Embed Size (px)
Citation preview
CLIMATE CHANGE, MATERIALITY AND RICE – A RESEARCH PROJECT - ideas,
methods and results
Barbara Harriss-White and AlfyGathorne Hardy with D. NarasimhaReddy, Deepak Mishra and R Hema
1
ORIGINS http://www2.lse.ac.uk/researchAndExpertise/units/mackinder/theHar
twellPaper/Home.aspx
• Thought-process of HARTWELL PAPER (2009) - but see Dubash et al (June 2013 EPW) and Bidwai (2012)
• critique of structural flaws of policy for climate change response:
• Fails test of history - global goal of emissions reduction not possible; 2013 – energy majors retreat from renewables
• Cap and trade has major problems: carbon price s.t. political control (overallocation of permits: lobbies/recession);
• Clean devt mechanism also struggling ((non)counterfactuals, measurement, corruption + rent seeking.)
2
WHAT IS THE ALTERNATIVE?
• ‘Relentless pragmatism’ : decarbonifying the econ desirable as a benefit in itself and also contingent on co-benefits and other goals.
• Hartwell’s goals: ren en / en efficiency and access (reduce waste) / respect for eco-systems / protn from risk.
• Dubash et al 2013: growth, inclusiveness, environmental gains
• Policy instruments not confined to ‘markets’ but include bans, taxes - what about technology? organisation of society?
3
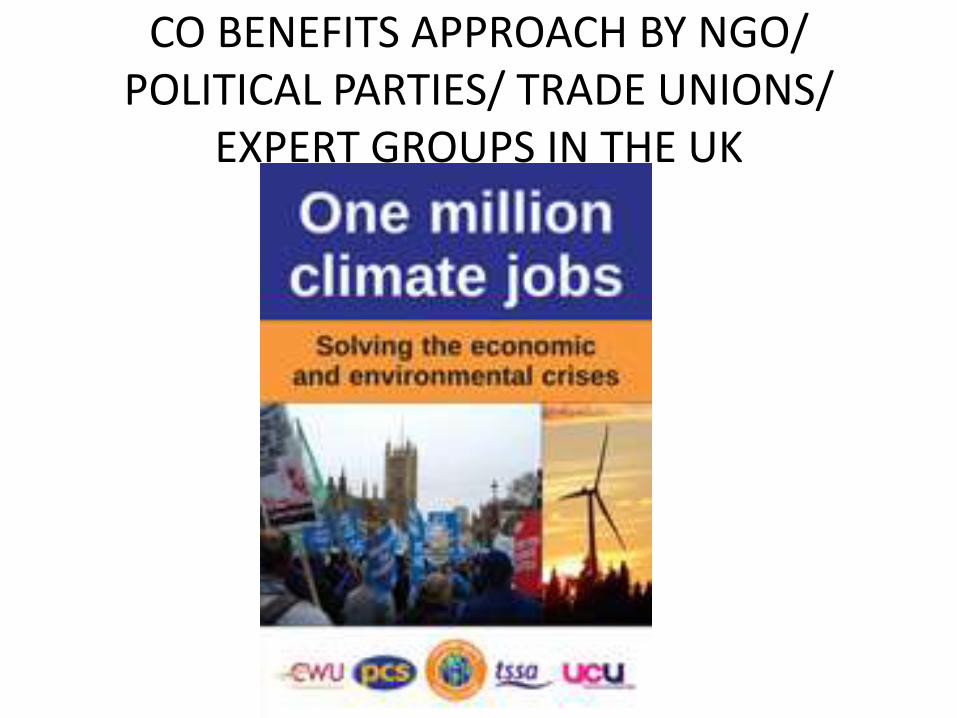
CO BENEFITS APPROACH BY NGO/ POLITICAL PARTIES/ TRADE UNIONS/
EXPERT GROUPS IN THE UK
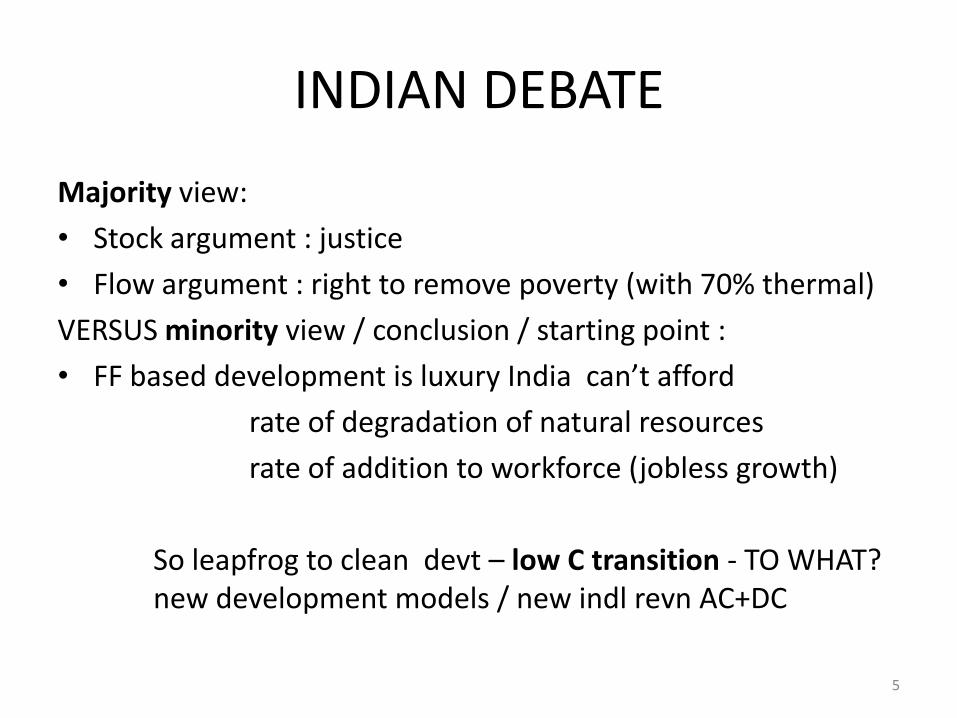
INDIAN DEBATE
Majority view:
• Stock argument : justice
• Flow argument : right to remove poverty (with 70% thermal)
VERSUS minority view / conclusion / starting point :
• FF based development is luxury India can’t afford
rate of degradation of natural resources
rate of addition to workforce (jobless growth)
So leapfrog to clean devt – low C transition - TO WHAT? new development models / new indl revn AC+DC
5
IDEAS AND METHODS
OUR PROJECT
• Global responses to climate change neglect informal economy / ILO’s and NCEUS’projectof decent work /standard work
• 90% jobs 60% GDP inf econ
• 43% workforce has half a year’s work
SO?
7
Develop methods to
1.think of theeconomy as a system of capital and labour using materials to produce commodities and physical – solid, liquid and gaseous -
waste
2. measure parameters of informal economy
8
Objectives - developing methods -contd
• 3. to scope technological alternatives according to several incommensurable criteria (environmental / social / economic) which generate trade-offs between criteria.
• 4. to mainstream social relations of work –quantity and quality of labour

Big problems of separate knowledge fields – at least a dozen
10
climate change – climate policy – life cycle assessment –informal economy – value / supply chain analysis –science and technology studies – policy studies – labour studies – agriculture – rice - agricultural markets
For 1. and 2. – the materiality of the economy - fuse life cycle assessment (LCA) with value / supply chain analysis (VCA ) - politicise the frontier between formal regulation/ policy and social regulation
For 3. the evaluation of incommensurable dimensions of technological choices - use multi-criteria mapping (MCM) and
For 4. the study of livelihoods and labour – start withDecent Work / Standard Work (DW)
Innovative Learning Workshops
11
1. LCA and 2. VCA
• LCA measures GHGs at all stages of a production-consumption process from raw materials procurement to the waste disposal at the end of a consumption process
• VCA has a similar concept of a ladder/chain and seeks to compute value added, rents and potential for technological / managerial upgrading
• OUR PROJECT SEEKS TO DEVELOP A FUSION (AGH-Hema) that is sensitive to the political space at the frontiers of formal regulation (AP)
12
3.ALTERNATIVE TECHNOLOGY/ POLICY
• Research on energy and materials efficiency leads to normative questions: how to scope and analyse technologies / policies reducing environmental impact in the informal economy
• LCA leads to MCM experiment (AGH-BHW)
• Mitigation technology options (4) assessed by stakeholders (30-40) on incommensurable criteria (min = 3 (costs, GHGs, and labour quantity and quality))
4. WORK AND WORK ALTERNATIVES
• Research on the quality of work and production relations leads to nightmare of indicators - 125 in the ILO’s Decent Work
• Trades Unions, frequently airbrushed out as ‘stakeholders’, are actively involved here –NTUI – VCA -> labourist supply chain analysis (MM-GM-MS)
• LCA develops new measures of work for trade offs with GHGs/energy and costs (AGH)
14

CLIMATE CHANGE AND AGRICULTURE – WHY AGRICULTURE?
• Agriculture innocent? Small proportion of global GHG emissions? 10-14%
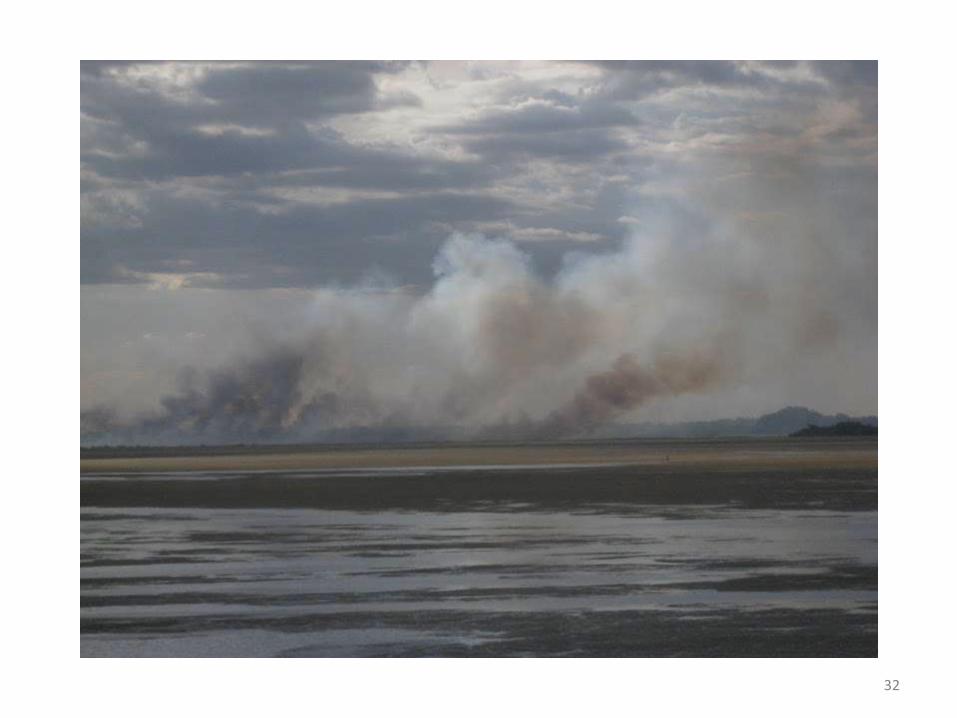
versus• USDA (2011) estimate that entire food-system
production-distribution-(transport-processing-storage)-consumption-waste
PLUS land use change (burning forests for agriculture) = +/- 33 - 45% global GHGsAND agriculture as an emissions floor is ‘poorly understood’ (Anderson, 2011)
15
CLIMATE CHANGE AND RICE
• Vulnerability – temperature, weeds and pests; rain and crop failure -> yield declines expected -> critical impact on food /feed prices and food security/ availability esp if no change in access and utilisation (S Asian prodn/nutnparadox)
• Agenda of adaptation in rice: crop-livestock stress research; irrigation management; biotech innovations (inc. GM and hybrids) ;collective action/farmers’ groups (info – dissemination)
• -> funds in new revolutionary high-tech frontier rather than farming systems; focus on adaptation rather than mitigation
• Sources: Nelson et al, IFPRI, 2009; Alagh, 2013
16
RICE AS A CASE STUDY – HERE -1
• NOT because a big polluter [though food system and all land-based activity thought to account for up to 45% GHG] BUT
• Rice is bio-physically complex – emitting various GHGs as well as sequestering them –so scientifically interesting
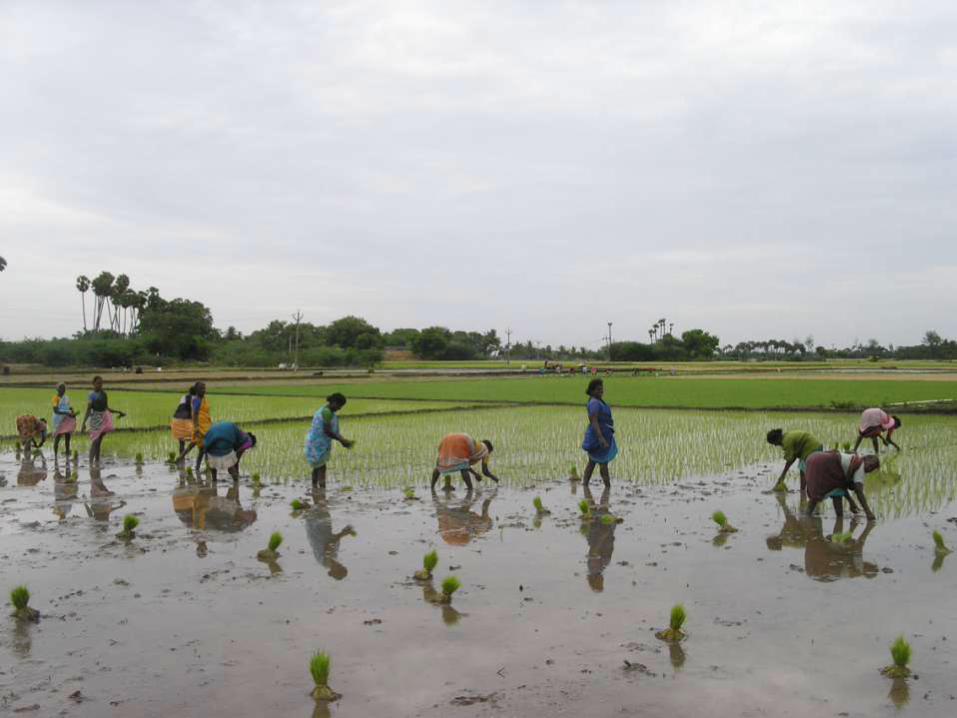
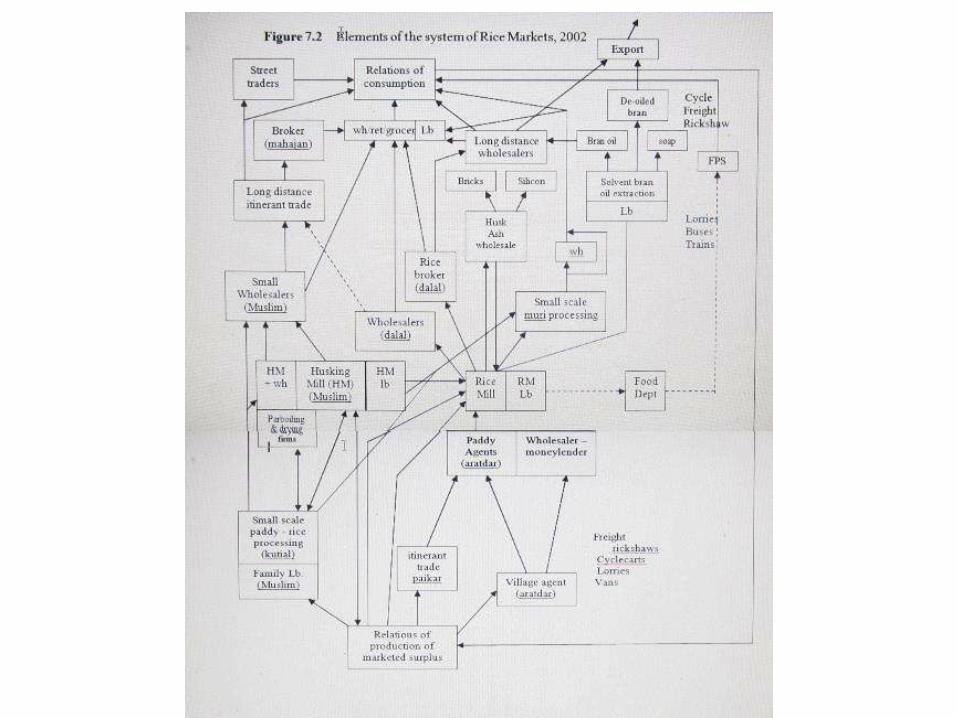
• Rice is socio-technically complex – 4 production systems 4-5 marketing systems –> social scientific interest
17
RICE AS A CASE STUDY - 2
• Resources, employment and poverty are entwined in production-distribution systems –>policy interest
• Production and distribution weave in and out of the informal economy –> theoretical and policy interest
• Food is generally exempt from the scenarios lowering emissions (Anderson/Royal Society 2011) i.e. something of a political special case –but how special ?
LCA-VCA-MCM generate cross-cutting themes
• Socio-political limits to the reach of state regulative policy, the interface and forms of regulation of the informal economy (A.P.)
• The means whereby UN-organised labour makes gains in the informal economy (BHW/ NTUI/CWM)
• Innovation and technical change in the informal economy (BHW/GR)
19
20
21
22
23
24
25
26
27
28
30
31
32
OBJECTIVES:
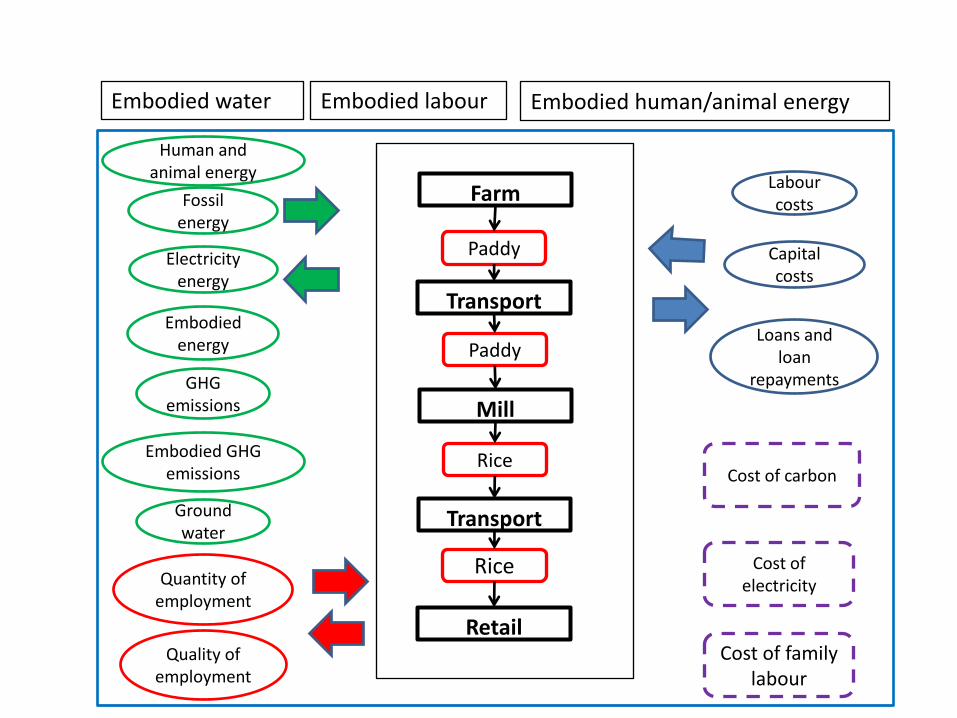
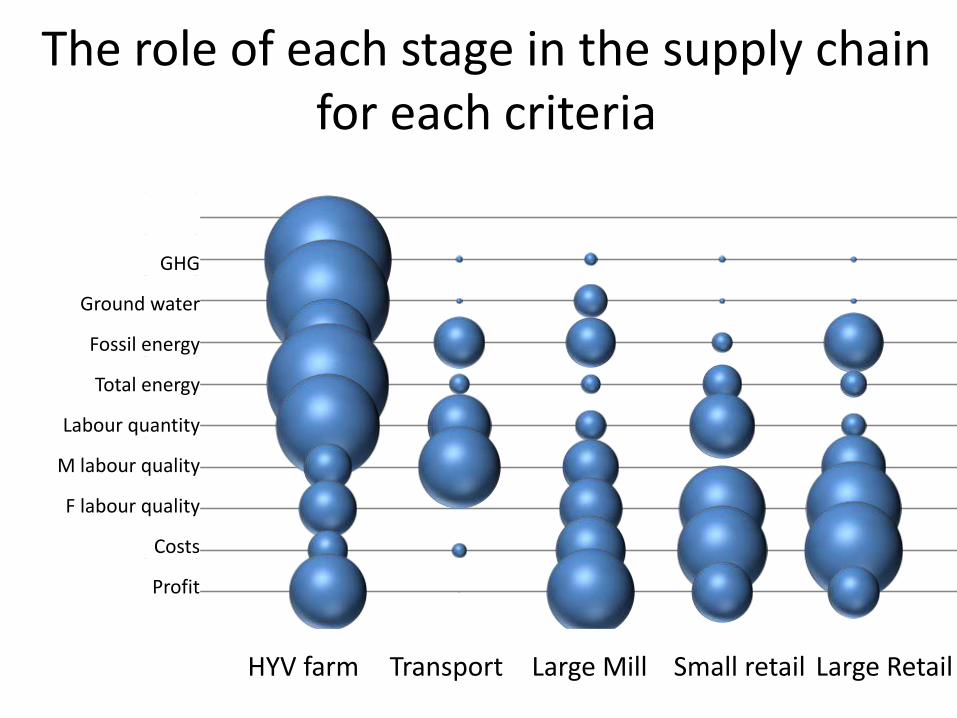
Through the perspective of different production methods, measure variation in the entire rice supply chain - production and distribution - to understand where, how and why GHGs, labour and money interact.
Criteria:
physical : water, fossil energy, animal and human energy, greenhouse gases
economic/social: costs and returns, quantity and quality of labour
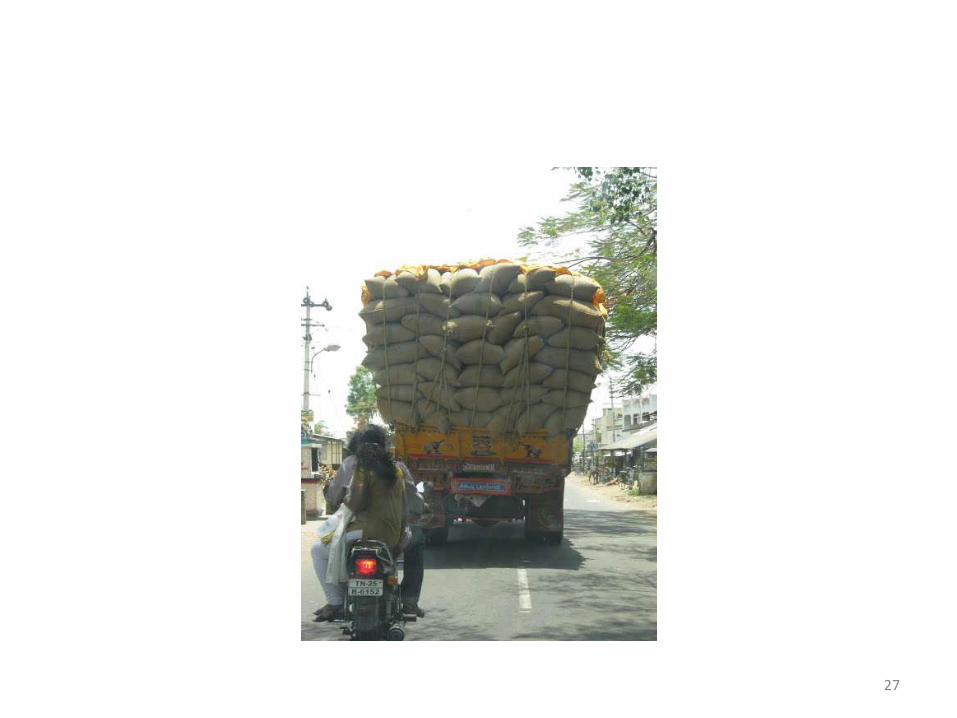
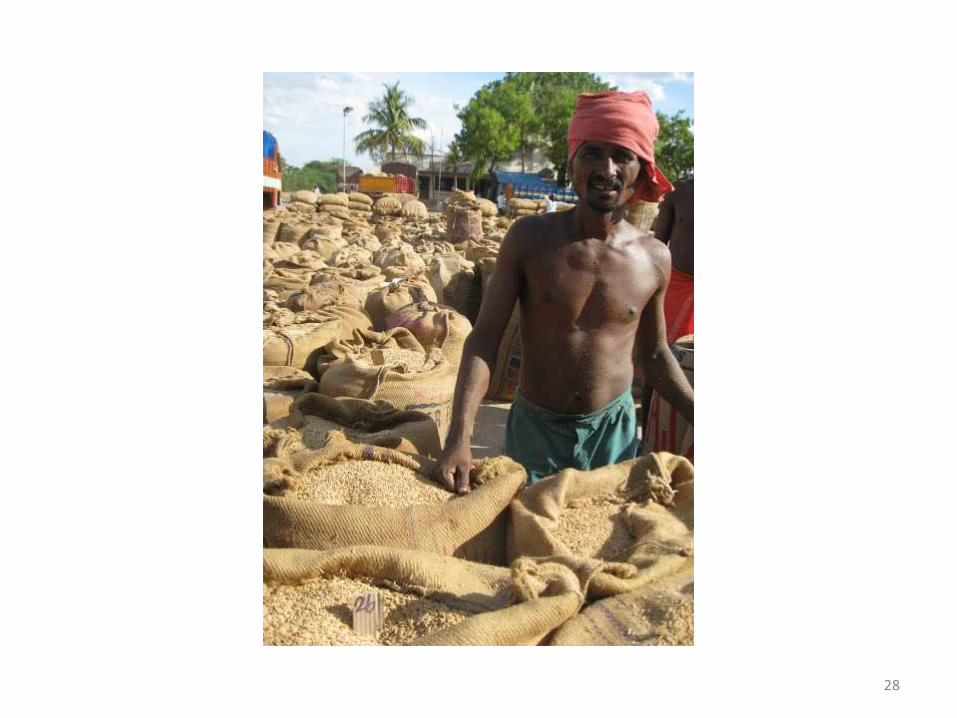
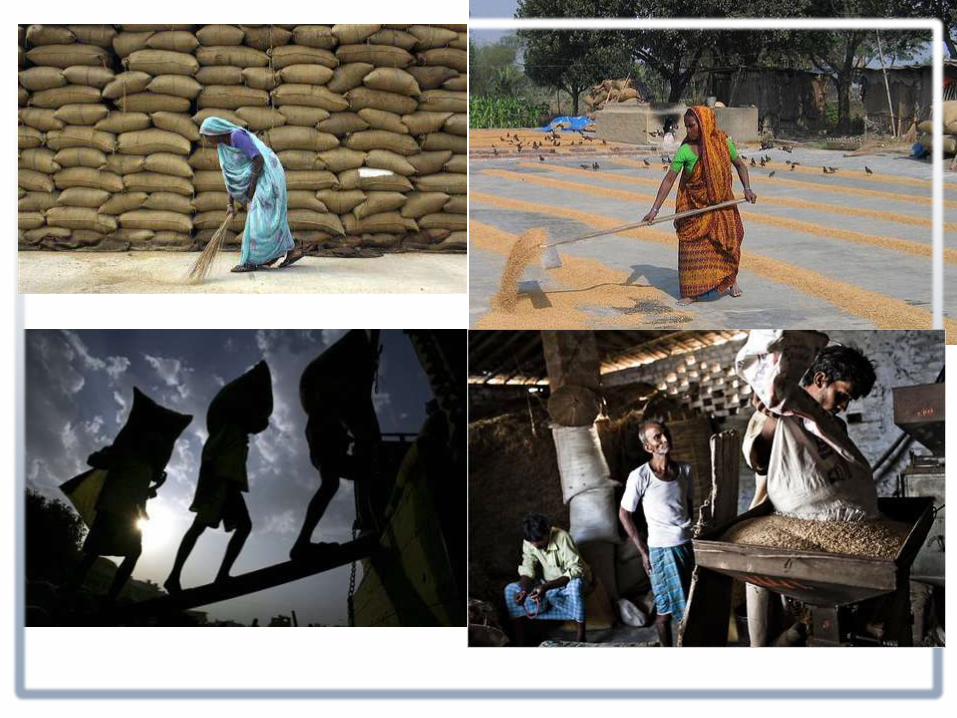
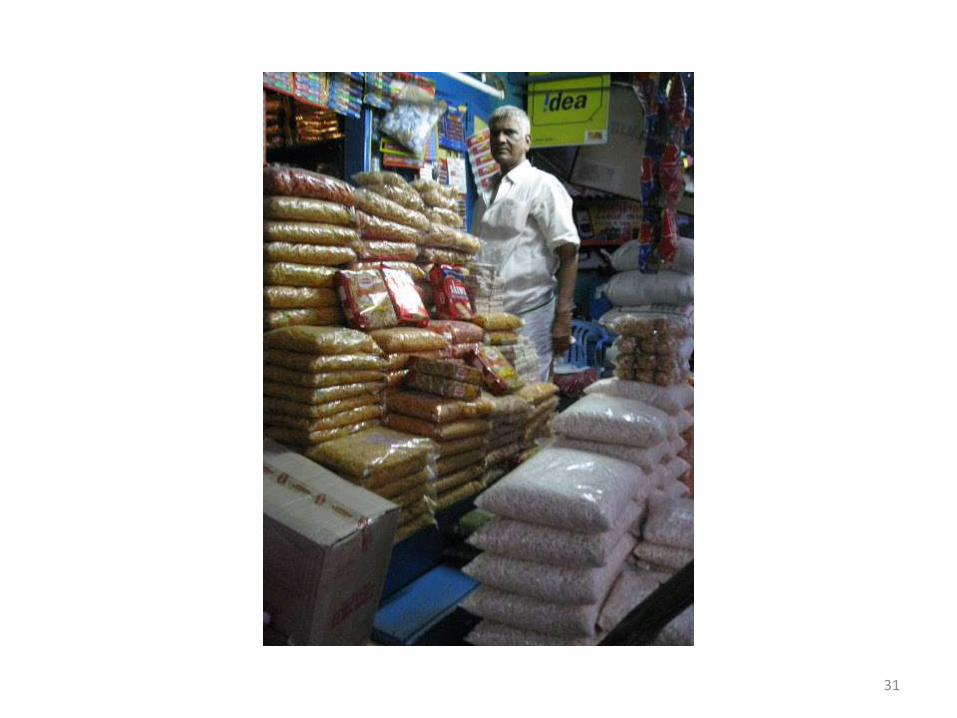
Sub-categories of the chain:
• Four different production systems in 3 states
• Different transport distances
• Different milling types
• 2 different retail types + PDS
• extreme complexity…

A stylised model
Farm
Mill
Transport
Retail
Transport
Paddy
Paddy
Rice
Rice
Electricity energy
Human and animal energy
Fossil energy
Embodied energy
Loans and loan
repayments
Labour costs
Capital costs
Ground water
Quantity of employment
Quality of employment
Farm
Mill
Transport
Retail
Transport
Paddy
Paddy
Rice
Rice
Cost of carbon
Cost of electricity
Cost of family labour
Embodied GHG emissions
GHG emissions
Embodied water Embodied labour Embodied human/animal energy
RESULTS
38
0
1
2
3
4
5
6
7
8
9
10
11
12
0 1 2 3 4 5 6
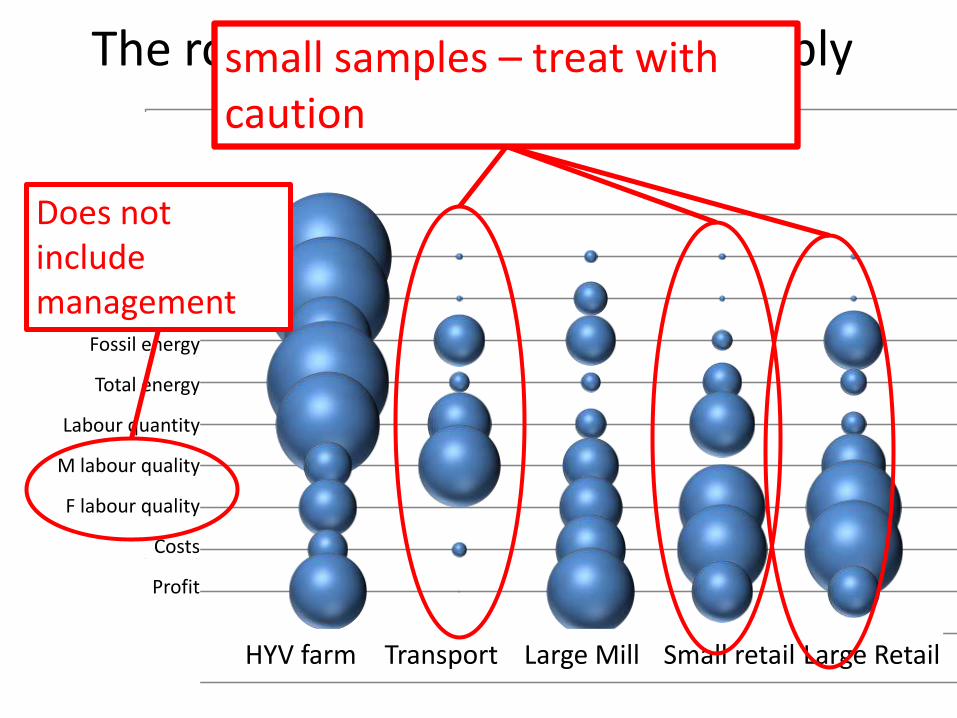
GHG
Ground water
Fossil energy
Total energy
Labour quantity
M labour quality
F labour quality
Costs
Profit
HYV farm Transport Large Mill Small retail Large Retail
Yes.No.
The role of each stage in the supply chain for each criteria
small samples – treat with caution
Does not include management
0
1
2
3
4
5
6
7
8
9
10
11
12
0 1 2 3 4 5 6
GHG
Ground water
Fossil energy
Total energy
Labour quantity
M labour quality
F labour quality
Costs
Profit
HYV farm Transport Large Mill Small retail Large Retail
Yes.No.
The role of each stage in the supply chain for each criteria
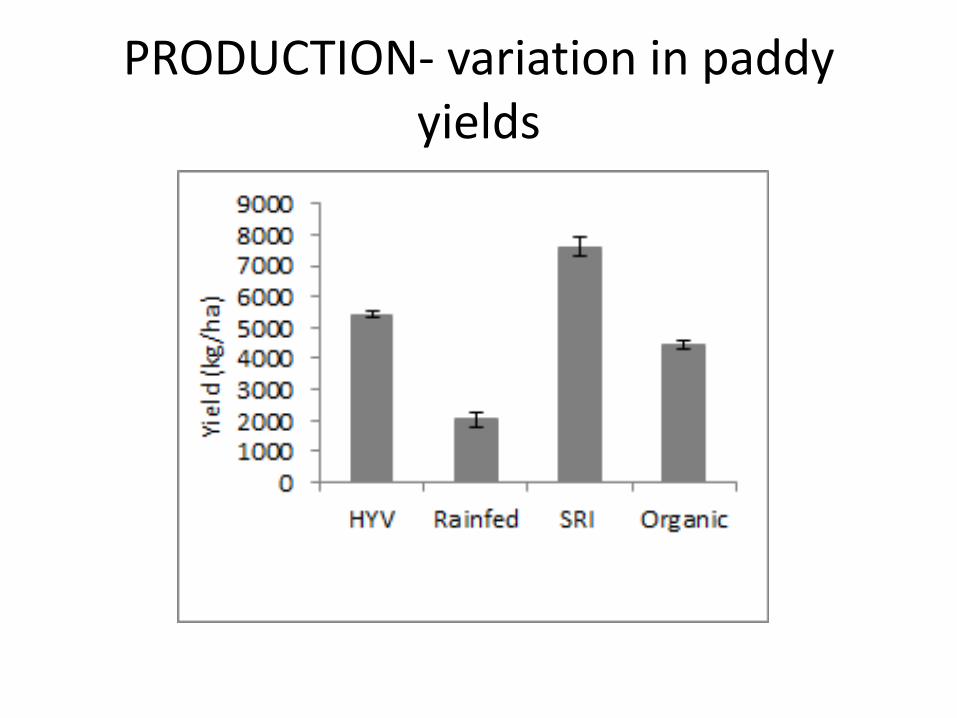
PRODUCTION- variation in paddy yields
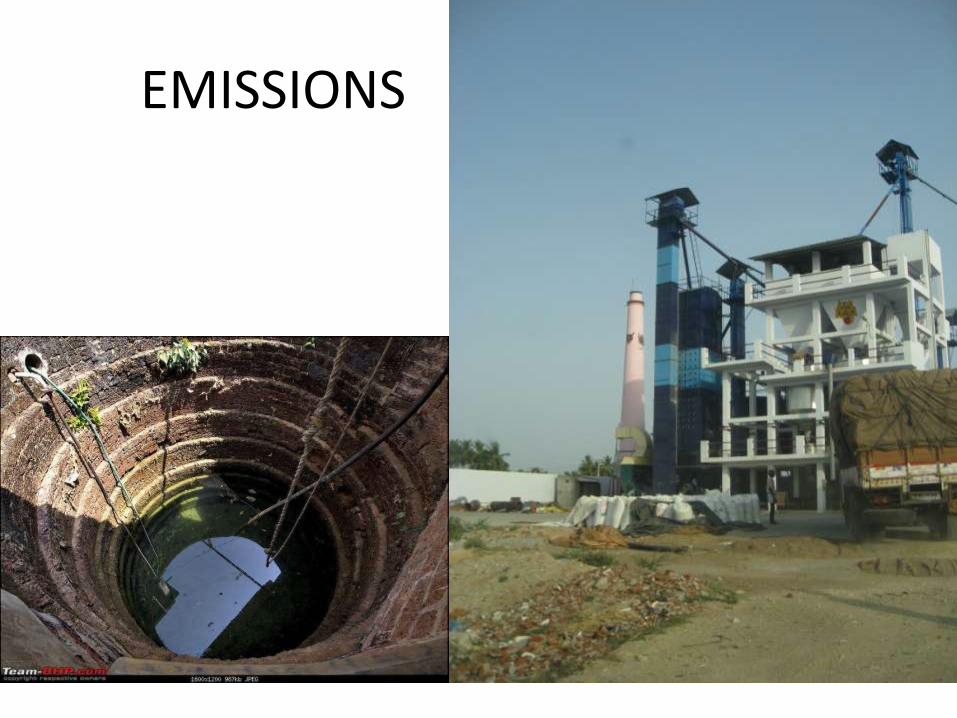
EMISSIONS ONSEMIE
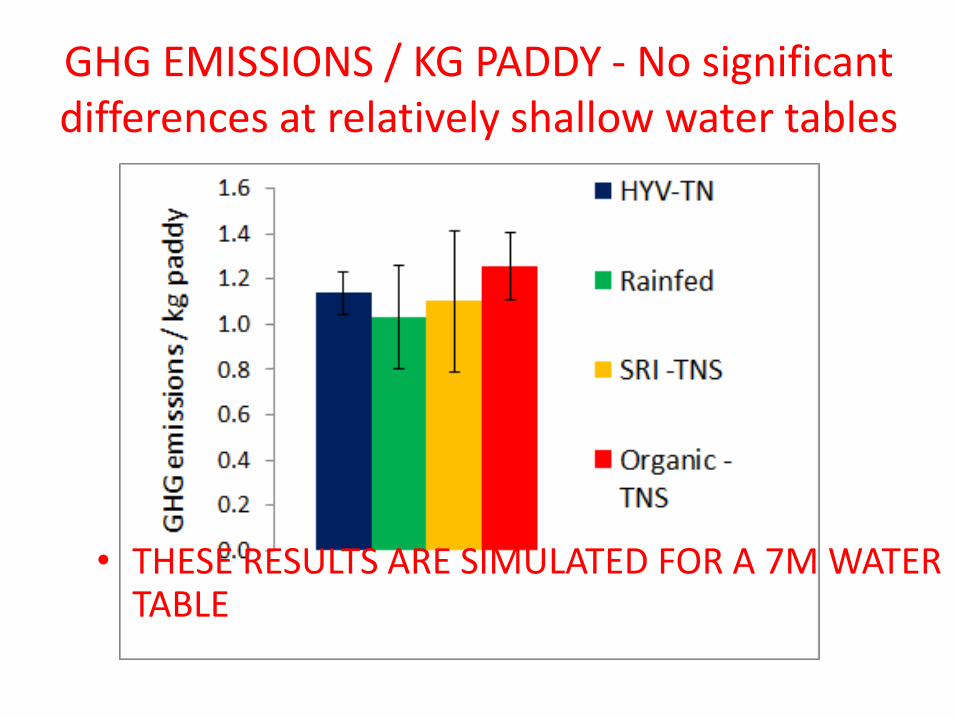
GHG EMISSIONS / KG PADDY - No significant differences at relatively shallow water tables
• THESE RESULTS ARE SIMULATED FOR A 7M WATER TABLE
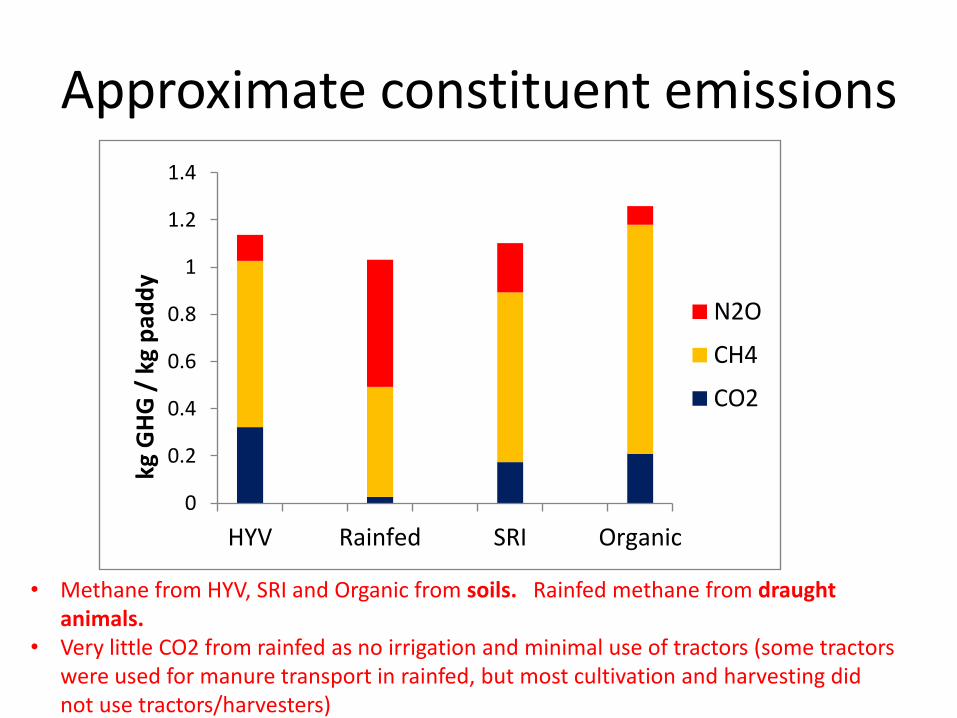
Approximate constituent emissions
0
0.2
0.4
0.6
0.8
1
1.2
1.4
HYV Rainfed SRI Organic
kg G
HG
/ k
g p
add
y
N2O
CH4
CO2
• Methane from HYV, SRI and Organic from soils. Rainfed methane from draught animals.
• Very little CO2 from rainfed as no irrigation and minimal use of tractors (some tractors were used for manure transport in rainfed, but most cultivation and harvesting did not use tractors/harvesters)
Activity related emissions –conceptualisation of production through
activity
-0.3
0.0
0.3
0.5
0.8
1.0
1.3
1.5
kg C
O2
eq
/ k
g p
add
y
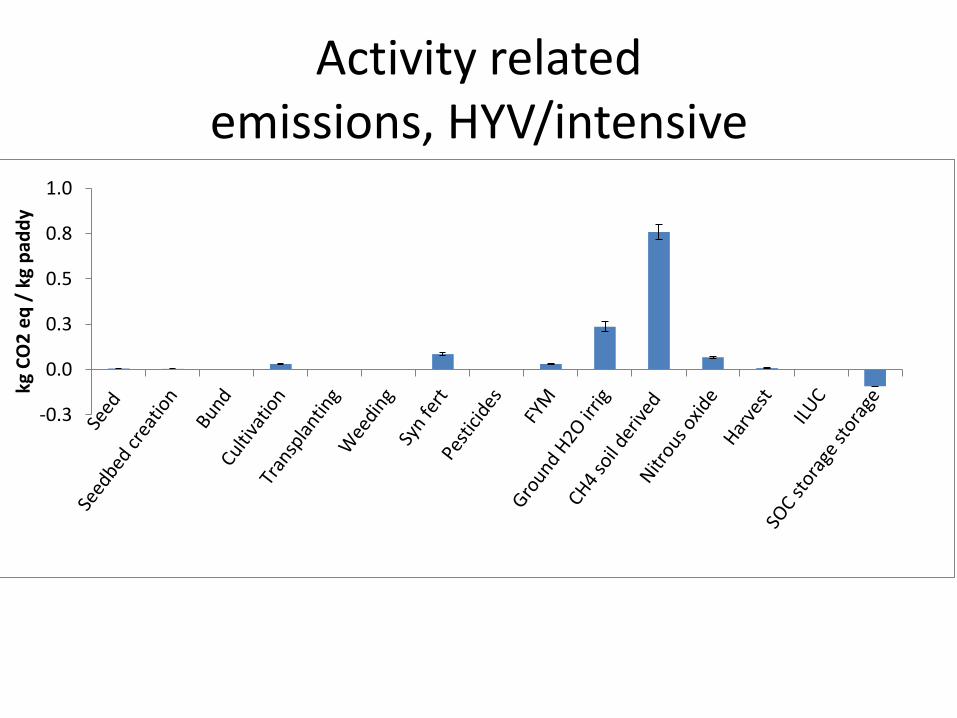
Activity related emissions, HYV/intensive
-0.3
0.0
0.3
0.5
0.8
1.0
kg C
O2
eq
/ k
g p
add
y
-0.3
0.0
0.3
0.5
0.8
1.0
kg C
O2
eq
/ k
g p
add
y
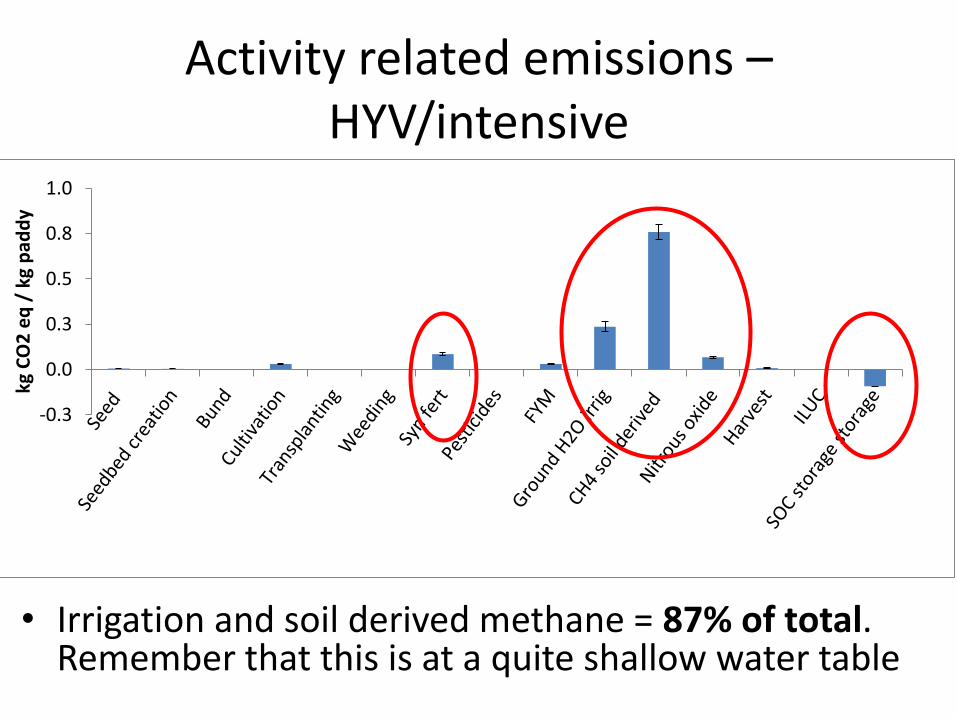
Activity related emissions –HYV/intensive
• Irrigation and soil derived methane = 87% of total. Remember that this is at a quite shallow water table
-0.2
0.0
0.2
0.4
0.6
0.8
1.0
kg C
O2
-eq
/kg
pad
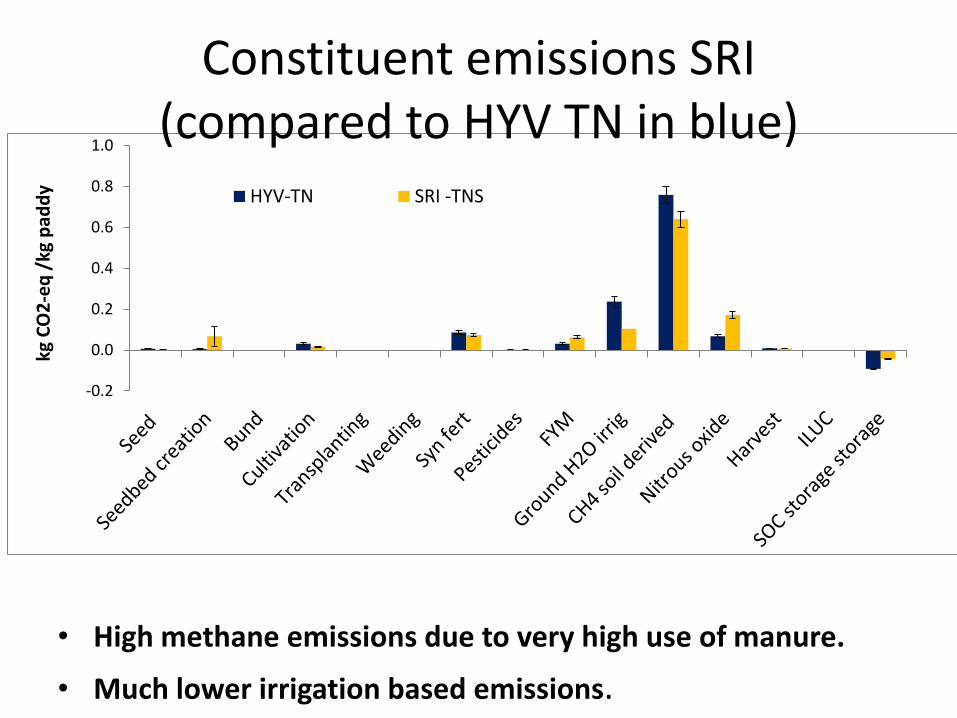
dy HYV-TN SRI -TNS
Constituent emissions SRI (compared to HYV TN in blue)
• High methane emissions due to very high use of manure.
• Much lower irrigation based emissions.
-0.2
0.0
0.2
0.4
0.6
0.8
1.0
1.2
1.4
kg C
O2
-eq
/kg
pad
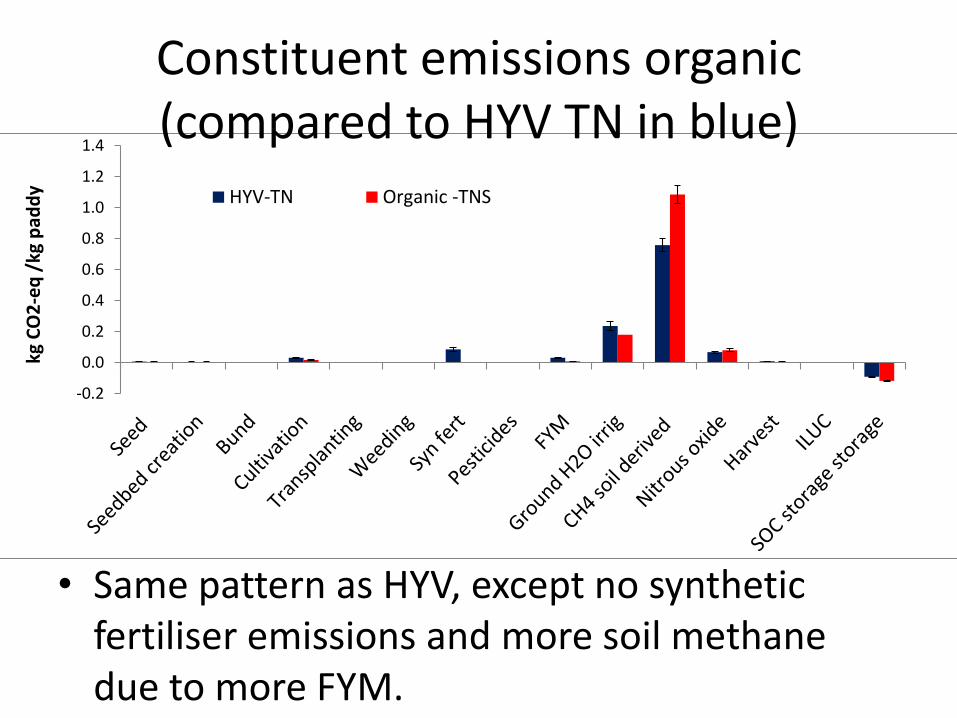
dy HYV-TN Organic -TNS
Constituent emissions organic(compared to HYV TN in blue)
• Same pattern as HYV, except no synthetic fertiliser emissions and more soil methane due to more FYM.
-0.2
0.0
0.2
0.4
0.6
0.8
1.0
kg C
O2
-eq
/kg
pad
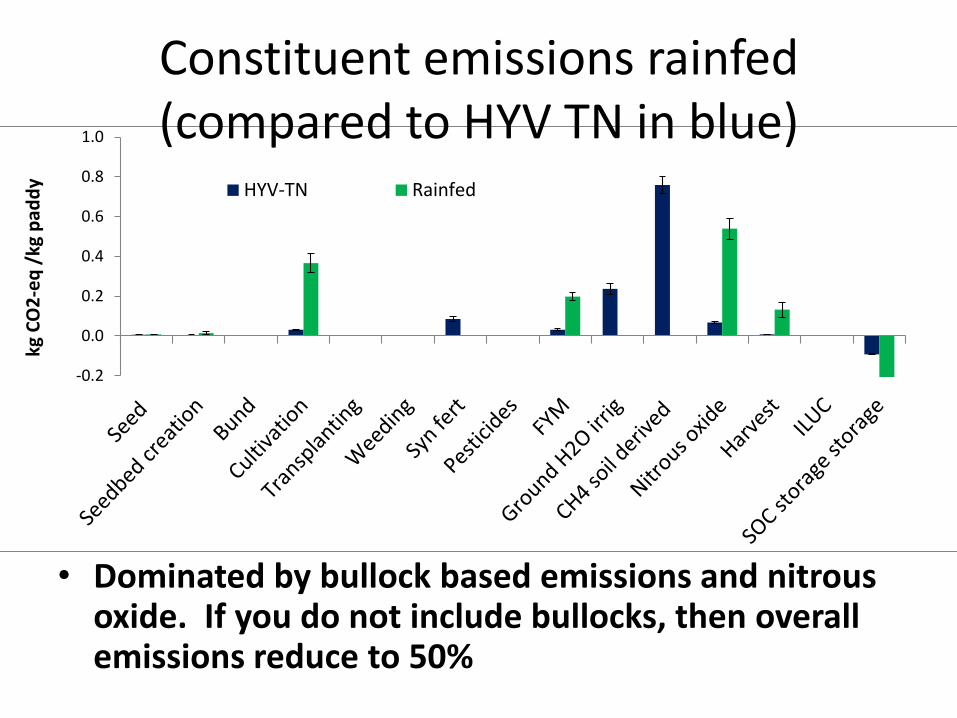
dy HYV-TN Rainfed
Constituent emissions rainfed(compared to HYV TN in blue)
• Dominated by bullock based emissions and nitrous oxide. If you do not include bullocks, then overall emissions reduce to 50%
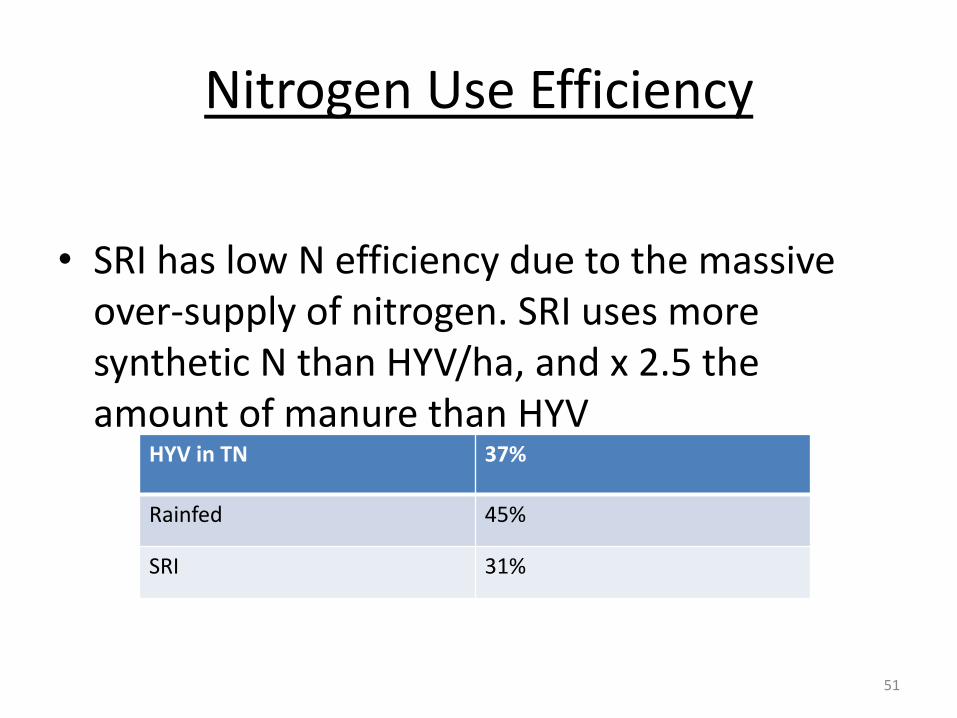
Nitrogen Use Efficiency
• SRI has low N efficiency due to the massive over-supply of nitrogen. SRI uses more synthetic N than HYV/ha, and x 2.5 the amount of manure than HYV
51
HYV in TN 37%
Rainfed 45%
SRI 31%
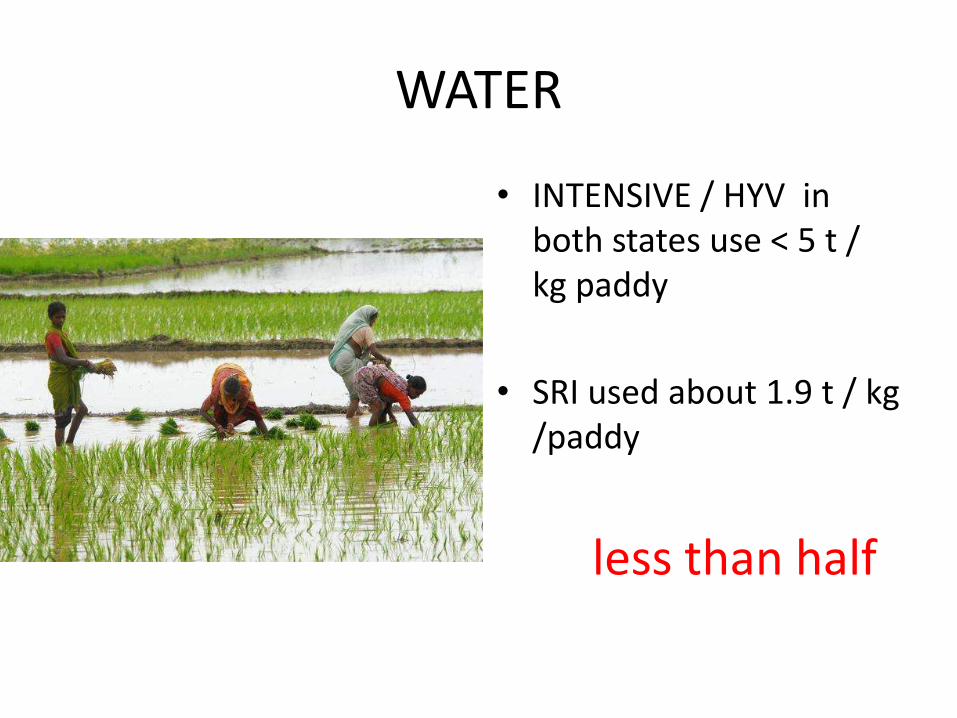
WATER
• INTENSIVE / HYV in both states use < 5 t / kg paddy
• SRI used about 1.9 t / kg /paddy
less than half
First problem – water measurement
53
• 1. Measure the field and model the field depth day to day - very difficult
• HP of motor known, but pumping is hard to calculate:– “How much electricity to you use?”
• Electricity is free, supply is highly erratic, no meters• Pump use often constant when electricity is on, but
that varies considerably day by day.
• 2. SO Build profiles from farmers who keep watch on well depth / water depth, hours of motor use, HP, and efficiency loss factor
2nd problem - water baseline
• We’ve used N TN water table as a ‘baseline’, at 7m (since that was the average level for intensive (HYV)rice).
• In fact the water table for:
– Organic (also Tamil Nadu) was 12 m
– SRI (in Andhra Pradesh) was 27 m
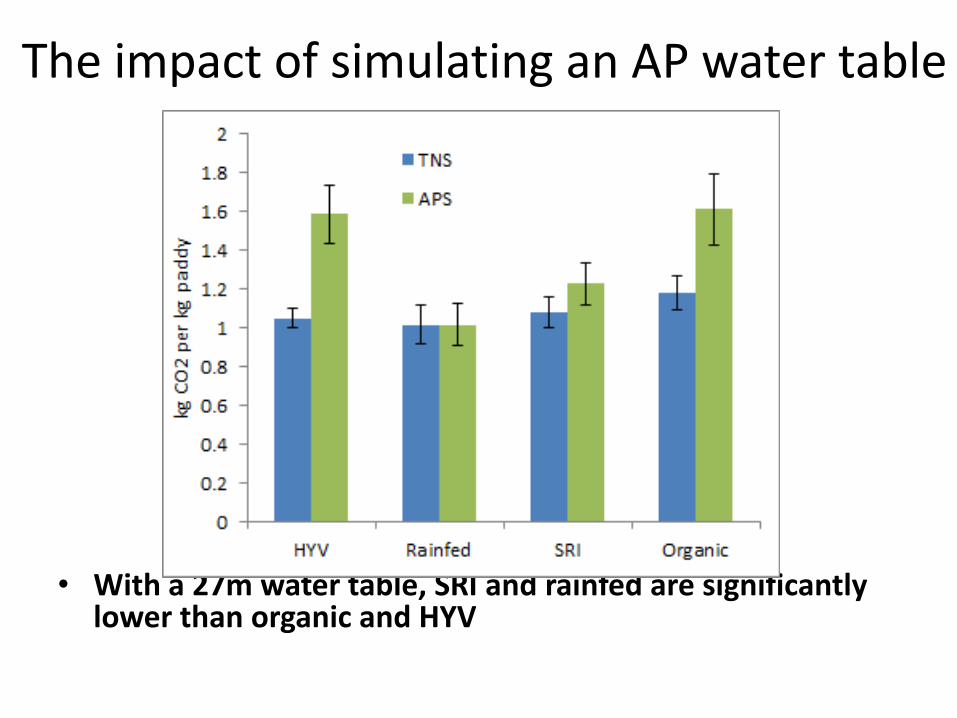
The impact of simulating an AP water table
• With a 27m water table, SRI and rainfed are significantly lower than organic and HYV
ENERGY
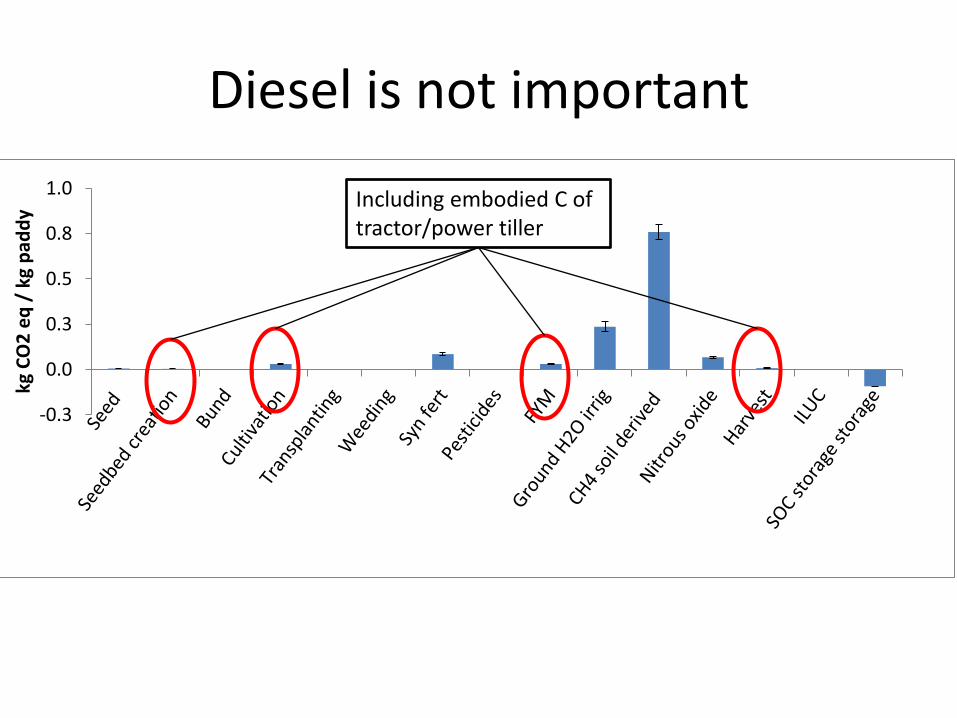
Diesel is not important
-0.3
0.0
0.3
0.5
0.8
1.0
kg C
O2
eq
/ k
g p
add
y
Including embodied C of tractor/power tiller
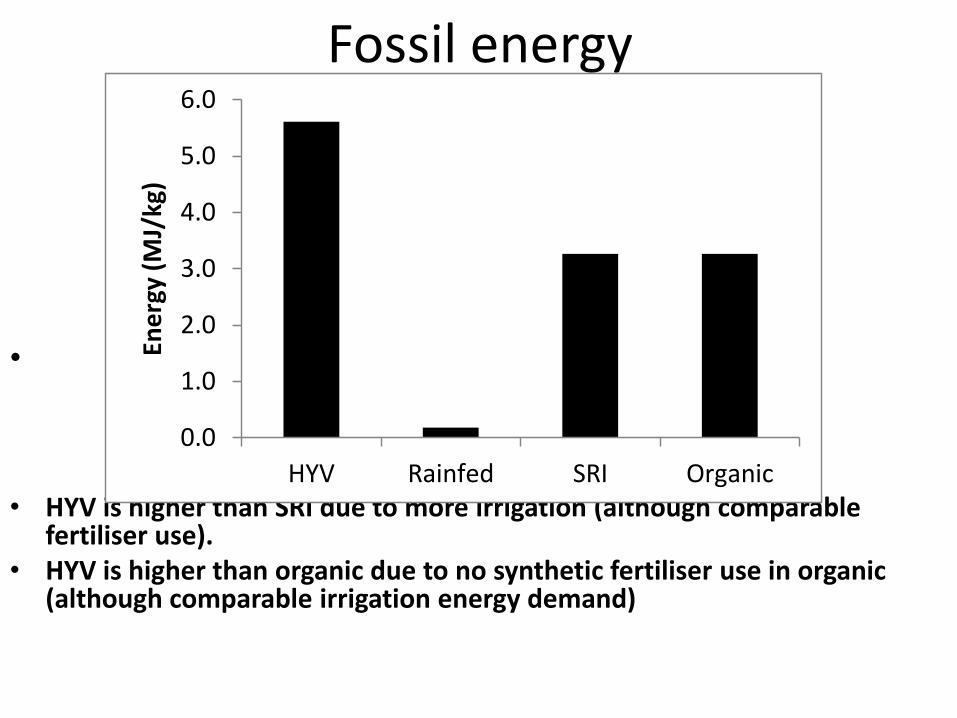
Fossil energy
•
• HYV is higher than SRI due to more irrigation (although comparable fertiliser use).
• HYV is higher than organic due to no synthetic fertiliser use in organic (although comparable irrigation energy demand)
0.0
1.0
2.0
3.0
4.0
5.0
6.0
HYV Rainfed SRI Organic
Ene
rgy
(MJ/
kg)
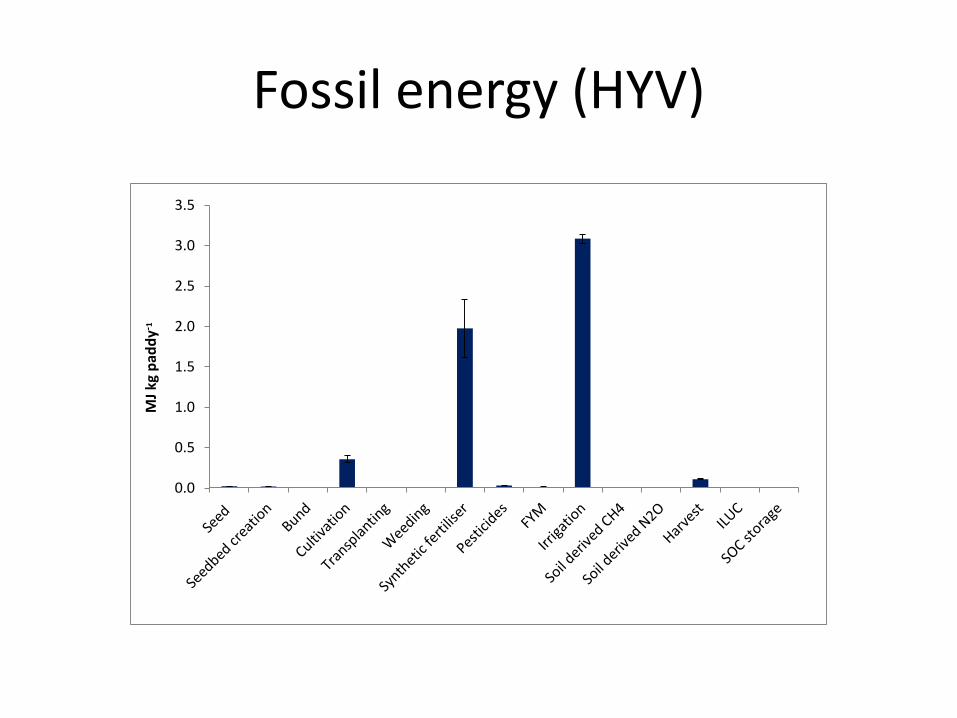
Fossil energy (HYV)
0.0
0.5
1.0
1.5
2.0
2.5
3.0
3.5
MJ
kg p
add
y- 1
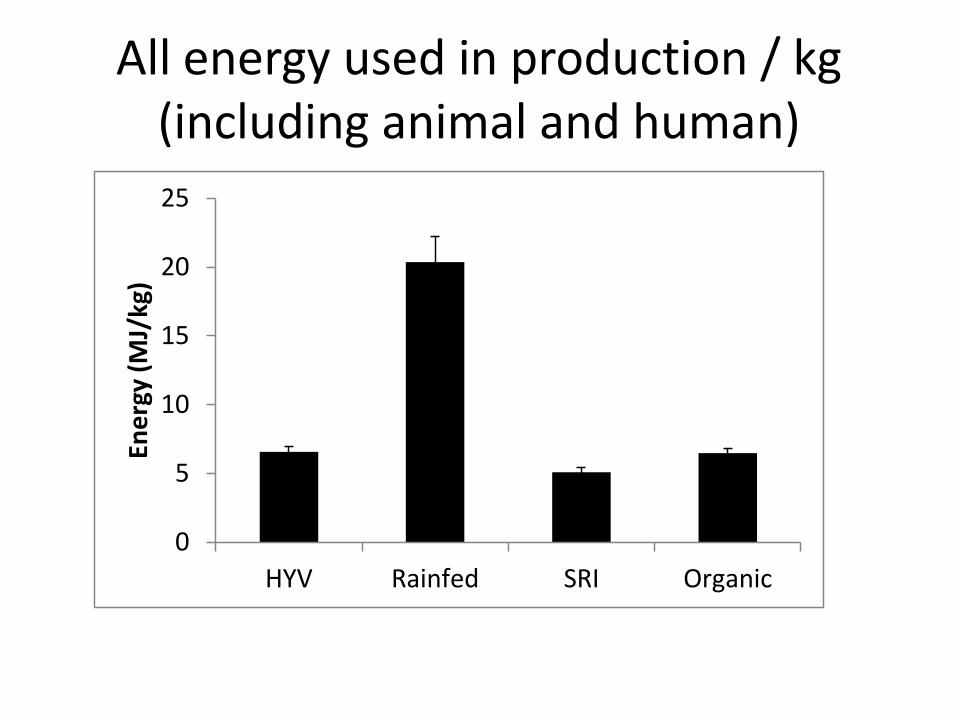
All energy used in production / kg(including animal and human)
0
5
10
15
20
25
HYV Rainfed SRI Organic
Ene
rgy
(MJ/
kg)
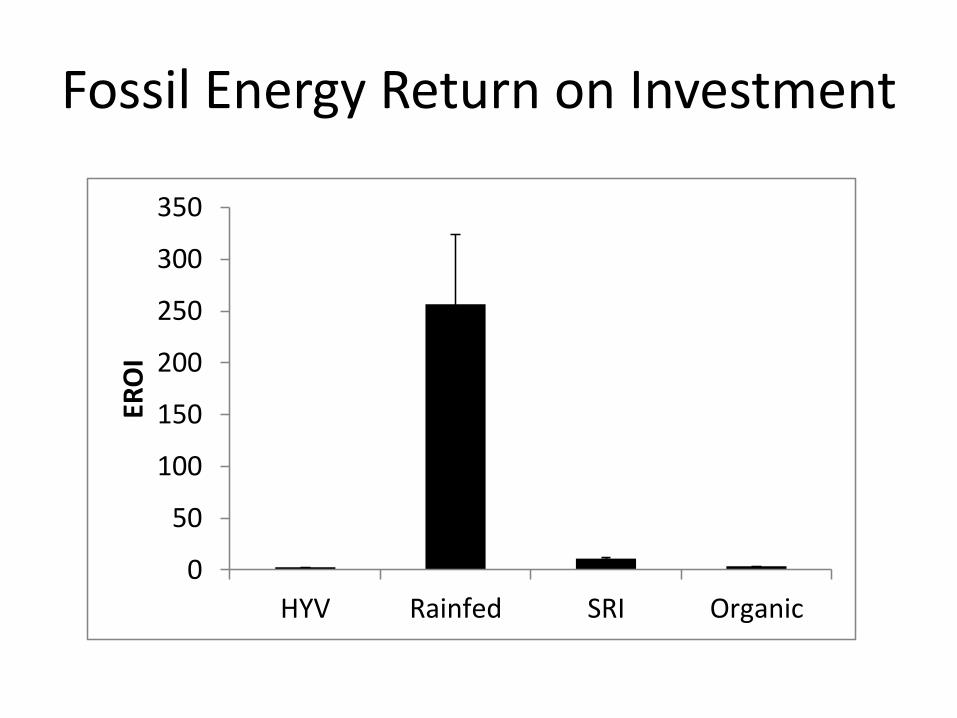
Fossil Energy Return on Investment
0
50
100
150
200
250
300
350
HYV Rainfed SRI Organic
ERO
I
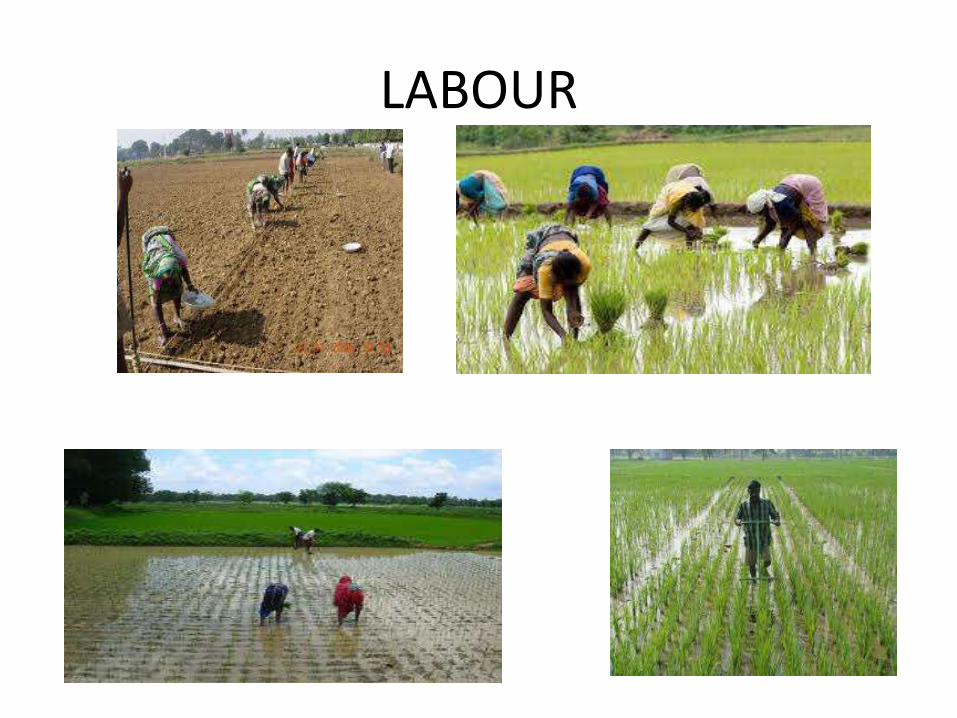
LABOUR
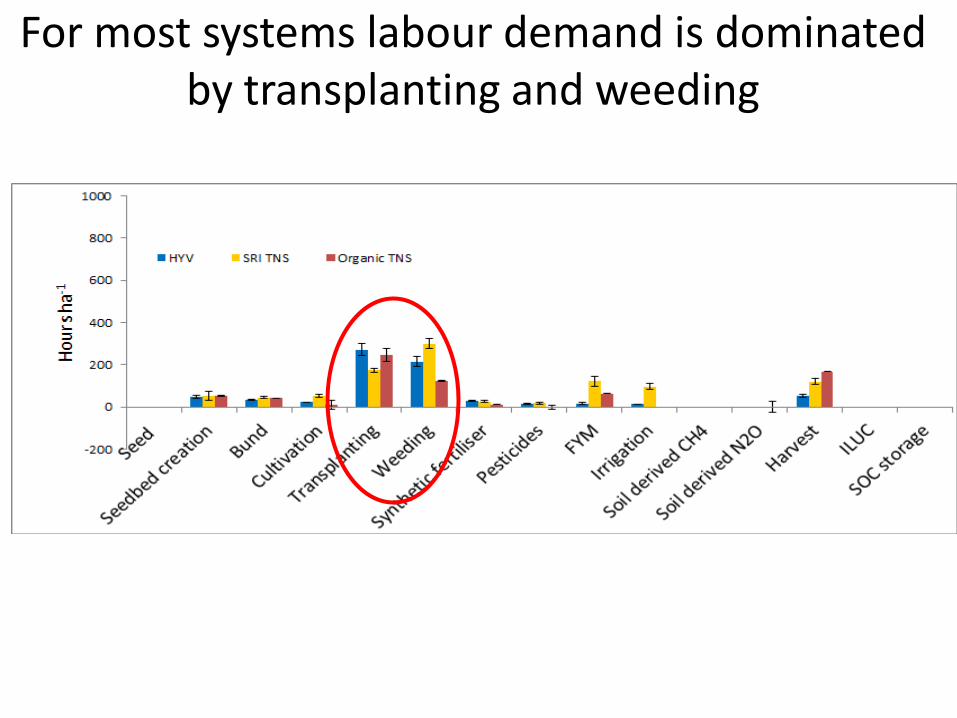
For most systems labour demand is dominated by transplanting and weeding
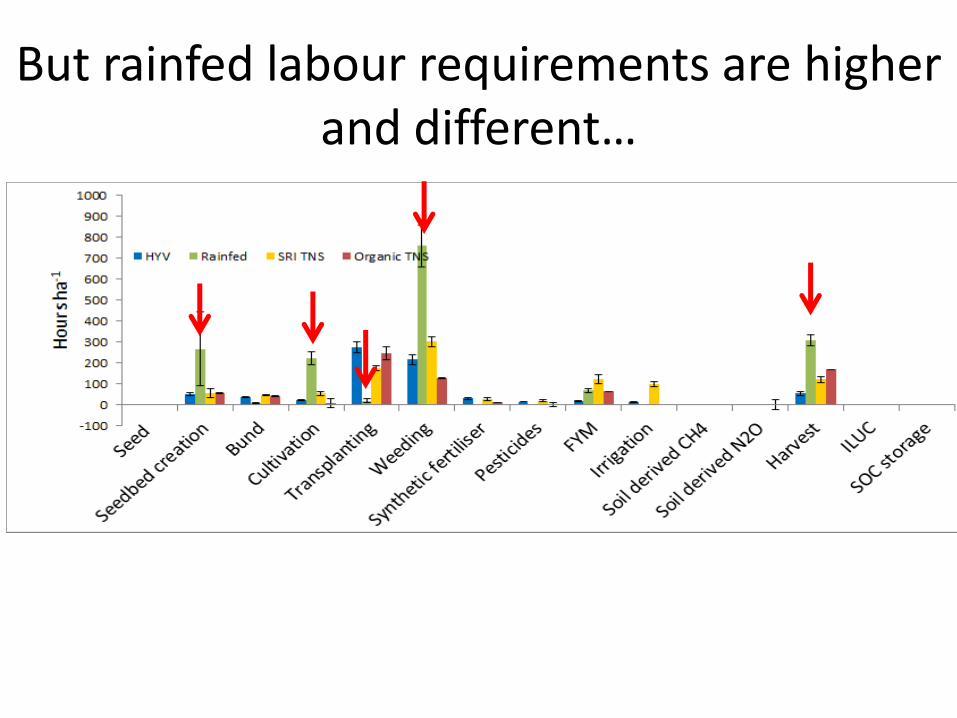
But rainfed labour requirements are higher and different…
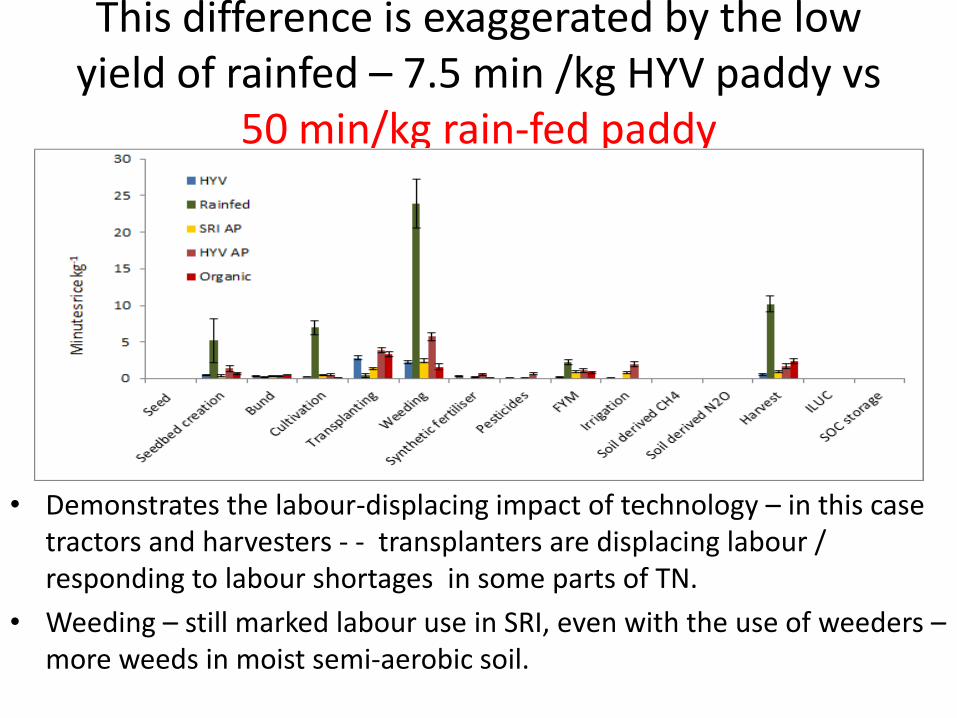
This difference is exaggerated by the low yield of rainfed – 7.5 min /kg HYV paddy vs
50 min/kg rain-fed paddy
• Demonstrates the labour-displacing impact of technology – in this case tractors and harvesters - - transplanters are displacing labour / responding to labour shortages in some parts of TN.
• Weeding – still marked labour use in SRI, even with the use of weeders –more weeds in moist semi-aerobic soil.
If we assuming (a) more labour is better and (b) more pay is better,
is rainfed rice (RR) the best form of production from the labour perspective?
(Is there an alternative? Is some work better than no work?)
• Per hectare little difference – per kg high labour demand for RR
• Family labour matters for RR; pay = very low for wage lb (Rs 100/d for men Rs 40/day for women)
• RR provides Rs 7,740 of employment / ha, compared to the max of Rs 24,802 / ha for HYV TN.

Overall gender balance –intensification and feminisation
• Women do absolutely more in rainfed, mainly because of their
high input to weeding
• Women have lost out from dominating weeding to sharing it equally with men in SRI, due to shift to male push-weeding machines.
67
0
100
200
300
400
500
600
700
800
900
1000
HYV Rainfed SRI
Ho
urs
/ha
Male
Female
INTERACTIONS
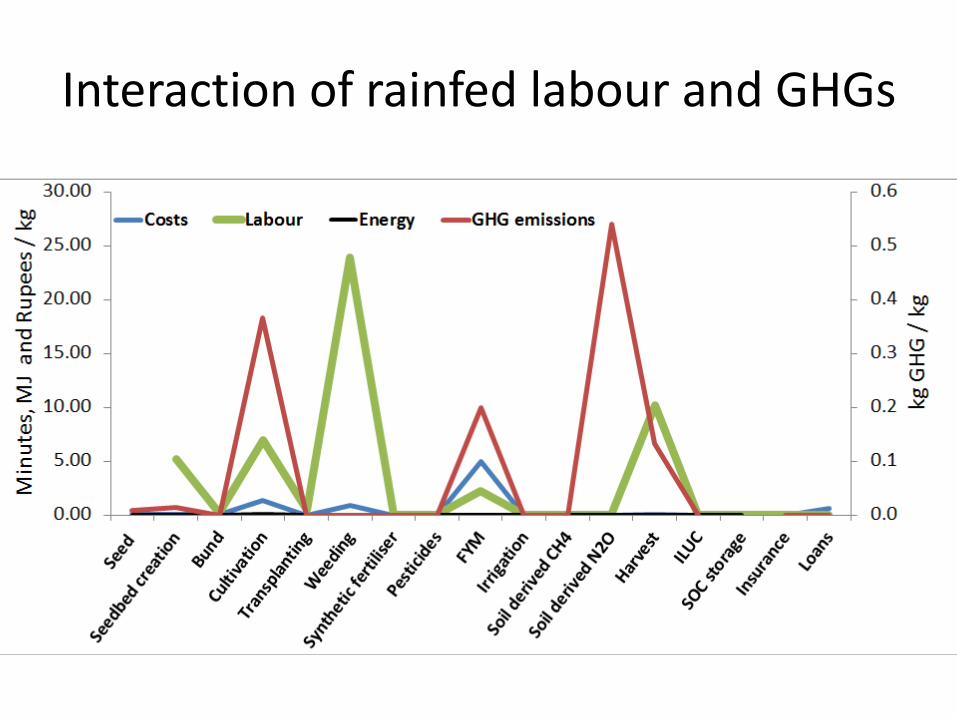
Interaction of rainfed labour and GHGs
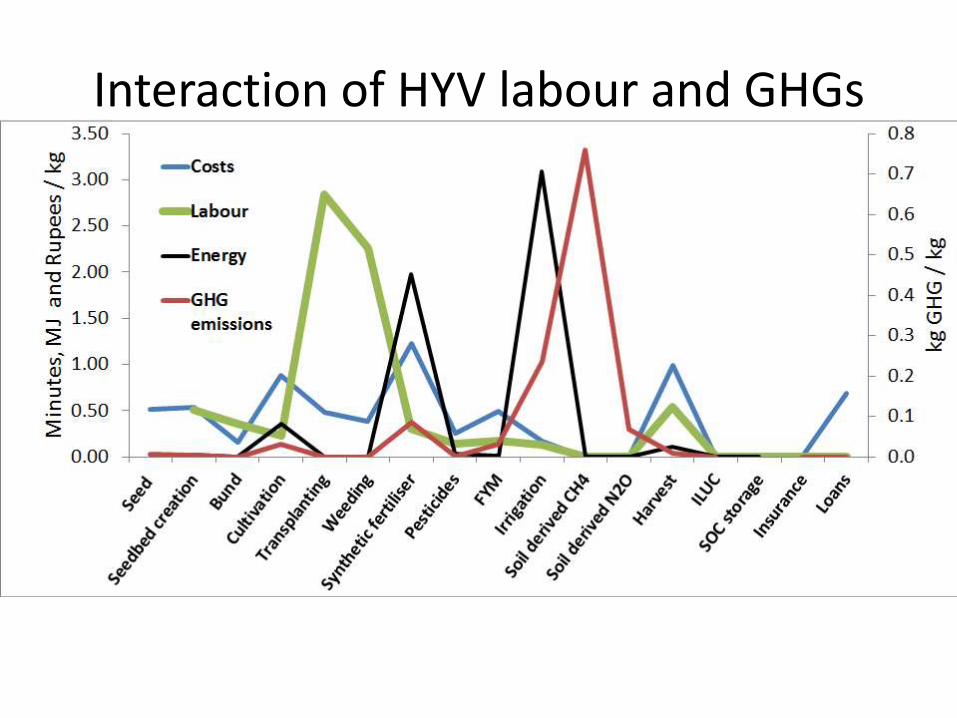
Interaction of HYV labour and GHGs
COST AND RETURNS - SIMULATIONS
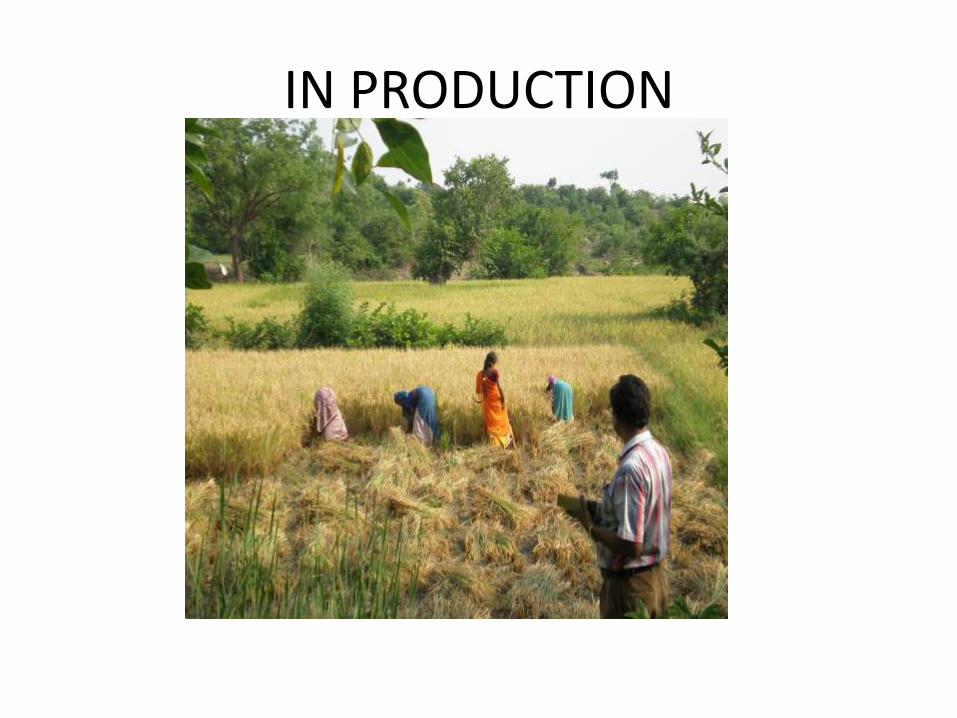
IN PRODUCTION
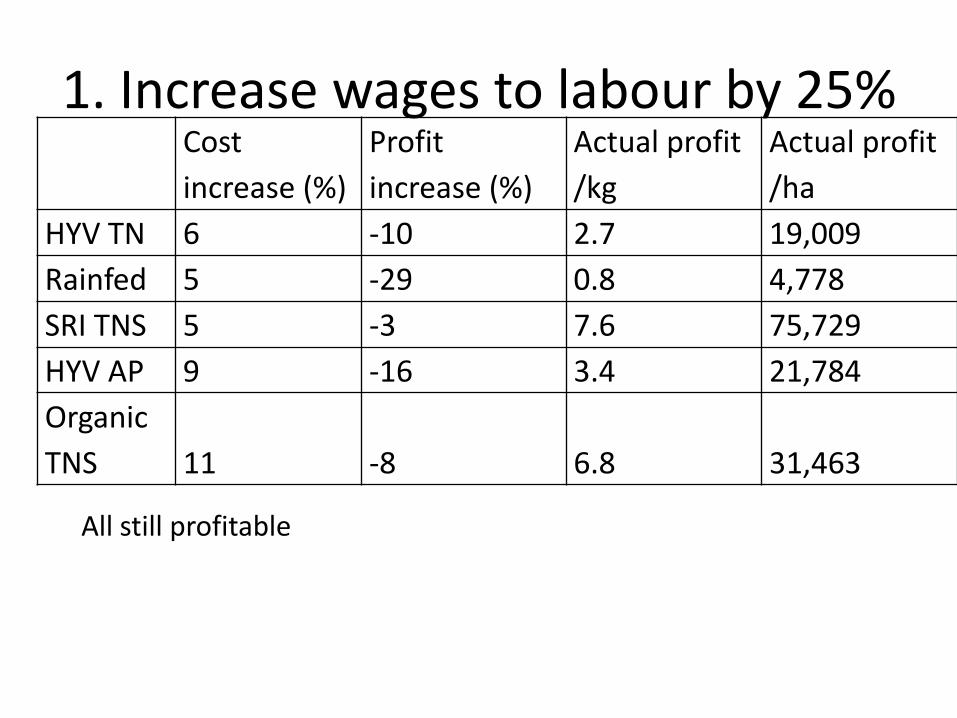
1. Increase wages to labour by 25%Cost
increase (%)
Profit
increase (%)
Actual profit
/kg
Actual profit
/ha
HYV TN 6 -10 2.7 19,009
Rainfed 5 -29 0.8 4,778
SRI TNS 5 -3 7.6 75,729
HYV AP 9 -16 3.4 21,784
Organic
TNS 11 -8 6.8 31,463
All still profitable
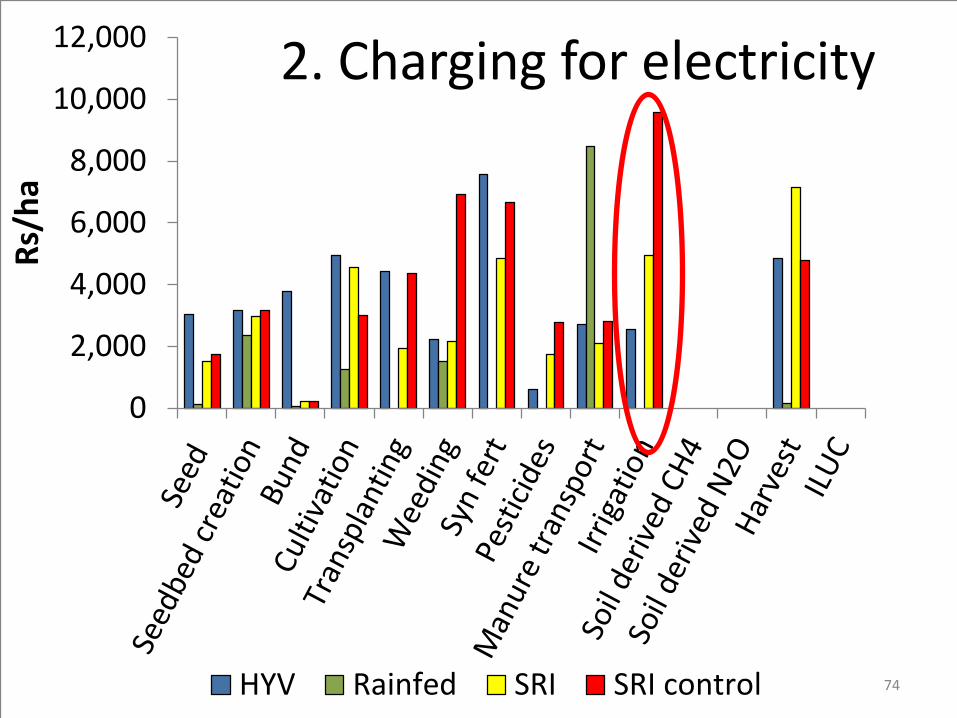
0
2,000
4,000
6,000
8,000
10,000
12,000R
s/h
a
HYV Rainfed SRI SRI control
2. Charging for electricity
74
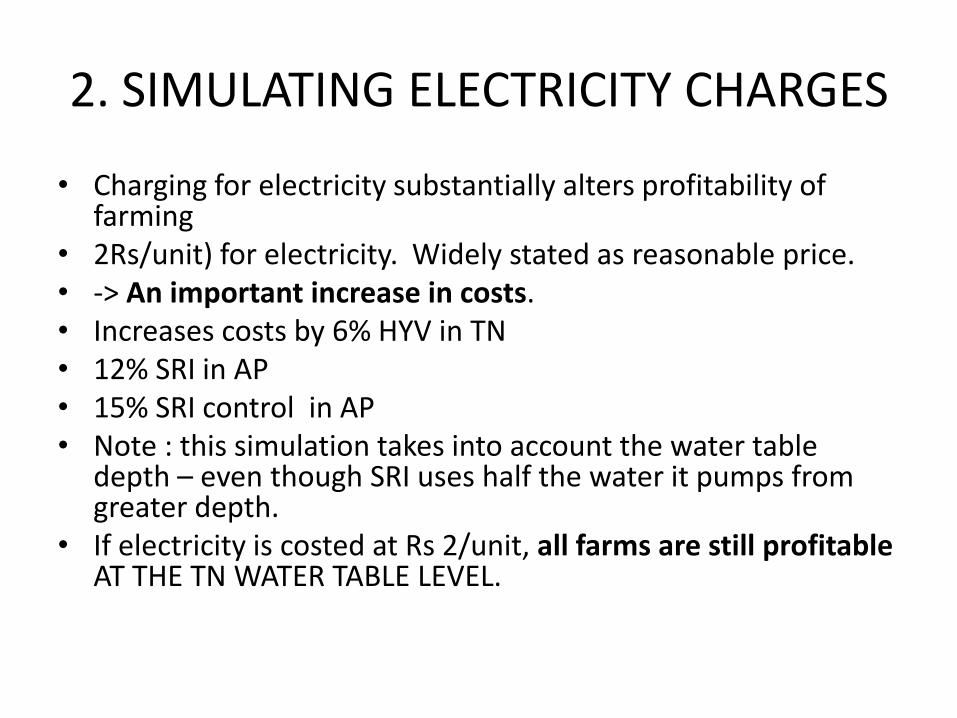
2. SIMULATING ELECTRICITY CHARGES
• Charging for electricity substantially alters profitability of farming
• 2Rs/unit) for electricity. Widely stated as reasonable price. • -> An important increase in costs.• Increases costs by 6% HYV in TN• 12% SRI in AP• 15% SRI control in AP• Note : this simulation takes into account the water table
depth – even though SRI uses half the water it pumps from greater depth.
• If electricity is costed at Rs 2/unit, all farms are still profitable AT THE TN WATER TABLE LEVEL.
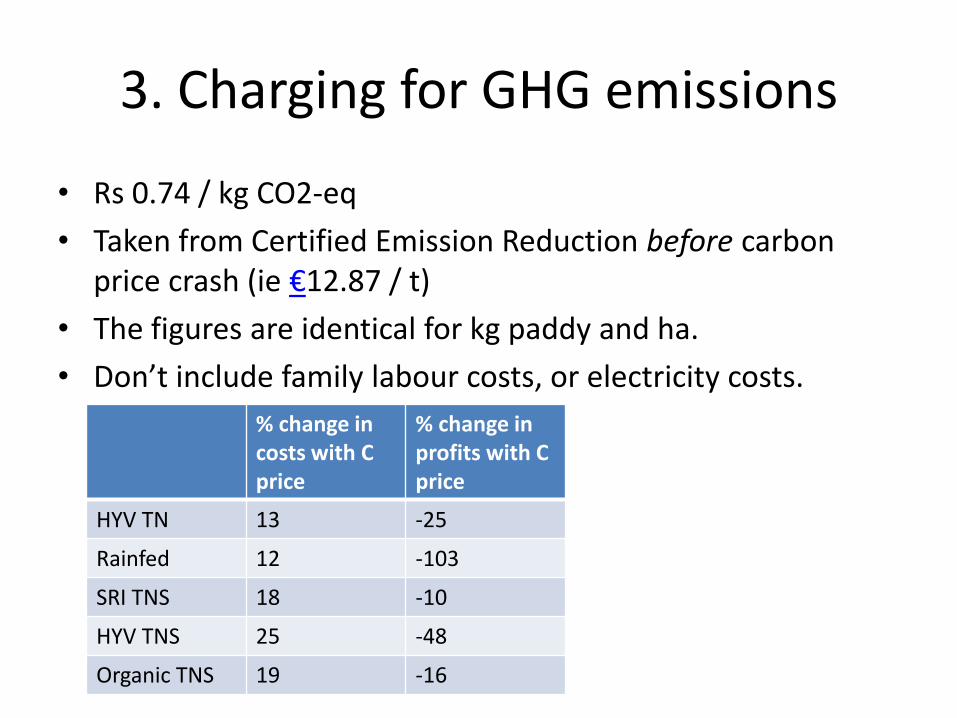
3. Charging for GHG emissions
• Rs 0.74 / kg CO2-eq
• Taken from Certified Emission Reduction before carbon price crash (ie €12.87 / t)
• The figures are identical for kg paddy and ha.
• Don’t include family labour costs, or electricity costs.
% change in costs with C price
% change in profits with C price
HYV TN 13 -25
Rainfed 12 -103
SRI TNS 18 -10
HYV TNS 25 -48
Organic TNS 19 -16
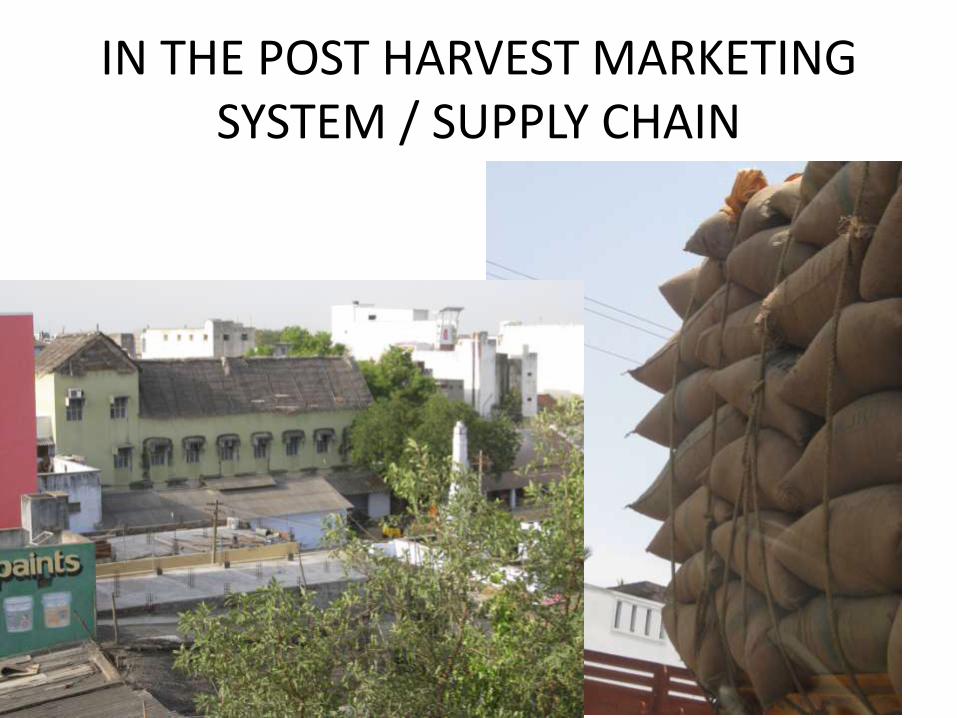
IN THE POST HARVEST MARKETING SYSTEM / SUPPLY CHAIN
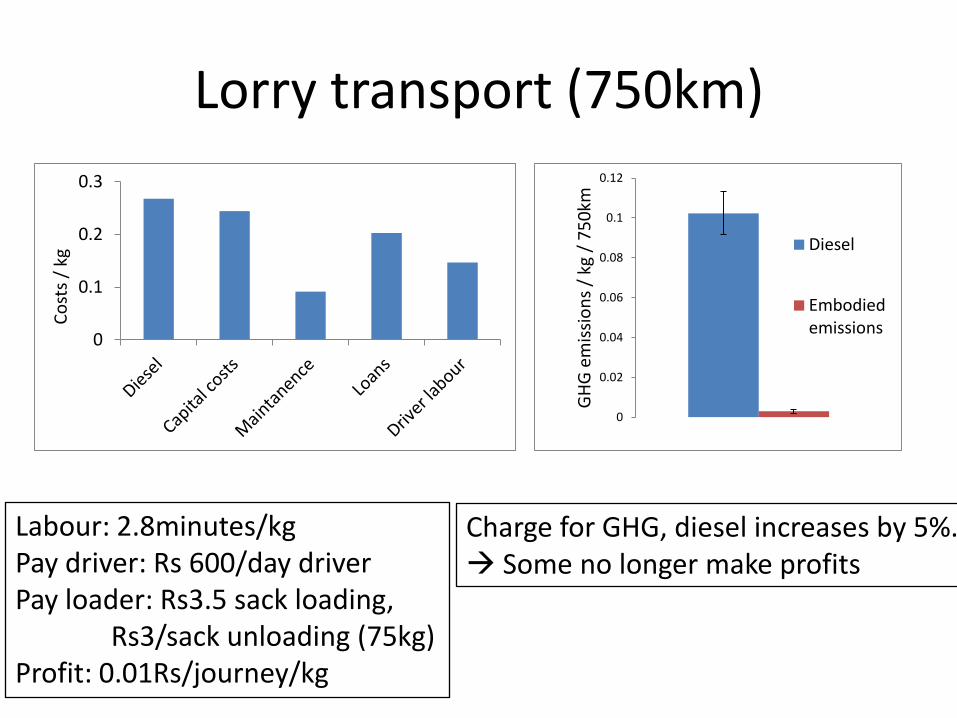
Lorry transport (750km)
0
0.1
0.2
0.3
Co
sts
/ kg
Labour: 2.8minutes/kgPay driver: Rs 600/day driverPay loader: Rs3.5 sack loading,
Rs3/sack unloading (75kg)Profit: 0.01Rs/journey/kg
Charge for GHG, diesel increases by 5%. Some no longer make profits
0
0.02
0.04
0.06
0.08
0.1
0.12
GH
G e
mis
sio
ns
/ kg
/ 7
50
km
Diesel
Embodiedemissions
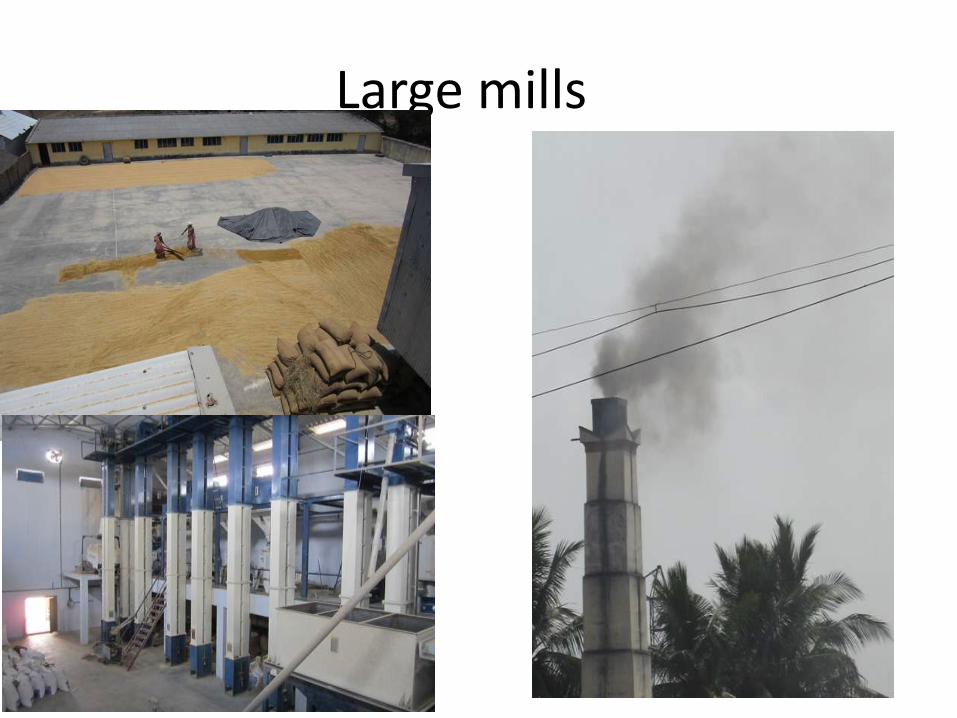
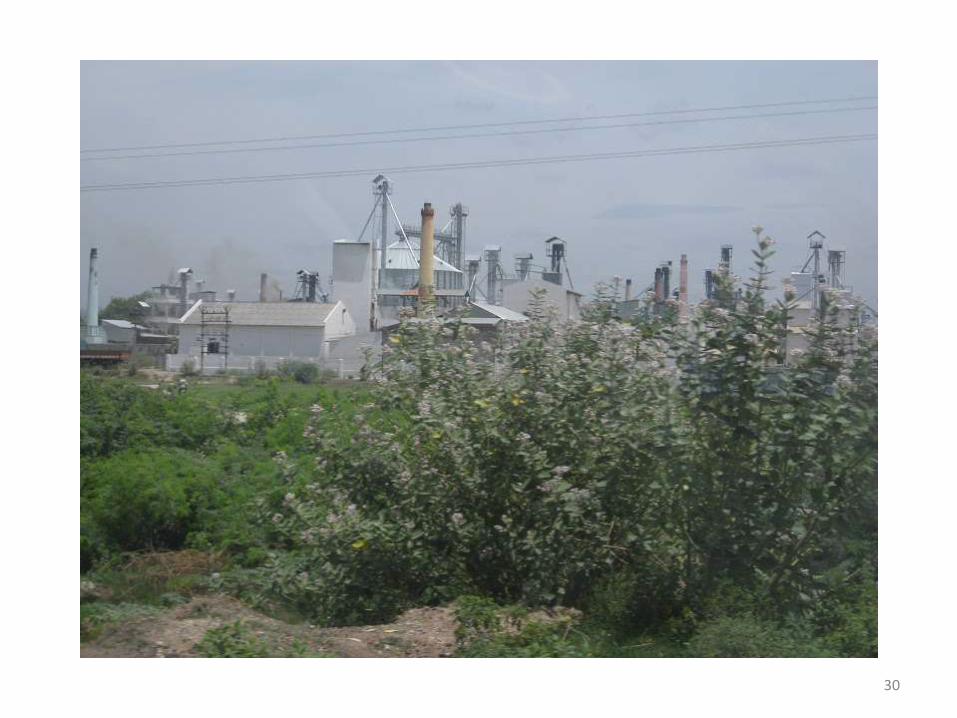
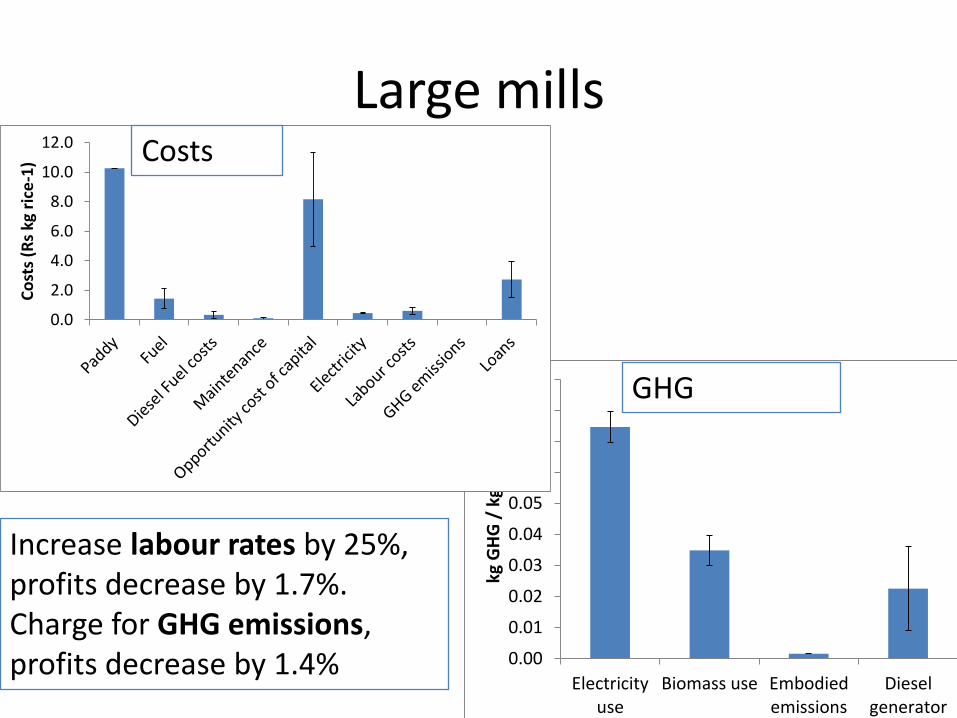
Large mills
Large mills
0.00
0.01
0.02
0.03
0.04
0.05
0.06
0.07
0.08
0.09
Electricityuse
Biomass use Embodiedemissions
Dieselgenerator
kg G
HG
/ k
g ri
ce
0.0
2.0
4.0
6.0
8.0
10.0
12.0
Co
sts
(Rs
kg r
ice
-1) Costs
GHG
Increase labour rates by 25%, profits decrease by 1.7%.Charge for GHG emissions, profits decrease by 1.4%
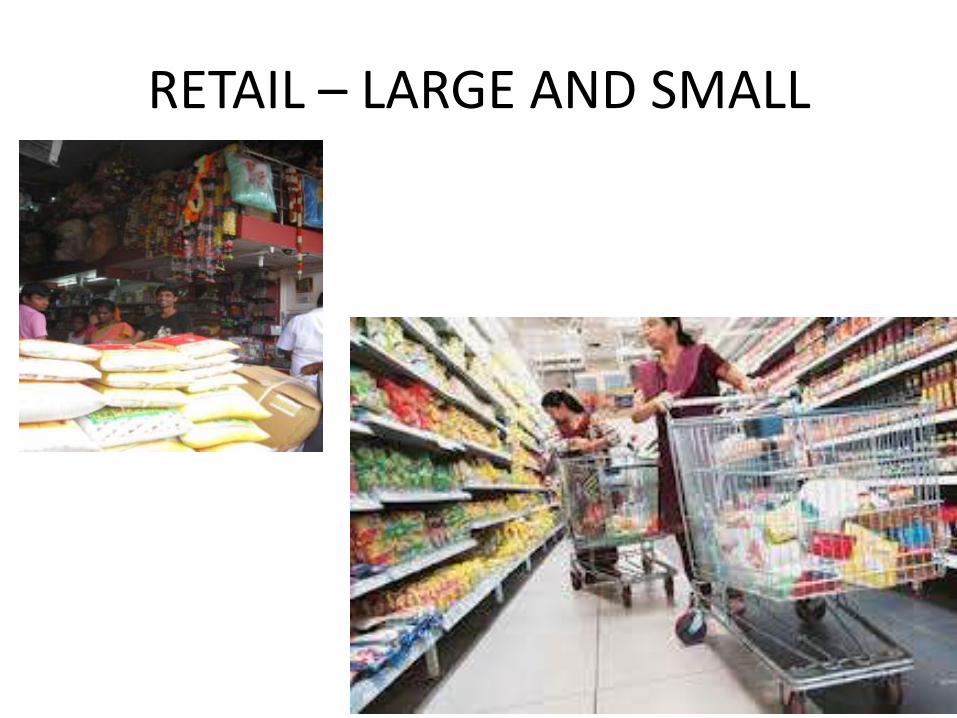
RETAIL – LARGE AND SMALL
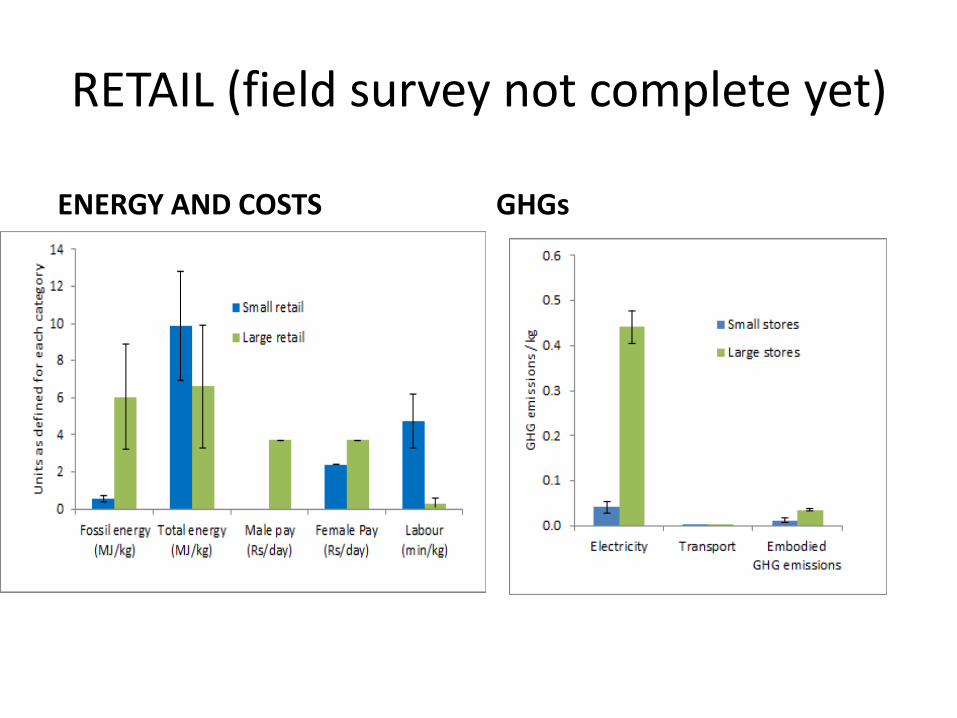
RETAIL (field survey not complete yet)
ENERGY AND COSTS GHGs

Storage/losses
Conclusions. Production
• Agricultural production GHGs, energy, water dominate the supply chain – distribution is far less important.
• GHG emissions are highly dependent upon the water table. At shallow water table, there is no significant difference in GHG emissions. At deeper water tables, SRI and rainfed show significant GHG savings.
• Labour use / ha is highest in SRI and Rain-fed rice
Conclusions. Production. 1. GHGs
GHGs1. GHG emissions from three main sources –
methane, electricity, nitrous oxide.
2. Mitigate methane through reduced irrigation, and appropriate use and timing of organic inputs (not more than needed, not just before flooding)
3. Reduce embodied electricity GHGs through less water and less technological transmission losses.
4. Reduce N2O emissions through appropriate use of nitrogen – many farms putting far more on than necessary. Reduce N2O emissions through total flooding – but trade-off with methane
Conclusions. Production. 2: Water
SRI uses significantly less water per kg, but not a significantly less compared to HYV on an area basis.
Conclusion . Production 3: Fossil Energy
• Irrigation dominates and synthetic fertilisers also very important (mainly nitrogen). Diesel not important (although dominates rainfed as no ground water irrigation or synthetic fertilisers). Embodied energy in machinery is not important.
• Energy return on investment (EROI) (fossil energy). Positive for all. V positive for rainfed
Conclusions. Transport.
• Transport, even simulated for 750km, plays a very small role in the overall chain.
• GHG emissions and costs are not well matched.
• C price would have big impact on profitability due to low margins
Conclusions. Mills
• Modern rice mills highly mechanised, so capital a key component
• Biomass emissions likely to be more important than normally recorded.
• Due to the progressive labour displacement increasing wages to labour makes minimal impact on profits
• High degree of variability in profit.
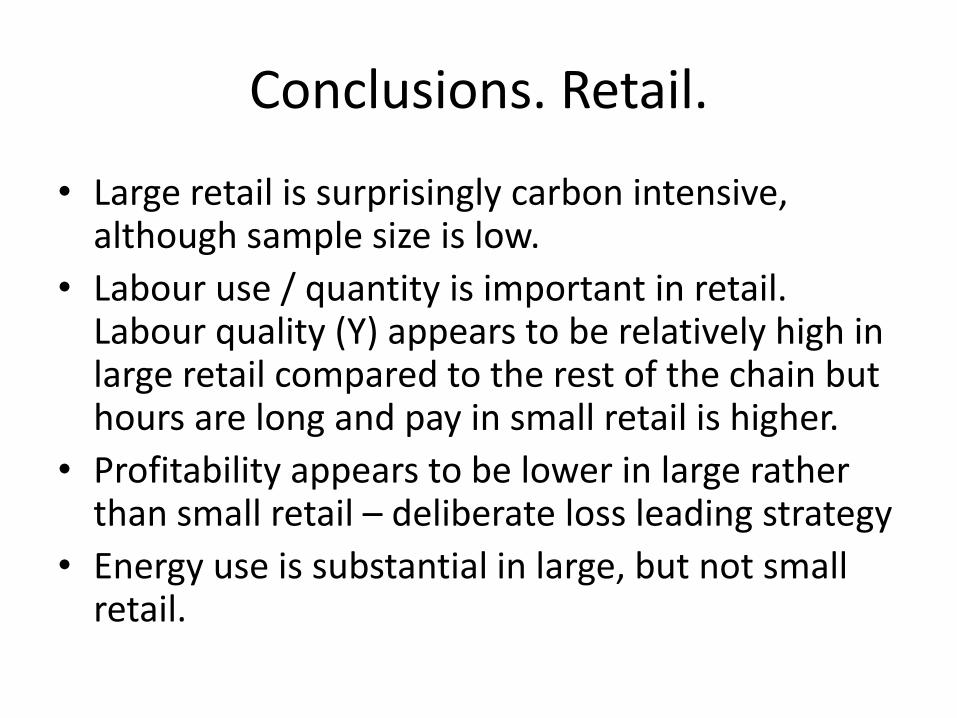
Conclusions. Retail.
• Large retail is surprisingly carbon intensive, although sample size is low.
• Labour use / quantity is important in retail. Labour quality (Y) appears to be relatively high in large retail compared to the rest of the chain but hours are long and pay in small retail is higher.
• Profitability appears to be lower in large rather than small retail – deliberate loss leading strategy
• Energy use is substantial in large, but not small retail.
Cautions
• Data results from a range of ways of knowing: measurement, recall, calculation and extrapolation -as careful as possible
• Alone they cannot be used as a prescriptive tool for policy makers – sustainability is much more complicated than just GHG emissions and labour use (biodiversity loss; immediate water pollution etc)
UNIQUE SELLING POINT!
• But our approach is a novel combination of • 1. first hand fieldwork; • 2. practical alternatives; • 3. multidisciplinary analysis of criteria • 4. the integration of measurement methods with a
consultation comparing expert and general public evaluations of policy outcomes from the measurement research.
• 5. multiple elements of sustainability from a whole supply chain with many elements in the informal sector. The research raises issues of trade-offs/synergies in a novel manner and often for the first time
MORE ON OUR WEBSITE
• http://www.southasia.ox.ac.uk/resources-greenhouse-gases-technology-and-jobs-indias-informal-economy-case-rice
93