Embed Size (px)
Citation preview
A
W. BRADFORD WILCOX AND WENDY WANG
S E PTEMBER 2017
The Marriage DivideHOW AND WHY WORKING-CLASS FAMIL IE S ARE MORE FRAGILE TODAY
RESEARCH BRIEF FOR OPPORTUNITY AMERICA–AEI–BROOKINGS WORKING CLASS GROUP
1
Executive Summary
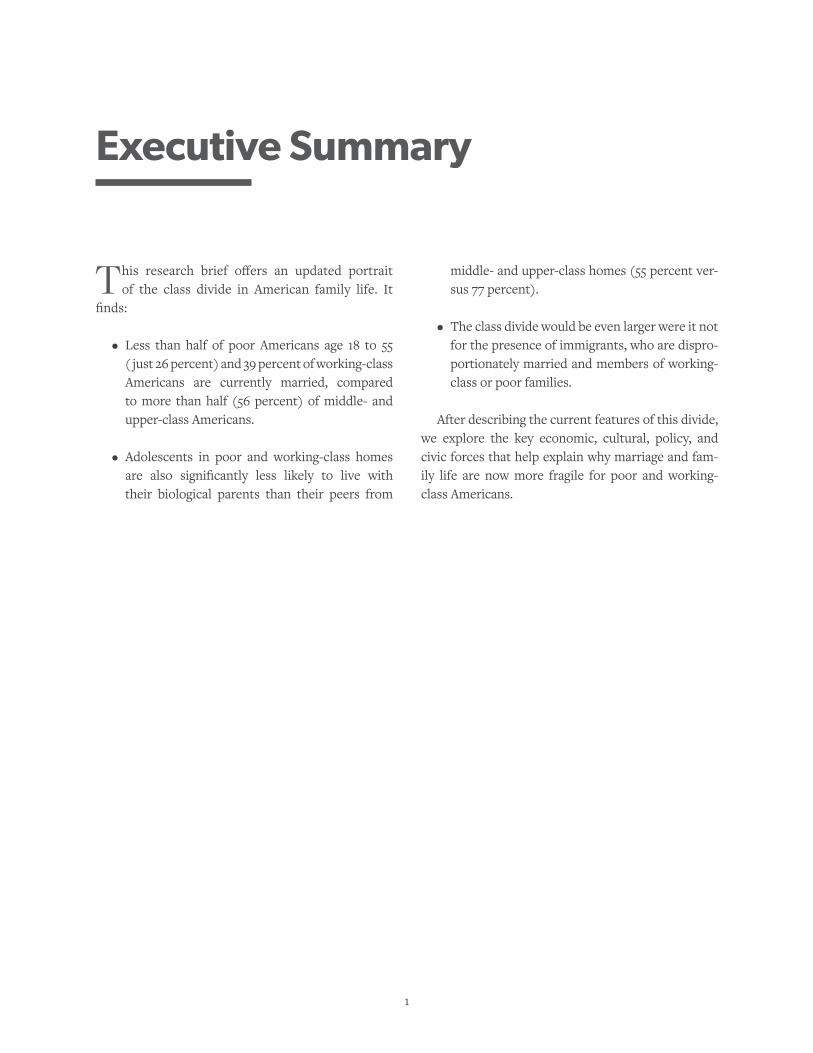
This research brief offers an updated portrait of the class divide in American family life. It
finds:
• Less than half of poor Americans age 18 to 55 ( just 26 percent) and 39 percent of working-class Americans are currently married, compared to more than half (56 percent) of middle- and upper-class Americans.
• Adolescents in poor and working-class homes are also significantly less likely to live with their biological parents than their peers from
middle- and upper-class homes (55 percent ver-sus 77 percent).
• The class divide would be even larger were it not for the presence of immigrants, who are dispro-portionately married and members of working- class or poor families.
After describing the current features of this divide, we explore the key economic, cultural, policy, and civic forces that help explain why marriage and fam-ily life are now more fragile for poor and working- class Americans.
2
The Marriage Divide
HOW AND WHY WORKING-CLASS FAMIL IES ARE M O RE F RAGI LE TODAY
W. Bradford Wilcox and Wendy Wang
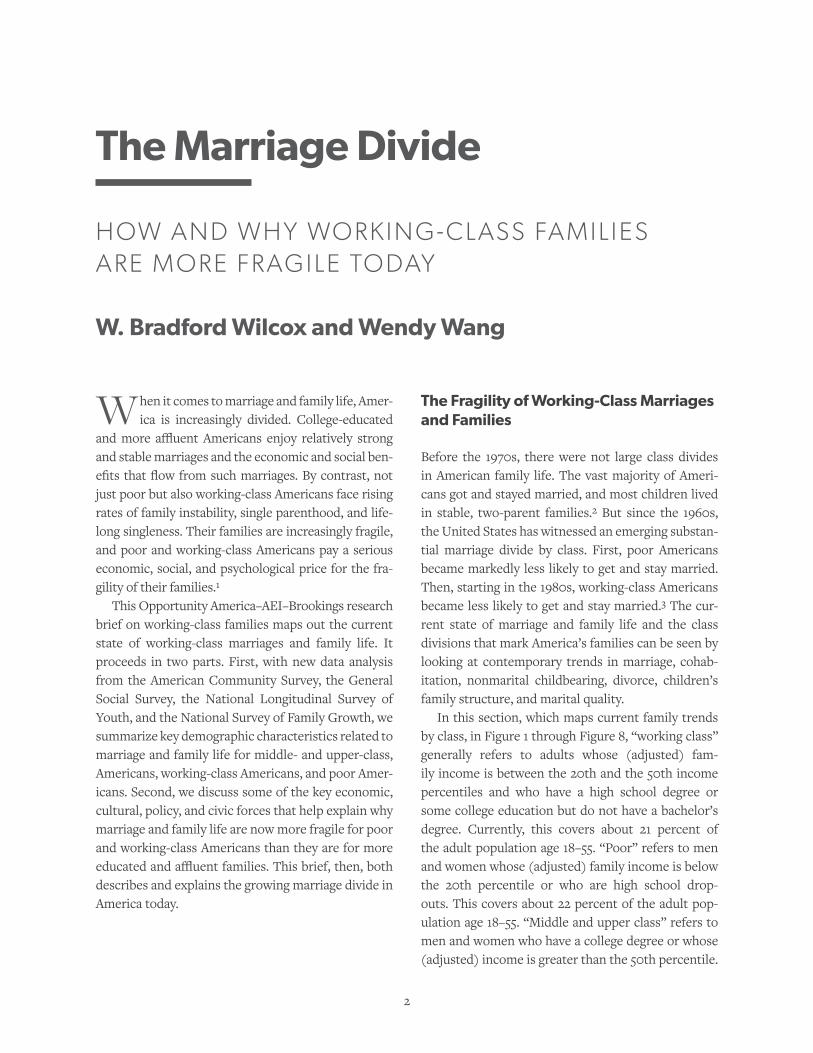
When it comes to marriage and family life, Amer-ica is increasingly divided. College-educated
and more affluent Americans enjoy relatively strong and stable marriages and the economic and social ben-efits that flow from such marriages. By contrast, not just poor but also working-class Americans face rising rates of family instability, single parenthood, and life-long singleness. Their families are increasingly fragile, and poor and working-class Americans pay a serious economic, social, and psychological price for the fra-gility of their families.1
This Opportunity America–AEI–Brookings research brief on working-class families maps out the current state of working-class marriages and family life. It proceeds in two parts. First, with new data analysis from the American Community Survey, the General Social Survey, the National Longitudinal Survey of Youth, and the National Survey of Family Growth, we summarize key demographic characteristics related to marriage and family life for middle- and upper-class, Americans, working-class Americans, and poor Amer-icans. Second, we discuss some of the key economic, cultural, policy, and civic forces that help explain why marriage and family life are now more fragile for poor and working-class Americans than they are for more educated and affluent families. This brief, then, both describes and explains the growing marriage divide in America today.
The Fragility of Working-Class Marriages and Families
Before the 1970s, there were not large class divides in American family life. The vast majority of Ameri-cans got and stayed married, and most children lived in stable, two-parent families.2 But since the 1960s, the United States has witnessed an emerging substan-tial marriage divide by class. First, poor Americans became markedly less likely to get and stay married. Then, starting in the 1980s, working-class Americans became less likely to get and stay married.3 The cur-rent state of marriage and family life and the class divisions that mark America’s families can be seen by looking at contemporary trends in marriage, cohab-itation, nonmarital childbearing, divorce, children’s family structure, and marital quality.
In this section, which maps current family trends by class, in Figure 1 through Figure 8, “working class” generally refers to adults whose (adjusted) fam-ily income is between the 20th and the 50th income percentiles and who have a high school degree or some college education but do not have a bachelor’s degree. Currently, this covers about 21 percent of the adult population age 18–55. “Poor” refers to men and women whose (adjusted) family income is below the 20th percentile or who are high school drop-outs. This covers about 22 percent of the adult pop-ulation age 18–55. “Middle and upper class” refers to men and women who have a college degree or whose (adjusted) income is greater than the 50th percentile.
3
THE MARRIAGE DIVIDE W. BRADFORD WILCOX AND WENDY WANG
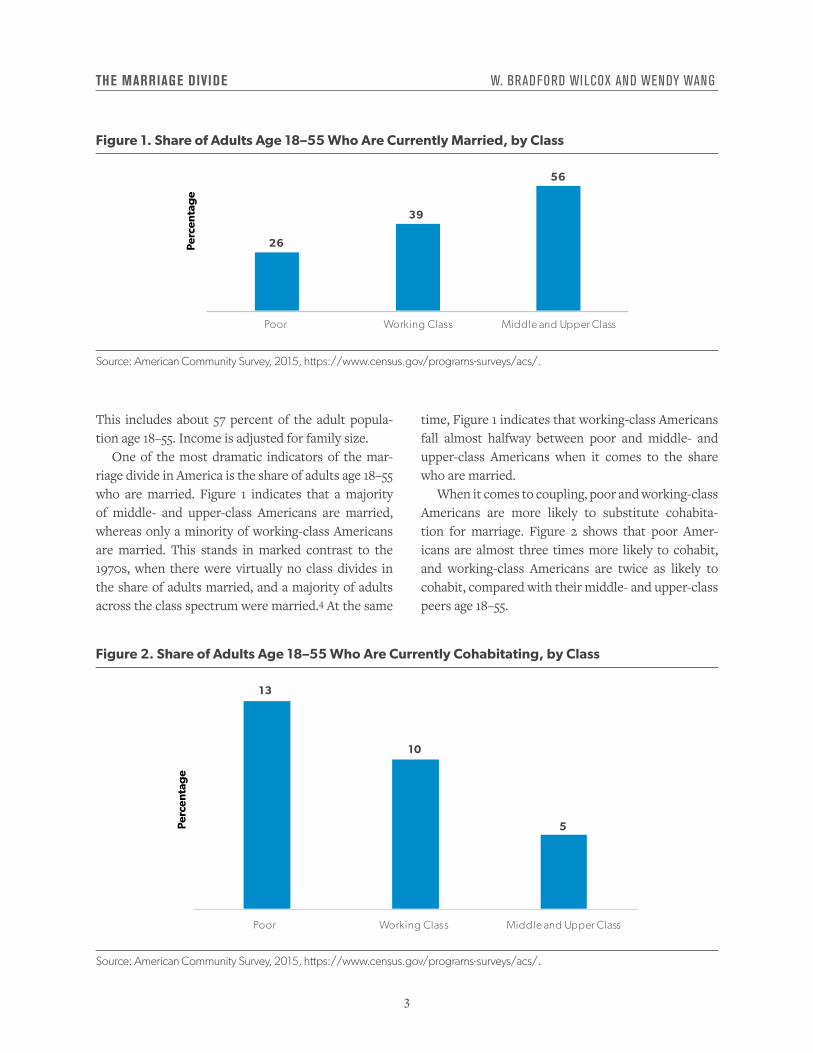
This includes about 57 percent of the adult popula-tion age 18–55. Income is adjusted for family size.
One of the most dramatic indicators of the mar-riage divide in America is the share of adults age 18–55 who are married. Figure 1 indicates that a majority of middle- and upper-class Americans are married, whereas only a minority of working-class Americans are married. This stands in marked contrast to the 1970s, when there were virtually no class divides in the share of adults married, and a majority of adults across the class spectrum were married.4 At the same
time, Figure 1 indicates that working-class Americans fall almost halfway between poor and middle- and upper-class Americans when it comes to the share who are married.
When it comes to coupling, poor and working-class Americans are more likely to substitute cohabita-tion for marriage. Figure 2 shows that poor Amer-icans are almost three times more likely to cohabit, and working-class Americans are twice as likely to cohabit, compared with their middle- and upper-class peers age 18–55.
Figure 1. Share of Adults Age 18–55 Who Are Currently Married, by Class
Source: American Community Survey, 2015, https://www.census.gov/programs-surveys/acs/.
26
39
56
Poor Working Class Middle and Upper Class
Perc
enta
ge
Figure 2. Share of Adults Age 18–55 Who Are Currently Cohabitating, by Class
Source: American Community Survey, 2015, https://www.census.gov/programs-surveys/acs/.
13
10
5
Poor Working Class Middle and Upper Class
Perc
enta
ge
4
THE MARRIAGE DIVIDE W. BRADFORD WILCOX AND WENDY WANG
Taken together, these figures suggest that lower- income and less-educated Americans are more likely to be living outside of a partnership. Specifically, about six in 10 poor Americans are single, about five in 10 working-class Americans are single, and about four in 10 middle- and upper-class Americans are single.
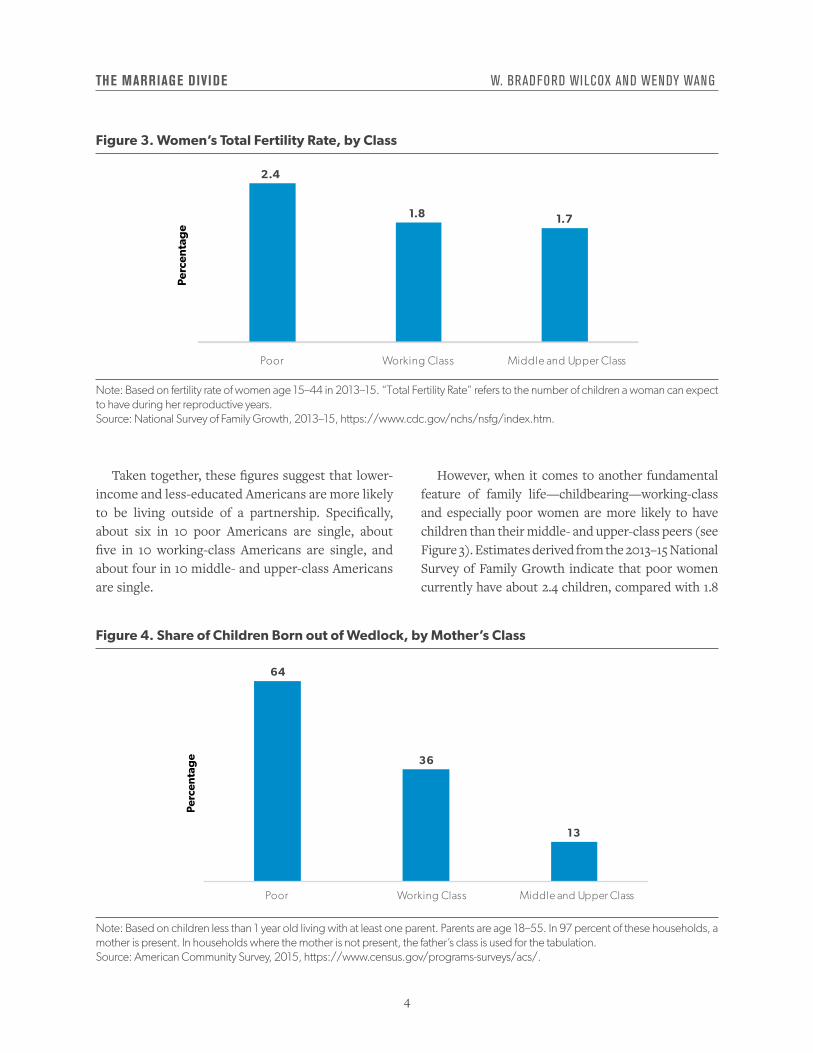
However, when it comes to another fundamental feature of family life—childbearing—working-class and especially poor women are more likely to have children than their middle- and upper-class peers (see Figure 3). Estimates derived from the 2013–15 National Survey of Family Growth indicate that poor women currently have about 2.4 children, compared with 1.8
Figure 3. Women’s Total Fertility Rate, by Class
Note: Based on fertility rate of women age 15–44 in 2013–15. “Total Fertility Rate” refers to the number of children a woman can expect to have during her reproductive years.Source: National Survey of Family Growth, 2013–15, https://www.cdc.gov/nchs/nsfg/index.htm.
2.4
1.8 1.7
Poor Working Class Middle and Upper Class
Perc
enta
ge
Figure 4. Share of Children Born out of Wedlock, by Mother’s Class
Note: Based on children less than 1 year old living with at least one parent. Parents are age 18–55. In 97 percent of these households, a mother is present. In households where the mother is not present, the father’s class is used for the tabulation.Source: American Community Survey, 2015, https://www.census.gov/programs-surveys/acs/.
64
36
13
Poor Working Class Middle and Upper Class
Perc
enta
ge
5
THE MARRIAGE DIVIDE W. BRADFORD WILCOX AND WENDY WANG
children for working-class women and 1.7 children for middle- and upper-class women. Poor women, in par-ticular, start childbearing earlier and end up having markedly more children than more affluent women.
But that working-class and poor Americans are less likely to be married also means they are more likely to have these children outside of wedlock. In fact, as Figure 4 indicates, children born to working-class mothers are almost three times as likely to be born outside of wedlock, compared with children born to middle- and upper-class mothers. Children born to poor mothers are about five times as likely to be born out of wedlock.
Two points are particularly salient here. First, non-marital childbearing is comparatively rare among more affluent and educated women. Second, it is still the case that a majority of babies born to working-class mothers are born in wedlock. In other words, marriage is still connected to parenthood for most working-class parents having a baby.
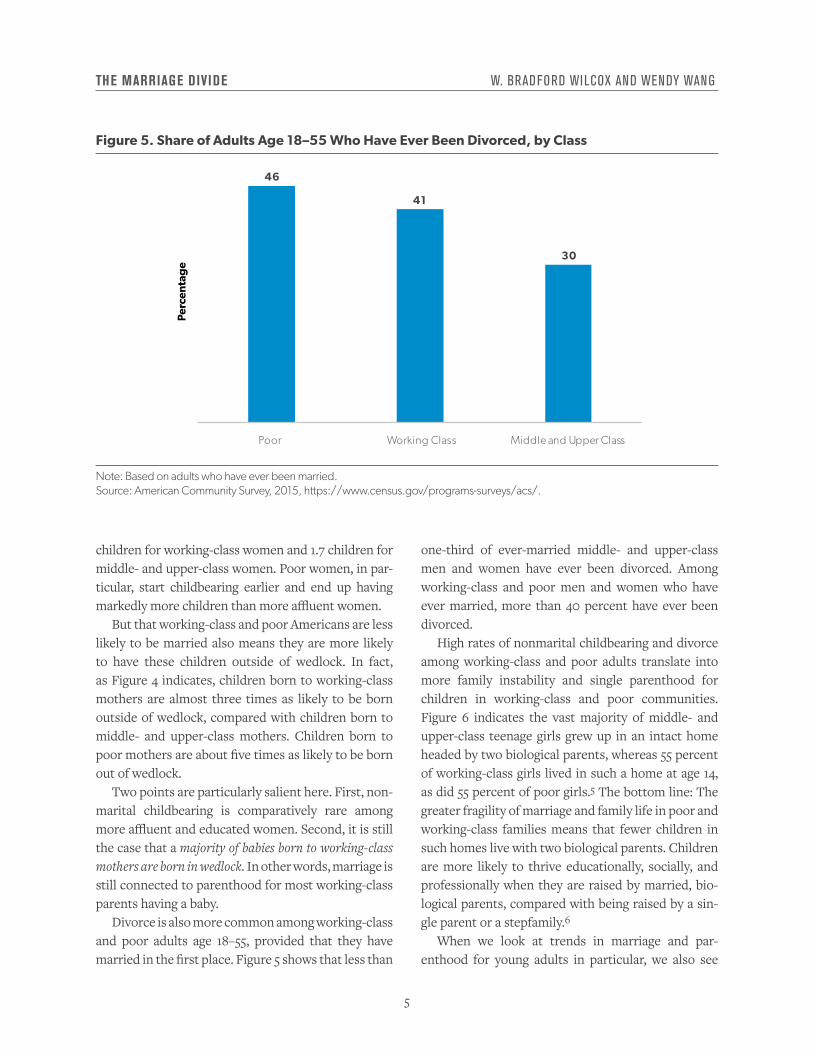
Divorce is also more common among working-class and poor adults age 18–55, provided that they have married in the first place. Figure 5 shows that less than
one-third of ever-married middle- and upper-class men and women have ever been divorced. Among working-class and poor men and women who have ever married, more than 40 percent have ever been divorced.
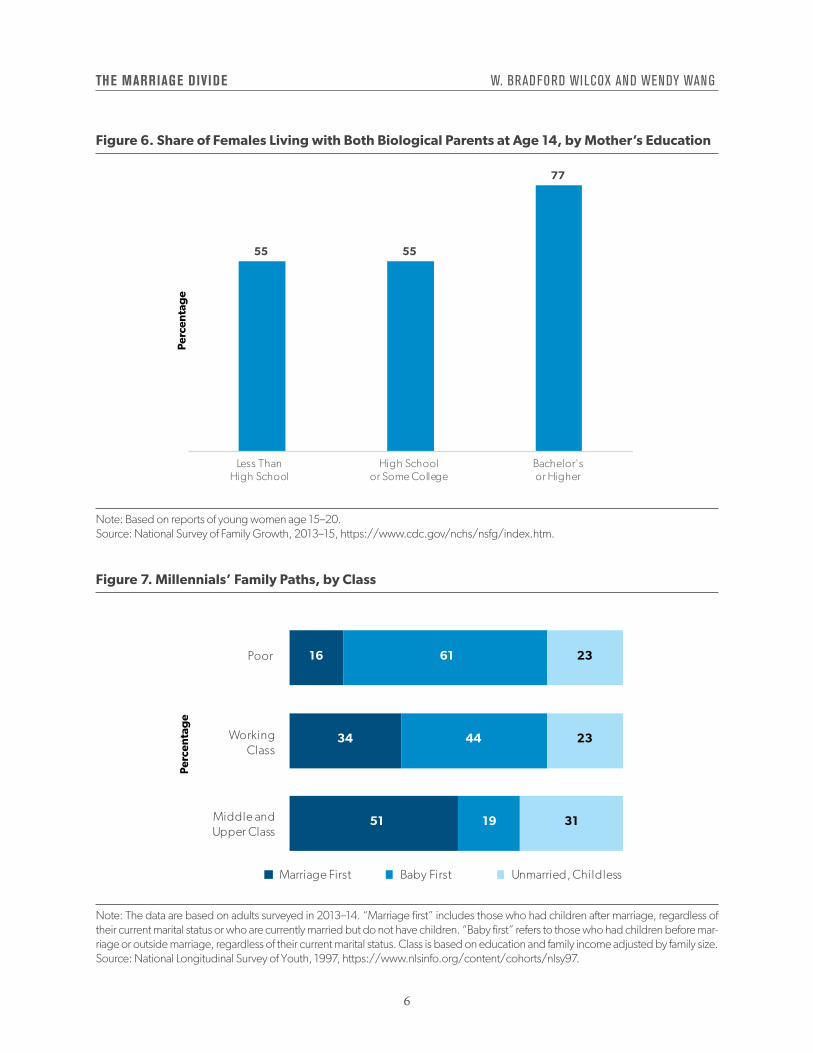
High rates of nonmarital childbearing and divorce among working-class and poor adults translate into more family instability and single parenthood for children in working-class and poor communities. Figure 6 indicates the vast majority of middle- and upper-class teenage girls grew up in an intact home headed by two biological parents, whereas 55 percent of working-class girls lived in such a home at age 14, as did 55 percent of poor girls.5 The bottom line: The greater fragility of marriage and family life in poor and working-class families means that fewer children in such homes live with two biological parents. Children are more likely to thrive educationally, socially, and professionally when they are raised by married, bio-logical parents, compared with being raised by a sin-gle parent or a stepfamily.6
When we look at trends in marriage and par-enthood for young adults in particular, we also see
Figure 5. Share of Adults Age 18–55 Who Have Ever Been Divorced, by Class
Note: Based on adults who have ever been married.Source: American Community Survey, 2015, https://www.census.gov/programs-surveys/acs/.
46
41
30
Poor Working Class Middle and Upper Class
Perc
enta
ge
6
THE MARRIAGE DIVIDE W. BRADFORD WILCOX AND WENDY WANG
Figure 7. Millennials’ Family Paths, by Class
Note: The data are based on adults surveyed in 2013–14. “Marriage first” includes those who had children after marriage, regardless of their current marital status or who are currently married but do not have children. “Baby first” refers to those who had children before mar-riage or outside marriage, regardless of their current marital status. Class is based on education and family income adjusted by family size.Source: National Longitudinal Survey of Youth, 1997, https://www.nlsinfo.org/content/cohorts/nlsy97.
16
34
51
61
44
19
23
23
31
Poor
WorkingClass
Middle andUpper Class
Marriage First Baby First Unmarried, Childless
Perc
enta
ge
Figure 6. Share of Females Living with Both Biological Parents at Age 14, by Mother’s Education
Note: Based on reports of young women age 15–20.Source: National Survey of Family Growth, 2013–15, https://www.cdc.gov/nchs/nsfg/index.htm.
55 55
77
Less ThanHigh School
High Schoolor Some College
Bachelor'sor Higher
Perc
enta
ge
7
THE MARRIAGE DIVIDE W. BRADFORD WILCOX AND WENDY WANG
marked differences by class.7 Figure 7 indicates that poor and working-class millennials age 28–34 are much more likely to have children before or outside marriage. In contrast, middle- and upper-class mil-lennials are markedly more likely to marry before having any children or to have postponed or avoided marriage and parenthood altogether. For instance, 44 percent of working-class millennials have had a child before marriage, whereas 51 percent of middle- and upper-class millennials have married first.
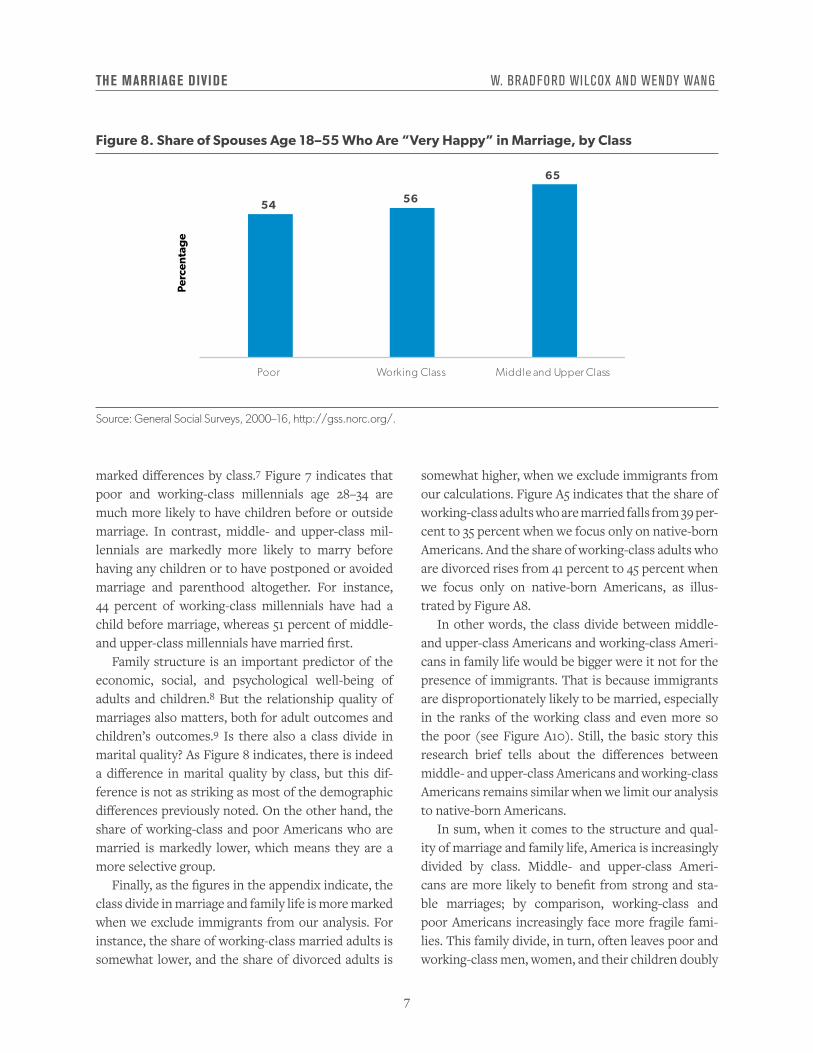
Family structure is an important predictor of the economic, social, and psychological well-being of adults and children.8 But the relationship quality of marriages also matters, both for adult outcomes and children’s outcomes.9 Is there also a class divide in marital quality? As Figure 8 indicates, there is indeed a difference in marital quality by class, but this dif-ference is not as striking as most of the demographic differences previously noted. On the other hand, the share of working-class and poor Americans who are married is markedly lower, which means they are a more selective group.
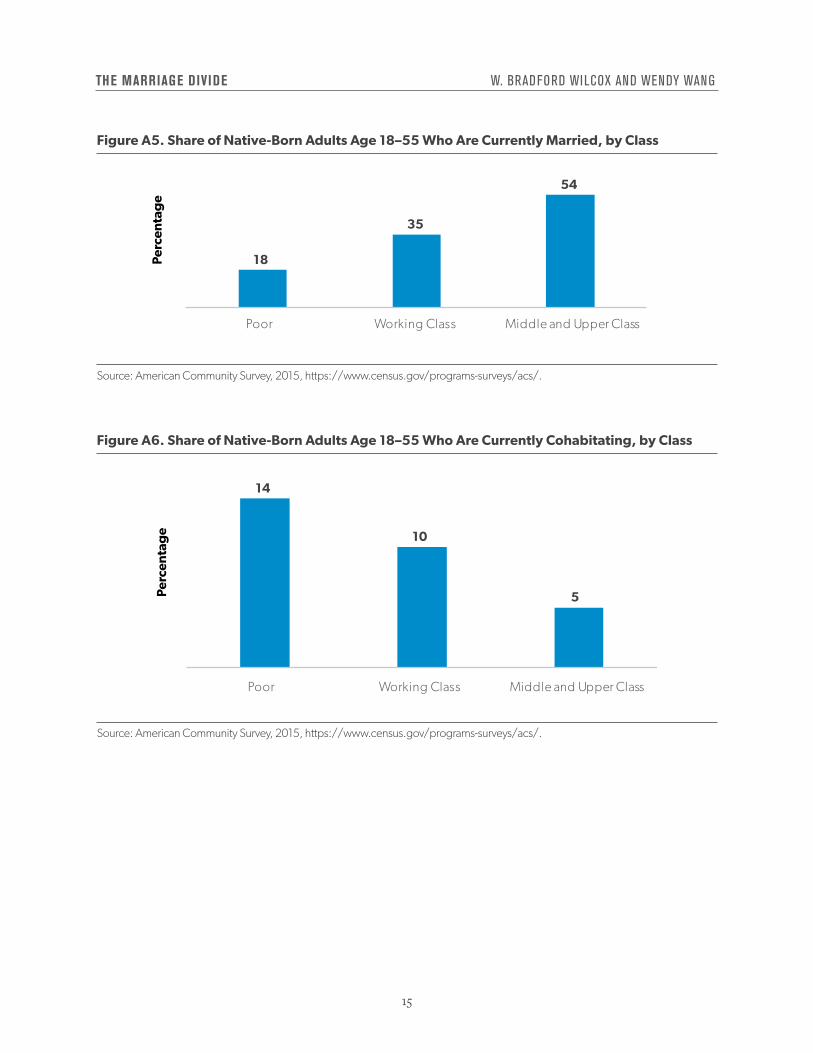
Finally, as the figures in the appendix indicate, the class divide in marriage and family life is more marked when we exclude immigrants from our analysis. For instance, the share of working-class married adults is somewhat lower, and the share of divorced adults is
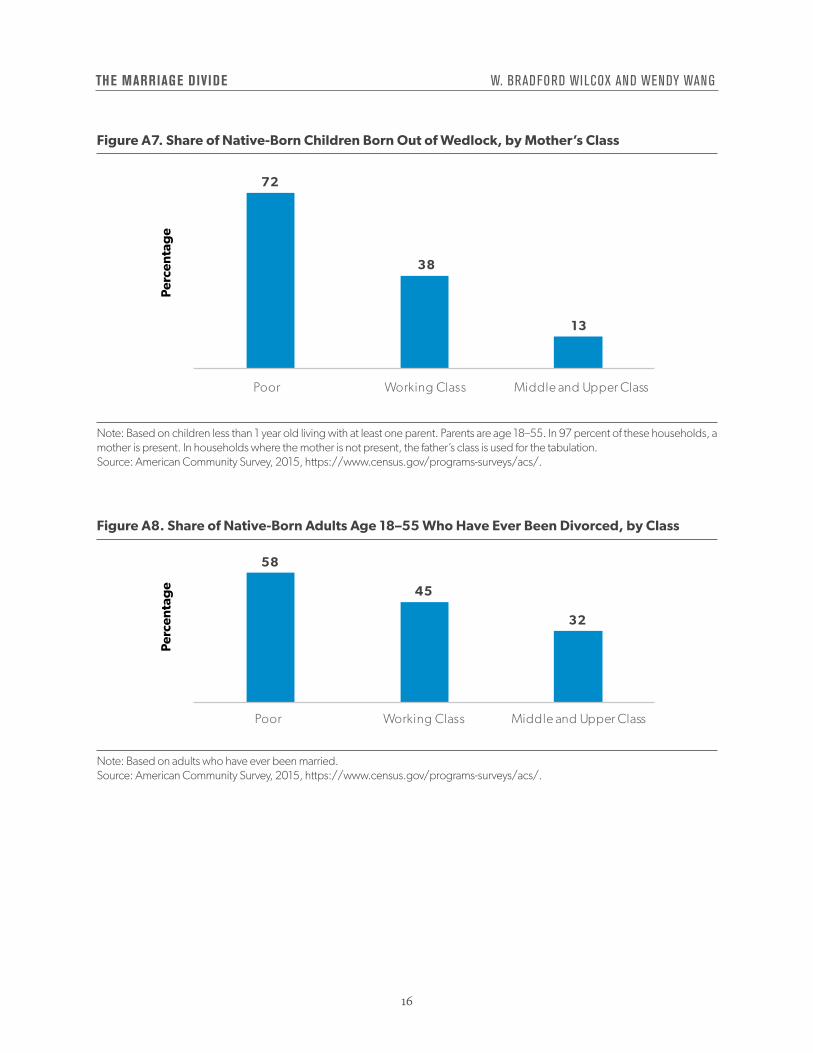
somewhat higher, when we exclude immigrants from our calculations. Figure A5 indicates that the share of working-class adults who are married falls from 39 per-cent to 35 percent when we focus only on native-born Americans. And the share of working-class adults who are divorced rises from 41 percent to 45 percent when we focus only on native-born Americans, as illus-trated by Figure A8.
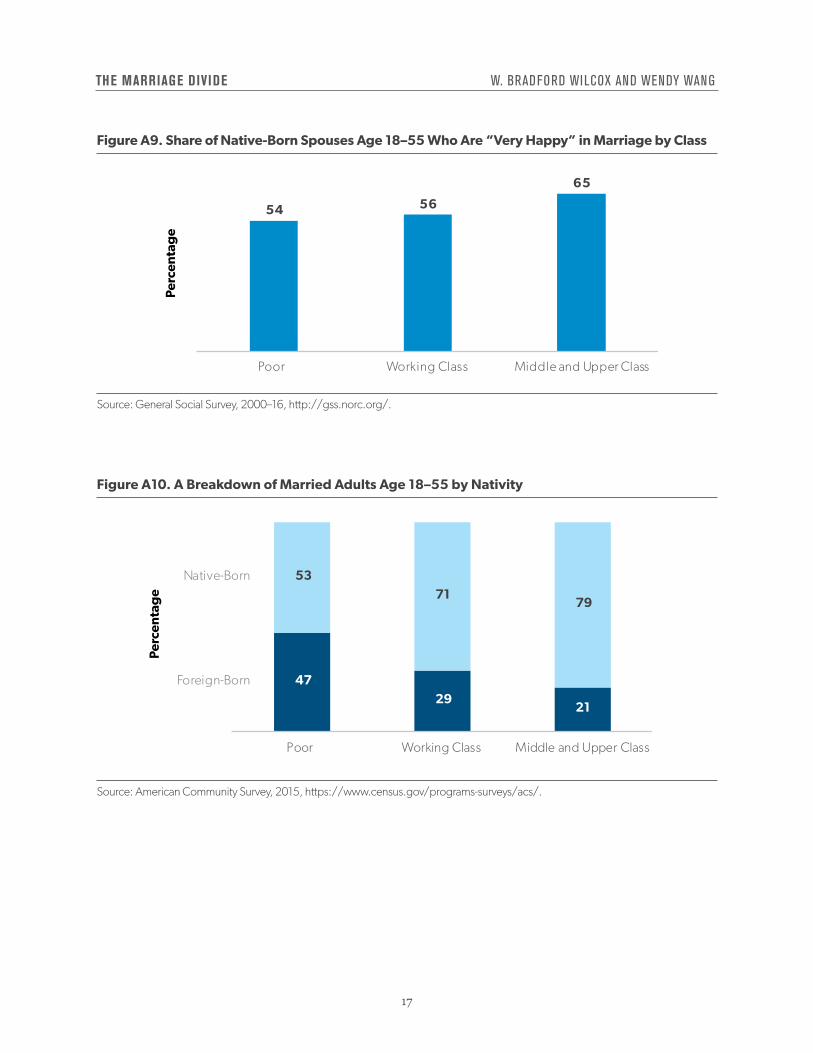
In other words, the class divide between middle- and upper-class Americans and working-class Ameri-cans in family life would be bigger were it not for the presence of immigrants. That is because immigrants are disproportionately likely to be married, especially in the ranks of the working class and even more so the poor (see Figure A10). Still, the basic story this research brief tells about the differences between middle- and upper-class Americans and working-class Americans remains similar when we limit our analysis to native-born Americans.
In sum, when it comes to the structure and qual-ity of marriage and family life, America is increasingly divided by class. Middle- and upper-class Ameri-cans are more likely to benefit from strong and sta-ble marriages; by comparison, working-class and poor Americans increasingly face more fragile fami-lies. This family divide, in turn, often leaves poor and working-class men, women, and their children doubly
Figure 8. Share of Spouses Age 18–55 Who Are “Very Happy” in Marriage, by Class
Source: General Social Surveys, 2000–16, http://gss.norc.org/.
54 56
65
Poor Working Class Middle and Upper Class
Perc
enta
ge
8
THE MARRIAGE DIVIDE W. BRADFORD WILCOX AND WENDY WANG
disadvantaged: They have more fragile families and fewer socioeconomic resources.10
What Explains the Marriage Divide in America?
Given the class divide in marriage and family pat-terns, concluding that this divide is driven solely by economic factors is tempting. But as Brookings econ-omist Isabel Sawhill has observed, a “purely economic theory falls short as an explanation of the dramatic transformation of family life in the U.S. in recent decades.”11 Consider, for instance, that there was no marked increase in divorce, family instability, or sin-gle parenthood at the height of the Great Depression in the 1930s. A different policy, cultural, and civic con-text in that era meant that economic distress did not automatically lead to greater family instability.
By contrast, a series of interlocking economic, pol-icy, civic, and cultural changes since the 1960s in Amer-ica combined to create a perfect family storm for poor
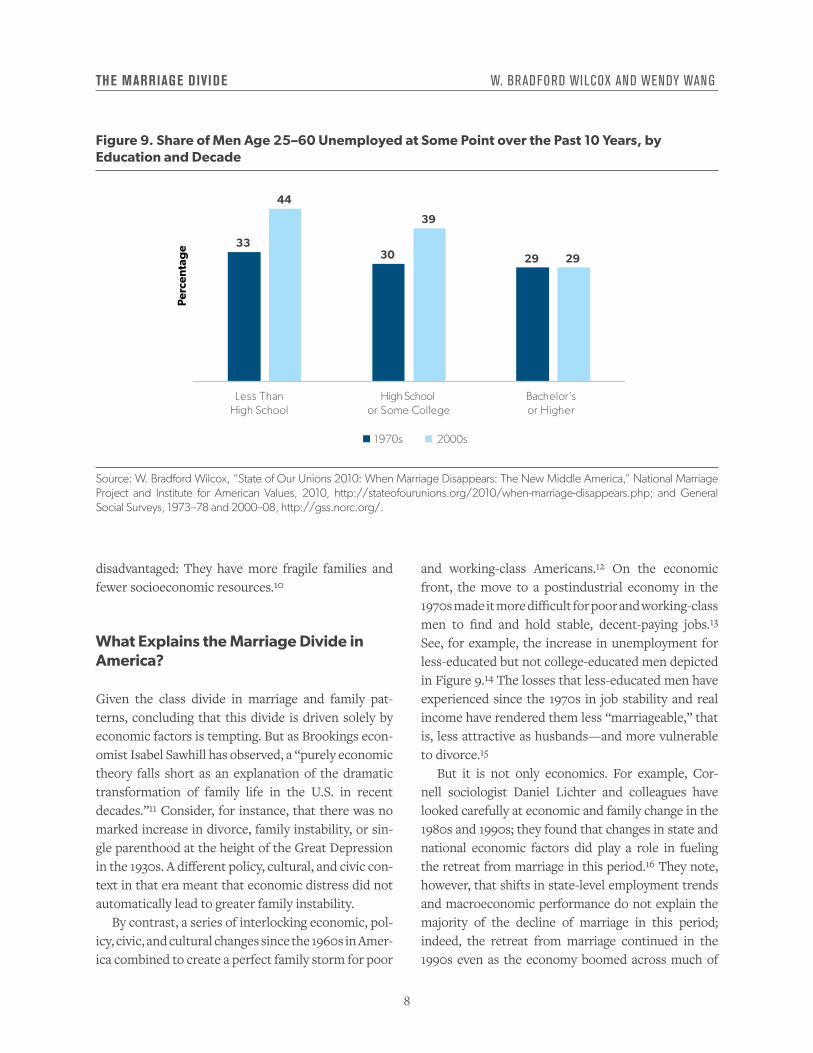
and working-class Americans.12 On the economic front, the move to a postindustrial economy in the 1970s made it more difficult for poor and working-class men to find and hold stable, decent-paying jobs.13 See, for example, the increase in unemployment for less-educated but not college-educated men depicted in Figure 9.14 The losses that less-educated men have experienced since the 1970s in job stability and real income have rendered them less “marriageable,” that is, less attractive as husbands—and more vulnerable to divorce.15
But it is not only economics. For example, Cor-nell sociologist Daniel Lichter and colleagues have looked carefully at economic and family change in the 1980s and 1990s; they found that changes in state and national economic factors did play a role in fueling the retreat from marriage in this period.16 They note, however, that shifts in state-level employment trends and macroeconomic performance do not explain the majority of the decline of marriage in this period; indeed, the retreat from marriage continued in the 1990s even as the economy boomed across much of
Figure 9. Share of Men Age 25–60 Unemployed at Some Point over the Past 10 Years, by Education and Decade
Source: W. Bradford Wilcox, “State of Our Unions 2010: When Marriage Disappears: The New Middle America,” National Marriage Project and Institute for American Values, 2010, http://stateofourunions.org/2010/when-marriage-disappears.php; and General Social Surveys, 1973–78 and 2000–08, http://gss.norc.org/.
33 30 29
44
39
29
Less ThanHigh School
High School or Some College
Bachelor’sor Higher
1970s 2000s
Perc
enta
ge
9
THE MARRIAGE DIVIDE W. BRADFORD WILCOX AND WENDY WANG
the country in this decade. In their words: “Our results call into question the appropriateness of monocausal economic explanations of declining marriage.”17
The decline of marriage and rise of single parent-hood in the late 1960s preceded the economic changes that undercut men’s wages and job stability in the 1970s.18 Shifts in the culture weakened marriage before shifts in the economy directly affected working-class families. The counterculture, sexual revolution, and rise of expressive individualism in the 1960s and 1970s undercut the norms, values, and virtues that sustain strong and stable marriages and families. In other words, marriage-related culture shifted before the economic changes that often garner more attention.19
But why would these cultural changes disparately affect poor and working-class Americans? These shifts ended up disparately affecting poor and then working-class men, women, and their children for three reasons.
First, because working-class and poor Americans have less of a social and economic stake in stable mar-riage, they depend more on cultural supports for mar-riage than do their middle- and upper-class peers.20 For example, middle- and upper-class Americans are
more likely to own a home, and home ownership stabi-lizes marriage apart from whether homeowners have a strong normative commitment to marital perma-nence.21 By contrast, when marriage norms become weaker, working-class and poor couples—who are much less likely to own a home together—have fewer reasons to avoid divorce. So, the decline in norma-tive support for marriage has affected working-class couples more because they have a smaller eco-nomic stake in marriage and have depended more on marriage-related norms to get and stay married.
Second, working-class and poor Americans have fewer cultural and educational resources to success-fully navigate the increasingly deinstitutionalized character of dating, childbearing, and marriage. The legal scholar Amy Wax argues that the “moral dereg-ulation” of matters related to sex, parenthood, mar-riage, and divorce proved more difficult for poor and working-class Americans to navigate than for more educated and affluent Americans because the latter group was and remains more likely to approach these matters with a disciplined, long-term perspective.22 By contrast, poor and working-class Americans were more likely to take a short-term view of these matters
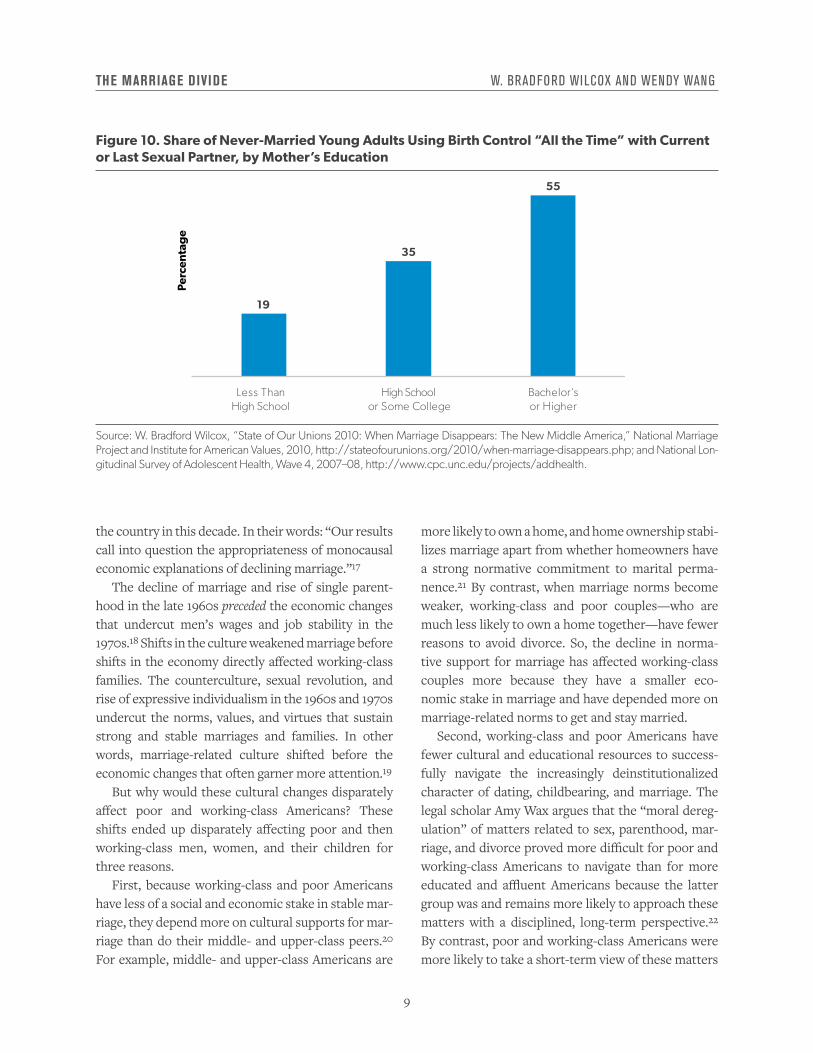
Figure 10. Share of Never-Married Young Adults Using Birth Control “All the Time” with Current or Last Sexual Partner, by Mother’s Education
Source: W. Bradford Wilcox, “State of Our Unions 2010: When Marriage Disappears: The New Middle America,” National Marriage Project and Institute for American Values, 2010, http://stateofourunions.org/2010/when-marriage-disappears.php; and National Lon-gitudinal Survey of Adolescent Health, Wave 4, 2007–08, http://www.cpc.unc.edu/projects/addhealth.
19
35
55
Less ThanHigh School
High School or Some College
Bachelor’sor Higher
Perc
enta
ge
10
THE MARRIAGE DIVIDE W. BRADFORD WILCOX AND WENDY WANG
and make decisions that were gratifying in the short term but hurt their long-term well-being, or that of their children and families.
Sociologists Sharon Sassler and Amanda Miller interpret this dynamic somewhat differently: They argue that the stresses facing poor and working-class young adults leave them with a diminished sense of efficacy, which in turn makes it more difficult for them to navigate today’s choices related to sex, con-traception, childbearing, and marriage than their better-educated and more affluent peers.23 But the bottom line is similar: Today’s ethos of freedom and choice when it comes to dating, childbearing, and marriage is more difficult for working-class and poor Americans to navigate. For instance, young adults from less-educated homes are less likely to consis-tently use contraception than are young adults from more educated homes, as Figure 10 indicates.
Third, in recent years, middle- and upper-class Americans have rejected the most permissive dimen-sions of the counterculture for themselves and their children, even as poor and working-class Americans have adapted a more permissive orientation toward
matters such as divorce and premarital sex.24 The end result has been that key norms, values, and virtues—from fidelity to attitudes about teen pregnancy—that sustain a strong marriage culture are now generally weaker in poor and working-class communities.25
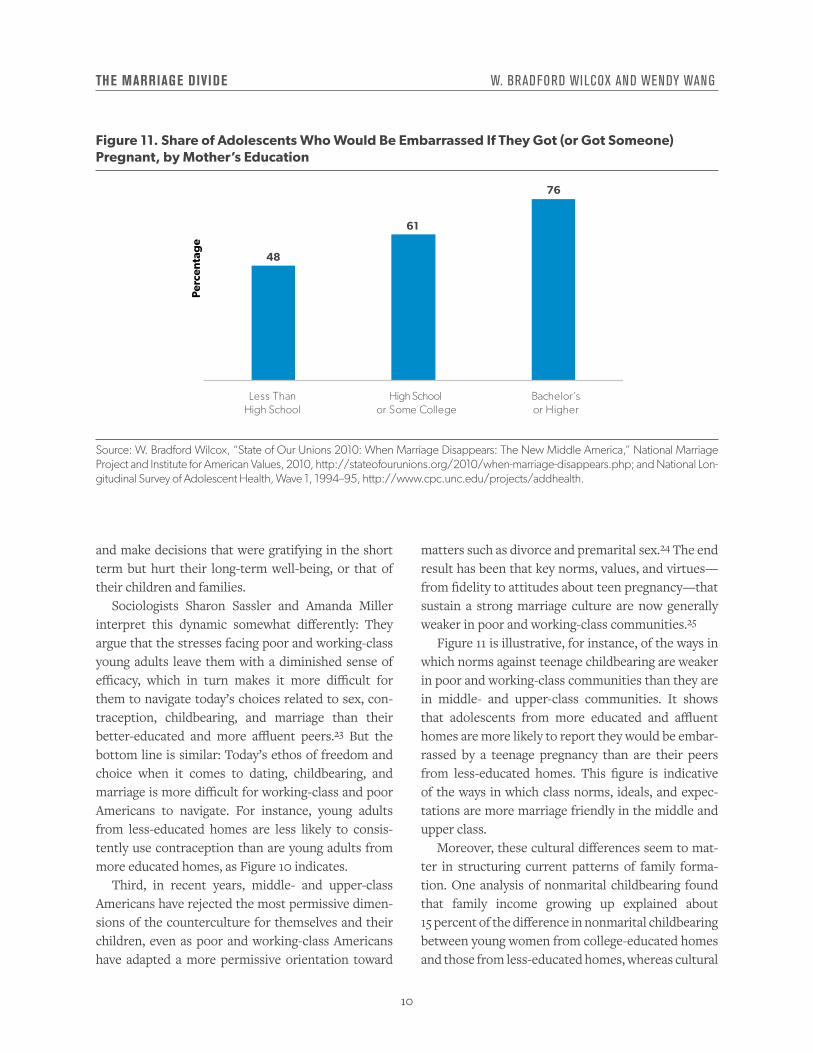
Figure 11 is illustrative, for instance, of the ways in which norms against teenage childbearing are weaker in poor and working-class communities than they are in middle- and upper-class communities. It shows that adolescents from more educated and affluent homes are more likely to report they would be embar-rassed by a teenage pregnancy than are their peers from less-educated homes. This figure is indicative of the ways in which class norms, ideals, and expec-tations are more marriage friendly in the middle and upper class.
Moreover, these cultural differences seem to mat-ter in structuring current patterns of family forma-tion. One analysis of nonmarital childbearing found that family income growing up explained about 15 percent of the difference in nonmarital childbearing between young women from college-educated homes and those from less-educated homes, whereas cultural
Figure 11. Share of Adolescents Who Would Be Embarrassed If They Got (or Got Someone) Pregnant, by Mother’s Education
Source: W. Bradford Wilcox, “State of Our Unions 2010: When Marriage Disappears: The New Middle America,” National Marriage Project and Institute for American Values, 2010, http://stateofourunions.org/2010/when-marriage-disappears.php; and National Lon-gitudinal Survey of Adolescent Health, Wave 1, 1994–95, http://www.cpc.unc.edu/projects/addhealth.
48
61
76
Less ThanHigh School
High School or Some College
Bachelor’sor Higher
Perc
enta
ge
11
THE MARRIAGE DIVIDE W. BRADFORD WILCOX AND WENDY WANG
factors—for example, an adolescent woman’s orienta-tion toward college, her history of sexual activity, and her attitudes to single parenthood—accounted for about 20 percent of the class difference in nonmarital childbearing.26 At least for this family outcome, then, economics and culture both appear to be important in explaining the class divide in nonmarital childbearing. Moreover, these economic and cultural dynamics rein-force one another in different, class-based social net-works among today’s young adults.
Starting in the 1960s, the policy context also changed in ways that have undercut marriage and stable fam-ily life, especially in poor and working-class com-munities. Authorizing no-fault divorce, eliminating man-in-the-house rules, and passing more generous welfare programs in the 1960s and 1970s all weakened the legal and economic importance of marriage and two-parent families.27 Poor and working-class fami-lies were and continue today to be affected more by these changes because they have more contact with the state for material support and assistance. Now, because many means-tested programs have expanded, more than 40 percent of families with children receive
support from at least one transfer program—such as Medicaid, food stamps, and Pell Grants; many of these programs penalize marriage.28
Such penalties may currently play a modest role in discouraging marriage among poor and working-class couples.29 In fact, one national survey found that 31 percent of Americans say they personally know someone who chose not to marry for fear of losing a means-tested benefit.30 More broadly, shifts in family law and the expansion of the welfare state since the 1960s seem to have played a modest role in undercut-ting marriage among the poor starting in the late 1960s. In more recent decades, public policies may now be undercutting marriage among working-class families, insofar as marriage penalties related to programs such as Medicaid and food stamps are now more likely to affect working-class families than poor families.31
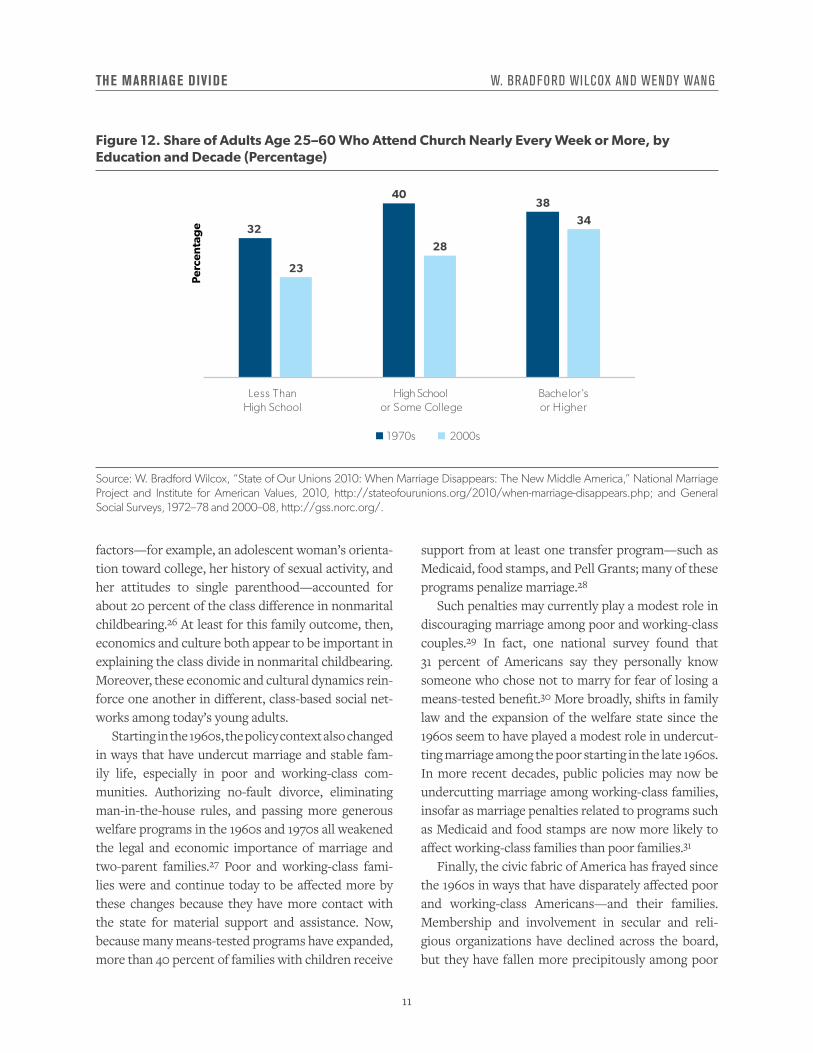
Finally, the civic fabric of America has frayed since the 1960s in ways that have disparately affected poor and working-class Americans—and their families. Membership and involvement in secular and reli-gious organizations have declined across the board, but they have fallen more precipitously among poor
Figure 12. Share of Adults Age 25–60 Who Attend Church Nearly Every Week or More, by Education and Decade (Percentage)
Source: W. Bradford Wilcox, “State of Our Unions 2010: When Marriage Disappears: The New Middle America,” National Marriage Project and Institute for American Values, 2010, http://stateofourunions.org/2010/when-marriage-disappears.php; and General Social Surveys, 1972–78 and 2000–08, http://gss.norc.org/.
32
40 38
23
28
34
Less ThanHigh School
High School or Some College
Bachelor’sor Higher
1970s 2000s
Perc
enta
ge
12
THE MARRIAGE DIVIDE W. BRADFORD WILCOX AND WENDY WANG
and working-class Americans.32 This matters because such organizations have tended to support families over the years. This is particularly true for religious institutions, which often offer psychic, social, and moral support to marriage and family life. Indeed, Americans who regularly attend religious service are more likely to marry, have children in wedlock, avoid divorce, and enjoy higher-quality relationships.33 Nev-ertheless, as Figure 12 indicates, religious attendance has fallen most among Americans with less education.
Moreover, many of these religious institutions have been less likely to clearly and regularly address issues related to marriage and family life since the 1970s. Because of demographic changes in the pews and changes in the broader culture and the churches, pastors, priests, and lay leaders have become more reluctant to address topics related to sex, marriage, divorce, and nonmarital childbearing.34 This means that all Americans, including working-class men and women, are less likely to receive direction and guid-ance about marriage and family life that might other-wise strengthen and stabilize their families.
In sum, the nation’s marriage divide is rooted in economic, cultural, policy, and civic changes that all undercut the normative, financial, and communal bases of strong and stable marriages and families in poor and working-class communities across America.
Conclusion
This Opportunity America–AEI–Brookings research brief documents major differences in marriage and family life between working-class and middle- and upper-class Americans. Moreover, the roots of the marriage divide between the middle and upper class and the working class in America are clearly varied. No single panacea will bridge this divide. Policymak-ers, business leaders, and educators need to pursue a range of educational and work-related policies to shore up the economic foundations of working-class and poor families. They also need to eliminate or min-imize the marriage penalties embedded in many of our means-tested policies. And the country’s secular and religious civic leaders should do more to engage
and involve working-class and poor Americans—especially poor and working-class men who tend to have the weakest ties to our civic institutions.
Finally, leaders need to pursue a strategy to extend norms around marriage and childbearing—which remain strong among the middle and upper class—to working-class and poor women and men. The alter-native to taking steps like these is to accept a world where middle- and upper-class Americans benefit from strong, stable families while everyone else faces increas-ingly fragile families, and where high rates of economic inequality and child poverty are locked in by a marriage divide that puts working-class and poor Americans—and their children—at a stark disadvantage.
About the Authors
W. Bradford Wilcox is a visiting scholar at the American Enterprise Institute, a senior fellow at the Institute for Family Studies, and the director of the National Marriage Project at the University of Vir-ginia. Wilcox has published widely on marriage, cohabitation, fatherhood, and the welfare of children.
Wendy Wang is director of research at the Institute for Family Studies. She is a former senior researcher at Pew Research Center, where she conducted research on marriage, gender, work, and family life in the United States. She was the lead author of the Pew Research Center report, “Breadwinner Moms,” among other Pew reports.
Acknowledgments
We would like to thank Tanner Eastmond, Samuel Sturgeon, and Jeremy Uecker for their research assis-tance. Thanks also go to Tamar Jacoby and Robert Doar for their substantive feedback and to Nicole Noyes for guiding the editorial process. Finally, Rachel Jelinek edited the brief.
This report was commissioned by the Opportunity America–AEI–Brookings working class group.
13
THE MARRIAGE DIVIDE W. BRADFORD WILCOX AND WENDY WANG
Appendix
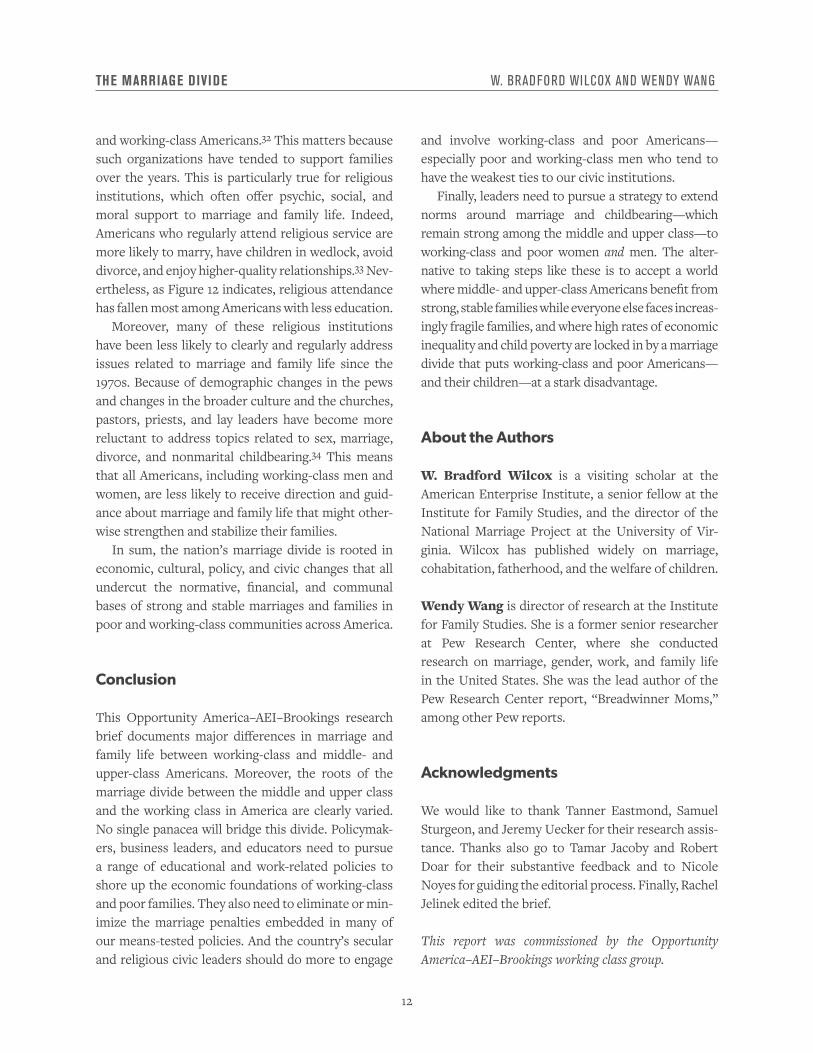
Figure A1. Percentage Married, 25–55-Year-Olds, by Education and Year
Source: US Census, 1970, 1990, and 2010; and American Community Survey, 2015, https://www.census.gov/programs-surveys/acs/.
Figure A2. Percentage of Births to Never-Married Women 15–44-Years-Old, by Education and Year
Source: W. Bradford Wilcox, “State of Our Unions 2010: When Marriage Disappears: The New Middle America,” National Marriage Project and Institute for American Values, 2010, http://stateofourunions.org/2010/when-marriage-disappears.php.
82 83 82
61
68 69
Perc
enta
ge
1970 1990 2010 2015
High School Dropouts High School/Some College College +
4955
65
48 51
63
Least Educated Moderately Educated Highly Educated
1982 2006–08
33
54
13
44
2
6
Perc
enta
ge
14
THE MARRIAGE DIVIDE W. BRADFORD WILCOX AND WENDY WANG
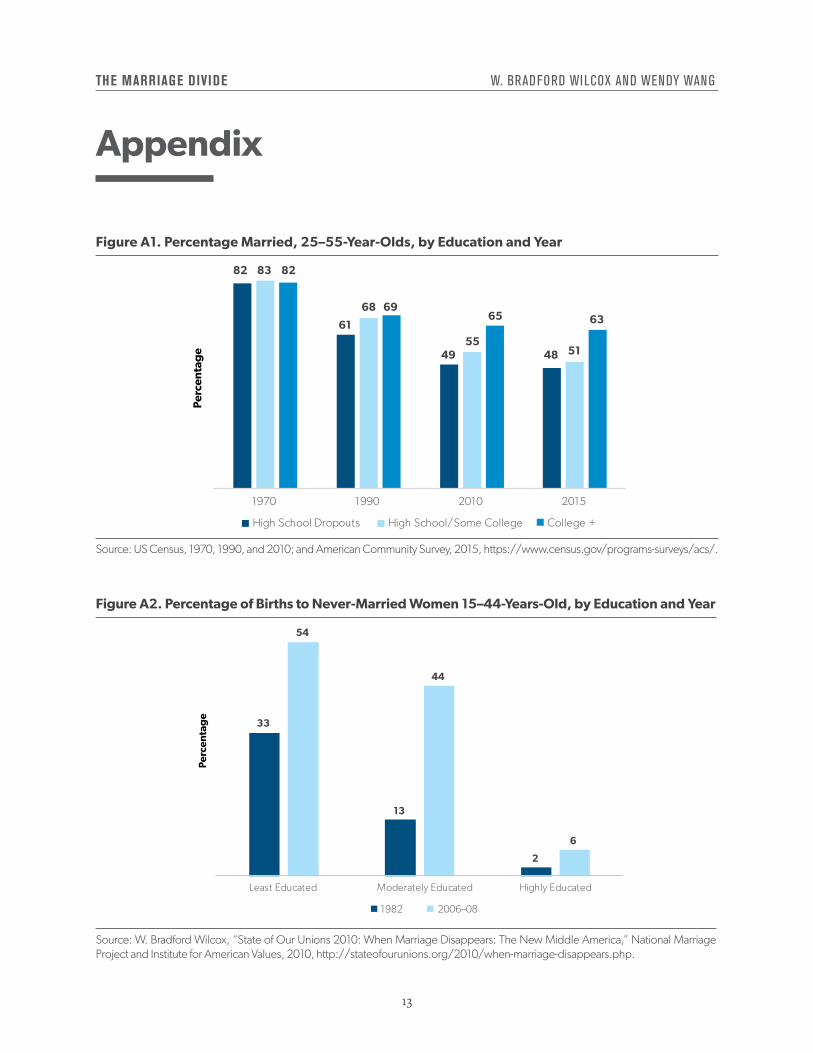
Figure A3. Women’s Total Fertility Rate, by Education, Socioeconomic Status, and Decade
Note: Based on fertility rate of women age 15–44 in 2013–15. “Total Fertility Rate” refers to the number of children a woman can expect to have during her reproductive years. Socioeconomic status measures did not adjust by family size.Source: National Survey of Family Growth, 1988 and 2013–15, https://www.cdc.gov/nchs/nsfg/index.htm.
Overall LTHS HS/SC College Low Medium HighMother’s Education Socioeconomic Status
1988 2013–15
1.881.99
2.34
2.62
1.98
1.82
1.471.59
2.15
2.42
2.07
1.82
1.41
1.74
Figure A4. 14-Year-Old Girls Living with Biological Parents, by Mother’s Education and Decade
Source: National Survey of Family Growth, 1982 and 2013–15, https://www.cdc.gov/nchs/nsfg/index.htm.
Overall Mother LessThan High School
Mother High Schoolor Some College
Mother Bachelor’s or More
1982 2013–15
71
61 63
55
73
55
79 77
Perc
enta
ge
15
THE MARRIAGE DIVIDE W. BRADFORD WILCOX AND WENDY WANG
Figure A5. Share of Native-Born Adults Age 18–55 Who Are Currently Married, by Class
Source: American Community Survey, 2015, https://www.census.gov/programs-surveys/acs/.
18
35
54
Poor Working Class Middle and Upper Class
Perc
enta
ge
Figure A6. Share of Native-Born Adults Age 18–55 Who Are Currently Cohabitating, by Class
Source: American Community Survey, 2015, https://www.census.gov/programs-surveys/acs/.
14
10
5
Poor Working Class Middle and Upper Class
Perc
enta
ge
16
THE MARRIAGE DIVIDE W. BRADFORD WILCOX AND WENDY WANG
Figure A7. Share of Native-Born Children Born Out of Wedlock, by Mother’s Class
Note: Based on children less than 1 year old living with at least one parent. Parents are age 18–55. In 97 percent of these households, a mother is present. In households where the mother is not present, the father’s class is used for the tabulation.Source: American Community Survey, 2015, https://www.census.gov/programs-surveys/acs/.
72
38
13
Poor Working Class Middle and Upper Class
Perc
enta
ge
Figure A8. Share of Native-Born Adults Age 18–55 Who Have Ever Been Divorced, by Class
Note: Based on adults who have ever been married.Source: American Community Survey, 2015, https://www.census.gov/programs-surveys/acs/.
58
45
32
Poor Working Class Middle and Upper Class
Perc
enta
ge
17
THE MARRIAGE DIVIDE W. BRADFORD WILCOX AND WENDY WANG
Figure A9. Share of Native-Born Spouses Age 18–55 Who Are “Very Happy” in Marriage by Class
Source: General Social Survey, 2000–16, http://gss.norc.org/.
54 56
65
Poor Working Class Middle and Upper Class
Perc
enta
ge
Figure A10. A Breakdown of Married Adults Age 18–55 by Nativity
Source: American Community Survey, 2015, https://www.census.gov/programs-surveys/acs/.
4729
21
5371
79
Poor Working Class Middle and Upper Class
Native-Born
Foreign-Born
Perc
enta
ge
18
THE MARRIAGE DIVIDE W. BRADFORD WILCOX AND WENDY WANG
Notes
1. David Autor and Melanie Wasserman, “Wayward Sons: The Emerging Gender Gap in Education and Labor Markets,” Third Way, 2013, https://economics.mit.edu/files/8754; Kathryn Edin and Maria Kefalas, Promises I Can Keep: Why Poor Women Put Motherhood Before Marriage (Berkeley, CA: University of California Press, 2011); Sara McLanahan, “Diverging Destinies: How Children Are Faring Under the Second Demographic Transition,” Demography 41 (2004): 607–27, https://www.jstor.org/stable/1515222?seq=1#page_scan_tab_contents; and W. Bradford Wilcox, “State of Our Unions 2010: When Marriage Disappears: The New Middle America,” National Marriage Project and Institute for American Values, 2010, http://nationalmarriageproject.org/wp-content/uploads/2012/06/Union_ 11_12_10.pdf. 2. David Ellwood and Christopher Jencks, “The Spread of Single-Parent Families in the United States Since 1960,” in Future of the Family, ed. Daniel Patrick Moynihan, Timothy Smeeding, and Lee Rainwater (New York: Russell Sage Foundation, 2006). 3. Ibid; and Wilcox, “State of Our Unions 2010.” 4. Wilcox, “State of Our Unions 2010.” 5. Because of data limitations, Figure 6 is based only on maternal education, not family income. 6. Autor and Wasserman, “Wayward Sons”; Sara McLanahan and Gary Sandefur, Growing Up with a Single Parent: What Hurts, What Helps (Cambridge: Harvard University Press, 1994); and Sara McLanahan and Isabel Sawhill, “Marriage and Child Wellbeing Revisited: Introducing the Issue,” Future of Children 25, no. 2 (2015): 3–9, https://www.jstor.org/stable/43581969?seq=1#page_scan_ tab_contents. 7. Wendy Wang and W. Bradford Wilcox, “The Millennial Success Sequence: Marriage, Kids, and the ‘Success Sequence’ Among Young Adults,” American Enterprise Institute and Institute for Family Studies, 2017, http://www.aei.org/publication/millennials- and-the-success-sequence-how-do-education-work-and-marriage-affect-poverty-and-financial-success-among-millennials/. 8. McLanahan and Sawhill, “Marriage and Child Wellbeing Revisited”; and W. Bradford Wilcox et al., Why Marriage Matters: 30 Conclusions from the Social Sciences (New York: Institute for American Values and National Marriage Project, 2011). 9. Susan L. Brown, “Marriage and Child Well-Being: Research and Policy Perspectives,” Journal of Marriage and Family 72 (2010): 1059–77, https://www.ncbi.nlm.nih.gov/pmc/articles/PMC3091824/; Christine M. Proulx, Heather Helms, and Cheryl Buehler, “Marital Quality and Personal Well-Being: A Meta-Analysis,” Journal of Marriage and Family Life 69 (2007): 576–93, http://onlinelibrary.wiley.com/doi/10.1111/j.1741-3737.2007.00393.x/abstract; and Wilcox et al., Why Marriage Matters. 10. McLanahan, “Diverging Destinies.” 11. Isabel Sawhill, “The Economics of Marriage, and Family Breakdown,” Brookings Institution, 2014, https://www.brookings.edu/opinions/the-economics-of-marriage-and-family-breakdown/. 12. Ellwood and Jencks, “The Spread of Single-Parent Families in the United States Since 1960”; and Wilcox, “State of Our Unions 2010.” 13. Andrew J. Cherlin, The Marriage-Go-Round: The State of Marriage and the Family in America Today (New York: Vintage, 2009); and William Julius Wilson, The Truly Disadvantaged: The Inner City, the Underclass, and Public Policy (Chicago: University of Chicago Press, 1987). 14. Figure 9 through Figure 12 are based on education alone; they do not incorporate data regarding household income. 15. Autor and Wasserman, “Wayward Sons.” 16. Daniel Lichter, Diane K. McLaughlin, and David C. Ribar, “Economic Restructuring and the Retreat from Marriage,” Social Science Research 31 (2002): 230–56, http://www.sciencedirect.com/science/article/pii/S0049089X01907288. 17. Ibid. 18. Andrew J. Cherlin, Labor’s Love Lost: The Rise and Fall of Working-Class Family in America (New York: Russell Sage Foundation, 2014).
19
THE MARRIAGE DIVIDE W. BRADFORD WILCOX AND WENDY WANG
19. Cherlin, The Marriage-Go-Round. 20. W. Bradford Wilcox, Nicholas Wolfinger, and Charles Stokes, “One Nation, Divided: Culture, Civic Institutions, and the Marriage Divide,” Future of Children 25 (2015): 111–27, https://www.princeton.edu/futureofchildren/publications/docs/marriagedivide.pdf. 21. Scott J. South and Glenna Spitze, “Determinants of Divorce over the Marital Life Course,” American Sociological Review 51 (1986): 583–90, https://www.jstor.org/stable/2095590?seq=1#page_scan_tab_contents. 22. Amy Wax, “Diverging Family Structure and ‘Rational’ Behavior: The Decline in Marriage as a Disorder of Choice,” in Research Handbook on the Economics of Family Law, ed. Lloyd R. Cohen and Joshua D. Wright (Cheltenham, UK: Edward Elgar, 2011), 15–71. 23. Sharon Sassler and Amanda Miller, Cohabitation Nation: Gender, Class, and the Remaking of Relationships (Oakland: University of California Press, 2017). 24. Wilcox, “State of Our Unions 2010.” 25. Ibid. 26. Wilcox, Wolfinger, and Stokes, “One Nation, Divided.” 27. Ibid. 28. W. Bradford Wilcox, Joseph P. Price, and Angela Rachidi, “Marriage, Penalized: Does Social-Welfare Policy Affect Family Forma-tion?,” American Enterprise Institute and Institute for Family Studies, 2016, http://www.aei.org/publication/marriage-penalized-does- social-welfare-policy-affect-family-formation/. 29. Douglas Besharov and Neil Gilbert, “Marriage Penalties in the Modern Welfare State,” R Street Institute, 2015, http://www.rstreet.org/policy-study/marriage-penalties-in-the-modern-social-welfare-state/; and Wilcox, Price, and Rachidi, “Marriage, Penalized.” 30. Wilcox, Price, and Rachidi, “Marriage, Penalized.” 31. Ibid. 32. Robert D. Putnam, Our Kids: The American Dream in Crisis (New York: Simon and Schuster, 2015); and Wilcox, “State of Our Unions 2010.” 33. W. Bradford Wilcox and Nicholas Wolfinger, Soul Mates: Religion, Sex, Love, and Marriage Among African Americans and Latinos (New York: Oxford University Press, 2016). 34. W. Bradford Wilcox, Soft Patriarchs, New Men: How Christianity Shapes Fathers and Husbands (Chicago: University of Chicago Press, 2004); Wilcox and Wolfinger, Soul Mates.
© 2017 by the American Enterprise Institute. All rights reserved.
The American Enterprise Institute (AEI) is a nonpartisan, nonprofit, 501(c)(3) educational organization and does not take institutional positions on any issues. The views expressed here are those of the author(s).