Embed Size (px)
Citation preview

Alastair Wilson
Senior Researcher
The Marinas and Moorings Market in the UKSummer 2017

ContentsIntroduction
• Contents page 2-3
• Methodology page 4
• Glossary page 5
The UK Marina Industry• Topline Market Analysis page 7
• UK Marina & Moorings Operations: Facts & Figures page 8
Economic Overview: the UK Marine Industry• UK GDP & Marine Industry Revenue Trends page 10
• Marine Industry, Revenue, Profit & Operating Costs page 11
• UK & Marine Industry Business Confidence Trends page 12
• UK Consumer Confidence Trends page 13
• UK Consumer Price Inflation & Leisure Spending Trends page 14
The Inland Marina & Moorings Sector• Inland Marinas & Moorings Sector Market Analysis page 16
• Inland Marinas & Moorings Sector Structure page 17
• Inland Marina & Moorings Operations: Facts & Figures page 18
• Inland Marina & Moorings Sector Revenue Trends page 19
• Inland Marina & Moorings Sector Revenue, Profit & Operating Costs page 20
• Inland Marina & Moorings Sector Business Confidence Trends page 21
• Inland Marina & Moorings Sector Workforce Growth page 22
• Inland Marina & Moorings Sector Capital Expenditures & Other Investments page 23
• Inland Marina & Moorings Sector Pricing Trends and Retail Price Inflation page 24
• Inland Marina & Moorings Sector Market Commentary page 25
• Inland Marina & Moorings Sector Social Impact page 26 2

Contents (continued)
The Coastal Marina & Moorings Sector• Coastal Marinas & Moorings Market Analysis page 28
• Coastal Marina & Moorings Sector Structure page 29
• Coastal Marina & Moorings Operations: Facts & Figures page 30
• Coastal Marina & Moorings Sector Revenue Trends page 31
• Coastal Marina & Moorings Sector Revenue, Profit & Operating Costs page 32
• Coastal Marina & Moorings Sector Business Confidence Trends page 33
• Coastal Marina & Moorings Sector Workforce Growth page 34
• Coastal Marina & Moorings Sector Capital Expenditures & Other Investments page 35
• Coastal Marina & Moorings Sector Pricing Trends and Retail Price Inflation page 36
• Coastal Marina & Moorings Sector Market Commentary page 37
• Coastal Marina & Moorings Sector Social Impact page 38
Boat Ownership, Participation & Marina Occupancy in the UK• UK Boating & Watersports Participation page 40
• Coastal Marine Traffic page 41
• Inland Marine Traffic page 42
• Marina & Berth Distribution page 43
• Occupancy Rates & Moorings Demand page 44
• New Marina Developments in the UK page 45
3

Methodology
This report details a wide range of economic indicators for the UK‘s marinas and moorings sector, including data on: revenue growth; valued added contribution; full-time equivalent employment; capital investments; pricing trends; business and consumer confidence; inflation and household leisure spending; boat ownership and participation; berth and moorings capacity and occupancy; and data on future marina planning developments.
The data model that informs this analysis is based on three main sources. The first is derived from primary financial data received from British Marine members’ ‘Turnover Declaration Forms’ for their last annual business performance, submitted as part of their membership renewal. The second source is a business trends survey that has been tracking marine companies and their trading prospects since 2008. The third and final part, is drawn from primary data collected through surveys of British Marine’s marina members, collecting data on marina capacity, occupancy and other metrics unique to the sector. The data in these surveys is benchmarked against official Government economic and social statistics, and complemented by the findings of British Marine’s additional research into boating ownership, participation and activity trends.
This marina and moorings sector report is published to enhance knowledge of the sector, identify key trends over time and provide key capacity and occupancy information for marina operators. It is only possible to complete this research reliably through the time dedicated by British Marine members in engaging with British Marine’s market research team, for which thanks is extended. All data is held in complete confidence.
4

5
Glossary
Gross Value Added (GVA) Measures the contribution to an economy of a producer (company), sector, industry or region. Gross Value Added quantifies the value of goods and services produced, less the cost of all inputs and raw materials that are directly attributable to that production.
Capacity The number of boat storage spaces advertised.
Occupancy Rate The percentage of boat storage spaces that are occupied out of all boat storage spaces that are advertised.
Berth A fixed bay or other space where vessels can park, with direct access to land. Berths usually consist of a floating pontoon or fixed dock and are sheltered offline in a marina or harbour basin.
Mooring An anchorage on the water that is inaccessible by land and requires transfer by boat. Moorings usually consist of a single anchor at the bottom of a waterway with a line running to a buoy on the surface.
Dry Stack Storage of vessels on land stacked on racks in purpose-built warehouses similar in style to a multi-story car park.
Hard Standing Storage of vessels on land upon metal cradles or ‘stands’ to prevent corrosion during the winter and allow forthe vessel to undergo refit and repair during the ‘off’ season.

The UK Marina Industry
6

Topline Market AnalysisBritish Marine’s latest economic research indicates that over the last financial year, the marina sector enjoyed its fifth consecutive year of growth. In 2016, direct revenues from marinas, moorings and associated activities grew by 0.3%, rising to £222m, directly contributing over £100m of Gross Value Added to the UK economy, while directly supporting nearly 3,000 Full-Time Equivalent employees.
Business sentiment from British Marine business surveys shows that the sector was experiencing a slightly depressed trading environment prior to the EU referendum. The ‘Leave’ vote in June had an immediate impact on marine businesses, with the majority of marine enterprises reporting a negative outlook for the coming 6 months. Business outlook among marinas has since been buoyed by the devaluation of sterling, encouraging an increase in overseas sailors, tourists and other marina customers. Berth occupancy has reached its highest levels since 2013 (88.3%), while business confidence is high (+58%), with members reporting positive performance across many major marina trades.
However, this positive sentiment is also tinged by concern. Marinas continue to struggle to retain customers with an ageing market that finds it increasingly difficult to justify the rising costs associated with marina berthing, particularly in an environment of rising costs and economic and political uncertainty. In some quarters, the low valuation of sterling is a particular concern since it threatens a boat drain in the UK as European sailors capitalize on beneficial exchange rates, further threatening marina occupancy in the UK. With this ageing market not being replenished with new, younger boat owners, the biggest challenge for operators is encouraging uptake while adapting to changes in customer behavior, as berth holders downsize in boat and berth sizes.
As a result, operators are seeking more innovative ways to encourage engagement with boat ownership, through ‘shared’ ownership schemes and flexibility in the services that are offered to boaters. In the inland sector this is characterized by a greater movement into residential berths, while in coastal markets the emphasis has been on the growth in dry stack storage and facilities for smaller boats. And across both markets we have seen the development of marina hubs as all-encompassing leisure and tourism facilities. And as their boating markets continue to narrow as older boat owners withdraw from ownership and participation, this movement towards diversification among marinas is likely to accelerate.
Workforce % Growth
-0.3%
Business Confidence i
+/- Increase
+33%
2,816
+58%
i This figure is taken from British Marine’s Industry Trends and Marina Market surveys and represents the net balance score or the difference between members reporting a positive and negative response to questions about their business’s future prospects over the next 6 months. ii Marina “occupancy rate" refers to the percentage of boat storage spaces that are occupied out of all boat storage spaces that are advertised (“capacity”). iii Yield per berth refers to the average revenue generated by each marina berth or mooring. 7
£222mRevenue % Growth
+0.3%
£104mGross Value Added % Growth
+0.3%
+3.9%
88.3%Occupancy Rate % Growth ii
+0.3%£2,345
Yield/Berth % Growth iii

8
UK Marina & Moorings Operations: Facts & Figures
10.25…the average trips taken by each
berth holder annually
54.3%…% of marina berth holders
who regularly participate
£24,130…the average salary of
a marina manager
…the average FTE jobs supported by a marina
7.16
45%
33%
18% 4%
UK Marinas by Business Size
Micro (£0 to £199,999)
Small (£200,000 to £999,999)
Medium (£1,000,000 to £6,000,000)
Large (£6,000,000+)
…the average revenue generated by a marina
£548,380
…the average tax contribution of a marina
£164,690
…the average GVAcreated by a marina
£195,490…the average occupancy
of a 175 berth marina
89.3%
…the average number of berths per marina
179
£32.29…the average amount spent by each
berth holder on a boating trip
11%
14%
43%
32%
UK Marinas by Berths
Over 400 berths
251 to 400 berths
100 to 250 berths
Less than 100 berths
Economic Overview:The UK Marine Industry
9

UK GDP & Marine Industry Revenue Trends
10
-5.0
-2.5
0.0
2.5
5.0
An
nu
al E
con
om
ic G
row
th (
%)
UK GDP
Marine Industry Revenue
The total revenue of the leisure marine, superyacht and small commercial marine industry was £3.013 billion in 2015/16 (+1.6% on 2014/15 and +2.6% on 2013/14). Industry growth is expected to slow in 2017 as economic volatility increases closer to and during negotiations over the UK’s exit from the European Union. The industry should avoid contraction, however, with currency depreciation supporting boat and equipment exports and inbound and domestic tourism activity.
Source: British Marine internal economic data; Office for National Statistics, GDP estimates; Bank of England GDP forecasts

Marine Industry Revenue, Profit & Operating Costs (Business Sentiment)
11
The chart above shows that prior to the EU referendum, industry turnover and profit growth was already perceived to be contracting. This sentiment dropped sharply following the vote to leave the EU with the slide in business and consumer confidence that followed the referendum. By the end of 2016, this had recovered somewhat, with the weakening of a strong pound providing needed support to trade. However, marine businesses see this as a short-term benefit, with inflation expected to rise to 2.7% by the end of 2017, having already produced an increase in operating costs at the end of 2016. With these rising costs, recent political uncertainty following the 2017 General Election, as well as the uncertainty of Brexit negotiations, industry growth is expected to slow over the next 12 months.
0
20
40
60
80
100
-20
0
20
40
60
80
100
Op
erat
ing
Co
sts
Sen
tim
ent
Ne
t B
alan
ce S
core
(%
)
Re
ven
ue
and
Pro
fit
Sen
tim
ent
Ne
t B
alan
ce S
core
(%
)*
Operating Costs
Turnover
Profit
*The net balance reflects the difference between members reporting a positive and negative response to questions about their financial performance
Source: British Marine Industry Trends Survey

UK & Marine Industry Business Confidence Trends
12
EU Referendum:Marine Confidence: -7UK Confidence (ICAEW): -10UK Confidence (CBI): -44
Source: British Marine Industry Trends Surveys; ICAEW Business Confidence Monitor; CBI SME Quarterly Trends Survey
*The net balance reflects the difference between members reporting a positive and negative response to questions about their business prospects
As with the wider economy, marine business confidence fell heavily following the vote to leave the European Union, echoing the results posted in business sentiment surveys by Markit, ICAEW and CBI. In particular, CBI’s research reveals that while SMEs expect exports to rise with the depreciation in sterling, the majority feel less optimistic about business overall. While this similarly applies for the marine industry, many marine businesses have seen a windfall to exports and tourism business since July with the depreciation of sterling and, as a result, we see a small uplift in confidence for the near term. However, with recent political uncertainty, there is a drop in optimism heading into the summer.
-60
-40
-20
0
20
40
60
80
100
Bu
sin
ess
Co
nfi
den
ce In
dex
Sco
re
(Ne
t B
alan
ce S
core
%)
Marine Business Confidence
UK Business Confidence (ICAEW)

UK Consumer Confidence Trends
13
While the outlook among British consumers sank following the vote to leave the European Union (declining by -0.9% in Q2-3 2016), there has been a stuttering recovery since then, with confidence growing by +0.2% between July 2016 and January 2017. Fears over Brexit dampened towards the end of 2016 with UK macro-economic data remaining strong throughout this period. However, instability and uncertainty has returned in 2017. With the recent General Election result muddying the mandate for upcoming Brexit negotiations, consumer confidence has returned to the same level as July 2016. With domestic political infighting probable, and the upcoming UK-EU negotiations expected to cause further uncertainty, consumer confidence is likely to fall further in the coming months.
Source: OECD, Consumer Confidence Index
93
94
95
96
97
98
99
100
101
102
103
UK
Co
nsu
mer
Co
nfi
den
ce In
dex
Sco
re
(Lo
ng
Term
Ave
rage
= 1
00
)

Consumer Price Inflation & Leisure Spending Trends
14
Inflation has risen steadily since the vote to leave the EU, climbing to +2.1% by the end of Q1 2017. The cost of goods and services is forecast to rise sharply by the end of 2017, with inflation anticipated to reach +2.7% according to the latest Bank of England analysis. These price climbs are primarily due to a rise in the cost of imported fuel and foodstuffs. As a result of these rising living costs, household leisure spending is also forecast to contract as increased living costs eat into discretionary spending.
Source: Office for National Statistics, Household Spending; Office for National Statistics, Consumer Price Index
£1,000
£1,200
£1,400
£1,600
£1,800
£2,000
£2,200
£2,400
0.0
0.5
1.0
1.5
2.0
2.5
3.0
3.5
4.0
4.5
5.0
Ho
use
ho
ld S
pen
din
g, R
ecre
atio
n &
Sp
ort
(£
m)
Co
nsu
mer
Pri
ce In
flat
ion
(%
Ch
ange
ove
r 1
2 m
on
ths)
Consumer Price Inflation (% Change)
Household Spending, Recreation & Sport (£m)

The Inland Marinas & Moorings Sector
15

Inland Marinas & Moorings Sector Market Analysis
British Marine’s latest economic research indicates that over the last financial year, the inland marina sector generated revenues of over £70m, rising by 3.6% on the previous year’s turnover, whilst directly contributing £30m in Gross Value Added to the UK economy, and supporting nearly 1,000 Full-Time Equivalent employees.
Business sentiment from British Marine business surveys shows that while experiencing a slight dip in confidence following the EU referendum in June 2016, the outlook for business has recovered swiftly and now sits at its highest level (+64%) since 2014. The ‘Leave’ vote in June had an immediate impact on marine businesses, with the majority of marine enterprises reporting a negative outlook for the coming 6 months. However, business outlook in the inland boating sector has benefitted from a weakening of sterling and an increase in both domestic and overseas tourists and boaters. Berth occupancy has now reached its highest levels since 2013 (88.7%), with inland marina operators reporting positive performance across many major marina trades.
However, this positive sentiment is also tinged by concern. Marinas continue to struggle to retain customers with an ageing market that finds it increasingly difficult to justify the rising costs associated with marina berthing, particularly in an environment of rising costs and economic and political uncertainty. And on the inland waterways, with licensed boats only growing by +0.1% i (or less than 200 boats), and proposed and planned new moorings facilities outstripping demand, competition for berthing among marinas is only going to intensify as operators eat into each others’ customer base.
With this ageing market not being replenished with new, younger boat owners, the biggest challenge for operators is encouraging uptake while adapting to changes in customer behavior. As a result, inland marinas are seeking more innovative ways to encourage engagement with boat ownership, through ‘shared’ ownership schemes and flexibility in the services that are offered to boaters in the marina. In the inland sector this is characterized by a greater movement into residential moorings to attract a new kind of customer and the development of marina hubs as all-encompassing leisure and tourism facilities in order to diversify in a challenging trading environment.
Workforce % Growth
+0.2%
Business Confidence ii
+/- Increase
+29%
975
+64%
i This figure is taken from the Canal & River Trust’s annual accounts for 2015/16, available online here.ii This figure is taken from British Marine’s Industry Trends and Marina Market surveys and represents the net balance score or the difference between members reporting a positive and negative response to questions about their business’s future prospects over the next 6 months. iii Marina “occupancy rate" refers to the percentage of boat storage spaces that are occupied out of all boat storage spaces that are advertised (“capacity”). iv Yield per berth refers to the average revenue generated by each marina berth or mooring.
16
£70mRevenue % Growth
+3.6%
£30mGross Value Added % Growth
+3.6%
+4.8%
88.7%Occupancy Rate % Growth iii
+3.6%£2,031
Yield/Berth % Growth iv

UK Inland Marinas, Berths & Economic Impact by Region
17
RegionNo. of
MarinasNo. of Berths/
MooringsAverage Berths/
Moorings per MarinaUK Employees
(FTE)Revenue
(£ million)
South West 12 1,787 149 62 £3.43
South East 52 6,862 132 209 £17.78
East of England 47 5,218 111 164 £7.87
East Midlands 45 7,284 162 180 £16.98
West Midlands 43 5,440 127 129 £7.17
North West 34 4,786 141 101 £7.46
North East - - - - -
Yorkshire 19 1,963 103 48 £2.45
London 2 338 169 18 £2.10
Wales 2 182 91 9 £0.72
Scotland 7 612 87 41 £3.50
Northern Ireland 3 188 63 14 £0.93
Channel Islands - - - - -
Total 266 34,660 130 975 £70.40
Structure of the Marina & Moorings Sector

2%
7%
43%
31%
Inland Marinas by Berths
Over 400 berths
251 to 400 berths
100 to 250 berths
Less than 100 berths
18
Inland Marina & Moorings Operations: Facts & Figures
6.0…the average trips taken by
berth holders annually
64%…% of marina berth holders
who regularly participate
£24,750…the average salary of an
inland marina manager
…the average FTE jobs supported by an inland marina
3.7
63%
33%
3%
1%
Inland Marina Operators by Business Size
Micro (£0 to £199,999)
Small (£200,000 to £999,999)
Medium (£1,000,000 to £6,000,000)
Large (£6,000,000+)
…the average revenue generated by an inland marina
£264,662
…the average tax contribution of an inland marina
£75,966
…the average GVAcreated by an inland marina
£112,331…the average occupancy
of a 130 berth marina
88.7%
…the average number of berths per marina
130
£36.53…the average amount spent on expenses
by each berth holder on a boating trip

Inland Marinas: Revenue Trends (Actual)
19
The total revenue of the inland marina and moorings sector increased to £70.4 million in 2015/16 (+3.6% on 2014/15 and +3.4% on 2013/14). Inland marinas and moorings revenue has grown gradually since the recession and is now hitting a new peak. With a weak pound promoting increased inland tourism and sustained interest in inland boating thanks to a growth in media exposure, this trend should continue in 2017. The greatest influence on the health of the sector remains the UK’s economic and political stability during the negotiations to leave the European Union, and the affect this will have on consumer optimism over the next 12 months.
Source: British Marine internal economic data
£70mInland Marinas & Moorings
Revenue, 2015/16
£0.00
£20.00
£40.00
£60.00
£80.00
£100.00
Inla
nd
Mar
inas
Rev
enu
e (£
m)

Inland Marinas: Revenue, Profit & Operating Costs (Business Sentiment)
20
Revenue, profit and costs sentiment among inland marina businesses shows a slightly more nuanced picture. Prior to the EU referendum, turnover and profit was in fact climbing steadily, thanks in part to the increased interest in inland boating over the last 12 months. This sentiment, of course, dropped sharply following the vote to leave the EU. Opinion has stabilised somewhat since then with the recovery of confidence among customers. However, operating costs for marina operators have reason steadily over this period. With increases in inflation, business rates and other overheads eating into profit margins, costs are now approaching their pre-2014 highs. These costs are expected to continue to rise in line with inflation, as the pricing trend charts on page 24 indicates.
0
20
40
60
80
100
-60
-40
-20
0
20
40
60
80
100
Op
erat
ing
Co
sts
Sen
tim
ent
Ne
t B
alan
ce S
core
(%
)*
Rev
enu
e an
d P
rofi
t Se
nti
men
tN
et
Bal
ance
Sco
re (
%)*
Operating Costs
Revenue
Profit
*The net balance reflects the difference between members reporting a positive and negative response to questions about their financial performance
Source: British Marine Industry Trends Survey; British Marine Marina Market Survey

21
-40
-20
0
20
40
60
80
100
Bu
sin
ess
Co
nfi
den
ce In
dex
Sco
re
(Ne
t B
alan
ce S
core
%)*
Source: British Marine Industry Trends Survey; British Marine Marina Market Survey
*The net balance reflects the difference between members reporting a positive and negative response to questions about their business prospects
Inland Marinas: Business Confidence Trends
EU Referendum:Inland Marinas: +41
While the EU referendum in June had an immediate negative impact on business confidence, over the last 12 months it has also had a positive impact on certain sectors of the marine industry, including the UK’s marina sector. Inland hire boats and moorings have been comparatively cheaper for European tourists, while the rise in consumer confidence and spending has benefitted marinas as much as other tourism businesses, helping business confidence to rise to a new high.

Inland Marinas: Workforce Growth (Business Sentiment)
22
-40
-20
0
20
40
60
80
100
Wo
rkfo
rce
Gro
wth
Sen
tim
ent
(Ne
t B
alan
ce S
core
%)
47%…inland marinas increasing payroll costs, Jan-May 2017
Source: British Marine Industry Trends Survey; British Marine Marina Market Survey
*The net balance reflects the difference between members reporting a positive and negative response to questions about recruitment
Full-Time equivalent employment in the inland marina sector sits at approximately 975 employees (+0.2% on 2014/15), or an average of 3.7 Full-Time equivalent employees per inland marina. If we look at the trends in business hiring sentiment, we can see that after recruitment plummeted during the recession, it took until 2012/13 for inland marina businesses to start actively hiring again, which mirrors the slow post-recession increase in investments in other areas shown on page 23. After rising consistently since 2012, and spiking in 2015 with a bumper year for the inland boating sector, employee growth has now returned to 2014 levels. Hiring activity is expected to slow further over the next 12 months with rising costs, economic and political volatility and receding consumer confidence denting recruitment sentiment among inland marina employers.
975Full-Time Equivalent Jobs
Directly Supported by Inland Marinas

Inland Marinas: Investments (Business Sentiment)
23
Capital expenditures and other kinds of investment among inland marina businesses plummeted during the financial crisis, but recovered quickly, and have been on an upwards trend until 2015, when it improved substantially during a successful year for the inland boating sector. The EU referendum did little to affect sentiment, with investments only dipping slightly 12 months onfrom the ‘Leave’ vote.
-20
0
20
40
60
80
100
Cap
ital
Exp
end
itu
res
Gro
wth
(N
et
Bal
ance
Sco
re %
)
+22%Increase in investments in Environmental Protection
+7%Increase in investments in
Social Programmes
*The net balance reflects the difference between members reporting a positive and negative response to questions about their investments
Source: British Marine Industry Trends Survey; British Marine Marina Market Survey

Retail Price Inflation & Inland Marina Pricing Sentiment
24
Inland marina pricing sentiment has a seasonal fluctuation between off-peak to peak periods, from winter to summer. Beneath this seasonal movement, however, the trendline above shows that prices have gradually increased over the period from 2008 to 2016. If we compare this with the moving average for price sentiment for this period, we can see prices dropped and recovered sharply following the recession, before following a more gentle upwards trend after 2012. This marina price movement loosely follows the movement of retail price inflation, and with the dramatic increase in inflation projected over the course of 2017 following the sharp depreciation of the pound in July-December 2016, inland marina berth prices will continue to increase over the coming 12 months.
Source: British Marine Industry Trends Survey; Office for National Statistics, Retail Price Index
-2.0
0.0
2.0
4.0
6.0
8.0
10.0
-20
0
20
40
60
80
100
Re
tail
Pri
ce In
flat
ion
(%
Ch
ange
ove
r 1
2 m
on
ths)
Mar
ina
Pri
ce In
crea
ses
At
or
Ab
ove
Infl
atio
n (
%)*
Inland Marina Price Increases (%) Retail Price Inflation (%)
Inland Marina Pricing Trendline Inland Marina Prices (Moving Average)
*This figure represents the percentage of marinas that stated they were expecting to increase their prices at or above the level of inflation.

Inland Marinas: Market Commentary
“There is still an oversupply of moorings on the canal network”
Independent Marina (Canals)
“Accessibility and affordability are continuing to weigh on business. New boats aren’t selling, its difficult retaining berth holders in an ageing market with costs increasing, while there are limited new boat owners.”
Independent Marina (Non-Tidal River)
“The market for mid priced craft is slowing. We have seen downsizing in boat and berth sizes, so we have begun charging more for our best pontoon berths.”
Independent Marina (Non-Tidal River)
“The canal operator is not helping a difficult trading environment. The new reciprocal licencing arrangements – and their aggressive enforcement – for visiting craft are killing the business.”
Independent Moorings (Canal)
“Business activity seems moderately positive overall - for us, continued demand for residential moorings is the most important trend”
Independent Marina (Non-Tidal River)25
“There is an oversupply of moorings causing boats to move more often and only some to take a winter mooring. The lack of maintenance of track by CRT may well lead to a decline in boats on the inland waterways”
Independent Moorings (Canal)“There is a very strong demand for good quality moorings on the Thames. We are now able to keep a waiting list because of the strength of demand.”
Independent Marina (Non-Tidal River)
“Growth in residential is strong for us, while the leisure market is holding up and not contracting. However, economic and political stability is a concern and will probably dent customer confidence.”
Marina Group (Canals)

Inland Marinas: Economic & Social Impact
26
Over 50% of mooring businesses are family-owned and run, and almost a third are independent marinas, supporting local jobs and salaries, purchasing from local businesses, and returning that revenue to the local economy. A significant number of new marina developments are also designed as residential-commercial-recreational hubs, providing housing and hotels for the local community, as well as commercial and retail space, further supporting local economic growth. In addition, marinas act as recreational and social hubs for local communities, providing added social benefit to their economic impact, with 44% allowing access to their site to the general public, with another 25% holding structured social and recreational events to promote the boating lifestyle and culture.
Source: British Marine Marina Market Survey
46%
74%
70%
66%
72%
59%
85%
76%
83%
86%
76%
88%
Early Mornings (7am-9am)
Mid Mornings (9am-11am)
Lunchtime (11am-2pm)
Mid Afternoons (2pm-4pm)
Late Afternoons (4pm-6pm)
Evening (6pm-9pm)
Weekend
Weekday
50%…of marinas have a boat launch facility that
is made available to the general public
44%…of marinas allow the general public
to access their site
25%…of marinas hold structured social/
recreational events for their berth holders
7%…of marinas with structured social/
recreational events are increasing their investment in social programmes
Most Popular Times to Visit an Inland Marina
58%
32%5%
5%Family-run Business
Independent Marina
Marina Group
Local Authority
UK Inland Marinas by Ownership Type

The Coastal Marinas & Moorings Sector
27

Coastal Marinas & Moorings Sector Market Analysis
British Marine’s latest economic research indicates that over the last financial year, the coastal marina sector generated direct revenues from marinas, moorings and associated activities of £152m, a contraction of -1.2% on the last financial year, but an increase of +3.4% on revenues posted in 2013/14. In addition, the sector directly contributed over £70m in Gross Value Added to the UK economy, while directly supporting nearly 2,000 Full-Time Equivalent employees.
Business sentiment from British Marine business surveys shows that the sector was experiencing a slightly depressed trading environment prior to the EU referendum. The ‘Leave’ vote in June had an immediate impact on marine businesses, with the majority of marine enterprises reporting a negative outlook for the coming 6 months. Business outlook among coastal marinas plummeted to its lowest levels since 2011, but over the last 12 months business confidence has been buoyed by the devaluation of sterling, encouraging an increase in overseas sailors and marina customers. Market demand is strong, with berth occupancy reaching its highest levels since 2013 (88.0%), with many members indicating healthy waiting lists, and reporting positive performance across many major marina trades.
However, this positive sentiment is also tinged by concern. Marinas continue to struggle to retain customers with an ageing market that finds it increasingly difficult to justify the rising costs associated with marina berthing, particularly in an environment of rising costs and economic and political uncertainty. In some quarters, the low valuation of sterling is a particular concern since it threatens a boat drain in the UK as European sailors capitalize on current beneficial exchange rates, further threatening marina occupancy in the UK.
With this ageing market not being replenished with new, younger boat owners, the biggest challenge for operators is encouraging uptake while adapting to changes in customer behavior, as berth holders downsize in boat and berth sizes. As a result, operators are seeking more innovative ways to encourage engagement with boat ownership, through ‘shared’ ownership schemes and flexibility in the services that are offered to boaters in the marina. In the coastal sector this is characterized by a growth in dry stack storage to cater to the smaller boat market, as well as the development of marina hubs as all-encompassing leisure and tourism facilities, providing diverse services for a broader customer base.
Workforce % Growth
-0.6%
Business Confidence i
+/- Increase
+41%
1,841
+53%
28
£152mRevenue % Growth
-1.2%
£74mGross Value Added % Growth
-1.2%
+3.1%
88.0%Occupancy Rate % Growth ii
-1.2%£2,526
Yield/Berth % Growth iii
i This figure is taken from British Marine’s Industry Trends and Marina Market surveys and represents the net balance score or the difference between members reporting a positive and negative response to questions about their business’s future prospects over the next 6 months. ii Marina “occupancy rate" refers to the percentage of boat storage spaces that are occupied out of all boat storage spaces that are advertised (“capacity”). iii Yield per berth refers to the average revenue generated by each marina berth or mooring.

UK Coastal Marinas, Berths & Economic Impact by Region
29
Structure of the Marina & Moorings Sector
RegionNo. of
MarinasNo. of Berths/
MooringsAverage Berths/
Moorings per MarinaUK Employees
(FTE)Revenue
(£ million)
South West 56 10,337 185 345 £26.74
South East 94 20,716 220 787 £75.88
East of England 29 6,566 226 147 £10.00
East Midlands 2 277 139 10 £1.37
West Midlands - - - - -
North West 7 1,661 237 29 £1.26
North East 8 1,646 206 32 £1.95
Yorkshire 2 559 280 12 £0.50
London 16 1,303 81 106 £6.29
Wales 20 5,633 282 78 £4.66
Scotland 42 5,960 142 202 £14.61
Northern Ireland 12 1,525 127 50 £2.21
Channel Islands 9 3,857 429 42 £6.19
Total 297 60,040 202 1,841 £151.64

30
Coastal Marinas & Moorings Operations: Facts & Figures
7.0…the average trips taken by
berth holders annually
45%…% of marina berth holders
who regularly participate
£29,850…the average salary of
a coastal marina manager
…the average FTE jobs supported by a coastal marina
6.2
55%
30%
13%
2%
Coastal Marina Operators by Business Size
Micro (£0 to £199,999)
Small (£200,000 to £999,999)
Medium (£1,000,000 to £6,000,000)
Large (£6,000,000+)
…the average revenue generated by a coastal marina
£510,572
…the average tax contribution of a coastal marina
£142,327
…the average GVAcreated by a coastal marina
£248,350 …the average occupancy of a 200 berth coastal marina
88.0%
…the average number of berths per coastal marina
202
£46.49
19%
18%35%
28%
Coastal Marinas by Berths
Over 400 berths
251 to 400 berths
100 to 250 berths
Less than 100 berths
…the average amount spent on expenses by each berth holder on a boating trip

Coastal Marinas: Revenue Trends (Actual)
31
Source: British Marine internal economic data
£152mCoastal Marinas & Moorings
Revenue, 2015/16
£0.00
£20.00
£40.00
£60.00
£80.00
£100.00
£120.00
£140.00
£160.00
£180.00
£200.00
Co
asta
l Mar
inas
Rev
enu
e (£
m)
The total revenue of the coastal marina and moorings sector was £151.6 million in 2015/16 (-1.2% on 2014/15 and +3.4% on 2013/14). Coastal marinas and moorings revenue has been relatively stable since the recession, with little movement after 2009 until a sharp increase in 2012/13. Sector revenue has remained steady since then and is not expected to change significantly over the next 12 months. With a weak pound promoting increased visits from European sailors and consumer confidence and spending positive despite economic and political uncertainty, the fortunes of the sector should remain steady. But while the market for coastal moorings is consistent, there are risks on the horizon. The weakness of sterling, while attracting European sailors, has added significantly to operating costs. In addition to the rising costs of boating in the UK, the exchange rate disadvantage with the Euro also threatens to reduce marina occupancy as UK boat owners sell to sailors in the EU to mitigate their costs.

Coastal Marinas: Revenue, Profit & Operating Costs (Business Sentiment)
32
Sentiment among coastal marinas reinforces this picture. Unlike with the inland sector, prior to the EU referendum, turnover and profit was already perceived to be slowing. This sentiment dropped sharply following the vote to leave the EU. Since the vote, sentiment has recovered to 2014 levels, supported by consumer optimism and the boost of a weak pound increasing visiting and permanent berth holders from Europe, boat sales and other marina-based services. However, operating costs for marina operators have risen steadily over this period, with increases in inflation, business rates and other overheads eating into profit margins. These costs are expected to continue to rise, as the pricing trend chart on page 33 indicates.
0
20
40
60
80
100
-60
-40
-20
0
20
40
60
80
100
Op
erat
ing
Co
sts
Sen
tim
ent
Ne
t B
alan
ce S
core
(%
)*
Rev
enu
e an
d P
rofi
t Se
nti
men
tN
et
Bal
ance
Sco
re (
%)*
Operating Costs
Revenue
Profit
*The net balance reflects the difference between members reporting a positive and negative response to questions about their financial performance
Source: British Marine Industry Trends Survey; British Marine Marina Market Survey

33
-20
0
20
40
60
80
100
Bu
sin
ess
Co
nfi
den
ce In
dex
Sco
re
(Ne
t B
alan
ce S
core
%)*
Source: British Marine Industry Trends Survey; British Marine Marina Market Survey
*The net balance reflects the difference between members reporting a positive and negative response to questions about their business prospects
Coastal Marinas: Business Confidence Trends
EU Referendum:Coastal Marinas: +5
While the EU referendum in June had an immediate negative impact on business confidence, for coastal marinas it largely compounded existing pessimism about the prospects for the sector. Despite the negativity that quickly followed the ‘Leave’ vote, business confidence among coastal marina operators has quickly rebounded, returning to levels not seen since the end of 2014. This is partially driven by a buoyant consumer market, aided by the weakness of sterling and the attraction of European tourists to UK marinas.

Coastal Marinas: Workforce Growth (Business Sentiment)
34
-40
-20
0
20
40
60
80
100
Wo
rkfo
rce
Gro
wth
Sen
tim
ent
(Ne
t B
alan
ce S
core
%)
67%…coastal marinas increasing payroll costs, Jan-May 2017
Source: British Marine Industry Trends Survey; British Marine Marina Market Survey
*The net balance reflects the difference between members reporting a positive and negative response to questions about recruitment
1,841Full-Time Equivalent Jobs
Directly Supported by Coastal Marinas
Full-Time equivalent employment in the coastal marina sector sits at approximately 1,841 employees (-0.6% on 2014/15), or an average of 6.2Full-Time equivalent employees per coastal marina. If we look at the trends in hiring sentiment, we can see that, after accounting for seasonal trends in marina employment, recruitment declined after 2008 before recovering sharply in 2012/13, mirroring the delayed post-recession increase in investments in other areas shown on page 32. After rising consistently from 2012, and spiking in 2015, employee recruitment has stalled again. Hiring activity is expected to remain muted over the next 12 months with rising costs, consumer trends, economic and political volatility and declining consumer confidence denting recruitment sentiment among coastal marina employers.

Coastal Marinas: Investments (Business Sentiment)
35
Capital expenditures and other kinds of investment among marina businesses plummeted during the financial crisis, but recovered quickly, and have been on an upwards trend from late 2011 to late 2014. The EU referendum did little to affect this downwardsmovement, with capex and other investments remaining fairly stable from 2015 onwards. Despite steady increases to operating costs in 2017, a clear majority of coastal marina operators continue to invest in facilities to protect their business, responding to changing customer trends in order to compete effectively in a congested marketplace.
-20
-10
0
10
20
30
40
50
60
70
80
90
100
Cap
ital
Exp
end
itu
res
Gro
wth
(N
et
Bal
ance
Sco
re %
)
+32%Increase in investments in Environmental Protection
+29%Increase in investments in
Social Programmes
*The net balance reflects the difference between members reporting a positive and negative response to questions about their investments
Source: British Marine Industry Trends Survey; British Marine Marina Market Survey

Retail Price Inflation & Coastal Marina Pricing Sentiment
36
Source: British Marine Industry Trends Survey; Office for National Statistics, Retail Price Index
-2.0
0.0
2.0
4.0
6.0
8.0
10.0
-10
0
10
20
30
40
50
60
70
80
90
100
Re
tail
Pri
ce In
flat
ion
(%
Ch
ange
ove
r 1
2 m
on
ths(
Mar
ina
Pri
ce In
crea
ses
At
or
Ab
ove
Infl
atio
n (
%)*
Coastal Marina Price Increases (%) Retail Price Inflation (%)
Marina Pricing Trendline Coastal Marina Prices (Moving Average)
*This figure represents the percentage of marinas that stated they were expecting to increase their prices at or above the level of inflation.
Coastal marina pricing sentiment has a seasonal fluctuation between off-peak to peak periods, from winter to summer. Beneath this seasonal movement, however, the trendline above shows that prices have gradually been increasing after a sharp fall in 2008/9. If we compare this with the moving average for price sentiment for this period, we can see prices remained fairly stable after plummeting post-recession, until a steep increase in 2013 and then again in 2016/17. This marina price movement loosely follows the movement of retail price inflation, and with the dramatic increase in inflation projected over the course of 2017 following the sharp depreciation of the pound in July-December 2016, coastal marina prices are expected to continue to increase sharply over the coming 12 months.
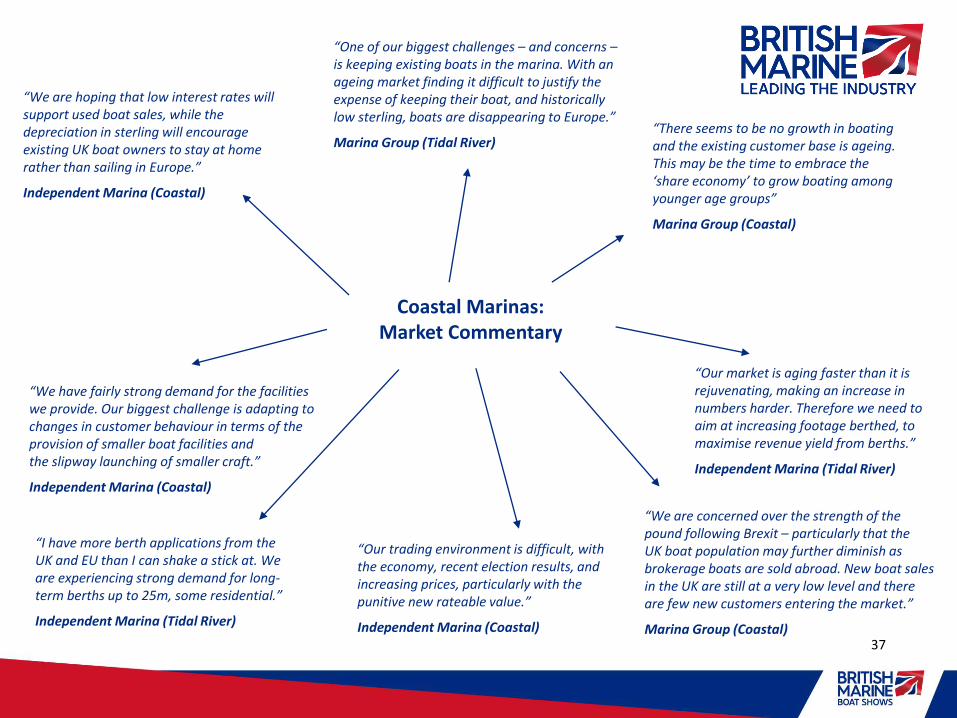
Coastal Marinas: Market Commentary
“There seems to be no growth in boating and the existing customer base is ageing. This may be the time to embrace the ‘share economy’ to grow boating among younger age groups”
Marina Group (Coastal)
“We are concerned over the strength of the pound following Brexit – particularly that the UK boat population may further diminish as brokerage boats are sold abroad. New boat sales in the UK are still at a very low level and there are few new customers entering the market.”
Marina Group (Coastal)
“One of our biggest challenges – and concerns –is keeping existing boats in the marina. With an ageing market finding it difficult to justify the expense of keeping their boat, and historically low sterling, boats are disappearing to Europe.”
Marina Group (Tidal River)
“We are hoping that low interest rates will support used boat sales, while the depreciation in sterling will encourage existing UK boat owners to stay at home rather than sailing in Europe.”
Independent Marina (Coastal)
“We have fairly strong demand for the facilities we provide. Our biggest challenge is adapting to changes in customer behaviour in terms of the provision of smaller boat facilities and the slipway launching of smaller craft.”
Independent Marina (Coastal)
37
“Our trading environment is difficult, with the economy, recent election results, and increasing prices, particularly with the punitive new rateable value.”
Independent Marina (Coastal)
“I have more berth applications from the UK and EU than I can shake a stick at. We are experiencing strong demand for long-term berths up to 25m, some residential.”
Independent Marina (Tidal River)
“Our market is aging faster than it is rejuvenating, making an increase in numbers harder. Therefore we need to aim at increasing footage berthed, to maximise revenue yield from berths.”
Independent Marina (Tidal River)
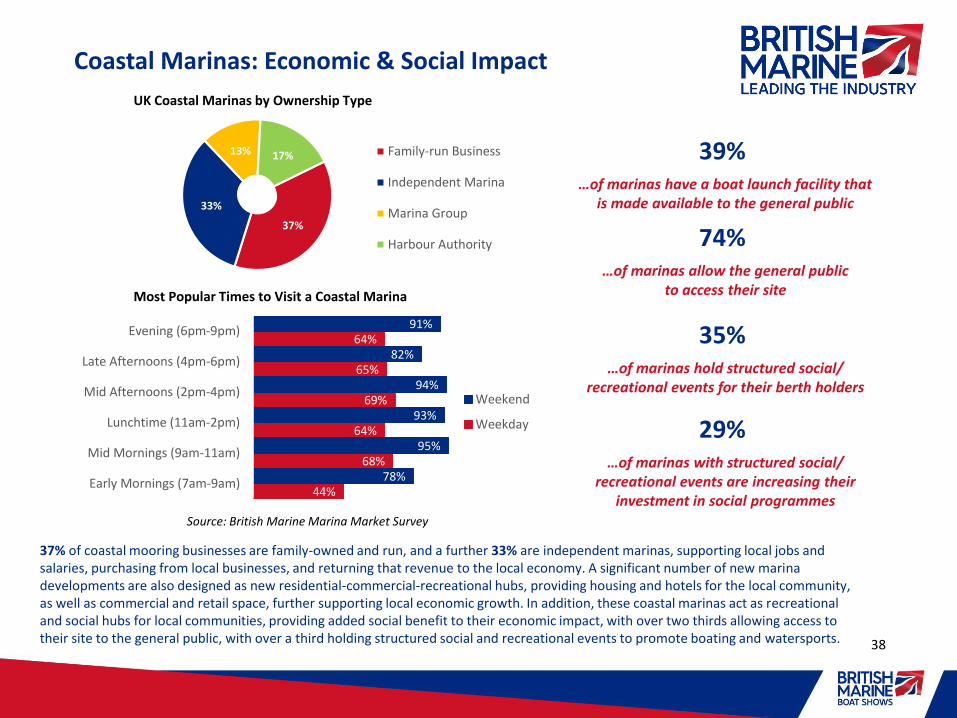
Coastal Marinas: Economic & Social Impact
38
37% of coastal mooring businesses are family-owned and run, and a further 33% are independent marinas, supporting local jobs and salaries, purchasing from local businesses, and returning that revenue to the local economy. A significant number of new marina developments are also designed as new residential-commercial-recreational hubs, providing housing and hotels for the local community, as well as commercial and retail space, further supporting local economic growth. In addition, these coastal marinas act as recreational and social hubs for local communities, providing added social benefit to their economic impact, with over two thirds allowing access to their site to the general public, with over a third holding structured social and recreational events to promote boating and watersports.
Source: British Marine Marina Market Survey
44%
68%
64%
69%
65%
64%
78%
95%
93%
94%
82%
91%
Early Mornings (7am-9am)
Mid Mornings (9am-11am)
Lunchtime (11am-2pm)
Mid Afternoons (2pm-4pm)
Late Afternoons (4pm-6pm)
Evening (6pm-9pm)
Weekend
Weekday
39%…of marinas have a boat launch facility that
is made available to the general public
74%…of marinas allow the general public
to access their site
35%…of marinas hold structured social/
recreational events for their berth holders
29%…of marinas with structured social/
recreational events are increasing their investment in social programmes
Most Popular Times to Visit a Coastal Marina
37%
33%
13% 17% Family-run Business
Independent Marina
Marina Group
Harbour Authority
UK Coastal Marinas by Ownership Type

Boat Ownership, Participation & Marina Occupancy in the UK
39

UK Boat Ownership & Participation
40
Source: British Marine Watersports Participation Survey 2016
The image above shows hotspots for all boating participation across the UK. The data in the bar chart and table opposite are not represented in this map.
3%
4%
4%
5%
7%
8%
8%
8%
9%
10%
14%
20%
2%
4%
4%
7%
6%
6%
9%
6%
8%
15%
9%
23%
Northern Ireland
East Midlands
North East
Wales
West Midlands
East
Scotland
Yorkshire
North West
South West
London
South East
Ownership
Participants
UK Boat Ownership & Participants by Region (% Share)
UK Boat Ownership by Craft
Craft Type Total Boats % Kept in UK
Any boat 1,147,265 95%
Small sailing boat 171,057 95%
Sailing yacht 52,266 93%
Power boat 45,193 84%
Motor boat 83,798 88%
Canal boat 27,917 97%
Canoe/kayak 547,729 98%
Rowing boat 45,330 94%
RIBs/Inflatables 34,962 93%
Windsurfer 104,381 96%
Personal Watercraft 34,633 91%
3,494,000UK Participants in a Boating
or Watersports Activity

Coastal Marine Traffic
41
Source: British Marine Watersports Participation Survey 2016
The heat map above shows hotspots for small sailboat, sailing yacht, motorboat and power boat coastal traffic.
Small Sail Boat Activities Yacht Cruising
Trip Frequency Once 2 to 5 6 to 12 13+ Once 2 to 5 6 to 12 13+
South East 20% 21% 28% 12% 38% 20% 20% 3%
London 6% 9% 49% 11% 23% 0% 0% 0%
South West 34% 34% 17% 0% 62% 7% 7% 0%
East of England 22% 37% 3% 38% 0% 93% 0% 7%
North West 60% 27% 0% 0% 47% 0% 0% 0%
Wales 0% 0% 34% 0% 42% 8% 27% 22%
Scotland 34% 42% 4% 10% 28% 24% 36% 12%
Power Boating Motor Boating
Trip Frequency Once 2 to 5 6 to 12 13+ Once 2 to 5 6 to 12 13+
South East 35% 18% 14% 3% 48% 34% 4% 4%
London 38% 13% 0% 0% 32% 25% 9% 0%
South West 43% 23% 0% 34% 27% 35% 0% 0%
East of England 60% 40% 0% 0% 45% 22% 13% 20%
North West 26% 21% 0% 22% 22% 41% 5% 0%
Wales 43% 26% 0% 0% 35% 12% 0% 0%
Scotland 34% 0% 18% 24% 60% 0% 12% 0%
Frequency of Participation in Key UK Boating Regions (% Share)
The tables above show the frequency of participation among different boat types used most commonly on the coast. This data is derived from a different sample to the data used to create the heat map opposite.

Inland Marine Traffic
42
Source: British Marine Watersports Participation Survey 2016; Canal & River Trust Annual Lockage Report 2016
Canal & River Trust Waterway Area*
Annual Lock Passages 2016
% Share of Inland Activity
Annual % Growth on 2015
Central Shires 4,203 16.6% -2%
South East 4,010 15.8% -
North Wales & Borders 3,823 15.1% +2%
West Midlands 2,694 10.6% +3%
Kennet & Avon 2,425 9.6% +3%
South Wales & Severn 2,079 8.2% -
London 1,928 7.6% +1%
North West 1,261 5.0% +4%
Manchester & Pennine 1,168 4.6% -8%
North East 979 3.9% +7%
East Midlands 779 3.1% -8%
The heat map above shows hotspots for inland boating (primarily narrowboat) traffic in the UK.
*Please Note: Detailed lock passage data is only available for the Canal & River Trust managed sections of the UK’s inland waterways.
The table above shows the volume of passages through different locks on the rivers and canals controlled by the Canal & River Trust. This data is different to the data represented on the heat map opposite, which is based on inland boating participation from a separate consumer survey.

Marina & Berth Distribution
43
Source: British Marine internal data
The heat map below shows hotspots for berth/ mooring provision across the UK, coupled with example marinas from each major UK region.
Example Marinas (Scotland):Troon Yacht Haven; Largs Yacht Haven; Clyde Marina; Kip Marina; Rhu Marina; Ardfern Yacht Centre; Orkney Marina; Dunstaffnage Marina; LossiemouthMarina; James Watt Dock.
Example Marinas (N Ireland):Bangor Marina; Carrickfergus Marina; Ardglass Marina; Coleraine Marina.
Example Marinas (Wales):Swansea Marina; Hafan Pwllheli; NeylandYacht Haven; Conwy Quays; Cardiff Marina; Milford Haven Marina; PenarthQuays; Holyhead Marina; Goytre Wharf.
Example Marinas (South West):Cobb’s Quay Marina; Bristol City Docks; Plymouth Yacht Haven; Portland Marina; Brixham Marina; Mayflower Marina; Mylor Yacht Harbour; Falmouth Marina; Darthaven Marina; Torquay Marina; Parkstone Bay; Weymouth Marina; Bath Marina; Portishead Quays; Caen Hill Marina; Poole Harbour.
Example Marinas (Channel Islands):Elizabeth Marina (Jersey); La Collette Yacht Basin (Jersey); St Helier Marina (Jersey); Beaucette Marina (Guernsey); St Peter Port Harbour (Guernsey).
Example Marinas (Solent):Port Solent; Buckler’s Hard Yacht Harbour; East Cowes Marina; Mercury Yacht Harbour; SouthseaMarina; Kemps Quay; Shamrock Quay; Universal Marina; Deacons Marina; Town Quay Marina; Swanwick Marina.
Example Marinas (London/ South East):South Dock Marina; St Katherine’s Docks; Limehouse Basin; Brighton Marina; Ramsgate Royal Harbour; Haslar Marina; Shepperton Marina; Harleyford Estate; Dover Marina; GillinghamMarina; Bray Marina; Thames & Kennet Marina; Gosport Marina.
Example Marinas (East of England):Suffolk Yacht Harbour; Tollesbury Marina; Ipswich Haven Marina; Hartford Marina; Broads Edge Marina; Tidemill Yacht Harbour; Lowestoft Haven Marina; Burnham Yacht Harbour; BrundallGardens Marina; Fambridge Yacht Haven; Brundall Bay Marina; Broadlands Marina.
Example Marinas (Midlands):Pillings Lock; Buckden Marina; Nottingham Castle; Kings Marina; Braunston Marina; Calcutt Boats; Alvechurch Marina; Stourport Marina; NaptonMarina; Diglis Basin; Ventnor Farm Marina; Droitwich Spa Marina.
Example Marinas (Northern England):York Marina; Overwater Marina; Royal Quays; Tattenhall Marina; Hull Marina; Windermere Aquatic; Anderton Marina; Preston Marina; Sunderland Marina; Glasson Basin; Wrenbury Mill.
Please Note: The marinas listed here constitute a random sample, and are not listed in order of size or importance.

88
.2%
79
.7%
92
.6%
88
.9%
84
.8%
92
.4%
82
.7%
84
.1%
89
.8%
83
.7%
91
.9%
80
.5%
80
.9%
84
.9%
83
.9%
84
.4%
89
.9%
89
.8%
87
.5%
88
.3%
86
.8%
88
.0%
88
.7%
88
.3%
2013 2015 2017
Marina & Moorings Occupancy Rates & Market Demand
44
Source: British Marine Marina Market Survey
49%
51%
Do you have a berth holder waiting list?
Yes No
40Average Berth Holders
on a Marina Waiting List
53%
21%
32%
-7%
15%
32%
12%
25%
Boatyard Services
Chandlery Sales
Used Boat Sales
New Boat Sales
Dry Stack Storage
Residential Berths/ Moorings
Commercial Berths/ Moorings
Leisure Berths/ Moorings
88.3%Average Marina Occupancy Rate
Across all UK Marinas
Marina Market Performance Net Balance Score*
*The net balance reflects the difference between members reporting an increase or decrease in their business over the last 12 months when asked about each of these markets
22%
78%
Inland Marinas Occupancy Split (%)
9%
36%
5%
44%
6%10%
Coastal Marinas Occupancy Split (%)
Small Sailboats Sailing Yachts
Rigid Inflatable Boats Motor Boats
Motor Yachts Narrowboats
Marina Occupancy Rate by Market Segment (%)
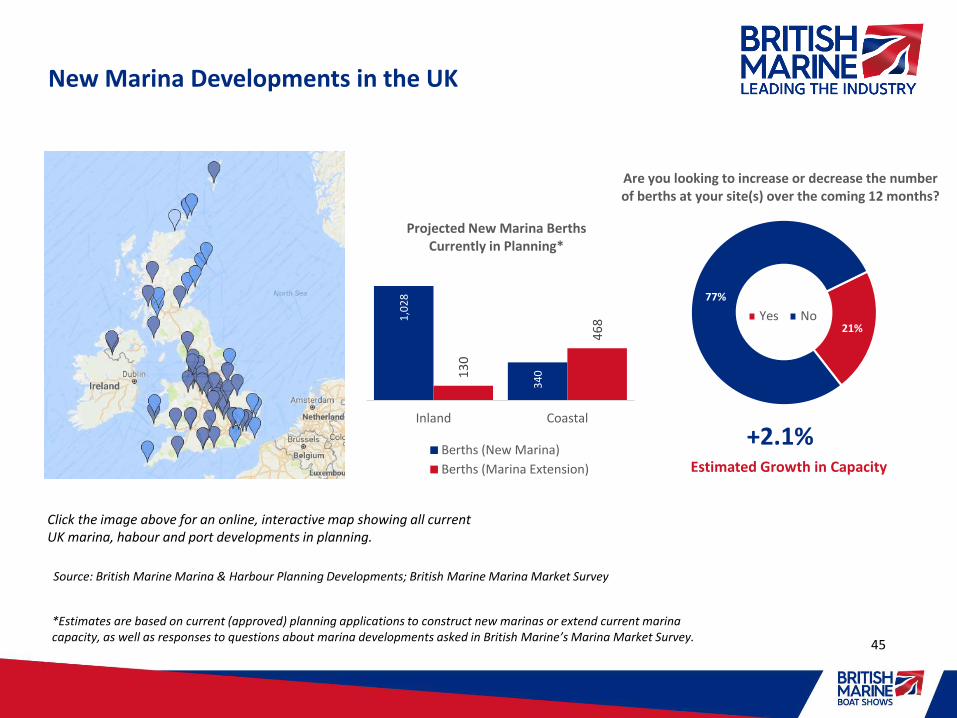
New Marina Developments in the UK
45
Source: British Marine Marina & Harbour Planning Developments; British Marine Marina Market Survey
21%
77%
Are you looking to increase or decrease the number of berths at your site(s) over the coming 12 months?
Yes No
+2.1%Estimated Growth in Capacity
Click the image above for an online, interactive map showing all current UK marina, habour and port developments in planning.
1,0
28
34
013
0
46
8
Inland Coastal
Projected New Marina Berths Currently in Planning*
Berths (New Marina)
Berths (Marina Extension)
*Estimates are based on current (approved) planning applications to construct new marinas or extend current marina capacity, as well as responses to questions about marina developments asked in British Marine’s Marina Market Survey.

Further Information
Thank you for reading this report. This research was produced by British Marine’s Market Research and Statistics department. British Marine publishes a wide range of market and economic research to promote and support the UK leisure, Superyacht and small commercial marine industry, including:
• Biennial KPI research providing insight on the economic performance and impact of the industry;
• Bi-annual reports tracking key business trends across all marine industry sectors;
• Annual market research tracking boating participation and ownership trends;
• Reports quantifying the volume, value and key characteristics of boating tourism;
• Interactive maps charting marine-related planning developments across the United Kingdom;
• Trade data exploring marine related imports and exports and the UK marine industry’s key trading partners;
• Reports exploring the marine industry labour market and skills, training and productivity in the industry;
• And a host of other research reports providing insight on domestic and international leisure marine markets
These research reports are available for free to all members of British Marine and can be downloaded directly from the British Marine website. British Marine also provides a bespoke analytical service to support members’ individual needs. To learn more about market research at British Marine, please contact [email protected].
© Copyright British Marine, 2017. All rights reserved. No part of this publication may be reproduced or transmitted in any form or by any means, electronic or mechanical,
Including photocopying, recording, or any information storage or retrieval system, without prior written consent of British Marine.
46