Embed Size (px)
Citation preview

2
The Many Faces of Poverty (Volume 3)
The Many Faces of Poverty in the Province ofTarlac
INDICATOR
DEMOGRAPHYPopulationAverage household sizeChildren under 1 year oldChildren under 5 years oldChildren 0-5 years oldChildren 6-12 years oldMembers 13-16 years oldMembers 6-16 years oldMembers 10 years old and aboveMembers of the labor force
HEALTH AND NUTRIT IONChildren under 5 years old who diedWomen who died due to pregnancy related-causesMalnourished children 0-5 year old
HOUS INGHouseholds living in makeshift housingHouseholds who are informal settlers
WATER AND SANITATIONHouseholds without access to safe water supplyHouseholds without access to sanitary toilet facilities
BASIC EDUCATI ONChildren 6-12 years old not attending elementary schoolChildren 13-16 years old not attending high schoolChildren 6-16 years old not attending school
INCOME AND L IVELIHOODHouseholds with income below poverty thresholdHouseholds with income below food thresholdHouseholds who experienced food shor tageUnemployment rate (15 years old and above)
PEACE AND ORDERVictims of crime
Magnitude
2281985
58485001
1134314158
107942745732522
Propor tion
2.62.2
5.06.3
47.332.71.1
Households Population
CBMS Core Indicators, Province of Tarlac, 2008-2009
Propo r t io nMagni tu de
22749109732132016156089
85412241501780291308842
1048532
27229
361083437039238
23.240.316.3
559 0.1
1876
0.2
11115 3.6
0.11.4
CBMS Composite Indicator, Province of Tarlac, 2008-2009
CBMS Composite IndicatorAvera g e
1.1

The Many Faces of Poverty (Volume 3)
3
CBMS Core Indicators, by Municipality, Province of Tarlac, 2008-2009
Munic ipa l i ty Tota lhouseholds
Number o fch i ld ren
(0-5years o ld )
Malnou rishedch i ld ren
(0-5 years o ld )
Ch i ld deaths(0-4 years o ld )
Number ofch i ld ren
(0-1year o ld )
Women deathsdue to
preg nancy -re l a tedcauses
Tota lpopulati on
Propor tionPropor tion Propor tion Magni tudeM ag n i tudeM ag n i tude
Number o fch i ld ren
(0-4years o ld )
Number o fch i ld ren
(6-12 yearso l d )
Ch i ld ren not attend inge lementar y school
(6-12 years old )
Ch i ld ren not attend ingh igh school
(13-16 years old )
Number o fch i ld ren(13 -16
years o ld )
Number o fch i ld ren
(6-16 yearso l d )
Ch i ld ren not attend ingschoo l
(6-16 years old )
Munic ipa l i ty
P r opor t i onP r opor t i onP r opor t i on M ag n i tudeM ag n i tudeM ag n i tude
Households liv ing inmak eshif t hous ing
Households who arein f ormal sett l e rs
Households without accessto safe water supply
Households without access tosanitar y to i le t faci l i t ies
Munic ipa l i ty
P r opor t i onP r opor t i on P r opor t i onP r opor t i on M ag n i tudeM ag n i tudeM ag n i tudeM ag n i tude
ANAOCAMILINGCAPASCITY OF TARLACCONCEPCIONGERONALA PAZMAYANTOCMONCADAPANIQUIPURARAMOSSAN CLEMENTESAN JOSESAN MANUELSANTA IGNACIAVICTORIA
ANAOCAMILINGCAPASCITY OF TARLACCONCEPCIONGERONALA PAZMAYANTOCMONCADAPANIQUIPURARAMOSSAN CLEMENTESAN JOSESAN MANUELSANTA IGNACIAVICTORIA
ANAOCAMILINGCAPASCITY OF TARLACCONCEPCIONGERONALA PAZMAYANTOCMONCADAPANIQUIPURARAMOSSAN CLEMENTESAN JOSESAN MANUELSANTA IGNACIAVICTORIA
2342766124037579812605917496122546162113511885146584062253465374947869112575
990433652
113115249035124052745655744725363916227636320446179501095531008215713647155013
9863434129512704514002762464582835547480412031200310393692251535576045
91028392461811152295419111824
0.90.30.20.10.20.10.30.40.30.30.40.20.40.50.40.50.4
18367224055709287816331334583118618024284052207815755761379
00412112800120142
0.00.00.20.00.10.10.10.30.70.00.00.20.90.00.20.70.1
11954195155913249816936910977753397662095312435240912824464302543497205
6139257941743053146517016910345438529112
5.10.91.60.31.00.30.74.30.80.76.94.33.59.80.20.71.6
6947746220455143582146830054516664537267204170
3.06.31.93.52.02.11.81.12.72.93.61.62.11.11.42.51.4
44647622801302531705315143035552352331104237
0.20.62.04.00.51.51.40.91.32.30.81.40.98.00.61.31.9
34321628182185254952251818820575103418163810141265112
0.15.76.83.23.33.24.38.41.71.11.62.516.525.320.515.60.9
1732418412772146215498182785836993717410914094143681070
0.74.37.74.95.78.96.74.55.23.78.01.84.321.68.44.78.5
1385504718764384792068210615917137037732110992973271915775381315152198392
21289839371122735592790178373414582865586545338158972911421716
15.317.821.029.217.226.319.419.819.025.819.720.021.429.523.122.520.5
80127269964209081088859475069204040896259172214769523149181030384574
25010123797931843862542187678214892303470475330177870310921767
31.237.238.144.640.342.837.038.336.736.827.332.234.756.538.836.938.6
2186777328728593873157016562142405743118211735846954195252985304961825712966
17389539741357442102734191385714632622364511281211074310261788
7.911.513.822.913.316.513.414.912.415.17.812.211.124.715.012.713.8

4
The Many Faces of Poverty (Volume 3)
CBMS Core Indicators, by Municipality, Province of Tarlac, 2008-2009
Households with income be low thepover ty th resho ld
Households with income be low thefood th reshold
Households who experienced foodsho r ta g e
Munic ipa l i ty
P r opor t i on P r opor t i on P r opor t i onM ag n i tudeM ag n i tudeM ag n i tude
Unemployment rate(15 years old and above)
Persons who are v ictimsof cr imes
Number o f persons in thelabor fo rce
(15 years old and above)
Munic ipa l i ty CBMS Compos iteInd icator
P r opor t i onP r opor t i onM ag n i tude M ag n i tude
ANAOCAMILINGCAPASCITY OF TARLACCONCEPCIONGERONALA PAZMAYANTOCMONCADAPANIQUIPURARAMOSSAN CLEMENTESAN JOSESAN MANUELSANTA IGNACIAVICTORIA
ANAOCAMILINGCAPASCITY OF TARLACCONCEPCIONGERONALA PAZMAYANTOCMONCADAPANIQUIPURARAMOSSAN CLEMENTESAN JOSESAN MANUELSANTA IGNACIAVICTORIA
9322123539810115427627468724713611643
135
0.40.40.90.60.40.61.34.52.40.41.61.20.59.41.30.01.1
268210260348147053037983235481886594411472923970674160233857984764551072818369
5150814342444201981410422916096581622263013433955299
1.95.04.13.55.33.55.53.14.12.82.43.80.81.45.30.51.6
6368958266374239912022415239
0.10.00.10.00.00.00.10.30.00.10.10.00.00.10.10.00.1
1262433078752660011323959373753117653082521953167210303407289853255400
53.956.532.845.943.554.860.250.657.643.841.941.240.752.158.661.342.9
9613437433918449706673505310223049265555129110326422244224939743518
41.044.918.131.827.142.043.336.243.429.527.725.425.334.345.545.728.0
1.11.30.91.11.01.31.41.21.31.01.00.91.01.81.51.41.0

The Many Faces of Poverty (Volume 3)
5
Map 2. Proportion of Children 0-4 Years Old who Died, by Barangay, 2008-2009
Map 1. Proportion of Children 0-4 Years Old who Died, by Municipality, 2008-2009
SAN JOSE
MAYANTOC
CAMILING
SANTA IGNACIA
SAN CLEMENTE
MONCADA
SAN MANUEL
PANIQUI
ANAO
RAMOSPURA
GERONAVICTORIA
CITY OF TARLAC
LA PAZ
CONCEPCIONCAPAS
BAMBAN
0.4
0.5
0.2 0.2
0.30.1
0.10.4
0.4
0.20.3
0.3 0.9
0.4
0.3
0.5
0.4
SAN JOSE
MAYANTOC
CAMILING
SANTA IGNACIA
SAN CLEMENTE
MONCADA
SAN MANUEL
PANIQUI
ANAO
RAMOSPURA
GERONAVICTORIA
CITY OF TARLAC
LA PAZ
CONCEPCIONCAPAS
BAMBAN
SAN JOSE
MAYANTOC
CAMILING
SANTA IGNACIA
SAN CLEMENTE
MONCADA
SAN MANUEL
PANIQUI
ANAO
RAMOSPURA
GERONAVICTORIA
CITY OF TARLAC
LA PAZ
CONCEPCIONCAPAS
BAMBAN
0.4
0.5
0.2 0.2
0.30.1
0.10.4
0.4
0.20.3
0.3 0.9
0.4
0.3
0.5
0.4
SAN JOSE
MAYANTOC
CAMILING
SANTA IGNACIA
SAN CLEMENTE
MONCADA
SAN MANUEL
PANIQUI
ANAO
RAMOSPURA
GERONAVICTORIA
CITY OF TARLAC
LA PAZ
CONCEPCIONCAPAS
BAMBAN
CBMS Poverty Maps: Tarlac
M unicip a li t y M ag ni t ud e Pr o p o r t io nA nao 9 0 .9San Jose 19 0.5Santa Ignacia 18 0.5Pura 9 0 .4San M anuel 11 0 .4V icto ria 24 0 .4M ayantoc 11 0 .4San Clemente 4 0 .4Camiling 10 0 .3La Paz 18 0 .3M oncada 15 0 .3Paniqui 22 0 .3Ramos 5 0 .2Capas 28 0 .2Concepcion 24 0 .2City Tarlac 39 0.1Gerona 6 0.1
C hi ld d eat hs ( 0 - 4 years o ld )
M uni c i p a l i t y B a r a ng a y M a g ni t ud e P r o p o r t i o n
M o ncad a Po b lacio n 2 6 4 .4C it y o f Tar lac A st urias 7 4 .1A nao Po b lacio n 1 3 .4A nao Santo D o ming o 1 3 .3
C amil ingSini lian C acalib o so an 1 3 .0
Santa Ig nacia Pug o -C ecilio 5 2 .9Santa Ig nacia Santa Ines Cent ro 5 2 .9A nao D o n Ramo n 1 2 .9A nao Hernand o 1 2 .7M ayant o c C ao cao ayan 2 2 .6
B o t t o m 10 B a r a ng a y s

6
The Many Faces of Poverty (Volume 3)
CBMS Poverty Maps: Tarlac
Map 3. Proportion of Women who Died Due to Pregnancy-Related Causes,by Municipality, 2008-2009
Map 4. Proportion of Women who Died Due to Pregnancy-Related Causes,by Barangay, 2008-2009
SAN JOSE
MAYANTOC
CAMILING
SANTA IGNACIA
SAN CLEMENTE
MONCADA
SAN MANUEL
PANIQUI
ANAO
RAMOSPURA
GERONAVICTORIA
CITY OF TARLAC
LA PAZ
CONCEPCIONCAPAS
BAMBAN
SAN JOSE
MAYANTOC
CAMILING
SANTA IGNACIA
SAN CLEMENTE
MONCADA
SAN MANUEL
PANIQUI
ANAO
RAMOSPURA
GERONAVICTORIA
CITY OF TARLAC
LA PAZ
CONCEPCIONCAPAS
BAMBAN
0.00.0
0.7
0.2
0.0
0.20.0
0.10.1
0.00.1
0.10.2
0.0
0.70.3
0.9
SAN JOSE
MAYANTOC
CAMILING
SANTA IGNACIA
SAN CLEMENTE
MONCADA
SAN MANUEL
PANIQUI
ANAO
RAMOSPURA
GERONAVICTORIA
CITY OF TARLAC
LA PAZ
CONCEPCIONCAPAS
BAMBAN
SAN JOSE
MAYANTOC
CAMILING
SANTA IGNACIA
SAN CLEMENTE
MONCADA
SAN MANUEL
PANIQUI
ANAO
RAMOSPURA
GERONAVICTORIA
CITY OF TARLAC
LA PAZ
CONCEPCIONCAPAS
BAMBAN
0.00.0
0.7
0.2
0.0
0.20.0
0.10.1
0.00.1
0.10.2
0.0
0.70.3
0.9
M unic ip a l it y M ag ni t ud e Pr o p o r t io nSan Clemente 2 0 .9Santa Ignacia 4 0.7M oncada 8 0.7M ayantoc 2 0 .3Ramos 1 0 .2San M anuel 1 0 .2Capas 4 0 .2V icto ria 2 0.1La Paz 1 0.1Concepcion 2 0.1Gerona 1 0.1City Tarlac 1 0 .0A nao 0 0 .0Camiling 0 0 .0Paniqui 0 0 .0Pura 0 0 .0San Jose 0 0 .0
W o men d eat hs d ue t o p reg nancy-re lat ed causes
M unic ip a li t y B ar a ng ay M a g ni t ud e P r o p o r t io n
M ayantoc B inbinaca 1 8.3M o ncada Pob lacion 2 2 7.1M ayantoc B ayb ayao as 1 7.1Santa Ignacia Pugo -Cecilio 2 6.5M o ncada Pob lacion 3 1 5.9M o ncada Santa Lucia East 1 5.9V icto ria Cab uluan 1 5.3Santa Ignacia Timmaguab 2 4.8M o ncada San Ro que 1 4.2San Clemente Pob lacion Sur 1 3.8
B o t t o m 10 B ar ang a ys

The Many Faces of Poverty (Volume 3)
7
Map 6. Proportion of Children 0-5 Years Old who are Malnourished,by Barangay, 2008-2009
Map 5. Proportion of Children 0-5 Years Old who are Malnourished,by Municipality, 2008-2009
SAN JOSE
MAYANTOC
CAMILING
SANTA IGNACIA
SAN CLEMENTE
MONCADA
SAN MANUEL
PANIQUI
ANAO
RAMOSPURA
GERONAVICTORIA
CITY OF TARLAC
LA PAZ
CONCEPCIONCAPAS
BAMBAN
SAN JOSE
MAYANTOC
CAMILING
SANTA IGNACIA
SAN CLEMENTE
MONCADA
SAN MANUEL
PANIQUI
ANAO
RAMOSPURA
GERONAVICTORIA
CITY OF TARLAC
LA PAZ
CONCEPCIONCAPAS
BAMBAN
0.2
0.8 5.1
4.30.7
6.90.3
1.6
0.30.7
1.01.6
9.8
4.3
0.9
0.7
3.5
SAN JOSE
MAYANTOC
CAMILING
SANTA IGNACIA
SAN CLEMENTE
MONCADA
SAN MANUEL
PANIQUI
ANAO
RAMOSPURA
GERONAVICTORIA
CITY OF TARLAC
LA PAZ
CONCEPCIONCAPAS
BAMBAN
SAN JOSE
MAYANTOC
CAMILING
SANTA IGNACIA
SAN CLEMENTE
MONCADA
SAN MANUEL
PANIQUI
ANAO
RAMOSPURA
GERONAVICTORIA
CITY OF TARLAC
LA PAZ
CONCEPCIONCAPAS
BAMBAN
0.2
0.8 5.1
4.30.76.9
0.31.6
0.30.7
1.01.6
9.8
4.3
0.9
0.7
3.5
CBMS Poverty Maps: Tarlac
M unicip a li t y M ag ni t ud e Pr o p o r t io nSan Jose 438 9 .8Pura 169 6 .9A nao 61 5.1M ayantoc 146 4 .3Ramos 103 4 .3San Clemente 45 3.5Capas 257 1.6V icto ria 112 1.6Concepcion 174 1.0Camiling 39 0 .9M oncada 51 0 .8Paniqui 70 0.7La Paz 53 0.7Santa Ignacia 29 0.7Gerona 30 0 .3City Tarlac 94 0 .3San M anuel 5 0 .2
M alno ur ished chi ld ren ( 0 - 5 years o ld )
M unic ip al i t y B ar ang ay M a g ni t ud e P r o p o r t io n
San Jo se M aamot 3 84 8 5.5M ayantoc Labney 62 40 .8Capas B ueno 57 29 .4Camiling Tuec 18 24 .0Ramo s Pob lacion Center 33 19.4M ayantoc San Jose 3 7 19.2Paniq ui San Juan de M illa 18 18.6Pura Poroc 16 17.0Pura Cad anglaan 16 16 .5A nao Rizal 10 16.4
B o t t o m 10 B ar ang ay s

8
The Many Faces of Poverty (Volume 3)
Table 1. Health and Nutrition Indicators, by Barangay, Province of Tarlac, 2008-2009
Munic ipa l i ty Ba rang a y Number o fch i ld ren
(0-5years o ld )
Malnou rishedch i ld ren
(0-5 years o ld )
Propor t ion
Chi ld deaths(0-4
years o ld )
Number o fch i ld ren
(0-1year o ld )
Women deathsdue to
preg nancy -re l a tedcauses
Magni tude Magni tude Pr opo r t i on Magni tude Propor tion
Number o fch i ld ren
(0-4years o ld )
ANAO Baguindoc (Baguinloc)BantogCamposCarmenCasiliDon RamonHernandoPoblacionRizalSan Francisco EastSan Francisco WestSan Jose Nor thSan Jose SouthSan JuanSan RoqueSanto DomingoSinenseSuaverdez
CAMI L ING Anoling 1stAnoling 2ndAnoling 3rdBacabacBacsayBiladBirbiraCacamilingan NorteCacamilingan SurCayaoanCayasanFloridaLibuegMalacampaManakemMarawiMatubogNagrambacanNagserialanPalimbo-CaarosipanPindangan 2ndPoblacion BPoblacion ESinilian 3rdSinilian CacalibosoanSinulatan 2ndSurgui 3rdTambuganTuec
CAPAS ArangurenBuenoCristo ReyCubcub (Pob.)Cutcut 1stCutcut 2ndDoloresEstrada (Calingcuan)LawyMangaManlapigMarugluO’DonnellSanta JulianaSanta LuciaSanta RitaSanto Domingo 1stSanto Domingo 2ndSanto RosarioTalaga
2949365984343628503791424452822910896
010101110001011100
0.02.00.01.70.02.92.73.40.00.00.02.30.01.91.23.30.00.0
66911136120952192141731921
000000000000000000
0.00.00.00.00.00.00.00.00.00.00.00.00.00.00.00.00.00.0
36574371100414536614912146506010234128115
2224430010155026267
5.63.54.75.64.07.30.00.016.42.04.110.90.03.35.95.94.76.1
6175462422221919618313939257235913842148139241412152041295083325411611059
00100020000010010010200010001
0.00.02.10.00.00.02.00.00.00.00.00.00.30.00.00.70.00.00.70.01.00.00.00.03.00.00.00.01.7
11157474431223828661567257303082445383081651421259
00000000000000000000000000000
0.00.00.00.00.00.00.00.00.00.00.00.00.00.00.00.00.00.00.00.00.00.00.00.00.00.00.00.00.0
789153299272235112218165493584438171481841733016727524114969108416113913575
000000804000400000000011001218
0.00.00.00.00.00.07.10.02.40.00.00.00.90.00.00.00.00.00.00.00.00.01.40.90.00.00.71.524.0
5601522475336103267661629886922316127011667441016230258560724585
001214100011010300121
0.00.00.00.60.10.60.20.00.00.00.60.40.01.30.30.00.00.20.30.2
1032748268216150140501074732621141321984247127150111
00000010000011000001
0.00.00.00.00.00.00.70.00.00.00.00.00.90.80.00.00.00.00.00.9
67119430174081193798746349106526319531414178831244276314669884691
265717021632040882440102389
3.929.40.60.00.22.00.40.60.01.50.02.50.62.73.20.40.00.34.31.3

The Many Faces of Poverty (Volume 3)
9
Table 1. Health and Nutrition Indicators, by Barangay, Province of Tarlac, 2008-2009
Munic ipa l i ty Ba rang a y Number o fch i ld ren
(0-5years o ld )
Malnou rishedch i ld ren
(0-5 years o ld )
Propor t ion
Chi ld deaths(0-4
years o ld )
Number o fch i ld ren
(0-1year o ld )
Women deathsdue to
preg nancy -re l a tedcauses
Magni tude Magni tude Pr opo r t i on Magni tude Propor tion
Number o fch i ld ren
(0-4years o ld )
CITY OF TARLAC AgusoAlvindia SegundoAmucaoArmeniaAsturiasAtiocBalantiBaleteBalibago IBalibago IIBalingcanawayBanabaBantogBaras-barasBatang-batangBinaugananBoraBuenavistaBuhilit (Bubulit)BurotCalingcuanCapehanCarangianCareCentralCulipatCut-cut ICut-cut IIDalayapDela PazDoloresLaoangLigtasanLourdesMabiniMaligayaMaliwaloMapalacsiaoMapaladMataderoMatatalaibParaisoPoblacionSalapunganSan CarlosSan FranciscoSan IsidroSan JoseSan Jose de UrquicoSan Juan de MataSan LuisSan ManuelSan MiguelSan NicolasSan PabloSan PascualSan RafaelSan RoqueSan SebastianSan VicenteSanta CruzSanta MariaSanto CristoSanto DomingoSanto NiñoSapang MaragulSapang TagalogSepung CalzadaSinaitSuizo
494165229414163178168398210256500951893381883678512014233416822381742933165436693382111802692231674541966646457170126634616161142212983666221390276581690799314266542667356101529610711513286
1138475402233427
2000711112000000000000200000100010020100010000000411000000000000211021
0.40.00.00.04.10.60.60.30.50.80.00.00.00.00.00.00.00.00.00.00.00.00.20.00.00.00.00.00.30.00.00.00.40.00.00.50.00.20.00.00.00.30.00.00.00.00.00.00.01.00.40.20.00.00.00.00.00.00.00.00.00.00.00.02.30.10.20.00.90.2
107343495344241725057921853713181153522664234174836398
13380414261513639513810914402906724027392121384497581161371906464114156711975320202819243898551101
0000000000000000000000000000000000000000000000000000000000000000000000
0.00.00.00.00.00.00.00.00.00.00.00.00.00.00.00.00.00.00.00.00.00.00.00.00.00.00.00.00.00.00.00.00.00.00.00.00.00.00.00.00.00.00.00.00.00.00.00.00.00.00.00.00.00.00.00.00.00.00.00.00.00.00.00.00.00.00.00.00.00.0
597198281491195212208477247310583113240409231448107141178397192269964514400815579340725020832725919469505795553631941534407161901662601186805253456324681835958387308667798430127135812913115998
1343594486266511
13100020104032120110011000011101100061105110004300000101102900000142130
0.21.50.40.00.00.01.00.00.40.00.70.01.30.50.40.40.00.70.60.00.00.40.10.00.00.00.00.10.20.40.00.30.40.00.00.00.80.21.60.00.30.26.30.00.00.00.30.40.00.00.00.00.00.10.00.30.10.00.50.70.00.00.00.00.01.00.30.21.10.0

10
The Many Faces of Poverty (Volume 3)
Table 1. Health and Nutrition Indicators, by Barangay, Province of Province of Tarlac, 2008-2009
Munic ipa l i ty Ba rang a y Number o fch i ld ren
(0-5years o ld )
Malnou rishedch i ld ren
(0-5 years o ld )
Propor t ion
Chi ld deaths(0-4
years o ld )
Number o fch i ld ren
(0-1year o ld )
Women deathsdue to
preg nancy -re l a tedcauses
Magni tude Magni tude Pr opo r t i on Magni tude Propor tion
Number o fch i ld ren
(0-4years o ld )
CITY OF TARLAC TarijiTibagTibaganTrinidadUngotVilla Bacolor
CONCEPC ION AlfonsoBalutuCafeCalius GuecoCaluluanCastilloCorazon de JesusCulatinganDunganDutung-A-MatasGreen VillageLilibanganMabilogMagaoMalupaMinanePanalicsianPandoParangParulungPitabunanSan Agustin (Murcia)San AntonioSan Bar tolomeSan FranciscoSan Isidro (Almendras)San Jose (Pob.)San Juan (Castro)San MartinSan Nicolas (Pob.)San Nicolas BalasSan VicenteSanta CruzSanta MariaSanta MonicaSanta RitaSanta RosaSantiagoSanto CristoSanto NiñoSanto RosarioTalimunduc MarimlaTalimunduc San MiguelTelabancaTinang
GERONA AbagonAmacalanApsayanAysonBawaBuenlagBularitCalayaanCarbonelCardonaCaturayDanzoDicolorDon BasilioLuna
2651365479170267192
003000
0.00.00.60.00.00.0
68258102326843
001000
0.00.01.00.00.00.0
3151664584198339236
160101
0.30.40.00.50.00.4
810333253109426330217326112488169105267207136359125272273134344592288226783284767457283053101834761425483464175301053961861542137
464
000004010000000120002102002101100000300300000
0.00.00.00.00.01.20.00.30.00.00.00.00.00.00.00.31.60.00.00.00.60.20.00.90.00.00.30.20.00.30.30.00.00.00.00.00.70.00.00.80.00.00.00.00.0
165766026945840712412035255038357524485025631165261153631609456858369434936910010119863431422
105
000000000000000000000000000000000000000101000
0.00.00.00.00.00.00.00.00.00.00.00.00.00.00.00.00.00.00.00.00.00.00.00.00.00.00.00.00.00.00.00.00.00.00.00.00.00.00.01.10.03.10.00.00.0
956404301124503393259393126595210132325239159432150336335170406723362262973338933559393763682135741766524235026511414852211862488
575
000000001200160021335000000002009001314500230000003
0.00.00.00.00.00.00.00.00.80.30.00.04.90.00.04.92.010.40.00.00.00.00.00.00.00.00.20.00.02.40.00.02.30.66.90.00.03.50.00.00.00.00.00.00.5
38327222314214820426826811622210514417084128
010001010100000
0.00.40.00.00.00.50.00.40.00.40.00.00.00.00.0
884642363441705029472226292224
441338264161179248318318142274122165204104153
040110001101001
0.01.20.00.60.60.00.00.00.70.40.00.60.00.00.7
000000000000000
0.00.00.00.00.00.00.00.00.00.00.00.00.00.00.0

The Many Faces of Poverty (Volume 3)
11
Table 1. Health and Nutrition Indicators, by Barangay, Province of Province of Tarlac, 2008-2009
Munic ipa l i ty Ba rang a y Number o fch i ld ren
(0-5years o ld )
Malnou rishedch i ld ren
(0-5 years o ld )
Propor t ion
Chi ld deaths(0-4
years o ld )
Number o fch i ld ren
(0-1year o ld )
Women deathsdue to
preg nancy -re l a tedcauses
Magni tude Magni tude Pr opo r t i on Magni tude Propor tion
Number o fch i ld ren
(0-4years o ld )
GERONA MabiniMagaspacMalayepMatapitapMatayumcabNew SalemOloybuayaPadapadaParsolinganPinasling (Pinasung)PlastadoPoblacion 1Poblacion 2Poblacion 3QuezonRizalSalapunganSan AgustinSan AntonioSan Bar tolomeSan JoseSanta LuciaSantiagoSembranoSingatSulipaTagumbaoTangcaranVilla Paz
LA PAZ BalanoyBantog-CaricutanCaramutanCautComillasDumaraisGuevarraKapanikianLa PurisimaLaraLaungcupangLomboyMacalongMatayumtayumMayangMotricoPaludpudRizalSan Isidro (Pob.)San Roque (Pob.)Sierra
MAYANTOC AmbalingitBaybayaoasBigbigaBinbinacaCalabtanganCaocaoayanCarabaoanCubcubGayonggayongGossoodLabneyMamonitManiniogMapandanNambalanPedro L. Quines
116409159104140997810925728615124869231125123231119314105124521711151318935291149
02000000000000000000000000000
0.00.50.00.00.00.00.00.00.00.00.00.00.00.00.00.00.00.00.00.00.00.00.00.00.00.00.00.00.0
228536223021182471663057145028215124691834937252422662132
01000000000000000000000000000
0.01.20.00.00.00.00.00.00.00.00.00.00.00.00.00.00.00.00.00.00.00.00.00.00.00.00.00.00.0
140505184132159127941253043551912949926814414527214135512114765199139155113428101176
02001000000000071000310021002
0.00.40.00.00.60.00.00.00.00.00.00.00.00.00.04.80.40.00.00.02.01.50.00.01.30.90.00.01.1
224297451281460445437205325122199314213321157283210142352777243
300002011120013000040
1.30.00.00.00.00.40.00.50.30.81.00.00.00.31.90.00.00.00.00.50.0
47541005711011010150561739664266265843288014440
000000000000000000010
0.00.00.00.00.00.00.00.00.00.00.00.00.00.00.00.00.00.00.00.70.0
267348542333553526522248388153233370256385204359249177437938287
00202000170110101081181
0.00.00.40.00.40.00.00.04.40.00.40.30.00.30.00.30.04.50.21.90.3
63361306456755536488212822973156174146
1011020001000030
1.60.00.81.50.02.60.00.00.01.20.00.00.00.01.70.0
1013281110181481117255518343325
0101000000000000
0.07.10.08.30.00.00.00.00.00.00.00.00.00.00.00.0
78421627170926544539915226198181215174
00000000726270331
0.00.00.00.00.00.00.00.013.22.040.82.70.01.71.40.6

12
The Many Faces of Poverty (Volume 3)
Table 1. Health and Nutrition Indicators, by Barangay, Province of Tarlac, 2008-2009
Munic ipa l i ty Ba rang a y Number o fch i ld ren
(0-5years o ld )
Malnou rishedch i ld ren
(0-5 years o ld )
Propor t ion
Chi ld deaths(0-4
years o ld )
Number o fch i ld ren
(0-1year o ld )
Women deathsdue to
preg nancy -re l a tedcauses
Magni tude Magni tude Pr opo r t i on Magni tude Propor tion
Number o fch i ld ren
(0-4years o ld )
MAYANTOC PitombayogPoblacion NortePoblacion SurRotrottoocSan Bar tolomeSan JoseTaldiapanTangcarang
MONCADA Ablang-SapangAringinAtencioBanaoang EastBanaoang WestBaquero Nor teBaquero SurBurgosCalamayCalapanCamangaan EastCamangaan WestCamposanto 1 - Nor teCamposanto 1 - SurCamposanto 2CapaoayanLapsingMabiniMaluacPoblacion 1Poblacion 2Poblacion 3Poblacion 4RizalSan JuanSan JulianSan LeonSan PedroSan RoqueSanta Lucia EastSanta Lucia WestSanta MariaSanta MonicaTolega Nor teTolega SurTubectubangVilla
PANIQUI AbogadoAcocolaoAduasApulidBalaoangBarang (Borang)BrillanteBurgosCabayaoasanCananCarinoCayangaColibangbangCoralDapdapEstacionMabilangManaoisMatalapitapNagmisaanNancamarinan
1812472539914216571126
10010000
0.50.00.01.00.00.00.00.0
3751471828401517
00000000
0.00.00.00.00.00.00.00.0
22630330411916219391142
2000037121
0.90.00.00.00.019.21.114.8
3801795512613315014620490991561491371752172831792146293131749813121124513064117771201991797913123823
1000010001000000000060001100010100110
0.30.00.00.00.00.70.00.00.01.00.00.00.00.00.00.00.00.00.00.04.40.00.00.00.50.40.00.00.01.30.00.50.00.00.80.40.0
8836143025363939171432343442555340511021261619174556301723162438411526625
1000001000000000000021000000110100000
1.10.00.00.00.00.02.50.00.00.00.00.00.00.00.00.00.00.00.00.07.15.90.00.00.00.00.00.04.25.90.02.60.00.00.00.00.0
45821467151160182176243110126196179171206263339208251741081688811915924730414779137951422502229815530226
0.00.00.00.02.53.80.00.40.01.60.00.00.00.00.40.00.00.00.00.01.21.12.50.03.20.00.00.06.60.04.21.60.00.00.60.07.7
0000470102000010000021308000906400102
47815917827433910450209256206403118146167102320212104180170331
100000000221000000002
0.20.00.00.00.00.00.00.00.01.00.50.80.00.00.00.00.00.00.00.00.6
1113238666923124659448931384119724320334271
000000000000000000000
0.00.00.00.00.00.00.00.00.00.00.00.00.00.00.00.00.00.00.00.0
55918820033240212563247303245484145171189119401260124217204395
5102300015000200001005
0.90.50.06.90.00.00.00.41.70.00.00.01.20.00.00.00.00.80.00.01.3

The Many Faces of Poverty (Volume 3)
13
Table 1. Health and Nutrition Indicators, by Barangay, Province of Tarlac, 2008-2009
Munic ipa l i ty Ba rang a y Number o fch i ld ren
(0-5years o ld )
Malnou rishedch i ld ren
(0-5 years o ld )
Propor t ion
Chi ld deaths(0-4
years o ld )
Number o fch i ld ren
(0-1year o ld )
Women deathsdue to pregnancy-
re l a ted causes
Magni tude Magni tude Pr opo r t i on Magni tude Propor tion
Number o fch i ld ren
(0-4years o ld )
PANIQUI NipacoPatalanPoblacion NortePoblacion SurRang-ayanSalumagueSamputSan CarlosSan IsidroSan Juan de MillaSanta InesSinigpitTablangVentenilla
PURA BaliteBuenavistaCadanglaanEstiponaLinaoMaasinMatindegMaungibNayaNilasin 1stNilasin 2ndPoblacion 1Poblacion 2Poblacion 3PorocSingat
RAMOS Coral-IlocoGuitebPancePoblacion CenterPoblacion NorthPoblacion SouthSan JuanSan RaymundoToledo
SAN CL EMENTE BallocBambanCasipoCatagudinganDaldalayapDoclong 1Doclong 2MaasinNagsabaranPit-aoPoblacion NortePoblacion Sur
SAN JOSE BurgosDavidIbaLabneyLawacamulagLubiganMaamotMababanabaMorionesPaoSan Juan de ValdezSulaVilla Aglipay
10023570744919824043013619378149166225229
00110061001031
0.00.00.10.20.00.01.40.70.00.00.70.01.30.4
285315793457110332541329345833
00000000000000
0.00.00.00.00.00.00.00.00.00.00.00.00.00.0
12227982752623128450615921997168193271276
102011202180000
0.80.00.20.00.40.40.40.00.918.60.00.00.00.0
13121183362109601121339293108849212180160
1111000110101100
0.80.51.20.30.00.00.00.71.10.00.90.01.10.80.00.0
29461974161224241722271624222234
0000000000000000
0.00.00.00.00.00.00.00.00.00.00.00.00.00.00.00.0
154247974441296913515911311412910410914794191
120166219691190386161
7.80.016.514.00.813.04.45.79.77.90.02.97.34.117.00.5
37734542114114421153111200
101110001
0.30.00.20.70.70.00.00.00.5
816581303039161746
000100000
0.00.00.03.20.00.00.00.00.0
45241250517016925769131244
6903302021023
1.32.20.019.40.07.82.97.69.4
140842059637648173689687125
300001000000
2.10.00.00.00.01.30.00.00.00.00.00.0
2820711101673817202125
000000010001
0.00.00.00.00.00.00.02.60.00.00.03.8
170102227277945721186122109160
4501010250081
2.44.90.01.40.01.10.011.80.00.07.30.6
324182494186134102357294402173149384511
2112002071003
0.60.50.21.10.00.00.60.01.70.60.00.00.6
7234106422622775692333685100
0000000000000
394205610230163127449357475204177470603
0.30.00.011.73.10.085.50.00.20.01.13.80.0
1002750
3840102180
0.00.00.00.00.00.00.00.00.00.00.00.00.0

14
The Many Faces of Poverty (Volume 3)
Table 1. Health and Nutrition Indicators, by Barangay, Province of Tarlac, 2008-2009
Munic ipa l i ty Ba rang a y Number o fch i ld ren
(0-5years o ld )
Malnou rishedch i ld ren
(0-5 years o ld )
Propor t ion
Chi ld deaths(0-4
years o ld )
Number o fch i ld ren
(0-1year o ld )
Women deathsdue to
preg nancy -re l a tedcauses
Magni tude Magni tude Pr opo r t i on Magni tude Propor tion
Number o fch i ld ren
(0-4years o ld )
SAN MANUEL ColubotLanatLegaspiMangandingayMatarannocPacpacoPoblacionSalcedoSan AgustinSan FelipeSan JacintoSan MiguelSan NarcisoSan VicenteSanta Maria
SANTA IGNACIA BaldiosBotbotonesCaanamonganCabaruanCabugbuganCaduldulaoanCalipayanMacaguingNambalanPadapadaPilpilaPinpinasPoblacion EastPoblacion WestPugo-CecilioSan FranciscoSan SoteroSan VicenteSanta Ines CentroSanta Ines EastSanta Ines WestTaguiporoTimmaguabVargas
V ICTORI A BaculongBalayangBalbalotoBangarBantogBatangbatangBuloCabuluanCalibunganCanaremCruzLalapacMaluidMangolagoMasalasaPalacpalacSan AgustinSan AndresSan Fernando (Pob.)San FranciscoSan Gavino (Pob.)San JacintoSan Nicolas (Pob.)San VicenteSanta BarbaraSanta Lucia (Pob.)
10222517910510912413824522929296225120177149
000010212010112
0.00.00.00.00.90.01.40.40.90.01.00.00.80.61.3
235138262522325945653056194836
000000000000001
0.00.00.00.00.00.00.00.00.00.00.00.00.00.02.7
123269224135129150163290271341110273152211184
000000104000000
0.00.00.00.00.00.00.60.01.50.00.00.00.00.00.0
18613113089629110269159274153631682081651949120216721916445201224
000000001000005400503000
0.00.00.00.00.00.00.00.00.60.00.00.00.00.02.92.00.00.02.90.01.80.00.00.0
29213213021201014482261872933204230423064043
000000000000002000000020
0.00.00.00.00.00.00.00.00.00.00.00.00.00.06.50.00.00.00.00.00.00.04.80.0
22415216611777111130841983171947422326618524411324119126420160244273
0000002500001007001100120
0.00.00.00.00.00.01.66.00.00.00.00.00.50.00.02.90.00.00.50.40.00.05.10.0
411338186207216131217121194200205226287204163164317163252159225288265202528176
0.20.01.10.50.00.00.90.00.51.50.00.40.00.50.60.00.30.00.01.20.40.70.70.00.40.6
92813855532850184242424963363447714259415653545313842
00000001000000100000000000
0.00.00.00.00.00.00.05.30.00.00.00.00.00.02.90.00.00.00.00.00.00.00.00.00.00.0
10210020130101101002122021
488399223244256156258148226237242254341246195195396212306185275341312248617205
18031001600811521022419821405
0.22.00.01.23.90.06.20.00.03.40.40.41.50.80.50.05.61.90.34.92.90.60.31.60.02.5

The Many Faces of Poverty (Volume 3)
15
Map 7. Proportion of Households Living in Makeshift Housing, by Municipality,2008-2009
Map 8. Proportion of Households Living in Makeshift Housing, by Barangay, 2008-2009
SAN JOSE
MAYANTOC
CAMILING
SANTA IGNACIA
SAN CLEMENTE
MONCADA
SAN MANUEL
PANIQUI
ANAO
RAMOSPURA
GERONAVICTORIA
CITY OF TARLAC
LA PAZ
CONCEPCIONCAPAS
BAMBAN
SAN JOSE
MAYANTOC
CAMILING
SANTA IGNACIA
SAN CLEMENTE
MONCADA
SAN MANUEL
PANIQUI
ANAO
RAMOSPURA
GERONAVICTORIA
CITY OF TARLAC
LA PAZ
CONCEPCIONCAPAS
BAMBAN
1.4
2.7 3.0
1.62.96.3
1.1
1.1
1.9 2.0
1.8
1.4
3.5
2.13.6
2.5
2.1
SAN JOSE
MAYANTOC
CAMILING
SANTA IGNACIA
SAN CLEMENTE
MONCADA
SAN MANUEL
PANIQUI
ANAO
RAMOSPURA
GERONAVICTORIA
CITY OF TARLAC
LA PAZ
CONCEPCIONCAPAS
BAMBAN
SAN JOSE
MAYANTOC
CAMILING
SANTA IGNACIA
SAN CLEMENTE
MONCADA
SAN MANUEL
PANIQUI
ANAO
RAMOSPURA
GERONAVICTORIA
CITY OF TARLAC
LA PAZ
CONCEPCIONCAPAS
BAMBAN
1.4
2.7 3.0
1.62.96.3
1.1
1.1
1.9 2.0
1.8
1.4
3.5
2.13.6
2.5
2.1
CBMS Poverty Maps: Tarlac
M unicip a li t y M ag ni t ud e Pr o p o r t io nCamiling 477 6 .3Pura 166 3 .6City Tarlac 2045 3.5A nao 69 3 .0Paniqui 545 2 .9M oncada 300 2.7Santa Ignacia 204 2.5San Clemente 53 2.1Gerona 358 2.1Concepcion 514 2 .0Capas 462 1.9La Paz 214 1.8Ramos 64 1.6V icto ria 170 1.4San M anuel 67 1.4San Jose 72 1.1M ayantoc 68 1.1
Ho useho ld s l iving in makeshi f t ho us ing
M unicip al i t y B ar ang ay M ag ni t ud e P r o p o r t io n
Camiling Poblacion B 118 34 .3Cit y of Tarlac M apalacsiao 359 33 .8Santa Ignacia Caduldulao an 45 32 .8Camiling Cacamilingan No rte 144 32 .0Santa Ignacia B otbo tones 81 30 .2Concep cio n Caluluan 2 51 28 .3Cit y of Tarlac Santo Crist o 9 9 2 5.4Camiling Palimb o-Caarosipan 127 2 5.3Capas M anlap ig 9 6 25.1A nao Suaverdez 45 22 .2
B o t t o m 10 B a r ang a ys

16
The Many Faces of Poverty (Volume 3)
CBMS Poverty Maps: Tarlac
Map 10. Proportion of Households who are Informal Settlers, by Barangay, 2008-2009
Map 9. Proportion of Households who are Informal Settlers, by Municipality,2008-2009
SAN JOSE
MAYANTOC
CAMILING
SANTA IGNACIA
SAN CLEMENTE
MONCADA
SAN MANUEL
PANIQUI
ANAO
RAMOSPURA
GERONAVICTORIA
CITY OF TARLAC
LA PAZ
CONCEPCIONCAPAS
BAMBAN
SAN JOSE
MAYANTOC
CAMILING
SANTA IGNACIA
SAN CLEMENTE
MONCADA
SAN MANUEL
PANIQUI
ANAO
RAMOSPURA
GERONAVICTORIA
CITY OF TARLAC
LA PAZ
CONCEPCIONCAPAS
BAMBAN
0.6
0.21.3
2.30.8
1.51.9
1.44.0
1.3
0.60.9
0.9
8.0
2.0 0.5
1.4
SAN JOSE
MAYANTOC
CAMILING
SANTA IGNACIA
SAN CLEMENTE
MONCADA
SAN MANUEL
PANIQUI
ANAO
RAMOSPURA
GERONAVICTORIA
CITY OF TARLAC
LA PAZ
CONCEPCIONCAPAS
BAMBAN
SAN JOSE
MAYANTOC
CAMILING
SANTA IGNACIA
SAN CLEMENTE
MONCADA
SAN MANUEL
PANIQUI
ANAO
RAMOSPURA
GERONAVICTORIA
CITY OF TARLAC
LA PAZ
CONCEPCIONCAPAS
BAMBAN
0.6
0.21.3
2.30.8
1.51.9
1.44.0
1.3
0.6
0.9
0.9
8.0
2.0 0.5
1.4
M unic ip a l i t y M ag ni t ud e P ro p o r t io nSan Jose 523 8 .0City Tarlac 2280 4 .0Paniqui 430 2 .3Capas 476 2 .0V icto ria 237 1.9Gerona 253 1.5La Paz 170 1.4Ramos 55 1.4M oncada 151 1.3Santa Ignacia 104 1.3San Clemente 23 0 .9M ayantoc 53 0 .9Pura 35 0 .8San M anuel 31 0 .6Camiling 46 0 .6Concepcion 130 0.5A nao 4 0 .2
Ho useho ld s w ho are inf o rmal set t le rs
M unicip al i t y B a r ang a y M a g ni t ud e Pr o p o r t io n
San Jo se M aamot 459 84.8Cit y of Tarlac San Luis 26 1 51.4Capas Santo Doming o 1st 179 34.8Cit y of Tarlac Santo Crist o 112 28.9Cit y of Tarlac San Pab lo 155 25.5Cit y of Tarlac B alib ago II 142 22.6V icto ria San Gavino (Pob .) 9 5 17.6Cit y of Tarlac Cap ehan 8 4 17.5Paniq ui Samput 139 16.6Santa Ignacia Pinp inas 2 5 15.5
B o t t o m 10 B ar ang a ys

The Many Faces of Poverty (Volume 3)
17
Map 11. Proportion of Households without Access to Safe Water Supply,by Municipality, 2008-2009
Map 12. Proportion of Households without Access to Safe Water Supply,by Barangay, 2008-2009
SAN JOSE
MAYANTOC
CAMILING
SANTA IGNACIA
SAN CLEMENTE
MONCADA
SAN MANUEL
PANIQUI
ANAO
RAMOSPURA
GERONAVICTORIA
CITY OF TARLAC
LA PAZ
CONCEPCIONCAPAS
BAMBAN
SAN JOSE
MAYANTOC
CAMILING
SANTA IGNACIA
SAN CLEMENTE
MONCADA
SAN MANUEL
PANIQUI
ANAO
RAMOSPURA
GERONAVICTORIA
CITY OF TARLAC
LA PAZ
CONCEPCIONCAPAS
BAMBAN
20.5
1.7 0.1
2.51.11.6
3.20.9
3.24.3
3.36.8
25.3
15.68.4
5.716.5
SAN JOSE
MAYANTOC
CAMILING
SANTA IGNACIA
SAN CLEMENTE
MONCADA
SAN MANUEL
PANIQUI
ANAO
RAMOSPURA
GERONAVICTORIA
CITY OF TARLAC
LA PAZ
CONCEPCIONCAPAS
BAMBAN
SAN JOSE
MAYANTOC
CAMILING
SANTA IGNACIA
SAN CLEMENTE
MONCADA
SAN MANUEL
PANIQUI
ANAO
RAMOSPURA
GERONAVICTORIA
CITY OF TARLAC
LA PAZ
CONCEPCIONCAPAS
BAMBAN
20.5
1.7 0.1
2.51.11.6
3.20.9
3.24.3
3.36.8
25.3
15.68.4
5.7
16.5
CBMS Poverty Maps: Tarlac
M unicip al i t y M ag ni t ud e P ro p o r t io nSan Jose 1638 25.3San M anuel 1014 20.5San Clemente 418 16 .5Santa Ignacia 1265 15.6M ayantoc 518 8.4Capas 1628 6.8Camiling 432 5.7La Paz 522 4.3Concepcion 852 3.3Gerona 549 3.2City Tarlac 1821 3.2Ramos 103 2.5M oncada 188 1.7Pura 75 1.6Paniqui 205 1.1V icto ria 112 0.9A nao 3 0.1
Ho useho ld s w i t ho ut access t o saf e w at er sup p ly
M unicip al i t y B ar a ng ay M ag ni t ud e P r o p o r t io n
Santa Ignacia Cabug bug an 2 66 9 6.7Gero na Santa Lucia 16 0 9 6.4San M anuel San A gust in 3 60 9 3.0Concep cio n Tinang 733 8 6.8San Jo se V illa A glip ay 8 24 8 4.9San M anuel Leg aspi 311 8 4.1San Jo se Lub ig an 18 6 8 0.9Santa Ignacia Nambalan 3 13 75.2M ayanto c Calabtangan 97 74.6Santa Ignacia B ald io s 2 68 70.2
B o t t o m 10 B ar a ng ay s

18
The Many Faces of Poverty (Volume 3)
Map 14. Proportion of Households without Access to Sanitary Toilet Facilities,by Barangay, 2008-2009
Map 13. Proportion of Households without Access to Sanitary Toilet Facilities,by Municipality, 2008-2009
SAN JOSE
MAYANTOC
CAMILING
SANTA IGNACIA
SAN CLEMENTE
MONCADA
SAN MANUEL
PANIQUI
ANAO
RAMOSPURA
GERONAVICTORIA
CITY OF TARLAC
LA PAZ
CONCEPCIONCAPAS
BAMBAN
SAN JOSE
MAYANTOC
CAMILING
SANTA IGNACIA
SAN CLEMENTE
MONCADA
SAN MANUEL
PANIQUI
ANAO
RAMOSPURA
GERONAVICTORIA
CITY OF TARLAC
LA PAZ
CONCEPCIONCAPAS
BAMBAN
8.4
5.2 0.7
1.83.74.3
4.78.9
8.5
4.96.7
5.77.7
21.6
4.5
4.3 8.0
SAN JOSE
MAYANTOC
CAMILING
SANTA IGNACIA
SAN CLEMENTE
MONCADA
SAN MANUEL
PANIQUI
ANAO
RAMOSPURA
GERONAVICTORIA
CITY OF TARLAC
LA PAZ
CONCEPCIONCAPAS
BAMBAN
SAN JOSE
MAYANTOC
CAMILING
SANTA IGNACIA
SAN CLEMENTE
MONCADA
SAN MANUEL
PANIQUI
ANAO
RAMOSPURA
GERONAVICTORIA
CITY OF TARLAC
LA PAZ
CONCEPCIONCAPAS
BAMBAN
8.4
5.2 0.7
1.83.74.3
4.78.9
8.5
4.96.7
5.77.7
21.6
4.5
4.3 8.0
CBMS Poverty Maps: Tarlac
M unicip a li t y M ag ni t ud e Pr o p o r t io nSan Jose 1409 21.6Gerona 1549 8 .9V icto ria 1070 8.5San M anuel 414 8 .4Pura 371 8 .0Capas 1841 7.7La Paz 818 6.7Concepcion 1462 5.7M oncada 583 5.2City Tarlac 2772 4 .9Santa Ignacia 368 4.7M ayantoc 278 4.5San Clemente 109 4 .3Camiling 324 4 .3Paniqui 699 3.7Ramos 74 1.8A nao 17 0.7
Ho useho ld s w i t ho ut access t o sani t a ry t o ile t f aci l i t ies
M u ni c ip a l i t y B a r a ng a y M a g n i t ud e P r o p o r t i o n
San Jo se M aamo t 4 4 7 8 2 .6C ap as Sant a Jul iana 6 78 6 8 .5C ap as M arug lu 18 7 6 5.8Gero na Sant a Lucia 8 7 52 .4C ap as B ueno 12 2 4 8 .2
Gero naSan B ar t o lo me 9 7 4 0 .9
Gero na San Jo se 114 3 9 .2C it y o f Tar lac B ant o g 12 9 3 2 .2C it y o f Tar lac Sant a M ar ia 58 2 9 .9San Jo se M o r io nes 18 6 2 9 .2
B o t t o m 10 B a r a n g a y s

The Many Faces of Poverty (Volume 3)
19
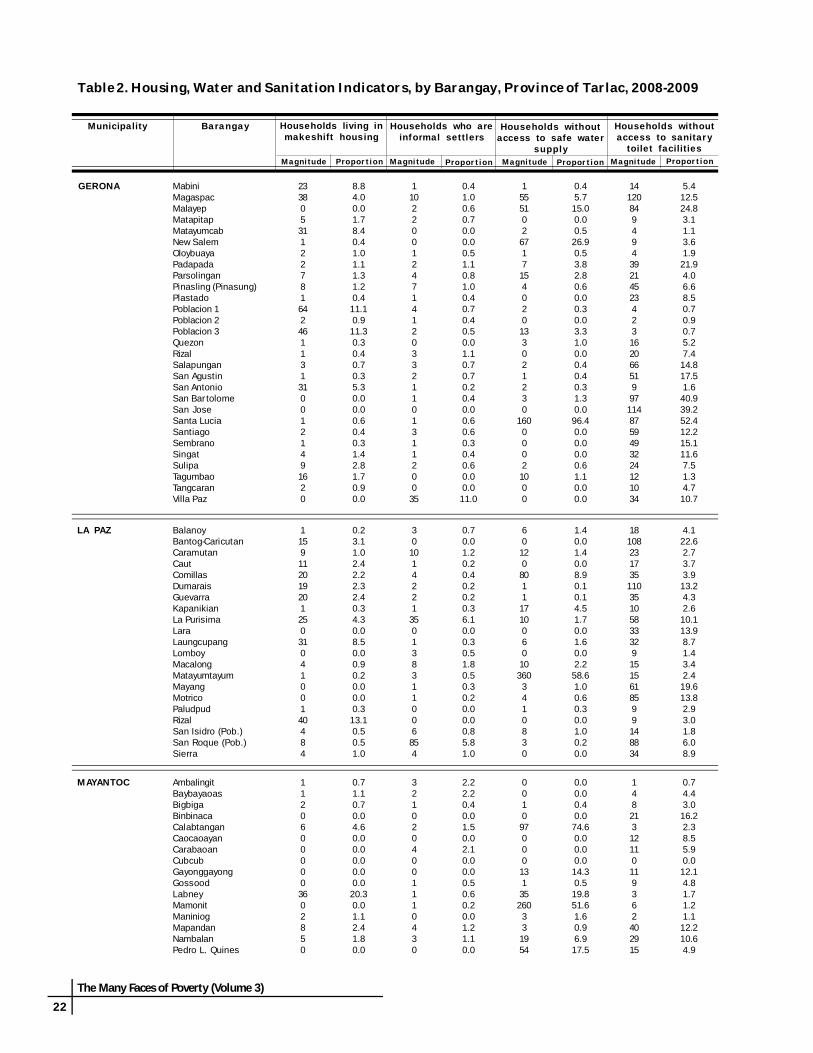
Table 2. Housing, Water and Sanitation Indicators, by Barangay, Province of Tarlac, 2008-2009
Households liv ing inmak eshif t hous ing
Households who arein f ormal sett l e rs
Household s with outaccess to safe water
supp l y
Household s with outaccess to san itar y
to i le t faci l i t ies
Ba rang a yMunic ipa l i ty
P r opor t i onP r opor t i on P r opor t i on P r opor t i onMagni tude Magni tude Magni tude Magni tude
ANAO Baguindoc (Baguinloc)BantogCamposCarmenCasiliDon RamonHernandoPoblacionRizalSan Francisco EastSan Francisco WestSan Jose Nor thSan Jose SouthSan JuanSan RoqueSanto DomingoSinenseSuaverdez
CAMI L ING Anoling 1stAnoling 2ndAnoling 3rdBacabacBacsayBiladBirbiraCacamilingan NorteCacamilingan SurCayaoanCayasanFloridaLibuegMalacampaManakemMarawiMatubogNagrambacanNagserialanPalimbo-CaarosipanPindangan 2ndPoblacion BPoblacion ESinilian 3rdSinilian CacalibosoanSinulatan 2ndSurgui 3rdTambuganTuec
CAPAS ArangurenBuenoCristo ReyCubcub (Pob.)Cutcut 1stCutcut 2ndDoloresEstrada (Calingcuan)LawyMangaManlapigMarugluO’DonnellSanta JulianaSanta LuciaSanta RitaSanto Domingo 1stSanto Domingo 2ndSanto RosarioTalaga
0.03.20.00.01.10.03.00.00.00.00.50.00.011.00.00.00.522.2
010000010200000000
0.00.80.00.00.00.00.01.20.01.70.00.00.00.00.00.00.00.0
000000000020000100
0.00.00.00.00.00.00.00.00.00.00.90.00.00.00.01.10.00.0
04002030001001300145
022120110010150010
0.01.62.80.71.10.01.01.20.00.00.50.01.04.20.00.00.50.0
1002205
14430101901270111271
11800004290
0.70.00.00.40.50.01.932.01.00.01.90.03.70.01.10.62.00.03.525.30.234.30.00.00.00.01.412.10.0
00011334140002006202101221001
0.00.00.00.20.20.71.10.94.70.00.00.00.40.00.01.80.60.00.60.20.00.31.50.81.10.00.00.40.0
0143219225011110022000003000800407040
0.00.543.942.80.55.80.02.53.70.00.01.30.40.00.00.00.00.09.50.00.02.30.00.04.60.024.61.70.0
5211503393812227231119452074812101280613
3.51.111.29.80.89.01.11.84.03.13.74.64.50.31.15.71.113.56.31.411.90.31.53.913.86.30.02.58.9
2801308949711619612327831015120
2.30.00.04.35.34.00.60.20.80.325.10.40.90.24.30.91.91.40.90.0
1212412431047012741550
17940182
0.10.80.35.80.10.32.90.02.20.00.30.73.01.50.30.034.83.71.30.2
48461
34728241
33734195441651761220591
0.33.21.00.120.723.30.40.216.19.50.333.51.816.710.00.30.41.94.30.1
7312217826104282
146225
18722767889207241640
6.048.20.41.11.58.62.60.47.06.11.365.89.368.55.05.91.42.21.23.9

20
The Many Faces of Poverty (Volume 3)
Table 2. Housing, Water and Sanitation Indicators, by Barangay, Province of Tarlac, 2008-2009
Households liv ing inmak eshif t hous ing
Households who arein f ormal sett l e rs
Household s with outaccess to safe water
supp l y
Household s with outaccess to san itar y
to i le t faci l i t ies
Ba rang a yMunic ipa l i ty
P r opor t i onP r opor t i on P r opor t i on P r opor t i onMagni tude Magni tude Magni tude Magni tude
CITY OF TARLAC AgusoAlvindia SegundoAmucaoArmeniaAsturiasAtiocBalantiBaleteBalibago IBalibago IIBalingcanawayBanabaBantogBaras-barasBatang-batangBinaugananBoraBuenavistaBuhilit (Bubulit)BurotCalingcuanCapehanCarangianCareCentralCulipatCut-cut ICut-cut IIDalayapDela PazDoloresLaoangLigtasanLourdesMabiniMaligayaMaliwaloMapalacsiaoMapaladMataderoMatatalaibParaisoPoblacionSalapunganSan CarlosSan FranciscoSan IsidroSan JoseSan Jose de UrquicoSan Juan de MataSan LuisSan ManuelSan MiguelSan NicolasSan PabloSan PascualSan RafaelSan RoqueSan SebastianSan VicenteSanta CruzSanta MariaSanto CristoSanto DomingoSanto NiñoSapang MaragulSapang TagalogSepung CalzadaSinaitSuizo
20342313041234560125344123059162104015223244016022543590437130276042151589
2057
1413719532582129099325571045
2.011.20.40.40.310.11.31.30.77.20.70.03.00.80.85.50.30.91.20.00.81.91.12.80.01.70.01.20.35.50.50.88.73.80.02.62.433.80.00.91.21.80.07.72.20.02.51.35.41.01.821.30.48.60.51.30.94.02.02.618.90.025.41.31.02.80.80.10.05.8
1273131120142714213152018040511843700092621028202287022200230500195128
26134591761552791508
12801
112647253441
12.910.20.61.40.70.00.30.46.722.61.50.51.20.30.02.30.01.80.00.71.817.50.20.90.00.00.00.73.90.52.60.42.10.50.00.21.30.70.04.86.43.10.01.40.00.01.14.41.91.051.43.63.310.725.50.43.911.40.64.10.00.528.92.71.93.70.60.40.95.2
22227159476124103342136731114127032000
3473381247007
116544833372509
165160718199308811050057111
11631823
0.20.70.43.40.319.81.38.40.23.91.11.68.50.30.30.42.03.21.21.42.32.54.94.30.00.00.028.70.59.00.20.40.916.50.00.85.35.13.31.71.00.48.30.61.90.00.514.20.40.80.00.71.01.21.55.80.46.20.81.60.02.61.84.90.55.80.32.50.50.4
19565611064365421665301912993514301217116109
1040180
168436761039065526122473082224173632015156110277428431067358111969818681
1.918.411.913.821.11.021.74.63.910.43.410.132.21.49.91.89.85.57.00.12.62.10.614.00.07.50.013.96.51.41.711.80.010.60.00.72.52.50.84.71.50.40.02.38.20.42.46.322.72.52.916.86.21.73.18.14.10.20.82.20.529.92.80.44.33.50.92.515.90.1

The Many Faces of Poverty (Volume 3)
21
Table 2. Housing, Water and Sanitation Indicators, by Barangay, Province of Tarlac, 2008-2009
Households liv ing inmak eshif t hous ing
Households who arein f ormal sett l e rs
Household s with outaccess to safe water
supp l y
Household s with outaccess to san itar y
to i le t faci l i t ies
Ba rang a yMunic ipa l i ty
P r opor t i onP r opor t i on P r opor t i on P r opor t i onMagni tude Magni tude Magni tude Magni tude
CITY OF TARLAC TarijiTibagTibaganTrinidadUngotVilla Bacolor
CONCEPC ION AlfonsoBalutuCafeCalius GuecoCaluluanCastilloCorazon de JesusCulatinganDunganDutung-A-MatasGreen VillageLilibanganMabilogMagaoMalupaMinanePanalicsianPandoParangParulungPitabunanSan Agustin (Murcia)San AntonioSan Bar tolomeSan FranciscoSan Isidro (Almendras)San Jose (Pob.)San Juan (Castro)San MartinSan Nicolas (Pob.)San Nicolas BalasSan VicenteSanta CruzSanta MariaSanta MonicaSanta RitaSanta RosaSantiagoSanto CristoSanto NiñoSanto RosarioTalimunduc MarimlaTalimunduc San MiguelTelabancaTinang
GERONA AbagonAmacalanApsayanAysonBawaBuenlagBularitCalayaanCarbonelCardonaCaturayDanzoDicolorDon BasilioLuna
358726178
6.93.43.40.41.02.4
818100152
1.60.71.30.02.20.6
470523318
0.82.80.70.74.95.5
1252127454661
2.42.016.716.96.918.7
2021
25118150001301115270022961041000001810222201151702045
0.10.00.40.528.33.10.30.90.00.00.06.70.00.30.40.12.45.20.00.00.43.01.30.30.00.70.60.00.00.00.06.20.10.02.23.20.00.17.00.22.30.00.40.05.3
55003104160600020551937412341060220123070230204
0.30.70.00.00.30.20.00.70.60.70.03.10.00.00.00.30.01.00.80.31.70.31.51.20.90.50.20.10.00.80.00.70.20.01.20.40.00.80.00.31.00.00.40.00.5
55111321420032081412011103053019052315112020000
733
0.30.70.20.50.10.50.50.22.30.20.00.00.50.60.01.10.50.80.20.70.01.10.20.00.20.00.30.40.02.40.01.70.21.11.50.10.10.20.00.30.00.00.00.086.8
68990710112852817211214833424102492219441112643535105011321420280415
111116150
164
4.714.20.03.51.119.522.45.29.60.20.36.22.52.314.80.511.319.87.87.23.64.523.17.83.19.70.30.10.00.60.03.83.84.92.04.10.04.72.317.60.35.53.30.019.4
131103083005001111
1.81.80.00.90.01.40.60.00.00.90.00.02.50.50.3
527121012122102323
7.111.80.40.30.00.20.40.21.03.70.00.60.71.01.0
191161432731124075
2287153123703650253107412525
3.014.53.29.35.812.67.49.213.25.50.02.19.412.88.1
2.60.20.21.80.30.70.65.01.60.20.40.60.90.024.1
22
The Many Faces of Poverty (Volume 3)
Table 2. Housing, Water and Sanitation Indicators, by Barangay, Province of Tarlac, 2008-2009
Households liv ing inmak eshif t hous ing
Households who arein f ormal sett l e rs
Household s with outaccess to safe water
supp l y
Household s with outaccess to san itar y
to i le t faci l i t ies
Ba rang a yMunic ipa l i ty
P r opor t i onP r opor t i on P r opor t i on P r opor t i onMagni tude Magni tude Magni tude Magni tude
GERONA MabiniMagaspacMalayepMatapitapMatayumcabNew SalemOloybuayaPadapadaParsolinganPinasling (Pinasung)PlastadoPoblacion 1Poblacion 2Poblacion 3QuezonRizalSalapunganSan AgustinSan AntonioSan Bar tolomeSan JoseSanta LuciaSantiagoSembranoSingatSulipaTagumbaoTangcaranVilla Paz
LA PAZ BalanoyBantog-CaricutanCaramutanCautComillasDumaraisGuevarraKapanikianLa PurisimaLaraLaungcupangLomboyMacalongMatayumtayumMayangMotricoPaludpudRizalSan Isidro (Pob.)San Roque (Pob.)Sierra
MAYANTOC AmbalingitBaybayaoasBigbigaBinbinacaCalabtanganCaocaoayanCarabaoanCubcubGayonggayongGossoodLabneyMamonitManiniogMapandanNambalanPedro L. Quines
233805311227816424611313100121491620
8.84.00.01.78.40.41.01.11.31.20.411.10.911.30.30.40.70.35.30.00.00.60.40.31.42.81.70.90.0
1102200124714120332110131120035
0.41.00.60.70.00.00.51.10.81.00.40.70.40.50.01.10.70.70.20.40.00.60.60.30.40.60.00.011.0
15551026717154020133021230
16000021000
0.45.715.00.00.526.90.53.82.80.60.00.30.03.31.00.00.40.40.31.30.096.40.00.00.00.61.10.00.0
1412084949439214523423162066519971148759493224121034
5.412.524.83.11.13.61.921.94.06.68.50.70.90.75.27.414.817.51.640.939.252.412.215.111.67.51.34.710.7
11591120192012503104100140484
0.23.11.02.42.22.32.40.34.30.08.50.00.90.20.00.00.313.10.50.51.0
301014221350138311006854
0.70.01.20.20.40.20.20.36.10.00.30.51.80.50.30.20.00.00.85.81.0
6012080111710060103603410830
1.40.01.40.08.90.10.14.51.70.01.60.02.258.61.00.60.30.01.00.20.0
18108231735110351058333291515618599148834
4.122.62.73.73.913.24.32.610.113.98.71.43.42.419.613.82.93.01.86.08.9
11206000003602850
0.71.10.70.04.60.00.00.00.00.020.30.01.12.41.80.0
3210204001110430
2.22.20.40.01.50.02.10.00.00.50.60.20.01.21.10.0
00109700013135260331954
0.00.00.40.074.60.00.00.014.30.519.851.61.60.96.917.5
14821312110119362402915
0.74.43.016.22.38.55.90.012.14.81.71.21.112.210.64.9

The Many Faces of Poverty (Volume 3)
23
Table 2. Housing, Water and Sanitation Indicators, by Barangay, Province of Tarlac, 2008-2009
Households liv ing inmak eshif t hous ing
Households who arein f ormal sett l e rs
Household s with outaccess to safe water
supp l y
Household s with outaccess to san itar y
to i le t faci l i t ies
Ba rang a yMunic ipa l i ty
P r opor t i onP r opor t i on P r opor t i on P r opor t i onMagni tude Magni tude Magni tude Magni tude
MAYANTOC PitombayogPoblacion NortePoblacion SurRotrottoocSan Bar tolomeSan JoseTaldiapanTangcarang
MONCADA Ablang-SapangAringinAtencioBanaoang EastBanaoang WestBaquero Nor teBaquero SurBurgosCalamayCalapanCamangaan EastCamangaan WestCamposanto 1 - Nor teCamposanto 1 - SurCamposanto 2CapaoayanLapsingMabiniMaluacPoblacion 1Poblacion 2Poblacion 3Poblacion 4RizalSan JuanSan JulianSan LeonSan PedroSan RoqueSanta Lucia EastSanta Lucia WestSanta MariaSanta MonicaTolega Nor teTolega SurTubectubangVilla
PANIQUI AbogadoAcocolaoAduasApulidBalaoangBarang (Borang)BrillanteBurgosCabayaoasanCananCarinoCayangaColibangbangCoralDapdapEstacionMabilangManaoisMatalapitapNagmisaanNancamarinan
02210002
0.00.30.30.40.00.00.00.8
414001129
1.12.40.00.00.30.31.43.5
010538321
0.01.70.81.32.10.81.40.4
3314911913410
8.82.41.50.45.13.42.73.9
0109110047621015301933612102015510101241241111605
0.00.30.03.80.33.20.00.95.12.70.63.84.87.80.21.40.78.60.81.23.11.30.05.51.32.00.40.05.12.25.00.93.20.50.412.310.0
1801221015201011100185032000148000110300060
2.50.00.90.80.60.30.03.31.50.00.30.00.32.90.00.04.11.20.01.80.60.00.00.00.39.80.00.00.06.00.00.70.00.00.01.20.0
183001001129770000040001110130010003310120
2.51.00.00.00.30.00.00.20.713.123.10.00.00.00.00.00.90.00.00.00.30.70.40.00.30.60.00.00.40.00.00.09.70.50.02.50.0
179411937121915172541015700950132401130912113203192416226
24.41.30.98.011.63.87.53.312.411.31.23.84.81.80.00.02.01.20.00.60.91.41.70.02.96.13.90.68.97.18.30.75.611.36.44.512.0
573086700013137910198130833
5.58.22.41.08.30.00.02.90.20.60.62.40.30.05.81.12.80.02.11.10.4
100022011443617003255943
10.00.00.60.30.00.40.70.90.70.60.50.32.10.00.04.51.12.22.31.50.4
56103312504229623005139
0.51.60.30.00.41.10.70.40.90.00.40.58.41.60.60.60.00.01.90.45.3
5010712529332817337966131317915
4.82.72.10.23.00.76.17.35.03.32.91.92.61.61.81.82.97.42.45.74.9

24
The Many Faces of Poverty (Volume 3)
Table 2. Housing, Water and Sanitation Indicators, by Barangay, Province of Tarlac, 2008-2009
PANIQUI NipacoPatalanPoblacion NortePoblacion SurRang-ayanSalumagueSamputSan CarlosSan IsidroSan Juan de MillaSanta InesSinigpitTablangVentenilla
PURA BaliteBuenavistaCadanglaanEstiponaLinaoMaasinMatindegMaungibNayaNilasin 1stNilasin 2ndPoblacion 1Poblacion 2Poblacion 3PorocSingat
RAMOS Coral-IlocoGuitebPancePoblacion CenterPoblacion NorthPoblacion SouthSan JuanSan RaymundoToledo
SAN CL EMENTE BallocBambanCasipoCatagudinganDaldalayapDoclong 1Doclong 2MaasinNagsabaranPit-aoPoblacion NortePoblacion Sur
SAN JOSE BurgosDavidIbaLabneyLawacamulagLubiganMaamotMababanabaMorionesPaoSan Juan de ValdezSulaVilla Aglipay
Households liv ing inmak eshif t hous ing
Households who arein f ormal sett l e rs
Household s with outaccess to safe water
supp l y
Household s with outaccess to san itar y
to i le t faci l i t ies
Ba rang a yMunic ipa l i ty
P r opor t i onP r opor t i on P r opor t i on P r opor t i onMagni tude Magni tude Magni tude Magni tude
2663219373191801073313
0.611.12.11.60.612.22.30.32.20.02.91.66.12.4
33234353
1392528113
1.00.51.53.71.00.516.60.61.41.02.30.20.20.6
13169235734111113
4.20.20.40.84.70.80.80.91.10.50.30.20.22.4
10485735936024592135919
3.20.75.50.67.11.54.30.06.528.86.17.81.73.5
1315
130114200012051
3.90.23.617.20.40.61.80.70.00.00.00.50.80.03.00.3
8413032330240110
2.40.70.70.40.01.90.91.01.70.00.81.90.00.40.60.0
2003311002011032029
0.60.00.00.41.10.60.50.00.08.50.44.71.20.70.08.6
2249396016147171922601042759
6.68.128.38.06.19.13.25.910.79.42.40.04.11.516.217.4
14733009100
1.91.14.00.00.02.00.90.00.0
0.40.20.10.00.010.90.00.00.0
13.30.00.10.00.00.40.00.00.0
73327002212
0.95.33.50.00.00.41.80.30.5
10001002000
3110050000
15103301512238
0.32.71.50.02.21.50.04.37.90.71.42.4
210610110641
0.70.50.03.60.70.00.70.30.02.21.90.3
5363107840181
142157
17.534.41.50.057.42.00.05.10.751.60.516.8
161338155510214
5.30.54.51.85.90.53.415.86.60.70.51.2
107108000510535
0.20.00.80.30.03.50.00.00.01.63.30.93.6
313031
45904212521
0.60.30.30.01.10.484.80.00.60.70.34.32.2
35147201
186160149001
133824
7.147.40.20.00.480.929.625.80.00.00.323.184.9
697317650243444735186574
16094
12.723.519.813.69.014.882.66.129.218.61.327.79.7

The Many Faces of Poverty (Volume 3)
25
Table 2. Housing, Water and Sanitation Indicators, by Barangay, Province of Tarlac, 2008-2009
Households liv ing inmak eshif t hous ing
Households who arein f ormal sett l e rs
Household s with outaccess to safe water
supp l y
Household s with outaccess to san itar y
to i le t faci l i t ies
Ba rang a yMunic ipa l i ty
P r opor t i onP r opor t i on P r opor t i on P r opor t i onMagni tude Magni tude Magni tude Magni tude
SAN MANUEL ColubotLanatLegaspiMangandingayMatarannocPacpacoPoblacionSalcedoSan AgustinSan FelipeSan JacintoSan MiguelSan NarcisoSan VicenteSanta Maria
SANTA IGNACIA BaldiosBotbotonesCaanamonganCabaruanCabugbuganCaduldulaoanCalipayanMacaguingNambalanPadapadaPilpilaPinpinasPoblacion EastPoblacion WestPugo-CecilioSan FranciscoSan SoteroSan VicenteSanta Ines CentroSanta Ines EastSanta Ines WestTaguiporoTimmaguabVargas
V ICTORI A BaculongBalayangBalbalotoBangarBantogBatangbatangBuloCabuluanCalibunganCanaremCruzLalapacMaluidMangolagoMasalasaPalacpalacSan AgustinSan AndresSan Fernando (Pob.)San FranciscoSan Gavino (Pob.)San JacintoSan Nicolas (Pob.)San VicenteSanta BarbaraSanta Lucia (Pob.)
01360201050101290
0.00.29.70.01.00.03.71.10.00.20.00.20.73.00.0
491041221200131
2.02.20.30.02.00.40.70.40.30.40.00.00.41.00.3
92
31157613
1774
3606031191
4.50.584.122.630.01.265.10.993.01.20.00.70.46.30.3
33656151719496824571117744
1.58.715.16.08.57.61.52.017.74.721.32.46.224.51.2
08122204522000700104013010042
0.030.26.80.80.032.80.713.30.00.02.10.00.00.20.00.90.03.30.00.20.00.00.9
900001009212552170119170041
2.40.00.00.00.00.70.00.02.20.40.315.51.10.47.10.00.64.80.21.60.00.00.9
268406
266260
31324690048717132790132
70.21.50.02.396.71.52.00.075.244.02.70.00.00.836.44.00.60.80.41.62.10.02.90.4
33821229015172132718130776991716
0.81.12.58.10.71.53.10.00.20.95.113.00.78.70.41.90.67.716.61.323.20.91.53.5
120521251005030771491116211237
0.10.30.01.20.40.45.30.40.00.01.40.00.60.02.11.90.111.20.20.40.21.00.40.21.211.3
03100301111725332202250954814333
0.00.50.20.00.01.20.00.42.04.00.61.20.60.70.60.50.00.54.10.017.60.71.63.33.40.9
00123410301219000333602108590
0.00.00.20.57.20.40.01.10.00.20.64.40.00.00.00.80.40.71.00.00.41.71.61.20.90.0
2279118111246392379564524781829293060343625158
13924
2.911.90.24.323.50.89.713.74.218.516.110.44.517.05.47.94.36.99.811.96.64.23.01.914.17.3

26
The Many Faces of Poverty (Volume 3)
CBMS Poverty Maps: Tarlac
Map 15. Proportion of Children 6-12 years old Not Attending ElementarySchool, by Municipality, 2008-2009
Map 16. Proportion of Children 6-12 years old Not Attending ElementarySchool, by Barangay, 2008-2009
SAN JOSE
MAYANTOC
CAMILING
SANTA IGNACIA
SAN CLEMENTE
MONCADA
SAN MANUEL
PANIQUI
ANAO
RAMOSPURA
GERONAVICTORIA
CITY OF TARLAC
LA PAZ
CONCEPCIONCAPAS
BAMBAN
SAN JOSE
MAYANTOC
CAMILING
SANTA IGNACIA
SAN CLEMENTE
MONCADA
SAN MANUEL
PANIQUI
ANAO
RAMOSPURA
GERONAVICTORIA
CITY OF TARLAC
LA PAZ
CONCEPCIONCAPAS
BAMBAN
23.1
19.0 15.3
20.025.817.8
19.726.3
20.5
29.219.4
17.221.0
29.5
22.519.8
21.4
SAN JOSE
MAYANTOC
CAMILING
SANTA IGNACIA
SAN CLEMENTE
MONCADA
SAN MANUEL
PANIQUI
ANAO
RAMOSPURA
GERONAVICTORIA
CITY OF TARLAC
LA PAZ
CONCEPCIONCAPAS
BAMBAN
SAN JOSE
MAYANTOC
CAMILING
SANTA IGNACIA
SAN CLEMENTE
MONCADA
SAN MANUEL
PANIQUI
ANAO
RAMOSPURA
GERONAVICTORIA
CITY OF TARLAC
LA PAZ
CONCEPCIONCAPAS
BAMBAN
23.1
19.0 15.3
20.025.817.8
19.726.3
20.5
29.219.4
17.221.0
29.5
22.519.8
21.4
M unicip al i t y M ag ni t ud e P ro p o r t io nSan Jose 1589 29.5City Tarlac 11227 29 .2Gerona 2790 26 .3Paniqui 2865 25.8San M anuel 729 23.1Santa Ignacia 1142 22.5San Clemente 338 21.4Capas 3937 21.0V icto ria 1716 20.5Ramos 545 20 .0M ayantoc 734 19 .8Pura 586 19 .7La Paz 1783 19 .4M oncada 1458 19 .0Camiling 898 17.8Concepcion 3559 17.2A nao 212 15.3
C hi ld ren no t at t end ing e lement ary scho o l ( 6 - 12 years o ld )
M unicip al it y B ar ang ay M ag nit ud e Pr o p o r t io n
City of Tarlac M abini 88 10 0.0City of Tarlac Santa Cruz 439 98.0City of Tarlac Tariji 336 97.4City of Tarlac San Ro que 706 86.8Gerona M atayumcab 128 63.1City of Tarlac San Isidro 794 60.1Santa Ignacia Calipayan 90 51.4City of Tarlac Tibag 984 51.3Gerona Santa Lucia 43 50.6San Jose M aamot 261 47.5
B o t t o m 10 B ar ang a ys

The Many Faces of Poverty (Volume 3)
27
Map 18. Proportion of Children 13-16 years old Not Attending High School,by Barangay, 2008-2009
Map 17. Proportion of Children 13-16 years old Not Attending High School,by Municipality, 2008-2009
SAN JOSE
MAYANTOC
CAMILING
SANTA IGNACIA
SAN CLEMENTE
MONCADA
SAN MANUEL
PANIQUI
ANAO
RAMOSPURA
GERONAVICTORIA
CITY OF TARLAC
LA PAZ
CONCEPCIONCAPAS
BAMBAN
SAN JOSE
MAYANTOC
CAMILING
SANTA IGNACIA
SAN CLEMENTE
MONCADA
SAN MANUEL
PANIQUI
ANAO
RAMOSPURA
GERONAVICTORIA
CITY OF TARLAC
LA PAZ
CONCEPCIONCAPAS
BAMBAN
38.8
36.7 31.2
32.236.837.2
27.342.8
38.6
37.044.6
40.338.1
56.5
38.3 36.9
34.7
SAN JOSE
MAYANTOC
CAMILING
SANTA IGNACIA
SAN CLEMENTE
MONCADA
SAN MANUEL
PANIQUI
ANAO
RAMOSPURA
GERONAVICTORIA
CITY OF TARLAC
LA PAZ
CONCEPCIONCAPAS
BAMBAN
SAN JOSE
MAYANTOC
CAMILING
SANTA IGNACIA
SAN CLEMENTE
MONCADA
SAN MANUEL
PANIQUI
ANAO
RAMOSPURA
GERONAVICTORIA
CITY OF TARLAC
LA PAZ
CONCEPCIONCAPAS
BAMBAN
38.8
36.7 31.2
32.236.837.2
27.342.8
38.6
37.044.6
40.338.1
56.5
38.3 36.9
34.7
CBMS Poverty Maps: Tarlac
M unic ip a l it y M ag ni t ud e Pr o p o r t io nSan Jose 1778 56 .5City Tarlac 9318 44 .6Gerona 2542 42 .8Concepcion 4386 40 .3San M anuel 703 38 .8V icto ria 1767 38 .6M ayantoc 782 38 .3Capas 3797 38.1Camiling 1012 37.2La Paz 1876 37.0Santa Ignacia 1092 36 .9Paniqui 2303 36 .8M oncada 1489 36 .7San Clemente 330 34 .7Ramos 475 32 .2A nao 250 31.2Pura 470 27.3
C hi ld ren no t a t t end ing hig h scho o l ( 13 - 16 years o ld )
M unicip a li t y B a r ang ay M ag ni t ud e Pr o p o r t io n
Cit y of Tarlac M abini 45 10 0.0Cit y of Tarlac Santa Cruz 2 38 99.6Cit y of Tarlac Tariji 18 0 96.3Gerona M atayumcab 101 90.2Cit y of Tarlac San Ro que 4 64 88 .7San Jo se M aamot 2 36 82.8M o ncad a San Leon 60 8 1.1San Jo se David 111 81.0Gerona Santa Lucia 35 79.5Capas M aruglu 88 77.2
B o t t o m 10 B ar ang a ys

28
The Many Faces of Poverty (Volume 3)
Map 19. Proportion of Children 6-16 years old Not Attending School,by Municipality, 2008-2009
Map 20. Proportion of Children 6-16 years old Not Attending School,by Barangay, 2008-2009
SAN JOSE
MAYANTOC
CAMILING
SANTA IGNACIA
SAN CLEMENTE
MONCADA
SAN MANUEL
PANIQUI
ANAO
RAMOSPURA
GERONAVICTORIA
CITY OF TARLAC
LA PAZ
CONCEPCIONCAPAS
BAMBAN
SAN JOSE
MAYANTOC
CAMILING
SANTA IGNACIA
SAN CLEMENTE
MONCADA
SAN MANUEL
PANIQUI
ANAO
RAMOSPURA
GERONAVICTORIA
CITY OF TARLAC
LA PAZ
CONCEPCIONCAPAS
BAMBAN
15.0
12.4 7.9
12.215.111.5
12.716.5
7.8
13.8
13.422.9
13.313.8
24.7
14.9
11.1
SAN JOSE
MAYANTOC
CAMILING
SANTA IGNACIA
SAN CLEMENTE
MONCADA
SAN MANUEL
PANIQUI
ANAO
RAMOSPURA
GERONAVICTORIA
CITY OF TARLAC
LA PAZ
CONCEPCIONCAPAS
BAMBAN
SAN JOSE
MAYANTOC
CAMILING
SANTA IGNACIA
SAN CLEMENTE
MONCADA
SAN MANUEL
PANIQUI
ANAO
RAMOSPURA
GERONAVICTORIA
CITY OF TARLAC
LA PAZ
CONCEPCIONCAPAS
BAMBAN
15.0
12.4 7.9
12.215.111.5
12.716.5
7.8
13.8
13.422.9
13.313.8
24.7
14.9
11.1
CBMS Poverty Maps: Tarlac
M unicip al i t y M ag ni t ud e Pr o p o r t io nSan Jose 2110 24 .7City Tarlac 13574 22 .9Gerona 2734 16.5Paniqui 2622 15.1San M anuel 743 15.0M ayantoc 857 14.9Capas 3974 13.8V icto ria 1788 13.8La Paz 1913 13.4Concepcion 4210 13.3Santa Ignacia 1026 12.7M oncada 1463 12.4Ramos 511 12.2Camiling 895 11.5San Clemente 281 11.1A nao 173 7.9Pura 364 7.8
C hi ld ren no t a t t end ing scho o l ( 6 - 16 year s o ld )
M unic ip a l it y B a r ang ay M a g ni t ud e P r o p o r t io n
Cit y of Tarlac M ab ini 13 3 10 0.0Cit y of Tarlac Santa Cruz 6 73 9 8.0Cit y of Tarlac Tariji 516 9 6.6Cit y of Tarlac San Roq ue 1130 8 4.6Gerona M atayumcab 20 9 6 6.3Cit y of Tarlac San Isid ro 1171 57.1Gerona Santa Lucia 72 55.8Cit y of Tarlac Tibag 13 85 47.2
M o ncad a San Leo n 115 46 .7
San Jo se M aamot 3 73 44 .7
B o t t o m 10 B a r ang a ys

The Many Faces of Poverty (Volume 3)
29
Table 3. Education Indicators, by Barangay, Province of Tarlac, 2008-2009
Number o fch i ld ren
( 6 -12 yearsold)
Chi ld ren nota ttend in g
e lementar y school(6-12 years old )
Number o fch i ld ren( 1 3 - 1 6
years old)
Chi ld ren notattend i ng h igh
schoo l(13-16 years old )
Number o fch i ld ren
( 6 -16 yearsold)
Chi ld ren notattend ing school(6-16 years old )
Ba rang a yMunic ipa l i ty
M ag n i tude Magni tude Magni tudeP r opor t i on P r opor t i on P r opor t i on
ANAO Baguindoc (Baguinloc)BantogCamposCarmenCasiliDon RamonHernandoPoblacionRizalSan Francisco EastSan Francisco WestSan Jose Nor thSan Jose SouthSan JuanSan RoqueSanto DomingoSinenseSuaverdez
CAMI L ING Anoling 1stAnoling 2ndAnoling 3rdBacabacBacsayBiladBirbiraCacamilingan NorteCacamilingan SurCayaoanCayasanFloridaLibuegMalacampaManakemMarawiMatubogNagrambacanNagserialanPalimbo-CaarosipanPindangan 2ndPoblacion BPoblacion ESinilian 3rdSinilian CacalibosoanSinulatan 2ndSurgui 3rdTambuganTuec
CAPAS ArangurenBuenoCristo ReyCubcub (Pob.)Cutcut 1stCutcut 2ndDoloresEstrada (Calingcuan)LawyMangaManlapigMarugluO’DonnellSanta JulianaSanta LuciaSanta RitaSanto Domingo 1stSanto Domingo 2ndSanto RosarioTalaga
3079438314152484783761196052609948118147
4176122191291781971071861020
13.321.514.314.514.917.325.019.120.510.516.011.719.611.718.212.58.513.6
254027586824361841517332323069307572
1214914179153121125111322242928
48.035.033.324.125.037.541.716.729.321.634.234.440.66.731.913.338.738.9
551197014120976846512412719292849016878193219
3101091696678162921332222
5.58.414.36.47.711.87.19.25.66.38.32.210.72.27.73.811.410.0
102119553462582301362691734432109578170632002262323235331821189135378017419392
12248524844255039551510932636403425950562324712332019
11.820.214.515.018.719.118.418.722.511.415.613.818.918.89.518.017.713.018.116.915.726.525.817.818.915.019.010.420.7
4564501961271537815310820135431675381081069
10816514413558832347939859
930238449613753405614106311524314325666832518120373022
20.046.946.042.938.639.947.434.637.025.046.225.933.541.339.522.229.244.429.634.645.861.543.121.74.342.639.830.637.3
14718310554238538321442228164451638942451013083323234051846234614721860127267291151
32524755464124831571211822526203175167912810220152317
2.013.722.913.814.116.75.611.411.07.815.67.413.29.05.08.46.09.45.09.814.526.319.04.63.315.75.67.911.3
896289370645113069328143741562318249284198092514023113747401028823
18812369881254191159653086563119457354255606582193157
21.042.618.818.019.420.519.517.419.720.425.341.923.138.318.219.317.411.118.819.1
51313120022316714844092228001411451141139485824145209402476421
201977627522620713951306455288462347247567087155124
39.274.038.132.533.742.834.023.038.331.935.977.240.671.530.038.633.521.632.629.5
140942057086821977141612235962362459394398311914102226456583114215041244
20417171559216179133344544437123478473252566369104110
14.540.712.58.710.912.710.95.719.29.69.430.915.333.511.312.310.86.06.98.8

30
The Many Faces of Poverty (Volume 3)
Table 3. Education Indicators, by Barangay, Province of Tarlac, 2008-2009
Number o fch i ld ren
( 6 -12 yearsold)
Chi ld ren nota ttend in g
e lementar y school(6-12 years old )
Number o fch i ld ren( 1 3 - 1 6
years old)
Chi ld ren notattend i ng h igh
schoo l(13-16 years old )
Number o fch i ld ren
( 6 -16 yearsold)
Chi ld ren notattend ing school(6-16 years old )
Ba rang a yMunic ipa l i ty
M ag n i tude Magni tude Magni tudeP r opor t i on P r opor t i on P r opor t i on
CITY OF TARLAC AgusoAlvindia SegundoAmucaoArmeniaAsturiasAtiocBalantiBaleteBalibago IBalibago IIBalingcanawayBanabaBantogBaras-barasBatang-batangBinaugananBoraBuenavistaBuhilit (Bubulit)BurotCalingcuanCapehanCarangianCareCentralCulipatCut-cut ICut-cut IIDalayapDela PazDoloresLaoangLigtasanLourdesMabiniMaligayaMaliwaloMapalacsiaoMapaladMataderoMatatalaibParaisoPoblacionSalapunganSan CarlosSan FranciscoSan IsidroSan JoseSan Jose de UrquicoSan Juan de MataSan LuisSan ManuelSan MiguelSan NicolasSan PabloSan PascualSan RafaelSan RoqueSan SebastianSan VicenteSanta CruzSanta MariaSanto CristoSanto DomingoSanto NiñoSapang MaragulSapang TagalogSepung CalzadaSinaitSuizo
666209323523255268265603302348739140350466239439110163194515204297103954855410759859449357307389322264884949316928520117875191821922835313219522545153947541000100843936578981383919214481451461601351525715533318588
173477210150557113866651733949993799224259954357235138891712225150816391605788107221129235337912024952657941996291811454052511041041937062007544392935343336511211063108
26.022.522.319.319.620.526.822.921.918.723.427.914.021.215.522.720.025.830.418.421.119.222.625.216.115.920.326.233.422.720.523.418.721.6100.021.723.718.727.126.421.223.111.122.422.818.460.120.924.417.720.619.240.524.923.730.524.586.823.839.398.020.024.021.324.624.215.720.619.818.4
3661141873051081451323121431684007621124712125761808427211017056728129461334322161841441861941404527451540550119101126715120981557315071242722344325865002502064755235411108239671178357821383277160290
15153721364845731324972157417281599732344581295028315977178
2271008063776943458019110123673777844937524991985410582104294233110102137464160477238204031233979813777117
41.346.538.544.644.431.055.342.334.342.939.353.934.132.848.837.752.542.553.629.826.429.449.956.626.227.924.252.546.343.543.841.435.830.7100.029.237.124.946.056.337.329.226.740.837.833.568.339.143.538.635.024.150.246.644.054.828.888.729.643.199.629.934.237.340.449.125.649.548.140.3
10323235108283634133979154455161139216561713360696171243278787314467160682984816892
12916655414515755164041337681446109713532027987863333932650820521459378787628118615861508689571126413361380302968721226324319223461098810478878
21054691415548821645175200426477549835426275355832119778165
313148527198605413378199953374429924474640
11712357910177106549305961221471130102795673224139224488816185126
20.316.713.517.015.211.620.717.911.514.517.619.411.410.815.014.120.517.322.39.511.112.420.023.89.29.55.424.222.39.615.717.011.613.4100.010.213.88.724.423.115.311.712.113.914.17.957.116.120.912.812.38.934.620.213.921.411.684.67.426.298.010.415.616.011.519.18.019.917.814.4

The Many Faces of Poverty (Volume 3)
31
Table 3. Education Indicators, by Barangay, Province of Tarlac, 2008-2009
Number o fch i ld ren
( 6 -12 yearsold)
Chi ld ren nota ttend in g
e lementar y school(6-12 years old )
Number o fch i ld ren( 1 3 - 1 6
years old)
Chi ld ren notattend i ng h igh
schoo l(13-16 years old )
Number o fch i ld ren
( 6 -16 yearsold)
Chi ld ren notattend ing school(6-16 years old )
Ba rang a yMunic ipa l i ty
M ag n i tude Magni tude Magni tudeP r opor t i on P r opor t i on P r opor t i on
CITY OF TARLAC TarijiTibagTibaganTrinidadUngotVilla Bacolor
CONCEPC ION AlfonsoBalutuCafeCalius GuecoCaluluanCastilloCorazon de JesusCulatinganDunganDutung-A-MatasGreen VillageLilibanganMabilogMagaoMalupaMinanePanalicsianPandoParangParulungPitabunanSan Agustin (Murcia)San AntonioSan Bar tolomeSan FranciscoSan Isidro (Almendras)San Jose (Pob.)San Juan (Castro)San MartinSan Nicolas (Pob.)San Nicolas BalasSan VicenteSanta CruzSanta MariaSanta MonicaSanta RitaSanta RosaSantiagoSanto CristoSanto NiñoSanto RosarioTalimunduc MarimlaTalimunduc San MiguelTelabancaTinang
GERONA AbagonAmacalanApsayanAysonBawaBuenlagBularitCalayaanCarbonelCardonaCaturayDanzoDicolorDon BasilioLuna
3461920669184480316
336984129438080
97.451.319.323.416.725.3
1881013325100276148
1806241594710689
96.361.848.947.038.460.1
5342933994284756464
516138520949111110
96.647.221.017.314.723.7
1161597329148626580241410127731263179433264205507226433523255476834412270114338210786483745141320867427386654859074618961725226932812728
14094482310190405526126523478583310026659146751558788177612351178836632138481781038812226923238614
119
12.115.714.615.516.115.516.613.420.517.219.819.018.022.016.119.711.515.017.418.015.818.621.132.615.516.021.818.121.618.416.015.420.517.620.618.814.916.413.814.912.714.118.633.316.3
6813321789037932114121474378138852151339525512124527414119646523014254321857731515276195983621244322393613569431613513416612397
11379952814316757951414973347585457651779956931751207222565233113691100421915819098118172411526975772
197
16.623.853.431.137.752.040.444.418.939.452.940.034.963.947.429.842.131.436.139.747.437.652.250.741.429.840.535.940.033.151.342.952.846.844.041.032.748.343.648.151.156.046.418.249.6
1842929507238100590138262420111094012646483973007623476787973966721299642412168660016559635272760830610363971298787951110228393338740349424
1125
63587424136170549619150672792109435841669651851511251192035623210964610141214562179496162221635471744
215
3.46.214.610.113.518.914.115.49.513.516.710.214.227.514.37.611.89.712.012.912.611.619.528.912.09.314.011.311.56.316.613.420.714.116.711.910.114.77.817.514.017.615.017.419.1
480415338157232291376289148334150217225141198
147967331661077260331074057593244
30.623.321.619.728.436.819.120.822.332.026.726.326.222.722.2
23221017499145155177166531869110415069119
1219068305966866227833343573440
52.242.939.130.340.742.648.637.350.944.636.341.338.049.333.6
712625512256377446553455201520241321375210317
131883822621067960251274055543741
18.414.17.48.616.423.814.313.212.424.416.617.114.417.612.9

32
The Many Faces of Poverty (Volume 3)
Table 3. Education Indicators, by Barangay, Province of Tarlac, 2008-2009
Number o fch i ld ren
( 6 -12 yearsold)
Chi ld ren nota ttend in g
e lementar y school(6-12 years old )
Number o fch i ld ren( 1 3 - 1 6
years old)
Chi ld ren notattend i ng h igh
schoo l(13-16 years old )
Number o fch i ld ren
( 6 -16 yearsold)
Chi ld ren notattend ing school(6-16 years old )
Ba rang a yMunic ipa l i ty
M ag n i tude Magni tude Magni tudeP r opor t i on P r opor t i on P r opor t i on
GERONA MabiniMagaspacMalayepMatapitapMatayumcabNew SalemOloybuayaPadapadaParsolinganPinasling (Pinasung)PlastadoPoblacion 1Poblacion 2Poblacion 3QuezonRizalSalapunganSan AgustinSan AntonioSan Bar tolomeSan JoseSanta LuciaSantiagoSembranoSingatSulipaTagumbaoTangcaranVilla Paz
LA PAZ BalanoyBantog-CaricutanCaramutanCautComillasDumaraisGuevarraKapanikianLa PurisimaLaraLaungcupangLomboyMacalongMatayumtayumMayangMotricoPaludpudRizalSan Isidro (Pob.)San Roque (Pob.)Sierra
MAYANTOC AmbalingitBaybayaoasBigbigaBinbinacaCalabtanganCaocaoayanCarabaoanCubcubGayonggayongGossoodLabneyMamonitManiniogMapandanNambalanPedro L. Quines
18756117415220311312012234644520436814227515818331018435713717285258188189180504107200
40157604512830242888109577133503631926283444443543759441412155
21.428.034.529.663.126.520.023.025.424.527.919.323.218.222.816.929.733.723.232.125.650.620.919.731.224.428.019.627.5
1093511161051127871651942741062009115793861801062117098441529710511126759109
39137503110140322781112425538523542774092306335724345411252145
35.839.043.129.590.251.345.141.542.040.939.627.541.833.137.648.842.837.743.642.964.379.547.444.342.936.946.835.641.3
296912290257315191191187540719310568233432251269490290568207270129410285294291771166309
261745225209223321102110414821451925734092276972683673341321763
8.819.117.99.766.311.517.311.218.915.313.28.59.010.47.69.314.913.816.213.025.655.816.612.624.811.717.110.220.4
3054436243727595896362854101392864802764142674822542104791146315
58781288913111519364822654925081396766407819359
19.017.620.523.917.319.530.322.520.018.718.919.218.119.614.613.926.019.016.316.818.7
144251343206410299359146241102154266156235122275125118286670161
5296142731081661695511329589164734372553811220364
36.138.241.435.426.355.547.137.746.928.437.734.341.031.135.226.244.032.239.230.339.8
44969496757811698889954316512414407464326493897573793287651816476
4490149921061622455912321601015158386366319319467
9.813.015.415.99.118.224.613.718.98.713.613.511.88.99.88.317.49.512.210.714.1
94381808256102826445116139256109197221213
137273371216101111615116325140
13.818.415.040.212.511.819.515.624.49.543.919.914.716.223.118.8
482110265275270244152861376290126101
1364145121832121613604323355338
27.128.640.269.244.434.645.750.039.025.069.831.437.138.942.137.6
14259282147831541528886168225393171287347314
126386411112491210994317348137
8.510.213.543.513.37.115.810.214.06.044.010.99.911.823.311.8

The Many Faces of Poverty (Volume 3)
33
Table 3. Education Indicators, by Barangay, Province of Tarlac, 2008-2009
Number o fch i ld ren
( 6 -12 yearsold)
Chi ld ren nota ttend in g
e lementar y school(6-12 years old )
Number o fch i ld ren( 1 3 - 1 6
years old)
Chi ld ren notattend i ng h igh
schoo l(13-16 years old )
Number o fch i ld ren
( 6 -16 yearsold)
Chi ld ren notattend ing school(6-16 years old )
Ba rang a yMunic ipa l i ty
M ag n i tude Magni tude Magni tudeP r opor t i on P r opor t i on P r opor t i on
MAYANTOC PitombayogPoblacion NortePoblacion SurRotrottoocSan Bar tolomeSan JoseTaldiapanTangcarang
MONCADA Ablang-SapangAringinAtencioBanaoang EastBanaoang WestBaquero Nor teBaquero SurBurgosCalamayCalapanCamangaan EastCamangaan WestCamposanto 1 - Nor teCamposanto 1 - SurCamposanto 2CapaoayanLapsingMabiniMaluacPoblacion 1Poblacion 2Poblacion 3Poblacion 4RizalSan JuanSan JulianSan LeonSan PedroSan RoqueSanta Lucia EastSanta Lucia WestSanta MariaSanta MonicaTolega Nor teTolega SurTubectubangVilla
PANIQUI AbogadoAcocolaoAduasApulidBalaoangBarang (Borang)BrillanteBurgosCabayaoasanCananCarinoCayangaColibangbangCoralDapdapEstacionMabilangManaoisMatalapitapNagmisaanNancamarinan
23535531714321019189169
4365784039321722
18.318.324.628.018.616.819.113.0
9521917578111907296
2281533344362330
23.237.030.342.339.640.031.931.3
330574492221321281161265
3279723347342131
474264662012172251812921221692461862122393213822212677111921710013020726035917211717611616526424911721736427
824494228282748142843334262747637421026531826465056743042152853351924922
17.316.713.620.913.012.414.916.411.516.617.517.719.825.923.119.918.915.714.121.824.418.020.322.219.415.643.025.923.912.917.020.914.116.211.125.37.7
260117348510112390191428610778981061641811141464364112677813413819774629765771801547411520629
37.725.638.238.830.040.732.228.931.031.435.528.236.744.351.240.342.226.725.634.431.350.744.948.536.825.981.130.551.533.835.123.734.424.327.846.631.0
73438110028631834827148316425535326431034548556333541311418332916720834139855624617927318124244440319133257056
11423104220413339172841193059109773535822332534494736115126172232491427944
15.56.010.014.76.311.812.28.110.411.011.67.29.717.122.513.710.48.57.012.010.015.016.414.411.86.546.76.722.33.99.17.212.27.38.116.57.1
9830133330502955132738223647847343391122353435655051601850222741531832969
61217320438444916081267352309642176196251137438320140264238424
14672399910341136582661485954522913297315754108
23.941.619.125.822.925.616.024.323.321.423.233.527.620.721.230.130.322.121.622.725.5
36096117196289893715017118632980961608730018277137140235
1364541781064016515876982328513113210424505474
37.846.935.039.836.744.943.234.033.940.930.028.829.231.935.644.057.131.236.538.631.5
972269321580738249118417523495971256292411224738502217401378659
1287444681364917685850933433423114013614606489
13.227.513.711.718.419.714.416.311.110.19.613.311.310.213.819.027.16.515.016.913.5
9.713.814.614.914.612.113.011.7

34
The Many Faces of Poverty (Volume 3)
Table 3. Education Indicators, by Barangay, Province of Tarlac, 2008-2009
PANIQUI NipacoPatalanPoblacion NortePoblacion SurRang-ayanSalumagueSamputSan CarlosSan IsidroSan Juan de MillaSanta InesSinigpitTablangVentenilla
PURA BaliteBuenavistaCadanglaanEstiponaLinaoMaasinMatindegMaungibNayaNilasin 1stNilasin 2ndPoblacion 1Poblacion 2Poblacion 3PorocSingat
RAMOS Coral-IlocoGuitebPancePoblacion CenterPoblacion NorthPoblacion SouthSan JuanSan RaymundoToledo
SAN CL EMENTE BallocBambanCasipoCatagudinganDaldalayapDoclong 1Doclong 2MaasinNagsabaranPit-aoPoblacion NortePoblacion Sur
SAN JOSE BurgosDavidIbaLabneyLawacamulagLubiganMaamotMababanabaMorionesPaoSan Juan de ValdezSulaVilla Aglipay
1343021003689272324610173234118201227302293
221032991608614916442631555435958
16.434.129.823.231.646.026.924.326.912.727.418.919.519.8
931805353631282093388214469123130171180
2274182943812013232722451345359
23.741.134.025.929.757.439.139.050.034.841.526.231.032.8
22748215381052400533948255378187324357473473
16112249904921815033881745293563
7.023.216.28.612.340.915.812.923.39.113.98.17.413.3
233350106472178103128207119152144140144161116220
45832585342730442334302719251837
19.323.723.618.019.126.223.421.319.322.420.819.313.215.515.516.8
124196692639951110124817985699411061107
3747317923921301923232528271236
29.824.044.930.023.217.619.124.223.529.127.136.229.824.519.733.6
357546175735277154238331200231229209238271177327
2434315820612291820181617231028
6.76.217.77.97.23.95.08.89.08.77.97.77.18.55.68.6
53645052218021131372172263
10811383324048153670
20.125.115.917.819.015.320.820.926.6
259248341124871613783136
808814530193671753
31.035.542.524.221.822.418.920.539.0
795698863304298474109255399
9012913421152562170
11.318.515.56.95.05.35.58.217.5
2101183298901038327391161117201
412310141925127819381940
19.519.531.314.321.124.314.528.620.923.616.219.9
1237127536550631455410480117
423115171818165824422128
34.143.755.632.127.736.025.440.044.440.426.323.9
33318959151155153146418145265197318
312618723147771139919
9.313.830.54.614.89.24.818.47.614.74.66.0
447217792271183206549370582265223550726
12473232484451261831477444170238
27.733.629.317.724.024.847.522.425.327.919.731.032.8
27013841417793138285224365178111328428
1621112146941722368318911947197238
71735512064482763448345949474433348781154
1631442436754723738120011846242307
22.740.620.115.019.620.944.713.621.126.613.827.626.6
60.081.051.739.044.152.282.837.151.866.942.360.155.6
Number o fch i ld ren
( 6 -12 yearsold)
Chi ld ren nota ttend in g
e lementar y school(6-12 years old )
Number o fch i ld ren( 1 3 - 1 6
years old)
Chi ld ren notattend i ng h igh
schoo l(13-16 years old )
Number o fch i ld ren
( 6 -16 yearsold)
Chi ld ren notattend ing school(6-16 years old )
Ba rang a yMunic ipa l i ty
M ag n i tude Magni tude Magni tudeP r opor t i on P r opor t i on P r opor t i on

The Many Faces of Poverty (Volume 3)
35
Table 3. Education Indicators, by Barangay, Province of Tarlac, 2008-2009
Number o fch i ld ren
( 6 -12 yearsold)
Chi ld ren nota ttend in g
e lementar y school(6-12 years old )
Number o fch i ld ren( 1 3 - 1 6
years old)
Chi ld ren notattend i ng h igh
schoo l(13-16 years old )
Number o fch i ld ren
( 6 -16 yearsold)
Chi ld ren notattend ing school(6-16 years old )
Ba rang a yMunic ipa l i ty
M ag n i tude Magni tude Magni tudeP r opor t i on P r opor t i on P r opor t i on
SAN MANUEL ColubotLanatLegaspiMangandingayMatarannocPacpacoPoblacionSalcedoSan AgustinSan FelipeSan JacintoSan MiguelSan NarcisoSan VicenteSanta Maria
SANTA IGNACIA BaldiosBotbotonesCaanamonganCabaruanCabugbuganCaduldulaoanCalipayanMacaguingNambalanPadapadaPilpilaPinpinasPoblacion EastPoblacion WestPugo-CecilioSan FranciscoSan SoteroSan VicenteSanta Ines CentroSanta Ines EastSanta Ines WestTaguiporoTimmaguabVargas
V ICTORI A BaculongBalayangBalbalotoBangarBantogBatangbatangBuloCabuluanCalibunganCanaremCruzLalapacMaluidMangolagoMasalasaPalacpalacSan AgustinSan AndresSan Fernando (Pob.)San FranciscoSan Gavino (Pob.)San JacintoSan Nicolas (Pob.)San VicenteSanta BarbaraSanta Lucia (Pob.)
145242254158141156203289239331137274151218213
4069703622315453401004056312859
27.628.527.622.815.619.926.618.316.730.229.220.420.512.827.7
621541958481671051841221628216298139113
196672333023395445725067385045
30.642.936.939.337.034.337.129.336.944.461.041.438.836.039.8
207396449242222223308473361493219436249357326
2267803725282749501156366364434
10.616.917.815.311.312.68.810.413.923.328.815.114.512.310.4
254197231162157951758724733923910128336718829410628525327030446306233
403840392722901340594917466746703165657155139049
15.720.417.524.117.223.451.419.416.217.422.217.216.522.024.623.829.222.925.728.918.128.329.421.0
1271261229598461185614816614156168232911685318317515914427162177
362767271717652445504214478541573963665659117463
28.323.154.928.417.338.655.155.830.430.130.725.028.542.945.133.973.634.637.737.341.040.745.735.6
38132335325725514129314339550538015745159927946215946842842944873468410
262944241227124193944371327664558484250445899051
6.89.412.59.34.719.642.313.39.98.710.38.46.113.116.112.630.29.011.710.412.912.319.212.4
592435289294266152322160299278226318414293187238476298355270325345357272705226
115856266562859397458435576614836986767426976736814055
19.419.521.522.421.118.418.324.424.720.919.017.318.420.825.715.120.622.518.915.621.222.020.425.019.924.3
2942611661571538317466177150106186195145113157258156204117211198183172380112
1241095370523253307957467978604855904878475489627715443
42.241.832.144.634.038.630.545.544.638.043.442.540.041.442.535.034.930.838.240.225.644.933.944.840.538.4
8866964554514192354962264764283325046094383003957344545593875365435404441085338
1311156780563556446465428070654245964368434483568117245
14.816.514.817.713.414.911.319.513.415.212.715.911.514.814.011.413.19.512.211.18.215.310.418.215.913.3

36
The Many Faces of Poverty (Volume 3)
CBMS Poverty Maps: Tarlac
Map 22. Proportion of Households with Income Below the Poverty Threshold,by Barangay, 2008-2009
Map 21. Proportion of Households with Income Below the Poverty Threshold,by Municipality, 2008-2009
SAN JOSE
MAYANTOC
CAMILING
SANTA IGNACIA
SAN CLEMENTE
MONCADA
SAN MANUEL
PANIQUI
ANAO
RAMOSPURA
GERONAVICTORIA
CITY OF TARLAC
LA PAZ
CONCEPCIONCAPAS
BAMBAN
SAN JOSE
MAYANTOC
CAMILING
SANTA IGNACIA
SAN CLEMENTE
MONCADA
SAN MANUEL
PANIQUI
ANAO
RAMOSPURA
GERONAVICTORIA
CITY OF TARLAC
LA PAZ
CONCEPCIONCAPAS
BAMBAN
50.6 61.354.8
42.9
41.941.243.8
57.6 53.9
58.6
56.5
60.2
43.5
45.952.1
32.8
40.7
SAN JOSE
MAYANTOC
CAMILING
SANTA IGNACIA
SAN CLEMENTE
MONCADA
SAN MANUEL
PANIQUI
ANAO
RAMOSPURA
GERONAVICTORIA
CITY OF TARLAC
LA PAZ
CONCEPCIONCAPAS
BAMBAN
SAN JOSE
MAYANTOC
CAMILING
SANTA IGNACIA
SAN CLEMENTE
MONCADA
SAN MANUEL
PANIQUI
ANAO
RAMOSPURA
GERONAVICTORIA
CITY OF TARLAC
LA PAZ
CONCEPCIONCAPAS
BAMBAN
50.6 61.354.8
42.9
41.941.243.8
57.6 53.9
58.6
56.5
60.2
43.5
45.952.1
32.8
40.7
M unic ip a l it y M ag ni t ud e Pr o p o r t io nSanta Ignacia 5325 61.3La Paz 7375 60 .2San M anuel 2898 58.6M oncada 6530 57.6Camiling 4330 56 .5Gerona 9593 54.8A nao 1262 53.9San Jose 3407 52 .1M ayantoc 3117 50.6City of Tarlac 26600 45.9Paniqui 8252 43 .8Concepcion 11323 43 .5V icto ria 5400 42 .9Pura 1953 41.9Ramos 1672 41.2San Clemente 1030 40 .7Capas 7875 32 .8
Ho useho ld w i t h inco me b elo w p o ver t y t hresho ld
M unicip al i t y B a r ang a y M ag ni t ud e P r o p o r t io n
Cit y of Tarlac Cent ral 72 7 10 0.0Cit y of Tarlac M abini 116 10 0.0Gerona San Ag ust in 28 0 93 .3M ayantoc Labney 16 4 9 2.7San M anuel San Jacinto 24 8 9 2.5Gerona M atayumcab 34 3 92 .2Capas Santa Juliana 90 3 9 1.2Gerona San Barto lo me 217 9 1.2
Gerona Carb onel 174 9 1.1M o ncada M aluac 110 90 .2
B o t t o m 10 B a r ang a ys

The Many Faces of Poverty (Volume 3)
37
Map 23. Proportion of Households with Income Below the Food Threshold,by Municipality, 2008-2009
Map 24. Proportion of Households with Income Below the Food Threshold,by Barangay, 2008-2009
SAN JOSE
MAYANTOC
CAMILING
SANTA IGNACIA
SAN CLEMENTE
MONCADA
SAN MANUEL
PANIQUI
ANAO
RAMOSPURA
GERONAVICTORIA
CITY OF TARLAC
LA PAZ
CONCEPCIONCAPAS
BAMBAN
SAN JOSE
MAYANTOC
CAMILING
SANTA IGNACIA
SAN CLEMENTE
MONCADA
SAN MANUEL
PANIQUI
ANAO
RAMOSPURA
GERONAVICTORIA
CITY OF TARLAC
LA PAZ
CONCEPCIONCAPAS
BAMBAN
44.9
43.4
45.5
41.0
25.429.527.7
42.028.0
31.843.3
27.118.1
34.3
36.2 45.7
25.3
SAN JOSE
MAYANTOC
CAMILING
SANTA IGNACIA
SAN CLEMENTE
MONCADA
SAN MANUEL
PANIQUI
ANAO
RAMOSPURA
GERONAVICTORIA
CITY OF TARLAC
LA PAZ
CONCEPCIONCAPAS
BAMBAN
SAN JOSE
MAYANTOC
CAMILING
SANTA IGNACIA
SAN CLEMENTE
MONCADA
SAN MANUEL
PANIQUI
ANAO
RAMOSPURA
GERONAVICTORIA
CITY OF TARLAC
LA PAZ
CONCEPCIONCAPAS
BAMBAN
44.9
43.4
45.5
41.0
25.429.527.7
42.028.0
31.843.3
27.118.1
34.3
36.2 45.7
25.3
CBMS Poverty Maps: Tarlac
M unic ip a l it y M ag ni t ud e Pr o p o r t io nSanta Ignacia 3974 45.7San M anuel 2249 45.5Camiling 3437 44 .9M oncada 4926 43 .4La Paz 5310 43 .3Gerona 7350 42 .0A nao 961 41.0M ayantoc 2230 36 .2San Jose 2244 34 .3City of Tarlac 18449 31.8Paniqui 5555 29 .5V icto ria 3518 28 .0Pura 1291 27.7Concepcion 7066 27.1Ramos 1032 25.4San Clemente 642 25.3Capas 4339 18 .1
Ho useho ld s w i t h inco me b e lo w f o o d t hresho ld
M unicip al i t y B ar ang a y M a g ni t ud e P r o p o r t io n
Cit y of Tarlac M abini 116 10 0.0Cit y of Tarlac Cent ral 69 7 95.9M o ncad a M aluac 109 89 .3San M anuel San Jacinto 2 39 89 .2Gerona M atayumcab 33 1 89 .0Gerona Carbo nel 169 88 .5Gerona San Ag ust in 26 1 87.0Gerona Santa Lucia 141 84 .9
M ayantoc Labney 149 84 .2Camiling B ilad 36 1 83 .2
B o t t o m 10 B a r ang ay s

38
The Many Faces of Poverty (Volume 3)
Map 26. Proportion of Households who Experienced Food Shortage,by Barangay, 2008-2009
Map 25. Proportion of Households who Experienced Food Shortage,by Municipality, 2008-2009
SAN JOSE
MAYANTOC
CAMILING
SANTA IGNACIA
SAN CLEMENTE
MONCADA
SAN MANUEL
PANIQUI
ANAO
RAMOSPURA
GERONAVICTORIA
CITY OF TARLAC
LA PAZ
CONCEPCIONCAPAS
BAMBAN
SAN JOSE
MAYANTOC
CAMILING
SANTA IGNACIA
SAN CLEMENTE
MONCADA
SAN MANUEL
PANIQUI
ANAO
RAMOSPURA
GERONAVICTORIA
CITY OF TARLAC
LA PAZ
CONCEPCIONCAPAS
BAMBAN
1.3
2.4 0.4
1.20.41.6
1.10.6
0.4
0.5
0.04.5
0.61.3
0.40.9
9.4
SAN JOSE
MAYANTOC
CAMILING
SANTA IGNACIA
SAN CLEMENTE
MONCADA
SAN MANUEL
PANIQUI
ANAO
RAMOSPURA
GERONAVICTORIA
CITY OF TARLAC
LA PAZ
CONCEPCIONCAPAS
BAMBAN
SAN JOSE
MAYANTOC
CAMILING
SANTA IGNACIA
SAN CLEMENTE
MONCADA
SAN MANUEL
PANIQUI
ANAO
RAMOSPURA
GERONAVICTORIA
CITY OF TARLAC
LA PAZ
CONCEPCIONCAPAS
BAMBAN
1.3
2.4 0.4
1.20.41.6
1.10.6
0.4
0.5
0.04.5
0.61.3
0.40.9
9.4
CBMS Poverty Maps: Tarlac
M unicip al i t y M ag ni t ud e P ro p o r t io nSan Jose 611 9.4M ayantoc 276 4 .5M oncada 274 2.4Pura 72 1.6San M anuel 64 1.3La Paz 154 1.3Ramos 47 1.2V icto ria 135 1.1Capas 212 0.9City Tarlac 353 0.6Gerona 101 0.6San Clemente 13 0 .5Camiling 32 0.4Concepcion 98 0.4A nao 9 0.4Paniqui 68 0.4Santa Ignacia 3 0.0
Ho useho ld s w ho exp er ienced f o o d sho r t ag e
M unicip al i t y B a r a ng ay M a g ni t ud e P r o p o r t io n
San Jo se M aamo t 4 41 8 1.5M ayantoc Lab ney 98 55.4M ayantoc Gayong gayong 16 17.6Capas Santa Juliana 173 17.5Cit y of Tarlac V illa B aco lo r 55 16.2M o ncad a San Roq ue 38 16.2M ayantoc Caocao ayan 22 15.5M ayantoc Tangcarang 38 14.8M o ncad a Santa Lucia East 26 14.1San M anuel San V icente 35 11.6
B o t t o m 10 B a r ang ay s

The Many Faces of Poverty (Volume 3)
39
Households with income below thepover ty threshold
Households with income belowthe food threshold
Households who experiencedfood shor tage
Table 4. Income Indicators, by Barangay, Province of Tarlac, 2008-2009
Ba rang a yMunic ipa l i ty
M ag n i tude M ag n i tude M ag n i tudeP r opor t i on P r opor t i on P r opor t i on
ANAO Baguindoc (Baguinloc)BantogCamposCarmenCasiliDon RamonHernandoPoblacionRizalSan Francisco EastSan Francisco WestSan Jose Nor thSan Jose SouthSan JuanSan RoqueSanto DomingoSinenseSuaverdez
CAMI L ING Anoling 1stAnoling 2ndAnoling 3rdBacabacBacsayBiladBirbiraCacamilingan NorteCacamilingan SurCayaoanCayasanFloridaLibuegMalacampaManakemMarawiMatubogNagrambacanNagserialanPalimbo-CaarosipanPindangan 2ndPoblacion BPoblacion ESinilian 3rdSinilian CacalibosoanSinulatan 2ndSurgui 3rdTambuganTuec
CAPAS ArangurenBuenoCristo ReyCubcub (Pob.)Cutcut 1stCutcut 2ndDoloresEstrada (Calingcuan)LawyMangaManlapigMarugluO’DonnellSanta JulianaSanta LuciaSanta RitaSanto Domingo 1stSanto Domingo 2ndSanto RosarioTalaga
006000000020000010
0.00.07.50.00.00.00.00.00.00.00.90.00.00.00.00.00.50.0
001100000021270001000001023020
0.00.01.02.00.00.00.00.00.03.11.91.31.40.00.00.00.30.00.00.00.00.00.70.02.32.30.00.80.0
174000300001110
173100011
1.41.60.00.00.00.20.00.00.00.00.33.90.017.50.10.00.00.00.10.1
323672571256980158443944236579970101150
40.028.888.938.567.283.179.218.364.636.842.944.235.348.355.676.150.073.9
231462399265719662865322642826266117
28.811.276.526.449.578.370.311.050.823.929.733.725.535.646.167.432.757.6
129988527824038413222424612141243302345811110225242161357276587247664663
86.051.686.754.256.188.549.847.781.718.225.979.564.869.454.733.428.765.876.132.088.480.241.727.852.851.216.126.1
117767220919536111515221365
1042582104766631619686326245352830411742
78.040.073.540.745.683.243.432.370.89.19.366.750.762.344.319.917.742.161.617.180.771.225.210.833.731.86.017.4
55019610212692613282051907481255025114629035607380242239122
44.977.521.938.315.527.118.935.035.834.813.188.459.791.231.221.415.522.617.212.0
33615935115284175859442661272268288113253231665218
27.562.87.521.75.014.47.917.320.417.07.179.633.881.918.19.46.06.23.71.8

40
The Many Faces of Poverty (Volume 3)
Households with incomebelow the pover ty th reshold
Households with incomebelow the food threshold
Households who experiencedfood shor tage
Table 4. Income Indicators, by Barangay, Province of Tarlac, 2008-2009
Ba rang a yMunic ipa l i ty
M ag n i tude M ag n i tude M ag n i tudeP r opor t i on P r opor t i on P r opor t i on
CITY OF TARLAC AgusoAlvindia SegundoAmucaoArmeniaAsturiasAtiocBalantiBaleteBalibago IBalibago IIBalingcanawayBanabaBantogBaras-barasBatang-batangBinaugananBoraBuenavistaBuhilit (Bubulit)BurotCalingcuanCapehanCarangianCareCentralCulipatCut-cut ICut-cut IIDalayapDela PazDoloresLaoangLigtasanLourdesMabiniMaligayaMaliwaloMapalacsiaoMapaladMataderoMatatalaibParaisoPoblacionSalapunganSan CarlosSan FranciscoSan IsidroSan JoseSan Jose de UrquicoSan Juan de MataSan LuisSan ManuelSan MiguelSan NicolasSan PabloSan PascualSan RafaelSan RoqueSan SebastianSan VicenteSanta CruzSanta MariaSanto CristoSanto DomingoSanto NiñoSapang MaragulSapang TagalogSepung CalzadaSinaitSuizo
8000005000100111700000002917000010022000014021000090111162531500000011161170311120023
0.80.00.00.00.00.01.70.00.00.01.10.02.72.70.00.00.00.00.00.00.00.40.62.30.00.00.00.01.50.05.40.00.00.00.01.60.00.20.80.00.00.00.02.60.00.20.10.15.83.10.61.60.00.00.00.00.00.00.90.50.18.80.01.30.50.60.20.00.02.9
4461012534881421402403921382684471332661562531081621791676377513310665597276414486358317199259992211162411374490612139262141514313053738360173321208311726831208333390113121784856692122981091197278327268276
45.433.251.460.946.646.879.543.233.742.751.170.766.325.070.913.652.982.168.483.512.427.874.175.0100.026.414.140.053.875.148.749.821.551.9100.028.161.746.250.445.329.429.017.940.948.710.743.631.162.240.340.932.440.950.534.163.919.186.116.926.682.947.431.443.652.460.031.246.162.535.3
22362188363838620927910118829611717886201551201631355482689983479697466
326274243112179561571161853602733314742614010107782356019513221914721643451910825423199612649051863606673812177242173174
22.720.438.245.327.228.869.230.724.630.033.862.244.413.856.36.939.274.855.371.84.318.668.464.395.919.06.126.941.257.627.434.412.136.9100.021.616.225.727.331.313.519.011.930.629.24.633.116.847.527.528.922.524.531.517.748.811.375.89.815.475.832.515.429.335.140.719.934.140.322.3

The Many Faces of Poverty (Volume 3)
41
Households with incomebelow the pover ty th reshold
Households with incomebelow the food threshold
Households who experiencedfood shor tage
Table 4. Income Indicators, by Barangay, Province of Tarlac, 2008-2009
Ba rang a yMunic ipa l i ty
M ag n i tude M ag n i tude M ag n i tudeP r opor t i on P r opor t i on P r opor t i on
CITY OF TARLAC TarijiTibagTibaganTrinidadUngotVilla Bacolor
CONCEPC ION AlfonsoBalutuCafeCalius GuecoCaluluanCastilloCorazon de JesusCulatinganDunganDutung-A-MatasGreen VillageLilibanganMabilogMagaoMalupaMinanePanalicsianPandoParangParulungPitabunanSan Agustin (Murcia)San AntonioSan Bar tolomeSan FranciscoSan Isidro (Almendras)San Jose (Pob.)San Juan (Castro)San MartinSan Nicolas (Pob.)San Nicolas BalasSan VicenteSanta CruzSanta MariaSanta MonicaSanta RitaSanta RosaSantiagoSanto CristoSanto NiñoSanto RosarioTalimunduc MarimlaTalimunduc San MiguelTelabancaTinang
GERONA AbagonAmacalanApsayanAysonBawaBuenlagBularitCalayaanCarbonelCardonaCaturayDanzoDicolorDon BasilioLuna
0662055
0.00.20.80.70.016.2
000001035001350031800300200000000410002006110012
0.00.00.00.00.00.20.00.62.80.00.00.56.30.00.00.40.51.60.00.00.60.00.00.60.00.00.00.00.00.00.00.00.50.40.00.00.00.20.00.02.03.80.00.01.4
020004200600000
0.00.30.00.00.00.70.40.00.01.10.00.00.00.00.0
3131508442121223196
62.159.357.645.333.357.6
251121734689146163
49.847.945.133.321.847.9
11261793088851729826330093316117913051719599136195230151165386244169509197652197172232231353151125271683781925327318821425991358
77.325.668.144.058.351.969.056.151.738.033.147.254.949.442.613.463.837.836.549.731.339.450.850.436.835.938.125.625.828.444.746.737.139.352.124.544.821.824.743.461.474.056.477.842.3
1027672365431717317018945207836123199484089951219385222157972841073551039
151118931774932666196742718912617819083159
70.59.652.227.035.730.144.635.325.024.923.431.641.528.621.55.441.818.419.230.616.122.732.729.020.519.520.713.413.619.223.632.220.817.232.29.623.38.412.630.041.261.641.470.918.8
26323914617512123026227017436317420422386226
35.039.631.352.630.341.154.049.591.164.165.461.851.343.972.4
170146891258113618817816929614917417154194
22.624.219.137.520.324.338.832.788.552.356.052.739.327.662.2

42
The Many Faces of Poverty (Volume 3)
Households with incomebelow the pover ty th reshold
Households with incomebelow the food threshold
Households who experiencedfood shor tage
Table 4. Income Indicators, by Barangay, Province of Tarlac, 2008-2009
Ba rang a yMunic ipa l i ty
M ag n i tude M ag n i tude M ag n i tudeP r opor t i on P r opor t i on P r opor t i on
GERONA MabiniMagaspacMalayepMatapitapMatayumcabNew SalemOloybuayaPadapadaParsolinganPinasling (Pinasung)PlastadoPoblacion 1Poblacion 2Poblacion 3QuezonRizalSalapunganSan AgustinSan AntonioSan Bar tolomeSan JoseSanta LuciaSantiagoSembranoSingatSulipaTagumbaoTangcaranVilla Paz
LA PAZ BalanoyBantog-CaricutanCaramutanCautComillasDumaraisGuevarraKapanikianLa PurisimaLaraLaungcupangLomboyMacalongMatayumtayumMayangMotricoPaludpudRizalSan Isidro (Pob.)San Roque (Pob.)Sierra
MAYANTOC AmbalingitBaybayaoasBigbigaBinbinacaCalabtanganCaocaoayanCarabaoanCubcubGayonggayongGossoodLabneyMamonitManiniogMapandanNambalanPedro L. Quines
011000000201603512010010000000000
0.01.10.00.00.00.00.00.03.82.30.06.10.40.50.00.40.00.00.20.00.00.00.00.00.00.00.00.00.0
12115104093210004000001443
0.20.40.13.31.14.81.10.83.60.00.00.00.90.00.00.00.00.00.13.00.8
000192213016298076160
0.00.00.00.86.915.57.00.017.61.155.40.03.81.85.80.0
1034452001203432069312130723111220712113512911223228041021722214937022414519577094144
39.646.359.040.592.282.744.964.757.633.641.036.052.833.241.741.651.893.369.591.276.389.876.368.952.060.682.744.545.3
59295147853311917889218138681167565856118226133619719614128919210316069269111
22.730.743.428.789.076.737.747.640.920.124.920.232.816.027.522.740.687.056.982.867.484.959.659.136.949.774.332.734.9
3112904472995374935212304541601943882224031443041871433231125200
71.360.751.865.459.759.363.460.278.567.253.060.149.965.645.948.659.946.640.677.052.1
24217729522641334937016737812014128015732010317811778177868154
55.537.034.249.545.942.045.043.765.450.438.543.335.352.132.828.437.525.422.359.440.1
7760186115388650635411516427790186139135
57.565.269.488.529.060.626.770.859.361.292.755.048.656.750.543.7
6350138100186728484692149197651399379
47.054.351.576.913.747.215.053.950.548.984.239.135.142.433.825.6

The Many Faces of Poverty (Volume 3)
43
Households with incomebelow the pover ty th reshold
Households with incomebelow the food threshold
Households who experiencedfood shor tage
Table 4. Income Indicators, by Barangay, Province of Tarlac, 2008-2009
Ba rang a yMunic ipa l i ty
M ag n i tude M ag n i tude M ag n i tudeP r opor t i on P r opor t i on P r opor t i on
MAYANTOC PitombayogPoblacion NortePoblacion SurRotrottoocSan Bar tolomeSan JoseTaldiapanTangcarang
MONCADA Ablang-SapangAringinAtencioBanaoang EastBanaoang WestBaquero Nor teBaquero SurBurgosCalamayCalapanCamangaan EastCamangaan WestCamposanto 1 - Nor teCamposanto 1 - SurCamposanto 2CapaoayanLapsingMabiniMaluacPoblacion 1Poblacion 2Poblacion 3Poblacion 4RizalSan JuanSan JulianSan LeonSan PedroSan RoqueSanta Lucia EastSanta Lucia WestSanta MariaSanta MonicaTolega Nor teTolega SurTubectubangVilla
PANIQUI AbogadoAcocolaoAduasApulidBalaoangBarang (Borang)BrillanteBurgosCabayaoasanCananCarinoCayangaColibangbangCoralDapdapEstacionMabilangManaoisMatalapitapNagmisaanNancamarinan
24443012138
6.40.70.71.30.03.10.714.8
55378326000326100101901015610600038265450600
7.51.06.13.49.91.90.00.00.01.47.80.40.00.00.20.04.30.00.80.04.64.00.40.01.50.00.00.016.214.12.10.91.50.02.40.00.0
0000007244000200010135
0.00.00.00.00.00.04.80.40.70.80.00.00.00.50.00.00.00.40.00.44.8
1142823051431344586173
30.549.051.364.135.911.658.567.3
67193173116862266135
17.933.529.152.023.15.744.952.5
368220751692022132042198115722171183137364308345171110106183112791441441991181022061601711932528017427118
50.172.865.271.062.767.880.047.857.971.066.226.858.535.580.249.077.940.490.262.456.575.233.952.737.040.451.558.387.787.070.444.474.337.769.355.336.0
246197531311581721641295811318047118923082073151021095813298321159412387741911411441302214913019612
33.565.246.155.049.154.864.328.241.451.153.917.737.723.867.832.971.124.189.334.140.765.813.742.124.225.038.042.381.376.659.329.965.223.151.840.024.0
2941591285484855086128187174310155154591643332829195214382
28.443.239.187.757.718.058.528.333.333.927.142.044.815.450.346.561.739.724.780.852.3
142112115484386226077989117810186321162052115453174232
13.730.435.277.445.97.940.817.017.517.715.627.425.08.435.628.646.223.613.865.731.7

44
The Many Faces of Poverty (Volume 3)
Households with incomebelow the pover ty th reshold
Households with incomebelow the food threshold
Households who experiencedfood shor tage
Table 4. Income Indicators, by Barangay, Province of Province of Tarlac, 2008-2009
Ba rang a yMunic ipa l i ty
M ag n i tude M ag n i tude M ag n i tudeP r opor t i on P r opor t i on P r opor t i on
PANIQUI NipacoPatalanPoblacion NortePoblacion SurRang-ayanSalumagueSamputSan CarlosSan IsidroSan Juan de MillaSanta InesSinigpitTablangVentenilla
PURA BaliteBuenavistaCadanglaanEstiponaLinaoMaasinMatindegMaungibNayaNilasin 1stNilasin 2ndPoblacion 1Poblacion 2Poblacion 3PorocSingat
RAMOS Coral-IlocoGuitebPancePoblacion CenterPoblacion NorthPoblacion SouthSan JuanSan RaymundoToledo
SAN CL EMENTE BallocBambanCasipoCatagudinganDaldalayapDoclong 1Doclong 2MaasinNagsabaranPit-aoPoblacion NortePoblacion Sur
SAN JOSE BurgosDavidIbaLabneyLawacamulagLubiganMaamotMababanabaMorionesPaoSan Juan de ValdezSulaVilla Aglipay
00110400023010
0.00.00.10.10.00.70.00.00.01.00.90.00.20.0
40154200000071030
1.20.00.77.20.80.00.00.00.00.00.03.30.40.01.80.0
0100045001
0.00.20.00.00.09.80.00.00.3
160010010031
0.33.30.00.00.70.00.00.30.00.01.40.3
0132400
4411960103419
0.00.33.61.10.00.081.53.39.40.30.05.92.0
100258989268171324379145209121140202239229
31.943.363.822.434.654.044.945.556.859.040.645.044.442.6
55166790108912372229216410385107139167
17.627.951.09.018.439.526.328.844.650.224.623.825.831.1
1933087022413079114917291777110210493134
57.450.950.029.749.251.351.431.640.438.930.233.542.039.055.739.5
14522751143755985565158444363605378
43.237.536.419.028.438.338.319.428.724.817.320.325.922.531.723.0
25928253384712492255117
34.545.565.126.823.654.018.819.229.8
1481743754633162142753
19.728.145.814.711.035.112.09.413.5
135751666994167181727968131
44.640.823.939.572.820.146.251.647.128.732.538.5
9345124274254712549353461
30.724.517.925.154.412.332.435.632.012.716.317.9
345155420144101174348259307170118352514
63.250.047.138.737.775.764.344.948.355.238.660.852.8
259106272874613324016218811969250313
47.434.230.523.417.257.844.428.129.638.622.543.232.2

The Many Faces of Poverty (Volume 3)
45
Households with incomebelow the pover ty th reshold
Households with incomebelow the food threshold
Households who experiencedfood shor tage
Table 4. Income Indicators, by Barangay, Province of Province of Tarlac, 2008-2009
Ba rang a yMunic ipa l i ty
M ag n i tude M ag n i tude M ag n i tudeP r opor t i on P r opor t i on P r opor t i on
SAN MANUEL ColubotLanatLegaspiMangandingayMatarannocPacpacoPoblacionSalcedoSan AgustinSan FelipeSan JacintoSan MiguelSan NarcisoSan VicenteSanta Maria
SANTA IGNACIA BaldiosBotbotonesCaanamonganCabaruanCabugbuganCaduldulaoanCalipayanMacaguingNambalanPadapadaPilpilaPinpinasPoblacion EastPoblacion WestPugo-CecilioSan FranciscoSan SoteroSan VicenteSanta Ines CentroSanta Ines EastSanta Ines WestTaguiporoTimmaguabVargas
V ICTORI A BaculongBalayangBalbalotoBangarBantogBatangbatangBuloCabuluanCalibunganCanaremCruzLalapacMaluidMangolagoMasalasaPalacpalacSan AgustinSan AndresSan Fernando (Pob.)San FranciscoSan Gavino (Pob.)San JacintoSan Nicolas (Pob.)San VicenteSanta BarbaraSanta Lucia (Pob.)
8010708040000351
4.00.00.30.03.40.02.90.01.00.00.00.00.011.60.3
000300000000000000000000
0.00.00.01.10.00.00.00.00.00.00.00.00.00.00.00.00.00.00.00.00.00.00.00.0
0041419042022010663000110340
0.00.01.00.20.90.41.90.00.70.50.00.50.40.00.30.09.80.70.00.00.00.20.20.03.50.0
8732625113912713812522324229324828057162200
43.778.067.555.262.655.246.049.862.257.092.560.720.853.661.5
58260213941041118815119223123921231108157
29.162.257.337.351.244.432.433.749.444.989.246.011.335.848.3
2281431771621391151611182044762179120649121623810036824140529130217291
58.847.252.161.850.571.954.677.648.669.451.552.344.780.487.455.159.577.852.180.468.327.847.463.0
1459512313588948810211337317661994001911505832618635726016106232
37.431.436.251.532.058.829.867.126.954.441.835.121.565.577.334.734.568.940.270.861.014.823.150.2
253385194195173183186154126214146138318194172126175244249102133282268105531154
33.957.947.846.436.770.739.453.822.849.842.131.859.742.251.234.525.756.040.835.824.547.653.425.053.846.4
174288128142107150110121841509777229137129809015314135631861956129695
23.343.331.533.822.757.923.342.315.234.928.017.743.029.838.421.913.235.123.112.311.631.438.814.530.028.6

46
The Many Faces of Poverty (Volume 3)
CBMS Poverty Maps: Tarlac
Map 27. Unemployment Rate (15 years old and above), by Municipality, 2008-2009
Map 28. Unemployment Rate (15 years old and above), by Barangay, 2008-2009
SAN JOSE
MAYANTOC
CAMILING
SANTA IGNACIA
SAN CLEMENTE
MONCADA
SAN MANUEL
PANIQUI
ANAO
RAMOSPURA
GERONAVICTORIA
CITY OF TARLAC
LA PAZ
CONCEPCIONCAPAS
BAMBAN
SAN JOSE
MAYANTOC
CAMILING
SANTA IGNACIA
SAN CLEMENTE
MONCADA
SAN MANUEL
PANIQUI
ANAO
RAMOSPURA
GERONAVICTORIA
CITY OF TARLAC
LA PAZ
CONCEPCIONCAPAS
BAMBAN
5.3
4.1 1.9
3.82.85.0
0.8
0.53.5
1.6
3.55.5
5.34.1
1.4
3.1
2.4
SAN JOSE
MAYANTOC
CAMILING
SANTA IGNACIA
SAN CLEMENTE
MONCADA
SAN MANUEL
PANIQUI
ANAO
RAMOSPURA
GERONAVICTORIA
CITY OF TARLAC
LA PAZ
CONCEPCIONCAPAS
BAMBAN
SAN JOSE
MAYANTOC
CAMILING
SANTA IGNACIA
SAN CLEMENTE
MONCADA
SAN MANUEL
PANIQUI
ANAO
RAMOSPURA
GERONAVICTORIA
CITY OF TARLAC
LA PAZ
CONCEPCIONCAPAS
BAMBAN
5.3
4.1 1.9
3.82.85.0
0.8
0.53.5
1.6
3.55.5
5.34.1
1.4
3.1
2.4
M unicip a li t y M ag ni t ud e Pr o p o r t io nLa Paz 1042 5.5Concepcion 2019 5.3San M anuel 339 5.3Camiling 508 5.0M oncada 609 4.1Capas 1434 4.1Ramos 226 3 .8City Tarlac 2444 3.5Gerona 814 3.5M ayantoc 291 3.1Paniqui 658 2 .8Pura 162 2 .4A nao 51 1.9V icto ria 299 1.6San Jose 134 1.4San Clemente 30 0 .8Santa Ignacia 55 0.5
U nemp lo yment R at e ( 15 years o ld and ab o ve)
M unicip al it y B arang ay M agnit ud e Pro p o rt io n
City of Tarlac Central 40 97.6Camiling Birbira 174 49.2Gerona Carbonel 77 28.5Concepcion Parang 243 25.4Concepcion Parulung 116 22.5Concepcion Caluluan 257 20.8Concepcion Santo Cristo 71 18.3Gerona Parsolingan 106 18.2
City of Tarlac Santa Cruz 102 17.9Concepcion M abilog 73 17.7
B ot t o m 10 B arang ays

The Many Faces of Poverty (Volume 3)
47
Map 30. Proportion of Persons who are Victims of Crime, by Barangay, 2008-2009
Map 29. Proportion of Persons who are Victims of Crime, by Municipality,2008-2009
SAN JOSE
MAYANTOC
CAMILING
SANTA IGNACIA
SAN CLEMENTE
MONCADA
SAN MANUEL
PANIQUI
ANAO
RAMOSPURA
GERONAVICTORIA
CITY OF TARLAC
LA PAZ
CONCEPCIONCAPAS
BAMBAN
SAN JOSE
MAYANTOC
CAMILING
SANTA IGNACIA
SAN CLEMENTE
MONCADA
SAN MANUEL
PANIQUI
ANAO
RAMOSPURA
GERONAVICTORIA
CITY OF TARLAC
LA PAZ
CONCEPCIONCAPAS
BAMBAN
0.1
0.0 0.1
0.00.10.0
0.0
0.00.30.0
0.1
0.00.1
0.00.1
0.1
0.1
SAN JOSE
MAYANTOC
CAMILING
SANTA IGNACIA
SAN CLEMENTE
MONCADA
SAN MANUEL
PANIQUI
ANAO
RAMOSPURA
GERONAVICTORIA
CITY OF TARLAC
LA PAZ
CONCEPCIONCAPAS
BAMBAN
SAN JOSE
MAYANTOC
CAMILING
SANTA IGNACIA
SAN CLEMENTE
MONCADA
SAN MANUEL
PANIQUI
ANAO
RAMOSPURA
GERONAVICTORIA
CITY OF TARLAC
LA PAZ
CONCEPCIONCAPAS
BAMBAN
0.1
0.0 0.1
0.00.10.0
0.0
0.00.30.0
0.1
0.00.1
0.00.1
0.1
0.1
CBMS Poverty Maps: Tarlac
M unicip al i t y M ag ni t ud e P ro p o r t io nM ayantoc 74 0.3Paniqui 99 0 .1La Paz 63 0 .1San Jose 24 0 .1V icto ria 39 0 .1San M anuel 15 0 .1A nao 6 0 .1Capas 68 0 .1Pura 12 0 .1City Tarlac 95 0.0Gerona 26 0.0M oncada 23 0.0San Clemente 2 0.0Camiling 3 0.0Concepcion 8 0.0Santa Ignacia 2 0.0Ramos 0 0.0
Perso ns w ho are vict ims o f c r ime
M unicip a li t y B ar ang a y M ag ni t ud e P r o p o r t io n
M ayantoc Nambalan 33 2.6Paniq ui A bo gad o 35 0.8M ayantoc M amo nit 16 0.8La Paz Caramutan 27 0.7M ayantoc Tangcarang 7 0.7Pura Naya 5 0.6Capas Santo Rosario 37 0.6La Paz M ayang 8 0.6
M ayantoc Gossoo d 4 0.5V icto ria B ang ar 8 0.5
B o t t o m 10 B ar a ng a ys
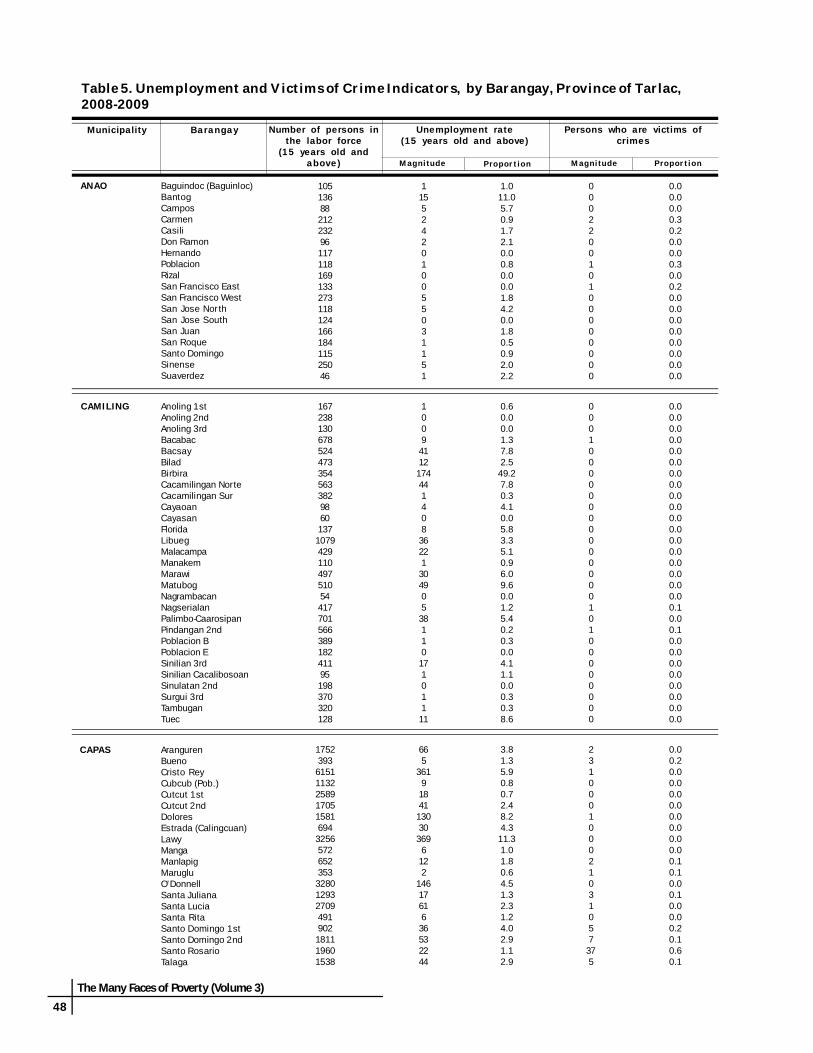
48
The Many Faces of Poverty (Volume 3)
Table 5. Unemployment and Victims of Crime Indicators, by Barangay, Province of Tarlac,2008-2009
ANAO Baguindoc (Baguinloc)BantogCamposCarmenCasiliDon RamonHernandoPoblacionRizalSan Francisco EastSan Francisco WestSan Jose Nor thSan Jose SouthSan JuanSan RoqueSanto DomingoSinenseSuaverdez
CAMI L ING Anoling 1stAnoling 2ndAnoling 3rdBacabacBacsayBiladBirbiraCacamilingan NorteCacamilingan SurCayaoanCayasanFloridaLibuegMalacampaManakemMarawiMatubogNagrambacanNagserialanPalimbo-CaarosipanPindangan 2ndPoblacion BPoblacion ESinilian 3rdSinilian CacalibosoanSinulatan 2ndSurgui 3rdTambuganTuec
CAPAS ArangurenBuenoCristo ReyCubcub (Pob.)Cutcut 1stCutcut 2ndDoloresEstrada (Calingcuan)LawyMangaManlapigMarugluO’DonnellSanta JulianaSanta LuciaSanta RitaSanto Domingo 1stSanto Domingo 2ndSanto RosarioTalaga
Unemployment rate(15 years old and above)
Persons who are vict ims ofcr imes
Number o f persons inthe labor fo rce
(15 years old andabove )
Ba rang a yMunic ipa l i ty
P r opor t i onP r opor t i on M ag n i tudeM ag n i tude
105136882122329611711816913327311812416618411525046
1155242010055031151
1.011.05.70.91.72.10.00.80.00.01.84.20.01.80.50.92.02.2
000220010100000000
0.00.00.00.30.20.00.00.30.00.20.00.00.00.00.00.00.00.0
167238130678524473354563382986013710794291104975105441770156638918241195198370320128
10094112174441408362213049053811017101111
0.60.00.01.37.82.549.27.80.34.10.05.83.35.10.96.09.60.01.25.40.20.30.04.11.10.00.30.38.6
00010000000000000010100000000
0.00.00.00.00.00.00.00.00.00.00.00.00.00.00.00.00.00.00.10.00.10.00.00.00.00.00.00.00.0
1752393615111322589170515816943256572652353328012932709491902181119601538
665
36191841130303696122
1461761636532244
3.81.35.90.80.72.48.24.311.31.01.80.64.51.32.31.24.02.91.12.9
231000100021031057375
0.00.20.00.00.00.00.00.00.00.00.10.10.00.10.00.00.20.10.60.1

The Many Faces of Poverty (Volume 3)
49
Table 5. Unemployment and Victims of Crime Indicators, by Barangay, Province of Tarlac,2008-2009
Unemployment rate(15 years old and above)
Persons who are vict ims ofcr imes
Number o f persons inthe labor fo rce
(15 years old andabove )
Ba rang a yMunic ipa l i ty
P r opor t i onP r opor t i on M ag n i tudeM ag n i tude
CITY OF TARLAC AgusoAlvindia SegundoAmucaoArmeniaAsturiasAtiocBalantiBaleteBalibago IBalibago IIBalingcanawayBanabaBantogBaras-barasBatang-batangBinaugananBoraBuenavistaBuhilit (Bubulit)BurotCalingcuanCapehanCarangianCareCentralCulipatCut-cut ICut-cut IIDalayapDela PazDoloresLaoangLigtasanLourdesMabiniMaligayaMaliwaloMapalacsiaoMapaladMataderoMatatalaibParaisoPoblacionSalapunganSan CarlosSan FranciscoSan IsidroSan JoseSan Jose de UrquicoSan Juan de MataSan LuisSan ManuelSan MiguelSan NicolasSan PabloSan PascualSan RafaelSan RoqueSan SebastianSan VicenteSanta CruzSanta MariaSanto CristoSanto DomingoSanto NiñoSapang MaragulSapang TagalogSepung CalzadaSinaitSuizo
13494351831066356435397909583835129818457699846311562975021423680162210179844125517814649674756386477554061161193219712111636043935111214846941165929171920339102573414841570212183682220506031777431756926057533822331451328
66441058
238222114384111274155119639508351220552240121144611921825182038669121015971173612148419159141051518119405077102661010885501640
1.71.812.02.03.90.72.04.51.93.20.38.28.91.91.33.41.70.03.714.81.53.25.42.297.64.70.61.04.82.31.43.21.16.215.51.71.75.55.52.02.65.34.70.24.15.54.12.51.21.92.00.60.95.01.82.25.86.62.81.817.92.31.03.04.52.84.10.02.53.8
00000000000011110000000290010010000001200000000010002000000001800000910041
0.00.00.00.00.00.00.00.00.00.00.00.00.10.40.10.00.00.00.00.00.00.00.40.00.00.10.00.00.00.00.00.00.00.00.00.00.00.00.00.00.00.00.00.00.00.00.00.00.00.00.10.00.00.00.00.00.00.00.00.10.00.00.00.00.00.10.20.00.20.0
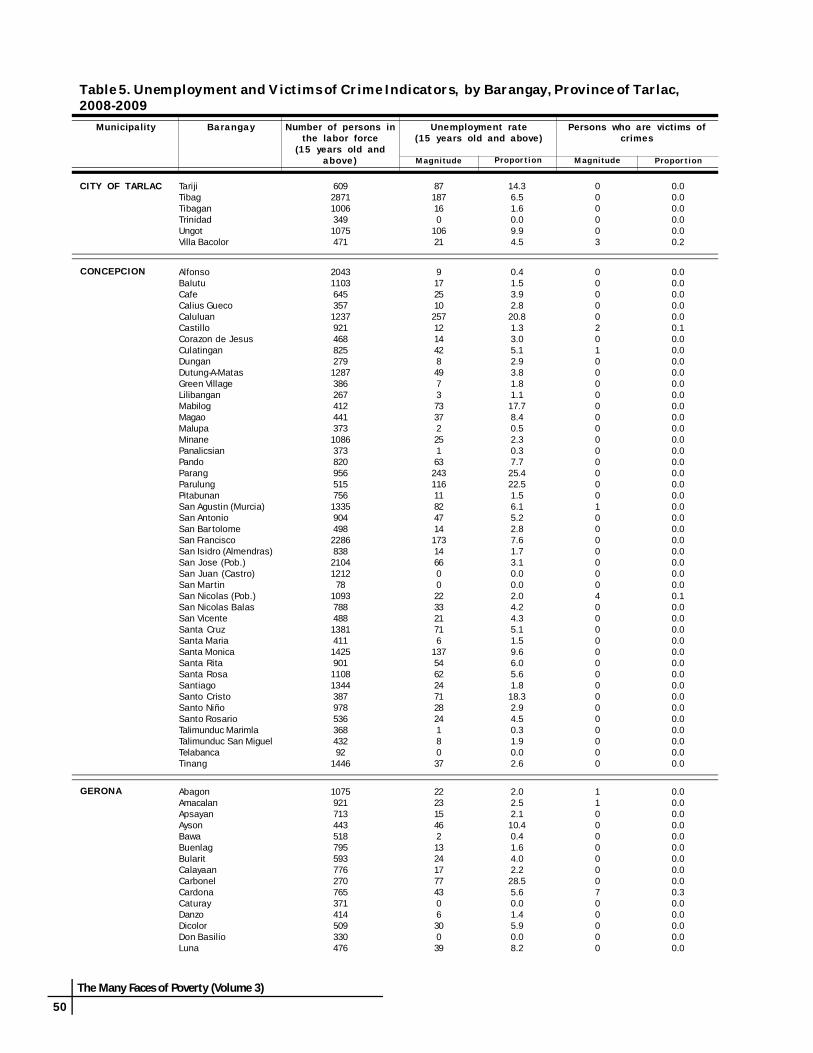
50
The Many Faces of Poverty (Volume 3)
Table 5. Unemployment and Victims of Crime Indicators, by Barangay, Province of Tarlac,2008-2009
CITY OF TARLAC TarijiTibagTibaganTrinidadUngotVilla Bacolor
CONCEPC ION AlfonsoBalutuCafeCalius GuecoCaluluanCastilloCorazon de JesusCulatinganDunganDutung-A-MatasGreen VillageLilibanganMabilogMagaoMalupaMinanePanalicsianPandoParangParulungPitabunanSan Agustin (Murcia)San AntonioSan Bar tolomeSan FranciscoSan Isidro (Almendras)San Jose (Pob.)San Juan (Castro)San MartinSan Nicolas (Pob.)San Nicolas BalasSan VicenteSanta CruzSanta MariaSanta MonicaSanta RitaSanta RosaSantiagoSanto CristoSanto NiñoSanto RosarioTalimunduc MarimlaTalimunduc San MiguelTelabancaTinang
GERONA AbagonAmacalanApsayanAysonBawaBuenlagBularitCalayaanCarbonelCardonaCaturayDanzoDicolorDon BasilioLuna
Unemployment rate(15 years old and above)
Persons who are vict ims ofcr imes
Number o f persons inthe labor fo rce
(15 years old andabove )
Ba rang a yMunic ipa l i ty
P r opor t i onP r opor t i on M ag n i tudeM ag n i tude
609287110063491075471
87187160
10621
14.36.51.60.09.94.5
000003
0.00.00.00.00.00.2
20431103645357123792146882527912873862674124413731086373820956515756133590449822868382104121278
1093788488138141114259011108134438797853636843292
1446
917251025712144284973733722516324311611824714173146600223321716
13754622471282418037
0.41.53.92.820.81.33.05.12.93.81.81.117.78.40.52.30.37.725.422.51.56.15.22.87.61.73.10.00.02.04.24.35.11.59.66.05.61.818.32.94.50.31.90.02.6
000002010000000000000100000004000000000000000
0.00.00.00.00.00.10.00.00.00.00.00.00.00.00.00.00.00.00.00.00.00.00.00.00.00.00.00.00.00.10.00.00.00.00.00.00.00.00.00.00.00.00.00.00.0
1075921713443518795593776270765371414509330476
22231546213241777430630039
2.02.52.110.40.41.64.02.228.55.60.01.45.90.08.2
110000000700000
0.00.00.00.00.00.00.00.00.00.30.00.00.00.00.0

The Many Faces of Poverty (Volume 3)
51
Table 5. Unemployment and Victims of Crime Indicators, by Barangay, Province of Tarlac,2008-2009
Unemployment rate(15 years old and above)
Persons who are vict ims ofcr imes
Number o f persons inthe labor fo rce
(15 years old andabove )
Ba rang a yMunic ipa l i ty
P r opor t i onP r opor t i on M ag n i tudeM ag n i tude
GERONA MabiniMagaspacMalayepMatapitapMatayumcabNew SalemOloybuayaPadapadaParsolinganPinasling (Pinasung)PlastadoPoblacion 1Poblacion 2Poblacion 3QuezonRizalSalapunganSan AgustinSan AntonioSan Bar tolomeSan JoseSanta LuciaSantiagoSembranoSingatSulipaTagumbaoTangcaranVilla Paz
LA PAZ BalanoyBantog-CaricutanCaramutanCautComillasDumaraisGuevarraKapanikianLa PurisimaLaraLaungcupangLomboyMacalongMatayumtayumMayangMotricoPaludpudRizalSan Isidro (Pob.)San Roque (Pob.)Sierra
MAYANTOC AmbalingitBaybayaoasBigbigaBinbinacaCalabtanganCaocaoayanCarabaoanCubcubGayonggayongGossoodLabneyMamonitManiniogMapandanNambalanPedro L. Quines
33112244234114733002863225839744338602485934592776504028771853082136593893723231232313459
215150652416
10662331711018140181847631911225
0.61.23.50.013.70.714.31.918.20.65.33.62.81.90.06.52.20.02.19.71.33.30.90.85.10.31.00.61.1
040000000101000100000000000100
0.00.10.00.00.00.00.00.00.00.00.00.40.00.00.10.00.00.00.00.00.00.00.00.00.00.00.00.00.0
70486613956991415122812506167374785801041725100747771955145112432168515
3575993781433827341581410215012589163812130
5.08.77.15.35.73.53.04.44.63.11.41.314.114.92.58.11.63.53.15.65.8
20271120000100808001021
0.10.00.70.00.30.00.00.00.00.10.00.00.40.00.60.00.00.10.00.00.1
236161482201197186290125199290280793209715441527
3369121114015618213
1.31.91.24.50.51.13.80.82.00.05.40.88.60.30.20.6
000000001431600330
0.00.00.00.00.00.00.00.00.20.50.40.80.00.02.60.0

52
The Many Faces of Poverty (Volume 3)
Table 5. Unemployment and Victims of Crime Indicators, by Barangay, Province of Tarlac,2008-2009
Unemployment rate(15 years old and above)
Persons who are vict ims ofcr imes
Number o f persons inthe labor fo rce
(15 years old andabove )
Ba rang a yMunic ipa l i ty
P r opor t i onP r opor t i on M ag n i tudeM ag n i tude
MAYANTOC PitombayogPoblacion NortePoblacion SurRotrottoocSan Bar tolomeSan JoseTaldiapanTangcarang
MONCADA Ablang-SapangAringinAtencioBanaoang EastBanaoang WestBaquero Nor teBaquero SurBurgosCalamayCalapanCamangaan EastCamangaan WestCamposanto 1 - Nor teCamposanto 1 - SurCamposanto 2CapaoayanLapsingMabiniMaluacPoblacion 1Poblacion 2Poblacion 3Poblacion 4RizalSan JuanSan JulianSan LeonSan PedroSan RoqueSanta Lucia EastSanta Lucia WestSanta MariaSanta MonicaTolega Nor teTolega SurTubectubangVilla
PANIQUI AbogadoAcocolaoAduasApulidBalaoangBarang (Borang)BrillanteBurgosCabayaoasanCananCarinoCayangaColibangbangCoralDapdapEstacionMabilangManaoisMatalapitapNagmisaanNancamarinan
471886816176459620253428
19635818222213
4.07.17.110.24.83.50.40.7
35200007
0.20.20.10.00.00.00.00.7
109540515335750145232758222426537531641645557479753156714526350019234534549856424625030017731862135825638450768
183121952141523161511174303518516146111518215415146256166131
1.67.71.35.310.43.14.60.313.82.34.03.54.10.95.24.43.49.04.15.312.25.71.45.24.20.91.60.41.77.91.94.01.76.31.62.61.5
0231001000200000001160102000100000200
0.00.10.10.10.00.00.10.00.00.00.10.00.00.00.00.00.00.00.20.10.10.00.10.00.00.00.00.00.10.00.00.00.00.00.20.00.0
1332464320907691308171447736681144645147254833610145212795425661158
6078
115133213161393816123225410820
4.51.52.512.71.91.01.22.92.21.90.60.71.72.93.63.24.81.41.81.41.7
3500000108230001001509
0.80.00.00.00.00.00.20.00.40.10.10.00.00.00.10.00.00.10.30.00.3

The Many Faces of Poverty (Volume 3)
53
Table 5. Unemployment and Victims of Crime Indicators, by Barangay, Province of Tarlac,2008-2009
Unemployment rate(15 years old and above)
Persons who are vict ims ofcr imes
Number o f persons inthe labor fo rce
(15 years old andabove )
Ba rang a yMunic ipa l i ty
P r opor t i onP r opor t i on M ag n i tudeM ag n i tude
PANIQUI NipacoPatalanPoblacion NortePoblacion SurRang-ayanSalumagueSamputSan CarlosSan IsidroSan Juan de MillaSanta InesSinigpitTablangVentenilla
PURA BaliteBuenavistaCadanglaanEstiponaLinaoMaasinMatindegMaungibNayaNilasin 1stNilasin 2ndPoblacion 1Poblacion 2Poblacion 3PorocSingat
RAMOS Coral-IlocoGuitebPancePoblacion CenterPoblacion NorthPoblacion SouthSan JuanSan RaymundoToledo
SAN CL EMENTE BallocBambanCasipoCatagudinganDaldalayapDoclong 1Doclong 2MaasinNagsabaranPit-aoPoblacion NortePoblacion Sur
SAN JOSE BurgosDavidIbaLabneyLawacamulagLubiganMaamotMababanabaMorionesPaoSan Juan de ValdezSulaVilla Aglipay
439718195116276867741102338532234458470557694
134375129426218322132811
3.00.61.93.14.20.52.40.63.41.34.82.85.01.6
102192210101500
0.10.00.00.40.10.10.00.00.10.00.10.30.00.0
4197812191203335209337437231377433313332352287476
7164453688114106141118
1.72.01.83.70.92.92.41.80.43.72.31.94.23.10.31.7
0110000050014000
0.00.00.10.00.00.00.00.00.60.00.00.10.40.00.00.0
12347871446409500647173308519
35767316312344
2.89.75.03.90.61.91.71.30.8
000000000
0.00.00.00.00.00.00.00.00.0
52930187238176302179557208456267557
232040125434
0.41.02.30.02.30.00.60.42.40.91.10.7
100000000010
0.10.00.00.00.00.00.00.00.00.00.10.0
867451150155440428767865110774494289861514
678432103129417310
0.71.60.50.70.70.71.54.82.70.94.00.30.7
00510001110240
0.00.00.10.10.00.00.00.40.00.00.10.10.0

54
The Many Faces of Poverty (Volume 3)
Table 5. Unemployment and Victims of Crime Indicators, by Barangay, Province of Tarlac,2008-2009
Unemployment rate(15 years old and above)
Persons who are vict ims ofcr imes
Number o f persons inthe labor fo rce
(15 years old andabove )
Ba rang a yMunic ipa l i ty
P r opor t i onP r opor t i on M ag n i tudeM ag n i tude
SAN MANUEL ColubotLanatLegaspiMangandingayMatarannocPacpacoPoblacionSalcedoSan AgustinSan FelipeSan JacintoSan MiguelSan NarcisoSan VicenteSanta Maria
SANTA IGNACIA BaldiosBotbotonesCaanamonganCabaruanCabugbuganCaduldulaoanCalipayanMacaguingNambalanPadapadaPilpilaPinpinasPoblacion EastPoblacion WestPugo-CecilioSan FranciscoSan SoteroSan VicenteSanta Ines CentroSanta Ines EastSanta Ines WestTaguiporoTimmaguabVargas
V ICTORI A BaculongBalayangBalbalotoBangarBantogBatangbatangBuloCabuluanCalibunganCanaremCruzLalapacMaluidMangolagoMasalasaPalacpalacSan AgustinSan AndresSan Fernando (Pob.)San FranciscoSan Gavino (Pob.)San JacintoSan Nicolas (Pob.)San VicenteSanta BarbaraSanta Lucia (Pob.)
275454361272313349400649522675193483552525432
233754923521581810205866
8.48.115.03.37.31.45.30.81.52.75.20.40.011.015.3
304000013000103
0.40.00.20.00.00.00.00.10.20.00.00.00.10.00.2
526462478329341246379243547670372211646479343565233441681613660167559537
0300023410208171502000232
0.00.60.00.00.00.80.81.60.20.00.50.01.23.50.30.90.00.50.00.00.01.20.50.4
100000000000000100000000
0.10.00.00.00.00.00.00.00.00.00.00.00.00.00.00.10.00.00.00.00.00.00.00.0
113487446951578242967246680867955869280255349949311005947174208179287086001604456
8818315108143161115231433121131422787511
0.70.93.80.61.92.31.23.03.80.92.02.22.92.50.60.60.13.51.83.32.70.81.11.20.32.4
00380190010010001301306200
0.00.00.20.50.00.10.40.00.00.10.00.00.00.00.00.00.00.20.00.10.10.00.30.10.00.0

The Many Faces of Poverty (Volume 3)
55
Map 32. CBMS Composite Indicator, by Barangay, 2008-2009
Map 31. CBMS Composite Indicator, by Municipality, 2008-2009
SAN JOSE
MAYANTOC
CAMILING
SANTA IGNACIA
SAN CLEMENTE
MONCADA
SAN MANUEL
PANIQUI
ANAO
RAMOSPURA
GERONAVICTORIA
CITY OF TARLAC
LA PAZ
CONCEPCIONCAPAS
BAMBAN
SAN JOSE
MAYANTOC
CAMILING
SANTA IGNACIA
SAN CLEMENTE
MONCADA
SAN MANUEL
PANIQUI
ANAO
RAMOSPURA
GERONAVICTORIA
CITY OF TARLAC
LA PAZ
CONCEPCIONCAPAS
BAMBAN
1.0
1.3
1.3
1.5
1.1
1.0 0.91.0
1.31.41.2
1.81.1
1.0
1.4
1.00.9
SAN JOSE
MAYANTOC
CAMILING
SANTA IGNACIA
SAN CLEMENTE
MONCADA
SAN MANUEL
PANIQUI
ANAO
RAMOSPURA
GERONAVICTORIA
CITY OF TARLAC
LA PAZ
CONCEPCIONCAPAS
BAMBAN
SAN JOSE
MAYANTOC
CAMILING
SANTA IGNACIA
SAN CLEMENTE
MONCADA
SAN MANUEL
PANIQUI
ANAO
RAMOSPURA
GERONAVICTORIA
CITY OF TARLAC
LA PAZ
CONCEPCIONCAPAS
BAMBAN
1.0
1.3
1.3
1.5
1.1
1.0 0.91.0
1.31.41.2
1.81.1
1.0
1.4
1.00.9
CBMS Poverty Maps: Tarlac
M unic ip a li t y A verag eSan Jose 1.8San M anuel 1.5Santa Ignacia 1.4La Paz 1.4Camiling 1.3M oncada 1.3Gerona 1.3M ayantoc 1.2City of Tarlac 1.1A nao 1.1Concepcion 1.0San Clemente 1.0V icto ria 1.0Pura 1.0Paniqui 1.0Ramos 0 .9Capas 0 .9
C B M S C o mp o si t e Ind icat o r
M unicip al i t y B ar a ng ay A v er ag e
San Jo se M aamo t 4.7Gerona Santa Lucia 3.6M ayantoc Lab ney 3.4Capas Santa Juliana 3 .1Capas M arug lu 3.0Cit y of Tarlac M ab ini 2.7San M anuel Leg aspi 2.6San Jo se Lub ig an 2.5
Cit y of Tarlac Santa Cruz 2.4Capas B ueno 2.4Gerona M atayumcab 2.4San M anuel San A gust in 2.4
B o t t o m 12 B ar a ng ay s

56
The Many Faces of Poverty (Volume 3)
Table 6. CBMS Composite Indicator, by Barangay, Province of Tarlac, 2008-2009
Ba rang a yMunic ipa l i ty CBMS Compos ite Indicator
Munic ipa l i ty Ba rang a y CBMS Compos ite Indicator
ANAO Baguindoc (Baguinloc)BantogCamposCarmenCasiliDon RamonHernandoPoblacionRizalSan Francisco EastSan Francisco WestSan Jose Nor thSan Jose SouthSan JuanSan RoqueSanto DomingoSinenseSuaverdez
CAMI L ING Anoling 1stAnoling 2ndAnoling 3rdBacabacBacsayBiladBirbiraCacamilingan NorteCacamilingan SurCayaoanCayasanFloridaLibuegMalacampaManakemMarawiMatubogNagrambacanNagserialanPalimbo-CaarosipanPindangan 2ndPoblacion BPoblacion ESinilian 3rdSinilian CacalibosoanSinulatan 2ndSurgui 3rdTambuganTuec
CAPAS ArangurenBuenoCristo ReyCubcub (Pob.)Cutcut 1stCutcut 2ndDoloresEstrada (Calingcuan)LawyMangaManlapigMarugluO’DonnellSanta JulianaSanta LuciaSanta RitaSanto Domingo 1stSanto Domingo 2ndSanto RosarioTalaga
CITY OF TARLAC AgusoAlvindia SegundoAmucaoArmeniaAsturiasAtiocBalantiBaleteBalibago IBalibago IIBalingcanawayBanabaBantogBaras-barasBatang-batangBinaugananBoraBuenavistaBuhilit (Bubulit)BurotCalingcuanCapehanCarangianCareCentralCulipatCut-cut ICut-cut IIDalayapDela PazDoloresLaoangLigtasanLourdesMabiniMaligayaMaliwaloMapalacsiaoMapaladMataderoMatatalaibParaisoPoblacionSalapunganSan CarlosSan FranciscoSan IsidroSan JoseSan Jose de UrquicoSan Juan de MataSan LuisSan ManuelSan MiguelSan NicolasSan PabloSan PascualSan RafaelSan RoqueSan SebastianSan VicenteSanta CruzSanta MariaSanto CristoSanto DomingoSanto NiñoSapang MaragulSapang TagalogSepung CalzadaSinaitSuizo
0.80.61.90.81.31.81.60.41.30.70.90.90.71.11.11.51.01.7
1.71.02.31.61.22.01.41.31.80.50.51.61.41.41.10.80.71.31.60.92.02.10.80.51.11.00.50.71.9
1.02.40.50.80.60.90.50.61.10.80.63.01.33.10.80.50.70.50.40.3
1.01.11.21.41.21.22.01.10.81.31.11.71.80.61.50.41.21.81.51.70.30.81.71.82.10.60.31.31.31.61.01.20.61.32.70.71.01.31.11.00.70.70.51.01.10.31.30.91.70.91.41.11.01.21.01.50.52.30.40.72.41.31.21.01.11.40.71.01.40.9

The Many Faces of Poverty (Volume 3)
57
Table 6. CBMS Composite Indicator, by Barangay, Province of Tarlac, 2008-2009
Ba rang a yMunic ipa l i ty CBMS Compos ite Indicator
Ba rang a yMunic ipa l i ty CBMS Compos ite Indicator
CITY OF TARLAC TarijiTibagTibaganTrinidadUngotVilla Bacolor
CONCEPC ION AlfonsoBalutuCafeCalius GuecoCaluluanCastilloCorazon de JesusCulatinganDunganDutung-A-MatasGreen VillageLilibanganMabilogMagaoMalupaMinanePanalicsianPandoParangParulungPitabunanSan Agustin (Murcia)San AntonioSan Bar tolomeSan FranciscoSan Isidro (Almendras)San Jose (Pob.)San Juan (Castro)San MartinSan Nicolas (Pob.)San Nicolas BalasSan VicenteSanta CruzSanta MariaSanta MonicaSanta RitaSanta RosaSantiagoSanto CristoSanto NiñoSanto RosarioTalimunduc MarimlaTalimunduc San MiguelTelabancaTinang
GERONA AbagonAmacalanApsayanAysonBawaBuenlagBularitCalayaanCarbonelCardonaCaturayDanzoDicolorDon BasilioLuna
GERONA MabiniMagaspacMalayepMatapitapMatayumcabNew SalemOloybuayaPadapadaParsolinganPinasling (Pinasung)PlastadoPoblacion 1Poblacion 2Poblacion 3QuezonRizalSalapunganSan AgustinSan AntonioSan Bar tolomeSan JoseSanta LuciaSantiagoSembranoSingatSulipaTagumbaoTangcaranVilla Paz
LA PAZ BalanoyBantog-CaricutanCaramutanCautComillasDumaraisGuevarraKapanikianLa PurisimaLaraLaungcupangLomboyMacalongMatayumtayumMayangMotricoPaludpudRizalSan Isidro (Pob.)San Roque (Pob.)Sierra
MAYANTOC AmbalingitBaybayaoasBigbigaBinbinacaCalabtanganCaocaoayanCarabaoanCubcubGayonggayongGossoodLabneyMamonitManiniogMapandanNambalanPedro L. Quines
1.91.51.51.11.01.8
1.60.61.40.91.61.31.51.21.10.80.71.11.31.11.00.31.41.11.01.30.70.91.41.20.80.80.70.50.50.60.91.10.90.81.20.60.80.50.81.21.31.71.21.52.0
0.91.10.61.20.71.01.21.12.31.51.41.31.21.01.9
0.91.21.60.82.42.01.11.51.40.80.90.91.00.80.80.91.32.11.52.32.13.61.61.51.31.31.70.91.2
1.51.51.21.51.41.41.41.31.91.51.21.21.22.11.11.11.21.00.81.71.3
1.21.41.42.21.41.40.71.41.81.33.41.61.11.31.41.0

58
The Many Faces of Poverty (Volume 3)
Table 6. CBMS Composite Indicator, by Barangay, Province of Tarlac, 2008-2009
Ba rang a yMunic ipa l i ty CBMS Compos ite Indicator
Ba rang a yMunic ipa l i ty CBMS Compos ite Indicator
MAYANTOC PitombayogPoblacion NortePoblacion SurRotrottoocSan Bar tolomeSan JoseTaldiapanTangcarang
MONCADA Ablang-SapangAringinAtencioBanaoang EastBanaoang WestBaquero Nor teBaquero SurBurgosCalamayCalapanCamangaan EastCamangaan WestCamposanto 1 - Nor teCamposanto 1 - SurCamposanto 2CapaoayanLapsingMabiniMaluacPoblacion 1Poblacion 2Poblacion 3Poblacion 4RizalSan JuanSan JulianSan LeonSan PedroSan RoqueSanta Lucia EastSanta Lucia WestSanta MariaSanta MonicaTolega Nor teTolega SurTubectubangVilla
PANIQUI AbogadoAcocolaoAduasApulidBalaoangBarang (Borang)BrillanteBurgosCabayaoasanCananCarinoCayangaColibangbangCoralDapdapEstacionMabilangManaoisMatalapitapNagmisaanNancamarinan
PANIQUI NipacoPatalanPoblacion NortePoblacion SurRang-ayanSalumagueSamputSan CarlosSan IsidroSan Juan de MillaSanta InesSinigpitTablangVentenilla
PURA BaliteBuenavistaCadanglaanEstiponaLinaoMaasinMatindegMaungibNayaNilasin 1stNilasin 2ndPoblacion 1Poblacion 2Poblacion 3PorocSingat
RAMOS Coral-IlocoGuitebPancePoblacion CenterPoblacion NorthPoblacion SouthSan JuanSan RaymundoToledo
SAN CL EMENTE BallocBambanCasipoCatagudinganDaldalayapDoclong 1Doclong 2MaasinNagsabaranPit-aoPoblacion NortePoblacion Sur
SAN JOSE BurgosDavidIbaLabneyLawacamulagLubiganMaamotMababanabaMorionesPaoSan Juan de ValdezSulaVilla Aglipay
0.81.11.01.40.80.41.21.7
1.41.61.31.61.51.51.70.91.51.71.70.61.20.91.71.01.70.91.91.21.31.70.71.20.80.91.31.12.22.01.60.91.70.91.41.31.0
0.81.00.91.91.30.41.20.70.70.70.60.80.90.41.01.01.40.80.61.71.1
0.71.01.40.50.81.31.10.91.31.60.90.90.91.0
1.31.11.51.00.91.11.10.71.01.00.60.80.90.81.21.0
0.81.01.40.60.41.20.40.40.7
1.11.20.70.72.10.40.91.31.01.10.60.8
1.51.91.21.00.82.54.71.21.41.40.92.02.1

The Many Faces of Poverty (Volume 3)
59
Table 6. CBMS Composite Indicator, by Barangay, Province of Tarlac, 2008-2009
Ba rang a yMunic ipa l i ty CBMS Compos ite Indicator
SAN MANUEL ColubotLanatLegaspiMangandingayMatarannocPacpacoPoblacionSalcedoSan AgustinSan FelipeSan JacintoSan MiguelSan NarcisoSan VicenteSanta Maria
SANTA IGNACIA BaldiosBotbotonesCaanamonganCabaruanCabugbuganCaduldulaoanCalipayanMacaguingNambalanPadapadaPilpilaPinpinasPoblacion EastPoblacion WestPugo-CecilioSan FranciscoSan SoteroSan VicenteSanta Ines CentroSanta Ines EastSanta Ines WestTaguiporoTimmaguabVargas
V ICTORI A BaculongBalayangBalbalotoBangarBantogBatangbatangBuloCabuluanCalibunganCanaremCruzLalapacMaluidMangolagoMasalasaPalacpalacSan AgustinSan AndresSan Fernando (Pob.)San FranciscoSan Gavino (Pob.)San JacintoSan Nicolas (Pob.)San VicenteSanta BarbaraSanta Lucia (Pob.)
1.01.72.61.41.81.21.71.02.41.32.21.20.51.61.4
1.71.21.11.31.81.71.21.71.61.71.11.20.71.62.21.11.21.71.21.61.70.50.91.3
0.81.31.01.01.11.51.01.30.61.21.00.81.21.11.10.80.71.30.90.80.71.01.10.61.21.1