Embed Size (px)
Citation preview
In preparing this research, we did not take into account the investment objectives, financial situation and particular needs of the reader. Before making any investment decision based on this
research, the reader needs to consider, with or without assistance of an adviser, whether the advice is appropriate to their particular investment needs, objectives and financial circumstances.
Please see disclaimer.
The manganese industry worldwide
– trends and opportunities
IMnI’s 39th Annual Conference
Istanbul – 6th June 2013
Duncan Hobbs
+44 20 3037 4497
– 2 –
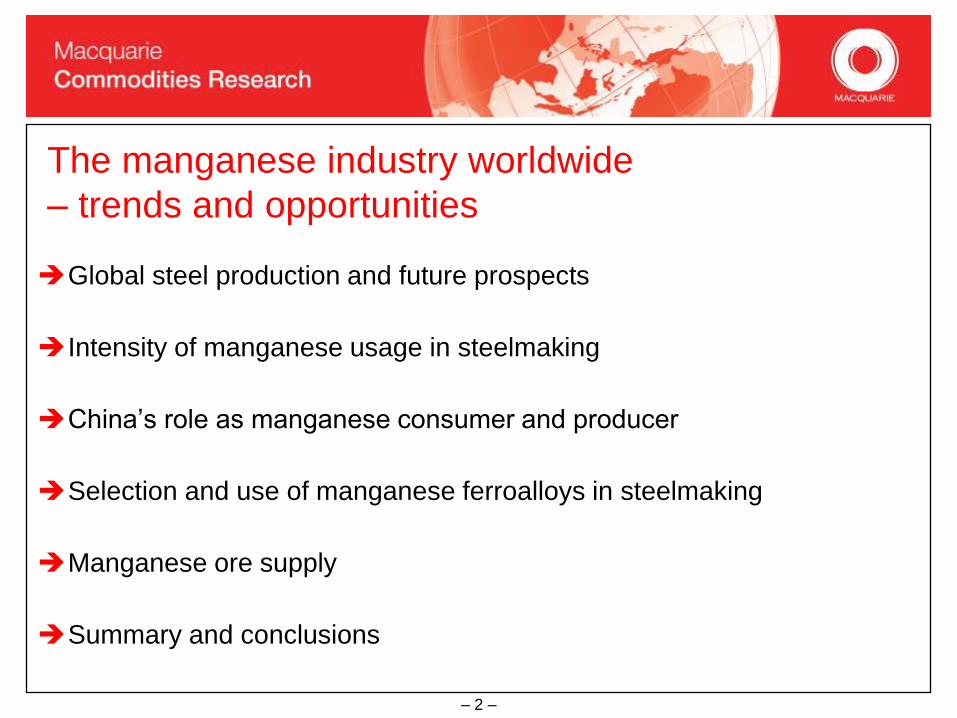
The manganese industry worldwide
– trends and opportunities
Global steel production and future prospects
Intensity of manganese usage in steelmaking
China’s role as manganese consumer and producer
Selection and use of manganese ferroalloys in steelmaking
Manganese ore supply
Summary and conclusions
– 3 –
The manganese industry worldwide
– trends and opportunities
Global steel production and future prospects
Intensity of manganese usage in steelmaking
China’s role as manganese consumer and producer
Selection and use of manganese ferroalloys in steelmaking
Manganese ore supply
Summary and conclusions
– 4 –
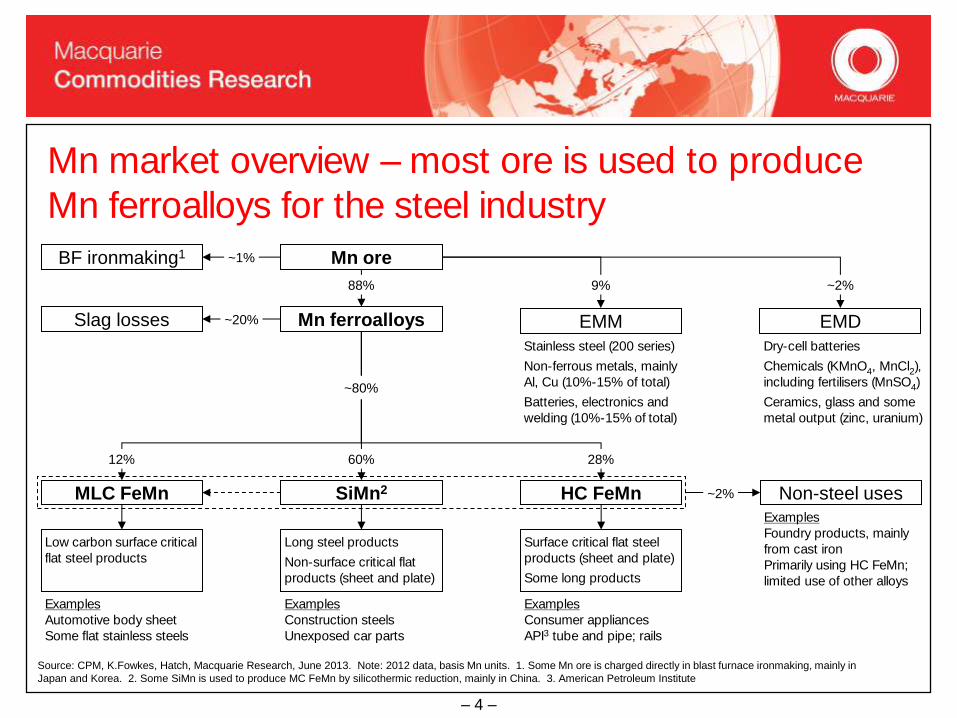
Mn market overview – most ore is used to produce
Mn ferroalloys for the steel industry
Mn ore BF ironmaking1
Mn ferroalloys Slag losses
SiMn2 MLC FeMn HC FeMn Non-steel uses
EMM EMD
~1%
88%
~20%
~80%
60% 12% 28%
~2%
9% ~2%
Stainless steel (200 series)
Non-ferrous metals, mainly
Al, Cu (10%-15% of total)
Batteries, electronics and
welding (10%-15% of total)
Dry-cell batteries
Chemicals (KMnO4, MnCl2),
including fertilisers (MnSO4)
Ceramics, glass and some
metal output (zinc, uranium)
Low carbon surface critical
flat steel products
Long steel products
Non-surface critical flat
products (sheet and plate)
Surface critical flat steel
products (sheet and plate)
Some long products
Examples
Foundry products, mainly
from cast iron
Primarily using HC FeMn;
limited use of other alloys
Examples
Automotive body sheet
Some flat stainless steels
Examples
Construction steels
Unexposed car parts
Examples
Consumer appliances
API3 tube and pipe; rails
Source: CPM, K.Fowkes, Hatch, Macquarie Research, June 2013. Note: 2012 data, basis Mn units. 1. Some Mn ore is charged directly in blast furnace ironmaking, mainly in
Japan and Korea. 2. Some SiMn is used to produce MC FeMn by silicothermic reduction, mainly in China. 3. American Petroleum Institute
– 5 –
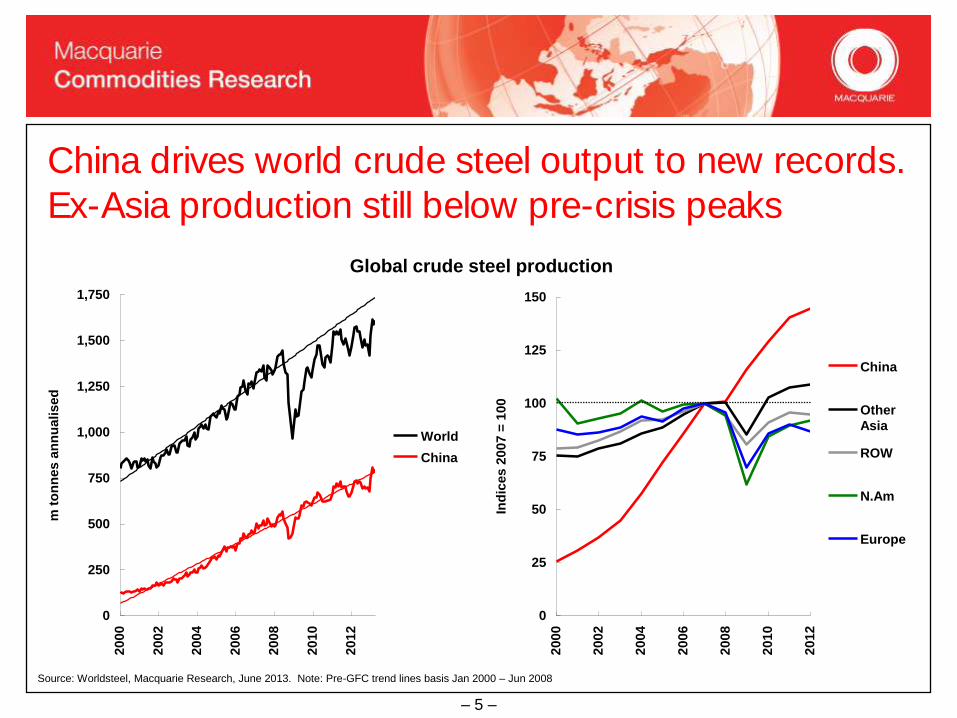
China drives world crude steel output to new records.
Ex-Asia production still below pre-crisis peaks
Global crude steel production
0
250
500
750
1,000
1,250
1,500
1,750
2000
2002
2004
2006
2008
2010
2012
m t
on
nes a
nn
ualised
World
China
0
25
50
75
100
125
150
2000
2002
2004
2006
2008
2010
2012
Ind
ices 2
007 =
100
China
Other
Asia
ROW
N.Am
Europe
Source: Worldsteel, Macquarie Research, June 2013. Note: Pre-GFC trend lines basis Jan 2000 – Jun 2008
– 6 –
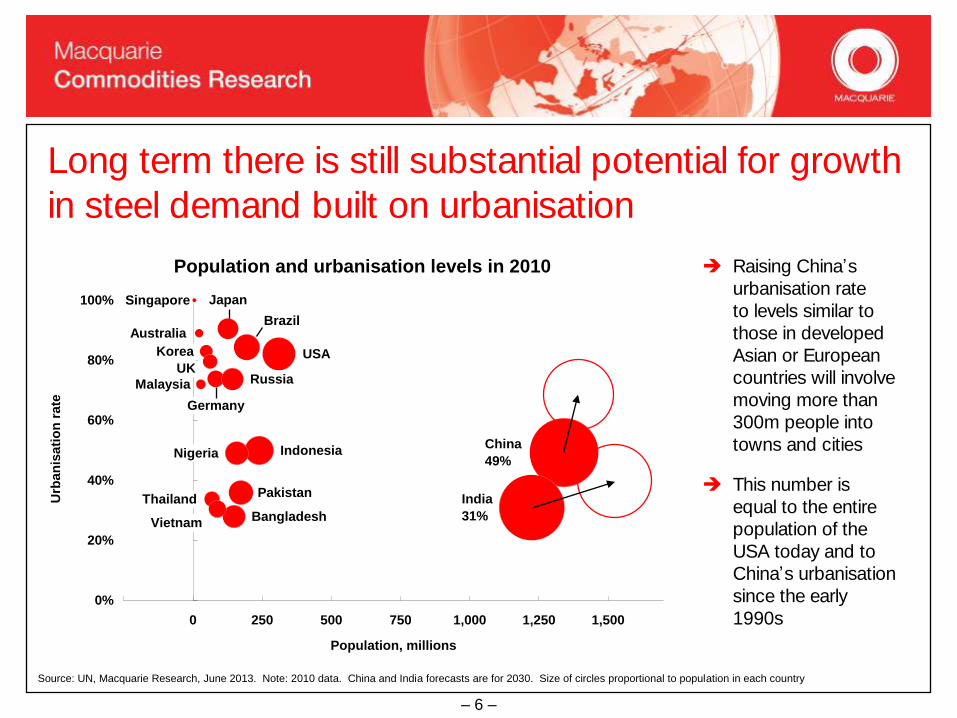
Long term there is still substantial potential for growth
in steel demand built on urbanisation
Population and urbanisation levels in 2010
Germany
Korea
Russia
Brazil
UKUSA
Indonesia
Pakistan
Bangladesh
China
49%
India
31%
Australia
Nigeria
Malaysia
Thailand
Vietnam
Singapore Japan
0%
20%
40%
60%
80%
100%
-250 0 250 500 750 1,000 1,250 1,500
Population, millions
Urb
an
isati
on
rate
-250
Raising China’s
urbanisation rate
to levels similar to
those in developed
Asian or European
countries will involve
moving more than
300m people into
towns and cities
This number is
equal to the entire
population of the
USA today and to
China’s urbanisation
since the early
1990s
Source: UN, Macquarie Research, June 2013. Note: 2010 data. China and India forecasts are for 2030. Size of circles proportional to population in each country
– 7 –
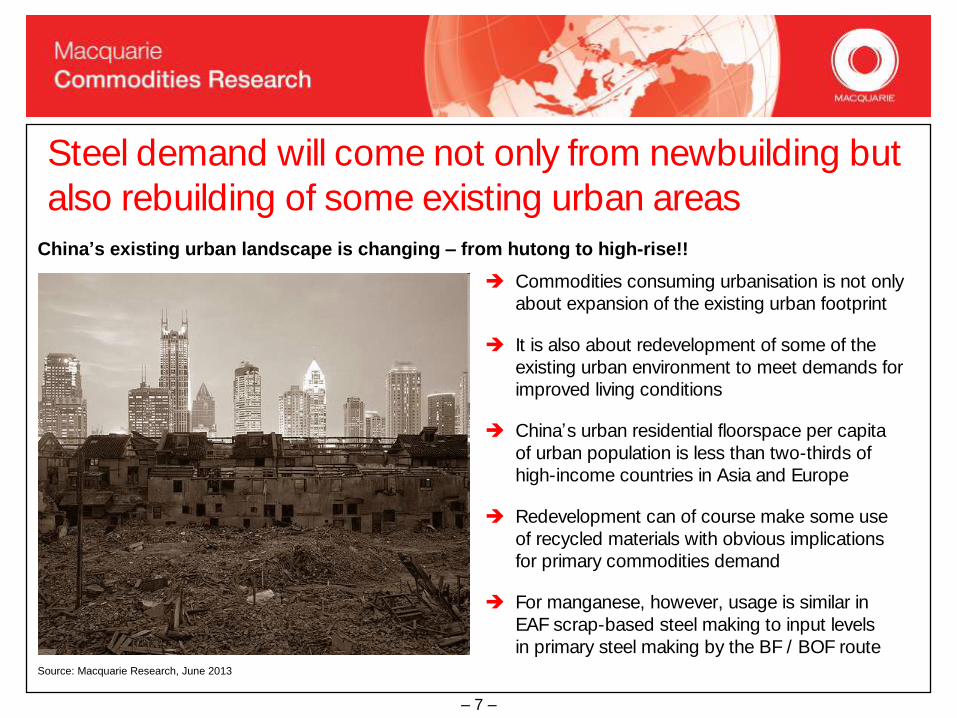
Steel demand will come not only from newbuilding but
also rebuilding of some existing urban areas
China’s existing urban landscape is changing – from hutong to high-rise!!
Commodities consuming urbanisation is not only
about expansion of the existing urban footprint
It is also about redevelopment of some of the
existing urban environment to meet demands for
improved living conditions
China’s urban residential floorspace per capita
of urban population is less than two-thirds of
high-income countries in Asia and Europe
Redevelopment can of course make some use
of recycled materials with obvious implications
for primary commodities demand
For manganese, however, usage is similar in
EAF scrap-based steel making to input levels
in primary steel making by the BF / BOF routeSource: Macquarie Research, June 2013
– 8 –
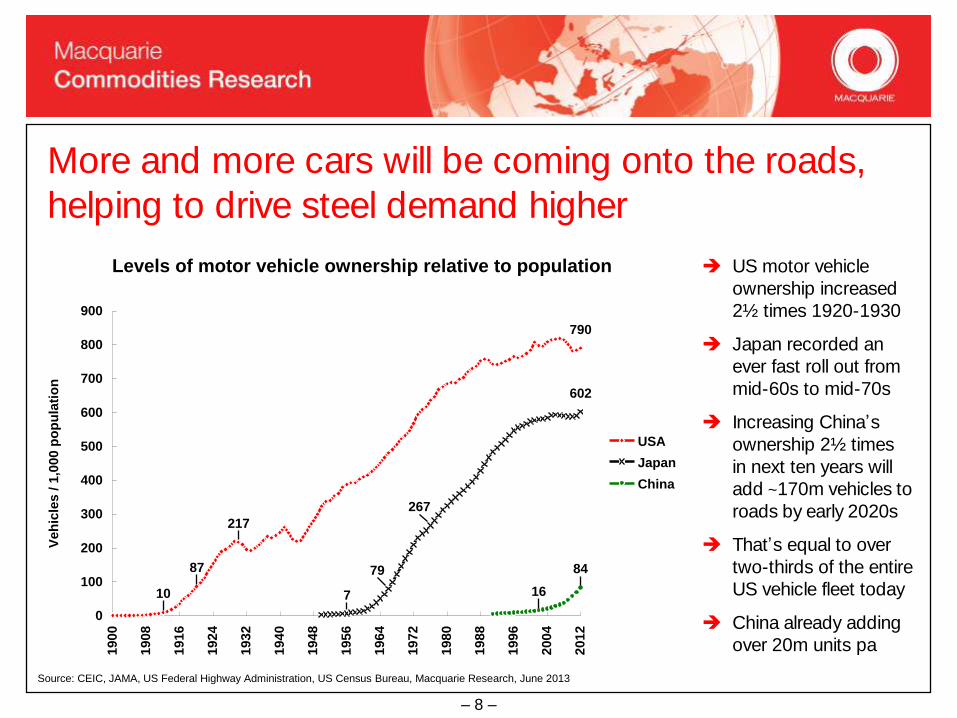
More and more cars will be coming onto the roads,
helping to drive steel demand higher
Levels of motor vehicle ownership relative to population
790
602
84
0
100
200
300
400
500
600
700
800
900
1900
1908
1916
1924
1932
1940
1948
1956
1964
1972
1980
1988
1996
2004
2012
Veh
icle
s / 1
,000 p
op
ula
tio
n
USA
Japan
China
10
87
217
7
79
267
16
84
US motor vehicle
ownership increased
2½ times 1920-1930
Japan recorded an
ever fast roll out from
mid-60s to mid-70s
Increasing China’s
ownership 2½ times
in next ten years will
add ~170m vehicles to
roads by early 2020s
That’s equal to over
two-thirds of the entire
US vehicle fleet today
China already adding
over 20m units pa
Source: CEIC, JAMA, US Federal Highway Administration, US Census Bureau, Macquarie Research, June 2013
– 9 –
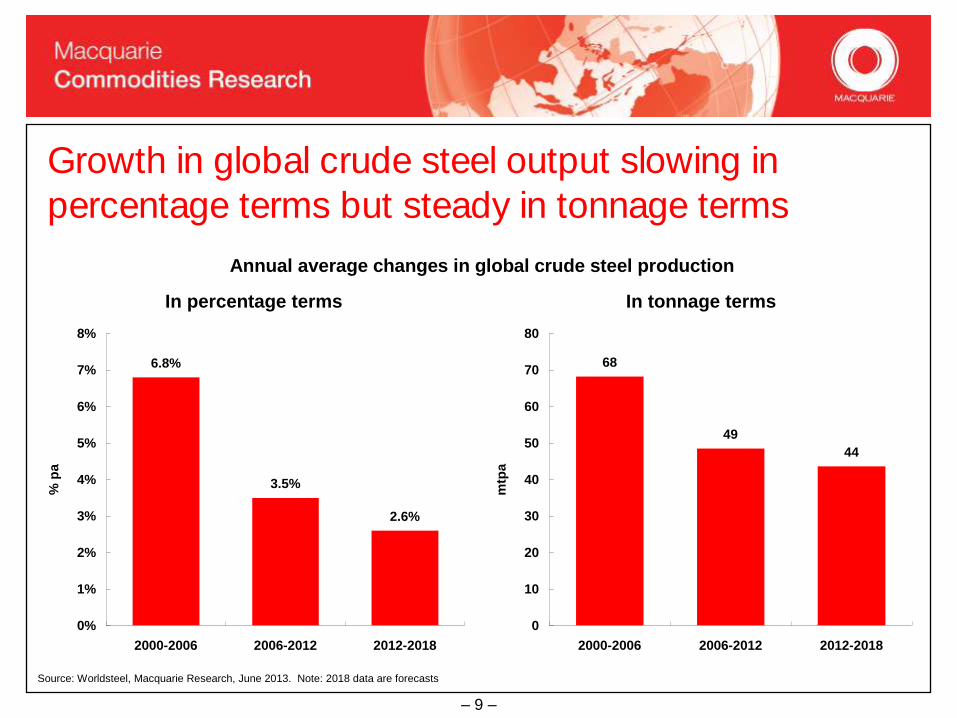
Growth in global crude steel output slowing in
percentage terms but steady in tonnage terms
Annual average changes in global crude steel production
In percentage terms
6.8%
3.5%
2.6%
0%
1%
2%
3%
4%
5%
6%
7%
8%
2000-2006 2006-2012 2012-2018
% p
a
In tonnage terms
68
49
44
0
10
20
30
40
50
60
70
80
2000-2006 2006-2012 2012-2018
mtp
a
Source: Worldsteel, Macquarie Research, June 2013. Note: 2018 data are forecasts
– 10 –
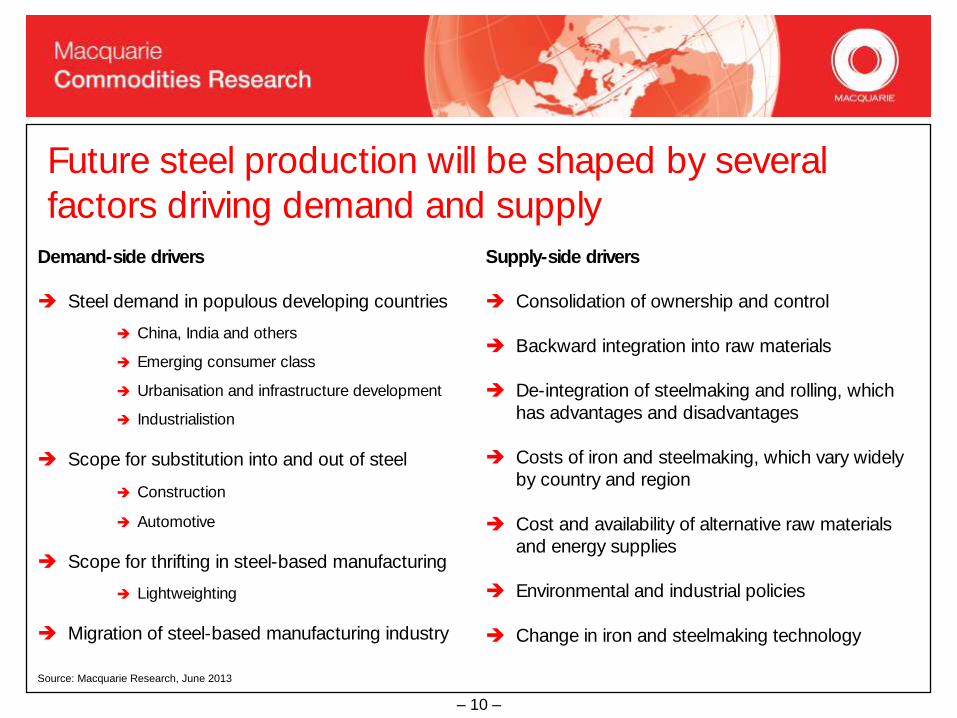
Future steel production will be shaped by several
factors driving demand and supply
Demand-side drivers
Steel demand in populous developing countries
China, India and others
Emerging consumer class
Urbanisation and infrastructure development
Industrialistion
Scope for substitution into and out of steel
Construction
Automotive
Scope for thrifting in steel-based manufacturing
Lightweighting
Migration of steel-based manufacturing industry
Supply-side drivers
Consolidation of ownership and control
Backward integration into raw materials
De-integration of steelmaking and rolling, which
has advantages and disadvantages
Costs of iron and steelmaking, which vary widely
by country and region
Cost and availability of alternative raw materials
and energy supplies
Environmental and industrial policies
Change in iron and steelmaking technology
Source: Macquarie Research, June 2013
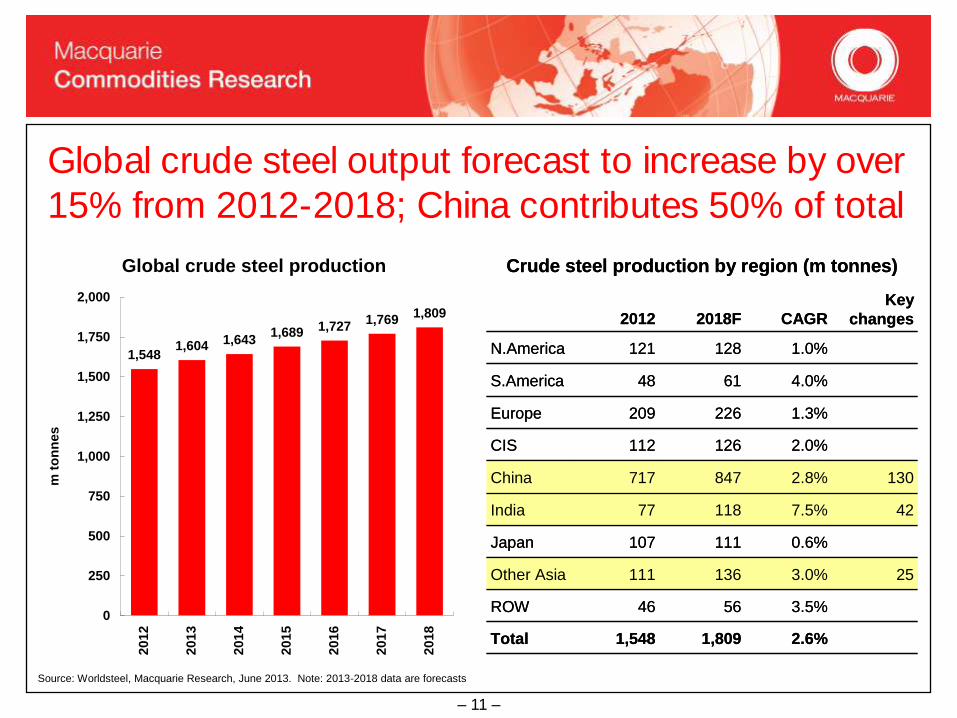
– 11 –
Global crude steel output forecast to increase by over
15% from 2012-2018; China contributes 50% of total
Global crude steel production
1,5481,604 1,643
1,689 1,7271,769
1,809
0
250
500
750
1,000
1,250
1,500
1,750
2,000
2012
2013
2014
2015
2016
2017
2018
m t
on
nes
2.6%1,8091,548Total
3.5%5646ROW
253.0%136111Other Asia
0.6%111107Japan
427.5%11877India
1302.8%847717China
2.0%126112CIS
1.3%226209Europe
4.0%6148S.America
1.0%128121N.America
Key
changesCAGR2018F2012
Crude steel production by region (m tonnes)
2.6%1,8091,548Total
3.5%5646ROW
253.0%136111Other Asia
0.6%111107Japan
427.5%11877India
1302.8%847717China
2.0%126112CIS
1.3%226209Europe
4.0%6148S.America
1.0%128121N.America
Key
changesCAGR2018F2012
Crude steel production by region (m tonnes)
Source: Worldsteel, Macquarie Research, June 2013. Note: 2013-2018 data are forecasts
– 12 –
The manganese industry worldwide
– trends and opportunities
Global steel production and future prospects
Intensity of manganese usage in steelmaking
China’s role as manganese consumer and producer
Selection and use of manganese ferroalloys in steelmaking
Manganese ore supply
Summary and conclusions
– 13 –
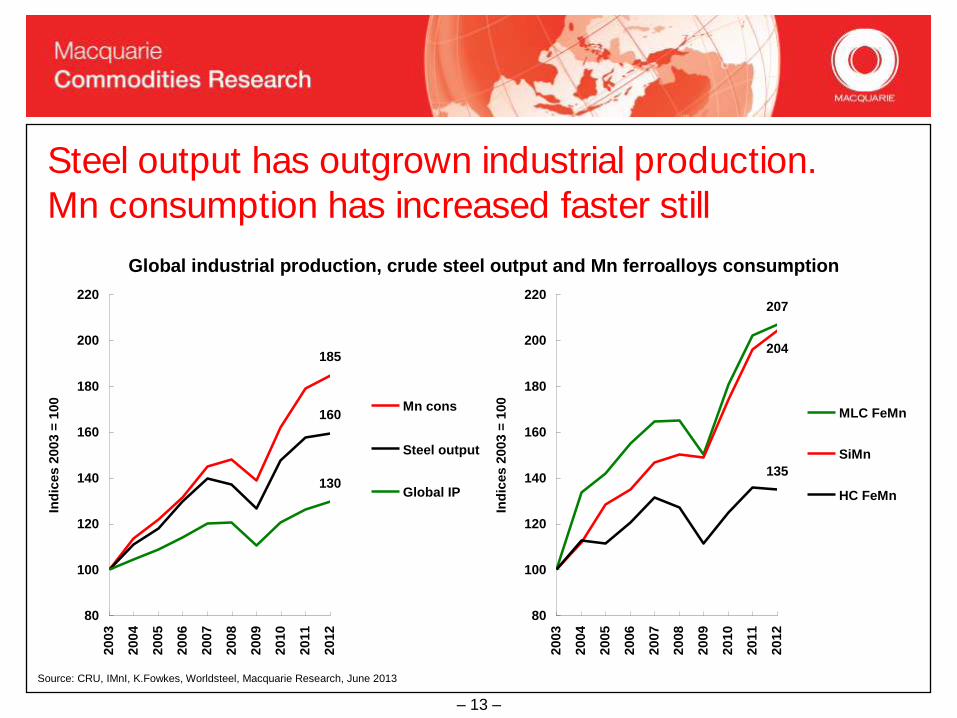
Steel output has outgrown industrial production.
Mn consumption has increased faster still
Global industrial production, crude steel output and Mn ferroalloys consumption
185
160
130
80
100
120
140
160
180
200
220
2003
2004
2005
2006
2007
2008
2009
2010
2011
2012
Ind
ices 2
003 =
100 Mn cons
Steel
output
Global IP
Steel output
207
204
135
80
100
120
140
160
180
200
220
2003
2004
2005
2006
2007
2008
2009
2010
2011
2012
Ind
ices 2
003 =
100
MLC FeMn
SiMn
HC FeMn
Source: CRU, IMnI, K.Fowkes, Worldsteel, Macquarie Research, June 2013
– 14 –
Intensity of manganese use in steelmaking has
increased by 15% in the last decade
Unit Mn usage in steel production
8.1
7.2
7.0
7.2
7.4
7.6
7.8
8.0
8.2
8.4
2003
2004
2005
2006
2007
2008
2009
2010
2011
2012
3Y
MA
, kg
Mn
/ t
on
ne s
teel
World Mn ferroalloys consumption
7.0
4.1
1.8
0
2
4
6
8
10
12
14
2012
m t
on
nes M
n c
on
tain
ed
Mn used in steelmaking in 2003
Increased Mn usage from rise
in steel production 2003-2012
Increased Mn usage from rise
in intensity of use 2003-2012
Source: K.Fowkes, IMnI, Worldsteel, Macquarie Research, June 2013. Note: data include EMM and direct charged Mn ore
– 15 –
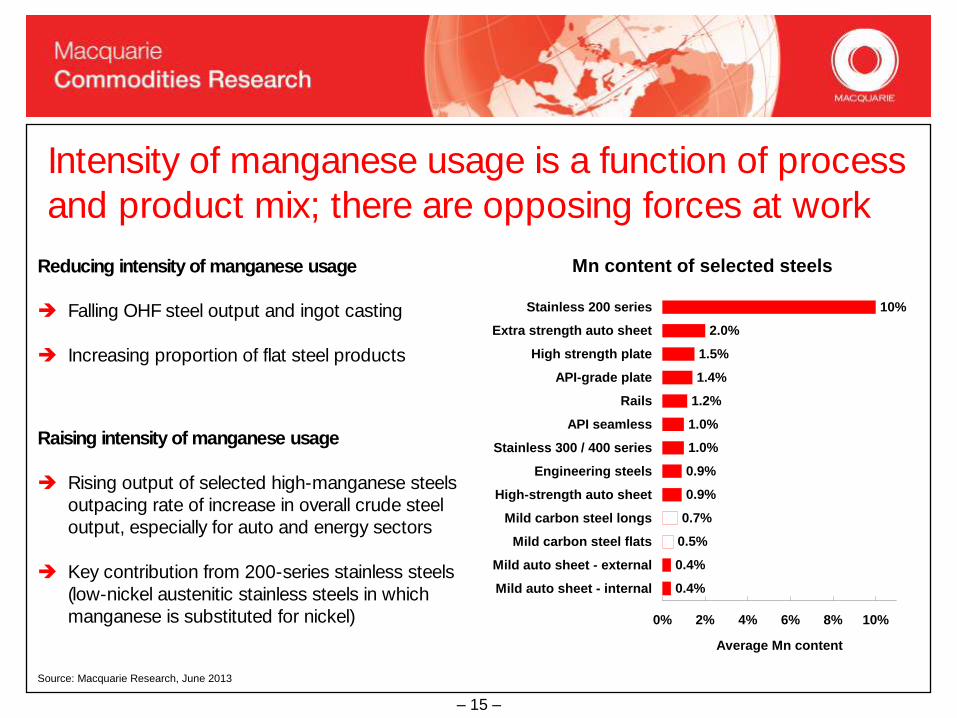
Intensity of manganese usage is a function of process
and product mix; there are opposing forces at work
Reducing intensity of manganese usage
Falling OHF steel output and ingot casting
Increasing proportion of flat steel products
Raising intensity of manganese usage
Rising output of selected high-manganese steels
outpacing rate of increase in overall crude steel
output, especially for auto and energy sectors
Key contribution from 200-series stainless steels
(low-nickel austenitic stainless steels in which
manganese is substituted for nickel)
Source: Macquarie Research, June 2013
Mn content of selected steels
2.0%
1.5%
1.4%
1.2%
1.0%
1.0%
0.9%
0.9%
0.7%
0.5%
0.4%
0.4%
10%
0% 2% 4% 6% 8% 10%
Stainless 200 series
Extra strength auto sheet
High strength plate
API-grade plate
Rails
API seamless
Stainless 300 / 400 series
Engineering steels
High-strength auto sheet
Mild carbon steel longs
Mild carbon steel flats
Mild auto sheet - external
Mild auto sheet - internal
Average Mn content
– 16 –
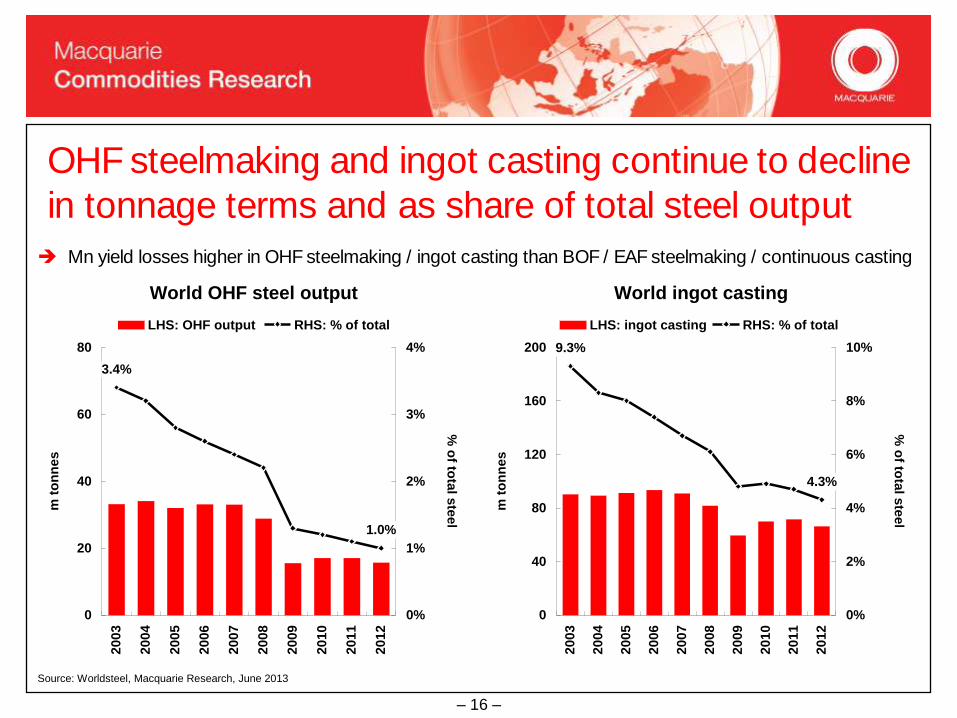
OHF steelmaking and ingot casting continue to decline
in tonnage terms and as share of total steel output
Source: Worldsteel, Macquarie Research, June 2013
Mn yield losses higher in OHF steelmaking / ingot casting than BOF / EAF steelmaking / continuous casting
World OHF steel output
1.0%
3.4%
0
20
40
60
80
2003
2004
2005
2006
2007
2008
2009
2010
2011
2012
m t
on
nes
0%
1%
2%
3%
4%
% o
f tota
l ste
el
LHS: OHF output RHS: % of total
World ingot casting
4.3%
9.3%
0
40
80
120
160
200
2003
2004
2005
2006
2007
2008
2009
2010
2011
2012
m t
on
nes
0%
2%
4%
6%
8%
10%
% o
f tota
l ste
el
LHS: ingot casting RHS: % of total
– 17 –
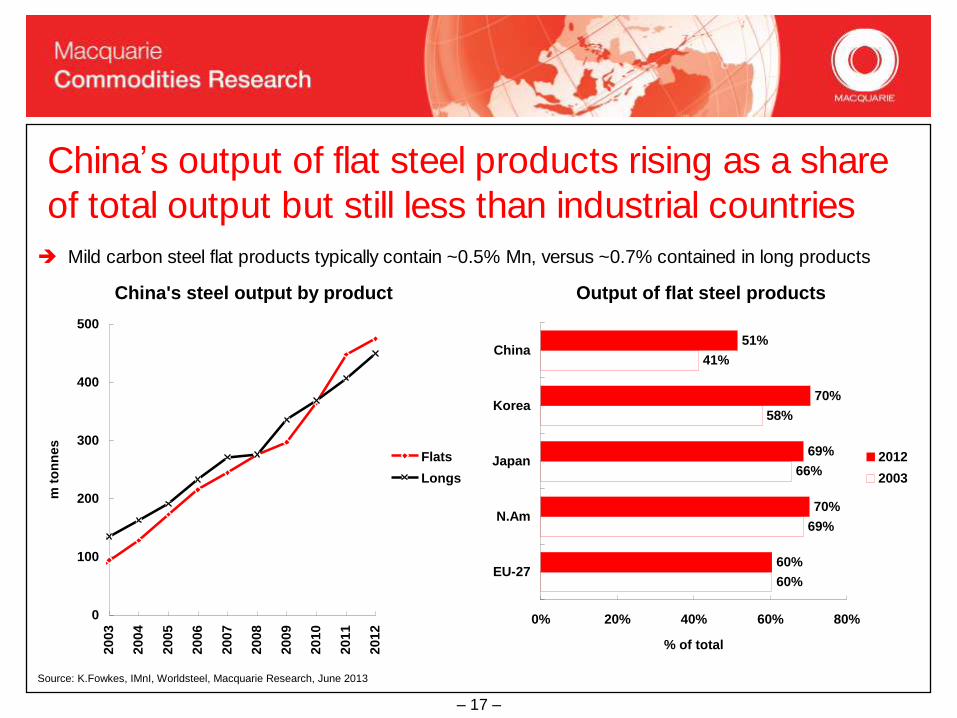
China’s output of flat steel products rising as a share
of total output but still less than industrial countries
Source: K.Fowkes, IMnI, Worldsteel, Macquarie Research, June 2013
Mild carbon steel flat products typically contain ~0.5% Mn, versus ~0.7% contained in long products
China's steel output by product
0
100
200
300
400
500
2003
2004
2005
2006
2007
2008
2009
2010
2011
2012
m t
on
nes
Flats
Longs
Output of flat steel products
60%
69%
66%
58%
41%
60%
70%
69%
70%
51%
0% 20% 40% 60% 80%
EU-27
N.Am
Japan
Korea
China
% of total
2012
2003
– 18 –
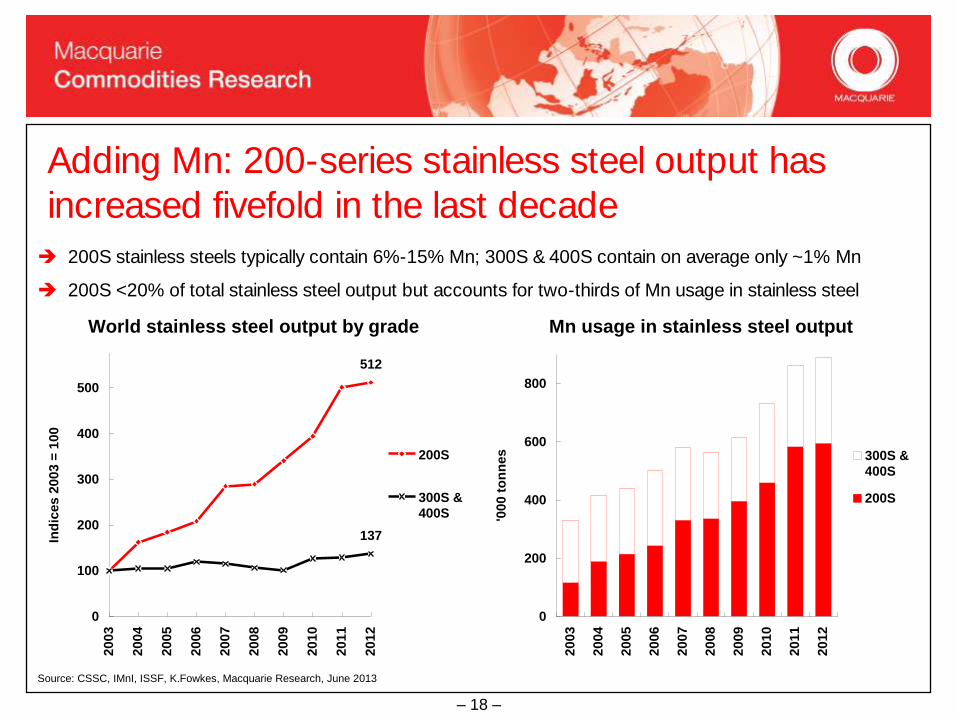
Adding Mn: 200-series stainless steel output has
increased fivefold in the last decade
200S stainless steels typically contain 6%-15% Mn; 300S & 400S contain on average only ~1% Mn
200S <20% of total stainless steel output but accounts for two-thirds of Mn usage in stainless steel
World stainless steel output by grade
512
137
0
100
200
300
400
500
2003
2004
2005
2006
2007
2008
2009
2010
2011
2012
Ind
ices
20
03
= 1
00
200S
300S &
400S
Mn usage in stainless steel output
0
200
400
600
800
2003
2004
2005
2006
2007
2008
2009
2010
2011
2012
'00
0 t
on
ne
s 300S &
400S
200S
Source: CSSC, IMnI, ISSF, K.Fowkes, Macquarie Research, June 2013
– 19 –
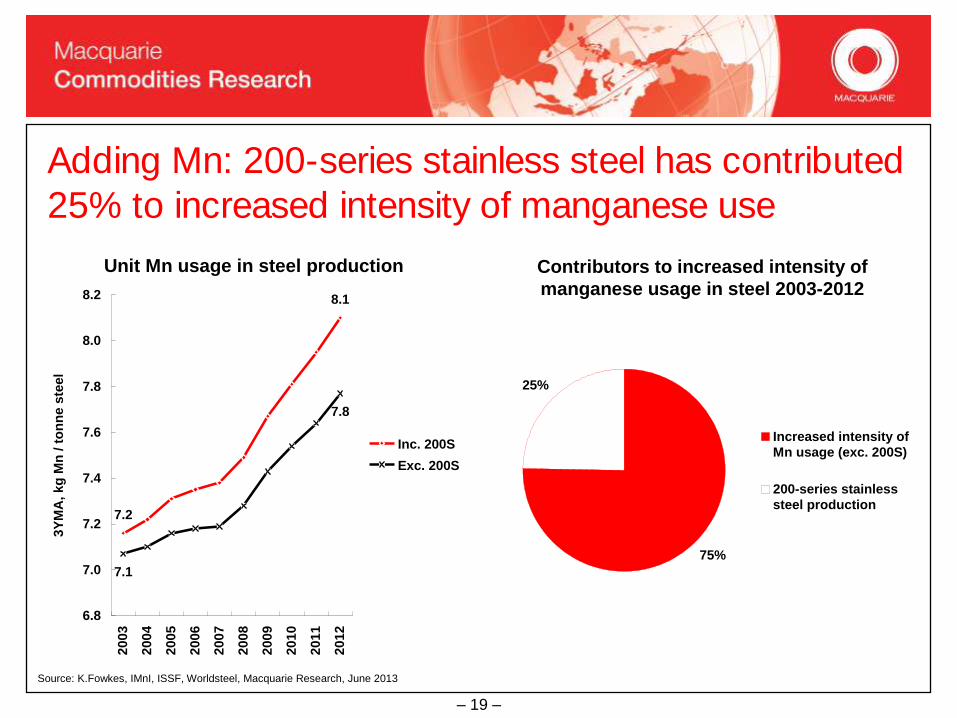
Adding Mn: 200-series stainless steel has contributed
25% to increased intensity of manganese use
Source: K.Fowkes, IMnI, ISSF, Worldsteel, Macquarie Research, June 2013
Unit Mn usage in steel production
7.2
8.1
7.8
7.1
6.8
7.0
7.2
7.4
7.6
7.8
8.0
8.2
2003
2004
2005
2006
2007
2008
2009
2010
2011
2012
3Y
MA
, kg
Mn
/ t
on
ne s
teel
Inc. 200S
Exc. 200S
Title
75%
25%
Increased intensity of
Mn usage (exc. 200S)
200-series stainless
steel production
Contributors to increased intensity of
manganese usage in steel 2003-2012
– 20 –
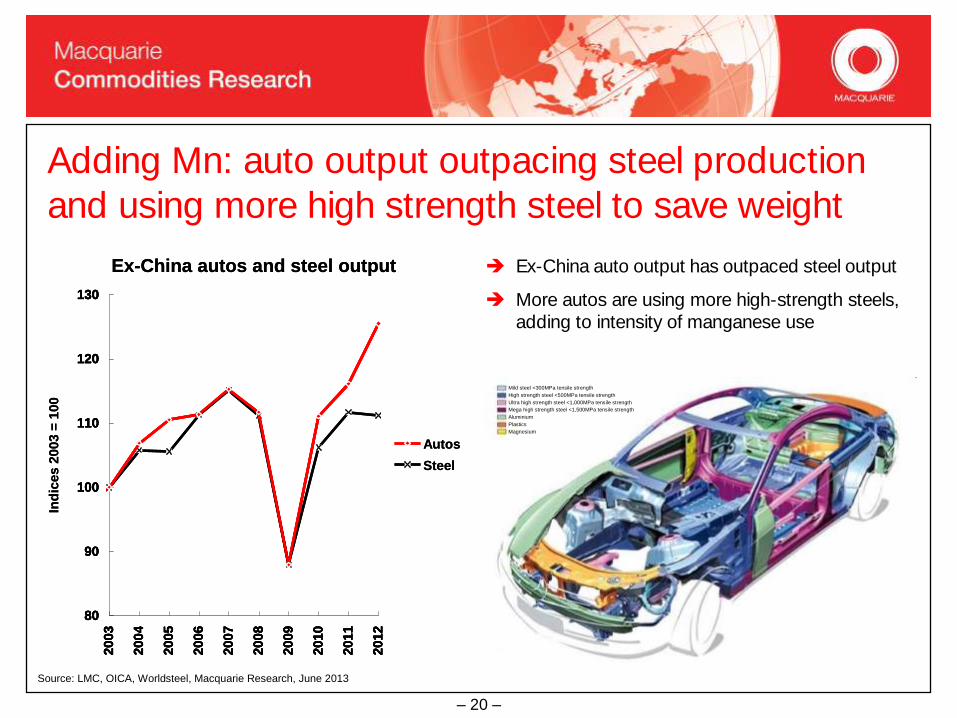
Adding Mn: auto output outpacing steel production
and using more high strength steel to save weight
Ex-China autos and steel output
80
90
100
110
120
130
2003
2004
2005
2006
2007
2008
2009
2010
2011
2012
Ind
ices 2
003 =
100
Autos
Steel
80
90
100
110
120
130
2003
2004
2005
2006
2007
2008
2009
2010
2011
2012
Ex-China autos and steel output
80
90
100
110
120
130
2003
2004
2005
2006
2007
2008
2009
2010
2011
2012
Ind
ices 2
003 =
100
Autos
Steel
80
90
100
110
120
130
2003
2004
2005
2006
2007
2008
2009
2010
2011
2012
Ex-China auto output has outpaced steel output
More autos are using more high-strength steels,
adding to intensity of manganese use
Mild steel <300MPa tensile strength
High strength steel <500MPa tensile strength
Ultra high strength steel <1,000MPa tensile strength
Mega high strength steel <1,500MPa tensile strength
Aluminium
Plastics
Magnesium
Mild steel <300MPa tensile strength
High strength steel <500MPa tensile strength
Ultra high strength steel <1,000MPa tensile strength
Mega high strength steel <1,500MPa tensile strength
Aluminium
Plastics
Magnesium
Source: LMC, OICA, Worldsteel, Macquarie Research, June 2013
– 21 –
The manganese industry worldwide
– trends and opportunities
Global steel production and future prospects
Intensity of manganese usage in steelmaking
China’s role as manganese consumer and producer
Selection and use of manganese ferroalloys in steelmaking
Manganese ore supply
Summary and conclusions
– 22 –
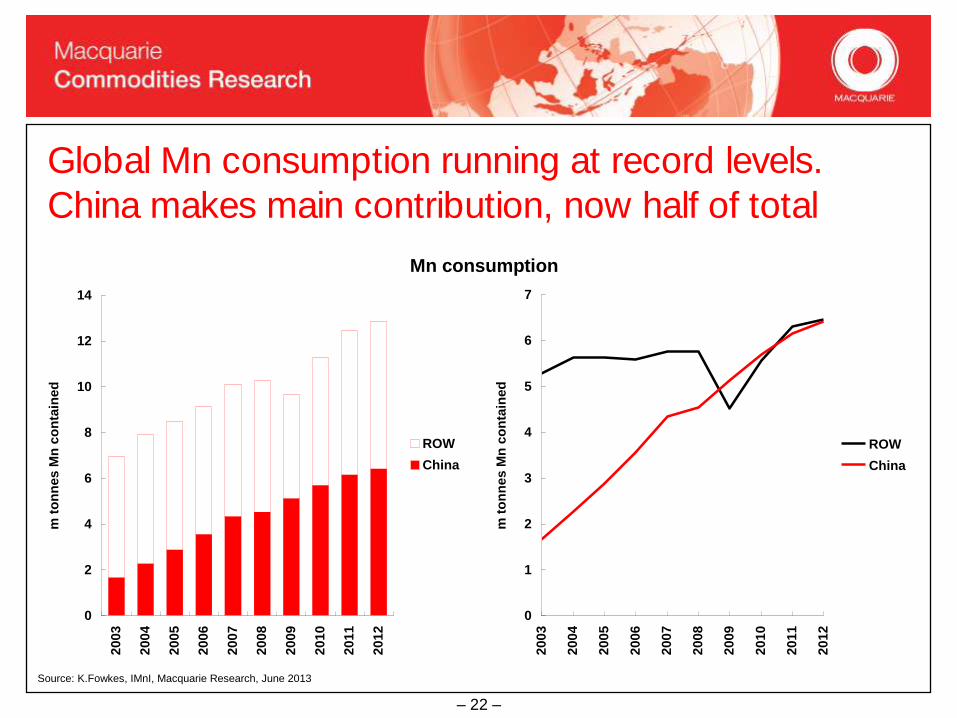
Global Mn consumption running at record levels.
China makes main contribution, now half of total
Mn consumption
0
2
4
6
8
10
12
14
2003
2004
2005
2006
2007
2008
2009
2010
2011
2012
m t
on
nes M
n c
on
tain
ed
ROW
China
0
1
2
3
4
5
6
7
2003
2004
2005
2006
2007
2008
2009
2010
2011
2012
m t
on
nes M
n c
on
tain
ed
ROW
China
Source: K.Fowkes, IMnI, Macquarie Research, June 2013
– 23 –
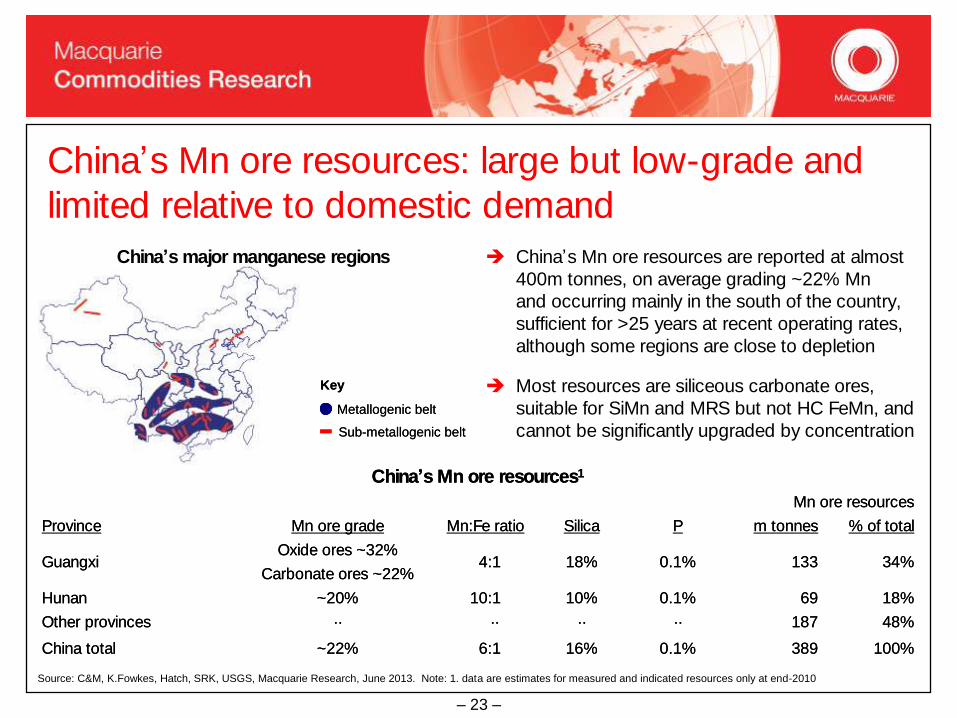
China’s Mn ore resources: large but low-grade and
limited relative to domestic demand
China’s major manganese regions
Key
Metallogenic belt
Sub-metallogenic belt
Key
Metallogenic belt
Sub-metallogenic belt
China’s Mn ore resources are reported at almost
400m tonnes, on average grading ~22% Mn
and occurring mainly in the south of the country,
sufficient for >25 years at recent operating rates,
although some regions are close to depletion
Most resources are siliceous carbonate ores,
suitable for SiMn and MRS but not HC FeMn, and
cannot be significantly upgraded by concentration
Mn ore resources
% of totalm tonnesPSilicaMn:Fe ratioMn ore gradeProvince
100%3890.1%16%06:1~22%China total
48%187········Other provinces
18%690.1%10%10:1~20%Hunan
Carbonate ores ~22%34%1330.1%18%04:1
Oxide ores ~32%Guangxi
China’s Mn ore resources1
Mn ore resources
% of totalm tonnesPSilicaMn:Fe ratioMn ore gradeProvince
100%3890.1%16%06:1~22%China total
48%187········Other provinces
18%690.1%10%10:1~20%Hunan
Carbonate ores ~22%34%1330.1%18%04:1
Oxide ores ~32%Guangxi
China’s Mn ore resources1
Source: C&M, K.Fowkes, Hatch, SRK, USGS, Macquarie Research, June 2013. Note: 1. data are estimates for measured and indicated resources only at end-2010
– 24 –
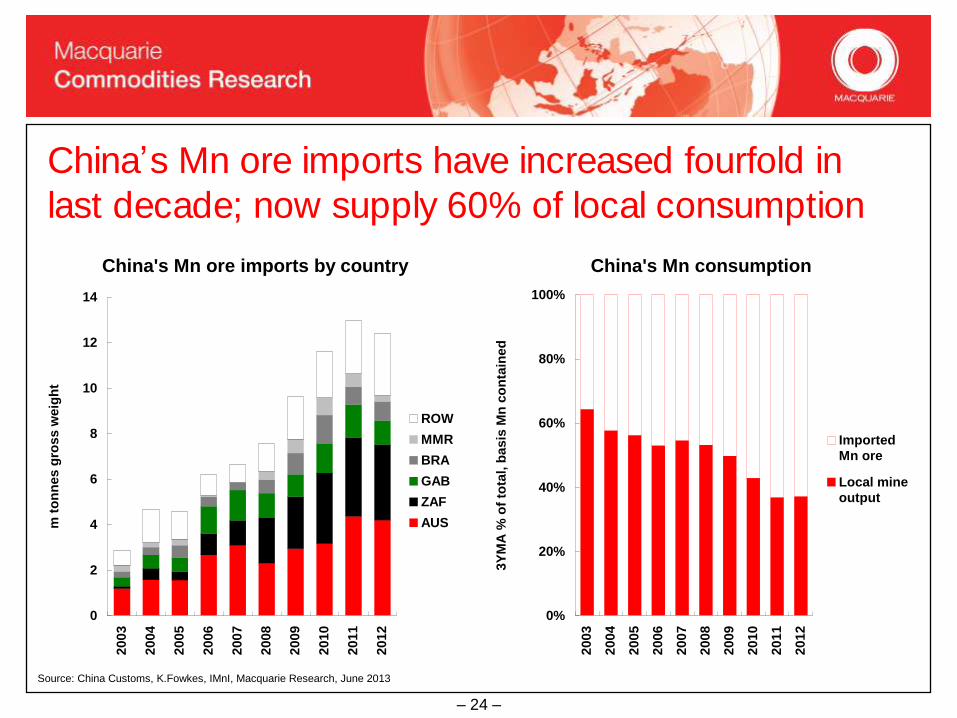
China’s Mn ore imports have increased fourfold in
last decade; now supply 60% of local consumption
China's Mn ore imports by country
0
2
4
6
8
10
12
14
2003
2004
2005
2006
2007
2008
2009
2010
2011
2012
m t
on
nes g
ross w
eig
ht
ROW
MMR
BRA
GAB
ZAF
AUS
China's Mn consumption
0%
20%
40%
60%
80%
100%
2003
2004
2005
2006
2007
2008
2009
2010
2011
2012
3Y
MA
% o
f to
tal, b
asis
Mn
co
nta
ined
Imported
Mn ore
Local mine
output
Source: China Customs, K.Fowkes, IMnI, Macquarie Research, June 2013
– 25 –
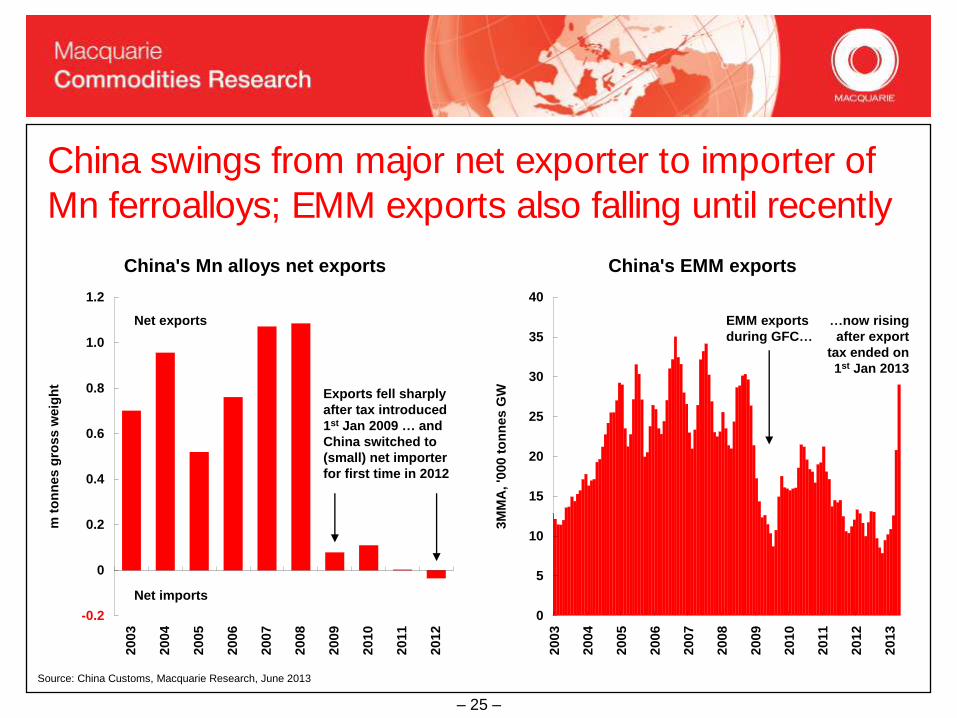
China swings from major net exporter to importer of
Mn ferroalloys; EMM exports also falling until recently
China's Mn alloys net exports
-0.2
0
0.2
0.4
0.6
0.8
1.0
1.2
2003
2004
2005
2006
2007
2008
2009
2010
2011
2012
m t
on
nes g
ross w
eig
ht
Net exports
Net imports
Exports fell sharply
after tax introduced
1st Jan 2009 … and
China switched to
(small) net importer
for first time in 2012
China's EMM exports
0
5
10
15
20
25
30
35
40
2003
2004
2005
2006
2007
2008
2009
2010
2011
2012
2013
3M
MA
, '0
00 t
on
nes G
W
EMM exports
during GFC…
…now rising
after export
tax ended on
1st Jan 2013
Source: China Customs, Macquarie Research, June 2013
– 26 –
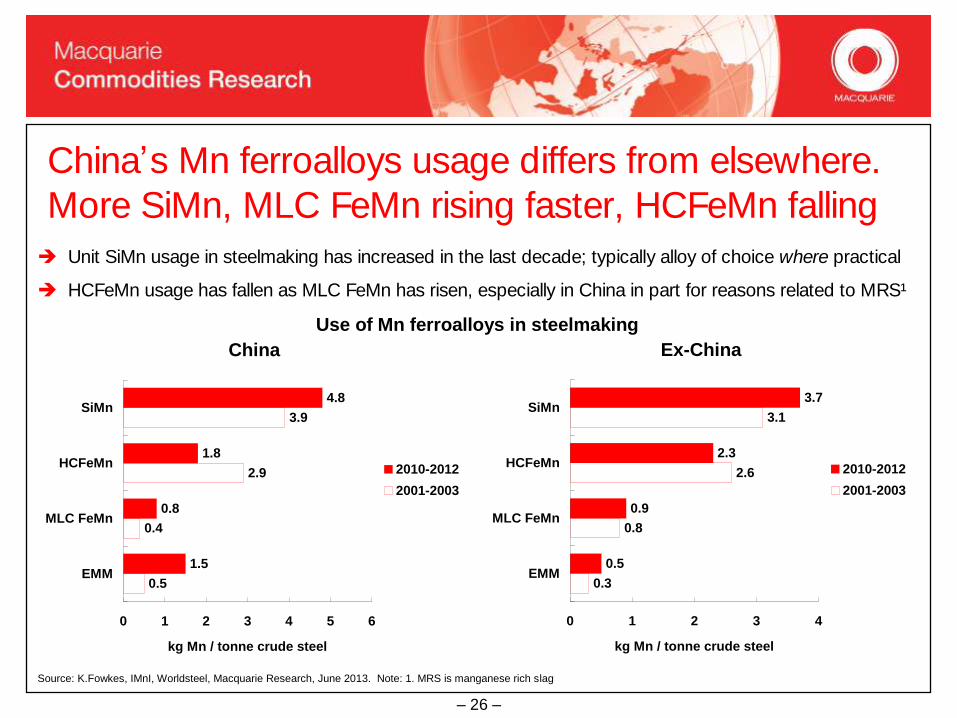
China’s Mn ferroalloys usage differs from elsewhere.
More SiMn, MLC FeMn rising faster, HCFeMn falling
Unit SiMn usage in steelmaking has increased in the last decade; typically alloy of choice where practical
HCFeMn usage has fallen as MLC FeMn has risen, especially in China in part for reasons related to MRS¹
Use of Mn ferroalloys in steelmaking
China
4.8
1.8
0.8
1.5
3.9
2.9
0.4
0.5
0 1 2 3 4 5 6
SiMn
HCFeMn
MLC FeMn
EMM
kg Mn / tonne crude steel
2010-2012
2001-2003
Ex-China
3.7
2.3
0.9
0.5
3.1
2.6
0.8
0.3
0 1 2 3 4
SiMn
HCFeMn
MLC FeMn
EMM
kg Mn / tonne crude steel
2010-2012
2001-2003
Source: K.Fowkes, IMnI, Worldsteel, Macquarie Research, June 2013. Note: 1. MRS is manganese rich slag
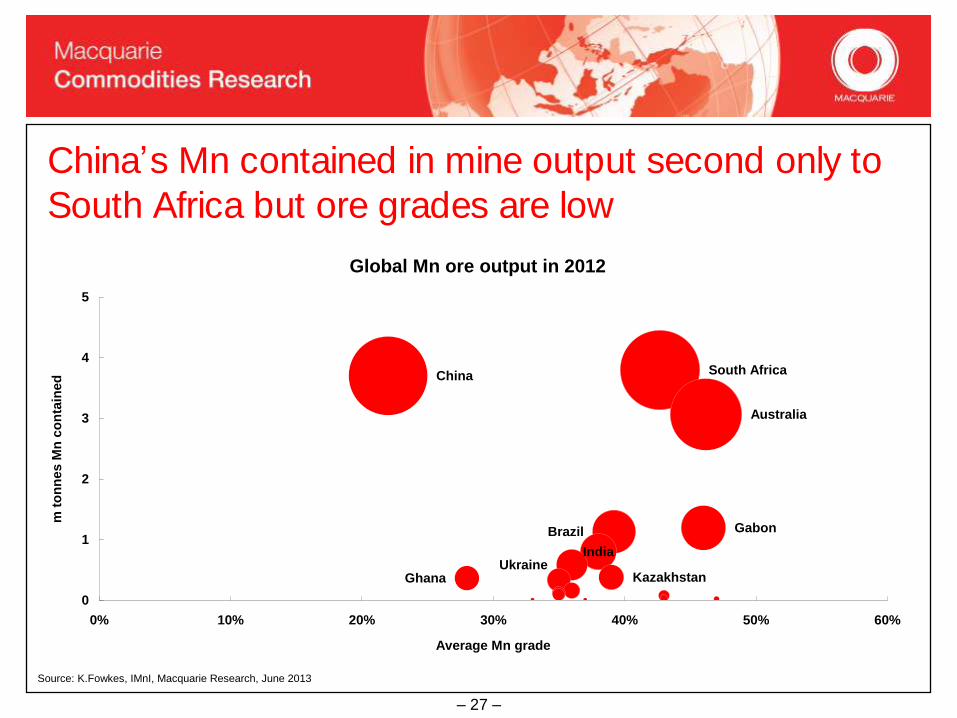
– 27 –
China’s Mn contained in mine output second only to
South Africa but ore grades are low
Global Mn ore output in 2012
KazakhstanUkraine
India
Brazil
Ghana
Gabon
Australia
South AfricaChina
0
1
2
3
4
5
0% 10% 20% 30% 40% 50% 60%
Average Mn grade
m t
on
nes M
n c
on
tain
ed
Source: K.Fowkes, IMnI, Macquarie Research, June 2013
– 28 –
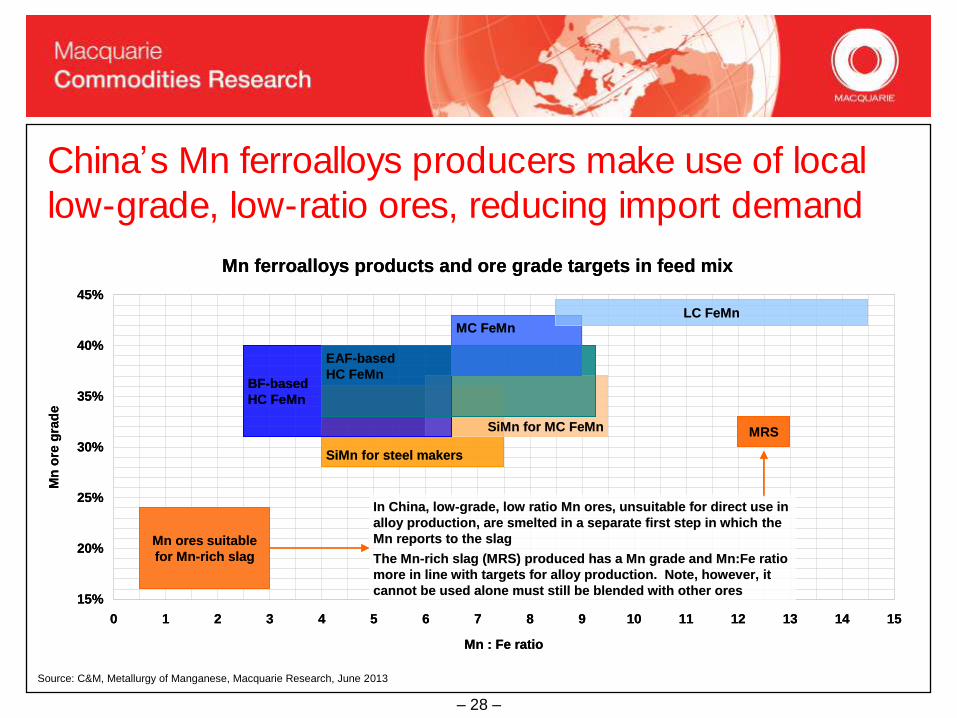
China’s Mn ferroalloys producers make use of local
low-grade, low-ratio ores, reducing import demand
Mn ferroalloys products and ore grade targets in feed mix
15%
20%
25%
30%
35%
40%
45%
0 1 2 3 4 5 6 7 8 9 10 11 12 13 14 15
Mn : Fe ratio
Mn
ore
gra
de
Mn ores suitable
for Mn-rich slag
SiMn for steel makers
SiMn for MC FeMn
BF-based
HC FeMn
EAF-based
HC FeMn
MC FeMnLC FeMn
MRS
In China, low-grade, low ratio Mn ores, unsuitable for direct use in
alloy production, are smelted in a separate first step in which the
Mn reports to the slag
The Mn-rich slag (MRS) produced has a Mn grade and Mn:Fe ratio
more in line with targets for alloy production. Note, however, it
cannot be used alone must still be blended with other ores
Source: C&M, Metallurgy of Manganese, Macquarie Research, June 2013
– 29 –
The manganese industry worldwide
– trends and opportunities
Global steel production and future prospects
Intensity of manganese usage in steelmaking
China’s role as manganese consumer and producer
Selection and use of manganese ferroalloys in steelmaking
Manganese ore supply
Summary and conclusions
– 30 –
Mn use in steelmaking – a summary
Source: Hatch, K.Fowkes, Macquarie Research, June 2013
Mn has two main uses in modern steelmaking
1. As an alloying agent
Mn increases tensile strength, hardness, toughness, wear resistance and machinability
2. To "fix" residual sulphur
No substitutes and essential in all steelmaking but use reduced by adoption of hot metal
desulphurisation as standard practice today
Mn ferroalloy(s) and amount used are a function of three main factors
1. The aim chemistry of the finished steel product
Mn content allied to carbon and silicon control. Flat steel products typically lower in carbon than
long steel products. Silicon control important in surface critical flat products
2. Steelmaking process and practice, which affect efficiency in achieving aim chemistry
No significant difference between BF / BOF and EAF steelmaking, except where bottom-stirring
used to reduce carbon on tapping in primary steelmaking
3. Cost of alternative alloying additions within constraints of aim chemistry and steel plant design
Configuration of hoppers feeding furnaces
– 31 –
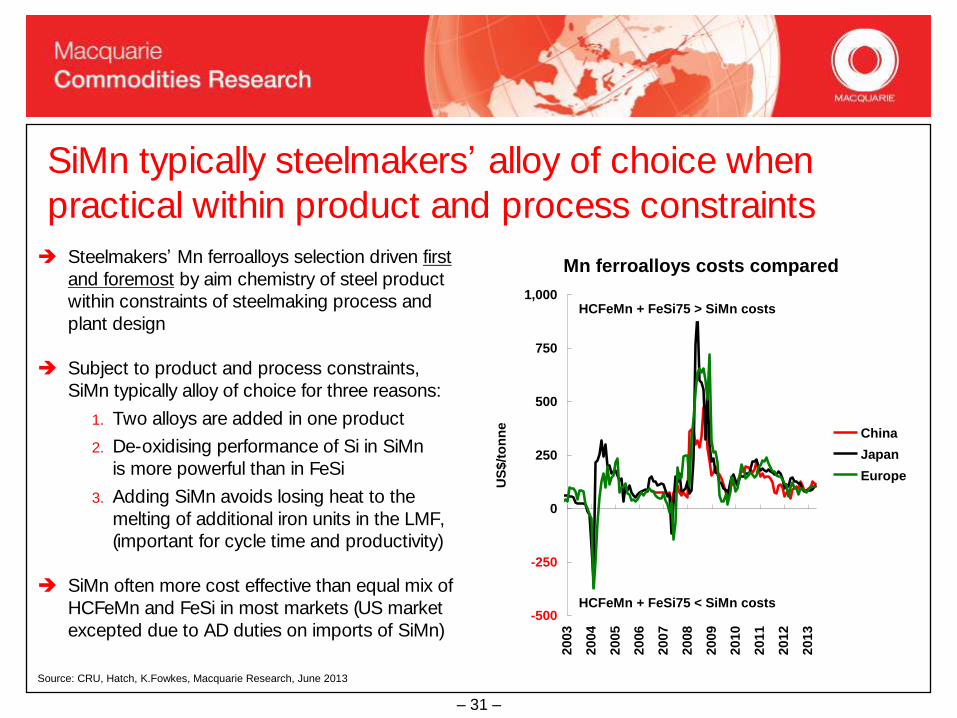
SiMn typically steelmakers’ alloy of choice when
practical within product and process constraints
Steelmakers’ Mn ferroalloys selection driven first
and foremost by aim chemistry of steel product
within constraints of steelmaking process and
plant design
Subject to product and process constraints,
SiMn typically alloy of choice for three reasons:
1. Two alloys are added in one product
2. De-oxidising performance of Si in SiMn
is more powerful than in FeSi
3. Adding SiMn avoids losing heat to the
melting of additional iron units in the LMF,
(important for cycle time and productivity)
SiMn often more cost effective than equal mix of
HCFeMn and FeSi in most markets (US market
excepted due to AD duties on imports of SiMn)
Source: CRU, Hatch, K.Fowkes, Macquarie Research, June 2013
Mn ferroalloys costs compared
-500
-250
0
250
500
750
1,000
2003
2004
2005
2006
2007
2008
2009
2010
2011
2012
2013
US
$/t
on
ne
China
Japan
Europe
HCFeMn + FeSi75 > SiMn costs
HCFeMn + FeSi75 < SiMn costs
– 32 –
Future shifts in steel product mix may alter balance of
Mn ferroalloys used by steelmakers
Source: Hatch, K.Fowkes, Macquarie Research, June 2013
Forecasts of an increasing uptake of higher strength, higher manganese steels in certain applications,
especially auto and energy steels, may see steelmakers seek adaptations and / or new products in
Mn ferroalloys
Products that mix better and melt faster with greater consistency in sizing and alloy chemistry.
Melting speed is important for cycle time. Mn recovery from ferroalloy to steel is a function of
steelmaking practice but also alloy quality; consistent recovery reduces risk of “off-spec” steel
Higher Mn grade to reduce volume additions required and resultant drop in steel temperature,
with positive implications for cycle time, productivity and cost control
Lower content of carbon and deleterious residuals, notably hydrogen, nitrogen, phosphorous
In future, steelmakers may consider melting Mn ferroalloys to add in liquid form at tapping and in the
LMF with the advantages this would be easier to add to the liquid steel stream and reduce energy use.
This is already practiced by some stainless and speciality steelmakers
– 33 –
The manganese industry worldwide
– trends and opportunities
Global steel production and future prospects
Intensity of manganese usage in steelmaking
China’s role as manganese consumer and producer
Selection and use of manganese ferroalloys in steelmaking
Manganese ore supply
Summary and conclusions
– 34 –
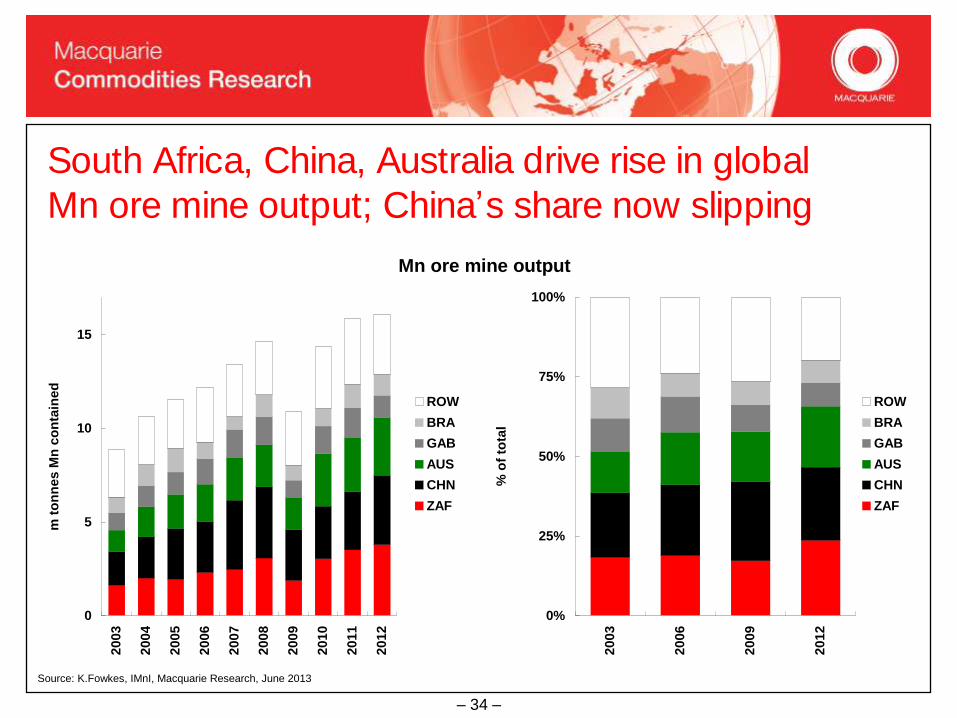
South Africa, China, Australia drive rise in global
Mn ore mine output; China’s share now slipping
Mn ore mine output
0
5
10
15
2003
2004
2005
2006
2007
2008
2009
2010
2011
2012
m t
on
nes M
n c
on
tain
ed
ROW
BRA
GAB
AUS
CHN
ZAF
0%
25%
50%
75%
100%
2003
2006
2009
2012
% o
f to
tal
ROW
BRA
GAB
AUS
CHN
ZAF
Source: K.Fowkes, IMnI, Macquarie Research, June 2013
– 35 –
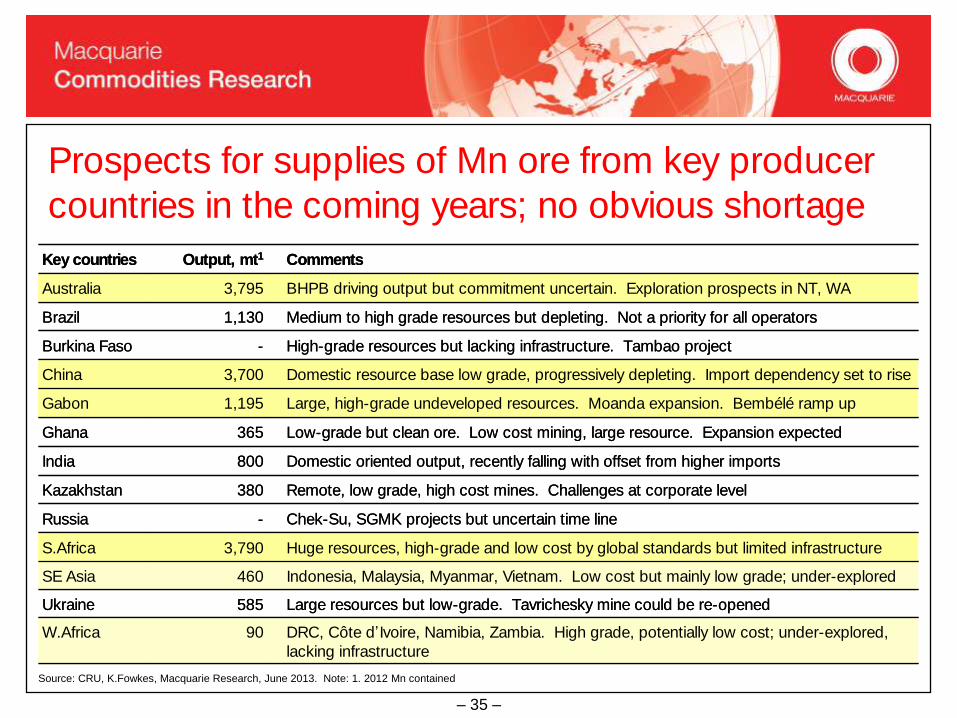
Prospects for supplies of Mn ore from key producer
countries in the coming years; no obvious shortage
Indonesia, Malaysia, Myanmar, Vietnam. Low cost but mainly low grade; under-explored460SE Asia
Low-grade but clean ore. Low cost mining, large resource. Expansion expected365Ghana
Large resources but low-grade. Tavrichesky mine could be re-opened585Ukraine
DRC, Côte d’Ivoire, Namibia, Zambia. High grade, potentially low cost; under-explored,
lacking infrastructure
90W.Africa
Huge resources, high-grade and low cost by global standards but limited infrastructure 3,790S.Africa
Chek-Su, SGMK projects but uncertain time line-Russia
Remote, low grade, high cost mines. Challenges at corporate level380Kazakhstan
Domestic oriented output, recently falling with offset from higher imports800India
Large, high-grade undeveloped resources. Moanda expansion. Bembélé ramp up1,195Gabon
Domestic resource base low grade, progressively depleting. Import dependency set to rise3,700China
High-grade resources but lacking infrastructure. Tambao project-Burkina Faso
Medium to high grade resources but depleting. Not a priority for all operators1,130Brazil
BHPB driving output but commitment uncertain. Exploration prospects in NT, WA3,795Australia
CommentsOutput, mt1Key countries
Source: CRU, K.Fowkes, Macquarie Research, June 2013. Note: 1. 2012 Mn contained
– 36 –
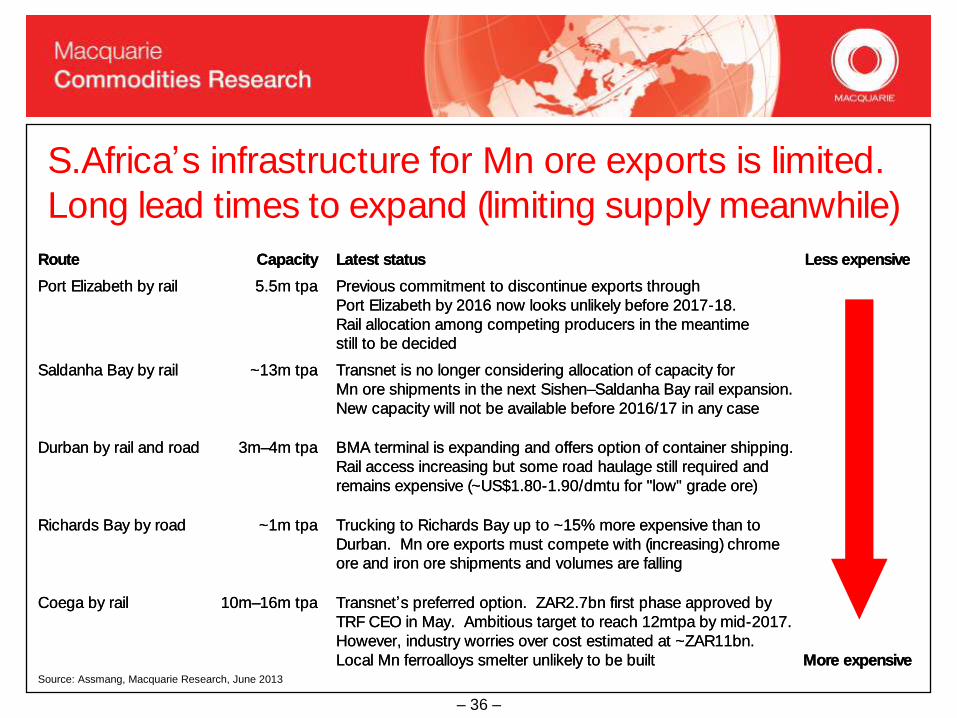
S.Africa’s infrastructure for Mn ore exports is limited.
Long lead times to expand (limiting supply meanwhile)
More expensive
Transnet’s preferred option. ZAR2.7bn first phase approved by
TRF CEO in May. Ambitious target to reach 12mtpa by mid-2017.
However, industry worries over cost estimated at ~ZAR11bn.
Local Mn ferroalloys smelter unlikely to be built
10m–16m tpaCoega by rail
Trucking to Richards Bay up to ~15% more expensive than to
Durban. Mn ore exports must compete with (increasing) chrome
ore and iron ore shipments and volumes are falling
~1m tpaRichards Bay by road
BMA terminal is expanding and offers option of container shipping.
Rail access increasing but some road haulage still required and
remains expensive (~US$1.80-1.90/dmtu for "low" grade ore)
3m–4m tpaDurban by rail and road
Transnet is no longer considering allocation of capacity for
Mn ore shipments in the next Sishen–Saldanha Bay rail expansion.
New capacity will not be available before 2016/17 in any case
~13m tpaSaldanha Bay by rail
Previous commitment to discontinue exports through
Port Elizabeth by 2016 now looks unlikely before 2017-18.
Rail allocation among competing producers in the meantime
still to be decided
5.5m tpaPort Elizabeth by rail
Less expensiveLatest statusCapacityRoute
Source: Assmang, Macquarie Research, June 2013
– 37 –
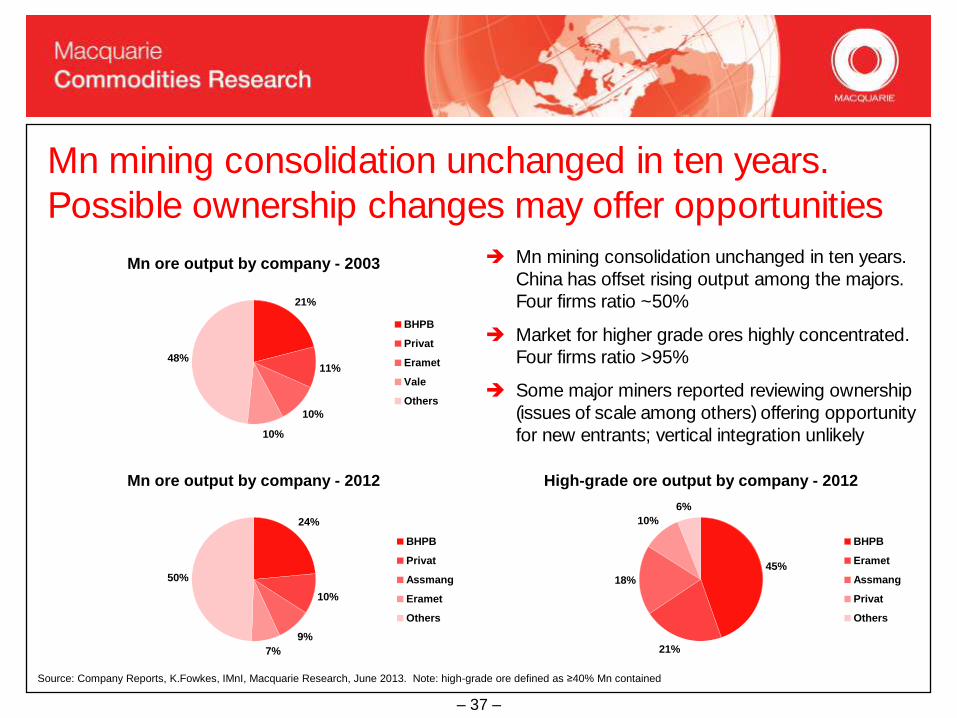
Source: Company Reports, K.Fowkes, IMnI, Macquarie Research, June 2013. Note: high-grade ore defined as ≥40% Mn contained
Mn mining consolidation unchanged in ten years.
Possible ownership changes may offer opportunities
Mn ore output by company - 2003
21%
11%
10%
10%
48%
BHPB
Privat
Eramet
Vale
Others
Mn ore output by company - 2012
24%
10%
9%
7%
50%
BHPB
Privat
Assmang
Eramet
Others
Mn mining consolidation unchanged in ten years.
China has offset rising output among the majors.
Four firms ratio ~50%
Market for higher grade ores highly concentrated.
Four firms ratio >95%
Some major miners reported reviewing ownership
(issues of scale among others) offering opportunity
for new entrants; vertical integration unlikely
High-grade ore output by company - 2012
45%
21%
18%
10%
6%
BHPB
Eramet
Assmang
Privat
Others
– 38 –
The manganese industry worldwide
– trends and opportunities
Global steel production and future prospects
Intensity of manganese usage in steelmaking
China’s role as manganese consumer and producer
Selection and use of manganese ferroalloys in steelmaking
Manganese ore supply
Summary and conclusions
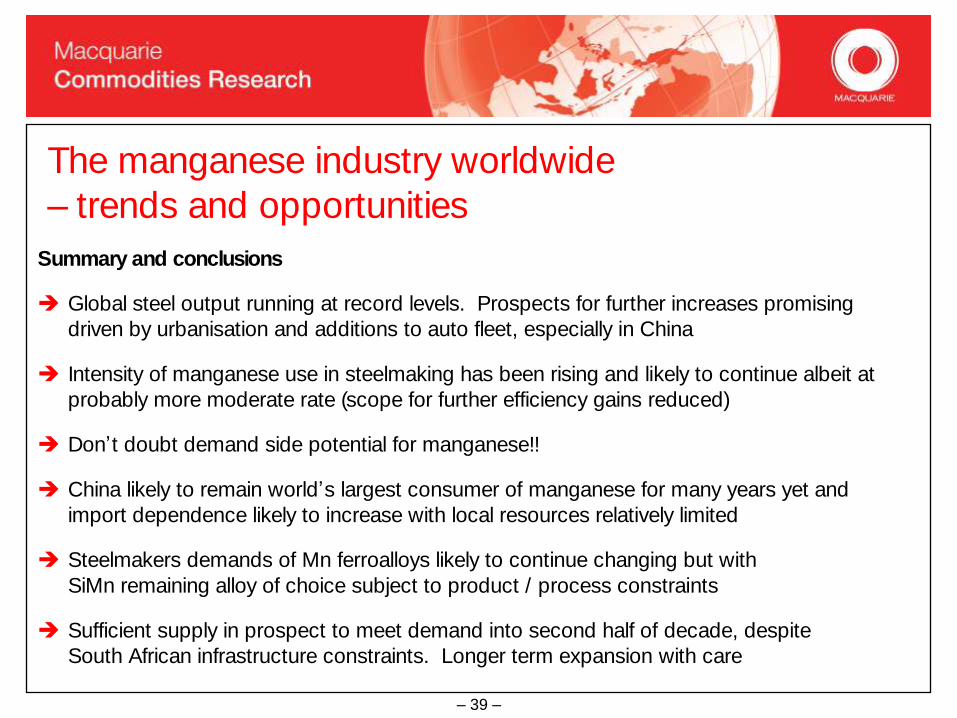
– 39 –
The manganese industry worldwide
– trends and opportunities
Summary and conclusions
Global steel output running at record levels. Prospects for further increases promising
driven by urbanisation and additions to auto fleet, especially in China
Intensity of manganese use in steelmaking has been rising and likely to continue albeit at
probably more moderate rate (scope for further efficiency gains reduced)
Don’t doubt demand side potential for manganese!!
China likely to remain world’s largest consumer of manganese for many years yet and
import dependence likely to increase with local resources relatively limited
Steelmakers demands of Mn ferroalloys likely to continue changing but with
SiMn remaining alloy of choice subject to product / process constraints
Sufficient supply in prospect to meet demand into second half of decade, despite
South African infrastructure constraints. Longer term expansion with care
– 40 –
Important disclosures:
Financial definitions
All "Adjusted" data items have had the following
adjustments made:
Added back: goodwill amortisation, provision for
catastrophe reserves, IFRS derivatives & hedging,
IFRS impairments & IFRS interest expense
Excluded: non recurring items, asset revals, property
revals, appraisal value uplift, preference dividends &
minority interests
EPS = adjusted net profit /efpowa*
ROA = adjusted ebit / average total assets
ROA Banks/Insurance = adjusted net profit /average
total assets
ROE = adjusted net profit / average shareholders
funds
Gross cashflow = adjusted net profit + depreciation
*equivalent fully paid ordinary weighted average
number of shares
All Reported numbers for Australian/NZ listed stocks
are modelled under IFRS (International Financial
Reporting Standards).
Volatility index definition*
This is calculated from the volatility of historic price
movements.
Very high–highest risk – Stock should be expected to
move up or down 60-100% in a year – investors should
be aware this stock is highly speculative.
High – stock should be expected to move up or down at
least 40-60% in a year – investors should be aware this
stock could be speculative.
Medium – stock should be expected to move up or
down at least 30-40% in a year.
Low–medium – stock should be expected to move up or
down at least 25-30% in a year.
Low – stock should be expected to move up or down at
least 15-25% in a year.
* Applicable to Australian/NZ stocks only
Recommendation – 12 months
Note: Quant recommendations may differ from
Fundamental Analyst recommendations
Recommendation definitions
Macquarie - Australia/New Zealand
Outperform – return > 3% in excess of benchmark return
Neutral – return within 3% of benchmark return
Underperform – return > 3% below benchmark return
Benchmark return is determined by long term nominal GDP
growth plus 12 month forward market dividend yield.
Macquarie – Asia/Europe
Outperform – expected return >+10%
Neutral – expected return from -10% to +10%
Underperform – expected <-10%
Macquarie First South - South Africa
Outperform – return > 10% in excess of benchmark return
Neutral – return within 10% of benchmark return
Underperform – return > 10% below benchmark return
Macquarie - Canada
Outperform – return > 5% in excess of benchmark return
Neutral – return within 5% of benchmark return
Underperform – return > 5% below benchmark return
Macquarie - USA
Outperform – return > 5% in excess of benchmark return
Neutral – return within 5% of benchmark return
Underperform – return > 5% below benchmark return
22.60%
34.10%
43.30%
EUR
(for US coverage by MCUSA, 3.33% of stocks covered are investment banking clients)
(for US coverage by MCUSA, 4.91% of stocks covered are investment banking clients)
(for US coverage by MCUSA, 6.10% of stocks covered are investment banking clients)
4.42%
32.60%
62.98%
CA
4.29%8.57%18.74%13.36%Underperform
55.01%41.43%28.01%41.52%Neutral
40.70%50.00%53.24%45.12%Outperform
USARSAAsiaAU/NZ
Recommendation proportions – for quarter ending 31 March 2013
– 41 –
Company Specific Disclosures:
Important disclosure information regarding the subject companies covered in this report is available at www.macquarie.com/research/disclosures.
Analyst Certification:
The views expressed in this research accurately reflect the personal views of the analyst(s) about the subject securities or issuers and no part of the compensation of the
analyst(s) was, is, or will be directly or indirectly related to the inclusion of specific recommendations or views in this research. The analyst principally responsible for the
preparation of this research receives compensation based on overall revenues of Macquarie Group Ltd ABN 94 122 169 279 (AFSL No. 318062) (MGL) and its related
entities (the Macquarie Group) and has taken reasonable care to achieve and maintain independence and objectivity in making any recommendations.
General Disclaimers:
Macquarie Securities (Australia) Ltd; Macquarie Capital (Europe) Ltd; Macquarie Capital Markets Canada Ltd; Macquarie Capital Markets North America Ltd; Macquarie
Capital (USA) Inc; Macquarie Capital Securities Ltd and its Taiwan branch; Macquarie Capital Securities (Singapore) Pte Ltd; Macquarie Securities (NZ) Ltd; and Macquarie
First South Securities (Pty) Limited; Macquarie Capital Securities (India) Pvt Ltd; Macquarie Capital Securities (Malaysia) Sdn Bhd; Macquarie Securities Korea Limited and
Macquarie Securities (Thailand) Ltd are not authorized deposit-taking institutions for the purposes of the Banking Act 1959 (Commonwealth of Australia), and their
obligations do not represent deposits or other liabilities of Macquarie Bank Limited ABN 46 008 583 542 (MBL) or MGL. MBL does not guarantee or otherwise provide
assurance in respect of the obligations of any of the above mentioned entities. MGL provides a guarantee to the Monetary Authority of Singapore in respect of the
obligations and liabilities of Macquarie Capital Securities (Singapore) Pte Ltd for up to SGD 35 million. This research has been prepared for the general use of the wholesale
clients of the Macquarie Group and must not be copied, either in whole or in part, or distributed to any other person. If you are not the intended recipient you must not use
or disclose the information in this research in any way. If you received it in error, please tell us immediately by return e-mail and delete the document. We do not guarantee
the integrity of any e-mails or attached files and are not responsible for any changes made to them by any other person. MGL has established and implemented a conflicts
policy at group level (which may be revised and updated from time to time) (the "Conflicts Policy") pursuant to regulatory requirements (including the FSA Rules) which sets
out how we must seek to identify and manage all material conflicts of interest. Nothing in this research shall be construed as a solicitation to buy or sell any security or
product, or to engage in or refrain from engaging in any transaction. In preparing this research, we did not take into account your investment objectives, financial situation or
particular needs. Before making an investment decision on the basis of this research, you need to consider, with or without the assistance of an adviser, whether the advice
is appropriate in light of your particular investment needs, objectives and financial circumstances. There are risks involved in securities trading. The price of securities can
and does fluctuate, and an individual security may even become valueless. International investors are reminded of the additional risks inherent in international investments,
such as currency fluctuations and international stock market or economic conditions, which may adversely affect the value of the investment. This research is based on
information obtained from sources believed to be reliable but we do not make any representation or warranty that it is accurate, complete or up to date. We accept no
obligation to correct or update the information or opinions in it. Opinions expressed are subject to change without notice. No member of the Macquarie Group accepts any
liability whatsoever for any direct, indirect, consequential or other loss arising from any use of this research and/or further communication in relation to this research. Clients
should contact analysts at, and execute transactions through, a Macquarie Group entity in their home jurisdiction unless governing law permits otherwise.
Country-Specific Disclaimers:
Australia: In Australia, research is issued and distributed by Macquarie Securities (Australia) Ltd (AFSL No. 238947), a participating organisation of the Australian Securities
Exchange. New Zealand: In New Zealand, research is issued and distributed by Macquarie Securities (NZ) Ltd, a NZX Firm. Canada: In Canada, research is prepared,
approved and distributed by Macquarie Capital Markets Canada Ltd, a participating organisation of the Toronto Stock Exchange, TSX Venture Exchange & Montréal
Exchange. Macquarie Capital Markets North America Ltd., which is a registered broker-dealer and member of FINRA, accepts responsibility for the contents of reports
issued by Macquarie Capital Markets Canada Ltd in the United States and sent to US persons. Any person wishing to effect transactions in the securities described in the
reports issued by Macquarie Capital Markets Canada Ltd should do so with Macquarie Capital Markets North America Ltd. The Research Distribution Policy of Macquarie
– 42 –
Capital Markets Canada Ltd is to allow all clients that are entitled to have equal access to our research. United Kingdom: In the United Kingdom, research is issued and
distributed by Macquarie Capital (Europe) Ltd, which is authorised and regulated by the Financial Services Authority (No. 193905). Germany: In Germany, research is
issued and distributed by Macquarie Capital (Europe) Ltd, Niederlassung Deutschland, which is authorised and regulated in the United Kingdom by the Financial Services
Authority (No. 193905). France: In France, research is issued and distributed by Macquarie Capital (Europe) Ltd, which is authorised and regulated in the United Kingdom
by the Financial Services Authority (No. 193905). Hong Kong & Mainland China: In Hong Kong, research is issued and distributed by Macquarie Capital Securities Ltd,
which is licensed and regulated by the Securities and Futures Commission. In Mainland China, Macquarie Securities (Australia) Limited Shanghai Representative Office
only engages in non-business operational activities excluding issuing and distributing research. Only non-A share research is distributed into Mainland China by Macquarie
Capital Securities Ltd. Japan: In Japan, research is Issued and distributed by Macquarie Capital Securities (Japan) Limited, a member of the Tokyo Stock Exchange, Inc.,
Osaka Securities Exchange Co. Ltd. (Financial Instruments Firm, Kanto Financial Bureau (kin-sho) No. 231, a member of Japan Securities Dealers Association and
Financial Futures Association of Japan and Japan Securities Investment Advisers Association). India: In India, research is issued and distributed by Macquarie Capital
Securities (India) Pty Ltd., 92, Level 9, 2 North Avenue, Maker Maxity, Bandra Kurla Complex, Bandra (East), Mumbai – 400 051, India, which is a SEBI registered Stock
Broker having membership with National Stock Exchange of India Limited (INB231246738) and Bombay Stock Exchange Limited (INB011246734). Malaysia: In Malaysia,
research is issued and distributed by Macquarie Capital Securities (Malaysia) Sdn. Bhd. (Company registration number: 463469-W) which is a Participating Organisation of
Bursa Malaysia Berhad and a holder of Capital Markets Services License issued by the Securities Commission. Taiwan: Information on securities/instruments that are
traded in Taiwan is distributed by Macquarie Capital Securities Ltd, Taiwan Branch, which is licensed and regulated by the Financial Supervisory Commission. No portion
of the report may be reproduced or quoted by the press or any other person without authorisation from Macquarie. Nothing in this research shall be construed as a
solicitation to buy or sell any security or product. Thailand: In Thailand, research is issued and distributed by Macquarie Securities (Thailand) Ltd, a licensed securities
company that is authorized by the Ministry of Finance, regulated by the Securities and Exchange Commission of Thailand and is an exchange member no. 28 of the Stock
Exchange of Thailand. The Thai Institute of Directors Association has disclosed the Corporate Governance Report of Thai Listed Companies made pursuant to the policy
of the Securities and Exchange Commission of Thailand. Macquarie Securities (Thailand) Ltd does not endorse the result of the Corporate Governance Report of Thai
Listed Companies but this Report can be accessed at: http://www.thai-iod.com/en/publications.asp?type=4. South Korea: In South Korea, unless otherwise stated,
research is prepared, issued and distributed by Macquarie Securities Korea Limited , which is regulated by the Financial Supervisory Services. Information on analysts in
MSKL is disclosed at http://dis.kofia.or.kr/fs/dis2/fundMgr/DISFundMgrAnalystPop.jsp?companyCd2=A03053&pageDiv=02. South Africa: In South Africa, research is
issued and distributed by Macquarie First South Securities (Pty) Limited, a member of the JSE Limited. Singapore: In Singapore, research is issued and distributed by
Macquarie Capital Securities (Singapore) Pte Ltd (Company Registration Number: 198702912C), a Capital Markets Services license holder under the Securities and
Futures Act to deal in securities and provide custodial services in Singapore. Pursuant to the Financial Advisers (Amendment) Regulations 2005, Macquarie Capital
Securities (Singapore) Pte Ltd is exempt from complying with sections 25, 27 and 36 of the Financial Advisers Act. All Singapore-based recipients of research produced by
Macquarie Capital (Europe) Limited, Macquarie Capital Markets Canada Ltd, Macquarie First South Securities (Pty) Limited and Macquarie Capital (USA) Inc. represent and
warrant that they are institutional investors as defined in the Securities and Futures Act. United States: In the United States, research is issued and distributed by
Macquarie Capital (USA) Inc., which is a registered broker-dealer and member of FINRA. Macquarie Capital (USA) Inc, accepts responsibility for the content of each
research report prepared by one of its non-US affiliates when the research report is distributed in the United States by Macquarie Capital (USA) Inc. Macquarie Capital
(USA) Inc.’s affiliate’s analysts are not registered as research analysts with FINRA, may not be associated persons of Macquarie Capital (USA) Inc., and therefore may not
be subject to FINRA rule restrictions on communications with a subject company, public appearances, and trading securities held by a research analyst account. Any
persons receiving this report directly from Macquarie Capital (USA) Inc. and wishing to effect a transaction in any security described herein should do so with Macquarie
Capital (USA) Inc. Important disclosure information regarding the subject companies covered in this report is available at www.macquarie.com/research/disclosures, or
contact your registered representative at 1-888-MAC-STOCK, or write to the Supervisory Analysts, Research Department, Macquarie Securities, 125 W.55th Street, New
York, NY 10019.
© Macquarie Group