Embed Size (px)
Citation preview
This document differs from the Conference CD as it corrects the typos on pages 4 and 17 and the 15 slide presentation is now attached
1
The Lower Tertiary Trend
and the Oil Export Economic Prize
Peter Lovie
Devon Energy Corporation
ABSTRACT
Competition between traditional pipeline export in GOM and shuttle tanker newcomers has gone
on intermittently in the deeper waters of the US Gulf of Mexico since 2001, but now the
competition is heating up with the prospects of developments in the remote ultra deep waters of
the Lower Tertiary trend. At these locations, the laws of economics and physics may now be at a
tipping point, possibly tilting towards tankers.
This paper examines the factors at play in the economics, sensitivities to volumes and risks
associated with commitments to use pipelines or shuttle tankers, based on studies underway for
the last two years for a portfolio of Lower Tertiary prospects, and the impact the export solution
may have on field development decisions and their timing.
Pipeline export and shuttle tanker export is surprisingly not an easy comparison, with issues of
scalability, initial risk exposures, and, since 2005, the ability to resist harsher hurricane criteria.
These Lower Tertiary prospects are also one of the most challenging anywhere to drill and
produce, causing changes in the way the choice for export method may be made.
This document differs from the Conference CD as it corrects the typos on pages 4 and 17 and the 15 slide presentation is now attached
2
2005 changed the way export hazards are looked at with ‘optionality’ being a key word heard
from both the pipeline and tanker factions after the multiple pipeline breaks and incapacitation of
shore facilities by Katrina and Rita.
The very high pipeline investments that would be required for these developments also
encourage consideration of tankers, particularly as the delivery of the US built tankers required
under the Jones Act for this service can now be delivered in a timely manner by US yards. In the
event of a field being a bust, operators are realizing that tankers’ redeployability can mitigate the
commercial risk on export service commitments.
Aggregation of large enough volumes to enable an economic pipeline is more difficult in the
Lower Tertiary trend than discoveries made closer to shore and very difficult indeed for early
production. For example, towards the end of 2007, two tankers were committed for use at
Cascade/Chinook to service the Early Production System being employed there by Petrobras
America and its partners (Devon and Total).
Finally, economic insights are suggested for each of the export modes with respect to the
business and field conditions that would apply in developments in the Lower Tertiary trend,
based on economic study data and the methodology developed here.
OBJECTIVES
This paper examines the Facility Options and the Transportation Options relevant to deciding on
the method of oil export from locations in the Lower Tertiary Trend in the remote ultra
deepwater regions of the US Gulf of Mexico, with the intent of demonstrating the size of the
economic prize that can be at stake from weighing the differences between different export
options, while employing reasonable judgment and realistic typical figures to gain insights on
when and where each export option might be best suited.
Secondary objectives are those of identifying key cost components, creating a methodology for
such comparisons and the opening up of a rational debate on what has often appeared as a murky
This document differs from the Conference CD as it corrects the typos on pages 4 and 17 and the 15 slide presentation is now attached
3
decision making process in the past, such that a clear basis can be arrived at for weighing all
export options now available in the marketplace for a field development in the Lower Tertiary
Trend.
PRACTICAL FACILITY AND EXPORT OPTIONS
Two practical facility choices are possible in these Lower Tertiary locations in generally 6,000 to
9,000 foot water depths: I) Facility without storage (typically a spar or a semisubmersible), or:
II) Facility with storage (typically an FPSO). The choice of facility might be influenced by
export options or it might have nothing to do with that and be driven by reservoir production
considerations to enable maximum recovery.
Which ever of these two facility choices is made, multiple export options are now feasible:
I Facility without Storage – Export Options
1. Pipeline.
Commonly will consist of an export riser and a length of new line to connect the facility
to one of a number of choices of existing trunk lines that in turn connect to others and
ultimately deliver production to sales points onshore, typically refinery destination(s).
This is by far the most widely used and accepted export option in GoM.
2. FSO + Shuttle Tankers.
Stabilized crude from the production facility is transferred to a Floating Storage
Offloading (FSO) tanker moored about a mile distant from the production facility, from
which shuttle tankers are loaded and transport the production to any one of a number of
sales points that might be located around the Gulf of Mexico. The shuttle tankers would
be equipped with a Bow Loading System (BLS), bow thrusters, a high lift rudder, a
controllable pitch propeller (CPP) and may be dynamically positioned (DP), all to ensure
a high degree of maneuverability and hence the maximum in safety while near an FSO,
FPSO or other production facility.
3. HiLoad + Direct Loading of Conventional Tankers.
This document differs from the Conference CD as it corrects the typos on pages 4 and 17 and the 15 slide presentation is now attached
4
This is a new alternative to Option 2 employing a new concept, whereby two HiLoad
systems are employed. Each HiLoad unit is a manned floating vessel that looks
somewhat like a fork lift truck and is dynamically positioned with a transfer hose from
the facility. One HiLoad unit continuously loads a conventional tanker at its midship
manifold as the oil is produced from the facility. When the first tanker is full, it leaves to
deliver its cargo to its destination. Meantime a second HiLoad system has latched on to a
second tanker and as the first tanker completes loading, production is transferred to the
second without interruption. The number of tankers employed needs to be at least two (2)
and there might easily be three or four tankers as volumes dictate. The idea of Direct
Loading has been successfully employed at the Heidrun TLP in the Norwegian North Sea
for many years, pioneered by Conoco and now operated by StatoilHydro. Direct loading
usually is cost effective with large volumes of production, e.g. the system at Heidrun
started with around 225,000 bopd.
II Facility with Storage – Export Options
4. Shuttle Tankers.
Widely used in North Sea for 20+ years, their first use in GoM will start at the Petrobras
operated Cascade/Chinook development in mid 2010 (50:50 Petrobras:Devon at Cascade
and 67:33 Petrobras:Total at Chinook).
5. HiLoad + Conventional Tankers.
Only one HiLoad is used and its function is to allow the use of conventional tankers
instead of shuttle tankers with their added CAPEX for their special features mentioned
above. The rationale for this option is thus an economic one: can the investment in a
HiLoad system offset the added costs of the special features on two or three shuttle
tankers that might be employed for a field development? Use of conventional tankers has
the additional commercial advantage that they may be more available and may enter or
leave export service more readily as production levels change. This might be a serious
advantage since the Jones Act fleet is relatively small and the fleet of Jones Act shuttle
tankers is much smaller still. The HiLoad system thus offers a new alternative to
traditional export configurations for FSOs and FPSOs.
This document differs from the Conference CD as it corrects the typos on pages 4 and 17 and the 15 slide presentation is now attached
5
Consideration of these five (5) options, their economics, risks and benefits are the basis for the
analyses and discussion in this paper.
DESIGN BASIS
Regardless of past history for offshore production in the deep waters of GoM, some design
factors individually or in combination with others will be different for future field developments
in the Lower Tertiary Trend. Key among these are:-
Water Depth: 6,000-9,000 ft. is always challenging!
Crude Quality: May be heavier and more sour than previous developments in GoM, e.g.
much lower grade oil than the well known West Texas Intermediate (WTI)
marker, lower than Mars blend from deepwater locations, and more like
Arab Heavy imports.
Gas Production: GORs are much lower than common in GoM, often around 250 scf/bbl,
meaning that associated gas volumes are low and a 6- or 8-inch diameter
gas export line may become a common, easy to lay practical solution.
There is even talk of gas imports being needed as later in field life there
may not be enough gas for fuel on the production facility. For purposes of
the oil export analyses, this gas export solution is assumed in all cases.
Field Life: Longer than typical GoM, might be 30-50 years or about double typical
GoM development field lives.
Well Depths: At around 30,000 ft. through sometimes miles of salt to reach reservoirs
that are at pressures of more than 20,000 psi and often at high
temperatures, wells take several months to drill and complete, rigs often
work at close to their design limits, and investments per well are at levels
rarely seen anywhere. Well costs can drive the choice of facility like
never before, often outweighing otherwise compelling export economics.
Remoteness: Helicopter trips to shore bases of 250 miles are not uncommon. Distances
from facility to sales point for the crude export can be similar or more.
Reservoirs: Limited experience in production from these reservoir formations may
mean uncertainties on the expected volumes to be transported, imposing
This document differs from the Conference CD as it corrects the typos on pages 4 and 17 and the 15 slide presentation is now attached
6
higher risks in front end investment in export systems and increasing need
for flexibility in the export system for adjusting to future actual volumes.
Aggregation: The huge CAPEX for pipelines and the slow development of “critical
mass” volumes can combine to make traditional hub and spoke field
development systems with pipeline export much more difficult
commercially than with traditional patterns in GoM.
Combining the effects of these design factors, it is not difficult to see why arriving at the
sanction stage for these mega projects is an exhausting and time consuming process! And that is
not to say anything about the $billions of investment and number of years for the execution
phase. Once first oil is achieved, the ramp up to full production may take several years in
contrast to the faster buildup hitherto, so the build in early revenue potential for export systems
may be more economically difficult than before.
In contrast to the demanding nature of the facilities that may be employed to produce oil and gas
from the Lower Tertiary Trend, the technologies of export systems are relatively straightforward.
Laying 24-inch or even 28-inch pipe in 7,000 foot water depths over the mountainous seabed
often found in Walker Ridge and Keathley Canyon will certainly be demanding, but contractors
maintain they are able to tackle it, repairs methods have been developed and flow assurance
matters are being investigated. The HiLoad system cited as an option with two of the tanker
solutions is in the prototype stage after years of development and testing. But close precedents
do exist in each of these instances.
The technologies employed in tanker-based export systems are well proven. What is challenging
in the US market is the availability of Jones Act tankers and their cost. Until the last year or two,
their delivery from US shipyards was not very reliable. That has greatly improved in 2007-2008.
The building of tankers in at US shipyards at roughly three times the cost of their Far East
counterparts, plus US crews at roughly double international fleet rates, all makes economics
difficult. The Jones Act fleet of tankers of the size that might be used for export is small (around
30) and so newbuilds are likely requirements for GoM export service. There are few owners and
This document differs from the Conference CD as it corrects the typos on pages 4 and 17 and the 15 slide presentation is now attached
7
operators of Jones Act tonnage. Hence the challenge with tanker based solutions for GoM tends
to be more commercial than technical.
We therefore take it for our discussion here that the technologies employed in these five export
options are all doable to the extent where any one of them could indeed be sanctioned for
construction and operation if an operator chose to do so.
Further, given the cycle time from sanction to first oil of say three to four years, it can be
assumed that any one of these five export solutions could be contracted for at sanction time and
delivered ready for first oil. Obviously the contracting and managing of whatever export
solution is ultimately chosen will still take some doing, but for purposes of the examination of
these five options, it is assumed that all can be compared.
CREATING A BASIS FOR COMPARISONS
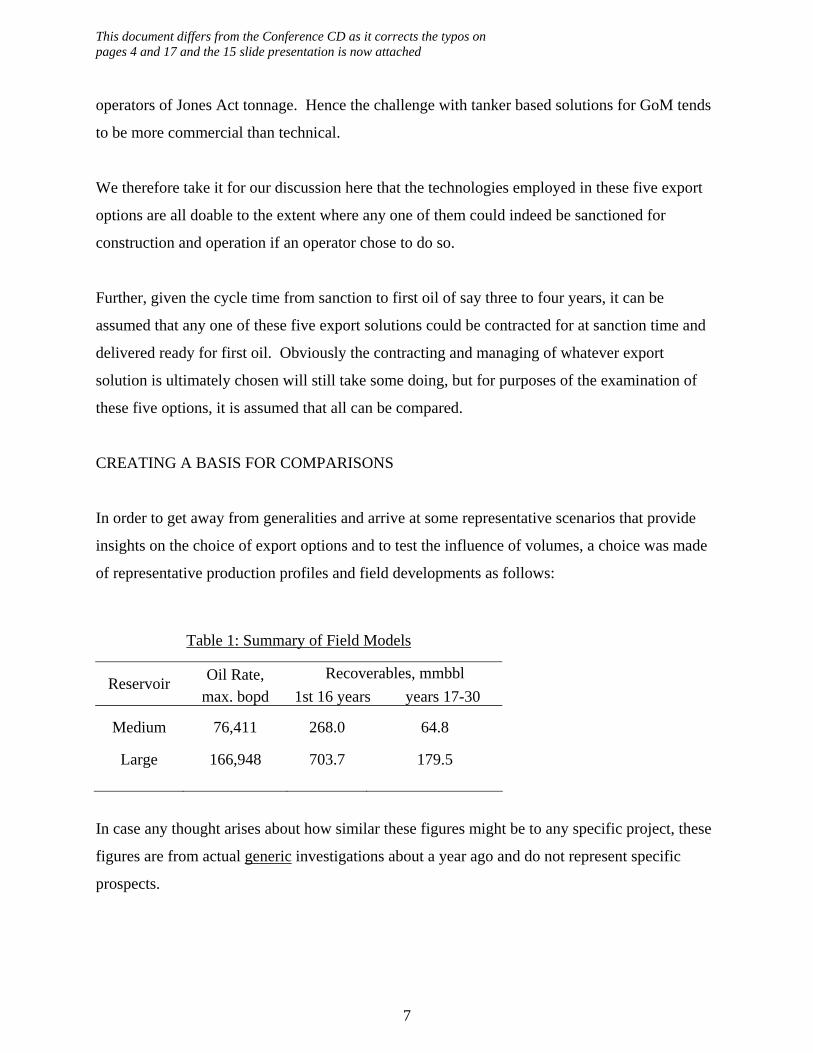
In order to get away from generalities and arrive at some representative scenarios that provide
insights on the choice of export options and to test the influence of volumes, a choice was made
of representative production profiles and field developments as follows:
Table 1: Summary of Field Models
Oil Rate, Recoverables, mmbbl Reservoir
max. bopd 1st 16 years years 17-30
Medium 76,411 268.0 64.8
Large 166,948 703.7 179.5
In case any thought arises about how similar these figures might be to any specific project, these
figures are from actual generic investigations about a year ago and do not represent specific
prospects.
This document differs from the Conference CD as it corrects the typos on pages 4 and 17 and the 15 slide presentation is now attached
8
It became evident that the first half of the field’s production had about 80% of the total
recoverable and since after 15-16 years it was more and more uncertain how realistic any
projections might be, the choice was made for simplicity to make comparisons on the first half –
about 16 years of production.
Cost buildups for an ultra deep water pipeline system depend greatly on the location of the field
development, the seabed profile, the distance to a tie-in point and available and economic
pipeline networks back to shore. For the analyses here a simple assumption was made that the
line would be 130 miles long from facility to tie-in point and the ruling factor was an installed
cost of $700million for a 24-inch diameter pipeline to serve the “Large” reservoir, and
$460million for an 18-inch line to serve the “Medium” reservoir. Obviously these figures will
change considerably depending on specific projects, but some representative set of numbers
needed to be chosen. More figures are shown in Tables 6 and 7.
The buildup of costs for tanker systems first required an idea of the production that can be
transported per tanker and then the number of tankers to serve the volumes for “Large” and
“Medium” reservoirs. Simultaneous with that determination, the choice of size of tanker is
needed! Draft limitations in GoM ports imply a maximum shuttle tanker capacity of about
550,000 bbl. However there is little crude transportation business as a backup trade for that size
of tanker in the Jones Act trade - which led to adoption of the smaller product tanker (often
called Handymax) size of about 320,000 bbl capacity, which would have better back up trade
possibilities. Many calculations on trip times, weather and port delays and range of destinations
led to an average production capacity estimate of 55,000 bopd per tanker. Calculations also
showed the smaller tanker size did not detract much from economies of scale.
The number of tankers needed was determined from the production profile for the field
development, chartering in tankers in increments of 55,000 bopd as needed for production
volumes, e.g. the maximum production rate of 166,948 bopd for the Large reservoir would
require three tankers, and when production was at or below 110,000 bopd, then two tankers
would be needed and so on. Inevitably there would be surplus capacity in some years, e.g.
This document differs from the Conference CD as it corrects the typos on pages 4 and 17 and the 15 slide presentation is now attached
9
130,000 bopd requires 2.27 tankers - so three tankers are provided and there is unused export
capacity of about 40,000 bopd.
It was assumed at this early stage in market development in GoM that for these tanker
calculations there was no sharing of tankers between one development and another. Tanker
operations would be dedicated and so tanker efficiency would be very high, e.g. 95-98%. It is
very likely that the sharing of tankers between different future developments in GoM would
occur but that was ignored here since there was no guarantee of that potential to spread costs.
For both pipeline and tanker solutions it was next assumed that all aspects of these are obtained
in the marketplace on an open competitive contract basis, i.e. none of the equipment is producer
built and owned. The argument here is part consistency and part philosophy – some oil
companies may or may not wish to invest in and own pipelines or tankers, preferring to sticking
to their core businesses, and often a third party transportation contractor is better placed to
manage capacity from multiple developments than an operator. The opportunity still exists for
an oil company to enter either the pipeline or tanker business based on the economics and risks
of the situation. At this point we are not there yet and simply projecting how the economics and
risks stack up.
For the pipeline tie in to existing GoM networks, assumptions were made of typical returns of an
investment to justify a contractor’s decision to build the new segment.
For tanker solutions, estimates were made for time chartering tankers for different periods to suit
the reservoir production profile, e.g. one tanker for all of its 25-35 year life in the Jones Act
market, a second for perhaps a half of that and a third for maybe a third of its life. In this
example the second and third tankers would then be employed later in their lives in the product
trade or continue as a shuttle tanker in a different development. Port and fuel costs were then
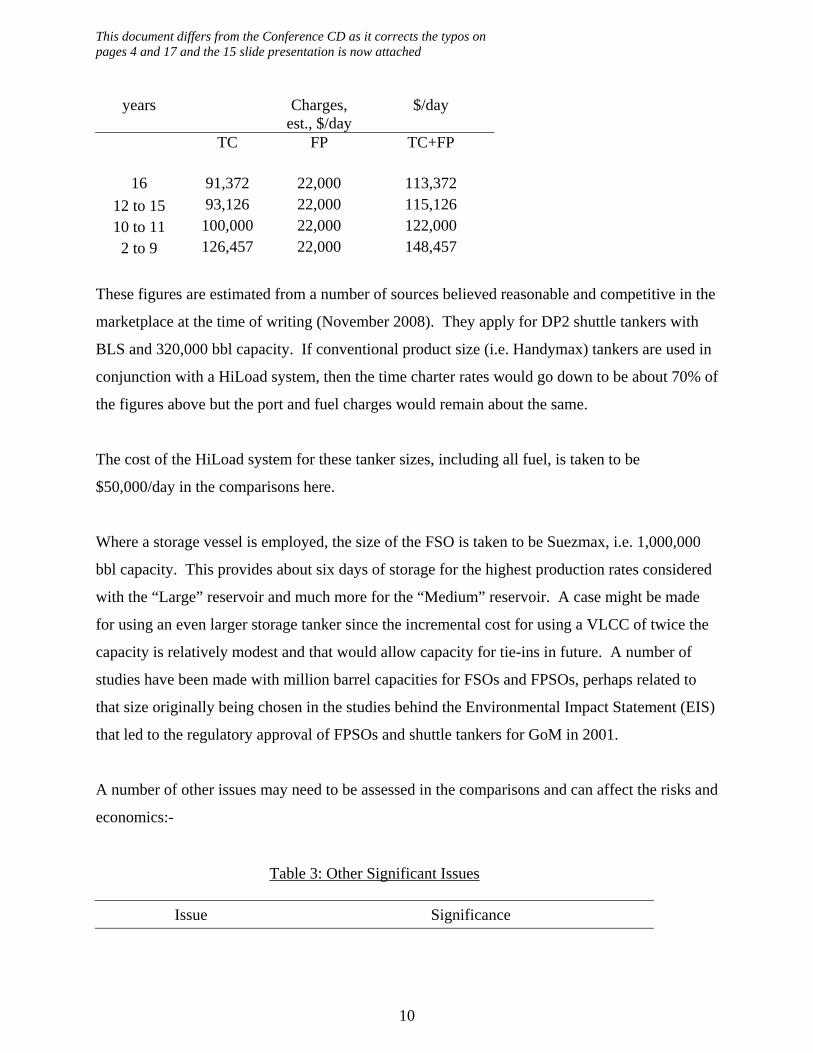
added in as follows:-
Table 2: Tanker Cost Buildup Total tanker costs, dedicated, no sharing
Term, TC, $/day Fuel & Port Total tanker cost,
This document differs from the Conference CD as it corrects the typos on pages 4 and 17 and the 15 slide presentation is now attached
10
years Charges, est., $/day
$/day
TC FP TC+FP
16 91,372 22,000 113,372 12 to 15 93,126 22,000 115,126 10 to 11 100,000 22,000 122,000 2 to 9 126,457 22,000 148,457
These figures are estimated from a number of sources believed reasonable and competitive in the
marketplace at the time of writing (November 2008). They apply for DP2 shuttle tankers with
BLS and 320,000 bbl capacity. If conventional product size (i.e. Handymax) tankers are used in
conjunction with a HiLoad system, then the time charter rates would go down to be about 70% of
the figures above but the port and fuel charges would remain about the same.
The cost of the HiLoad system for these tanker sizes, including all fuel, is taken to be
$50,000/day in the comparisons here.
Where a storage vessel is employed, the size of the FSO is taken to be Suezmax, i.e. 1,000,000
bbl capacity. This provides about six days of storage for the highest production rates considered
with the “Large” reservoir and much more for the “Medium” reservoir. A case might be made
for using an even larger storage tanker since the incremental cost for using a VLCC of twice the
capacity is relatively modest and that would allow capacity for tie-ins in future. A number of
studies have been made with million barrel capacities for FSOs and FPSOs, perhaps related to
that size originally being chosen in the studies behind the Environmental Impact Statement (EIS)
that led to the regulatory approval of FPSOs and shuttle tankers for GoM in 2001.
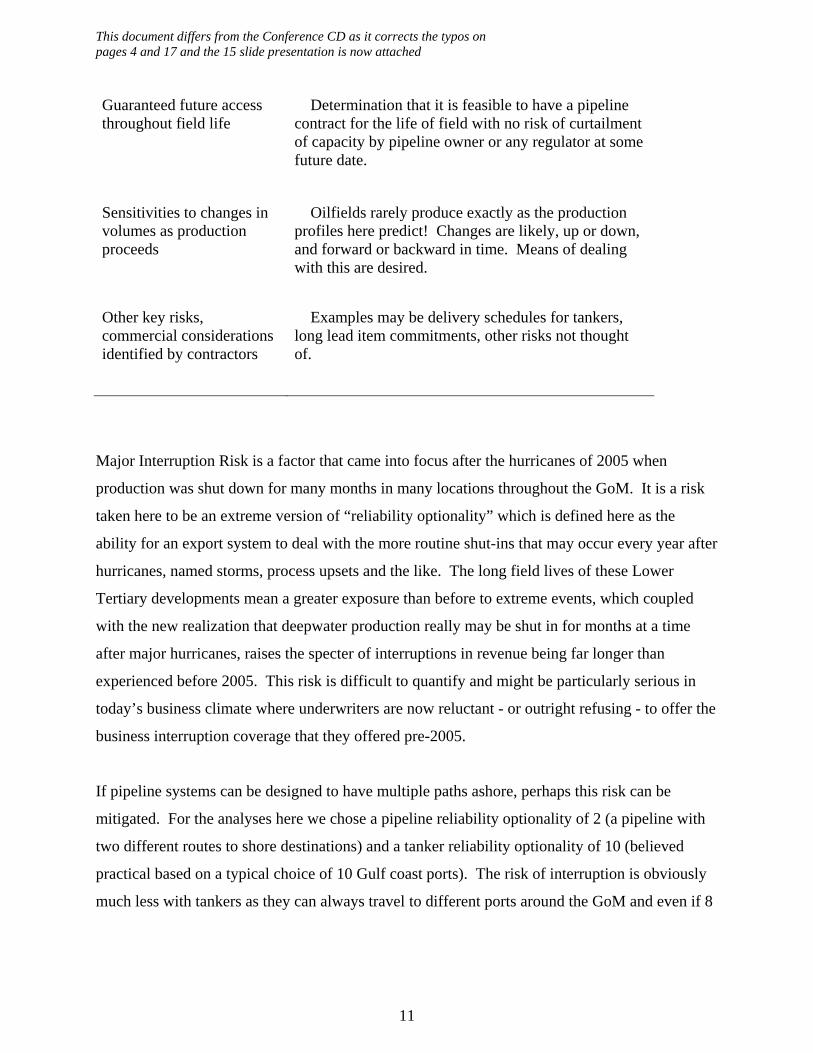
A number of other issues may need to be assessed in the comparisons and can affect the risks and
economics:-
Table 3: Other Significant Issues
Issue Significance
This document differs from the Conference CD as it corrects the typos on pages 4 and 17 and the 15 slide presentation is now attached
11
Guaranteed future access throughout field life
Determination that it is feasible to have a pipeline contract for the life of field with no risk of curtailment of capacity by pipeline owner or any regulator at some future date.
Sensitivities to changes in volumes as production proceeds
Oilfields rarely produce exactly as the production profiles here predict! Changes are likely, up or down, and forward or backward in time. Means of dealing with this are desired.
Other key risks, commercial considerations identified by contractors
Examples may be delivery schedules for tankers, long lead item commitments, other risks not thought of.
Major Interruption Risk is a factor that came into focus after the hurricanes of 2005 when
production was shut down for many months in many locations throughout the GoM. It is a risk
taken here to be an extreme version of “reliability optionality” which is defined here as the
ability for an export system to deal with the more routine shut-ins that may occur every year after
hurricanes, named storms, process upsets and the like. The long field lives of these Lower
Tertiary developments mean a greater exposure than before to extreme events, which coupled
with the new realization that deepwater production really may be shut in for months at a time
after major hurricanes, raises the specter of interruptions in revenue being far longer than
experienced before 2005. This risk is difficult to quantify and might be particularly serious in
today’s business climate where underwriters are now reluctant - or outright refusing - to offer the
business interruption coverage that they offered pre-2005.
If pipeline systems can be designed to have multiple paths ashore, perhaps this risk can be
mitigated. For the analyses here we chose a pipeline reliability optionality of 2 (a pipeline with
two different routes to shore destinations) and a tanker reliability optionality of 10 (believed
practical based on a typical choice of 10 Gulf coast ports). The risk of interruption is obviously
much less with tankers as they can always travel to different ports around the GoM and even if 8
This document differs from the Conference CD as it corrects the typos on pages 4 and 17 and the 15 slide presentation is now attached
12
or 9 of these GoM ports were shut in, tankers could still deliver to the remaining one or two that
were open or to (say) the Philadelphia refiners, if necessary.
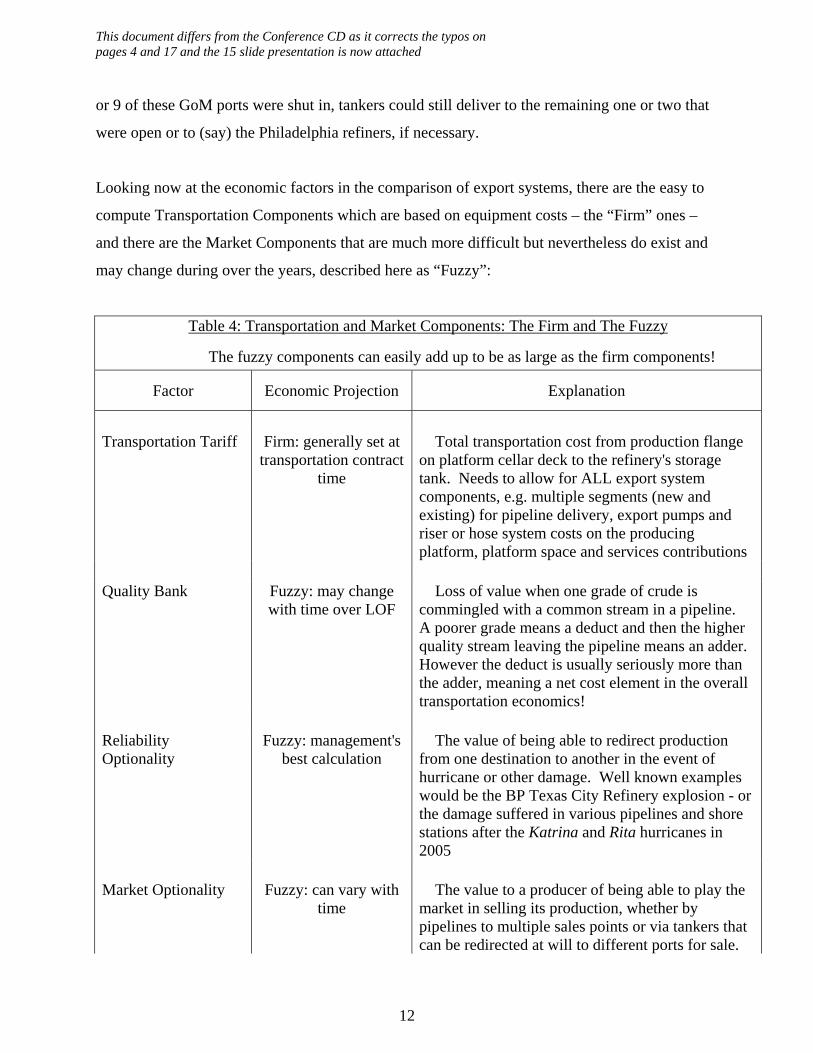
Looking now at the economic factors in the comparison of export systems, there are the easy to
compute Transportation Components which are based on equipment costs – the “Firm” ones –
and there are the Market Components that are much more difficult but nevertheless do exist and
may change during over the years, described here as “Fuzzy”:
Table 4: Transportation and Market Components: The Firm and The Fuzzy
The fuzzy components can easily add up to be as large as the firm components!
Factor Economic Projection Explanation
Transportation Tariff Firm: generally set at
transportation contract time
Total transportation cost from production flange on platform cellar deck to the refinery's storage tank. Needs to allow for ALL export system components, e.g. multiple segments (new and existing) for pipeline delivery, export pumps and riser or hose system costs on the producing platform, platform space and services contributions
Quality Bank Fuzzy: may change
with time over LOF Loss of value when one grade of crude is
commingled with a common stream in a pipeline. A poorer grade means a deduct and then the higher quality stream leaving the pipeline means an adder. However the deduct is usually seriously more than the adder, meaning a net cost element in the overall transportation economics!
Reliability Optionality
Fuzzy: management's best calculation
The value of being able to redirect production from one destination to another in the event of hurricane or other damage. Well known examples would be the BP Texas City Refinery explosion - or the damage suffered in various pipelines and shore stations after the Katrina and Rita hurricanes in 2005
Market Optionality Fuzzy: can vary with
time The value to a producer of being able to play the
market in selling its production, whether by pipelines to multiple sales points or via tankers that can be redirected at will to different ports for sale.
This document differs from the Conference CD as it corrects the typos on pages 4 and 17 and the 15 slide presentation is now attached
13
Engineers understand the Firm but the Fuzzy components drive them nuts! Nevertheless the
Fuzzy are commercial realities, cannot be ignored and are susceptible to market projections by
independent consultants. Put another way, the Firm components tend to be follow a tight
probability curve while the Fuzzy follow a much flatter bell curve with the location of P50 being
more difficult to find than with the Firm.
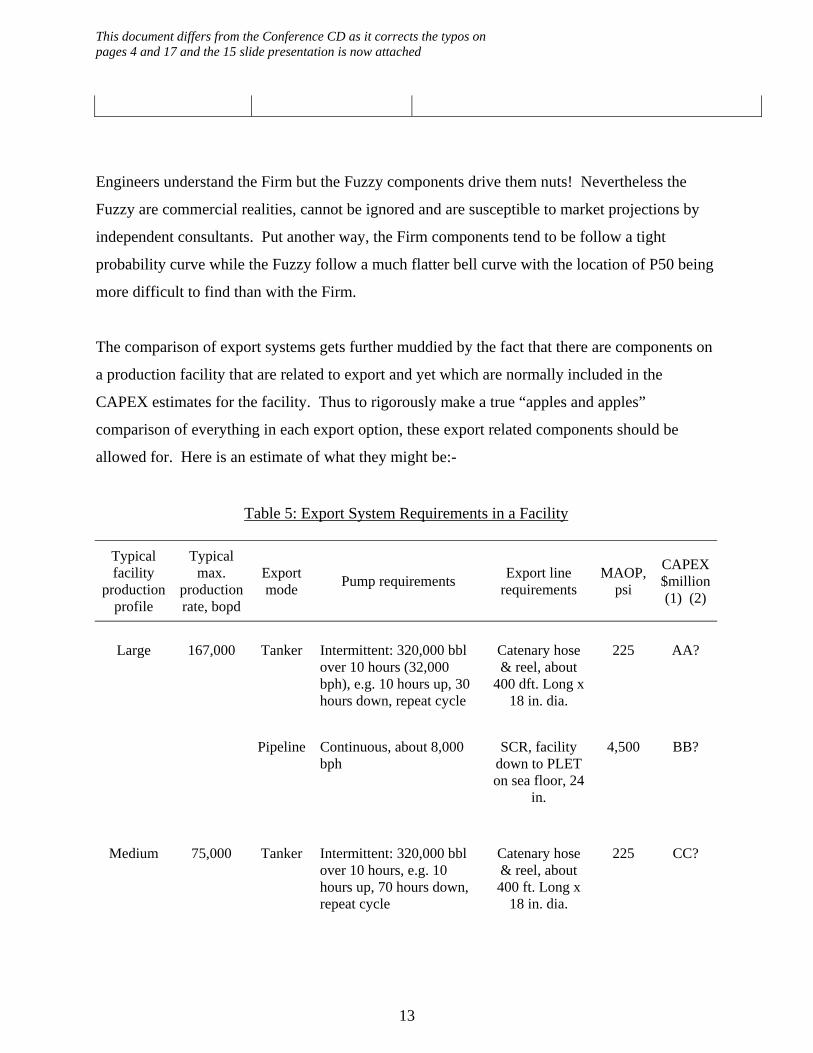
The comparison of export systems gets further muddied by the fact that there are components on
a production facility that are related to export and yet which are normally included in the
CAPEX estimates for the facility. Thus to rigorously make a true “apples and apples”
comparison of everything in each export option, these export related components should be
allowed for. Here is an estimate of what they might be:-
Table 5: Export System Requirements in a Facility
Typical facility
production profile
Typical max.
production rate, bopd
Export mode Pump requirements Export line
requirements MAOP,
psi
CAPEX $million (1) (2)
Large 167,000 Tanker Intermittent: 320,000 bbl
over 10 hours (32,000 bph), e.g. 10 hours up, 30 hours down, repeat cycle
Catenary hose & reel, about
400 dft. Long x 18 in. dia.
225 AA?
Pipeline Continuous, about 8,000 bph
SCR, facility down to PLET on sea floor, 24
in.
4,500 BB?
Medium 75,000 Tanker Intermittent: 320,000 bbl
over 10 hours, e.g. 10 hours up, 70 hours down, repeat cycle
Catenary hose & reel, about 400 ft. Long x
18 in. dia.
225 CC?
This document differs from the Conference CD as it corrects the typos on pages 4 and 17 and the 15 slide presentation is now attached
14
Pipeline Continuous, about 4,000 bph
SCR, facility down to PLET on sea floor, 18
in.
4,500 DD?
Notes: (i) CAPEX information AAA-DDD needs to include some contribution for prime movers to power the system, plus some contribution for the space and weight carrying capabilities in the facility.
(ii)
CAPEX numbers would be translated later to equivalent tariffs in the LT Export comparison tables.
All the factors are now identified to allow economic projections for the five export options and
how they are affected by the volumes from the Medium and Large reservoirs.
For simplicity a deterministic calculation is used here to show the directions that emerge.
Serious projections for a specific field with all the uncertainties involved obviously would
benefit from probabilistic projections. Attempting first to arrive at realistic ranges for each
factor would require some serious judgment and experience!
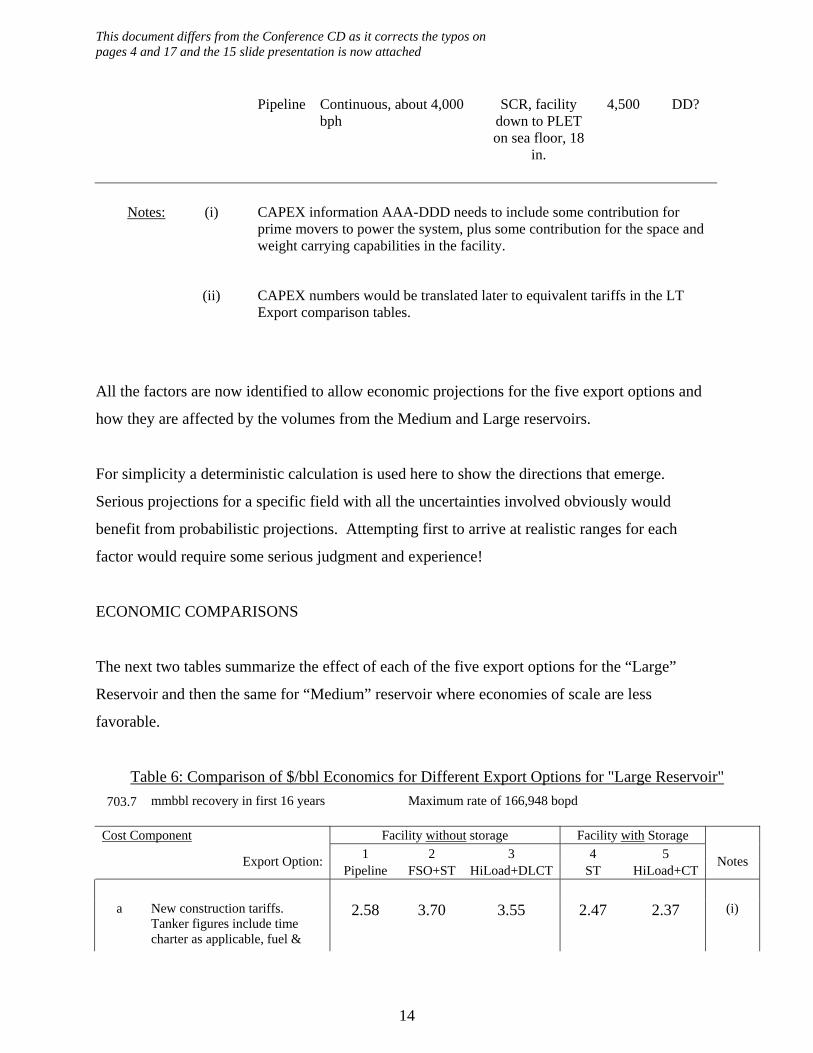
ECONOMIC COMPARISONS
The next two tables summarize the effect of each of the five export options for the “Large”
Reservoir and then the same for “Medium” reservoir where economies of scale are less
favorable.
Table 6: Comparison of $/bbl Economics for Different Export Options for "Large Reservoir" 703.7 mmbbl recovery in first 16 years Maximum rate of 166,948 bopd
Cost Component Facility without storage Facility with Storage
1 2 3 4 5
Export Option: Pipeline FSO+ST HiLoad+DLCT ST HiLoad+CT
Notes
a New construction tariffs.
Tanker figures include time charter as applicable, fuel &
2.58 3.70 3.55 2.47 2.37 (i)
This document differs from the Conference CD as it corrects the typos on pages 4 and 17 and the 15 slide presentation is now attached
15
port costs:
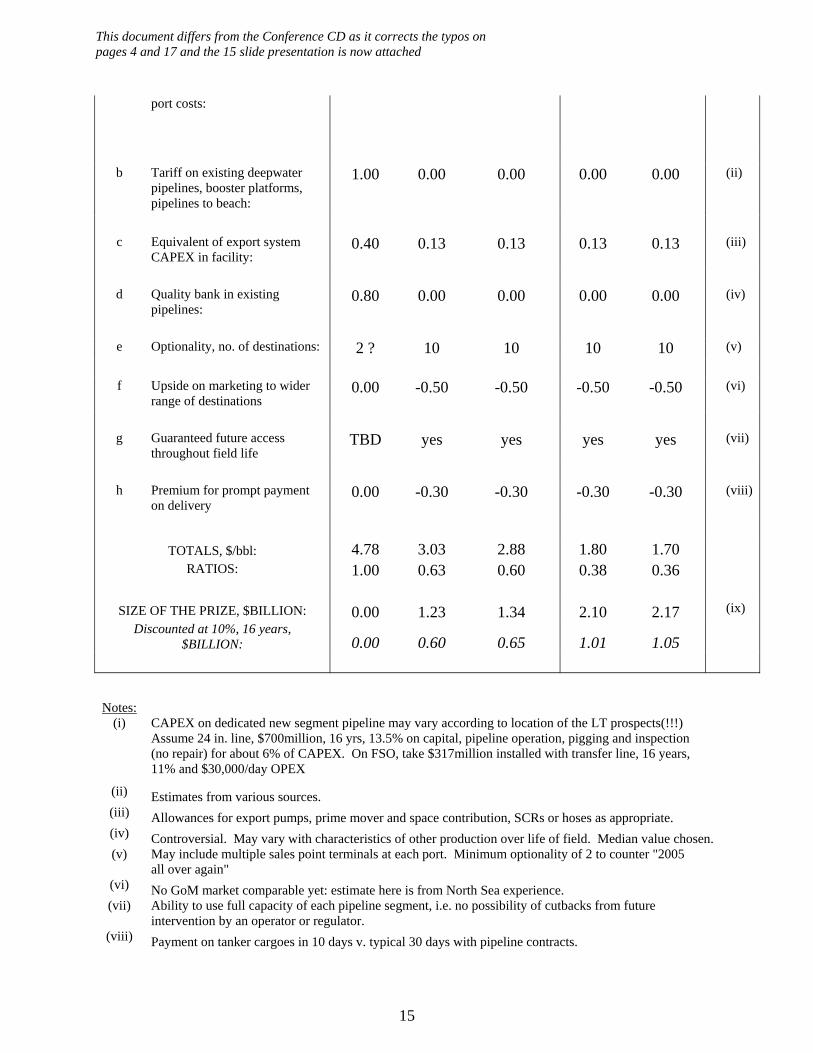
b Tariff on existing deepwater
pipelines, booster platforms, pipelines to beach:
1.00 0.00 0.00 0.00 0.00 (ii)
c Equivalent of export system
CAPEX in facility: 0.40 0.13 0.13 0.13 0.13 (iii)
d Quality bank in existing
pipelines: 0.80 0.00 0.00 0.00 0.00 (iv)
e Optionality, no. of destinations: 2 ? 10 10 10 10 (v) f Upside on marketing to wider
range of destinations 0.00 -0.50 -0.50 -0.50 -0.50 (vi)
g Guaranteed future access
throughout field life TBD yes yes yes yes (vii)
h Premium for prompt payment
on delivery 0.00 -0.30 -0.30 -0.30 -0.30 (viii)
TOTALS, $/bbl: 4.78 3.03 2.88 1.80 1.70
RATIOS: 1.00 0.63 0.60 0.38 0.36
SIZE OF THE PRIZE, $BILLION: 0.00 1.23 1.34 2.10 2.17 (ix) Discounted at 10%, 16 years,
$BILLION: 0.00 0.60 0.65 1.01 1.05
Notes:
(i)
CAPEX on dedicated new segment pipeline may vary according to location of the LT prospects(!!!) Assume 24 in. line, $700million, 16 yrs, 13.5% on capital, pipeline operation, pigging and inspection (no repair) for about 6% of CAPEX. On FSO, take $317million installed with transfer line, 16 years, 11% and $30,000/day OPEX
(ii) Estimates from various sources. (iii) Allowances for export pumps, prime mover and space contribution, SCRs or hoses as appropriate. (iv) Controversial. May vary with characteristics of other production over life of field. Median value chosen. (v) May include multiple sales point terminals at each port. Minimum optionality of 2 to counter "2005
all over again" (vi) No GoM market comparable yet: estimate here is from North Sea experience. (vii) Ability to use full capacity of each pipeline segment, i.e. no possibility of cutbacks from future
intervention by an operator or regulator. (viii) Payment on tanker cargoes in 10 days v. typical 30 days with pipeline contracts.
This document differs from the Conference CD as it corrects the typos on pages 4 and 17 and the 15 slide presentation is now attached
16
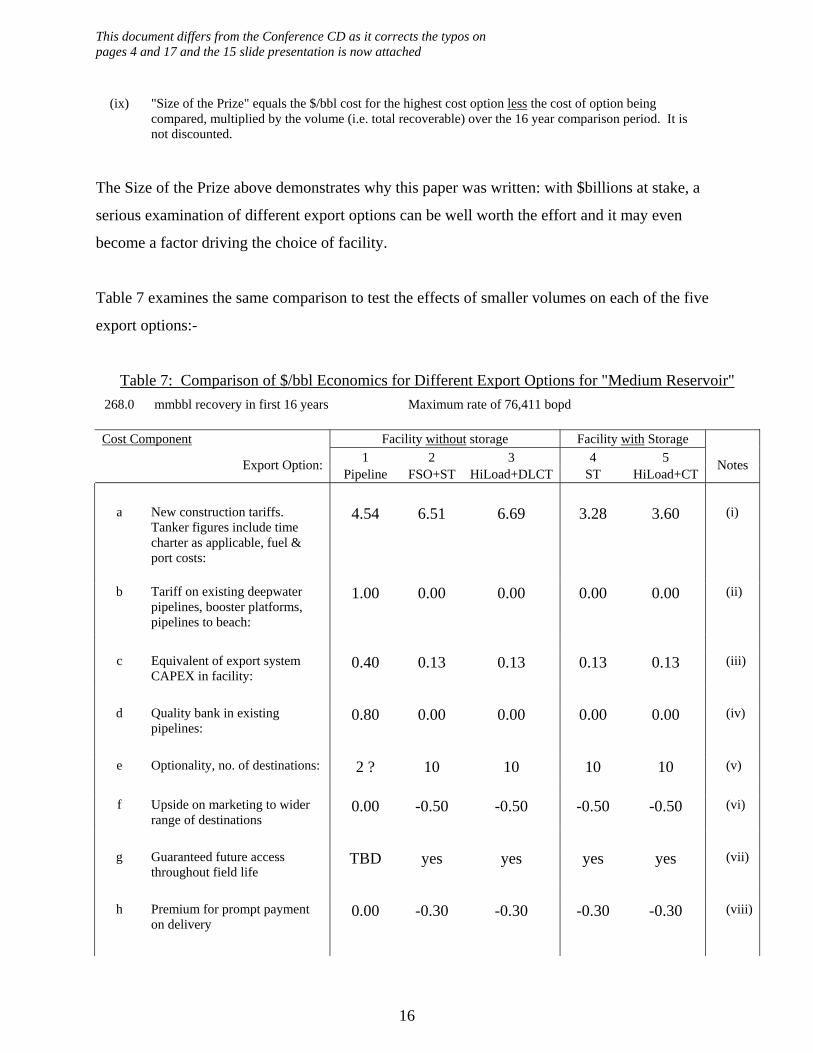
(ix)
"Size of the Prize" equals the $/bbl cost for the highest cost option less the cost of option being compared, multiplied by the volume (i.e. total recoverable) over the 16 year comparison period. It is not discounted.
The Size of the Prize above demonstrates why this paper was written: with $billions at stake, a
serious examination of different export options can be well worth the effort and it may even
become a factor driving the choice of facility.
Table 7 examines the same comparison to test the effects of smaller volumes on each of the five
export options:-
Table 7: Comparison of $/bbl Economics for Different Export Options for "Medium Reservoir" 268.0 mmbbl recovery in first 16 years Maximum rate of 76,411 bopd Cost Component Facility without storage Facility with Storage
1 2 3 4 5
Export Option: Pipeline FSO+ST HiLoad+DLCT ST HiLoad+CT
Notes
a New construction tariffs.
Tanker figures include time charter as applicable, fuel & port costs:
4.54 6.51 6.69 3.28 3.60 (i)
b Tariff on existing deepwater
pipelines, booster platforms, pipelines to beach:
1.00 0.00 0.00 0.00 0.00 (ii)
c Equivalent of export system
CAPEX in facility: 0.40 0.13 0.13 0.13 0.13 (iii)
d Quality bank in existing
pipelines: 0.80 0.00 0.00 0.00 0.00 (iv)
e Optionality, no. of destinations: 2 ? 10 10 10 10 (v) f Upside on marketing to wider
range of destinations 0.00 -0.50 -0.50 -0.50 -0.50 (vi)
g Guaranteed future access
throughout field life TBD yes yes yes yes (vii)
h Premium for prompt payment
on delivery 0.00 -0.30 -0.30 -0.30 -0.30 (viii)
This document differs from the Conference CD as it corrects the typos on pages 4 and 17 and the 15 slide presentation is now attached
17
TOTALS: 6.74 5.84 6.02 2.61 2.93 RATIOS: 1.00 0.87 0.89 0.39 0.43
SIZE OF THE PRIZE, $BILLION: 0.00 0.90 0.72 4.13 3.81 (ix) Discounted at 10%, 16 years,
$BILLION: 0.00 0.44 0.35 2.00 1.84
Notes:
(i)
CAPEX on dedicated new segment pipeline may vary according to location of the LT prospects(!!!) Assume 18 in. line, $460million, 16 yrs, 13.5% on capital, pipeline operation, pigging and inspection (no repair) for about 6% of CAPEX. On FSO, take $317million installed with transfer line, 16 years, 11% and $30,000/day OPEX
(ii) Estimates from various sources. (iii) Allowances for export pumps, prime mover and space contribution, SCRs or hoses as appropriate. (iv) Controversial. May vary with characteristics of other production over life of field. Median value chosen. (v) May include multiple sales point terminals at each port. Minimum optionality of 2 to counter "2005
all over again" (vi) No GoM market comparable yet: estimate here is from North Sea experience. (vii) Ability to use full capacity of each pipeline segment, i.e. no possibility of cutbacks from future
intervention by an operator or regulator. (viii) Payment on tanker cargoes in 10 days v. typical 30 days with pipeline contracts. (ix)
"Size of the Prize" equals the $/bbl cost for the highest cost option less the cost of option being compared, multiplied by the volume (i.e. total recoverable) over the 16 year comparison period. It is not discounted.
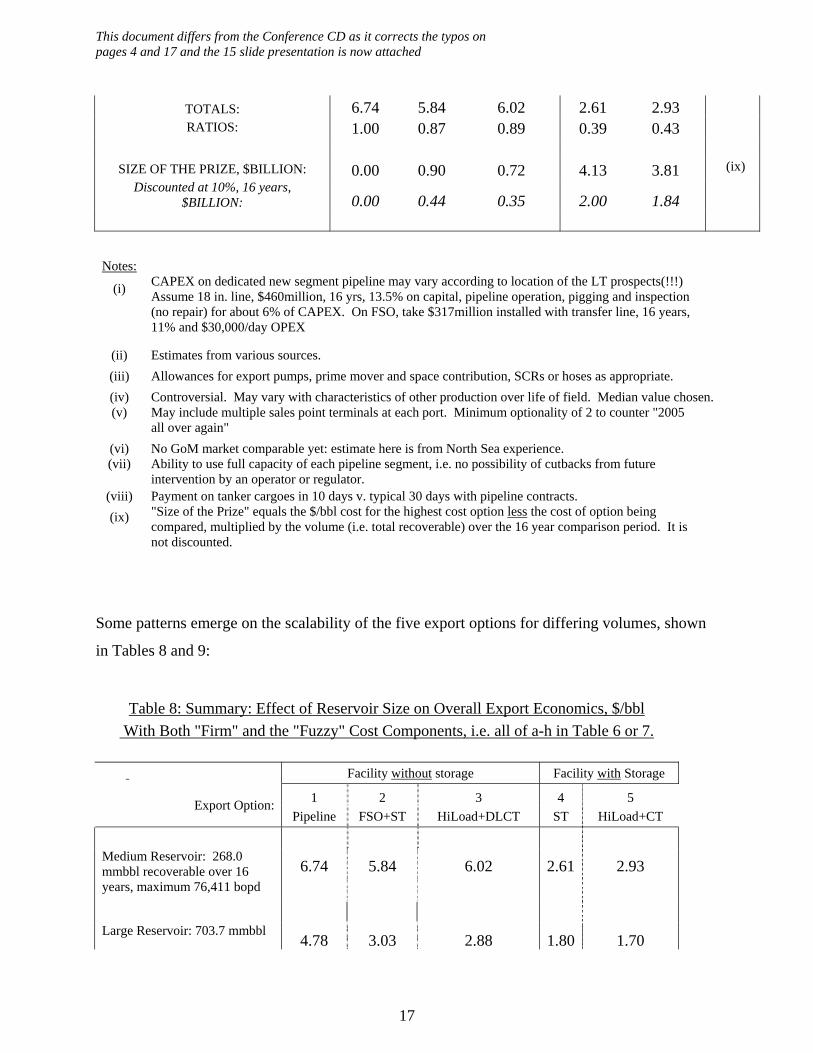
Some patterns emerge on the scalability of the five export options for differing volumes, shown
in Tables 8 and 9:
Table 8: Summary: Effect of Reservoir Size on Overall Export Economics, $/bbl With Both "Firm" and the "Fuzzy" Cost Components, i.e. all of a-h in Table 6 or 7.
Facility without storage Facility with Storage
1 2 3 4 5
Export Option: Pipeline FSO+ST HiLoad+DLCT ST HiLoad+CT
6.74 5.84 6.02 2.61 2.93 Medium Reservoir: 268.0 mmbbl recoverable over 16 years, maximum 76,411 bopd Large Reservoir: 703.7 mmbbl
4.78 3.03 2.88 1.80 1.70
This document differs from the Conference CD as it corrects the typos on pages 4 and 17 and the 15 slide presentation is now attached
18
recoverable over 16 years, maximum 166,948 bopd
The “Firm” cost components are relatively straightforward and engineers can compute them with
the debate being about design and costs for physical equipment.
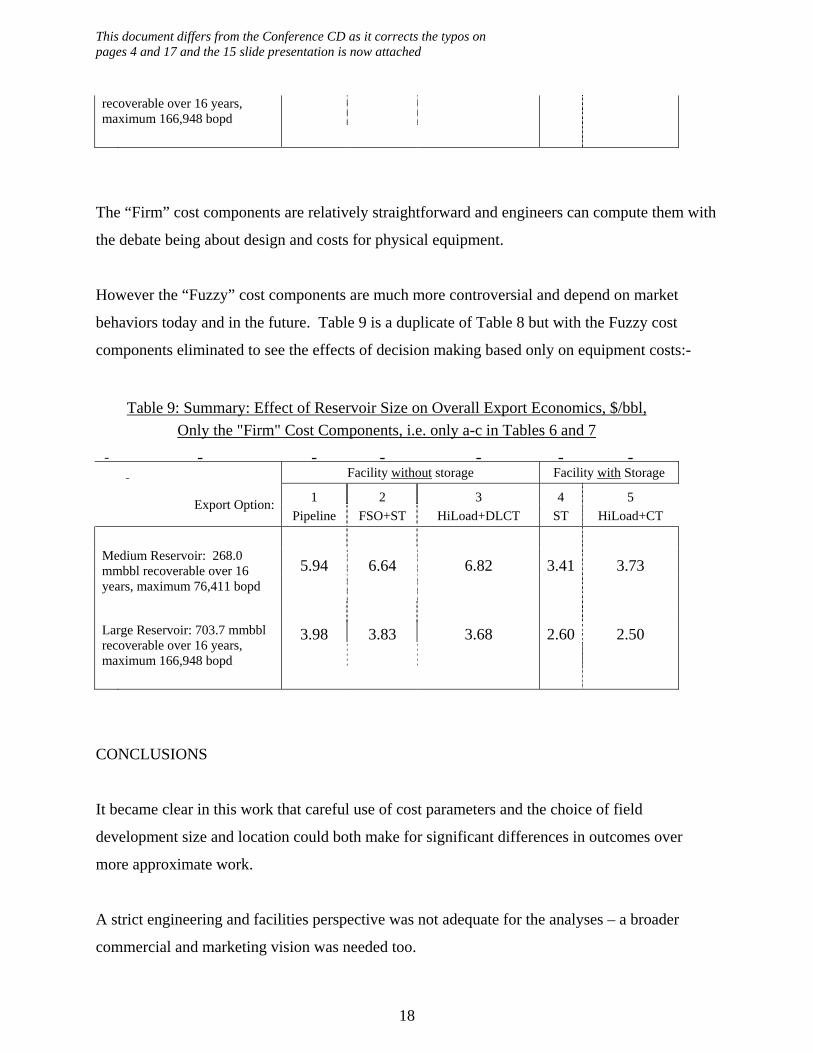
However the “Fuzzy” cost components are much more controversial and depend on market
behaviors today and in the future. Table 9 is a duplicate of Table 8 but with the Fuzzy cost
components eliminated to see the effects of decision making based only on equipment costs:-
Table 9: Summary: Effect of Reservoir Size on Overall Export Economics, $/bbl, Only the "Firm" Cost Components, i.e. only a-c in Tables 6 and 7
Facility without storage Facility with Storage
1 2 3 4 5
Export Option: Pipeline FSO+ST HiLoad+DLCT ST HiLoad+CT
5.94 6.64 6.82 3.41 3.73 Medium Reservoir: 268.0 mmbbl recoverable over 16 years, maximum 76,411 bopd
3.98 3.83 3.68 2.60 2.50 Large Reservoir: 703.7 mmbbl recoverable over 16 years, maximum 166,948 bopd
CONCLUSIONS
It became clear in this work that careful use of cost parameters and the choice of field
development size and location could both make for significant differences in outcomes over
more approximate work.
A strict engineering and facilities perspective was not adequate for the analyses – a broader
commercial and marketing vision was needed too.
This document differs from the Conference CD as it corrects the typos on pages 4 and 17 and the 15 slide presentation is now attached
19
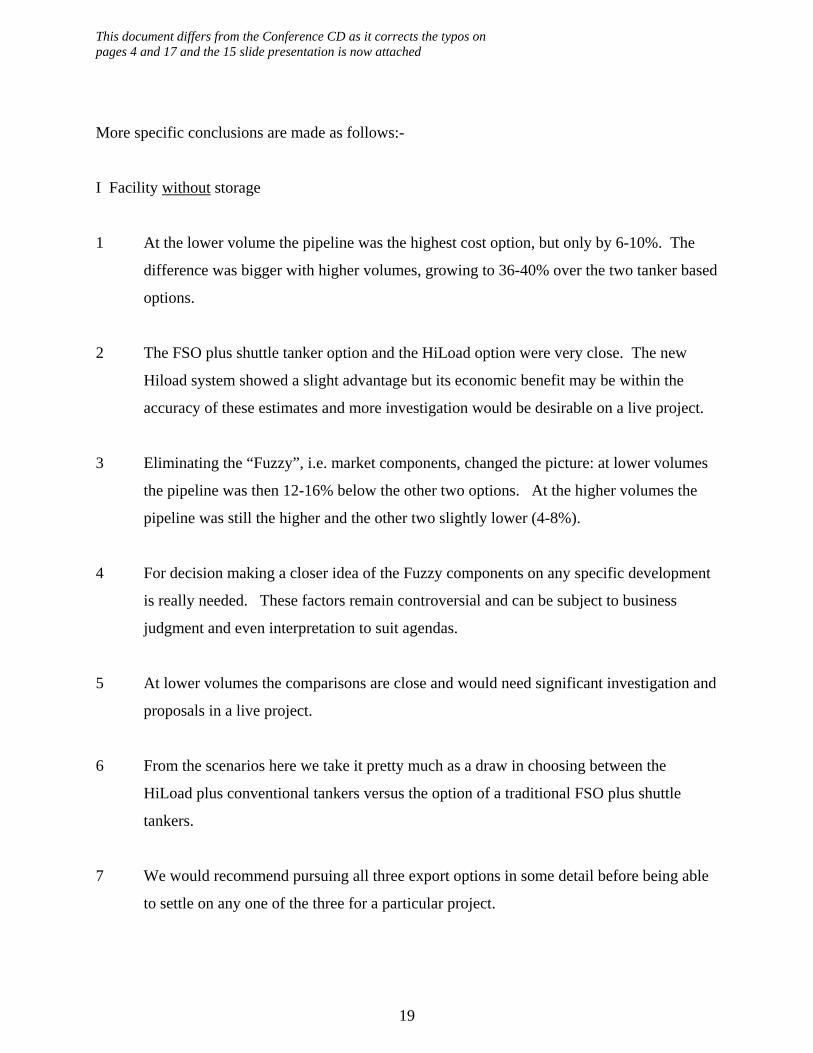
More specific conclusions are made as follows:-
I Facility without storage
1 At the lower volume the pipeline was the highest cost option, but only by 6-10%. The
difference was bigger with higher volumes, growing to 36-40% over the two tanker based
options.
2 The FSO plus shuttle tanker option and the HiLoad option were very close. The new
Hiload system showed a slight advantage but its economic benefit may be within the
accuracy of these estimates and more investigation would be desirable on a live project.
3 Eliminating the “Fuzzy”, i.e. market components, changed the picture: at lower volumes
the pipeline was then 12-16% below the other two options. At the higher volumes the
pipeline was still the higher and the other two slightly lower (4-8%).
4 For decision making a closer idea of the Fuzzy components on any specific development
is really needed. These factors remain controversial and can be subject to business
judgment and even interpretation to suit agendas.
5 At lower volumes the comparisons are close and would need significant investigation and
proposals in a live project.
6 From the scenarios here we take it pretty much as a draw in choosing between the
HiLoad plus conventional tankers versus the option of a traditional FSO plus shuttle
tankers.
7 We would recommend pursuing all three export options in some detail before being able
to settle on any one of the three for a particular project.
This document differs from the Conference CD as it corrects the typos on pages 4 and 17 and the 15 slide presentation is now attached
20
II Facility with storage
8 The major conclusion for the volumes and economic scenarios here is that a facility with
storage can enjoy an export cost of around 44-52% of that of a facility without storage.
Even if one ignores every one of the Fuzzy cost components, the advantage is less but
still serious: in the range of about 55-67% of the without storage option. The lower end
of these ranges corresponded to estimates for the larger volume.
9 It is difficult to see a compelling case for deciding between the use of the higher cost
shuttle tankers and the lower cost conventional tankers combined with a HiLoad system.
The larger volume scenario favored the HiLoad by a few percent and lower the lower
volume scenario favored shuttle tankers by a few percent. In the real world more detailed
assessments and competitive bidding would be required to resolve the choice for a
specific requirement.
Acknowledgement and Disclaimer
The author wishes to thank Devon Energy Corporation for providing the time to prepare this
work and in approving its presentation at DOT.
The figures used here and the opinions expressed are these of the author, are believed to be
representative of the factors at play but do not imply any corporate position by Devon Energy
Corporation. However Devon does endorse the principles put forward here of arriving at some
form of careful technical and economic assessment of all export options to enable a prudent
business choice on export mode.
1
1 of 15
The Lower Tertiary Trend and the Oil Export Economic Prize
Peter LovieDevon Energy Corporation
2 of 15
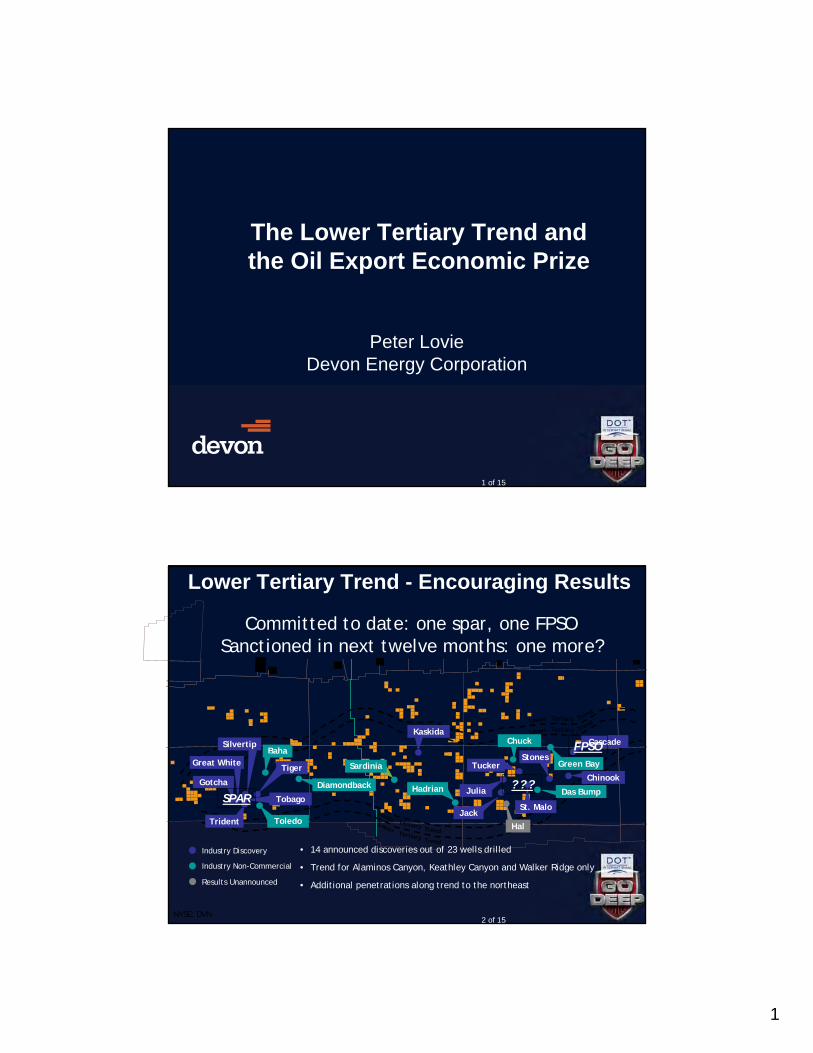
Lower Tertiary Trend - Encouraging Results
NYSE: DVN
TertiaryLower Trend
Tertiary
Lower
Trend
TertiaryLower Trend
Tertiary
Lower
Trend
Industry Discovery
Industry Non-Commercial
Results Unannounced
• 14 announced discoveries out of 23 wells drilled
• Trend for Alaminos Canyon, Keathley Canyon and Walker Ridge only
• Additional penetrations along trend to the northeast
Cascade
Jack
Chinook
Stones
St. Malo
Kaskida
Tobago
Gotcha
Great White
Silvertip
Trident
Tiger
Toledo
Baha
Sardinia
HadrianDiamondbackDas Bump
Tucker
Julia
Hal
Green Bay
Chuck FPSO
SPAR? ? ?
Committed to date: one spar, one FPSOSanctioned in next twelve months: one more?
2
3 of 15
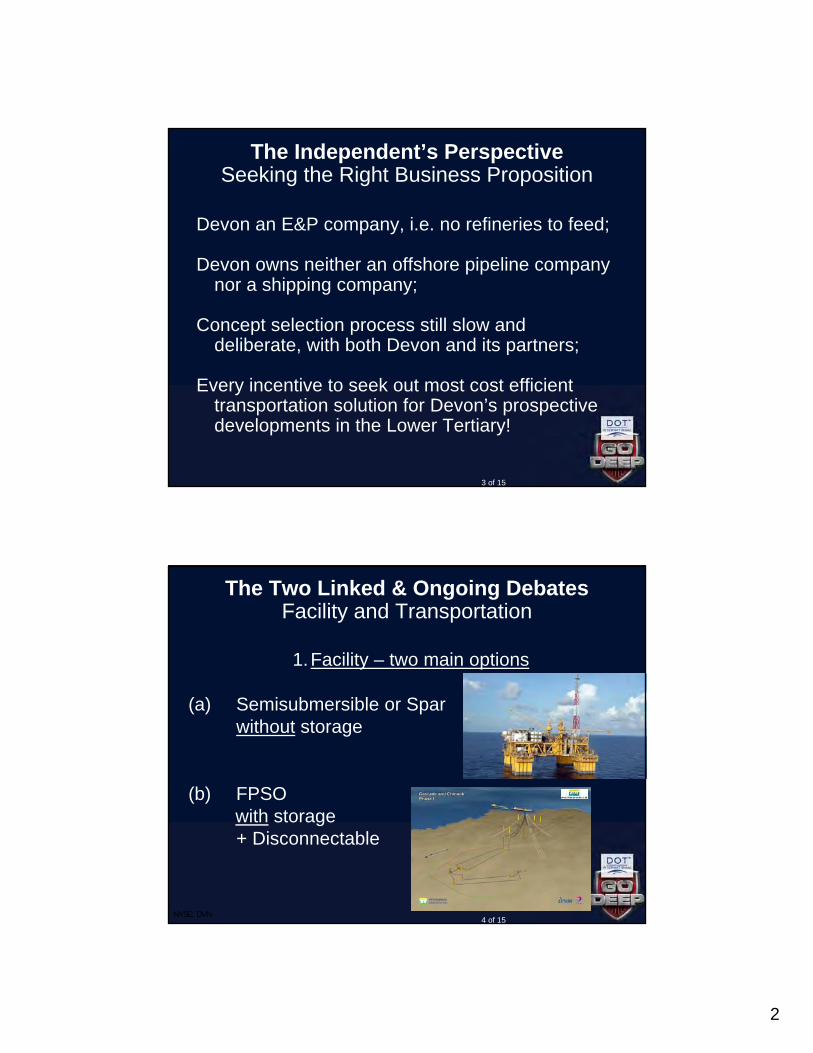
The Independent’s Perspective Seeking the Right Business Proposition
Devon an E&P company, i.e. no refineries to feed;
Devon owns neither an offshore pipeline company nor a shipping company;
Concept selection process still slow and deliberate, with both Devon and its partners;
Every incentive to seek out most cost efficient transportation solution for Devon’s prospective developments in the Lower Tertiary!
4 of 15NYSE: DVN
The Two Linked & Ongoing Debates Facility and Transportation
1.Facility – two main options
(a) Semisubmersible or Spar without storage
(b) FPSO with storage+ Disconnectable
3
5 of 15
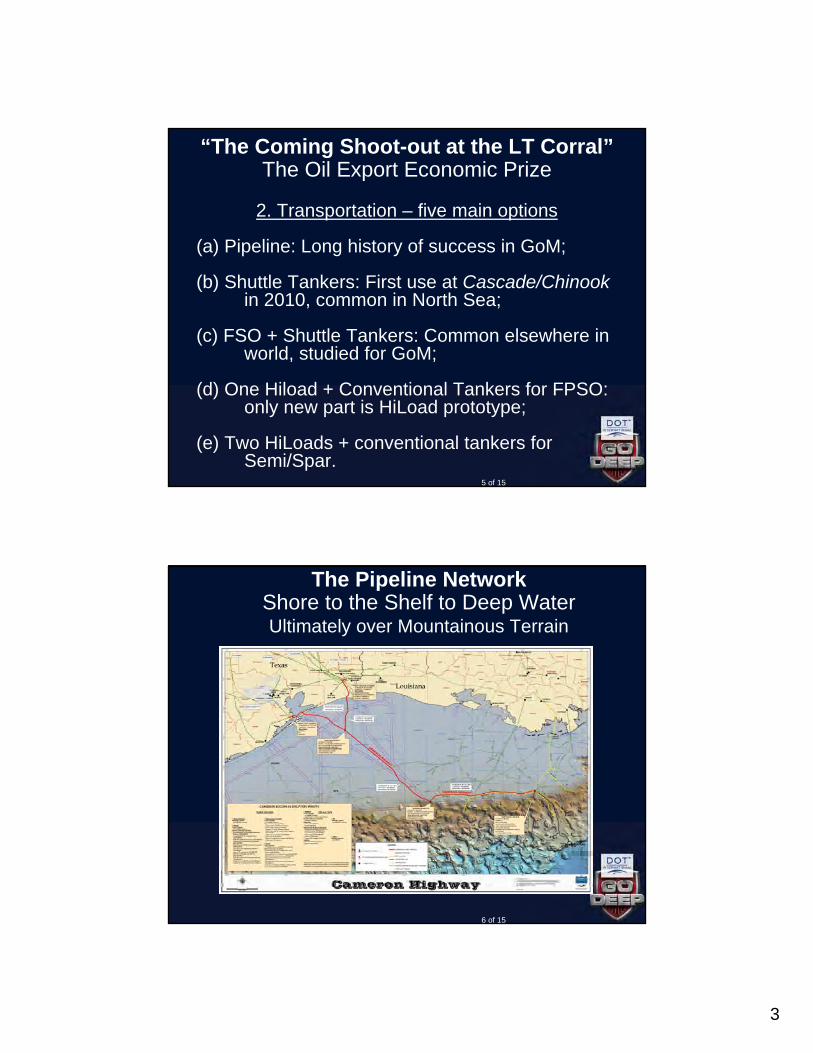
“The Coming Shoot-out at the LT Corral”The Oil Export Economic Prize
2. Transportation – five main options
(a) Pipeline: Long history of success in GoM;
(b) Shuttle Tankers: First use at Cascade/Chinookin 2010, common in North Sea;
(c) FSO + Shuttle Tankers: Common elsewhere in world, studied for GoM;
(d) One Hiload + Conventional Tankers for FPSO: only new part is HiLoad prototype;
(e) Two HiLoads + conventional tankers for Semi/Spar.
6 of 15
The Pipeline Network Shore to the Shelf to Deep Water Ultimately over Mountainous Terrain
4
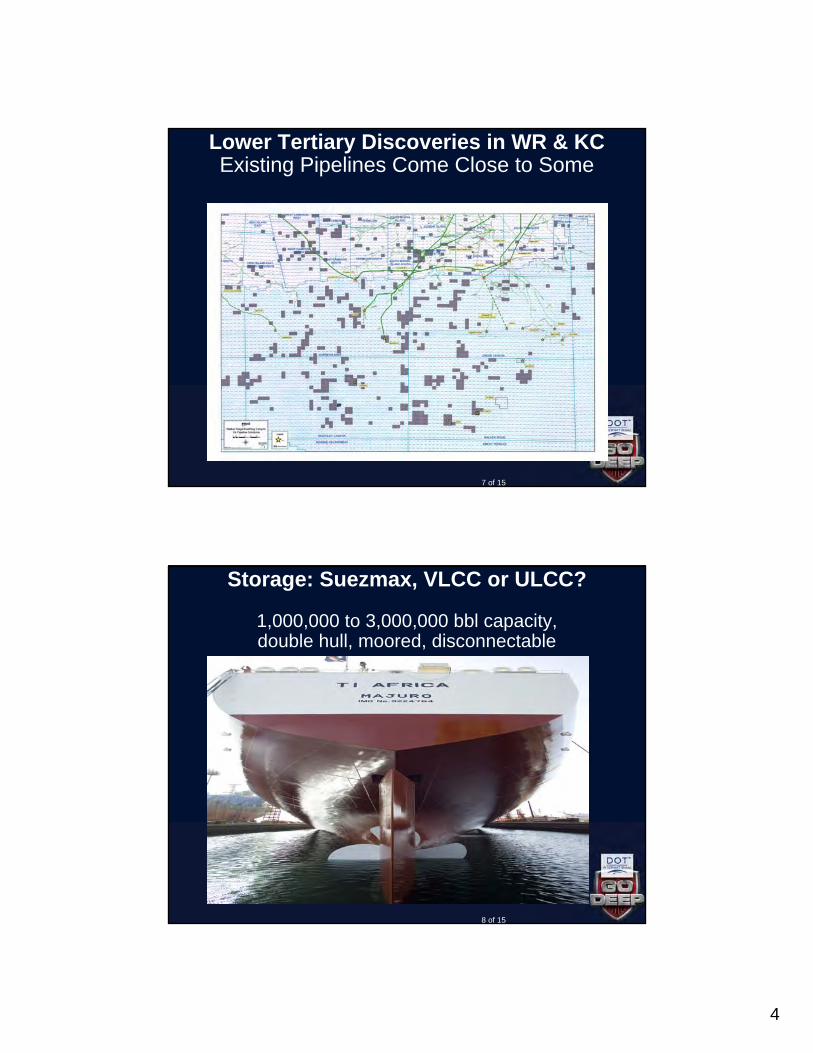
7 of 15
Lower Tertiary Discoveries in WR & KCExisting Pipelines Come Close to Some
8 of 15
Storage: Suezmax, VLCC or ULCC?
1,000,000 to 3,000,000 bbl capacity, double hull, moored, disconnectable
5
9 of 15
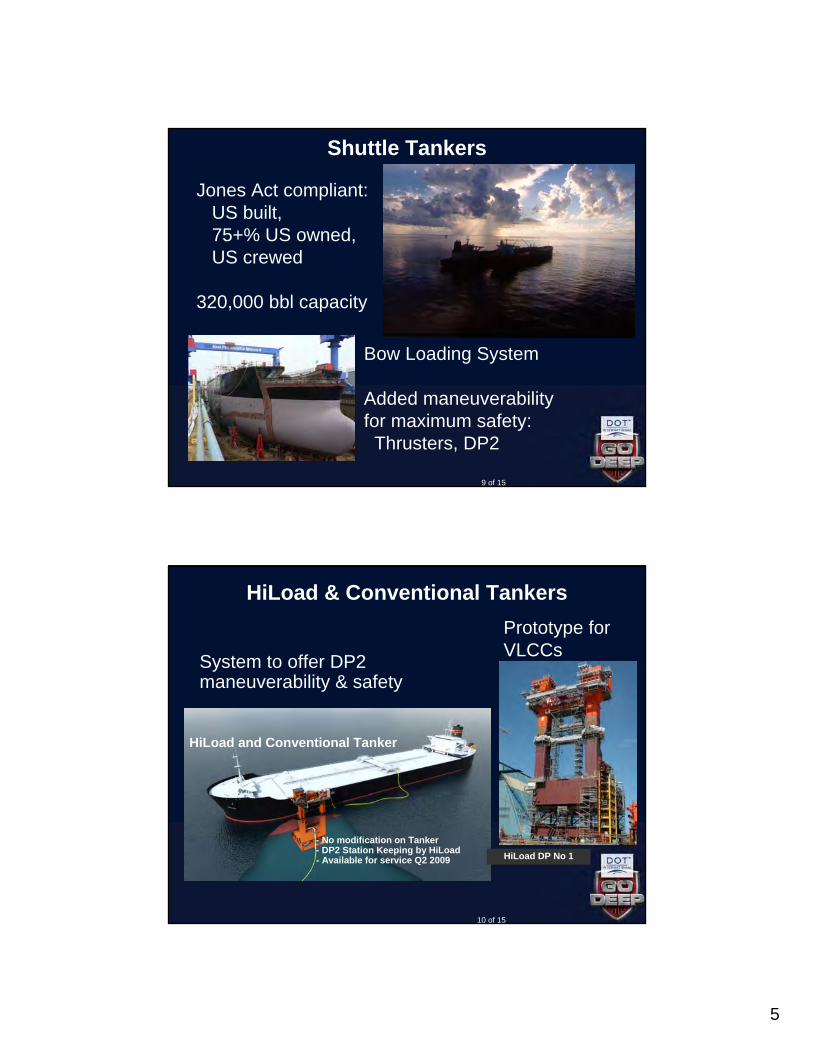
Shuttle Tankers
Jones Act compliant: US built, 75+% US owned, US crewed
320,000 bbl capacity
Bow Loading System
Added maneuverability for maximum safety:
Thrusters, DP2
10 of 15
HiLoad & Conventional Tankers
- No modification on Tanker- DP2 Station Keeping by HiLoad- Available for service Q2 2009
HiLoad and Conventional Tanker
HiLoad DP No 1
System to offer DP2 maneuverability & safety
Prototype for VLCCs
6
11 of 15
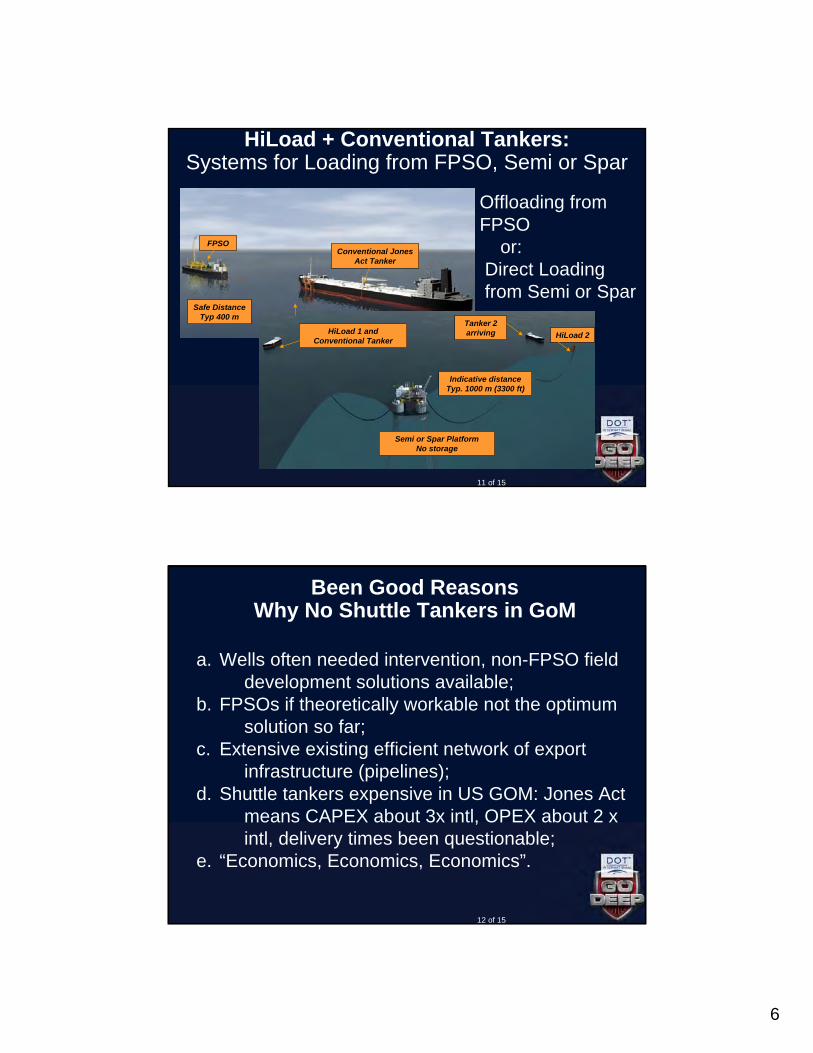
HiLoad + Conventional Tankers: Systems for Loading from FPSO, Semi or Spar
FPSO
Safe Distance Typ 400 m
Conventional Jones Act Tanker
HiLoad DP
Semi or Spar PlatformNo storage
HiLoad 1 andConventional Tanker
HiLoad 2
Indicative distance Typ. 1000 m (3300 ft)
Tanker 2 arriving
Offloading from FPSO
or: Direct Loadingfrom Semi or Spar
12 of 15
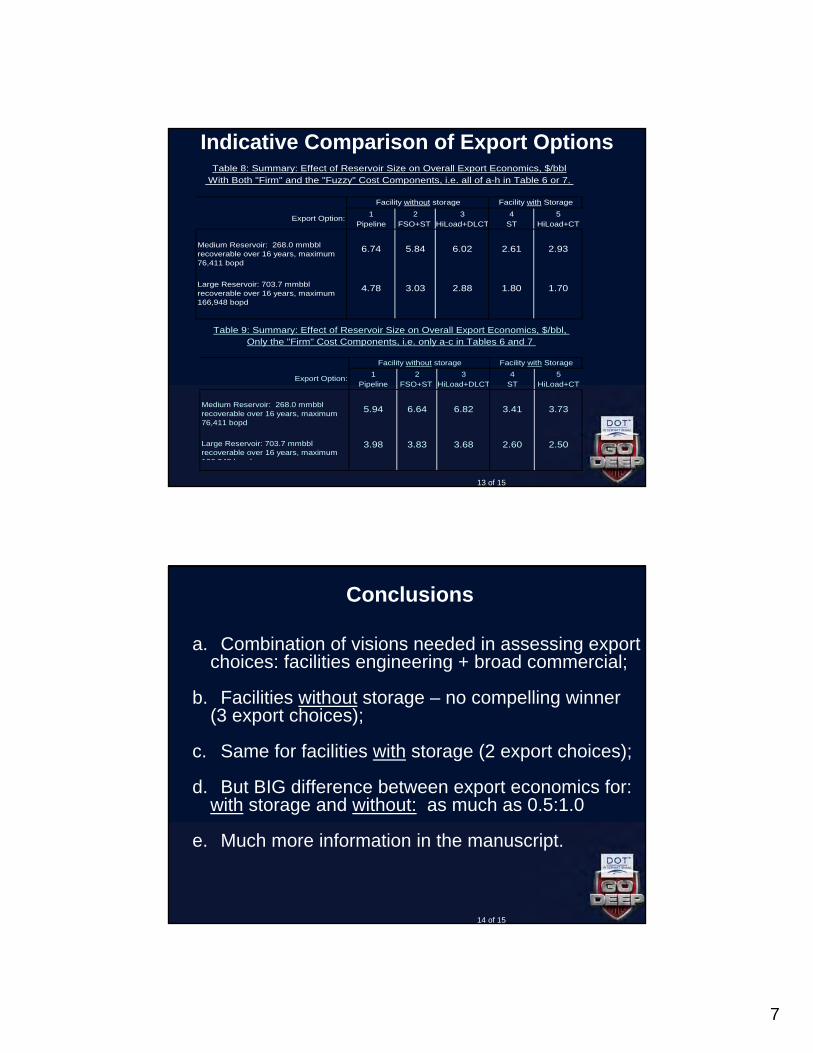
Been Good Reasons Why No Shuttle Tankers in GoM
a. Wells often needed intervention, non-FPSO field development solutions available;
b. FPSOs if theoretically workable not the optimum solution so far;
c. Extensive existing efficient network of export infrastructure (pipelines);
d. Shuttle tankers expensive in US GOM: Jones Act means CAPEX about 3x intl, OPEX about 2 x intl, delivery times been questionable;
e. “Economics, Economics, Economics”.
7
13 of 15
Indicative Comparison of Export Options
1 2 3 4 5Pipeline FSO+ST HiLoad+DLCT ST HiLoad+CT
5.94 6.64 6.82 3.41 3.73
3.98 3.83 3.68 2.60 2.50
Export Option:
Medium Reservoir: 268.0 mmbbl recoverable over 16 years, maximum 76,411 bopd
Large Reservoir: 703.7 mmbbl recoverable over 16 years, maximum 166 948 b d
Only the "Firm" Cost Components, i.e. only a-c in Tables 6 and 7 Table 9: Summary: Effect of Reservoir Size on Overall Export Economics, $/bbl,
Facility without storage Facility with Storage
1 2 3 4 5Pipeline FSO+ST HiLoad+DLCT ST HiLoad+CT
6.74 5.84 6.02 2.61 2.93
4.78 3.03 2.88 1.80 1.70
Table 8: Summary: Effect of Reservoir Size on Overall Export Economics, $/bbl
Facility without storage Facility with Storage
Export Option:
Medium Reservoir: 268.0 mmbbl recoverable over 16 years, maximum 76,411 bopd
Large Reservoir: 703.7 mmbbl recoverable over 16 years, maximum 166,948 bopd
With Both "Firm" and the "Fuzzy" Cost Components, i.e. all of a-h in Table 6 or 7.
14 of 15
Conclusions
a. Combination of visions needed in assessing export choices: facilities engineering + broad commercial;
b. Facilities without storage – no compelling winner (3 export choices);
c. Same for facilities with storage (2 export choices);
d. But BIG difference between export economics for: with storage and without: as much as 0.5:1.0
e. Much more information in the manuscript.