Embed Size (px)
Citation preview

Fetvadjiev, Velichko H.; He, JiaThe longitudinal links of personality traits, values, and well-being andself-esteem. A five-wave study of a nationally representative sampleformal und inhaltlich überarbeitete Version der Originalveröffentlichung in:formally and content revised edition of the original source in:
Journal of personality and social psychology 117 (2019) 2, S. 448-464, 10.1037/pspp0000212
Bitte verwenden Sie in der Quellenangabe folgende URN oder DOI /Please use the following URN or DOI for reference:urn:nbn:de:0111-dipfdocs-18998710.25657/02:18998
https://nbn-resolving.org/urn:nbn:de:0111-dipfdocs-189987https://doi.org/10.25657/02:18998
Nutzungsbedingungen Terms of use
Gewährt wird ein nicht exklusives, nicht übertragbares, persönliches undbeschränktes Recht auf Nutzung dieses Dokuments. Dieses Dokument istausschließlich für den persönlichen, nicht-kommerziellen Gebrauchbestimmt. Die Nutzung stellt keine Übertragung des Eigentumsrechts andiesem Dokument dar und gilt vorbehaltlich der folgenden Einschränkungen:Auf sämtlichen Kopien dieses Dokuments müssen alleUrheberrechtshinweise und sonstigen Hinweise auf gesetzlichen Schutzbeibehalten werden. Sie dürfen dieses Dokument nicht in irgendeiner Weiseabändern, noch dürfen Sie dieses Dokument für öffentliche oderkommerzielle Zwecke vervielfältigen, öffentlich ausstellen, aufführen,vertreiben oder anderweitig nutzen.
We grant a non-exclusive, non-transferable, individual and limited right tousing this document.This document is solely intended for your personal, non-commercial use. Useof this document does not include any transfer of property rights and it isconditional to the following limitations: All of the copies of this documents mustretain all copyright information and other information regarding legalprotection. You are not allowed to alter this document in any way, to copy it forpublic or commercial purposes, to exhibit the document in public, to perform,distribute or otherwise use the document in public.
Mit der Verwendung dieses Dokuments erkennen Sie dieNutzungsbedingungen an.
By using this particular document, you accept the above-stated conditions ofuse.
Kontakt / Contact:
DIPF | Leibniz-Institut fürBildungsforschung und BildungsinformationFrankfurter [email protected]

©American Psychological Association, 2019. This paper is not the copy of record and may not exactly replicate the authoritative document published in the APA journal. Please do not copy or cite without author's permission. The final article is available, upon publication, at: https://doi.org/10.1037/pspp0000212

Running head: TRAITS, VALUES, AND WELL-BEING
1
The Longitudinal Links of Personality Traits, Values, Well-Being, and Self-Esteem:
A Five-Wave Study of a Nationally Representative Sample
Velichko H. Fetvadjiev
Victoria University of Wellington, New Zealand
Jia He
Tilburg University, The Netherlands, and
German Institute for International Educational Research, Germany
Acknowledgement: We thank Fons van de Vijver, Ron Fischer, Christian Kandler,
Kenneth Locke, and an anonymous reviewer for their comments and suggestions on earlier
versions of this article.
To appear in the Journal of Personality and Social Psychology.
– This is an unedited manuscript version that has been accepted for publication.
– This manuscript may not exactly replicate the final article version published in the journal.
It is not the copy of record.
© American Psychological Association
Journal home page: http://www.apa.org/pubs/journals/psp/index.aspx

TRAITS, VALUES, AND WELL-BEING
2
Abstract
The existence of links between personality traits, values, well-being, and self-esteem is well
established, but the nature and direction of these links have been less clearly understood. This
study examines longitudinally the stability of traits and values, their mutual effects, and their
effects on affective and cognitive well-being and self-esteem. We analyzed data from a
nationally representative panel in the Netherlands, spanning five time points spread across
eight years (n = 5,159 to 7,021 per time point, total N = 11,890). We estimated trait-state-
error models and random-intercepts cross-lagged panel models to account for the trait-like,
time-invariant stability of the constructs. Traits were more stable than values. The
bidirectional effects tended to be significant, but could be distinguished by their relative size.
Traits predicted values more strongly than they were predicted by values, and generally
predicted well-being and self-esteem more strongly than values did. Traits predicted broad
well-being (especially its affective aspects) more strongly than they were predicted by it;
values, by contrast, were predicted by well-being (especially its cognitive aspects and self-
esteem) more strongly than they predicted it. The findings highlight the central role of traits
for personality functioning, while also supporting the mutual constitution of traits and other
personality concepts. The results are discussed in the framework of different theoretical
approaches to the composition of the broader personality system.
Keywords: personality traits and values; affective and cognitive well-being; self-
esteem; stability and predictive power

TRAITS, VALUES, AND WELL-BEING
3
The Longitudinal Links of Personality Traits, Values, Well-Being, and Self-Esteem:
A Five-Wave Study of a Nationally Representative Sample
How are personality traits and values related, and how do they relate to psychological
well-being and self-esteem? Although it has been established that these concepts are
systematically linked (e.g., Parks-Leduc, Feldman, & Bardi, 2015; Steel, Schmidt, & Shultz,
2008), the nature and direction of these links have remained elusive. Is it possible to assign
causal or predictive priority to any of these concepts? Are personality traits or values more
stable and stronger in predicting one another? Do they differ in their effects on well-being
and self-esteem, and how do these effects come about? These questions are central to
understanding the composition of personality, but few direct empirical data exist to address
them comprehensively. The present study addresses this gap by examining the interrelations
of personality traits, values, well-being, and self-esteem in a nationally representative panel
in the Netherlands with data from five time points spanning eight years.
Theoretical Framework
Two broad theoretical perspectives inform the different approaches to the longitudinal
relations of personality and values (Bleidorn et al., 2010; Specht et al., 2014). The five-factor
theory (FFT: McCrae & Costa, 2008; Mõttus, 2017), on the one hand, places the notion of
biologically given personality traits centrally. A distinction is drawn between basic traits and
characteristic adaptations, or core and surface personality characteristics (Kandler,
Zimmermann, & McAdams, 2014). The basic traits (captured in the Five-Factor Model) are
seen as core personality characteristics that are heritable, temporally stable, relatively
immune to external influences, and causally prior to surface characteristics. Other aspects of
personality, such as values and self-schemata, are seen as surface manifestations of the basic
traits. These manifestations, denoted as characteristic adaptations, are jointly influenced by
the underlying traits and environmental conditions, and are thus more malleable. The

TRAITS, VALUES, AND WELL-BEING
4
neosocioanalytic theory (NST: Roberts & Nickel, 2017; Roberts & Wood, 2006), on the other
hand, sees traits, values, and affects as elements of personality at the same level of hierarchy,
all co-determined by genetic and environmental factors. From this perspective, there is no
differentiation between core and surface characteristics; there is no clear causal priority of
traits or other aspects of personality; and all characteristics can change in response to
environmental demands such as social roles.
Kandler and colleagues (2014) reviewed published studies on the longitudinal
stability, causal ordering, heritability, and genetic variance in basic traits, values, attitudes,
beliefs, self-schemata, and strivings. Overall, this review argued against a sharp distinction
between supposed core and surface characteristics. For example, some attitudes had similar
levels of stability as traits, and some of the causal links between traits and the other elements
appeared to be reciprocal rather than unidirectional. However, the empirical basis of this
review was rather limited. There were only a few studies that directly compared traits to other
personality elements in their longitudinal stability and direction of causation, and these
studies did not involve values but mostly sociopolitical attitudes. In the following sections,
we review several studies that are relevant, firstly, for the stability and causal priority of
personality traits and values, and secondly, for their effects on well-being and self-esteem,
before introducing the present study.
Personality Traits and Values
Values, representing abstract and enduring concepts about desirable end states and
behaviors, constitute an important aspect of the broader system of personality and feature
alongside traits both in the FFT and NST perspectives. Similarly to trait models (e.g.,
McCrae, R. R., Terracciano, A., & 78 Members of the Personality Profiles of Cultures
Project, 2005), there is evidence that the underlying structure of values is largely universal
(Fischer, 2018; Schwartz, 1992). Personality traits and values have systematic and

TRAITS, VALUES, AND WELL-BEING
5
meaningful relations, established in two meta-analyses: Openness is negatively related to the
higher order value dimension of Conservation and positively to the individual value of Self-
Direction; Agreeableness is positively related to the higher order Self-Transcendence and to
the individual value of Benevolence; Extraversion is negatively related to higher order
Conservation and positively to the individual value of Stimulation; Conscientiousness relates
positively to higher order Conservation and to the individual values of Conformity and
Security; Neuroticism, capturing variance in emotional and temperamental aspects, is much
less strongly related to any value (Fischer & Boer, 2015; Parks-Leduc et al., 2015).
In a further parallel to traits, values are also generally seen as stable constructs (Bardi
& Goodwin, 2011). Milfont, Milojev, and Sibley (2016) found three-year retest correlations
of value dimensions between .58 and .60. These correlations were lower than retest
correlations obtained for traits (e.g., over .70 in Terracciano, Costa, & McCrae, 2006, despite
the longer mean retest interval of 10 years); the difference could to an extent be due to
differences in the reliability of the measures. Dobewall and Aavik (2016) conducted, to our
knowledge, the only study so far to directly compare the longitudinal stability of traits and
values. These authors examined the three-year rank-order consistency of personality traits
and values in about fifty students and found no significant differences between the stability
estimates of traits and values in either self- or other-reports.
How do traits and values influence each other? Two possible mechanisms can be
distinguished in value theories (Schwartz, 1992). On the one hand, values motivate action
and function as guides for behavior. If a person finds order important, for example, he or she
is likely to pursue behaviors such as cleaning or order-preserving activities. A sustained,
value-guided shift in behaviors could over time lead to a corresponding shift in trait level. On
the other hand, values serve to justify behavior. A person who frequently engages in order-
preserving behaviors, for example, is likely to justify this by emphasizing the importance of

TRAITS, VALUES, AND WELL-BEING
6
order. The relative strength of these two functions can inform theory. While NST predicts no
systematic difference in the longitudinal effects of traits and values, FFT predicts stronger
effects of traits on values, which would imply that values serve more to justify than to guide
behavior. A few studies offer indirect indications on the potential causal ordering of
personality and values. Lüdtke, Trautwein, and Husemann (2009) found some small effects
(mostly in the range of .05 to .10) of personality traits on life goals in students across two
years, but almost no effects in the opposite direction. Differently from the conceptualization
of values as global and trans-situational life goals (Schwartz, 1992), the life goals examined
in this study were more concrete personal strivings including intrinsic (e.g., learning new
things and having committed relationships) and extrinsic (e.g., being famous and rich) goals.
In a behavior genetic study on an adult sample using two measurement points about six years
apart, Bleidorn et al. (2010) found that traits had higher heritability than the two broad life
goals of agency and communion, but the life goals also had some unique heritability variance
independent of traits. Furthermore, traits as well as agency and communion had significant
although small (around .10) mutual, genetically mediated effects, suggesting the interplay of
traits and life goals over time. Finally, Huuskes, Ciarrochi, and Heaven (2013) found small
(around .10) effects of religiosity values on Agreeableness and Psychoticism, but no effects
in the opposite direction, in high-school students assessed across two years.
Although the reviewed studies provided interesting insights, they have several
limitations. The only study that directly compared comprehensive models of traits and values
(Dobewall & Aavik, 2016) had a small sample size, reducing power to detect differences.
Observations have usually been drawn from only two measurement points, typically two to
three years apart, which may reduce the long-term generalizability of the effects. Finally,
with the exception of Dobewall and Aavik, the rest of the studies examined various concepts
related to values, but did not examine values directly and comprehensively. As a result, the

TRAITS, VALUES, AND WELL-BEING
7
empirical basis for broader generalizations on the stability and relative predictive power of
personality traits and values is rather limited. It is fair to conclude that there has been no
direct, comprehensive comparison of the long-term longitudinal stability of traits and values,
and no assessment of their relative causal ordering. This has been repeatedly recognized as a
major gap in the literature (Kandler et al., 2014; Roberts, Wood, & Caspi, 2008) and is
addressed in the present study.
Traits’ and Values’ Relations to Well-Being and Self-Esteem
An important way to distinguish the position of personality traits and values in the
broader personality system is by examining their predictive effects on other elements of that
system, such as well-being and self-esteem. Traits, values, well-being, and self-esteem are
interrelated components of personality that all exhibit some heritability, stability, and
predictive validity (Kandler et al., 2014). Both traits and values are usually seen as predictors
of well-being (Sortheix, & Schwartz, 2017; Steel et al., 2008). The different theoretical
perspectives assign different causal roles to these personality components. According to FFT,
the ultimate source for the covariation in personality components is found in the basic traits.
Traits are thus expected to contribute most strongly to the variability in well-being and self-
esteem. In NST, on the other hand, no assumption is made about causal priorities, so the
mutual effects between traits, values, well-being, and self-esteem can in principle be expected
to be similarly strong. Despite the theoretical relevance of comparisons of the predictive
power of traits and values, research on the effects of traits and the effects of values has
developed largely independent traditions, which we summarize in the following paragraphs.
Trait effects. The associations of personality traits with well-being have been
extensively documented. A meta-analysis indicated that 18% to 39% of variance in different
well-being aspects can be attributed to the traits of the Big Five model (Steel et al., 2008).
The reciprocal relations of traits and well-being have also been examined. Soto (2015), for

TRAITS, VALUES, AND WELL-BEING
8
example, described several potential mechanisms that could lead to trait–well-being links in
both directions. Traits could lead to a change in well-being both directly (e.g., extravert
people respond more strongly to positive events) and indirectly through behavior (e.g.,
extravert people engage in more social interaction, which generates opportunities for
inherently rewarding experiences). Well-being, in turn, can also affect personality traits
through affecting behavior patterns, for example, by freeing up resources for exploratory
behavior or by reinforcing behaviors that lead to increases in well-being. Soto assessed the
mutual longitudinal relations of traits and well-being in a representative sample in Australia
and found that the effects went in both directions, but the effects of traits on well-being were
stronger. Kandler, Kornadt, Hagemeyer, and Neyer (2015), on the other hand, found only
longitudinal effects of traits on well-being (not the other way around) in a study of older
individuals (64 to 89 years old). Kandler et al. attributed their finding to the use of a state-like
measure of well-being, as opposed to more trait-like measures used in other studies.
Self-esteem has been found to correlate with both personality traits and well-being
(Gebauer et al., 2015; Marsh, Trautwein, Lüdtke, Köller, & Baumert, 2006; Robins, Tracy, &
Trzesniewski, 2001). However, most reported associations are cross-sectional. While a fair
amount of evidence has been built up for self-esteem’s predictive power for life outcomes
(Orth & Robins, 2014), the mutual predictive links of personality traits and self-esteem have
received less attention.
Value effects. In contrast to traits, where both direct and indirect effects may be
operating, values’ associations with well-being may primarily be due to indirect effects,
where pursuing behaviors in line with one’s values promotes well-being.1 A distinction is
often drawn between “healthy,” growth values such as self-direction and benevolence, on the
1 Another type of indirect effect refers to person–environment fit, where values are associated with well-being when they are in line with normative values in a group (Sagiv & Schwartz, 2000). There is no established model for person–environment fit analyses in longitudinal data, so we do not consider person–environment fit in the present study.
TRAITS, VALUES, AND WELL-BEING
9
one hand, and “unhealthy,” deficiency values such as conformity and power, on the other
(Sagiv & Schwartz, 2000; Sortheix & Schwartz, 2017). The “healthy” values are expected to
correlate positively, and the “unhealthy” values negatively with well-being. While the
findings on the “healthy” values have been consistently in line with predictions, those on the
“unhealthy” values have been more varied. Sortheix and Schwartz (2017) found positive
correlations of Openness values and negative correlations of Conservation values with well-
being across 32 countries; however, these correlations were moderated by the country’s
egalitarianism, so that Conservation values had a positive association with well-being in more
egalitarian countries. Power was the only value consistently negatively correlated with well-
being (Sortheix & Schwartz, 2017). Finally, it is conceivable that, just as with traits, values’
links with well-being are bidirectional, and well-being may strengthen existing values. The
directionality of these effects has not been examined previously.
Values’ links with self-esteem have been less explored than those of traits. Lönnqvist
et al. (2009) found that self-esteem correlated positively with most values, especially self-
enhancement values (e.g., achievement and hedonism), but negatively with universalism and
tradition across five European countries. Feather (1991), on the other hand, found only
positive correlations of various values with self-esteem in Australian samples. As with well-
being, it is not known yet to what extent self-esteem affects values or is affected by them
across time.
Traits’ and values’ associations with well-being have usually been studied separately.
Haslam, Whelan, and Bastian’s (2009) cross-sectional study of a student sample in Australia
is one of the few exceptions. Traits in that study were generally more strongly correlated with
well-being, although six of the 10 studied values had correlations with positive affect in the
same range as those of Neuroticism, Conscientiousness, and Agreeableness (.20 to .40). No
TRAITS, VALUES, AND WELL-BEING
10
study to date has directly compared the longitudinal effects of traits and values on well-being
or self-esteem.2
Aspects of well-being, and self-esteem. Well-being research differentiates between
affective and cognitive aspects of well-being (Diener, 1984; Schimmack, Schupp, & Wagner,
2008). Affective well-being reflects the balance of positive and negative affects, and
cognitive well-being reflects cognitive evaluations of one’s life. Both personality and value
studies have independently demonstrated the distinct nature of affective and cognitive well-
being. For example, cultural factors moderate the effects of traits (Schimmack,
Radhakrishnan, Oishi, Dzokoto, & Ahadi, 2002) as well as values (Sortheix & Schwartz,
2017) on cognitive well-being more than those on affective well-being, suggesting that
affective well-being may have a stronger biological basis and be less susceptible to external
influences.
Where does self-esteem fit in the distinction between affective and cognitive aspects?
On the one hand, self-esteem is substantially correlated with Neuroticism, pointing to overlap
in affective content (e.g., Marsh et al., 2006). On the other hand, self-esteem shares an
element of cognitive evaluation with life satisfaction (Lucas, Diener, & Suh, 1996), evident
in some of the items used to measure the two constructs (e.g., “I am satisfied with my life”
from the Satisfaction With Life Scale [Diener, Emmons, Larsen, & Griffin, 1985] and “On
the whole, I am satisfied with myself” from Rosenberg’s [1965] Self-Esteem Scale). In a
meta-analysis, Judge, Erez, Bono, and Thoresen (2002) found that life satisfaction was more
strongly associated with self-esteem than with Neuroticism. In that meta-analysis, self-esteem
had a higher correlation with happiness (.51) than with life satisfaction (.35); yet, the same
pattern was found for the cognitive constructs of locus of control and self-efficacy. In
conclusion, self-esteem may include both affective and cognitive elements and is thus worth 2 Dobewall and Aavik (2016) examined the effects of profile consistency of traits and values across two time points on well-being, and found no systematic differences. Profile consistency represents an alternative approach to personality assessment, which is beyond the scope of the present study.

TRAITS, VALUES, AND WELL-BEING
11
examining in parallel to purer affective and cognitive measures of well-being. For the
purposes of the present study, the common element of the well-being aspects and self-esteem
is feeling well: in general (positive and negative affect), about one’s life (life satisfaction),
and about oneself (self-esteem). To simplify the presentation, we alternatively refer further to
well-being and self-esteem jointly as broad well-being.3
In summary, despite the accumulated evidence on the links of personality and values
with well-being and self-esteem, there are some important lacunae in this body of research.
First, there has been no direct comparison of the long-term effects of traits and values on
well-being and self-esteem. Second, the notion of mutual longitudinal effects between
personality and well-being (Soto, 2015) has not been extended to values or self-esteem.
Finally, no study to date has assessed the relative contribution of traits and values to the
affective and cognitive aspects of well-being. The present study aims to fill these gaps.
Study Overview
The present study aims to elucidate the relative position of personality traits and
values, as well as their links with well-being and self-esteem, within the broader system of
personality concepts. Using longitudinal data from five measurement points spanning eight
years in a nationally representative panel, we examine four questions that are fundamental to
understanding the constitution of personality but which have not been addressed as directly
and systematically in previous research.
Research Question 1: Are personality traits or values more stable across time?
FFT would predict higher stability of traits, and NST would predict no systematic
differences. The only, probably underpowered, study to compare the stability of traits and
values found no differences (Dobewall & Aavik, 2016), but the only other study to estimate
3 An alternative umbrella term is self-schemata (Kandler et al., 2014). We abstain from this term to avoid overlap with other aspects of the self-concept, such as independent/interdependent self-construal, which may be less directly related to well-being.

TRAITS, VALUES, AND WELL-BEING
12
value stability found somewhat lower estimates than typically found for traits (Milfont et al.,
2016). So, the relative stability of the two domains has remained an open question.
Research Question 2: Do traits have stronger predictive effects on values, or values
on traits?
FFT would predict stronger effects of traits and weaker or no effects of values,
whereas NST would predict no systematic differences. Findings from research on life goals
(Bleidorn et al., 2010; Lüdtke et al., 2009) suggest that stronger effects of traits can be
expected.
Research Question 3: Do traits or values have stronger effects on broad well-being?
In FFT, traits are the primary source of covariation of the different elements of the
personality system, so they can be expected to be a stronger predictor of well-being and self-
esteem than values; NST, by contrast, would predict no systematic differences. Both traits
and values correlate with broad well-being, and cross-sectional data suggest that traits may
play a stronger role (Haslam et al., 2009). Longitudinal effects have remained an open
question.
Research Question 4: Is there a pattern of differential relative predictive strength in
the bidirectional effects of traits-and-broad-well-being compared to values-and-broad-well-
being?
This question subsumes two subquestions:
Research Question 4a: In the bidirectional longitudinal effects of traits and broad
well-being, in which direction are the effects stronger?
Research Question 4b: In the bidirectional longitudinal effects of values and broad
well-being, in which direction are the effects stronger?
The presence of any bidirectional effects involving traits would be more supportive of
NST than of FFT. However, the relative strength of the effects is also informative. If the

TRAITS, VALUES, AND WELL-BEING
13
effects of traits on broad well-being are stronger than the other way around (as suggested by
Kandler et al., 2015, and Soto, 2015), and if this difference is larger than the corresponding
difference in values’ effects, this would be more in line with FFT than with NST, because
NST suggests no systematic differences.
We examine Questions 3 and 4 with respect to positive and negative affects, life
satisfaction, and self-esteem, which allows us to distinguish any differential patterns for
affective and cognitive aspects of well-being.
Method
According to Victoria University of Wellington’s human ethics policy, research
involving publicly available data, as in the present study, does not require ethical approval.
Sample and Procedure
We used data from the Longitudinal Internet Studies for the Social Sciences (LISS)
panel administered by CentERdata at Tilburg University, the Netherlands. The LISS panel is
a representative sample of Dutch individuals who participate in monthly internet surveys. The
panel is based on a true probability sample of households drawn from the population register
by Statistics Netherlands. Households that could not otherwise participate are provided with a
computer and internet connection. A longitudinal survey is fielded in the panel every year,
covering many domains.4
4 Different studies have used data from the LISS panel that partially overlap with the present data. We are aware of the following publications: (1) He and Van de Vijver (2015) examined the links between the general factors of personality and values, on the one hand, and response styles, on the other hand; (2) Hounkpatin, Boyce, Dunn, and Wood (in press) compared different statistical models to examine the longitudinal associations of personality and life satisfaction; (3) Schwaba and Bleidorn (in press a) examined individual differences in personality change in 14 age groups; (4) Schwaba and Bleidorn (in press b) assessed development in personality traits in the five years before and after retirement; (5) Schwaba, Luhmann, Denissen, Chung, and Bleidorn (in press) analyzed the life-span development of Openness to Experience and its associations with cultural activities. The present study has some overlap in content with Hounkpatin et al.’s study. Hounkpatin et al.’s analysis of the links of personality and life satisfaction (especially the bivariate autoregressive model, Figure 3) is similar to the analysis of personality and life satisfaction in the present study (Figure 4). However, there are substantial differences between the two studies. First, the present study has a stronger focus on substantive questions, as compared to Hounkpatin et al.’s stronger focus on methodological questions. Second, the present study addresses a substantively different and broader question: the conceptual and empirical interrelations of personality traits, values, and broad well-being. As a consequence, our analysis of personality traits and life satisfaction is part of an extensive set of analyses that include traits, values, and four aspects of broad well-

TRAITS, VALUES, AND WELL-BEING
14
We used eight waves of data collected from 2008 to 2015. Measures of the same
constructs including personality traits, values, affects, life satisfaction, and self-esteem were
administered in May of each year. Each year, over 8,000 selected household members were
invited to participate. The number of respondents ranged from 5,159 (in 2013) to 6,784
(2008), and the response rates ranged from 70% (in 2009) to 91% (in 2013). In 2010, 2012,
and 2015, the complete questionnaire was only administered to non-respondents of the
previous year. We hence used data from 2008 as T1; combined data from 2009 and 2010 as
T2; 2011 and 2012 as T3; 2013 as T4; and 2014 and 2015 as T5. The demographics of
respondents in the consolidated five time points are presented in the upper panel of Table 1.
Respondents who participated at all five time points (n = 3,912) did not differ in
gender distribution from those who took part at fewer time points, χ²(1, N = 11,890) = 0.29,
ns. Those who participated at all time points were slightly older (M = 50.54 years, SD =
17.94) than the partial participants (M = 49.70, SD = 18.00), F(1, 11,888) = 5.72, p < .05, η2
= .00. The education level also differed slightly (LR[4, N = 11,890] = 12.33, p < .05), but not
in a linear fashion; both the “no completed education” (0.1%, standardized residual = –2) and
the “university level of education” category (14.3%, standardized residual = –1.57) were
somewhat underrepresented in the group of all-wave participants compared with the partial
participants (where the two categories had 0.4% and 15.8%, with standardized residuals of
1.40 and 1.10, respectively). To handle the missing data across waves, we used full-
information maximum likelihood in our model estimation (Schafer & Graham, 2002), which
gave us a total sample size of 11,890.
Measures
being: positive affect, negative affect, life satisfaction, and self-esteem. Finally, the present study uses a different statistical model to estimate cross-lagged effects, the random-intercepts cross-lagged panel model, described in detail in the Analysis Outline subsection.

TRAITS, VALUES, AND WELL-BEING
15
All instruments were administered in Dutch. We used two parcels for each construct.
The Spearman-Brown (split-half) reliability indices per time point are presented in the lower
panel of Table 1.
Personality traits. The Big Five model was assessed using 50 items of the
International Personality Item Pool (IPIP), where each of the five domains is measured by 10
items (Goldberg et al., 2006). The response scale ranged from 1 (very inaccurate) to 5 (very
accurate). Positively and negatively worded items were assigned to separate parcels per trait.
Values. A rating-format version of the Rokeach Value Survey (RVS), including 18
instrumental values (referring to preferred modes of behavior) and 18 terminal values
(referring to desirable end-states of existence; Rokeach, 1973) was administered. The
response scale ranged from 1 (extremely unimportant) to 7 (extremely important). Schwartz
and Bilsky (1990) identified a quasi-universal structure of RVS items in seven countries, and
we used this structure as a guide for value assignment (similarly to Kasser, Koestner, &
Lekes, 2002). Specifically, we assigned the individual items (e.g., helpful) to values (e.g.,
Prosocial) based on their location in the majority of countries in Schwartz and Bilsky (1990),
with ties decided based on the theoretical expectations in that study. We assigned the items
(listed in Table S1) to seven values (with number of items and one example): Prosocial (8,
helpful), Restrictive Conformity (4, self-controlled), Enjoyment (4, pleasure), Self-Direction
(6, creative), Maturity (5, mature love), Security (4, national security), and Achievement (5, a
sense of accomplishment). The advantage of this a priori assignment is that it allows a
formally direct comparison of our results with other studies that use a structure derived from
Schwartz and Bilsky’s (1990) structure. The disadvantage is that the empirical applicability
of this imposed structure to the data is only partial.5 Items were assigned to parcels quasi-
5 We also conducted all analyses reported in the present study with an alternative value structure, derived empirically from factor analysis (cf. Feather, 1991). This empirical structure differed from the a priori structure in that there was no Achievement value, there was a Stimulation rather than an Enjoyment value, and the content of the other values overlapped only partially between the two structures. The cross-model correlations
TRAITS, VALUES, AND WELL-BEING
16
randomly (based on odd and even numbers) except for the Prosocial value, where items
loading on different empirical factors (see Footnote 5) were distributed equally between the
two parcels. In line with Schwartz and Bilsky (1990) and Kasser et al. (2002), we used raw
rather than ipsatized item scores.
Well-being and self-esteem. We examined positive and negative affects as indicators
of affective well-being, life satisfaction as an indicator of cognitive well-being, and self-
esteem. Positive and negative affects were measured with the 20-item Positive and Negative
Affect Scale (PANAS, Watson, Clark, & Tellegen, 1988). Items were introduced with the
question, “Indicate to what extent you feel, right now, that is, at the present moment…”, and
response options ranged from 1 (not at all) to 7 (extremely). The item “excited” had
ambiguous loadings on both the positive and the negative affect dimensions, possibly owing
to cultural specificities of the translated term, and was excluded from the analyses. Life
satisfaction was measured with the 5-item Satisfaction With Life Scale (SWLS, Diener et al.,
1985), with response options from 1 (totally disagree) to 7 (totally agree). Self-esteem was
assessed with the 10-item Rosenberg Self-Esteem Scale (RSE, Rosenberg, 1965), with
response options from 1 (totally disagree) to 7 (totally agree). The odd- and even-numbered
items of the PANAS and the SWLS, and the positively and negatively worded items of the
RSE were assigned to separate parcels, respectively.
Analysis Outline
To assess the longitudinal stability of traits and values, we used the univariate trait-
state-error model (Kenny & Zautra, 1995). To assess cross-lagged effects, we used an
adaptation of the multivariate trait-state-error model and the random-intercepts cross-lagged
between the corresponding values ranged from .66 (Enjoyment and Stimulation) to .96 (Restrictive Conformity), with a mean of .86. There was one main instance where the results with the empirically derived value structure were more intuitive than those with the a priori assignment: See Footnote 7. The results from this parallel set of analyses with respect to the research questions (trait and value stability, mutual predictive effects, and predictive effects for well-being and self-esteem) were essentially the same, and the conclusions were identical.

TRAITS, VALUES, AND WELL-BEING
17
panel model (RI-CLPM; Hamaker, Kuiper, & Grasman, 2015). Specifically, our cross-lagged
models had the basic structure of the RI-CLPM; in addition, each construct at each time point
had a measurement part (i.e., a latent factor measured with two parcels). This approach is
more appropriate than the conventional cross-lagged panel model (CLPM) in two ways. First,
the measurement part of the model accounts for the measurement errors of the constructs,
reducing the possibility that results may be affected by the reliability of the measures.
Second, the autoregressions in CLPM, meant to express the stability of the same construct
over time, may be inadequate if the construct has a trait-like, time-invariant stability, where
every person varies over time around the same group means. This can lead to erroneous
conclusions on the presence, direction, and significance of causal effects (Hamaker et al.,
2015). The random intercepts in RI-CLPMs account for the trait-like, time-invariant stability
through the inclusion of a global factor extracted from the same construct across time points
and with all loadings constrained to one. Between-person variance in RI-CLPMs is partialled
out in the random intercepts, and subsequently the lagged relationships target only within-
person dynamics. Personality traits, values, well-being, and self-esteem are all assumed to be
trait-like underlying constructs with stable individual differences, where the stability within
each domain should be accounted for. In sum, modeling the measurement part of each
construct and the random intercepts affords a more accurate assessment of the longitudinal
associations between the trait-like constructs of the present study. In order to avoid
multicollinearity problems, and because our focus was on the cross-lagged effects rather than
partitioning variance to traits versus states, we did not correlate the time-invariant factors of
traits, values, and broad well-being, but we allowed correlations between the error terms of
their respective time-specific latent factors.
The model types that we estimated are depicted in Figures 1 to 4. The model in Figure
1 provides factor loadings, denoted as coefficients a, of each time-specific latent factor on the

TRAITS, VALUES, AND WELL-BEING
18
time-invariant latent factor. We refer to these loadings as stability coefficients: Squaring
these coefficients gives the amount of variance in the time-specific latent factor attributable
to the time-invariant latent factor (e.g., Prenoveau, 2016). The stability coefficients thus
represent the long-term stability of personality traits and values (Research Question 1). The
model in Figure 2 estimates the mutual effects (cross-lagged effects, coefficients b and c) of
personality traits and values (Research Question 2). The model in Figure 3 estimates the
relative effects (cross-lagged effects, coefficients d and f) of traits and values on well-being
and self-esteem (Research Question 3). Although the model in Figure 3 also provides
estimates of the relative mutual effects of traits-and-well-being as well as values-and-well-
being, we chose to estimate these effects in separate models for traits and for values (Figure
4, coefficients g and h; Research Question 4). There were three reasons for this choice. First,
mutual longitudinal effects with well-being have so far only been studied for personality
traits (Kandler et al., 2015; Soto, 2015), so it is informative to examine similar effects for
values separately, as a baseline for comparisons. Second, in separate models, the effects of
traits are not conditional on those of values (and vice versa), so these separate models
represent the most frequent condition in which effects on well-being are studied; at the same
time, the parallel study of conditional and unconditional effects allows the identification of
suppression effects. Third, the separate models allow us to assess the mean effects across
both matched and non-matched traits and values (matching is described in the Baseline
Correlations subsection of the Results).
In the analyses of bivariate and trivariate models, each model was estimated
separately for matched pairs of traits and values (except for the separate trait and value
models of Figure 4), and for each of the four broad well-being aspects, where applicable. For
example, the model in Figure 2 encompasses separate models for each of the four trait–value
TRAITS, VALUES, AND WELL-BEING
19
pairs described in the Baseline Correlations subsection of the Results section and each of the
four broad well-being aspects.
We estimated all models in AMOS (Arbuckle, 2014) and evaluated model fit using
the comparative fit index (CFI, with values above .90 taken as acceptable and above .95 as
good) and root mean square error of approximation (RMSEA, with guideline values of .08
and .06, respectively; Bentler, 1990; Browne & Cudeck, 1993). We present the results on the
research questions by listing the means and standard deviations of the effects across the five
time points. For example, to assess the effect of a trait on a value in the model of Figure 2, we
present the mean and standard deviation of the four cross-lagged effects linking the five time
points. The advantage of assessing effects in this way, rather than using only two points or
setting equality constraints across lags, is the enhanced generalizability, along with estimates
of variability, of the effects derived from multiple time points.
Given the large number of models and estimates, we present summarized information
in the main body of the text and tables. In an online supplement, we present the assignment of
items to values (Table S1); the means and standard deviations of all parcels (Table S2); and
the complete fit (Table S3) and parameter statistics (Tables S4 to S8) for all models.
Results
Personality Traits and Values
Stability. The univariate stability models of the five traits and seven values all had
CFIs of 1 and RMSEAs of .04 or lower, supporting the fit of the models (see Table S3 for
details).
The standardized stability estimates averaged across the five time points (Figure 1’s
coefficients a) are presented in the left panel of Table 2 (for the individual estimates at each
time point, see Table S4). The stability coefficients were consistently higher for traits (M =
.86, SD = .03) than for values (M = .72, SD = .01). When converted into variance explained,

TRAITS, VALUES, AND WELL-BEING
20
these coefficients indicate that, on average, 74% (.862) of the variance in the time-specific
latent factors of traits was attributable to the time-invariant factors, whereas the
corresponding variance in values was 52% (.722). In response to Research Question 1, traits
displayed higher long-term stability than values.
Baseline correlations. To match personality traits and values, we analyzed their
correlations at T1.6 Agreeableness correlated with Prosocial at .38 (p < .001) and with the
other values between .08 and .29 (M = .18). Conscientiousness correlated with Restrictive
Conformity at .39 (p < .001) and with the other values between .13 and .26 (M = .19).
Extraversion correlated with Enjoyment at .22 (p < .001) and with the other values between
.03 and .19 (M = .13). Openness correlated with Self-Direction at .27 (p < .001) and with the
other values between –.09 and .14 (mean of absolute values = .06). Neuroticism’s
correlations with values ranged from –.01 to –.10, with a mean of –.05. These correlations
were in line with the previous literature on personality and values (Fischer & Boer, 2015;
Parks-Leduc et al., 2015). We hence matched Agreeableness with Prosocial,
Conscientiousness with Restrictive Conformity, Extraversion with Enjoyment, and Openness
with Self-Direction for direct comparisons. Neuroticism and the values of Maturity, Security,
and Achievement were not part of matched pairs, but were examined separately in the
univariate stability models (Figure 1) and the bidirectional models with well-being and self-
esteem (Figure 4).
Bidirectional effects. The four cross-lagged models of matched traits and values
(Figure 2) had CFIs of .97 or higher and RMSEAs of .05 or lower, supporting the fit of the
models (see Table S3 for details).
The mean cross-lagged effects of traits and values (Figure 2’s coefficients b and c) are
presented in the right panel of Table 2 (for the individual cross-lags, see Table S5). There
6 The obtained patterns were consistent across time points.

TRAITS, VALUES, AND WELL-BEING
21
were significant and sizable effects in both directions. The differences in cross-lagged effects
between traits and values were more pronounced than the differences in stability. The mean
effects of traits on values were nearly thrice as large as those of values on traits. To formally
assess the effect size difference, we used a Wilcoxon test, entering the estimates of all four
trait–value pairs for all four cross-lags. The value of the Wilcoxon test was –3.52, p < .001.
In response to Research Question 2, traits had stronger predictive effects on values than
values on traits.
Traits, Values, Well-Being, and Self-Esteem
Effects of trait–value pairs on broad well-being. There were 16 models estimating
the relative effects of traits and values on broad well-being (four individual trait–value pairs
by four broad well-being aspects). With the exception of the model for Openness, Self-
Direction, and self-esteem (CFI = .91), CFIs were at .96 and higher; RMSEAs were .04 or
lower (see Table S3 for details). These indices supported the model fit.
The mean cross-lagged effects of the matched trait–value pairs on the four broad well-
being aspects (Figure 3’s coefficients d and f) are presented in Table 3 (for the individual
cross-lags, see Table S6). Both traits and values had significant effects on broad well-being,
but the effects were most consistent for traits. The Prosocial and Self-Direction values had
stronger effects on positive affect than the corresponding traits of Agreeableness and
Openness. In all other comparisons, traits had stronger mean effects than values. Somewhat
counterintuitively, the Prosocial and Conformity values had a positive effect on both positive
and negative affect.7 The distinction of broad well-being aspects showed a complex pattern.
Traits had sizable effects on all four aspects of broad well-being, whereas values had most
noted effects on positive affect. We compared the size of the effects of traits and values using
separate Wilcoxon tests per broad well-being aspect, entering the estimates of all four trait– 7 In this instance, the empirically derived Prosocial value (also defined by 8 items, four of which overlapped with the Schwartz & Bilsky [1990] assignment; see Footnote 5) had a more intuitive pattern, with mean effects of .08 on positive affect, –.02 on negative affect, and .02 on both life satisfaction and self-esteem.

TRAITS, VALUES, AND WELL-BEING
22
value pairs for all four cross-lags. The tests (displayed at the bottom of Table 3) were
significant at .01 or lower for negative affect, life satisfaction, and self-esteem. In response to
Research Question 3, on average traits and values had similar effects on positive affect, but
traits had stronger effects on the other aspects of well-being and on self-esteem.
Traits’ and values’ bidirectional effects with broad well-being. For traits, there
were 20 models on the bidirectional effects with well-being (five traits by four broad well-
being aspects). For values, there were 28 models (seven values by four broad well-being
aspects). The model for Neuroticism and self-esteem was statistically nonadmissible due to
negative covariances among error components, even after fixing all variances of the error
components of the two parcels of each time-specific latent factor to be identical, so we report
results from a model using observed scores instead (CFI = .97, RMSEA = .08). (For the
model specification, see Figure S1. Neuroticism had Cronbach’s alpha across the five time
points from .87 to .89, and self-esteem, from .89 to .90. Disregarding this model would not
affect the overall conclusions.) The models for the other four traits had CFIs of .98 or higher
and RMSEAs of .04 or lower. The models for values had CFIs of .98 or higher and RMSEAs
of .03 or lower. (See Table S3 for details.) These indices supported model fit for both groups
of models.
The mean bidirectional effects of personality traits and broad well-being are presented
in Table 4, and those of values and broad well-being, in Table 5; both correspond to Figure
4’s coefficients g and h, with either traits or values represented by coefficients g. (For the
individual cross-lags of traits and broad well-being, see Table S7; for values and broad well-
being, see Table S8.) For traits, it was consistently the case that the mean trait → broad well-
being effects were stronger than the corresponding broad well-being → trait effects, with the
exception of Openness, which had more balanced mutual links with positive affect, life
satisfaction, and self-esteem. We computed Wilcoxon tests per broad well-being aspect,

TRAITS, VALUES, AND WELL-BEING
23
entering the estimates for all five traits across all four cross-lags. The Wilcoxon tests (bottom
of Table 4) were significant at .01 or lower for all broad well-being aspects. The differences
between the absolute values of the trait → broad well-being effects and the broad well-being
→ trait effects were positive (Difference row of Table 4), indicating that overall, personality
traits had a stronger effect on broad well-being than the other way around (Research Question
4a).
The general pattern for values was the opposite of that for traits. That is, the mean
value → broad well-being effects tended to be smaller than the corresponding broad well-
being → values effects. The Prosocial and Conformity values now had a coherent pattern of
positive links with broad well-being, indicating that their links with negative aspects in the
trivariate analysis with traits may be due to suppression effects. Achievement, on the other
hand, had a positive effect on both positive and negative affects. The Wilcoxon tests,
computed per broad well-being aspect for all seven values across the four cross-lags (bottom
of Table 5), were significant at .01 or lower for negative affect, life satisfaction, and self-
esteem. For these three aspects of broad well-being, the differences between the absolute
values of value → broad well-being effects and broad well-being → value effects were
negative (Difference row of Table 5). In sum, with the exception of positive affect, where the
effects were balanced, values changed in response to broad well-being more than the other
way around (Research Question 4b).
It is interesting to note that the differences were larger for the combination of traits
and affective well-being, and for the combination of values and cognitive well-being and
self-esteem (cf. Difference rows of Tables 4 and 5). Thus, traits predicted affective well-
being more strongly than they were predicted by it, and values were predicted by cognitive
well-being and self-esteem more strongly than these broad well-being aspects were predicted
by values. In summary, in response to Research Question 4, personality traits predicted broad
TRAITS, VALUES, AND WELL-BEING
24
well-being more strongly than they were predicted by it, whereas the opposite was generally
true for values.
Discussion
We examined the interrelations of personality traits, values, well-being, and self-
esteem in a nationally representative panel assessed at five time points spanning eight years.
Both traits and values had considerable stability, but traits were more stable longitudinally
than values (Research Question 1). Traits and values affected each other over time, but the
effects of traits on values were stronger (Research Question 2). Both traits and values
predicted well-being and self-esteem; while their mean effects on positive affect were similar,
traits had stronger effects than values on negative affect, life satisfaction, and self-esteem
(Research Question 3). The longitudinal links of traits, as well as those of values, with broad
well-being were bidirectional. However, the balance of strength was the opposite for traits
and values: Traits predicted broad well-being more strongly than they were predicted by it,
whereas broad well-being generally predicted values more strongly than values predicted it
(Research Question 4).
The overall results are more in line with FFT (McCrae & Costa, 2008) than with NST
(Roberts et al., 2008): Traits were more stable than values and were, on average, consistently
the strongest predictor of the various other elements of the personality system. However, the
results would not support a strong version of either FFT (which does not allow for external
effects on traits) or NST (which sees traits, values, well-being, and self-esteem as equally
basic elements of personality). Our findings are in line with studies that called for the
integration of the two perspectives (Bleidorn et al., 2010; Fischer, 2018; Kandler et al.,
2014). In integrative models, traits, values, beliefs, narratives, well-being, and other
personality-relevant concepts are related across time and form elements of a complex system

TRAITS, VALUES, AND WELL-BEING
25
(e.g., McAdams & Pals, 2006). Our findings suggest that traits are a primary driving force,
but they are embedded in networks that allow for ongoing mutual effects.
Our results cast light on the nature of the relations between personality and values.
The two domains have historically developed separately, yet the evidence for their links has
been mounting (Fischer & Boer, 2015; Parks-Leduc et al., 2015) and there have been
proposals for their integration into higher order overarching domains (e.g., Strus & Cieciuch,
2017). The nature and direction of these links, however, have so far been open to conjectures.
The present findings argue for an unequivocal position on this debate. Although traits and
values influence each other and may share common motivational bases such as approach and
cooperation (Fischer & Boer, 2015) or stability and plasticity (Strus & Cieciuch, 2017), traits
clearly have the leading role in this relationship. The consistent patterns of individuals’
thoughts, feelings, and behaviors (captured in the Big Five traits) shape what individuals find
important in life (their values) much more than values shape their traits.
Mechanisms
How can we interpret the observed differences in predictive power of traits and
values? To start with some methodological explanations, firstly, the similar reliability levels
in our study, combined with our latent modeling approach, rule out an artifact of
measurement accuracy. A second possibility is that the instruments differed in their coverage
of the respective domains (as reflected by their different length), leaving less room for values
to unfold their predictive potential. Three points argue against this interpretation: (a) the 36-
item RVS has a similar length as the 40-item Portrait Value Questionnaire which provides a
comprehensive measure of values (Schwartz et al., 2001); (b) the 8-item Prosocial value scale
is of similar length as the 10-item IPIP trait scales, yet did not exhibit similar predictive
power; (c) in the bidirectional models of values and life satisfaction, life satisfaction was the
stronger predictor despite being measured on a short, 5-item scale. A related interpretation for
TRAITS, VALUES, AND WELL-BEING
26
the stronger effects of traits than values on broad well-being is that trait measures may
include more affect-related content than value measures. However, the measures of different
traits vary in their affective, behavioral, and cognitive content. Conscientiousness measures,
for example, have a minimal coverage of affective content (on average about 6% according to
Pytlik Zillig et al., 2002), yet Conscientiousness was one of the strongest predictors of broad
well-being in the present study. As a final methodological explanation, the different effects of
traits and values could be attributable to ceiling effects in values and a reduced variance of
value measures. However, the standard deviations of values were similar and actually slightly
larger than those of traits relative to scale range (Table S2), so variance effects seem unlikely.
For an interpretation combining methodological and substantive elements, it is
interesting to consider the role of temporal stability for predictive power. More stable
variables can be expected in principle to be stronger longitudinal predictors. Our findings on
the relations of traits and values are clearly in line with this principle. However, the findings
on values and broad well-being did not follow such a simple pattern. The mean long-term
stability coefficients of affects and life satisfaction (.68) were slightly lower, and those of
self-esteem (.74) slightly higher than those of values (.72; see Table S9 for broad well-being
and Table 2 for values). Yet, broad well-being tended to predict values longitudinally even
when a well-being aspect had lower long-term stability than a value, as, for example, in the
case of life satisfaction (with a mean stability coefficient of .68) and the values of Restrictive
Conformity (mean stability coefficient of .79) and Maturity (mean stability coefficient of .73)
(see Table 5 for the corresponding cross-lagged effects). Thus, although the long-term
stability of concepts may make them more likely to be stronger predictors, other factors are
clearly involved.
Turning to more substantive interpretations, the differences in the predictive power of
traits and values could be due to cognitive accessibility. People may be less aware of their

TRAITS, VALUES, AND WELL-BEING
27
values than of their behavior patterns, and may infer their values from their traits. The
endorsement of this interpretation depends on the conceptualization of traits. While some
theorists equate traits with behavior patterns (Pervin, 1994), in FFT traits are the abstract,
hypothetical underlying causes of these behavior patterns (McCrae & Costa, 2008). The
underlying traits are only inferred from the observed behaviors, and are thus similarly
inaccessible as values. An alternative interpretation involves the different functions of values
as guides versus justifications for behavior (Schwartz, 1992). The finding that values are
predicted by traits suggests that, although values may indeed fulfill both functions, the
justifying function is stronger than the guiding function.
As evident from the preceding discussion, our data cannot unequivocally support a
single mechanism. Furthermore, longitudinal predictive links cannot uniquely identify
causation. Third variables may be involved, such as common genetic factors. It is worthwhile
to consider some different types of causation analyses. McCrae and Sutin (in press)
distinguished between explanatory causes that identify the mechanisms by which two
phenomena are linked, and practical causes that allow the prediction of a phenomenon.
Longitudinal models are limited in their ability to identify explanatory causes, but are useful
for practical prediction within the confines of the examined variables. Despite advances in
research on volitional personality change (e.g., Hudson & Fraley, 2015), the experimental
manipulation of traits is difficult at best, or impossible in the FFT framework (McCrae &
Sutin, in press). As recognized in research on self-esteem, depression, and anxiety, the limits
of the experimental approach underscore the usefulness of longitudinal data for testing the
direction of mutual effects between variables (Sowislo & Orth, 2013).
Well-Being and Self-Esteem as Elements of Personality
The results on well-being and self-esteem were in line with conceptualizations of
broad well-being as an integral part of personality, displaying trait-like features and mutual
TRAITS, VALUES, AND WELL-BEING
28
relations with the other personality elements (Roberts et al., 2008; Soto, 2015). The effects of
traits on well-being were fairly consistent across traits and across affective and cognitive
well-being and self-esteem (Tables 3 and 4). Well-being research has usually focused on
Extraversion and Neuroticism and found smaller associations for Agreeableness and
Conscientiousness, and the smallest for Openness (Soto, 2015; Steel et al., 2009). Our
findings show that all five traits contribute to broad well-being across time. The significant
effects in both directions are in line with Soto’s (2015) findings and differ from Kandler et
al.’s (2015) findings, where only traits predicted well-being. Although Kandler et al.
attributed the lack of effects of well-being to their state-like operationalization of well-being,
this does not seem to be the critical factor as the measures of positive and negative affects in
the present study were even more state-focused. Furthermore, Soto’s (2015) study contained
an unexpected finding that well-being tended to lead to decreases in Extraversion. This was
not replicated in our data, where the mutual effects of traits and well-being maintained the
same sign. In sum, it appears that well-being’s effects on traits are less consistent across
measures and populations than traits’ effects on well-being.
Values’ links with well-being and self-esteem varied more depending on the specific
value and specific aspect of broad well-being (Tables 3 and 5), in line with the notion that
values have a complex relationship with well-being in interaction with contextual factors
(Sortheix & Schwartz, 2017). The findings included a few counterintuitive effects in the same
direction for both positive and negative affects. In the case of Restrictive Conformity, it
appeared that its predictive effects on negative well-being are especially manifested when the
common variance with Conscientiousness is taken into account. In the case of Achievement,
the links in the same direction with positive and negative affects could have to do with the
combination of more intrinsic (a sense of accomplishment) and more extrinsic (social
recognition) elements, which have opposite associations with well-being (Ryan & Deci,

TRAITS, VALUES, AND WELL-BEING
29
2000). Further research with alternative value operationalizations would help to disentangle
the effects of these value elements. The main conclusion of interest to the present study is
that, overall, values had less pronounced effects than traits on broad well-being.
Areas of distinction between affective and cognitive well-being. Our study furthers
the understanding of broad well-being by highlighting the differential relations of its affective
and cognitive aspects, as well as of self-esteem, with traits and values. Traits’ effects did not
vary systematically between affective and cognitive well-being, underscoring the overall
consistent predictive role of traits. Values’ effects, on the other hand, were concentrated in
affective well-being, in line with the value studies that compared affective and cognitive
well-being (Sagiv & Schwarz, 2000; Sortheix & Schwartz, 2017).
The most systematic distinction of affective versus cognitive well-being (and self-
esteem, whose pattern here was closer to cognitive than to affective well-being) was observed
in traits’ and values’ bidirectional links with broad well-being (see Difference rows of Tables
4 and 5). The patterns for traits and values mirrored each other: The net balance of traits’ and
affective well-being’s reciprocal effects was larger and positive, whereas the net balance of
values’ and cognitive well-being’s (as well as self-esteem’s) effects was larger and negative,
with the other combinations being closer to neutral. This result raises some interesting
implications. First, in the domain of traits, the relative contribution of traits to well-being
over time may be stronger for affective well-being (although a similar pattern was not as
clearly evident in Soto, 2015). Second, in the domain of values, the overall relation is in the
direction of values changing in response to well-being, and this effect can be located
primarily in cognitive well-being and self-esteem. This is in line with the conceptualization
of values as cognitive constructs that facilitate adjustment to environmental demands
(Schwartz, 1992). This finding suggests that, rather than concluding that there are limited
associations between values and cognitive well-being (Sagiv & Schwartz, 2000), it would be

TRAITS, VALUES, AND WELL-BEING
30
productive to examine effects in the opposite direction, from broad well-being to values.
Finally, it is interesting to speculate about the long-term associations of all three domains
(traits, values, and broad well-being). While traits appear to be a primary driver for changes
in the other personality elements, it is conceivable that values, theorized to serve societally
adaptive functions (Schwartz & Bardi, 2001), drive behavior changes in response to external
demands, partly channeled through cognitive appraisals of well-being; these changes may in
turn lead to shifts in trait levels, setting in motion feedback loops between the personality
elements. It would be interesting for future research to examine such more complex models
especially in response to important life events and role transitions (e.g., Anusic &
Schimmack, 2016; Bardi, Lee, Hofmann-Towfigh, & Soutar, 2009).
In conclusion, the distinction between affective and cognitive aspects of well-being
can be substantiated on different levels, but one systematic pattern seems to be that over time,
traits influence affective well-being more than they are influenced by it, whereas values are
influenced by cognitive well-being and self-esteem more than they influence these aspects of
well-being. This is an intriguing result highlighting the distinct links of the various
components of personality, values, and broad well-being. Although the finding was obtained
in a large, nationally representative sample across five time points and various measures of
broad well-being, the novelty of the result implies that it will be important for future research
to replicate and extend the observed patterns.
Limitations and Future Research
Rokeach’s (1973) operationalization of values is widely established and formed the
basis for the currently dominant operationalization in Schwartz’s (1992) model. Still, more
recent measures based directly on Schwartz’s model have become more prevalent in recent
years and have often been used in research on personality and values (Fischer & Boer, 2015;
TRAITS, VALUES, AND WELL-BEING
31
Parks-Leduc et al., 2015). It would be informative to examine to what extent the patterns
found in our study replicate when using direct measures of Schwartz’s model.
Our study is based on a sample, albeit large and representative, from a single culture.
To generalize broadly on the interrelations of traits, values, and broad well-being, cross-
cultural research is needed. The relations between personality and values, as well as their
effects on well-being, are known to be moderated by culture-level factors such as contextual
threat, individualism, and egalitarianism (Fischer & Boer, 2015; Schimmack et al., 2002;
Sortheix & Schwartz, 2017). The importance of extending the longitudinal study of these
elements to cross-cultural comparisons cannot be overstated.
The impact of life events is another area that has been gaining attention in recent
research on both personality traits and values (Anusic & Schimmack, 2016; Bardi, 2009). A
comparison between the two domains in their flexibility in reacting to life events would
further clarify their respective roles in the broader personality system. Finally, it would be
interesting to examine to what extent the observed patterns hold across different age groups.
Conclusion
Using an eight-year longitudinal, nationally representative sample, we found that
personality traits were more stable than values; predicted values more strongly than they were
predicted by them; offered a generally stronger prediction than values of broad well-being;
and influenced broad well-being more than they were influenced by it, whereas the opposite
was true for values. Across the board, these results support theories, such as FFT, that place
traits centrally in the broader personality system. At the same time, the links between traits,
values, and broad well-being were bidirectional in line with theories, such as NST, that view
traits and other personality elements as adaptable and mutually constitutive. The balance of
results calls for new theoretical approaches that accommodate both the central position of
traits and their reciprocal links with other elements of personality.

TRAITS, VALUES, AND WELL-BEING
32
References
Anusic, I., & Schimmack, U. (2016). Stability and change of personality traits, self-esteem,
and well-being: Introducing the meta-analytic stability and change model of retest
correlations. Journal of Personality and Social Psychology, 110, 766–781.
doi:10.1037/pspp0000066
Arbuckle, J. L. (2014). Amos (Version 23.0) [Computer Program]. Chicago, IL: IBM SPSS.
Bardi, A., & Goodwin, R. (2011). The dual route to value change: Individual processes and
cultural moderators. Journal of Cross-Cultural Psychology, 42, 271–287.
doi:10.1177/0022022110396916
Bardi, A., Lee, J. A., Hofmann-Towfigh, N., & Soutar, G. (2009). The structure of
intraindividual value change. Journal of Personality and Social Psychology, 97, 913–
929. doi:10.1037/a0016617
Bentler, P. M. (1990). Comparative fit indexes in structural models. Psychological Bulletin,
107, 238–246. doi:10.1037/0033-2909.107.2.238
Bleidorn, W., Kandler, C., Hülsheger, U. R., Riemann, R., Angleitner, A., & Spinath, F. M.
(2010). Nature and nurture of the interplay between personality traits and major life
goals. Journal of Personality and Social Psychology, 99, 366–379.
doi:10.1037/a0019982
Browne, M. W., & Cudeck, R. (1993). Alternative ways of assessing model fit. In K. A.
Bollen, & J. S. Long (Eds.), Testing structural equation models (pp. 136–142).
Newbury Park, CA: Sage.
Diener, E. (1984). Subjective well-being. Psychological Bulletin, 95, 542-575.
doi:10.1037/0033-2909.95.3.542

TRAITS, VALUES, AND WELL-BEING
33
Diener, E., Emmons, R. A., Larsen, R. J., & Griffin, S. (1985). The Satisfaction With Life
Scale. Journal of Personality Assessment, 49, 71–75.
doi:10.1207/s15327752jpa4901_13
Dobewall, H., & Aavik, T. (2016). Rank-order consistency and profile stability of self- and
informant-reports of personal values in comparison to personality traits. Journal of
Individual Differences, 37, 40–48. doi:10.1027/1614-0001/a000186
Feather, N. T. (1991). Human values, global self-esteem, and belief in a just world. Journal
of Personality, 59, 83–107. doi:10.1111/j.1467-6494.1991.tb00769.x
Fischer, R. (2018). Personality, values, culture: An evolutionary approach. Cambridge, UK:
Cambridge University Press.
Fischer, R., & Boer, D. (2015). Motivational basis of personality traits: A meta-analysis of
value–personality correlations. Journal of Personality, 83, 481-510.
doi:10.1111/jopy.12125
Gebauer, J. E., Sedikides, C., Wagner, J., Bleidorn, W., Rentfrow, P. J., & Potter, J. (2015).
Cultural norm fulfillment, interpersonal belonging, or getting ahead? A large-scale
cross-cultural test of three perspectives on the function of self-esteem. Journal of
Personality and Social Psychology, 109, 526–548. doi:10.1037/pspp0000052
Goldberg, L. R., Johnson, J. A., Eber, H. W., Hogan, R., Ashton, M. C., Cloninger, C. R., &
Gough, H. G. (2006). The international personality item pool and the future of public-
domain personality measures. Journal of Research in Personality, 40, 84–96.
doi:10.1016/j.jrp.2005.08.007
Hamaker, E. L., Kuiper, R. M., & Grasman, R. P. P. P. (2015). A critique of the cross-lagged
panel model. Psychological Methods, 20, 102–116. doi:10.1037/a0038889

TRAITS, VALUES, AND WELL-BEING
34
Haslam, N., Whelan, J., & Bastian, B. (2009). Big Five traits mediate associations between
values and subjective well-being. Personality and Individual Differences, 46, 40–42.
doi:10.1016/j.paid.2008.09.001
He, J., & Van de Vijver, F. J. R. (2015). Self-presentation styles in self-reports: Linking the
general factors of response styles, personality traits, and values in a longitudinal
study. Personality and Individual Differences, 81, 129–134.
doi:10.1016/j.paid.2014.09.009
Hounkpatin, H. O., Boyce, C. J., Dunn, G., & Wood, A. M. (in press). Modeling bivariate
change in individual differences: Prospective associations between personality and
life satisfaction. Journal of Personality and Social Psychology.
doi:10.1037/pspp0000161
Hudson, N. W., & Fraley, R. C. (2015). Volitional personality trait change: Can people
choose to change their personality traits? Journal of Personality and Social
Psychology, 109, 490–507. doi:10.1037/pspp0000021
Huuskes, L., Ciarrochi, J., & Heaven, P. C. L. (2013). The longitudinal relationships between
adolescent religious values and personality. Journal of Research in Personality, 47,
483–487. doi:10.1016/j.jrp.2013.04.010
Judge, T. A., Erez, A., Bono, J. E., & Thoresen, C. J. (2002). Are measures of self-esteem,
neuroticism, locus of control, and generalized self-efficacy indicators of a common
core construct? Journal of Personality and Social Psychology, 83, 693–710.
doi:10.1037//0022-3514.83.3.693
Kandler, C., Kornadt, A. E., Hagemeyer, B., & Neyer, F. J. (2015). Patterns and sources of
personality development in old age. Journal of Personality and Social Psychology,
109, 175–191. doi:10.1037/pspp0000028

TRAITS, VALUES, AND WELL-BEING
35
Kandler, C., Zimmermann, J., & McAdams, D. P. (2014). Core and surface characteristics for
the description and theory of personality differences and development. European
Journal of Personality, 28, 231–243. doi:10.1002/per.1952
Kasser, T., Koestner, R., & Lekes, N. (2002). Early family experiences and adult values: A
26-year, prospective longitudinal study. Personality and Social Psychology Bulletin,
28, 826–835. doi:10.1177/0146167202289011
Kenny, D. A., & Zautra, A. (1995). The trait-state-error model for multiwave data. Journal of
Consulting and Clinical Psychology, 63, 52–59. doi:10.1037/0022-006X.63.1.52
Lönnqvist, J.-E., Verkasalo, M., Helkama, K., Andreyeva, G. M., Bezmenova, I., Manganelli
Rattazzi, A. M., ... Stetsenko, A. (2009). Self-esteem and values. European Journal of
Social Psychology, 39, 40–51. doi:10.1002/ejsp.465
Lucas, R. E., Diener, E., & Suh, E. (1996). Discriminant validity of well-being measures.
Journal of Personality and Social Psychology, 71, 616-628. doi:10.1037/0022-
3514.71.3.616
Lüdtke, O., Trautwein, U., & Husemann, N. (2009). Goal and personality trait development
in a transitional period: Assessing change and stability in personality development.
Personality and Social Psychology Bulletin, 35, 428–441.
doi:10.1177/0146167208329215
Marsh, H. W., Trautwein, U., Lüdtke, O., Köller, O., & Baumert, J. (2006). Integration of
multidimensional self-concept and core personality constructs: Construct validation
and relations to well-being and achievement. Journal of Personality, 74, 403–456.
doi:10.1111/j.1467-6494.2005.00380.x
McAdams, D. P., & Pals, J. L. (2006). A new Big Five: Fundamental principles for an
integrative science of personality. American Psychologist, 61, 204–217.
doi:10.1037/0003-066X.61.3.204
TRAITS, VALUES, AND WELL-BEING
36
McCrae, R. R., & Costa, P. T., Jr. (2008). The five-factor theory of personality. In O. P. John,
R. W. Robins, & L. A. Pervin (Eds.), Handbook of personality: Theory and research
(3rd ed., pp. 159–181). New York, NY: Guilford Press.
McCrae, R. R., & Sutin, A. R. (in press). A five-factor theory perspective on causal analysis.
European Journal of Personality. doi:10.1002/per.2134
McCrae, R. R., Terracciano, A., & 78 Members of the Personality Profiles of Cultures
Project. (2005). Universal features of personality traits from the observer’s
perspective: Data from 50 cultures. Journal of Personality and Social Psychology, 88,
547–561. doi:10.1037/0022-3514.88.3.547
Milfont, T. L., Milojev, P., & Sibley, C. G. (2016). Values stability and change in adulthood:
A 3-year longitudinal study of rank-order stability and mean-level differences.
Personality and Social Psychology Bulletin, 42, 572–588.
doi:10.1177/0146167216639245
Mõttus, R. (2017). Five-Factor Theory and personality development. In J. Specht (Ed.),
Personality development across the lifespan (pp. 87–100). London, UK: Academic
Press.
Orth, U., & Robins, R. W. (2014). The development of self-esteem. Current Directions in
Psychological Science, 23, 381–387. doi:10.1177/0963721414547414
Parks-Leduc, L., Feldman, G., & Bardi, A. (2015). Personality traits and personal values: A
meta-analysis. Personality and Social Psychology Review, 19, 3-29.
doi:10.1177/1088868314538548
Pervin, L. A. (1994). A critical analysis of current trait theory. Psychological Inquiry, 5, 103–
113. doi:10.1207/ s15327965pli0502_1
TRAITS, VALUES, AND WELL-BEING
37
Prenoveau, J. M. (2016). Specifying and interpreting latent state–trait models with
autoregression: An illustration. Structural Equation Modeling, 23, 731–749.
doi:10.1080/10705511.2016.1186550
Pytlik Zillig, L. M., Hemenover, S. H., & Dienstbier, R. A. (2002). What do we assess when
we assess a Big 5 trait? A content analysis of the affective, behavioral, and cognitive
processes represented in Big 5 personality inventories. Personality and Social
Psychology Bulletin, 28, 847–858. doi:10.1177/0146167202289013
Roberts, B. W., & Nickel, L. B. (2017). A critical evaluation of the Neo-Socioanalytic Model
of personality. In J. Specht (Ed.), Personality development across the lifespan (pp.
157–177). London, UK: Academic Press.
Roberts, B. W., & Wood, D. (2006). Personality development in the context of the Neo-
Socioanalytic Model of personality. In D. Mroczek & T. Little (Eds.), Handbook of
personality development. Mahwah, NJ: Lawrence Erlbaum Associates.
Roberts, B. W., Wood, D., & Caspi, A. (2008). The development of personality traits in
adulthood. In O. P. John, R. W. Robins, & L. A. Pervin (Eds.), Handbook of
personality: Theory and research (pp. 375–398). New York, NY: Guilford Press.
Robins, R. W., Tracy, J. L., & Trzesniewski, K. (2001). Personality correlates of self-esteem.
Journal of Research in Personality, 35, 463–482. doi:10.1006/jrpe.2001.2324
Rokeach, M. (1973). The nature of human values. New York, NY: Free Press.
Rosenberg, M. (1965). Society and the adolescent self-image. Princeton, NY: Princeton
University Press.
Sagiv, L., & Schwartz, S. H. (2000). Value priorities and subjective well-being: direct
relations and congruity effects. European Journal of Social Psychology, 30, 177–198.
doi:10.1002/(SICI)1099-0992(200003/04)30:2<177::AID-EJSP982>3.0.CO;2-Z

TRAITS, VALUES, AND WELL-BEING
38
Schafer, J. L., & Graham, J. W. (2002). Missing data: Our view of the state of the art.
Psychological Methods, 7, 147–177. doi:10.1037/1082-989X.7.2.147
Schimmack, U., Radhakrishnan, P., Oishi, S., Dzokoto, V., & Ahadi, S. (2002). Culture,
personality, and subjective well-being: Integrating process models of life-satisfaction.
Journal of Personality and Social Psychology, 82, 582–593. doi:10.1037/0022-
3514.82.4.582
Schimmack, U., Schupp, J., & Wagner, G. G. (2008). The influence of environment and
personality on the affective and cognitive component of subjective well-being. Social
Indicators Research, 89, 41–60. doi:10.1007/s11205-007-9230-3
Schwaba, T., & Bleidorn, W. (in press a). Individual differences in personality change across
the adult lifespan. Journal of Personality. doi:10.1111/joms.12327
Schwaba, T., & Bleidorn, W. (in press b). Personality trait development across the transition
to tetirement. Journal of Personality and Social Psychology.
doi:10.1037/pspp0000179
Schwaba, T., Luhmann, M., Denissen, J., Chung, J. M., & Bleidorn, W. (in press). Openness
to Experience and culture-openness transactions across the lifespan. Journal of
Personality and Social Psychology. doi: 10.1037/pspp0000150
Schwartz, S. H. (1992). Universals in the content and structure of values: Theoretical
advances and empirical tests in 20 countries. Advances in Experimental Social
Psychology, 25, 1–65. doi:10.1016/S0065-2601(08)60281-6
Schwartz, S. H., & Bardi, A. (2001). Value hierarchies across cultures: Taking a similarities
perspective. Journal of Cross-Cultural Psychology, 32, 268–290.
doi:10.1177/0022022101032003002
TRAITS, VALUES, AND WELL-BEING
39
Schwartz, S. H., & Bilsky, W. (1990). Toward a theory of the universal content and structure
of values: Extensions and cross-cultural replications. Journal of Personality and
Social Psychology, 58, 878-891. doi:10.1037/0022-3514.58.5.878
Sortheix, F. M., & Schwartz, S. H. (2017). Values that underlie and undermine well-being:
Variability across countries. European Journal of Personality, 31, 187–201.
doi:10.1002/per.2096
Soto, C. J. (2015). Is happiness good for your personality? Concurrent and prospective
relations of the Big Five with subjective well-being. Journal of Personality, 83, 45–
55. doi:10.1111/jopy.12081
Sowislo, J. F., & Orth, U. (2013). Does low self-esteem predict depression and anxiety? A
meta-analysis of longitudinal studies. Psychological Bulletin, 139, 213–240.
doi:10.1037/a0028931
Specht, J., Bleidorn, W., Denissen, J. A., Hennecke, M., Hutteman, R., Kandler, C., ...
Zimmermann, J. (2014). What drives adult personality development? A comparison
of theoretical perspectives and empirical evidence. European Journal of Personality,
28, 216–230. doi:10.1002/per.1966
Steel, P., Schmidt, J., & Shultz, J. (2008). Refining the relationship between personality and
subjective well-being. Psychological Bulletin, 134, 138–161. doi:10.1037/0033-
2909.134.1.138
Strus, W., & Cieciuch, J. (2017). Towards a synthesis of personality, temperament,
motivation, emotion and mental health models within the Circumplex of Personality
Metatraits. Journal of Research in Personality, 66, 70–95.
doi:10.1016/j.jrp.2016.12.002

TRAITS, VALUES, AND WELL-BEING
40
Terracciano, A., Costa, P. T., Jr., & McCrae, R. R. (2006). Personality plasticity after age 30.
Personality and Social Psychology Bulletin, 32, 999–1009.
doi:10.1177/0146167206288599
Watson, D., Clark, L. A., & Tellegen, A. (1988). Development and validation of brief
measures of positive and negative affect: The PANAS scales. Journal of Personality
and Social Psychology, 54, 1063–1070. doi:10.1037/0022-3514.54.6.1063

TRAITS, VALUES, AND WELL-BEING
41
Table 1 Demographics and Scale Reliabilities Across Time Points T1 T2 T3 T4 T5 Demographics Number of Participants 6,784 7,021 6,738 5,159 6,918 Mean Age in Years (SD) 45.84
(15.96) 46.75
(17.37) 48.29
(17.60) 50.81
(17.72) 48.58
(18.22) Age Range in Years 16–94 14–95 15–97 15–93 15–96 Education (Percentage) None Completed 1 0 0 0 0 Primary 4 4 3 4 3 Secondary 59 58 58 58 53 Higher vocational 26 25 25 26 28 University 11 12 13 13 16 Females (Percentage) 54 54 54 54 54 Reliability (Spearman-Brown) Personality Traits Agreeableness .71 .72 .73 .73 .74 Conscientiousness .67 .68 .67 .67 .68 Extraversion .83 .82 .83 .84 .84 Openness .65 .63 .64 .63 .65 Neuroticism .75 .74 .75 .75 .77 Values Prosocial .83 .83 .83 .82 .82 Restrictive Conformity .79 .79 .78 .77 .78 Enjoyment .77 .77 .78 .78 .77 Self-Direction .79 .80 .80 .79 .79 Maturity .70 .68 .69 .68 .69 Security .72 .71 .71 .67 .71 Achievement .66 .66 .67 .67 .68 Well-Being Positive Affect .91 .91 .91 .91 .92 Negative Affect .93 .94 .94 .95 .94 Life Satisfaction .89 .90 .91 .90 .91 Self-Esteem .78 .77 .80 .81 .81

TRAITS, VALUES, AND WELL-BEING
42
Table 2 Mean Standardized Stability Coefficients and Cross-Lagged Effects of Personality Traits and Values Across Time Points
Stability Coefficients Cross-Lagged Effects Trait Value Trait → Value Value → Trait Trait––Value M SD M SD M SD M SD Agreeableness––Prosocial .80 .04 .71 .01 .35(4/-/-) .02 .11(4/-/-) .04 Conscientiousness––Conformity .85 .02 .79 .01 .28(4/-/-) .02 .12(4/-/-) .05 Extraversion––Enjoyment .86 .04 .69 .01 .16(4/-/-) .01 .05(4/-/-) .02 Openness––Self-Direction .94 .01 .67 .01 .22(4/-/-) .02 .07(3/1/-) .03 Neuroticism–– .83 .03 ––Maturity .73 .01 ––Security .71 .02 ––Achievement .72 .03 Mean .86 .03 .72 .01 .25 .02 .09 .04
Note. Conformity = Restrictive Conformity. Stability coefficients are from univariate trait-state-error models computed separately for each trait and value (Figure 1, paths a). Cross-lagged effects are from random-intercepts cross-lagged panel models computed separately for each trait–value pair (Figure 2, paths b and c). The superscript numbers indicate number of significant effects at .001, .01, and .05, respectively, across the four cross-lagged effects.

TRAITS, VALUES, AND WELL-BEING
43
Table 3 Mean Standardized Cross-Lagged Effects of Matched Personality Traits and Values on Well-Being/Self-Esteem Across Time Points Positive
Affect Negative
Affect Life
Satisfaction
Self-Esteem Dimension M SD M SD M SD M SD Agreeableness .07(4/-/-) .01 -.15(4/-/-) .02 .07(4/-/-) .02 .10(4/-/-) .02 Prosocial .09(4/-/-) .02 .03(-/3/-) .01 .01(-/-/1) .01 .00(-/-/-) .01 Conscientiousness .15(4/-/-) .03 -.25(4/-/-) .02 .10(4/-/-) .00 .24(4/-/-) .03 Conformity .10(4/-/-) .01 .08(4/-/-) .02 -.01(-/-/-) .01 -.04(3/1/-) .01 Extraversion .14(4/-/-) .02 -.05(3/1/-) .01 .10(4/-/-) .01 .12(4/-/-) .02 Enjoyment .06(4/-/-) .01 -.02(-/-/-) .01 .01(-/1/-) .01 .02(-/-/1) .03 Openness .04(2/-/1) .02 -.13(4/-/-) .01 .03(2/1/-) .01 .12(4/-/-) .02 Self-Direction .12(4/-/-) .03 .00(-/-/-) .01 .01(-/1/-) .01 .01(-/1/-) .02 Mean (Absolute) Traits .10 .02 .14 .02 .07 .01 .15 .02 Values .09 .02 .03 .01 .01 .01 .02 .01 Wilcoxon Test -0.65 -3.52*** -3.47** -3.52*** Note. Conformity = Restrictive Conformity. The table presents the mean effects d and f from the model in Figure 3. The superscript numbers indicate number of significant effects at .001, .01, and .05, respectively, across the four cross-lags. The “Mean (Absolute)” rows display the means of the absolute values of mean effects and standard deviations across the four traits and values, respectively. The Wilcoxon Signed Ranked Tests were computed using the coefficients for all four cross-lags per trait–value pair. *p < .05. **p < .01. ***p < .001.

TRAITS, VALUES, AND WELL-BEING
44
Table 4 Mean Standardized Cross-Lagged Effects of Personality Traits and Well-Being/Self-Esteem Across Time Points Positive
Affect Negative
Affect Life
Satisfaction
Self-Esteem Dimension M SD M SD M SD M SD Agreeableness Trait → W/S .11(4/-/-) .01 -.13(4/-/-) .02 .08(4/-/-) .02 .12(4/-/-) .02 W/S → Trait .08(4/-/-) .03 -.07(4/-/-) .00 .05(4/-/-) .01 .10(4/-/-) .00 Conscientiousness Trait → W/S .18(4/-/-) .02 -.22(4/-/-) .02 .11(4/-/-) .01 .23(4/-/-) .02 W/S → Trait .08(4/-/-) .03 -.10(4/-/-) .01 .08(4/-/-) .01 .19(4/-/-) .02 Extraversion Trait → W/S .16(4/-/-) .02 -.06(4/-/-) .01 .10(4/-/-) .01 .15(4/-/-) .01 W/S → Trait .06(4/-/-) .02 -.03(3/1/-) .01 .06(4/-/-) .01 .12(4/-/-) .02 Openness Trait → W/S .06(3/1/-) .02 -.13(4/-/-) .01 .04(2/2/-) .01 .13(4/-/-) .02 W/S → Trait .06(4/-/-) .02 -.05(4/-/-) .01 .05(2/1/-) .02 .13(4/-/-) .02 Neuroticism Trait → W/S -.15(4/-/-) .01 .31(4/-/-) .01 -.26(4/-/-) .02 -.25(4/-/-)a .02a W/S → Trait -.09(4/-/-) .01 .12(4/-/-) .02 -.17(4/-/-) .04 -.21(4/-/-)a .01a Mean (Absolute) Trait → W/S .13 .01 .17 .01 .12 .01 .17 .02 W/S → Trait .07 .02 .07 .01 .08 .02 .15 .01 Difference .06 .09 .04 .02 Wilcoxon Test -3.57*** -3.92*** -3.49*** -3.27** Note. W/S = Well-Being/Self-Esteem. The table presents the mean effects g and h from the model in Figure 4 (for traits–well-being/self-esteem models). The superscript numbers indicate number of significant effects at .001, .01, and .05, respectively, across the four cross-lags. The “Mean (Absolute)” rows display the means of the absolute values of mean effects and standard deviations across the five traits. The Wilcoxon Signed Ranked Tests were computed using the coefficients for all four cross-lags per trait–well-being/self-esteem pair. aThe estimates for the Neuroticism–Self Esteem model are from analyses of observed scores because the model using latent scores was nonadmissible (see text). *p < .05. **p < .01. ***p < .001.

TRAITS, VALUES, AND WELL-BEING
45
Table 5 Mean Standardized Cross-Lagged Effects of Values and Well-Being/Self-Esteem Across Time Points Positive
Affect Negative
Affect Life
Satisfaction
Self-Esteem Dimension M SD M SD M SD M SD Prosocial Value → W/S .12(4/-/-) .02 -.05(4/-/-) .01 .04(2/1/1) .02 .05(3/1/-) .01 W/S → Value .13(4/-/-) .01 -.07(4/-/-) .01 .08(4/-/-) .01 .14(4/-/-) .03 Conformity Value → W/S .16(4/-/-) .02 -.01(-/-/-) .01 .03(1/1/1) .01 .04(3/1/-) .01 W/S → Value .13(4/-/-) .02 -.02(-/1/1) .01 .07(4/-/-) .01 .10(4/-/-) .03 Enjoyment Value → W/S .10(4/-/-) .01 -.04(2/2/-) .01 .05(4/-/-) .01 .06(3/-/-) .03 W/S → Value .13(4/-/-) .02 -.06(4/-/-) .01 .12(4/-/-) .01 .19(4/-/-) .01 Self-Direction Value → W/S .15(4/-/-) .03 -.04(2/1/1) .01 .03(2/-/-) .02 .06(3/1/-) .02 W/S → Value .17(4/-/-) .03 -.06(4/-/-) .01 .08(4/-/-) .01 .19(4/-/-) .03 Maturity Value → W/S .15(4/-/-) .03 -.02(-/1/-) .02 .03(2/-/-) .02 .06(3/-/-) .03 W/S → Value .16(4/-/-) .02 -.04(2/1/-) .02 .10(4/-/-) .01 .20(4/-/-) .02 Security Value → W/S .15(4/-/-) .02 -.08(4/-/-) .01 .05(2/2/-) .01 .08(3/1/-) .03 W/S → Value .17(4/-/-) .04 -.10(4/-/-) .02 .12(4/-/-) .01 .21(4/-/-) .05 Achievement Value → W/S .16(4/-/-) .03 .05(3/1/-) .01 .03(1/1/1) .02 .03(1/-/2) .02 W/S → Value .12(4/-/-) .03 .03(1/1/1) .02 .06(4/-/-) .01 .08(4/-/-) .02 Mean (Absolute) Value → W/S .14 .02 .04 .01 .04 .01 .05 .02 W/S → Value .14 .02 .05 .02 .09 .01 .16 .03 Difference .00 -.01 -.05 -.10 Wilcoxon Test 0.34 2.64** 4.62*** 4.62*** Note. Conformity = Restrictive Conformity; W/S = Well-Being/Self-Esteem. The table presents the mean effects g and h from the model in Figure 4 (for values–well-being/self-esteem models). The superscript numbers indicate number of significant effects at .001, .01, and .05, respectively, across the four cross-lags. The “Mean (Absolute)” rows display the means of the absolute values of mean effects and standard deviations across the seven values. The Wilcoxon Signed Ranked Tests were computed using the coefficients for all four cross-lags per value–well-being/self-esteem pair. *p < .05. **p < .01. ***p < .001.

TRAITS, VALUES, AND WELL-BEING
46
Figure 1. Stability model of personality traits/values. The T/V circles denote the latent factors of individual traits and values per time point; p1 and p2 denote parcels; paths a denote the loadings of the time-specific latent factor on the time-invariant latent factor, interpreted as long-term stability coefficients. Variances of the error components of the two parcels of each time-specific latent factor (e.g., u1 and u2, etc.) were fixed to be identical for model identification.

TRAITS, VALUES, AND WELL-BEING
47
Figure 2. Personality traits and values. For simplicity, the parcels are omitted (cf. Figure 1). Paths b and c denote the cross-lagged effects of traits and values, respectively, in each trait–value pair. In cases of nonadmissible solutions due to negative covariance among error components, variances of the error components of the two parcels of each time-specific latent factor were fixed to be identical.
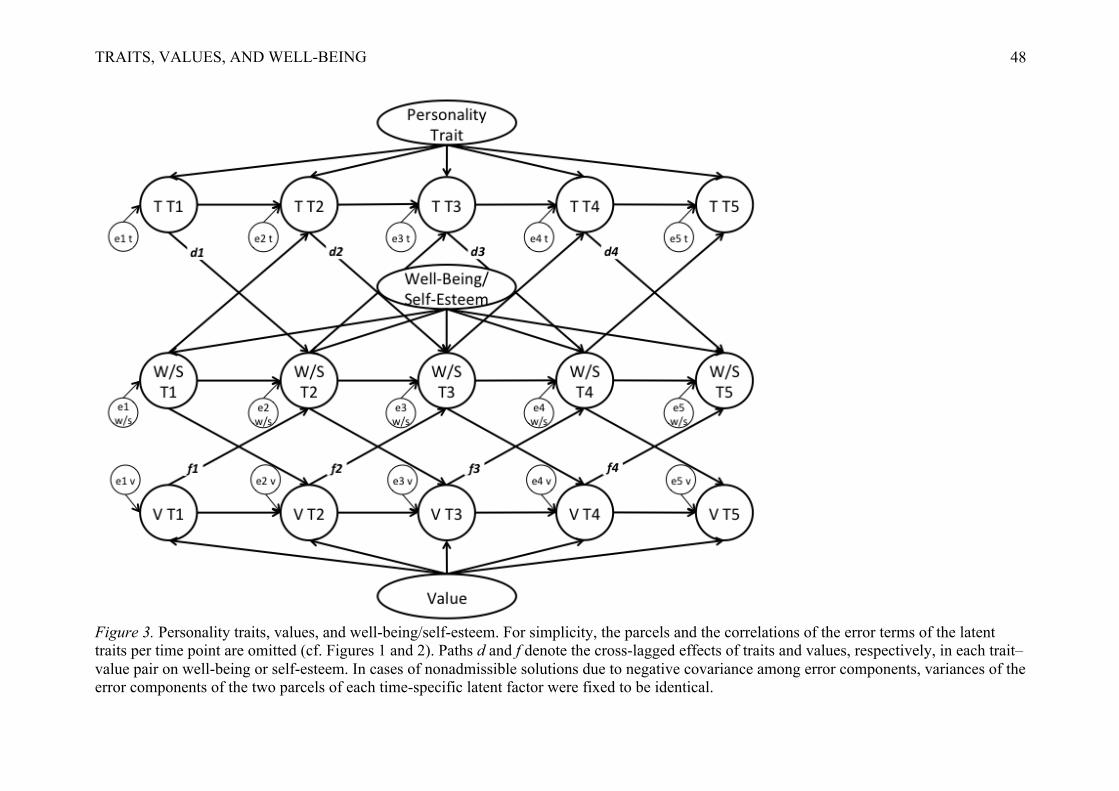
TRAITS, VALUES, AND WELL-BEING
48
Figure 3. Personality traits, values, and well-being/self-esteem. For simplicity, the parcels and the correlations of the error terms of the latent traits per time point are omitted (cf. Figures 1 and 2). Paths d and f denote the cross-lagged effects of traits and values, respectively, in each trait–value pair on well-being or self-esteem. In cases of nonadmissible solutions due to negative covariance among error components, variances of the error components of the two parcels of each time-specific latent factor were fixed to be identical.
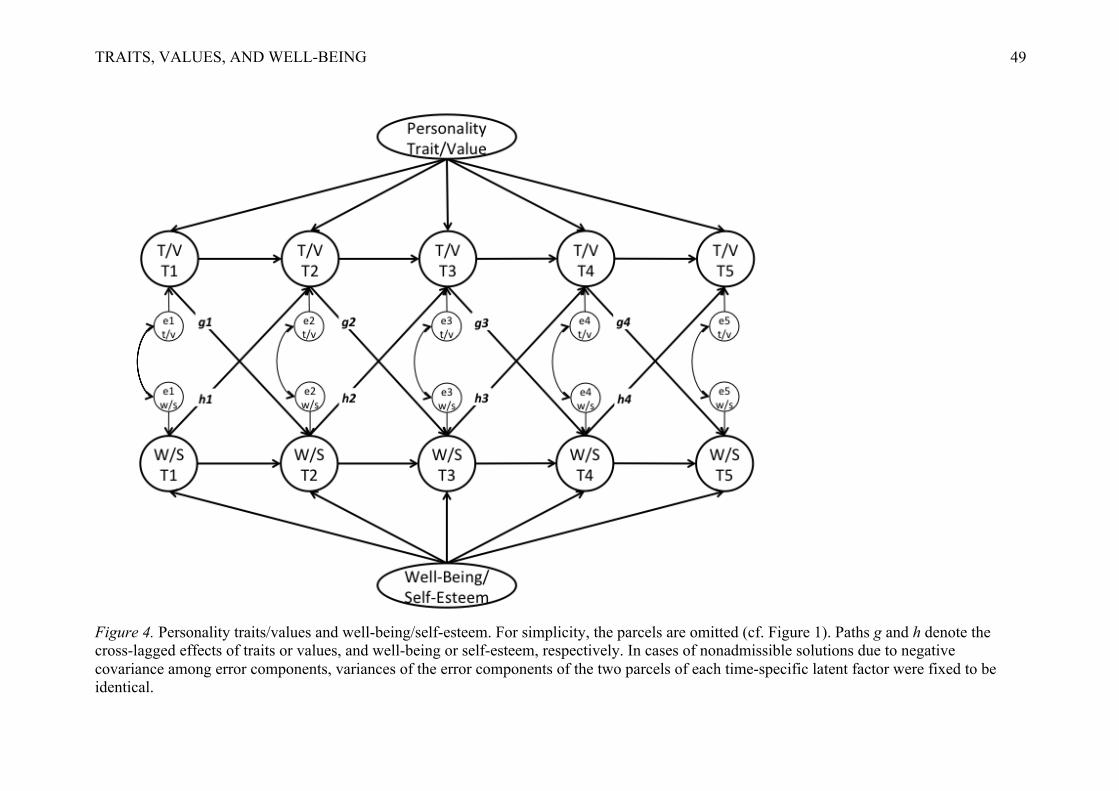
TRAITS, VALUES, AND WELL-BEING
49
Figure 4. Personality traits/values and well-being/self-esteem. For simplicity, the parcels are omitted (cf. Figure 1). Paths g and h denote the cross-lagged effects of traits or values, and well-being or self-esteem, respectively. In cases of nonadmissible solutions due to negative covariance among error components, variances of the error components of the two parcels of each time-specific latent factor were fixed to be identical.

TRAITS, VALUES, AND WELL-BEING
1
Table S1 Value Assignment Based on Majority Results From Schwartz and Bilsky (1990)
Value Item Prosocial A world at peace Equality Forgiving Helpful Honest (Sincere and truthful) Loving Salvation True friendship Restrictive Conformity Clean Obedient Polite Self-controlled Enjoyment Cheerful (Happy) Comfortable life Happiness Pleasure Self-Direction Broadminded (Open-minded) Freedom Imaginative (Creative) Independent Intellectual Logical Maturity A world of beauty Courageous Mature love Self-respect Wisdom Security Family security Inner harmony National security Responsible Achievement A sense of accomplishment Ambitious (Hardworking) Capable Exciting life Social recognition Note. The English back-translation is presented in parentheses, where it did not match the original wording exactly.

TRAITS, VALUES, AND WELL-BEING
2
Table S2 Means and Standard Deviations of the Parcels Used for Each Variable per Time Point Time 1 Time 2 Time 3 Time 4 Time 5 M SD M SD M SD M SD M SD Traits 3.80 0.51 3.77 0.51 3.73 0.51 3.72 0.53 3.75 0.53 Agreeableness 1 4.06 0.62 4.04 0.61 4.04 0.61 4.04 0.63 4.06 0.64 Agreeableness 2 3.58 0.53 3.56 0.54 3.55 0.54 3.55 0.55 3.57 0.54 Conscientiousness 1 3.92 0.72 3.88 0.73 3.89 0.72 3.95 0.71 3.92 0.73 Conscientiousness 2 3.46 0.66 3.43 0.66 3.41 0.67 3.38 0.69 3.39 0.69 Extraversion 1 3.14 0.71 3.13 0.71 3.11 0.71 3.10 0.72 3.10 0.73 Extraversion 2 3.51 0.51 3.49 0.51 3.46 0.51 3.44 0.52 3.48 0.52 Openness 1 3.51 0.70 3.48 0.70 3.48 0.70 3.48 0.70 3.52 0.71 Openness 2 2.60 0.71 2.60 0.70 2.56 0.70 2.51 0.73 2.55 0.73 Neuroticism 1 2.53 0.80 2.56 0.79 2.55 0.81 2.52 0.83 2.57 0.83 Neuroticism 2 3.80 0.51 3.77 0.51 3.73 0.51 3.72 0.53 3.75 0.53 Mean 3.41 0.65 3.39 0.65 3.38 0.65 3.37 0.66 3.39 0.67 Values Prosocial 1 6.07 0.84 6.02 0.85 5.92 0.87 5.94 0.86 5.96 0.85 Prosocial 2 5.77 0.89 5.68 0.90 5.59 0.91 5.57 0.90 5.62 0.91 Conformity 1 5.33 1.21 5.27 1.20 5.22 1.20 5.26 1.17 5.25 1.19 Conformity 2 5.44 1.09 5.38 1.09 5.28 1.07 5.30 1.09 5.31 1.10 Enjoyment 1 6.11 0.87 6.04 0.88 5.96 0.90 5.92 0.89 5.95 0.90 Enjoyment 2 5.80 0.90 5.74 0.92 5.68 0.93 5.63 0.93 5.72 0.93 Self-Direction 1 5.45 0.92 5.40 0.92 5.34 0.92 5.34 0.92 5.38 0.93 Self-Direction 2 5.64 0.85 5.56 0.86 5.50 0.85 5.50 0.86 5.53 0.85 Maturity 1 5.80 0.87 5.75 0.87 5.69 0.88 5.68 0.88 5.70 0.88 Maturity 2 5.51 0.97 5.45 0.99 5.37 1.00 5.32 1.01 5.37 1.00 Security 1 6.36 0.87 6.29 0.89 6.23 0.91 6.24 0.89 6.24 0.89 Security 2 5.85 1.02 5.81 1.02 5.68 1.06 5.71 1.03 5.75 1.04 Achievement 1 5.44 0.92 5.39 0.92 5.31 0.95 5.29 0.96 5.34 0.95 Achievement 2 4.77 1.18 4.72 1.20 4.64 1.20 4.52 1.23 4.58 1.25 Mean 5.67 0.96 5.61 0.96 5.53 0.97 5.52 0.97 5.55 0.98 Broad Well-Being Positive Affect 1 4.83 1.08 4.70 1.09 4.62 1.10 4.62 1.13 4.62 1.13 Positive Affect 2 4.64 1.13 4.52 1.12 4.43 1.12 4.43 1.14 4.47 1.16 Negative Affect 1 2.10 1.05 2.13 1.08 2.13 1.11 2.07 1.09 2.14 1.11 Negative Affect 2 2.01 1.14 2.04 1.14 2.07 1.18 2.02 1.16 2.09 1.21 Life Satisfaction 1 5.05 1.10 5.00 1.13 4.99 1.15 4.99 1.16 4.91 1.18 Life Satisfaction 2 5.23 1.10 5.17 1.13 5.15 1.14 5.15 1.15 5.08 1.20 Self-Esteem 1 5.74 0.90 5.68 0.90 5.59 0.92 5.60 0.94 5.58 0.94 Self-Esteem 2 5.58 1.24 5.53 1.23 5.49 1.23 5.54 1.24 5.50 1.27 Mean 4.40 1.09 4.35 1.10 4.31 1.12 4.30 1.13 4.30 1.15 Note. Conformity = Restrictive Conformity.

TRAITS, VALUES, AND WELL-BEING
3
Table S3 Model Fit of All Models Presented in the Study χ2 df TLI CFI RMSEA Univariate Stability (Figure 1) Agreeableness 141.353 15 .987 .996 .027 Conscientiousness 86.541 15 .993 .998 .020 Extraversion 227.834 15 .986 .996 .035 Openness 73.158 15 .994 .998 .018 Neuroticism 170.801 15 .985 .996 .030 Prosocial 39.164 15 .998 .999 .012 Restrictive Conformity 31.325 15 .998 1.000 .010 Enjoyment 52.856 15 .995 .999 .015 Self-Direction 37.531 15 .997 .999 .011 Maturity 13.608 15 1.000 1.000 .000 Security 22.170 15 .999 1.000 .006 Achievement 32.500 15 .998 .999 .010 Traits and Values (Figure 2) Agreeableness & Prosocial 954.909 107 .979 .989 .026 Conscientiousness & Conformity 2373.862 113 .946 .971 .046 Extraversion & Enjoyment 1062.455 112 .979 .989 .027 Openness & Self-Direction 553.994 107 .987 .993 .019 Traits, Values, and Well-Being/Self-Esteem (Figure 3) Agreeableness, Prosocial, & Positive Affect 4213.398 302 .954 .970 .033 Agreeableness, Prosocial, & Negative Affect 5093.417 304 .948 .966 .036 Agreeableness, Prosocial, & Life Satisfaction 4095.356 303 .957 .972 .032 Agreeableness, Prosocial, & Self-Esteem 5508.001 302 .934 .957 .038 Conscientiousness, Conformity, & Positive Affect 4973.409 301 .945 .965 .036 Conscientiousness, Conformity, & Negative Affect 5331.760 301 .945 .964 .037 Conscientiousness, Conformity, & Life Satisfaction 4693.725 298 .949 .967 .035 Conscientiousness, Conformity, & Self-Esteem 5836.770 298 .930 .955 .040 Extraversion, Enjoyment, & Positive Affect 2746.110 300 .973 .982 .026 Extraversion, Enjoyment, & Negative Affect 2231.809 300 .979 .987 .023 Extraversion, Enjoyment, & Life Satisfaction 2452.031 299 .976 .985 .025 Extraversion, Enjoyment, & Self-Esteem 3612.850 300 .960 .974 .030 Openness, Self-Direction, & Positive Affect 2609.644 299 .971 .981 .025 Openness, Self-Direction, & Negative Affect 2016.177 299 .979 .987 .022 Openness, Self-Direction, & Life Satisfaction 1899.677 298 .980 .987 .021 Openness, Self-Direction, & Self-Esteem 3574.638 300 .955 .911 .030 Traits and Well-Being/Self-Esteem (Figure 4) Agreeableness & Positive Affect 764.736 112 .986 .993 .022 Agreeableness & Negative Affect 1194.869 117 .980 .989 .028 Agreeableness & Life Satisfaction 612.514 112 .990 .995 .019 Agreeableness & Self-Esteem 1682.154 112 .962 .980 .034 Conscientiousness & Positive Affect 671.969 112 .988 .994 .021 Conscientiousness & Negative Affect 968.884 117 .985 .992 .025 Conscientiousness & Life Satisfaction 515.330 107 .992 .996 .018 Conscientiousness & Self-Esteem 1571.335 112 .967 .982 .033 Extraversion & Positive Affect 1279.835 112 .980 .989 .030 Extraversion & Negative Affect 440.127 117 .995 .997 .015 Extraversion & Life Satisfaction 895.950 112 .987 .993 .024 Extraversion & Self-Esteem 2192.381 117 .962 .979 .039

TRAITS, VALUES, AND WELL-BEING
4
Table S3 (Continued) χ2 df TLI CFI RMSEA Openness & Positive Affect 1013.472 107 .982 .990 .025 Openness & Negative Affect 1998.792 117 .968 .982 .037 Openness & Life Satisfaction 430.287 112 .993 .997 .015 Openness & Self-Esteem 1914.334 112 .957 .977 .037 Neuroticism & Positive Affect 577.578 107 .990 .995 .019 Neuroticism & Negative Affect 411.553 117 .994 .997 .015 Neuroticism & Life Satisfaction 998.136 107 .982 .991 .026 Neuroticism & Self-Esteem (Observed Scores) 1512.882 22 .921 .969 .075 Values and Well-Being/Self-Esteem (Figure 4) Prosocial & Positive Affect 968.298 112 .983 .991 .025 Prosocial & Negative Affect 767.714 109 .987 .993 .023 Prosocial & Life Satisfaction 454.961 107 .993 .996 .017 Prosocial & Self-Esteem 953.556 109 .980 .990 .026 Conformity & Positive Affect 724.911 108 .986 .993 .022 Conformity & Negative Affect 210.511 109 .998 .999 .009 Conformity & Life Satisfaction 409.007 108 .994 .997 .015 Conformity & Self-Esteem 573.096 108 .988 .994 .019 Enjoyment & Positive Affect 672.963 113 .987 .993 .020 Enjoyment & Negative Affect 419.505 112 .994 .997 .015 Enjoyment & Life Satisfaction 605.159 112 .989 .994 .019 Enjoyment & Self-Esteem 1237.368 113 .970 .984 .029 Self-Direction & Positive Affect 729.068 109 .986 .993 .022 Self-Direction & Negative Affect 230.877 109 .997 .999 .010 Self-Direction & Life Satisfaction 402.435 109 .993 .997 .015 Self-Direction & Self-Esteem 1080.633 109 .974 .987 .027 Maturity & Positive Affect 683.446 107 .986 .993 .021 Maturity & Negative Affect 359.505 113 .995 .997 .014 Maturity & Life Satisfaction 364.747 107 .994 .997 .014 Maturity & Self-Esteem 1079.485 108 .972 .986 .028 Security & Positive Affect 885.193 109 .981 .990 .024 Security & Negative Affect 349.634 109 .995 .997 .014 Security & Life Satisfaction 527.890 109 .990 .995 .018 Security & Self-Esteem 860.468 109 .978 .989 .024 Achievement & Positive Affect 1273.208 112 .973 .986 .030 Achievement & Negative Affect 750.244 113 .987 .993 .022 Achievement & Life Satisfaction 568.769 112 .990 .995 .019 Achievement & Self-Esteem 1529.254 113 .962 .980 .032 Note. Conformity = Restrictive Conformity.

TRAITS, VALUES, AND WELL-BEING
5
Table S4 Univariate Stability Coefficients for Personality Traits and Values (cf. Figure 1, Paths a, and Table 2, Left Panel) Time 1 Time 2 Time 3 Time 4 Time 5 Traits Agreeableness .87 .82 .79 .76 .76 Conscientiousness .89 .84 .86 .84 .84 Extraversion .92 .88 .85 .82 .82 Openness .94 .94 .94 .94 .92 Neuroticism .86 .85 .83 .80 .80 Values Prosocial .71 .71 .70 .71 .71 Restrictive Conformity .79 .77 .78 .81 .79 Enjoyment .71 .70 .68 .68 .68 Self-Direction .67 .68 .67 .68 .67 Maturity .72 .74 .73 .74 .73 Security .71 .70 .69 .73 .71 Achievement .77 .73 .70 .71 .70

TRAITS, VALUES, AND WELL-BEING
6
Table S5 Cross-Lagged Parameter Estimates for Personality Traits and Values (cf. Figure 2, Paths b and c, and Table 2, Right Panel) Trait → Value Value → Trait Trait–Value Pair Unst. SE p St. Unst. SE p St. Agreeableness & Prosocial Cross-Lag 1 .59 .03 < .001 .32 .10 .01 < .001 .18 Cross-Lag 2 .65 .03 < .001 .36 .06 .01 < .001 .09 Cross-Lag 3 .58 .03 < .001 .35 .06 .01 < .001 .10 Cross-Lag 4 .61 .03 < .001 .38 .06 .01 < .001 .09 Conscientiousness & Conformity Cross-Lag 1 .56 .04 < .001 .25 .09 .01 < .001 .19 Cross-Lag 2 .60 .04 < .001 .28 .05 .01 < .001 .11 Cross-Lag 3 .59 .04 < .001 .29 .04 .01 < .001 .07 Cross-Lag 4 .60 .03 < .001 .30 .05 .01 < .001 .10 Extraversion & Enjoyment Cross-Lag 1 .25 .02 < .001 .17 .05 .01 < .001 .07 Cross-Lag 2 .24 .02 < .001 .16 .03 .01 < .001 .05 Cross-Lag 3 .24 .02 < .001 .16 .03 .01 < .001 .04 Cross-Lag 4 .25 .02 < .001 .18 .03 .01 < .001 .04 Openness & Self-Direction Cross-Lag 1 .29 .02 < .001 .19 .08 .01 < .001 .12 Cross-Lag 2 .33 .03 < .001 .21 .05 .01 < .001 .07 Cross-Lag 3 .35 .03 < .001 .23 .02 .01 .003 .04 Cross-Lag 4 .36 .03 < .001 .24 .05 .01 < .001 .07 Note. Conformity = Restrictive Conformity, SE = Standard error, Unst. = Unstandardized, St. = Standardized.

TRAITS, VALUES, AND WELL-BEING
7
Table S6 Cross-Lagged Parameter Estimates for Personality Traits, Values, and Well-Being/Self-Esteem (cf. Figure 3, Paths d and f, and Table 3)
Positive Affect Negative Affect Life Satisfaction Self-Esteem Trait–Value Pair Unst. SE p St. Unst. SE p St. Unst. SE p St. Unst. SE p St. Agreeableness & Prosocial Trait → W/S CL1 .23 .04 < .001 .08 -.50 .04 < .001 -.15 .17 .04 < .001 .05 .26 .03 < .001 .12 Trait → W/S CL2 .22 .04 < .001 .08 -.50 .04 < .001 -.16 .19 .03 < .001 .06 .26 .03 < .001 .12 Trait → W/S CL3 .21 .04 < .001 .08 -.33 .04 < .001 -.11 .18 .04 < .001 .06 .15 .03 < .001 .07 Trait → W/S CL4 .14 .04 < .001 .05 -.48 .04 < .001 -.16 .26 .03 < .001 .09 .23 .03 < .001 .10 Value → W/S CL1 .15 .02 < .001 .10 .06 .02 .001 .04 .00 .02 .949 .00 .01 .01 .619 .01 Value → W/S CL2 .09 .02 < .001 .06 .05 .02 .003 .04 .03 .02 .033 .02 .00 .01 .978 .00 Value → W/S CL3 .13 .02 < .001 .08 .02 .02 .226 .02 -.01 .02 .676 -.01 -.01 .01 .660 -.01 Value → W/S CL4 .17 .02 < .001 .11 .05 .02 .009 .03 .01 .02 .584 .01 -.01 .01 .274 -.01 Conscientiousness & Conformity Trait → W/S CL1 .41 .05 < .001 .13 -.95 .05 < .001 -.27 .28 .04 < .001 .10 .58 .04 < .001 .25 Trait → W/S CL2 .36 .04 < .001 .13 -.83 .05 < .001 -.25 .24 .03 < .001 .10 .58 .04 < .001 .26 Trait → W/S CL3 .50 .04 < .001 .18 -.76 .05 < .001 -.23 .23 .03 < .001 .09 .49 .04 < .001 .21 Trait → W/S CL4 .42 .04 < .001 .16 -.88 .05 < .001 -.26 .25 .03 < .001 .10 .59 .04 < .001 .26 Value → W/S CL1 .13 .02 < .001 .11 .12 .01 < .001 .11 -.02 .01 .073 -.02 -.02 .01 .005 -.03 Value → W/S CL2 .08 .01 < .001 .08 .08 .01 < .001 .07 .01 .01 .465 .01 -.04 .01 < .001 -.05 Value → W/S CL3 .12 .02 < .001 .10 .06 .01 < .001 .06 -.01 .01 .374 -.01 -.03 .01 < .001 -.04 Value → W/S CL4 .12 .02 < .001 .10 .08 .02 < .001 .07 -.01 .01 .604 -.01 -.04 .01 < .001 -.05 Extraversion & Enjoyment Trait → W/S CL1 .25 .02 < .001 .13 -.10 .02 < .001 -.05 .21 .02 < .001 .11 .21 .02 < .001 .15 Trait → W/S CL2 .26 .02 < .001 .15 -.11 .02 < .001 -.06 .19 .02 < .001 .10 .16 .02 < .001 .11 Trait → W/S CL3 .21 .02 < .001 .13 -.07 .02 .001 -.04 .16 .02 < .001 .09 .15 .02 < .001 .11 Trait → W/S CL4 .27 .02 < .001 .17 -.10 .02 < .001 -.06 .21 .02 < .001 .11 .18 .02 < .001 .13 Value → W/S CL1 .10 .02 < .001 .06 -.02 .02 .409 -.01 .02 .02 .242 .01 .05 .01 < .001 .05 Value → W/S CL2 .07 .02 < .001 .05 -.02 .02 .250 -.01 .05 .02 .007 .03 .02 .01 .101 .02 Value → W/S CL3 .10 .02 < .001 .06 -.03 .02 .196 -.02 .02 .02 .280 .01 -.02 .01 .202 -.02 Value → W/S CL4 .09 .02 < .001 .06 -.04 .02 .059 -.02 .01 .02 .783 .00 .01 .01 .361 .01 Openness & Self-Direction Trait → W/S CL1 .18 .04 < .001 .06 -.48 .05 < .001 -.14 .08 .03 < .001 .04 .22 .03 < .001 .12 Trait → W/S CL2 .18 .04 < .001 .06 -.43 .05 < .001 -.13 .04 .02 .082 .02 .28 .03 < .001 .14 Trait → W/S CL3 .10 .04 .025 .03 -.39 .05 < .001 -.12 .07 .03 .007 .03 .22 .03 < .001 .10 Trait → W/S CL4 .05 .04 .231 .02 -.40 .05 < .001 -.12 .10 .03 < .001 .05 .29 .03 < .001 .13

TRAITS, VALUES, AND WELL-BEING
8
Table S6 (Continued)
Positive Affect Negative Affect Life Satisfaction Self-Esteem Trait–Value Pair Unst. SE p St. Unst. SE p St. Unst. SE p St. Unst. SE p St. Value → W/S CL1 .20 .02 < .001 .14 .00 .02 .974 .00 -.01 .02 .636 -.01 .00 .01 .790 .00 Value → W/S CL2 .13 .02 < .001 .09 .00 .02 .892 .00 .05 .02 .006 .03 .04 .01 .001 .04 Value → W/S CL3 .16 .02 < .001 .10 .00 .02 .847 .00 .00 .02 .871 .00 .01 .01 .713 .00 Value → W/S CL4 .23 .02 < .001 .15 -.02 .02 .246 -.01 .02 .02 .315 .01 .01 .01 .375 .01
Note. CL = Cross-lag, Conformity = Restrictive Conformity, SE = Standard error, Unst. = Unstandardized, St. = Standardized, W/S = Well-Being/Self-Esteem.

TRAITS, VALUES, AND WELL-BEING
9
Table S7 Cross-Lagged Parameter Estimates for Personality Traits and Well-Being/Self-Esteem (cf. Figure 4, Paths g and h, and Table 4)
Positive Affect Negative Affect Life Satisfaction Self-Esteem Trait Unst. SE p St. Unst. SE p St. Unst. SE p St. Unst. SE p St. Agreeableness Trait → W/S CL1 .30 .03 < .001 .13 -.40 .04 < .001 -.13 .18 .04 < .001 .06 .29 .03 < .001 .12 Trait → W/S CL2 .25 .03 < .001 .11 -.43 .04 < .001 -.14 .24 .04 < .001 .08 .32 .03 < .001 .14 Trait → W/S CL3 .23 .03 < .001 .11 -.27 .04 < .001 -.10 .21 .04 < .001 .07 .20 .03 < .001 .09 Trait → W/S CL4 .23 .03 < .001 .11 -.39 .04 < .001 -.14 .31 .03 < .001 .10 .27 .03 < .001 .12 W/S → Trait CL1 .06 .01 < .001 .12 -.03 .00 < .001 -.07 .02 .00 < .001 .07 .04 .01 < .001 .10 W/S → Trait CL2 .03 .01 < .001 .06 -.03 .00 < .001 -.08 .01 .00 < .001 .04 .04 .01 < .001 .09 W/S → Trait CL3 .03 .01 < .001 .07 -.02 .00 < .001 -.07 .01 .00 < .001 .04 .05 .01 < .001 .10 W/S → Trait CL4 .03 .01 < .001 .07 -.02 .00 < .001 -.07 .02 .00 < .001 .04 .04 .01 < .001 .10 Conscientiousness Trait → W/S CL1 .38 .03 < .001 .17 -.71 .05 < .001 -.21 .28 .04 < .001 .10 .51 .03 < .001 .23 Trait → W/S CL2 .33 .03 < .001 .16 -.72 .05 < .001 -.23 .31 .03 < .001 .11 .52 .03 < .001 .24 Trait → W/S CL3 .44 .04 < .001 .20 -.64 .05 < .001 -.20 .29 .04 < .001 .10 .44 .04 < .001 .19 Trait → W/S CL4 .39 .03 < .001 .18 -.77 .05 < .001 -.24 .32 .04 < .001 .11 .54 .04 < .001 .24 W/S → Trait CL1 .05 .01 < .001 .11 -.04 .00 < .001 -.12 .04 .00 < .001 .09 .09 .01 < .001 .19 W/S → Trait CL2 .03 .01 < .001 .06 -.03 .00 < .001 -.08 .02 .00 < .001 .07 .08 .01 < .001 .17 W/S → Trait CL3 .02 .01 < .001 .05 -.03 .00 < .001 -.09 .03 .00 < .001 .07 .09 .01 < .001 .20 W/S → Trait CL4 .04 .01 < .001 .08 -.03 .00 < .001 -.10 .03 .00 < .001 .09 .09 .01 < .001 .20 Extraversion Trait → W/S CL1 .28 .02 < .001 .15 -.12 .02 < .001 -.06 .22 .02 < .001 .11 .21 .02 < .001 .16 Trait → W/S CL2 .29 .02 < .001 .16 -.12 .02 < .001 -.07 .21 .02 < .001 .10 .18 .02 < .001 .14 Trait → W/S CL3 .24 .03 < .001 .14 -.09 .02 < .001 -.05 .17 .02 < .001 .09 .18 .02 < .001 .13 Trait → W/S CL4 .31 .02 < .001 .18 -.12 .02 < .001 -.07 .21 .02 < .001 .11 .19 .02 < .001 .15 W/S → Trait CL1 .05 .01 < .001 .08 -.02 .01 < .001 -.03 .04 .01 < .001 .08 .13 .01 < .001 .15 W/S → Trait CL2 .03 .01 < .001 .05 -.02 .01 < .001 -.04 .03 .01 < .001 .06 .10 .01 < .001 .12 W/S → Trait CL3 .02 .01 < .001 .04 -.02 .01 .002 -.03 .03 .01 < .001 .05 .09 .01 < .001 .11 W/S → Trait CL4 .04 .01 < .001 .07 -.02 .01 < .001 -.03 .04 .01 < .001 .07 .08 .01 < .001 .11 Openness Trait → W/S CL1 .23 .04 < .001 .07 -.47 .04 < .001 -.14 .11 .03 < .001 .04 .26 .03 < .001 .13 Trait → W/S CL2 .22 .04 < .001 .07 -.45 .05 < .001 -.13 .09 .03 .002 .04 .28 .03 < .001 .14 Trait → W/S CL3 .14 .05 .002 .04 -.40 .05 < .001 -.12 .10 .03 .002 .04 .23 .03 < .001 .11 Trait → W/S CL4 .15 .04 < .001 .04 -.42 .05 < .001 -.12 .15 .03 < .001 .06 .32 .03 < .001 .15

TRAITS, VALUES, AND WELL-BEING
10
Table S7 (Continued)
Positive Affect Negative Affect Life Satisfaction Self-Esteem Trait Unst. SE p St. Unst. SE p St. Unst. SE p St. Unst. SE p St. W/S → Trait CL1 .03 .00 < .001 .09 -.02 .00 < .001 -.06 .03 .01 < .001 .06 .08 .01 < .001 .15 W/S → Trait CL2 .02 .00 < .001 .05 -.02 .00 < .001 -.05 .01 .00 .102 .02 .05 .01 < .001 .10 W/S → Trait CL3 .02 .00 < .001 .05 -.01 .00 < .001 -.04 .01 .00 .005 .03 .06 .01 < .001 .13 W/S → Trait CL4 .02 .00 < .001 .07 -.01 .00 < .001 -.05 .03 .01 < .001 .07 .07 .01 < .001 .15 Neuroticism Trait → W/S CL1 -.27 .03 < .001 -.14 .67 .03 < .001 .33 -.63 .03 < .001 -.28 -4.08 .17 < .001 -.27 Trait → W/S CL2 -.29 .03 < .001 -.15 .64 .03 < .001 .31 -.63 .03 < .001 -.27 -3.91 .18 < .001 -.26 Trait → W/S CL3 -.27 .03 < .001 -.14 .58 .03 < .001 .30 -.53 .03 < .001 -.24 -3.60 .18 < .001 -.24 Trait → W/S CL4 -.27 .02 < .001 -.15 .60 .03 < .001 .32 -.55 .03 < .001 -.25 -3.52 .17 < .001 -.24 W/S → Trait CL1 -.06 .01 < .001 -.10 .07 .01 < .001 .14 -.10 .01 < .001 -.23 -.02 .00 < .001 -.22 W/S → Trait CL2 -.04 .01 < .001 -.08 .04 .01 < .001 .08 -.06 .01 < .001 -.13 -.02 .00 < .001 -.22 W/S → Trait CL3 -.05 .01 < .001 -.08 .07 .01 < .001 .13 -.07 .01 < .001 -.15 -.02 .00 < .001 -.21 W/S → Trait CL4 -.05 .01 < .001 -.10 .07 .01 < .001 .13 -.08 .01 < .001 -.16 -.01 .00 < .001 -.20
Note. CL = Cross-lag, SE = Standard error, Unst. = Unstandardized, St. = Standardized, W/S = Well-Being/Self-Esteem. The estimates for the Neuroticism–Self Esteem model are from analyses of observed scores because the model using latent scores was non-admissible (see text and Figure S1).

TRAITS, VALUES, AND WELL-BEING
11
Table S8 Cross-Lagged Parameter Estimates for Values and Well-Being/Self-Esteem (cf. Figure 4, Paths g and h, and Table 5)
Positive Affect Negative Affect Life Satisfaction Self-Esteem Value Unst. SE p St. Unst. SE p St. Unst. SE p St. Unst. SE p St. Prosocial Value → W/S CL1 .19 .02 < .001 .13 -.06 .02 < .001 -.04 .04 .01 .009 .03 .06 .01 < .001 .06 Value → W/S CL2 .14 .02 < .001 .09 -.08 .02 < .001 -.06 .08 .02 < .001 .06 .06 .01 < .001 .06 Value → W/S CL3 .16 .02 < .001 .11 -.07 .02 < .001 -.05 .04 .02 .017 .03 .04 .01 .003 .04 Value → W/S CL4 .21 .02 < .001 .13 -.08 .02 < .001 -.06 .08 .02 < .001 .05 .05 .01 < .001 .04 W/S → Value CL1 .09 .01 < .001 .14 -.04 .01 < .001 -.05 .07 .01 < .001 .09 .12 .02 < .001 .10 W/S → Value CL2 .08 .01 < .001 .11 -.06 .01 < .001 -.07 .06 .01 < .001 .08 .15 .01 < .001 .14 W/S → Value CL3 .08 .01 < .001 .13 -.07 .01 < .001 -.09 .05 .01 < .001 .07 .14 .01 < .001 .14 W/S → Value CL4 .09 .01 < .001 .15 -.05 .01 < .001 -.07 .06 .01 < .001 .09 .16 .01 < .001 .17 Restrictive Conformity Value → W/S CL1 .18 .01 < .001 .18 .00 .01 .876 .00 .03 .01 .026 .02 .03 .01 < .001 .05 Value → W/S CL2 .13 .01 < .001 .13 -.02 .01 .079 -.02 .05 .01 < .001 .05 .03 .01 < .001 .04 Value → W/S CL3 .17 .02 < .001 .16 -.02 .01 .248 -.02 .02 .01 .087 .02 .02 .01 .009 .03 Value → W/S CL4 .19 .02 < .001 .18 -.02 .01 .115 -.02 .04 .01 .003 .03 .03 .01 < .001 .04 W/S → Value CL1 .14 .01 < .001 .13 -.02 .01 .206 -.01 .06 .01 < .001 .07 .13 .02 < .001 .08 W/S → Value CL2 .10 .01 < .001 .10 -.01 .01 .479 -.01 .04 .01 < .001 .05 .13 .02 < .001 .08 W/S → Value CL3 .11 .01 < .001 .12 -.03 .01 .019 -.03 .07 .01 < .001 .08 .15 .02 < .001 .10 W/S → Value CL4 .14 .01 < .001 .15 -.04 .01 .002 -.04 .07 .01 < .001 .08 .19 .02 < .001 .14 Enjoyment Value → W/S CL1 .16 .02 < .001 .11 -.05 .02 .009 -.03 .07 .02 < .001 .05 .12 .01 < .001 .11 Value → W/S CL2 .13 .02 < .001 .09 -.07 .02 < .001 -.04 .10 .02 < .001 .07 .07 .02 < .001 .06 Value → W/S CL3 .15 .02 < .001 .11 -.06 .02 .003 -.04 .07 .02 < .001 .04 .02 .02 .100 .02 Value → W/S CL4 .15 .02 < .001 .11 -.07 .02 < .001 -.05 .06 .02 < .001 .04 .06 .01 < .001 .06 W/S → Value CL1 .11 .01 < .001 .15 -.03 .01 < .001 -.05 .09 .01 < .001 .13 .18 .02 < .001 .18 W/S → Value CL2 .08 .01 < .001 .11 -.05 .01 < .001 -.07 .07 .01 < .001 .11 .18 .01 < .001 .19 W/S → Value CL3 .09 .01 < .001 .12 -.03 .01 < .001 -.05 .07 .01 < .001 .10 .16 .01 < .001 .18 W/S → Value CL4 .10 .01 < .001 .14 -.05 .01 < .001 -.07 .08 .01 < .001 .12 .18 .01 < .001 .21 Self-Direction Value → W/S CL1 .23 .02 < .001 .17 -.06 .02 < .001 -.04 .02 .02 .280 .01 .09 .01 < .001 .09 Value → W/S CL2 .16 .02 < .001 .12 -.06 .02 .001 -.04 .06 .02 < .001 .04 .08 .01 < .001 .08 Value → W/S CL3 .17 .02 < .001 .12 -.04 .02 .021 -.03 .02 .02 .256 .01 .04 .01 .006 .03 Value → W/S CL4 .25 .02 < .001 .18 -.07 .02 < .001 -.05 .06 .02 < .001 .04 .06 .01 < .001 .05

TRAITS, VALUES, AND WELL-BEING
12
Table S8 (Continued)
Positive Affect Negative Affect Life Satisfaction Self-Esteem Value Unst. SE p St. Unst. SE p St. Unst. SE p St. Unst. SE p St. W/S → Value CL1 .14 .01 < .001 .19 -.03 .01 < .001 -.04 .06 .01 < .001 .08 .17 .02 < .001 .16 W/S → Value CL2 .10 .01 < .001 .14 -.04 .01 < .001 -.06 .04 .01 < .001 .06 .17 .02 < .001 .17 W/S → Value CL3 .12 .01 < .001 .17 -.05 .01 < .001 -.07 .05 .01 < .001 .08 .18 .01 < .001 .20 W/S → Value CL4 .14 .01 < .001 .20 -.06 .01 < .001 -.08 .07 .01 < .001 .09 .20 .01 < .001 .22 Maturity Value → W/S CL1 .23 .02 < .001 .17 -.02 .02 .347 -.01 .03 .02 .109 .02 .09 .01 < .001 .10 Value → W/S CL2 .18 .02 < .001 .13 -.02 .02 .352 -.01 .07 .02 < .001 .04 .06 .01 < .001 .06 Value → W/S CL3 .18 .02 < .001 .12 -.01 .02 .818 .00 .02 .02 .298 .01 .02 .01 .182 .02 Value → W/S CL4 .27 .02 < .001 .19 -.08 .02 .001 -.04 .07 .02 < .001 .04 .07 .01 < .001 .07 W/S → Value CL1 .13 .01 < .001 .19 .00 .01 .590 -.01 .07 .01 < .001 .10 .20 .02 < .001 .17 W/S → Value CL2 .10 .01 < .001 .13 -.03 .01 < .001 -.05 .07 .01 < .001 .11 .21 .02 < .001 .19 W/S → Value CL3 .10 .01 < .001 .14 -.03 .01 < .001 -.06 .06 .01 < .001 .09 .20 .02 < .001 .20 W/S → Value CL4 .12 .01 < .001 .16 -.03 .01 .002 -.04 .06 .01 < .001 .09 .22 .02 < .001 .22 Security Value → W/S CL1 .25 .02 < .001 .14 -.11 .02 < .001 -.07 .06 .02 .002 .04 .11 .02 < .001 .10 Value → W/S CL2 .21 .02 < .001 .13 -.13 .02 < .001 -.09 .10 .02 < .001 .06 .10 .02 < .001 .08 Value → W/S CL3 .24 .03 < .001 .14 -.09 .02 < .001 -.07 .05 .02 .005 .04 .04 .01 .005 .04 Value → W/S CL4 .31 .03 < .001 .17 -.14 .02 < .001 -.09 .09 .02 < .001 .05 .10 .02 < .001 .08 W/S → Value CL1 .11 .01 < .001 .17 -.05 .01 < .001 -.07 .08 .01 < .001 .12 .16 .02 < .001 .16 W/S → Value CL2 .08 .01 < .001 .13 -.06 .01 < .001 -.09 .08 .01 < .001 .12 .18 .02 < .001 .18 W/S → Value CL3 .09 .01 < .001 .15 -.08 .01 < .001 -.13 .08 .01 < .001 .13 .19 .02 < .001 .22 W/S → Value CL4 .12 .01 < .001 .22 -.05 .01 < .001 -.09 .06 .01 < .001 .12 .20 .01 < .001 .26 Achievement Value → W/S CL1 .32 .03 < .001 .19 .12 .03 < .001 .06 .07 .02 .003 .04 .08 .02 < .001 .06 Value → W/S CL2 .22 .03 < .001 .13 .09 .02 < .001 .05 .07 .02 < .001 .04 .03 .02 .033 .03 Value → W/S CL3 .24 .03 < .001 .15 .09 .02 < .001 .05 .01 .02 .763 .00 .01 .02 .680 .01 Value → W/S CL4 .31 .03 < .001 .19 .07 .02 .002 .04 .05 .02 .038 .02 .04 .02 .012 .03 W/S → Value CL1 .09 .01 < .001 .15 .03 .01 < .001 .06 .03 .01 < .001 .06 .06 .01 < .001 .07 W/S → Value CL2 .06 .01 < .001 .10 .01 .01 .460 .01 .03 .01 < .001 .06 .07 .01 < .001 .08 W/S → Value CL3 .07 .01 < .001 .11 .02 .01 .002 .04 .03 .01 < .001 .05 .06 .01 < .001 .07 W/S → Value CL4 .09 .01 < .001 .14 .02 .01 .030 .03 .04 .01 < .001 .07 .08 .01 < .001 .10
Note. CL = Cross-lag, SE = Standard error, Unst. = Unstandardized, St. = Standardized, W/S = Well-Being/Self-Esteem.

TRAITS, VALUES, AND WELL-BEING
13
Table S9 Univariate Stability Models of Well-Being and Self-Esteem (Estimated as in Figure 1) Model Fit Stability Coefficients χ2 df TLI CFI RMSEA T1 T2 T3 T4 T5 Positive Affect 39.650 15 .998 1 .012 .71 .68 .69 .66 .66 Negative Affect 46.413 15 .998 .999 .013 .70 .67 .66 .66 .65 Life Satisfaction 201.714 15 .988 .997 .032 .73 .68 .68 .66 .65 Self-Esteem 141.353 15 .989 .997 .026 .80 .76 .73 .69 .70 Note. T1 to T5 = Measurement time points.

TRAITS, VALUES, AND WELL-BEING
14
Figure S1. Model for Neuroticism and self-esteem in observed scores. Paths g and h denote the cross-lagged effects of Neuroticism and self-esteem, respectively.

[Correction Notice: An Erratum for this article was reported online in Journal of Personality and Social
Psychology on Apr 4 2019 (see record 2019-18472-001). In the article, the stability model is referred to
incorrectly as trait-state error model in the abstract, twice in the main body of the article, and in the
Table 2 Note. Corrected versions of the fourth sentence in the abstract, the first sentence of the Analysis
Outline section, and the first sentence of the Table 2 Note are provided in the erratum. The Kenny &
Zautra (1995) reference has been deleted from the text and References list, and Steyer & Schmitt (1994)
was added to the text and References list. All versions of this article have been corrected.]