Embed Size (px)
Citation preview

The Long-Term Squeeze on Municipal Finances
Massachusetts Association of School Business Officials
Michael J. Widmer, PresidentMassachusetts Taxpayers Foundation
February 10, 2014

Economic Context
2

Challenges to Economic Growth
• Stagnant employment growth since 2001• Rapidly aging population• Workforce will begin to decline in 2015• High business costs
– Regulations / Permitting– Unemployment insurance– Energy– Health care– DOR tax policies
3

2001
Q1
2001
Q3
2002
Q1
2002
Q3
2003
Q1
2003
Q3
2004
Q1
2004
Q3
2005
Q1
2005
Q3
2006
Q1
2006
Q3
2007
Q1
2007
Q3
2008
Q1
2008
Q3
2009
Q1
2009
Q3
2010
Q1
2010
Q3
2011
Q1
2011
Q3
2012
Q1
2012
Q3
2013
Q1
2013
Q33,000
3,100
3,200
3,300
3,400
3,500
3,600
Actual US Average
In T
hou
san
ds
MA Employs 60,000 Fewer Today Than in 2001; Would Have 180,000 More Jobs if MA Had Grown at US
Rate
4
3,382
3,354-1.8%
Source: U.S. Bureau of Labor Statistics
3,5343.4%

180,000 More Jobs Would Have Generated $700 Million in
Additional Income Tax Revenues in FY 13
5
Avg. Income Tax / Employee
Additional Employees
Additional Income Taxes
FY 13 3,942 180,000 709,631,935

1980Q11983Q11986Q11989Q11992Q11995Q11998Q12001Q12004Q12007Q12010Q12013Q1200
250
300
350
400
450
500
550
600
650
700
Actual US Average
In T
hou
san
ds
MA Manufacturing Employment Declines 60 Percent; Difference Has
Cost MA 150,000 Jobs
6
Down 60% since 1980
Source: Moody’s Analytics, January 6, 2014
Down 37.8% since 1980
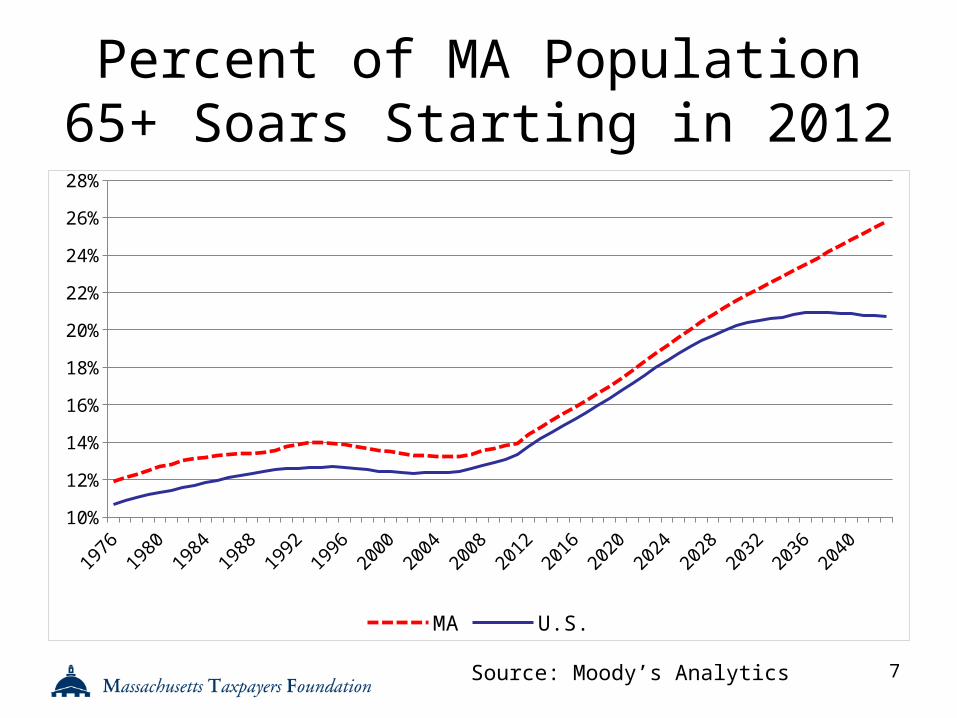
Percent of MA Population 65+ Soars Starting in 2012
7Source: Moody’s Analytics
1976
1979
1982
1985
1988
1991
1994
1997
2000
2003
2006
2009
2012
2015
2018
2021
2024
2027
2030
2033
2036
2039
2042
10%
12%
14%
16%
18%
20%
22%
24%
26%
28%
MA U.S.

Massachusetts’ Work Age Population (15 – 64) Peaks in
2015
8
1976
1979
1982
1985
1988
1991
1994
1997
2000
2003
2006
2009
2012
2015
2018
2021
2024
2027
2030
2033
2036
2039
2042
3,500
3,700
3,900
4,100
4,300
4,500
4,700
Th
ou
san
ds
Source: Moody’s Analytics

U.S. Work Age Population (15 – 64) Continues to Grow
9Source: Moody’s Analytics
1976
1979
1982
1985
1988
1991
1994
1997
2000
2003
2006
2009
2012
2015
2018
2021
2024
2027
2030
2033
2036
2039
2042
120
140
160
180
200
220
240
260
Mil
lion
s

State Finances Will Continue to Challenge Lawmakers

Tight Budgets for the Foreseeable Future
• Revenue growth less than 5 percent annually over the next decade
• Growth in major obligations exceeds revenue growth– Medicaid– Debt service– Employee benefits
• Curtailed federal spending over the next 10 years through ACA and sequestration (recently postponed by the budget agreement for two years until 2016)– Medicare ~ $7.3 billion– NIH ~ $1 billion– Defense ~ $6 billion 11

State Facing Sustained Period of Slower Revenue Growth
12
2000 2001 2002 2003 2004 2005 2006 2007 2008 2009 2010 2011 2012 2013 2014 2015 2016 2017 2018
-20%
-15%
-10%
-5%
0%
5%
10%
15%

Health Care and Employee Benefits Consume 85 Percent of Increased
Spending Since 2008
13
Hea
lth C
are
Empl
oyee
Ben
efits
Capita
l Sup
port
Trans
portat
ion
Hum
an S
ervice
s
Local
Gov
ernm
ent S
uppo
rt
Other
Edu
catio
n
Public
Saf
ety
Econo
mic D
evelop
men
t
Other
/Gen
eral
Gov
ernm
ent
CPI-10%
0%
10%
20%
30%
40%
50%
60%
70%
80%
The Long-Term Squeeze in Municipal Finances

Municipalities in Longest Period of Slow Growth in Prop
2 ½ Era
15
-2%
0%
2%
4%
6%
8%
10%
12% Average Annual Growth:
4.8%
Annual Municipal Revenue Growth(all sources)
Annual Revenue GrowthAverage Annual Growth FY1983 - FY2013
Fiscal Year

Property Taxes Grew at Slowest Rate Since 1985
• Property taxes account for half of all municipal revenues and increased by just 3.6 percent in 2013, from $13 billion to $13.4 billion.
16
0.0%
1.0%
2.0%
3.0%
4.0%
5.0%
6.0%
7.0%
8.0%
9.0% Annual Property Tax Growth, 1985 to 2013
From 1993 to 1997, state aid grew an average of 8.3% annually
In contrast, from 2009 to 2013, state aid dropped an aver-age of -0.4% annually
Average Annual Property Tax Growth, 1985 – 2012: 5.4%
Note: Proposition 2 ½ was not fully implemented until 1984, so growth for 1982 to 1984 is excluded for the graph.

Slow Recovery Is Limiting Increases in State Aid
• After years of cuts, the rebound in state aid lags that of other economic recoveries.
17
1985
1987
1989
1991
1993
1995
1997
1999
2001
2003
2005
2007
2009
2011
2013
-15.0%
-10.0%
-5.0%
0.0%
5.0%
10.0%
15.0%
20.0%Annual Change in State Aid, 1985 to 2014
After 3 years of cuts, state aid rebounded with 6.5% growth in 1993
After 2 years of cuts state aid grew by 4.4% in 2005
After 3 years of cuts state aid grew by 3.0% in 2012

Municipalities Face Enormous Unfunded Retiree Liabilities
18
2012 Unfunded Liability
($ billions)
2012 Total
Liability($ billions)
Funded Ratio
Municipal Pensions $13.2 $32.0 58.5%
Municipal Retiree Health Care $30.0 $30.0 <1.0%
Total, Retiree Benefits $43.2 $62.0 30.2%

Spending on Benefits and Debt is Crowding Out Basic
Services• Municipalities find themselves in a long-term
budget squeeze because the costs for pensions, employee and retiree health care, and debt service are rising faster than revenues.
19
Growth, 2007 to 2012
Revenues, 13.1%
All Other Health Care Debt Service Pension0%
5%
10%
15%
20%
25%
30%
35%
10.1%
18.5%
23.3%
29.8%

Debt Service Costs Grew Twice as Fast as Other
Spending• Debt service costs grew by 23
percent between fiscal 2007 and 2012, totaling $2.26 billion in 2012.
• Municipalities hold more than $12.7 billion in outstanding debt—almost as much as their unfunded pension liabilities. This is principal only and does not include interest costs.
20

Municipal Workforce Is Shrinking
• Municipalities have eliminated more than 15,500 full time positions, or six percent, since 2007.
21
FYTotal Municipal
FTEs2007 265,042
2008 261,835
2009 258,971
2010 252,613
2011 250,894
2012 249,472
Change -15,570
Source: Massachusetts Division of Local Services data

Despite Billions in Contributions, Little Progress in Funding Pensions
• In 2012, the state’s 99 local pension systems had approximately $13.2 billion in unfunded liabilities, compared to $13.5 billion in 2000.
• Municipal pensions were just 58.5 percent funded in 2012, compared to 59 percent in 2000. Of the 99 systems, 97 are below 80 percent funded and 26 are less than 50 percent funded.
• The lack of progress can be attributed to several factors:– Benefit enhancements– Weak investment returns– Extending funding schedules– Minimal savings from 2011 pension reform
22

23
2011 Pension Reforms Apply Only toNew Hires; Provide Minimal Savings• Pension reforms (in present value terms) will
save municipalities only $500 million out of a total liability of $35 billion, or roughly 1.5 percent.
• Savings are small because the pension reforms apply only to new hires (beginning April 2012):– Raises the minimum retirement age from 55 to 60 and
the full retirement age from 65 to 67 for most employees.
– Lengthens the period for calculating the pension benefit from three years to five years.
– Reduces the incentive to retire early by adjusting the benefit scale so that it mirrors Social Security’s benefit neutrality.

The Retiree Health Care Challenge
• Municipalities have $30 billion in retiree health care liabilities—99 percent unfunded.– This is what cities and towns must
pay in today’s dollars for the lifetime health care benefits already earned by current employees and retirees.
24

The Retiree Health Care Challenge
• Rather than paying down liabilities as they are doing with pensions, municipalities have opted to pay-as-you-go.
• Cities and towns spent an estimated $800 million on retiree health care benefits in fiscal 2012, almost equal to unrestricted (general government) aid.
• Without change, spending is expected to grow to $1.5 billion in 10 years.
25

Huge Increase in Property Taxes Required to Fund Retiree Health
Care(single family homes)
26
Municipality
ARC Shortfall($1,000s)
Total Residential
Share of ARC
Shortfall($1,000s)
Single Family Property Share
of Shortfall($1,000s)
Tax Bill Increase
Per Single Family
PropertyAverage Tax Bill
Tax Bill Increase
Brockton $36,983 $24,179 $17,332 $1,057 $2,954 36%Fitchburg 8,243 6,186 3,812 591 2,820 21%Haverhill 4,947 3,691 2,279 223 3,648 6%Holyoke 13,015 6,558 4,208 793 2,915 27%Lawrence 25,011 14,875 5,155 1,209 2,397 50%Lowell 23,261 16,106 8,407 714 3,205 22%New Bedford 21,352 14,468 7,805 633 2,762 23%Pittsfield 7,975 5,162 3,961 351 2,795 13%Springfield 18,551 11,197 7,655 294 2,638 11%Worcester 32,362 20,229 12,167 490 3,307 15%Total $191,699 $122,649 $72,781 $565 N/A N/A
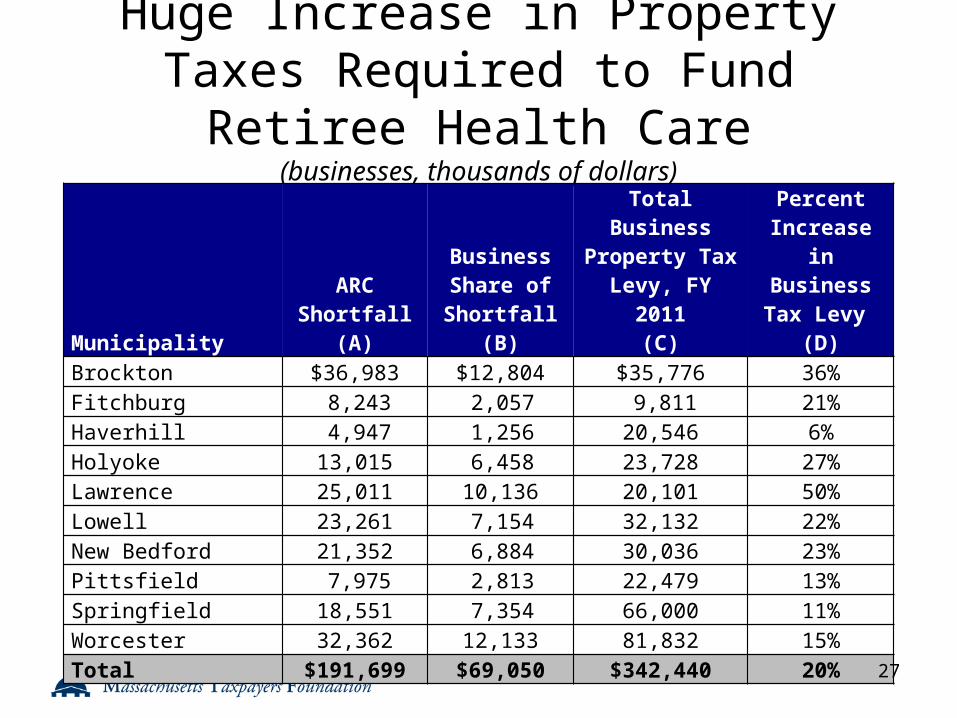
Huge Increase in Property Taxes Required to Fund Retiree Health
Care(businesses, thousands of dollars)
Municipality
ARC Shortfall
(A)
Business Share of Shortfall
(B)
Total Business Property Tax Levy, FY 2011
(C)
Percent Increase in
Business Tax Levy (D)
Brockton $36,983 $12,804 $35,776 36%
Fitchburg 8,243 2,057 9,811 21%
Haverhill 4,947 1,256 20,546 6%
Holyoke 13,015 6,458 23,728 27%
Lawrence 25,011 10,136 20,101 50%
Lowell 23,261 7,154 32,132 22%
New Bedford 21,352 6,884 30,036 23%
Pittsfield 7,975 2,813 22,479 13%
Springfield 18,551 7,354 66,000 11%
Worcester 32,362 12,133 81,832 15%
Total $191,699 $69,050 $342,440 20%27

The Need for Urgent Action
• The longer that retiree health care obligations go unaddressed, the more severe the consequences for retirees.
• As with municipal health reform, even with changes in eligibility and benefits, retirees would still receive a very generous benefit.
28