Embed Size (px)
Citation preview

The Long Run Impact of Bombing Vietnam♦
Edward Miguel * Gérard Roland **
This draft: October 2009 First draft: January 2005
Abstract: We investigate the impact of U.S. bombing on later economic development in Vietnam. The Vietnam War featured the most intense bombing campaign in military history and had massive humanitarian costs. We use a unique U.S. military dataset containing bombing intensity at the district level (N=584) to assess whether the war damage led to persistent local poverty traps. We compare the heavily bombed districts to other districts controlling for district demographic and geographic characteristics, and use an instrumental variable approach exploiting distance to the 17th parallel demilitarized zone. U.S. bombing does not have negative impacts on local poverty rates, consumption levels, infrastructure, literacy or population density through 2002. This finding indicates that even the most intense bombing in human history did not generate local poverty traps in Vietnam.
♦ We are grateful to Vietnam Veterans of America Foundation (VVAF), the Defense Security Cooperation Agency (DSCA), and the Technology Center for Bomb and Mine Disposal, Vietnam Ministry of Defense (BOMICO) for providing access to the U.S. military data, and in particular to Major Patrick Keane, Benjamin Reich, Michael Sheinkman, Bill Shaw, and Tom Smith. Pamela Jakiela, Melissa Knox, Khuyen Nguyen, Rachel Polimeni, Monika Shah and especially Paul Cathcart have provided splendid research assistance. We are also grateful to Fred Brown, Jim Fearon, Raquel Fernandez, Scott Gartner, Steve Helfand, Chang-Tai Hsieh, Chad Jones, Dean Karlan, David Laitin, Adam Przeworski, Martin Ravallion, Debraj Ray, John Strauss and to numerous seminar participants at Harvard / MIT, ECARES-ULB, the 2005 ASSA Meetings, U.C. Riverside, U.C. Berkeley, University of British Columbia, the Pacific Development Conference, University of Michigan, Center for Global Development, Stanford University, the MacArthur Inequality Network, BREAD-CEPR Conference, Economic History Association Meetings, NYU, Cornell, and Yale, and two anonymous referees and the editor (Mark Rosenzweig), for useful comments. * Department of Economics, University of California, Berkeley and NBER (email: [email protected], phone: 1-510-642-7162, fax: 1-510-642-6615) ** Department of Economics, University of California, Berkeley and CEPR (email: [email protected], phone: 1-510-642-4321, fax: 1-510-642-6615)
1
1. Introduction
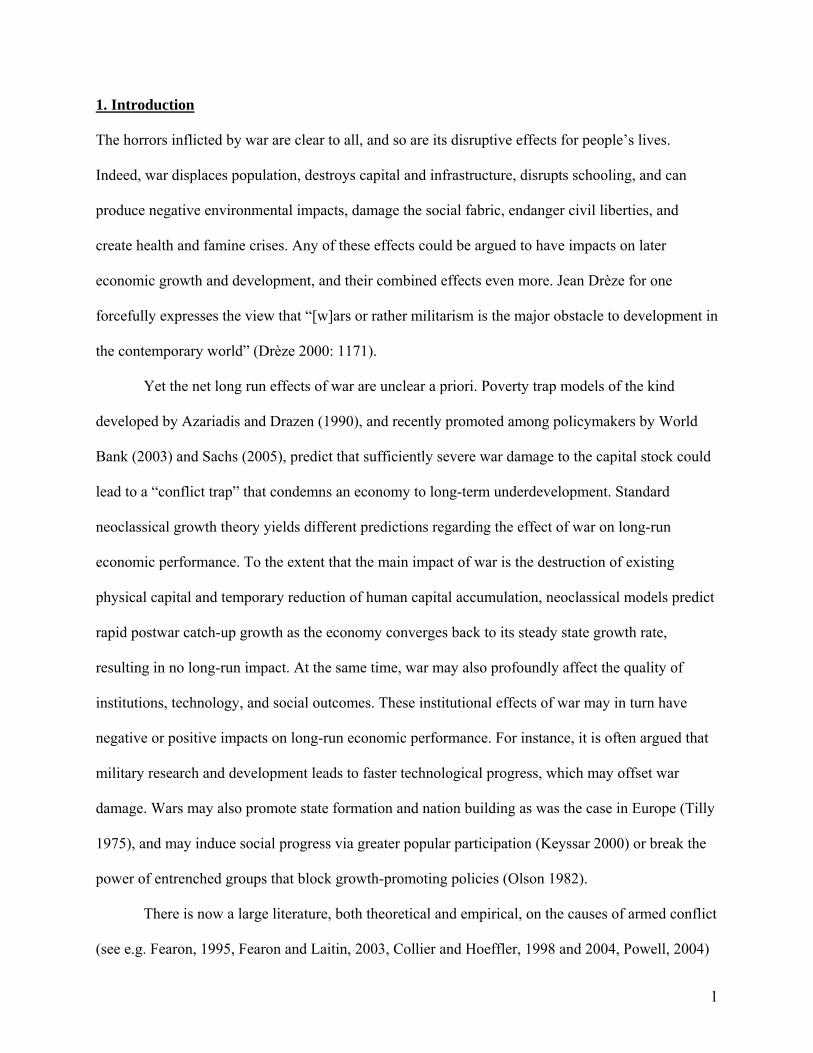
The horrors inflicted by war are clear to all, and so are its disruptive effects for people’s lives.
Indeed, war displaces population, destroys capital and infrastructure, disrupts schooling, and can
produce negative environmental impacts, damage the social fabric, endanger civil liberties, and
create health and famine crises. Any of these effects could be argued to have impacts on later
economic growth and development, and their combined effects even more. Jean Drèze for one
forcefully expresses the view that “[w]ars or rather militarism is the major obstacle to development in
the contemporary world” (Drèze 2000: 1171).
Yet the net long run effects of war are unclear a priori. Poverty trap models of the kind
developed by Azariadis and Drazen (1990), and recently promoted among policymakers by World
Bank (2003) and Sachs (2005), predict that sufficiently severe war damage to the capital stock could
lead to a “conflict trap” that condemns an economy to long-term underdevelopment. Standard
neoclassical growth theory yields different predictions regarding the effect of war on long-run
economic performance. To the extent that the main impact of war is the destruction of existing
physical capital and temporary reduction of human capital accumulation, neoclassical models predict
rapid postwar catch-up growth as the economy converges back to its steady state growth rate,
resulting in no long-run impact. At the same time, war may also profoundly affect the quality of
institutions, technology, and social outcomes. These institutional effects of war may in turn have
negative or positive impacts on long-run economic performance. For instance, it is often argued that
military research and development leads to faster technological progress, which may offset war
damage. Wars may also promote state formation and nation building as was the case in Europe (Tilly
1975), and may induce social progress via greater popular participation (Keyssar 2000) or break the
power of entrenched groups that block growth-promoting policies (Olson 1982).
There is now a large literature, both theoretical and empirical, on the causes of armed conflict
(see e.g. Fearon, 1995, Fearon and Laitin, 2003, Collier and Hoeffler, 1998 and 2004, Powell, 2004)

2
but the long run economic impacts of war remain largely unexplored empirically (as discussed in
Blattman and Miguel 2009), and this is so for several reasons. One important issue is the difficulty of
convincingly identifying war impacts on economic growth in the presence of dual causality between
violence and economic conditions, and possible omitted variable biases (Miguel et al 2004). But a
perhaps even more fundamental constraint for empirical work is the lack of data on war damage and
economic conditions in conflict and post-conflict societies.
In this paper we exploit a data-rich historical episode to estimate bombing impacts on long-
run economic performance, the U.S. bombing of Vietnam (what Vietnamese call “the American
War”). The Indochina War, centered in Vietnam, was the most intense aerial bombing episode in
history (Clodfelter 1995):
“The United States Air Force dropped in Indochina, from 1964 to August 15, 1973, a total of 6,162,000 tons of bombs and other ordnance. U.S. Navy and Marine Corps aircraft expended another 1,500,000 tons in Southeast Asia. This tonnage far exceeded that expended in World War II and in the Korean War. The U.S. Air Force consumed 2,150,000 tons of munitions in World War II – 1,613,000 tons in the European Theater and 537,000 tons in the Pacific Theater – and 454,000 tons in the Korean War.”
Vietnam War bombing thus represented at least three times as much (by weight) as both European
and Pacific theater World War II bombing combined, and about fifteen times total tonnage in the
Korean War. Given the prewar Vietnamese population of 32 million, U.S. bombing translates into
hundreds of kilograms of explosives per capita, more than the entire weight of the Vietnamese
nation. For another comparison, the atomic bombs dropped at Hiroshima and Nagasaki had the
power of roughly 15,000 and 20,000 tons of TNT, respectively (Grolier 1995). Since general purpose
bombs – by far the most common type of bomb used in Vietnam – are approximately 50% explosive
material by weight, each atomic bomb translates into roughly 30,000 to 40,000 tons of such
munitions. Measured this way, U.S. bombing in Indochina represents roughly 100 times the
combined impact of the Hiroshima and Nagasaki atomic bombs.

3
We employ an unusual United States military district-level dataset on bombs, missiles,
rockets and other ordnance dropped in Vietnam. The U.S. bombing of Vietnam was largely
concentrated in a subset of regions: roughly 70% of total ordnance was dropped in only 10% of the
584 sample districts. Figure 1 highlights the 10% most heavily bombed districts.
The heaviest bombing took place in Quang Tri province in the central region of the country
near the 17th parallel, the former border between North Vietnam and South Vietnam. The province is
the geographic unit above the district. Quang Tri province was basically bombed flat during the war,
with most of its capital and infrastructure destroyed: only 11 of 3,500 Quang Tri villages were left
unbombed by the end of the war (Project RENEW Report 2004: 3). Provinces immediately north and
south of Quang Tri also received heavy U.S. bombing, although less than Quang Tri itself. Coastal
regions of North Vietnam and some districts of Hanoi were heavily bombed, as was the region near
Saigon adjacent to Cambodia. This region was the site of frequent incursions by North Vietnam
Army and NLF/Vietcong troops into South Vietnam through the so-called Ho Chi Minh Trail that ran
through Laos and Cambodia.
There are many a priori reasons U.S. bombing could have long-run impacts on Vietnamese
economic development. First, the destruction of local physical infrastructure may have inhibited
commerce and changed later investment patterns. For instance, U.S. bombing during the Rolling
Thunder campaign of the late 1960s “destroyed 65 percent of the North's oil storage capacity, 59
percent of its power plants, 55 percent of its major bridges” (Clodfelter 1995: 134).1 Second, U.S.
bombing displaced population and this could potentially have reduced local economic activity if
many individuals never returned. Third, population displacement and the destruction of physical
infrastructure – including classrooms – disrupted schooling for millions, affecting human capital
accumulation. In terms of other possible factors, we do not have complete information on
unexploded ordnance (UXO), landmines or Agent Orange use, and unfortunately cannot focus on 1 See Tilford (1991: 155) for further details on the extent of U.S. bombing damage.

4
these in the main empirical analysis (however, there is obviously a strong correlation between
bombing and later UXO density).2 Vietnam in the 1960s and 1970s was society where one might
intuitively expect a poverty trap model to be quite empirically relevant: at the start of the war in the
1960s, Vietnam was already one of the world’s poorest countries, and it was subject to massive
devastation by American bombs, pushing income levels even lower.
We compare the predictions of the neoclassical Solow growth model to a modified
theoretical framework including a poverty trap in analyzing the long run impacts of bombing
Vietnam. In the neoclassical model, a heavily bombed region eventually returns to steady state
economic performance despite the initial destruction of its capital stock. In contrast, if the bombing
shock makes the region “too poor” to save and invest, a poverty trap model would predict that a
region’s income per capita would be permanently depressed. However, we show that a local poverty
trap would only result under very specific conditions that would not generally hold. If there is factor
mobility across regions of a country, for instance, we would observe economic convergence across
the regions bombed and those that were not, even in the poverty trap framework. Poverty traps would
also be averted by government redistribution of capital towards poorer regions, lifting them above the
poverty trap threshold, and thus ultimately generating sustained saving, investment and growth.
In the empirical analysis we find no robust adverse impacts of U.S. bombing on poverty
rates, consumption levels, electricity infrastructure, literacy, or population density through 2002, and
these results are consistent across a variety of specifications and samples. There is a moderate
negative effect of U.S. bombing on consumption levels through 1992/1993 but also faster
consumption growth between 1992/1993 and 2002, suggesting that any negative short-run war
2 UXOs as well as landmines can impair the use of agricultural land and are expensive to find and remove. While UXOs and landmines can seriously hurt farming families when an income earner is victimized, UXO and landmine injury rates in Vietnam during the 1980s and 1990s declined rapidly relative to the immediate postwar years (Project RENEW report 2004: 16-18). The chemical agents used by the U.S. could also generate long term damage to population health and land. The best known, Agent Orange, is a defoliant containing dioxins, and as late as 2001 traces of dioxins specific to Agent Orange were still found in human blood in some areas. Deforestation itself could also negatively affect the environment and agriculture by increasing soil instability and affecting wildlife.
5
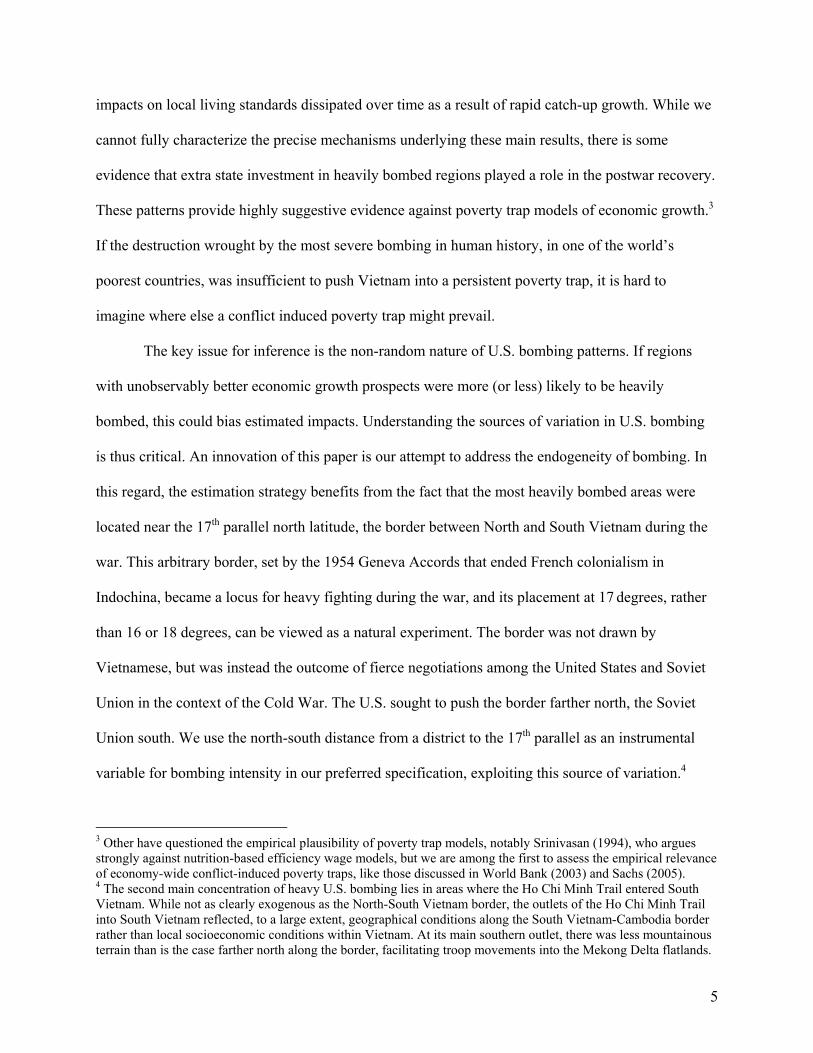
impacts on local living standards dissipated over time as a result of rapid catch-up growth. While we
cannot fully characterize the precise mechanisms underlying these main results, there is some
evidence that extra state investment in heavily bombed regions played a role in the postwar recovery.
These patterns provide highly suggestive evidence against poverty trap models of economic growth.3
If the destruction wrought by the most severe bombing in human history, in one of the world’s
poorest countries, was insufficient to push Vietnam into a persistent poverty trap, it is hard to
imagine where else a conflict induced poverty trap might prevail.
The key issue for inference is the non-random nature of U.S. bombing patterns. If regions
with unobservably better economic growth prospects were more (or less) likely to be heavily
bombed, this could bias estimated impacts. Understanding the sources of variation in U.S. bombing
is thus critical. An innovation of this paper is our attempt to address the endogeneity of bombing. In
this regard, the estimation strategy benefits from the fact that the most heavily bombed areas were
located near the 17th parallel north latitude, the border between North and South Vietnam during the
war. This arbitrary border, set by the 1954 Geneva Accords that ended French colonialism in
Indochina, became a locus for heavy fighting during the war, and its placement at 17 degrees, rather
than 16 or 18 degrees, can be viewed as a natural experiment. The border was not drawn by
Vietnamese, but was instead the outcome of fierce negotiations among the United States and Soviet
Union in the context of the Cold War. The U.S. sought to push the border farther north, the Soviet
Union south. We use the north-south distance from a district to the 17th parallel as an instrumental
variable for bombing intensity in our preferred specification, exploiting this source of variation.4
3 Other have questioned the empirical plausibility of poverty trap models, notably Srinivasan (1994), who argues strongly against nutrition-based efficiency wage models, but we are among the first to assess the empirical relevance of economy-wide conflict-induced poverty traps, like those discussed in World Bank (2003) and Sachs (2005). 4 The second main concentration of heavy U.S. bombing lies in areas where the Ho Chi Minh Trail entered South Vietnam. While not as clearly exogenous as the North-South Vietnam border, the outlets of the Ho Chi Minh Trail into South Vietnam reflected, to a large extent, geographical conditions along the South Vietnam-Cambodia border rather than local socioeconomic conditions within Vietnam. At its main southern outlet, there was less mountainous terrain than is the case farther north along the border, facilitating troop movements into the Mekong Delta flatlands.

6
One limitation is that while this econometric strategy provides estimates of differences across
districts, the approach is unable to capture aggregate nation-wide effects of the war on Vietnamese
development. The counterfactual – Vietnamese economic performance in the absence of the
“American War” – cannot be observed or estimated. This is potentially important to the extent that
the war led to major institutional and social changes, or if the cross-region spillovers of the war
within Vietnam were large. Still the rapid rate of economic growth in Vietnam since the early 1990s
– at 6% on average between 1993 and 2003 (World Bank 2004) – indicates that any nation-wide war
impacts on economic growth rates were not persistently negative, and did not generate a national
level poverty trap. Note that the within-country empirical approach adopted in this paper also has
merits. Exploiting the common data sources and postwar institutions and policies across Vietnamese
regions allows us to pinpoint local economic impacts of bombing more precisely than is possible in
cross-country analyses, where controlling for national trends and institutions is more problematic.
In related work, Davis and Weinstein (2002) show that the U.S. bombing of Japanese cities in
World War II had no long run impact on the population of those cities relative to prewar levels, and
Brakman et al. (2004) find a similar result for postwar Germany. Organski and Kugler (1977, 1980)
find that the economic effects of the two world wars tended to dissipate after only 15-20 years
(similar to our post-war timeframe of roughly 25 years), for both capitalist and socialist economies,
after which there was a return to prewar growth trends. Przeworski et al. (2000) similarly find rapid
postwar recovery in a cross-country analysis.
We view our results as complementary to these earlier studies. We are able to measure the
long run impact of bombing on a larger set of outcomes than other studies, which either only focus
on population effects or on aggregate growth. By examining the effect of bombing on (i) variables
that are central to leading economic growth theoretical models– physical capital, human capital and
population – and on (ii) variables that relate directly to human welfare, including poverty rates and
consumption, we believe that we paint a broader picture of long run bombing impacts.

7
In terms of other differences with existing studies, note that Vietnam during the 1960s and
1970s was much poorer than either Japan or Germany and was an overwhelmingly rural country. The
urban agglomeration effects emphasized by some theories thus likely played a less important role in
Vietnamese recovery, while poverty trap models are more relevant. Another major difference
between postwar Vietnam and Japan is that the former was a centrally planned economy until it
launched market reforms in the late 1980s while the latter was always a market economy. This raises
the question of what general lessons we can learn from these empirical studies, since other countries
with different institutions might have reacted differently. It is important to emphasize that institutions
are often quite country specific: Japan has unique capitalist institutions that differ from the U.S., for
example, and the Vietnamese form of socialism was quite different from East German central
planning. In our view it is only through the accumulation of evidence across many settings that
researchers can create a convincing picture of war’s long-run economic effects.
To be absolutely clear, the humanitarian costs of the Vietnam War itself – which led to
millions of civilian deaths by all accounts – were massive and the short term disruptive economic
effects were certainly quite strong. No matter how rapid the recovery, the war, in addition to all the
direct pain and suffering it wrought, meant an enormous amount of time and energy was wasted
fighting rather than engaging in economically productive activities. Vietnam’s southeast Asian
neighbors did not suffer from the American War, and income per capita is now $4,970 in Malaysia
and $2,720 in Thailand but only $620 in Vietnam.5 This gap provides suggestive evidence that
Vietnam, despite its high recent growth rates, might be much richer today had it not been for the war,
although this is admittedly speculative given all of the other institutional, social and policy
differences between these countries.
5 Source: World Development Indicators 2006 (http://devdata.worldbank.org/wdi2006/contents/cover.htm, last visited March 29, 2008. These patterns are discussed further in Fisman and Miguel (2008).

8
2. Theoretical framework
2.1. Economic theory and the effects of war and economic growth
It is useful to first recall results from the standard neoclassical economic growth model to provide a
baseline perspective on war’s possible economic impacts. If war leads to the partial destruction of the
physical capital stock but the production function remains unchanged, there will be a temporary
increase in capital accumulation until the steady state is again attained. In other words, war has no
long run effects on the economy but leads to a transitory increase in investment and consumption
growth relative to a situation without war. If war leads to a loss of the capital stock in some areas but
not others, the former will experience temporarily higher growth. If capital is mobile, capital will
also flow to the war-damaged areas so as to equalize marginal returns across regions. Postwar
recovery patterns are qualitatively similar for human capital (see Barro and Sala-i-Martin 2003 for a
fuller treatment of two-sector growth models). A reduction in human capital in a war torn region will
also result in more rapid postwar accumulation of human capital there, though again there will be no
change in the steady state provided that other model parameters are unchanged.6
The steady state of the economy could be affected by war, however, if it falls into a poverty
trap (Azariadis and Drazen 1990, World Bank 2003). Given its low initial income and the extensive
U.S. bombing, if a war induced “poverty trap” would ever be possible Vietnam would be a good
candidate.
Beyond the loss of physical and human capital, war could also lead to institutional changes
that would affect the aggregate production function, by modifying its scale parameter. Theory does
6 The effects of a loss of capital stock in a growth model with vintage capital are somewhat different. To the extent that postwar investment consists of more recent and better quality capital, economic performance could eventually exceed that of the prewar economy and thus regions that suffered more from the war might eventually overtake regions that suffered less. Gilchrist and Williams (2004) indeed argue that a vintage capital growth model is more consistent with macroeconomic recovery patterns in postwar Japan and Germany than the standard neoclassical model. Our main empirical findings below appear to be consistent with both the neoclassical and vintage capital views, and we do not attempt to decisively distinguish between these two models below since for us the key issue is to determine whether or not persistent adverse economic impacts can be detected, as a way to assess the empirical validity of poverty trap models.

9
not provide an unambiguous prediction as to the effect of war on institutions and technology.
Deterioration in institutions could lead to a new steady state characterized by a lower long run level
of both capital and income, while by symmetry, positive institutional changes brought about by war
could boost steady state capital and income postwar.
The possibility of cross-regional spillovers is also important to the extent that economic
conditions in one region affect growth elsewhere. Central government taxation and transfers may
also benefit some regions more than others, an issue we develop in the formal model in the next sub-
section. In the empirical analysis below, we also explore the possibility of cross-district spillovers by
examining relationships at different levels of aggregation (namely, at both provincial and district
levels), and also examine postwar state investment patterns to establish whether the areas most
affected by U.S. bombing benefited from additional investment.
2.2 A simple theoretical framework of regional war destruction
We focus our theoretical discussion on two plausible alternatives: the standard neoclassical growth
model and a model including poverty traps. We first introduce a version of the standard Solow model
based on districts within a country. Assume a country has i = 1,…,n districts. District i is assumed to
have a Cobb-Douglas constant returns to scale production function, Yit = AKitαLit
1-α where Yit is
district output and Kit and Lit are, respectively, the stock of capital and the labor force in district i.
(We ignore human capital here for simplicity but many of the implications for physical capital also
hold for human capital, as discussed above.) Assuming a constant saving rate s for simplicity, such
that St = sYt , and assuming a per period capital depreciation rate δ, annual investment is equal to It =
∆Kt+1 + δKt . Equating savings with investment leads to the dynamics of capital accumulation:
(1) Ki,t+1= (1 – δ)Kit + sYit.

10
Expressing quantities in per capita terms, capital intensity is kit = Kit/Lit, and the production function
is yit = Akitα with yit = Yit/Lit. Dividing the capital accumulation equation by Lit:
(2) (1+n)ki,t+1 = (1 – δ)kit + syit
where n is the population growth rate.
In a modification of the standard model, assume there is a minimum subsistence consumption
level cmin > 0 below which consumption per capita cannot fall. In that case, per capita savings in
district i are given by sit = min{yit – cmin, syit }. If the per capita consumption hits the cmin constraint, a
poverty trap will result: there is a capital intensity level below which there will be no further per
capita capital accumulation: ki,t+1 ≤ kit. Indeed, multiplying both sides of this inequality by (1+n) and
using (1+n)ki,t+1 = (1 – δ)kit + (yit – cmin) when the subsistence consumption constraint is binding,
we find that ki,t+1 ≤ kit if and only if:
(3) Akitα ≤ (n + δ)kit + cmin.
Given this inequality, there is a ktrap > 0 below which inequality (3) is strictly satisfied, and
this ktrap is the poverty trap threshold level of capital intensity. It is straightforward to see that ktrap
increases with cmin, n and δ, thus a higher minimum consumption level, faster population growth, and
a higher depreciation rate all increase the poverty trap level of ktrap.
To derive the steady state in the context of multiple districts, we need to make assumptions
on both the nature of factor mobility and government policy. Assume first that there is no factor
(capital or population) mobility across districts, and that initially at time zero ki,0 > ktrap in all
districts. We assume that both ki,0 and ktrap are far below the steady state level of capital accumulation
per capita, k* (defined such that (1+n)k* = (1 – δ)k* + sAk*α), an assumption made to ensure that
there is transitional economic growth.

11
Now imagine that at a later time t, however, m < n districts are hit by a bombing shock
destroying much of the local capital stock and bringing kit below ktrap in these districts.7 In the
absence of factor mobility or government redistribution, those m districts will fall into a poverty trap,
permanently condemning them to low income, while the remaining n – m districts (where capital
intensity is above the critical ktrap level) will continue to experience positive economic growth. In this
case, bombing would lead to persistent differences in per capita income (as well as in physical capital
intensity) between bombed and non-bombed districts.
This result is quite fragile, however, and does not hold if there is either extensive factor
mobility across districts (as is typically the case within a country) or if the government is able to
redistribute resources across districts.8 With mobile labor, then for any two districts i and j, after the
bombing there should be a reallocation of labor such that the marginal products of labor are
equalized across districts: FiL= FjL (1-α)Akitα = (1-α)Akjt
α kit = kjt. Similarly, if capital is
mobile, marginal products of capital should be equalized across districts. There should thus be equal
capital intensity kM and per capita income across districts once sufficient time has passed for labor
and capital to be optimally reallocated.9
Depending on whether kM is above or below ktrap, there will be either the same growth
positive rate in all districts or zero growth in all districts, as all have entered into a poverty trap10.
With perfect factor mobility, there will thus be no long run divergence in income between the
7 The bombing shock may also reduce local population, but because people can hide or flee from bombing, we assume that the destruction of capital stock is proportionally larger than for the labor force, such that bombing leads to a reduction in physical capital intensity k. 8 Note here that we do not consider the case in which the local scale parameter Ai, capturing local institutions and technology, is directly impacted by the bombing. We do not believe that cross-district variation institutional quality is sufficiently large in Vietnam to justify this approach, especially in the context of the strongly centralized policy environment that characterized post-war Vietnam. However, note that persistent differences in local institutions due to bombing damage would be another way to generate lasting income gaps across regions. 9 The poverty trap prevents savings in a district if income falls below a certain level. However, the marginal return of capital is not affected by the “trap” and thus capital equalization still occurs under factor mobility. 10 Individual investors do not internalize the effects of their individual investment decisions on capital accumulation in their district. When there is no investment in the whole economy, it is implicit (though not explicitly modeled) that wealthier individuals lend to poorer individuals to finance the minimum consumption level.
12
districts that are bombed heavily versus the other districts. There may be a long run nation-wide
effect of bombing if it pushes the entire country into a poverty trap, but this occurs in all districts.
However, poverty traps will never occur in the long run – whether or not there is perfect
factor mobility and even if all districts are initially pushed below ktrap due to the bombing – as long as
the government has sufficient authority to intervene in the economy and reallocate capital across
districts. Consider the case where all districts start out below the poverty trap level of capital
accumulation ktrap. Private agents are unable to internalize the growth externality inherent in a
poverty trap, but simply reallocate factors of production to those districts that have the highest
marginal return (in this case, zero). Yet as long as there is sufficient capital in the economy as a
whole for the government to redistribute to a single district i′ and bring capital intensity there above
the poverty trap level, ki′t > ktrap, then the government can allow capital to accumulate in that district
until a time t’ when “excess” capital there L i’t’(ki’t’ – ktrap) can be redistributed to a second district to
bring it above the poverty trap level of capital intensity. That second district will thus leave the
poverty trap and start accumulating capital on its own as it transitions to a higher steady state income
level. Capital accumulated above ktrap in these growing districts can then gradually be injected into all
other poor districts until the entire country has exited out of the poverty trap.
Therefore, under the relatively weak condition that there is enough capital in the economy (or
from foreign aid) at baseline to lift at least one district out of the poverty trap initially, selective
reallocation of capital by the government to poorer districts will generally prevent a national poverty
trap from occurring. Most existing poverty trap models neglect interregional differences and the
possibility of government intervention, and therefore exaggerate the theoretical plausibility of a
poverty trap. Poverty traps are unlikely to occur as long as a reasonably capable government that
seeks to promote economic growth is in power. Vietnam’s rapid recovery from U.S. bombing – both
in the bombed districts and in the country as a whole –strongly corroborates this view.

13
3. Data and Econometric Methods
3.1 Data description
We use a database assembled by the Defense Security Cooperation Agency (DSCA) housed at the
United States National Archives in Record Group 218, called “Records of the U.S. Joint Chiefs of
Staff”.11 The database contains information on all ordnance dropped from U.S. and allied airplanes
and helicopters in Vietnam between 1965 and 1975, as well as artillery fired from naval ships.12 To
our knowledge, these files embody the most complete, comprehensive and reliable summary
available of U.S. and allied ordnance expended during the Vietnam War. Some of the original tape
archives were reportedly damaged so up to several months of data may be missing, but unfortunately
we are unable to determine the precise extent of any missing data. The data were originally recorded
in aircraft mission logs and then reported to Pacific Command and the Joint Chiefs of Staff. They
were declassified and provided to the Vietnamese government following the war.
The raw data include the bombing location, a summary bomb damage assessment (which we
unfortunately do not have access to), and the quantity of ordnance by category and type. Categories
include general purpose bombs, cluster bombs, chemicals, incendiary, rockets, missiles, projectiles,
ammunition, mines and flares. Ordnance is measured in units rather than by weight. Since the source
of the data is the U.S. Air Force and Navy, we miss anti-personnel landmines that were placed by
Army ground forces, which probably accounts for a large share of U.S. landmines, and the landmine
data are thus less reliable than the other data. The raw data were then geo-coded by the VVAF using
11 We obtained the data from the Vietnam Veterans of America Foundation (VVAF) with authorization from DSCA and the Vietnam Ministry of Defense Technology Center for Bomb and Mine Disposal. The Data Appendix discusses data sources in greater detail. 12 In particular, data come from the 1965-70 Combat Activities-Air (CACTA), the 1970-1975 South East Asia (SEADAB), and Combat Naval Gunfire (CONGA) databases. Unfortunately, it is simply the total over the time period and is not disaggregated by year.

14
Vietnam district boundaries employed in the 1999 Population and Housing Census to yield the
dataset we use. (An example of the raw data is presented in Appendix Figure 1.)
General purpose bombs are by far the most common ordnance category (Table 1). The Mark
82 and Mark 36 Destructor general purpose bombs typically weighed between 500 to 750 pounds.
Bombing intensity was high, with an average of 32.3 bombs, missiles, and rockets per km2
nationwide through the war, and there is extensive variation across districts for all ordnance
categories. The distribution of bombing was skewed, with 10% of districts receiving nearly 70% of
all bombs, missiles and rockets13, and some districts receiving over 500 bombs per km2, while many
districts were not bombed at all. The most intense attacks took place near the 17th parallel that formed
the border between North and South Vietnam during the war. Note that the poor northwestern region
was hardly bombed at all, in part because of the Johnson administration’s reluctance to antagonize
China by bombing near its borders (Tilford 1991: 153).
There is a positive and statistically significant correlation across all ordnance categories
(Table 1). In the analysis below, we mostly employ total intensity of bombs, missiles, and rockets per
km2, but given the substantial correlation with other ordnance categories (e.g. ammunition), this is
also a good proxy for overall war activity. Unfortunately, we do not have comparable data for North
Vietnam Army or NLF/Vietcong ordnance nor do we have ordnance damage measures. Although we
do not have disaggregated Agent Orange exposure data, the broad regional patterns of exposure from
the maps in Stellman et al (2003) correspond closely with those in our data base.
We obtained 1960-61 provincial population density from both South Vietnam and North
Vietnam government sources (see the Data Appendix) and use those data as baseline controls in the
regressions (Table 2). A variety of district geographic and climatic characteristics – including
proportion of land at high altitude, average district temperature and precipitation, location in former
13 Quang Tri district in Quang Tri province, which is only 6 km2 in size, received over 3000 bombs per km2, the highest by far. We exclude this outlier in the analysis while still using data from the rest of Quang Tri province.
15
South Vietnam, and the proportion of land in 18 different soil type categories – are also included as
explanatory variables to partially control for agricultural productivity (an important component of the
scale factor A in the economic growth framework for an agrarian society) and factors potentially
affecting military strategy (e.g., altitude). The soil controls are excluded from the province level
analysis due to limited degrees of freedom, as there are only 55 provinces in the province sample.
The analysis principally focused on the more disaggregated district level (N=584) but some analysis
is conducted at the more aggregated province level (N=55) for a robustness check, and in particular
to capture cross-district externalities.
We focus on multiple economic outcomes that flow from the economic growth framework
discussed above, and others that are of independent policy interest. Poverty rate estimates are from
Minot et al. (2003), who use the Elbers et al (2003) local regression method. This approach matches
up 1999 Population and Housing Census data – which has excellent geographic coverage but limited
household characteristics – with detailed 1997/8 Vietnam Living Standards Survey (VLSS)
household data. Log-linear regressions of real cost-of-living-adjusted per capita consumption
expenditures on the 17 household characteristics found in both the census and VLSS are then carried
out, and the results used to compute predicted household consumption (details are in the Data
Appendix). The poverty rate is the proportion of population estimated to be living on less than the
official 1999 national poverty line of 1,789,871 Dong, and approximately 41% of the national
population met this criterion (Table 2). Related methods generate predicted average consumption
levels and the Gini coefficient (in per capita consumption) at the district level. The 1999 census also
provides information on household access to electricity (71% of households nationwide) and literacy
(88% of respondents), our proxies for past physical and human capital investments, respectively.
We obtained actual per capita consumption expenditure data from both the 1992/3 and 2002
VLSS waves for a sample of households in a subset of 166 districts. We focus on province level
averages with the VLSS, since the data was designed to be representative at this level of aggregation.

16
The disadvantage of this data set is its relatively small sample size of households. The VLSS also
contains useful retrospective information on migration that we discuss below.
Finally, Vietnamese Statistical Yearbooks provide a consistent series on province population
for 1985 to 2000, and some information on central government investment flows for 1985.
Unfortunately, more detailed economic data is lacking for the 1970s and 1980s, a period which
constitutes a sort of statistical black hole. Recall that in the aftermath of the “American War”,
Vietnam also fought a border war with China and occupied Cambodia to end Khmer Rouge rule, and
data collection was a low priority for the regime while the country remained on a war footing.
3.2 Econometric Approach
We focus on the following cross-sectional regression, where the unit of observation is typically the
district, denoted with subscript i:
(4) yit = α + Xi′β + γBOMBSi, 1965-75 + εit
The dependent variables, y, are different outcomes important in economic growth models, including
per capita consumption levels and growth (and related living standards variables, the poverty rate and
degree of inequality), population density, and both physical and human capital investment levels.
While some variables are generated using local area regression methods, their use as dependent
variables does not typically require additional regression adjustment (see Elbers et al 2005).
The vector X contains fixed district characteristics including geographic controls (soil type,
elevation, latitude) and population density in 1960 (the pre-U.S. bombing baseline period), that are
meant to partially proxy for differences in steady-state outcomes. The BOMBS term is the total
intensity of bombs, missiles, and rockets dropped in the district during 1965-1975 per km2. The
coefficient estimate on BOMBS is the main parameter of interest, capturing the difference in
outcomes in the post-war period between areas more versus less affected by the U.S. bombing, which

17
we relate to the theoretical predictions of the poverty trap model described in section 2.2. We
explored different measures of intensity, including indicators for the most extreme bombing levels,
and as we discuss below, these yield similar results. The disturbance terms, εit, are normally
distributed and allowed to be correlated (“clustered”) across districts within the same province,
although the results are nearly unchanged when they are allowed to be spatially autocorrelated using
the Conley (1999) method.
Below, we consider bombing impacts at both the province and district levels. There are a
number of reasons to consider outcomes at different levels of aggregation. First, U.S. bombing of one
district could generate negative externalities for nearby districts. Provincial level regressions are one
way to partially capture these externalities, although they still miss even broader national effects.
Second, the main baseline 1960-61 population density control is at the province level, and thus when
population density is the dependent variable at least (in Section 4.3 below), a lagged dependent
variable can be included as a control.
3.3. Determinants of U.S. Bombing Intensity and the Instrumental Variable Approach
Before presenting the results, we discuss the existing literature on U.S. bombing strategy during the
Vietnam War. A distinction is often made between the nature of bombing in North Vietnam versus
South Vietnam. U.S. bombing in North Vietnam is largely considered strategic bombing, targeting
transportation capabilities (e.g., airfields, railroads, bridges, ports, roads), as well as military
barracks, industrial plants, and storage depots (Clodfelter 1995: 134). The selection of targets in
North Vietnam was directly supervised by Washington officials on a weekly basis during the
Johnson administration’s “Rolling Thunder” air campaign (Littauer et al., 1972: 37), and the number
of approved targets regularly fell below the requests of the military, with the bombing of Hanoi,
18
Haiphong and areas near China categorically ruled out. A broader set of targets was approved under
the Nixon administration’s “Linebacker” campaign, including the major population centers.
Bombing in South Vietnam, and in parts of North Vietnam near the border, in contrast, was
typically interdiction bombing or tactical air support, which aimed to disrupt enemy troop
movements and support U.S. ground troop operations, rather than explicitly to destroy infrastructure
(Littauer et al 1972: 55; Schlight 1988: 292). Below we present empirical results broken down by the
former North and South Vietnam in some cases, in addition to full sample estimates, to investigate
differential impacts. Some existing research suggests there was no robust correlation between local
population density and U.S. bombing intensity (Nalty 2000: 83) but other authors claim poorer areas
were actually more likely to be hit: “[i]n the remoter, sparsely populated regions often used by the
NLF/NVA [North Vietnam Army] for staging, regroupment, and infiltration, area saturation bombing
is common” (Littauer et al 1972: 10-11).
The central estimation concern is the non-random geographic placement of U.S. bombing, in
response to military strategy and needs, and most worryingly, potentially in response to local
economic conditions. To address these concerns we develop an instrumental variable approach that
relies on the arbitrary placement of the North Vietnam-South Vietnam border at the 17th parallel
north latitude, as a result of Cold War negotiations between U.S. and Soviet officials. The first stage
relationship relates bombing intensity to the district’s distance from the border (DISTANCE):
(5) BOMBSi, 1965-75 = a + Xi′b + cDISTANCEi + eit
The north-south distance from the 17th parallel is a strong predictor of bombing intensity and
is statistically significant in the province level analysis (Table 3, regression 1), district level analysis
(regression 2), and a specification that excludes Quang Tri province, the most heavily bombed
province (regression 3), as a robustness check. The main district level specification in regression 2

19
serves as the first stage for the subsequent IV-2SLS analysis. Note that the instrument is highly
statistically significant with a t-statistic near three in that case.
A remaining econometric concern is whether the instrumental variable violates the exclusion
restriction, in the sense that distance from the 17th parallel has an independent impact on postwar
outcomes beyond any effects working through bombing intensity (conditional on the control
variables). One possible concern is that the IV is correlated with distance to one of Vietnam’s two
major cities, Hanoi and Ho Chi Minh City. If remoteness from these two booming metropolitan areas
is associated with lower incomes during the postwar period, as seems likely, this would generate a
negative correlation between distance to the 17th parallel and poverty in 1999. However, despite any
such possible bias, below we find no significant relationship between bombing and later poverty in
the IV specification. In other words, despite the fact that districts near the 17th parallel had the double
misfortune of being both heavily bombed and far from major national markets, they are currently no
poorer than other regions (conditional on baseline characteristics).
None of the other explanatory variables is significantly related to U.S. bombing intensity in a
consistent way across the three specifications in Table 3, including the indicator for former South
Vietnam, altitude measures, climatic conditions and latitude. The one partial exception is the prewar
1960-61 province population density measure, which is negative and statistically significant across
the two district level specifications, suggesting that more rural areas were somewhat more likely to
be bombed, echoing some of the existing historical literature. However, note that this result does not
hold in the province level analysis in regression 1. Thus overall, with the exception of distance to the
17th parallel (the instrumental variable), there are no consistent correlations between observables and
bombing intensity, partially alleviating the leading omitted variable bias concerns.
4. The Long-run Impact of Bombing Vietnam
4.1 Impacts on Poverty and Consumption Expenditures

20
Total U.S. bombing intensity is negatively and marginally statistically significantly related to the
1999 poverty rate at both the province level (Table 4, regression 1) and the district level (regression
2) in OLS regressions. The district level relationship between bombing intensity and poverty is
presented graphically in Figure 2. The main empirical results are similar if we consider only the
intensity of general purpose bombs, the major ordnance category, or if we consider a log
transformation of total bombing intensity (not shown). In terms of other factors, areas that had higher
population density in 1960-61 have significantly less poverty in 1999 as expected, as does South
Vietnam as a whole on average, while high altitude areas have considerably more poverty
(regressions 1 and 2). Climatic factors and latitude, in contrast, are not robustly associated with
poverty, although high precipitation areas have significantly more poverty in some specifications.
The district level effect remains negative and is even more statistically significant in
specifications that include province fixed effects (Table 4, regression 3) and exclude Quang Tri
(regression 4). Overall, the OLS specifications provide suggestive evidence that U.S. bombing if
anything moderately reduced later poverty, but estimates are only marginally significant and not
particularly robust. This negative relationship may in part reflect the fact that some of the poorest
provinces in Vietnam, those in the northwest, were rarely bombed by the U.S. due to their proximity
to China, generating a spurious correlation. More generally, some other unobserved source of
socioeconomic variation or potential could be driving both bombing patterns and later poverty.
We thus next turn to estimates that rely on the placement of the North Vietnam-South
Vietnam border at the 17th parallel as exogenous variation in bombing intensity. In the reduced form
specification (Table 4, regression 5), the north-south distance from the 17th parallel is negative but
not statistically significantly related to 1999 poverty, conditional on all other geographic factors.
Using this distance as an instrumental variable for bombing intensity in our preferred specification,
the relationship between bombing intensity is positive but not statistically significant (regression 6):
the coefficient estimate on total bombing intensity is 0.00026 (standard error 0.00042).

21
To get an idea of the magnitude of this estimated bombing impact on later poverty, first
consider the effect of a change from zero bombing up to the average bombing intensity of 32.3
bombs, missiles, and rockets per km2. The average effect in this sense is (32.3)*(0.00026) = 0.008.
This is a very small average effect, an increase in the poverty rate by less than one percentage point
and it is not statistically significant. In terms of how precise this estimate is, the 95% confidence
interval ranges from 0.00026 – 2*0.00042 = -0.00058, up to 0.00026 + 2*0.00042 = 0.0011. Thus
again considering the effect of going from zero bombing up to the average intensity of 32.3, the 95%
confidence band of estimates is (32.3)*(-0.00058) = -0.019 to (32.3)*(0.0011) = 0.035. In other
words, plausible average effects range from a 1.9 percentage point reduction in poverty up to a 3.5
percentage point increase in poverty on a base poverty rate of 41%, a reasonably tight range. The
analogous exercise using the OLS estimate (Table 4, regression 2) yields a point estimate of (32.2)*(-
0.00040) = -0.013, a 1.3 percentage point reduction in poverty (going from zero bombing up to
average bombing intensity), and a 95% confidence interval from a -2.7 percentage point decrease in
poverty up to a +0.1 percentage point increase, again a narrow range of estimates around zero.
The effect of bombing on poverty is negative and statistically significant in former North
Vietnam (Table 5, regression 1) but not in former South Vietnam (regression 2). The explanation for
this North-South difference is not entirely clear but it might reflect a postwar government bias
towards assisting heavily bombed areas in the North, or the different nature of bombing across the
two regions. Bombing effects are not statistically significant in initially rural areas (districts with
baseline 1960-1 population density less than 200 per km2, regression 3) but are statistically
significant and negative in urban areas (regression 4). There is some evidence for a nonlinear effect
of bombing intensity on later poverty rates: the linear bombing term remains negative and
statistically significant while the squared term is positive and significant (regression 5). This pattern
appears to in part reflect the high poverty rates in Quang Tri province, the most heavily bombed
province in the country and suggests that war impacts might persist for extremely intense bombing

22
like that in Quang Tri, although that claim is speculative. Point estimates are however not statistically
significant using an alternative nonlinear measure of heavy bombing (regression 6). In additional
results not shown in the tables, we find that alternative district-level welfare measures – the imputed
average per capita consumption level, and the Gini coefficient in consumption – are not significantly
related to U.S. bombing intensity at traditional levels.
Using the more detailed (but more aggregated) VLSS household consumption expenditure
data, average consumption per capita in 2002 is not robustly associated with bombing intensity
across the full sample (Table 6, Panel A, regression 1), or in a specification that excludes Quang Tri
province (regression 2), or in a specification that includes the north-south distance to the 17th parallel
as the main explanatory variable (regression 3). In contrast, all three specifications indicate that more
heavily bombed provinces were somewhat poorer in 1992/93 (Table 6, Panel B), although effects are
not significant at traditional confidence levels. We find that provinces that experienced more intense
U.S. bombing had significantly faster per capita consumption growth between 1992/93 and 2002
(Table 6, Panel C), and this effect is significant at 95% confidence. The coefficient estimate from the
full sample (regression 1) implies that going from zero to average U.S. bombing intensity is
associated with (32.3)*(0.0030) or 10 percentage points faster consumption expenditure growth
during that ten year period, a substantial difference that works out to be roughly one percentage point
faster growth per year on average.
These patterns suggest that more heavily bombed areas were somewhat poorer than other
areas soon after the war but they later caught up during the 1990s economic boom, in line with the
neoclassical growth model’s prediction of especially rapid consumption growth along the transition
path to steady state. Unfortunately, due to data limitations we cannot trace out consumption growth
patterns in the 1970s and 1980s, and so cannot estimate the extent of poverty immediately postwar.
Nevertheless, by 2002, nearly thirty years after U.S. troops pulled out of Vietnam, living standards in

23
the provinces that bore the brunt of the U.S. assault are largely indistinguishable from other areas.14
This is strong evidence against persistent local poverty traps: in that framework, consumption growth
rates would be significantly faster in areas that had experienced less bombing, while the heavily
bombed areas would stagnate or even experience falling per capita consumption.
4.2 Impacts on Physical Infrastructure and Human Capital
There is a positive relationship between U.S. bombing intensity and 1999 access to electricity across
the standard set of province and district specifications (Table 7, panel A), and coefficient estimates
are statistically significant at 95% confidence in six of seven specifications. The relationship is
weaker when province fixed effects are included as controls (regression 3), but the point estimate on
U.S. bombing remains positive and marginally statistically significant even in that case. Note the
negative and significant coefficient estimate on north-south distance to the 17th parallel, suggesting
particularly intensive power sector investments near the former border.
Taken together these estimates provide some evidence of technological “leapfrogging” in the
heavily bombed regions, consistent with either a vintage capital growth model, or investments in the
heavily bombed regions that exceeded war damage. Speculatively, this may have been a political
reward for regions that actively resisted the U.S. during the war. However, given the limited data
available immediately postwar, we have little hope of determining the relative contributions of these
two explanations. Infrastructure investment decisions in Vietnam in the 1970s, 1980s and 1990s
likely reflected a combination of central government redistributive goals as well as potential private 14 We examined attained adult height from the VLSS as a measure of living standards for cohorts born before and during the war to gauge the extent to which living standards fell in heavily bombed areas. We find that average height for the 1961-70 and 1971-80 birth cohorts is significantly lower in more heavily bombed regions. However, it is also somewhat lower for earlier cohorts (born pre-1961) in those same areas. The largest coefficient estimate on U.S. bombing intensity (for the 1961-70 cohort) is -0.0165, implying an average reduction of 0.5 cm when going from zero to average U.S. bombing intensity – not a large effect. The relatively small sample sizes in the VLSS, especially when the data are broken down by year of birth, gender, and province cells, and the possibility that children across a range of ages could experience some growth stunting, prevent us from drawing strong conclusions. The possibility of differential child and infant mortality as a result of the war could also generate selection effects that would further complicate the analysis.

24
returns, especially in the aftermath of the economic reforms, and it is difficult to disentangle these
motives in the absence of detailed micro-level public and private investment data, which do not exist
to our knowledge. International donors, non-governmental organizations (NGOs) and even the U.S.
government (following the 1995 normalization of relations with Vietnam) also played important
roles in reconstruction, further complicating interpretation.
Another key factor in economic growth models is human capital. There are no statistically
significant negative impacts of bombing on either province or district literacy rates in 1999, a proxy
for human capital investment (Table 7, Panel B, regressions 1-6), and similarly weak results hold for
other 1990s human capital measures from the VLSS database as well as for 1985 school enrollment
data from government yearbooks (results not shown).
There is thus no evidence that more heavily bombed districts have either less physical
infrastructure or human capital stocks 25 years after the end of the war, consistent with the rapid
postwar recovery in consumption levels documented above. But this is not to say that the war left no
observable legacies in heavily bombed regions. For one thing, more heavily bombed provinces have
higher membership in war veterans’ associations – in a specification analogous to Table 6 regression
1, the point estimate is 0.00022, standard error 0.00011 – and there is suggestive, though not always
significant, evidence that 2002 disability rates are somewhat higher (regressions not shown), perhaps
in part due to war and landmine/UXO injuries.
4.3 Impacts on Population Density
Province population density in 1999 is not significantly related to total U.S. bombing intensity (Table
8, regression 1), with a point estimate of 0.13 and standard error 0.49. Provinces that had high
population densities in 1960-61 also tend to have high density in 1999 (the point estimate on 1960-61
density is 0.89, standard error 0.19) as expected, and former South Vietnam has somewhat higher
1999 population density overall, although that effect is only marginally significant. In this province

25
level specification, the effect of a change from zero up to average province level U.S. bombing
intensity is (30.6)*(0.13) = 4.0 additional people per km2, a miniscule effect of less than 0.01 of a
standard deviation in 1999 province population density, with a tight 95% confidence range from -26
to +34 people per km2.
Total U.S. bombing intensity is not significantly related to 1999 district population density in
district level OLS specifications (Table 8, regression 2-4). Similarly, in neither the reduced form
regression of population density on the north-south distance from the 17th parallel (regression 5), nor
the IV-2SLS specification (regression 6) is the key explanatory variable statistically significantly
related to 1999 district population density. However, one caveat to the district level population
results are the large standard errors on the key coefficient estimates, which make these estimates less
precise than the poverty results. The leading explanation for these large standard errors in the district
level regressions is the absence of a prewar district level population density control: 1960-61
province population density is only weakly correlated with 1999 district population density.
There is similarly no statistically significant effect of bombing on 1999 district population
density in several other samples and specifications, including in former North Vietnam and South
Vietnam, in rural areas (districts with baseline population density less than 200 per km2), when
province fixed effects are included, and using alternative measures of bombing intensity (regressions
not shown). The estimated effect of bombing is sometimes positive for urban areas but the result is
not robust (not shown).
We next trace out effects on population density over time from 1985 to 2000 using
Vietnamese Statistical Yearbook data, and find no effect of bombing intensity on population density
in 1985 (Table 9, Panel A). We also find no effects on province population density growth rates from
1985 to 2000 (Panel B). So unlike for consumption, there is no evidence of “catch-up” population
growth. Moreover, as was the case for 1999 population, there is no statistically significant effect of
U.S. bombing on province population in any year from 1985 to 2000 (results not shown). This

26
suggests that if there were any large postwar population movements into the more heavily bombed
regions, they must have occurred prior to 1985. Unfortunately, disaggregated population figures are
incomplete for the 1970s and early 1980s, preventing us from extending the analysis back to the
immediate postwar period. Thus it remains possible that there were in fact short run localized effects
of the war on population that had dissipated by 1985.
It is plausible that this lack of population effects is due to large postwar inflows of migrants
into heavily bombed districts, but while we cannot rule this out, nor do we find any compelling
evidence that it is in fact the case. Using the 1997/8 VLSS, U.S. bombing intensity does not have a
consistent effect on the proportion of individuals not born in their current village of residence (Table
9, Panel C) although the point estimate is positive and marginally statistically significant in one
specification (regression 2). The leading interpretation of the data is that most households displaced
by the war simply returned to their home areas shortly after conflict had ended. Vietnamese
communities developed elaborate responses to avoid injury during periods of intense U.S. bombing,
including hiding for extended periods in well provisioned bomb shelters and in underground tunnels
– thousands of miles of which were built during the war – while others fled temporarily before
returning to rebuild (Herring 2002: 174-176).
5. Discussion: Why No Long-run Local Economic Impacts?
Why does the most intense bombing campaign in human history seemingly have no adverse local
economic consequences 25 years later? There are a variety of explanations, based on the theoretical
framework, the empirical analysis, as well as our reading of the historical literature. First, much U.S.
bombing targeted South Vietnam with the purpose of impeding the progress of enemy troops (both
North Vietnam Army and NLF/Vietcong guerrillas) and took place in rural areas (Tilford 1991: 105-
6). These areas had little fixed infrastructure to destroy, and instead bombing often led to the
destruction of forest and farmland, much of which could be expected to recover naturally over time.
27
Even U.S. military planners recognized early in the war that “the agrarian nature of the [Vietnamese]
economy precludes an economic collapse as a result of the bombing” (Pentagon Papers 1972: 232).
Even if the impact of bombing on infrastructure in rural areas was not as devastating as the
bombing intensity numbers suggest, one should not underestimate the ingenious strategies employed
by the North Vietnamese to limit the damage to physical infrastructure that did occur, especially in
urban areas. First of all, some industrial operations were dispersed across multiple sites (Kamps
2001: 70). Second, according to Tilford (1991: 112) “[r]oads (such as they were) were quickly
repaired. Bridges were bombed often but, in addition to being difficult to hit, were easily bypassed
with dirt fords, underwater bridges, and pontoon bridges.” In North Vietnam up to half a million
people worked rebuilding infrastructure destroyed by U.S. bombing (Herring 2002: 176).
Another important factor counteracting the effects of U.S. bombing was the major
Vietnamese government reconstruction effort after the war, with massive mobilization of labor and
resources to rebuild damaged infrastructure and demine the countryside (World Bank 2002). The
theoretical model we developed in section 2.2 above suggests that these sorts of government
investment efforts were likely critical in preventing the descent into local bombing-induced poverty
traps. Although we lack district-level investment data, government yearbooks contain information
on total state investment by province during 1976-1985. For 1985 alone we are able to construct per
capita state investment figures (complete province population data is only available for 1985), and
we find that more heavily bombed provinces did in fact receive somewhat more investment (in
millions of 1985 Dong per capita): in a specification analogous to Table 6, column 1, the point
estimate on total U.S. bombing intensity is 0.0113 (s.e. 0.0071, regression not shown), and this effect
is nearly significant at 90% confidence. This is a large effect: going from zero to average province
level bombing intensity leads to an increase of 1.5 standard deviations in state investment.
Similarly, over the entire 1976-1985 period, the ratio of state investment flows for provinces
above versus below the median in terms of U.S. bombing is 2.0. In other words, the more heavily

28
bombed provinces received twice as much state investment on average. As one can see in Figure 3,
this ratio increases rapidly after 1980, with the end of the border conflict with China and the
complete occupation of Cambodia, suggesting that the redistribution of state investment across
regions became stronger when more resources became available. These patterns provide further
evidence that the Vietnamese government attempted to allocate additional resources to heavily
bombed regions, either as a political reward or for the higher investment returns (or both). This may
explain some of the gains in electricity infrastructure and may also have laid the foundation for the
rapid catch-up growth in consumption discussed above.
Finally, despite the war, large-scale school expansion and literacy campaigns were carried
out during the 1960s and 1970s, especially in North Vietnam, where promoting literacy was a central
social goal of the regime (Ngo 2004). Since school infrastructure was vulnerable to U.S. bombing,
teachers and students dispersed into small groups to avoid strikes, and schools often had foxholes and
helmets for students’ protection during U.S. attacks (Duiker 1995, Nguyen Khac Vien 1981).
These results taken together are broadly in line with the predictions of the neoclassical
growth framework: a loss of factor endowments due to war led to rapid catch-up growth and
convergence back to the steady state, as proxied by performance in regions that suffered hardly at all
from U.S. bombing. There is no evidence of a local poverty trap. The electricity infrastructure results
are consistent with a vintage capital growth model, but we feel that distinguishing between the
vintage and neoclassical models is less fundamental than our main finding of no adverse long-run
local economic impacts, which provides evidence against poverty trap models. The most provocative
result, and one that resonates with Davis and Weinstein (2002) and others in this emerging literature,
is that the transition back to the economic steady state can be extremely rapid even after massive
bombing and destruction.
6. Conclusion

29
We find no robust long run impacts of U.S. bombing on local poverty rates, consumption levels, or
population density in Vietnam over 25 years after the end of the “American War”. Given that the
bombing of Vietnam was the most intense bombing episode in world history, and that Vietnam was
one of the world’s poorest countries at the time of the war, this is a surprising result from the point of
view of poverty trap models of economic growth. There is evidence of substantial reallocation of
Vietnamese government resources towards the regions that were more heavily bombed, and this can
plausibly explain (at least in part) why heavily bombed districts did not fall into a poverty trap.
As discussed above, our empirical approach compares more heavily bombed areas to other
areas and thus cannot directly estimate nation-wide war effects on Vietnamese economic
development. The counterfactual – national Vietnamese economic outcomes in the absence of the
war – is impossible to reconstruct. If the regions not greatly affected by the war assisted the more
heavily bombed regions through postwar resource transfers, as state investment data suggest, then
differences between the more and less heavily bombed areas would be dampened but overall
Vietnamese living standards could still have fallen. In that case, the actual aggregate effects of U.S.
bombing on long run Vietnamese economic performance would be more negative than our estimates
imply. Yet the legacy of the war has clearly not prevented Vietnam from achieving rapid economic
growth: Vietnamese growth in GDP per capita has recently been among the fastest in the world, at
6% per year between 1993 and 2003 (World Bank 2004), following the reforms of the 1980s and
1990s. Our data indicate the 1990s were a crucial period of economic convergence across regions.
Caution is called for in drawing broad lessons regarding war’s impacts on economic growth
in general. Unlike many other poor countries, postwar Vietnam benefited from relatively strong and
centralized political institutions with the power to mobilize human and material resources in the
reconstruction effort, and redistribute from richer to poorer districts. Countries with successful
postwar recovery experiences (like Vietnam, Japan, and Germany) are also probably more likely to
collect the sort of systematic economic data that make this study possible. This may lead to selection
30
bias: war-torn countries where the economy and institutions have collapsed (e.g., Democratic
Republic of Congo or Somalia) lack such data, preventing the estimation of any persistent local war
impacts in those societies.
Vietnam also emerged successfully from war out of a long struggle for national liberation15
against foreign occupiers (principally the French and later the United States), an experience that
fostered a strong sense of nationalism that could be mobilized in the postwar reconstruction. In
contrast, the bulk of wars in the world today are internal civil conflicts, which may exacerbate
political and social divisions and weaken national institutions rather than strengthen them. Some
recent research suggests that the low-level civil conflict in the Basque region of Spain has
significantly reduced economic growth there relative to neighboring regions (Abadie and
Gardeazabal 2003), for example. Collins and Margo (2004) find that the destructive U.S. race riots of
the 1960s had lingering effects on the average income of local African-Americans up to twenty years
later. The world’s most conflict prone region today is sub-Saharan Africa, where state institutions are
notoriously weak (Herbst 2000). In such settings, postwar reconstruction may drag on far longer than
in Vietnam (or in Japan, where postwar political institutions were also strong) leading to more
persistent adverse war legacies. Due to the uniqueness of each society’s institutions, politics, and
history, in our view further empirical evidence accumulated across cases is needed before general
claims about the effects of war on long run economic performance can be made with confidence.
References
Abadie, Alberto, and J. Gardeazabal. (2003). “The Economic Costs of Conflict: A Case Study of the Basque Country”, American Economic Review, 93(1), 112-132.
Azariadis, Costas, and Allan Drazen. (1990). “Threshold Externalities in Economic Development”, Quarterly Journal of Economics, 105(2), 501-526.
15 The conflict in Vietnam was a combination of a war of national liberation and a civil conflict between the North and the South, but the postwar political rhetoric of the victorious North usually emphasized the former.

31
Banens, Maks. (1999). “Vietnam: a Reconstitution of its 20th Century Population History.” Quantitative Economic History of Vietnam 1900-1990: An International Workshop.Jean-Pascal Bassino, Jean-Dominique Giacometti, Konosuke Odaka (eds.). Institute of Economic Research: Hitotsubashi University.
Barro, Robert J., and Xavier Sala-i-Martin. (2003). Economic Growth (Second Edition). MIT Press: Cambridge MA.
Blattman, Christopher, and Edward Miguel. (2009). “Civil War”, forthcoming Journal of Economic Literature.
Brakman, Steven, Harry Garretsen and Marc Schramm (2004). “The Strategic Bombing of Cities in Germany in World War II and it Impact on City Growth”, Journal of Economic Geography 4(1): 1-18.
Carter, G. A. and J.W. Ellis, Jr. 1976. User's Guide to Southeast Asia Combat Data. R-1815-ARPA. Santa Monica, CA: RAND Corporation.
Clodfelter, Mark. (1989). Limits of Air Power. New York: Free Press.
Clodfelter, Michael. (1995). Vietnam in Military Statistics: A History of the Indochina Wars, 1772-1991. Jefferson, NC: McFarland.
Collier, Paul and Anke Hoeffler. (1998). “Greed and Grievance in Civil War”, Oxford Economic Papers, 56(4):563-595.
Collier, Paul and Anke Hoeffler. (2004). “On Economic Causes of Civil War” Oxford Economic Papers, 50(4): 563-573.
Collins, William J., and Robert A. Margo. (2004). “The Labor Market Effects of the 1960s Riots”, Brookings-Wharton Papers on Urban Affairs, vol. 2004, 1-46.
Conley, Timothy. (1999). “GMM estimation with cross sectional dependence,” Journal of Econometrics, 92(1), 1-45.
Davis, Donald, and David Weinstein. (2002). “Bones, Bombs, and Break Points: The Geography of Economic Activity”, American Economic Review, 92(5), 1269-1289.
Doleman, Edgar C., Jr. (1984). Tools of War. Boston: Boston Publishing Company.
Drèze, Jean. (2000). “Militarism, Development and Democracy”, Economic and Political Weekly, April, 1171-1183.
Duiker, William. (1995). Sacred War: Nationalism and Revolution in a Divided Vietnam. New York: McGraw-Hill.
Elbers, C., J. Lanjouw and P. Lanjouw. (2003). “Micro-Level Estimation of Poverty and Inequality.” Econometrica, 71 (1), 355-364.
Elbers, Chris, Jean O. Lanjouw, and Peter Lanjouw. 2005. “Imputed welfare estimates in regression analysis”, Journal of Economic Geography, 5: 101-118.
Fearon, James. (1995) “Rationalist Explanations for War”, International Organization, 49(3), 379-414.
Fearon, James and David Laitin. (2003). “Ethnicity, Insurgency and Civil War”, American Political Science Review , 97(1), 75-90.
Federation of American Scientists (FAS) (2004). United States Weapons Systems. Retrieved 8/04/04 from: http://www.fas.org/man/dod-101/sys/index.html.
Fisman, Raymond, and Edward Miguel. (2008). Economic Gangsters: Corruption, Violence and the Poverty of Nations, Princeton University Press, Princeton NJ.

32
General Statistical Office. (1992, 1993, 1994, 1995, 1997, 1998, 2000, 2001). Vietnam Statistical Yearbook. Statistical Publishing House, Hanoi.
General Statistical Office. (2000). Vietnam Living Standards Survey 1997-1998. Statistical Publishing House, Hanoi.
Gilchrist, Simon, and John C. Williams. (2004). “Transition Dynamics in Vintage Capital Models: Explaining the Postwar Catch-up of Germany and Japan”, Federal Reserve Bank of San Francisco Working Paper #2004-14.
Grolier. (1995). Grolier Multimedia Encyclopedia, Danbury CT: Grolier.
Herbst, Jeffrey. (2000). States and Power in Africa. Princeton University Press: Princeton. Herring, George C. (2002). America’s Longest War: The United States and Vietnam, 1950-1975
(Fourth Edition), McGraw-Hill: Boston. Kalyvas, Stathis, and Matthew Kocher. (2003). “Violence and Control in Civil War: An Analysis
of the Hamlet Evaluation System (HES)”, unpublished working paper, University of Chicago.
Kamps, Charles Tustin. (2001). “The JCS 94-Target List: A Vietnam Myth That Still Distorts Military Thought.” Aerospace Power Journal. 15(1): 67-80. (http://www.airpower.maxwell.af.mil)
Keyssar, Alexander. (2000). The Right to Vote: The Contested History of Democracy in the United States. New York: Basic Books.
Knight, Malcolm , Loayza, Norman and Delano Vilanueva (1996) “The peace dividend: military spending cuts and economic growth” World Bank Policy research Working Papers.
Littauer, Raphael and Norman Uphoff (Editors) (1972). The Air War in Indochina. Revised Edition. Boston: Beacon Press.
Miguel, Edward, Shanker Satyanath, and Ernest Sergenti. (2004). “Economic Shocks and Civil Conflict: An Instrumental Variables Approach”, Journal of Political Economy, 112(4), 725-753.
Minot, Nicholas, Bob Baulch, and Michael Epprecht. (2003). Poverty and inequality in Vietnam: Spatial patterns and geographic determinants. IFPRI and Institute of Development Studies.
Momyer, William W. (1978). Air Power in Three Wars. Washington, DC: Dept. of Defense, Dept. of the Air Force.
Mrozek, Donald J. (1989). Air Power and the Ground War in Vietnam. Washington, DC: Pergamon-Brassey's International Defense Publishers.
Nalty, Bernard C. (2000). Air War Over South Vietnam: 1968-1975. Washington DC: U.S. Air Force.
National Institute of Statistics. (1959-1965). Statistical Yearbook of Vietnam. Vols. 8-12. Saigon. Ngo, Thi Minh. (2004). “Education and Agricultural Productivity in Vietnam”, unpublished
working paper, LSE.
Nguyen Khac Vien. (1981). Contemporary Vietnam (1858-1980). Edited by R. River. Hanoi: Foreign Language Publishing House.
Olson, Mancur . (1982). The Rise and Decline of Nations, Yale University Press, New Haven.
Ordnance Shop (2004). Weapons. Retrieved August 4, 2004 from the World Wide Web: http://www.ordnance.org/weapons.htm.
Organski, A.F.K., and Jacek Kugler. (1977). “The Costs of Major Wars: The Phoenix Factor”, American Political Science Review, 71(4), 1347-1366.
Organski, A.F.K., and Jacek Kugler. (1980). The War Ledger, Chicago: University of Chicago Press.
33
Parsch, Andreas (2003). Designations of U.S. Aeronautical and Support Equipment. Retrieved 8/04/04 from: http://www.designation-systems.net/usmilav/aerosupport.html.
Powell, Robert . (2004) “The Inefficient Use of Power: Costly Conflict with Complete Information” American Political Science Review, 98(2): 231-241.
Pentagon Papers: The Defense Department History of United States Decisionmaking on Vietnam (1972). Gravel Ed. Vol. 4. Boston: Beacon Press.
Project RENEW Report. (2004). “A Study of Knowledge-Awareness-Practices to the Danger of Postwar Landmines/Unexploded Ordnance and Accidents in Quang Tri Province, Vietnam” (www.vietnam-landmines.org).
Przeworski, Adam, Michael E. Alvarez, Jose Antonio Cheibub, and Fernando Limongi. (2000). Democracy and Development: Political Institutions and Wellbeing in the World 1950-1990. Cambridge: Cambridge University Press.
Sachs, Jeffrey. (2005). The End of Poverty: Economic Possibilities for Our Time, Penguin Press: New York, NY.
Schlight, John. (1988). War in South Vietnam: the Years of the Offensive, 1965-1968. Washington, DC: Office of Air Force History, US Air Force.
Smith, John T. (1998). Linebacker Raids: the Bombing of North Vietnam. Wellington House, London: Arms & Armour Press.
Smith, John T. (1994) Rolling Thunder: The American Strategic Bombing Campaign Against North Vietnam, 1964-68. Walton on Thames, Surrey, England: Air Research Publications.
Smith, Tom. 2001. “Southeast Asia Air Combat Data.” DISAM Journal, 24 (Winter): 19-20. Stellman, J. M., S. D. Stellman, T. Webber, C. Tomassallo, A. B. Stellman, and R. Christian, Jr. (2003). “A Geographic Information System for Characterizing Exposure to Agent Orange and Other Herbicides in Vietnam”, Environmental Health Perspectives, 111(3), 321-328.
Srinivasan, T.N. (1994). “Destitution: A Discourse”, Journal of Economic Literature, 32 (4), 1842–1855.
Tilford, Earl H., Jr. (1991). Setup: What the Air Force Did in Vietnam and Why. Maxwell Air Force Base, AL: Air University Press.
Tilly, Charles. (1975). The Formation of National States in Western Europe. Princeton University Press: Princeton.
United Nations Mine Action Service (UNMAS) (2004). Vietnam Country Profile. Retrieved 8/04/04 from: http://www.mineaction.org/countries/countries_overview.cfm?country_id=826.
World Bank. (2002). Vietnam Development Report 2002: Implementing Reforms for Faster Growth and Poverty Reduction. World Bank: Hanoi.
World Bank. (2003). Breaking the Conflict Trap: Civil War and Development Policy. World
Bank: Washington, DC. World Bank. (2004). World Development Report 2004. World Bank: Washington, DC.

34
Figure 1: Map of Vietnam – 10% of districts with the highest total
U.S. bombs, missiles, and rockets per km2 shaded
Hanoi / Haiphong region
Saigon (Ho Chi Minh City) region
Quang Tri Province 17o North latitude

35
Figure 2: 1999 estimated district poverty rate vs.
Total U.S. bombs, missiles, and rockets per km2 in the district (conditional on 1960-61 province population density, South Vietnam indicator, district average
temperature, average precipitation, elevation, soil controls, and latitude)
Quang Tri
Quang Tri
Quang Tri
Quang Tri Quang TriQuang Tri
Quang Tri
Quang Tri
-.6
-.4
-.2
-5.5
5e-1
7.2
.4R
esid
uals
/Fitt
ed v
alue
s
-200 0 200 400Residuals
Residuals Fitted values

36
Figure 3: State investment 1976-1985,
ratio of more heavily bombed (above median) to less heavily bombed (below median) provinces
11.
52
2.5
3R
atio
Abo
ve/B
elow
Med
ian
76 78 80 82 84 86Year
Sta
te in
vest
men
t

37
Table 1: Summary statistics – U.S. ordnance data
Mean S.D. Max. Obs. Correlation with general
purpose bombs Panel A: District level data Total U.S. bombs, missiles, and rockets per km2 32.3 68.5 561.5 584 Total U.S. bombs, missiles, and rockets 14692 37349 365449 584 General purpose bombs 11124 30779 322111 584 1 Cluster bombs 706 2268 32403 584 0.59*** Missiles 24.7 121.7 1600 584 0.27*** Rockets 2828 7208 106445 584 0.64*** Cannon artillery 8.6 51.9 772 584 0.37*** Incendiaries 795 16431 11667 584 0.65*** White phosphorus 70.7 306.6 3580 584 0.27*** Ammunition (000’s of rounds) 5677 11061 136416 584 0.54*** Panel B: Province level data Total U.S. bombs, missiles, and rockets per km2 30.6 51.7 335.5 55
Notes: The summary statistics are not weighted by population. The minimum value is zero for all variables at the district level, and thus we do not present this in the table. The sample throughout excludes Quang Tri district (one district within Quang Tri province), which has by far the highest total U.S. bombs, missiles, and rockets intensity per km2, at 3148; this outlier is excluded from the analysis throughout. Significant at 90 (*), 95 (**), 99 (***) percent confidence.

38
Table 2: Summary statistics – economic, demographic, climatic, and geographic data
Mean S.D. Min. Max. Obs. Panel A: District level data Estimated district poverty rate, 1999 0.41 0.20 0.03 0.94 584 Population density, 1999 1659 5846 10 2332 584 Proportion of households with access to electricity, 1999 0.71 0.27 0.08 1 584 Literacy rate, 1999 0.88 0.11 0.24 0.99 584 Proportion of land area 250-500m 0.11 0.19 0 1 584 Proportion of land area 500-1000m 0.11 0.21 0 1 584 Proportion of land area over 1000m 0.03 0.11 0 1 584 Total district land area (km2) 529 513 4 3230 584 Average precipitation (cm) 154.6 30.1 84.2 282.0 584 Average temperature (celsius) 24.3 1.9 19.4 27.3 584 Former South Vietnam 0.49 0.50 0 1 584 Latitude (oN) 18.0 5.2 9.7 25.4 584 | Latitude – 17oN | 4.9 2.0 0.0 8.4 584 Panel B: Province level data Population density (province), 1960-61 244 437 12 2868 55 Population density, 1985 401 533 34 3196 53 Population density, 1999 465 540 62 2908 55 Change in population density, 1985-2000 77.7 154.5 -439.4 745.1 53 Proportion not born in current village, 1997/98 0.26 0.23 0 1 55 Per capita consumption expenditures, 1992/93 (in 1998 Dong) 1831 591 997 3546 55 Per capita consumption expenditures, 2002 (in 1998 Dong) 3084 1007 2040 7505 55 Growth in per capita consumption expenditures 1992/93-2002 0.74 0.38 -0.08 1.67 55 Latitude (oN) 17.6 5.4 10.0 25.2 55 | Latitude – 17oN | 5.0 2.0 0.3 8.1 55
Notes: The summary statistics are not weighted by population. District latitude is assessed at the district centroid, and province latitude is the average of the district latitudes, weighted by district land area.

39
Table 3: Predicting bombing intensity
Dependent variable: Total U.S. bombs, missiles, and rockets per km2
(1) (2) (3) | Latitude – 17oN |
-14.8*** (5.3)
-17.0*** (6.0)
-10.2*** (2.2)
Population density (province), 1960-61 0.0050 (0.0043)
-0.0035** (0.0016)
-0.0034** (0.0014)
Former South Vietnam
-138.5* (74.9)
-134.5 (87.2)
-37.1 (27.7)
Proportion of land area 250-500m
89.5* (47.1)
-27.6 (20.5)
-26.6* (14.2)
Proportion of land area 500-1000m
-49.6 (65.3)
-17.7 (18.9)
-10.5 (16.8)
Proportion of land area over 1000m
156.3* (81.4)
-6.0 (30.4)
-19.8 (19.1)
Average precipitation (cm)
0.26 (0.17)
0.22 (0.18)
0.15* (0.08)
Average temperature (celsius)
15.2 (0.8)
-0.2 (4.4)
-0.6 (3.6)
Latitude (oN)
-8.7 (6.3)
-10.0 (7.1)
-2.3 (2.6)
District soil controls No Yes Yes Exclude Quang Tri province No No Yes Observations 55 584 576 R2 0.54 0.33 0.25 Mean (s.d.) dependent variable 30.6 (51.7) 32.3 (68.5) 27.1 (50.6)
Notes: Ordinary least squares (OLS) regressions. Robust Huber-White standard errors in parentheses. Significant at 90(*), 95(**), 99(***) percent confidence. Disturbance terms are clustered at the province level in regressions 2-3. The district soil type controls include the proportion of district land in 18 different soil categories. The omitted altitude category is 0-250m.

40
Table 4: Local bombing impacts on estimated 1999 poverty rate
Dependent variable: Estimated poverty rate, 1999 OLS
(1) OLS (2)
OLS (3)
OLS (4)
OLS (5)
IV-2SLS (6)
Total U.S. bombs, missiles, and rockets per km2
-0.00087* (0.00048)
-0.00040* (0.00022)
-0.00065*** (0.00012)
-0.00079*** (0.00016)
0.00026 (0.00042)
Population density (province), 1960-61 (÷100) -0.0089*** (0.0016)
-0.0021** (0.0009)
-0.0023** (0.0010)
-0.0021** (0.0010)
-0.0020* (0.0010)
Former South Vietnam
-0.317*** (0.087)
-0.174** (0.071)
-0.122* (0.071)
-0.139** (0.058)
-0.104 (0.082)
Proportion of land area 250-500m
0.341*** (0.096)
0.339*** (0.070)
0.182*** (0.067)
0.325*** (0.069)
0.342*** (0.070)
0.349*** (0.073)
Proportion of land area 500-1000m
0.386** (0.172)
0.261*** (0.052)
0.157** (0.062)
0.261*** (0.053)
0.253*** (0.054)
0.257*** (0.055)
Proportion of land area over 1000m
0.571** (0.231)
-0.048 (0.113)
-0.001 (0.159)
-0.066 (0.111)
-0.044 (0.120)
-0.043 (0.116)
Average precipitation (cm)
0.00027 (0.00044)
0.00111*** (0.00035)
0.00060 (0.00046)
0.00110*** (0.00033)
0.00068* (0.00038)
0.00063 (0.00044)
Average temperature (celsius)
0.033 (0.029)
-0.012 (0.019)
-0.034 (0.022)
-0.013 (0.020)
-0.0143 (0.0196)
-0.0143 (0.0199)
Latitude (oN)
-0.0127 (0.0108)
-0.0088 (0.0088)
0.038 (0.026)
-0.0044 (0.0088)
-0.0051 (0.0081)
-0.0025 (0.0100)
| Latitude – 17oN |
-0.0044 (0.0069)
District soil controls No Yes Yes Yes Yes Yes Province fixed effects No No Yes No No No Exclude Quang Tri province No No No Yes No No Observations 55 584 584 576 584 584 R2 0.75 0.61 0.79 0.63 0.60 - Mean (s.d.) dependent variable 0.39 (0.16) 0.41 (0.20) 0.41 (0.20) 0.41 (0.20) 0.41 (0.20) 0.41 (0.20)
Notes: Robust Huber-White standard errors in parentheses. Significant at 90(*), 95(**), 99(***) percent confidence. Disturbance terms are clustered at the province level in regressions 2-7. The district soil type controls include the proportion of district land in 18 different soil categories. The omitted altitude category is 0-250m. The instrumental variable in regression 6 is | Latitude – 17oN |.

41
Table 5: Local bombing impacts on estimated 1999 poverty rate – alternative specifications
Dependent variable: Estimated poverty rate, 1999 Ex-North
Vietnam Ex-South Vietnam
Rural: 1960-1 pop.
density < 200 per km2
Urban: 1960-1 pop.
density ≥ 200 per km2
All Vietnam All Vietnam
(1) (2) (3) (4) (5) (6) Total U.S. bombs, missiles, and rockets per km2
-0.00051** (0.00020)
-0.00009 (0.00025)
-0.00021 (0.00021)
-0.00088** (0.00017)
-0.00114*** (0.00033)
(Total U.S. bombs, missiles, and rockets per km2)2 (÷100)
0.00019*** (0.00006)
Top 10% districts, total U.S. bombs, missiles, and rockets per km2
-0.030 (0.026)
District demographic, geographic, soil controls Yes Yes Yes Yes Yes Yes Observations 300 284 409 175 584 584 R2 0.70 0.66 0.60 0.65 0.62 0.60 Mean (s.d.) dependent variable 0.46 (0.20) 0.35 (0.18) 0.46 (0.19) 0.29 (0.16) 0.41 (0.20) 0.41 (0.20)
Notes: Ordinary least squares (OLS) regressions. Robust Huber-White standard errors in parentheses. Significant at 90(*), 95(**), 99(***) percent confidence. Disturbance terms are clustered at the province level. District demographic and geographic controls include Population density (province) 1960-61, Former South Vietnam, Proportion of land area 250-500m, Proportion of land area 500-1000m, Proportion of land area over 1000m, Average precipitation (cm), Average temperature (celsius), and Latitude (oN). The district soil type controls include the proportion of district land in 18 different soil categories. The omitted altitude category is 0-250m.

42
Table 6: Local war impacts on consumption expenditures and growth (VLSS data)
OLS (1)
OLS (2)
OLS (3)
Panel A: Dependent variable: 2002 per capita consumption expenditures Total U.S. bombs, missiles, and rockets per km2
2.4 (1.7)
5.3 (3.4)
| Latitude – 17oN |
3.3
(54.5) Exclude Quang Tri province No Yes No Observations 55 54 55 R2 0.61 0.62 0.60 Mean (s.d.) dependent variable 3084 (1007) 3092 (1014) 3084 (1007)
Panel B: Dependent variable: 1992/93 per capita consumption expenditures Total U.S. bombs, missiles, and rockets per km2
-1.5 (1.0)
-2.0 (2.2)
| Latitude – 17oN |
53.9
(48.1) Exclude Quang Tri province No Yes No Observations 55 54 55 R2 0.46 0.44 0.47 Mean (s.d.) dependent variable 1831 (591) 1847 (585) 1831 (591)
Panel C: Dependent variable: Growth in consumption, 1992/93-2002 Total U.S. bombs, missiles, and rockets per km2
0.0030*** (0.0007)
0.0036** (0.0017)
| Latitude – 17oN |
-0.057** (0.028)
Exclude Quang Tri province No Yes No Observations 55 54 55 R2 0.47 0.41 0.41 Mean (s.d.) dependent variable 0.74 (0.38) 0.72 (0.37) 0.74 (0.38)
Notes: Robust Huber-White standard errors in parentheses. Significant at 90(*), 95(**), 99(***) percent confidence. All regressions contain controls (not shown) for Population density (province) 1960-61, Former South Vietnam, Proportion of land area 250-500m, Proportion of land area 500-1000m, Proportion of land area over 1000m, Average precipitation (cm), Average temperature (celsius), and Latitude (oN). The omitted altitude category is 0-250m.

43
Table 7: Local war impacts on physical infrastructure and human capital
OLS (1)
OLS (2)
OLS (3)
OLS (4)
OLS (5)
IV-2SLS (6)
Panel A: Dependent variable: Proportion of households with access to electricity, 1999
Total U.S. bombs, missiles, and rockets per km2
0.00168*** (0.00055)
0.00036*** (0.00012)
0.00025 (0.00016)
0.00043** (0.00017)
0.0019** (0.0009)
| Latitude – 17oN |
-0.033*** (0.009)
District soil controls No Yes Yes Yes Yes Yes Province fixed effects No No Yes No No No Exclude Quang Tri province No No No Yes No No Observations 55 584 584 576 584 584 R2 0.59 0.57 0.75 0.57 0.58 - Mean (s.d.) dependent variable 0.72 (0.21) 0.71 (0.27) 0.71 (0.27) 0.71 (0.27) 0.71 (0.27) 0.71 (0.27) Panel B: Dependent variable: Proportion of literate respondents, 1999
Total U.S. bombs, missiles, and rockets per km2
0.00005
(0.00012) 0.00003
(0.00006) 0.00009
(0.00006) 0.00012** (0.00006)
0.00041 (0.00037)
| Latitude – 17oN |
-0.0070 (0.0052)
District soil controls No Yes Yes Yes Yes Yes Province fixed effects No No Yes No No No Exclude Quang Tri province No No No Yes No No Observations 55 584 584 576 584 584 R2 0.65 0.59 0.75 0.59 0.59 - Mean (s.d.) dependent variable 0.89 (0.07) 0.88 (0.11) 0.88 (0.11) 0.88 (0.11) 0.88 (0.11) 0.88 (0.11)
Notes: Robust Huber-White standard errors in parentheses. Significant at 90(*), 95(**), 99(***) percent confidence. Disturbance terms are clustered at the province level in regressions 2-6. All regressions include Population density (province) 1960-61, Former South Vietnam, Proportion of land area 250-500m, Proportion of land area 500-1000m, Proportion of land area over 1000m, Average precipitation (cm), Average temperature (celsius), and Latitude (oN). The district soil type controls include the proportion of district land in 18 different soil categories. The omitted altitude category is 0-250m. The instrumental variable in regression 6 is | Latitude – 17oN |.

44
Table 8: Local bombing impacts on 1999 population density
Dependent variable: Population density, 1999 OLS
(1) OLS (2)
OLS (3)
OLS (4)
OLS (5)
IV-2SLS (6)
Total U.S. bombs, missiles, and rockets per km2
0.13
(0.49) 2.0
(8.9) 12.4
(10.9) 6.1
(12.5) -13.9
(19.7) Population density (province), 1960-61
0.89*** (0.19)
0.66 (0.42)
0.68 (0.42)
0.67* (0.40)
0.62 (0.45)
Former South Vietnam
282.7* (145.2)
857.9 (1890.2)
344.4 (1735.1)
1048.9 (862.8)
-821.7 (2899.1)
Proportion of land area 250-500m
-1332*** (426)
-3997 (3125)
-1416 (1721)
-3890 (3133)
-3845 (2830)
-4230 (3272)
Proportion of land area 500-1000m
13 (261)
-2164 (1661)
-1762 (1460)
-2181 (1686)
-1829 (1370)
-2075 (1586)
Proportion of land area over 1000m
-1468*** (489)
-1264 (1983)
-111 (1722)
-1084 (2014)
-1316 (1745)
-1399 (1982)
Average precipitation (cm)
-1.27** (0.55)
-22.7 (15.6)
-9.9 (9.2)
-22.7 (15.4)
-14.1 (11.2)
-11.0 (10.5)
Average temperature (celsius)
-46.7 (49.2)
767.3 (846.7)
470.0 (373.6)
774.9 (849.4)
828.0 (887.3)
824.6 (882.9)
Latitude (oN)
36.9** (16.5)
103.2 (177.5)
-1317.1 (904.5)
60.4 (164.4)
91.0 (120.2)
-48.1 (266.0)
| Latitude – 17oN |
237.1 (328.6)
District soil controls No Yes Yes Yes Yes Yes Province fixed effects No No Yes No No No Exclude Quang Tri province No No No Yes No No Observations 55 584 584 576 584 584 R2 0.86 0.16 0.56 0.15 0.15 - Mean (s.d.) dependent variable 465 (540) 1659 (5846) 1659 (5846) 1678 (5884) 1659 (5846) 1659 (5846)
Notes: Robust Huber-White standard errors in parentheses. Significant at 90(*), 95(**), 99(***) percent confidence. Disturbance terms are clustered at the province level in regressions 2-6. The district soil type controls include the proportion of district land in 18 different soil categories. The omitted altitude category is 0-250m. The instrumental variable in regression 6 is | Latitude – 17oN |.

45
Table 9: Local war impacts on other population characteristics
OLS (1)
OLS (2)
OLS (3)
Panel A: Dependent variable: Population density, 1985 Total U.S. bombs, missiles, and rockets per km2
-0.18 (0.58)
-0.99 (1.15)
| Latitude – 17oN |
-2.3 (10.4)
Exclude Quang Tri province No Yes No Observations 53 52 53 R2 0.73 0.73 0.73 Mean (s.d.) dependent variable 401 (533) 407 (536) 401 (533)
Panel B: Dependent variable: Growth in population density, 1985 to 2000 Total U.S. bombs, missiles, and rockets per km2
-0.008 (0.164)
0.090 (0.362)
| Latitude – 17oN |
7.5 (6.5)
Exclude Quang Tri province No Yes No Observations 53 52 53 R2 0.24 0.24 0.24 Mean (s.d.) dependent variable 77.7 (154.5) 78.7 (155.8) 77.7 (154.5)
Panel C: Dependent variable: 1997/98 proportion not born in current village Total U.S. bombs, missiles, and rockets per km2
0.00037 (0.00041)
0.00127* (0.00069)
| Latitude – 17oN |
0.006 (0.016)
Exclude Quang Tri province No Yes No Observations 55 54 55 R2 0.52 0.43 0.51 Mean (s.d.) dependent variable 0.27 (0.23) 0.27 (0.23) 0.27 (0.23)
Notes: Robust Huber-White standard errors in parentheses. Significant at 90(*), 95(**), 99(***) percent confidence. All regressions contain controls for Population density (province) 1960-61, Former South Vietnam, Proportion of land area 250-500m, Proportion of land area 500-1000m, Proportion of land area over 1000m, Average precipitation (cm), Average temperature (celsius), and Latitude (oN). The omitted altitude category is 0-250m.

46
Supplementary Appendix Figure 1: Raw DSCA bombing data, Quang Tri province (intended for online publication)

47
Supplementary Data Appendix (intended for online publication) (1) U.S. Military data The bombing data in this paper are derived from the following files, housed at the National Archives in Record Group 218, “Records of the U.S. Joint Chiefs of Staff”: Combat Activities File (CACTA)
• October 1965 – December 1970; November 1967 not available. Monthly. Derived from Combat Activities Reports II/III (COACT II/III), detailing daily air combat operations flown by the US Navy, Marine Corps, and Pacific Air Forces. Carter et al. (1976) list data cards for Army and USMC helicopters as primary input sources.
Southeast Asia Database (SEADAB) • January 1970 – June 1975. Daily records of allied air combat activities flown by the US Army,
Navy, Air Force, and Marine Corps, as well as the (South) Vietnamese Air Force, Royal Lao Air Force, and Khmer (Cambodian) Air Force. Includes both fixed-wing aircraft and helicopters.
Combat Naval Gunfire File (CONGA) • March 1966 – January 1973. Records of naval gunfire support in North and South Vietnam.
To the best of our knowledge, these data cover all air combat operations flown by all allied forces
involved in the Second Indochina War, including Thai and Australian. Some of the original tape archives were damaged, so several months of data may be missing.
The data are geocoded at the district level, employing the codes and boundaries used by the General Statistical Office in the 1999 Population and Housing census. The air ordnance data are divided into 16 categories by type: ammunition, cannon artillery, chemical, cluster bomb, flare, fuel air explosive, general purpose (iron bomb), grenade, incendiary, mine, missile, other, rocket, submunition, torpedo, and unknown. All entries denote number of units, rather than weight, of ordnance expended by district. Nearly all entries denote single units; most ammunition-class entries denote thousands of units. The naval gunfire data are divided into approximately forty specific categories.
Type of ordnance, quantity of ordnance, and drop location were originally recorded by the pilots and gunners who fired the weapons. Such records were created every time ordnance was expended. The data were reported to Pacific Command and ultimately the Joint Chiefs, who declassified the CACTA, SEADAB, CONGA files in 1975, after which they were sent to the National Archives.
The data were provided by Tom Smith at the Defense Security Cooperation Agency (DSCA), in cooperation with Michael Sheinkman of the Vietnam Veterans of America Foundation (VVAF). We are indebted to Tom Smith, Michael Sheinkman, and Bill Shaw A01 (AW) USN (ret.) for their assistance in understanding the data. VVAF sought and obtained permission from the Technology Center for Bomb and Mine Disposal (BOMICO), a department of the Engineering Command of the Vietnam Ministry of Defense to provide us the data. Clodfelter (1995: 216-7) summarizes U.S. ordnance: “Most bombs dropped by U.S. aircraft were either 750-pounders (favored by the U.S. Air Force) or 500-pounders (favored by the U.S. Navy), but bombs of up to 2,000 pounds and other ordnance of unconventional design and purpose were employed. Included among America’s air arsenal were antipersonnel bombs whose outer casing opened to release a string of small warheads along a line of one hundred yards. Some of the other U.S. antipersonnel and high-explosive bombs were the Lazy Dog, which exploded thirty yards above the ground to release a steel sleet of hundreds of tiny darts; cluster bombs, which were ejected from large canisters by small explosive charges after they had penetrated the upper canopy of the forest; and Snake Eyes, which oscillated earthward under an umbrellalike apparatus that retarded the rate of fall long enough to allow the bombing aircraft to come in low with its bomb load and then escape the resulting effects of the detonation.” The following table provides more details.

48
Supplementary Appendix Table 1: U.S. Ordnance Categories
Ordnance category Description General purpose bombs Conventional iron bombs, free-falling and unguided. “These account
for the greatest fraction of the total weight of aerial munitions used; they are carried by fighter-bombers, attack bombers, and high-flying strategic bombers (B-52s), and delivered by free fall. ... Weight ranges from 100 pounds to 3000 pounds; most common range is 500-1000 pounds; about 50 percent of weight is explosive. The bomb works mostly by blast effect, although shrapnel from the casing is also important. ... The crater from a 500-lb. bomb with impact fuze (e.g., MK 82) is typically 30 feet in diameter and 15 feet deep (this obviously varies greatly with the terrain). Shrapnel is important over a zone about 200 feet in diameter. Simple shelters (sandbags, earthworks, even bamboo) protect against all but close hits.” (Littauer et al 1972: 222). “The biggest of [the GP bombs] was the 15,000-pound BLU-82B ‘Daisy Cutter’.” (Doleman 1984: 127)
Cluster bombs Cluster bomb units (CBUs) scatter the submunitions they contain—ranging from under forty to over 600 in number—over a wide area, yielding a much broader destruction radius than conventional iron bombs. The outer casing is “blown open (by compressed gas) above ground level (typically 500-foot altitude), distributing bomblets over an area several hundred feet on a side.” (Littauer et al 1972: 222). In our dataset these are primarily fragmentary general purpose, anti-personnel, and anti-material weapons, and occasionally tear gas or smoke, ranging in total bomb weight from 150 to over 800 lbs.
Missiles Self-guided air-deployed munitions. Includes self-propelled air-to-air and air-to-ground missiles (that typically hone in on radiation from engines or radar) as well as free-fall “smart bombs” (guided toward their targets by laser reflection or electro-optical imaging, e.g., AGM-62 “Walleye”). “The most important anti-radiation air-to-ground missiles used by the U.S. forces in Vietnam were the AGM-45 Shrike and AGM-78 Standard ARM. Radar-directed like the Sparrow, the Shrike was carried by navy and air force jets, including the Wild Weasels. Its purpose was to knock out the ground radar stations that controlled the deadly SAMs and radar-guided anti-aircraft guns.” (Doleman 1984: 125).
Rockets Self-propelled unguided munitions. “The most common size is 2.75" diameter, delivered singly or in bursts from tubes mounted under the aircraft. Accuracy of delivery is generally higher than for free-fall weapons. Warheads include fragmentation (flechette), high explosive (including shaped charge against armored vehicles), and incendiary action (most white phosphorus or plasticized white phosphorus, PWP). Phosphorus may be used as anti-personnel weapon, but also serves to generate white smoke (often for target designation for further strikes).” (Littauer et al 1972: 223)

49
Cannon artillery High-velocity projectiles too large to be labeled ‘Ammunition’. Chiefly, high explosive shells from 105mm Howitzers. (Sources: personal communication with Bill Shaw, 4/16/04)
Incendiaries / white phosphorus
Napalm fire bombs and white phosphorus smoke bombs (<5%). Total fire bomb weights range from 250lb to 750lb, containing between 33-100 gallons of combustible napalm gel. Napalm was primarily successful as a wide-area anti-personnel weapon: “Most effective against entrenched infantry, napalm gave off no lethal fragments and could be used close to friendly forces without the dangers of fragmentation posed by conventional bombs. Often the fire from napalm would penetrate jungle that was immune to shrapnel. A single napalm canister spread its contents over an area a hundred yards long.” (Doleman 1984: 127)
Land mines Primarily air-dropped ‘Destructor’ mines. “Destructor Mines are general purpose low-drag [GP] bombs converted to mines. They can be deployed by air, either at sea as bottom mines or on land as land mines. … When dropped on land, they bury themselves in the ground on impact, ready to be actuated by military equipment, motor vehicles and personnel. When dropped in rivers, canals, channels, and harbors, they lie on the bottom ready to be actuated by a variety of vessels including war ships, freighters, coastal ships, and small craft.” (FAS 2004) With just over 55,000 mines listed for the entire country in our dataset, compared with an outside estimate of 3,500,000 mines (UNMAS 2004), our data capture a trivial fraction of total presumed landmine presence in Vietnam. This is likely because a large share of landmines were placed in the ground by U.S. army troops.
Ammunition (000’s of rounds) Projectiles fired from air at high-velocity. Cross-sectional diameter (caliber) ranges from 5.56mm to 40mm, spanning the traditional categories of small-arms (≤0.50 caliber/inches = 12.7 mm), regular ammunition, and cannon artillery (≥20mm). (Sources: FAS (2004); personal communication with Bill Shaw, 4/16/04)
(2) Vietnam Poverty, Geographic, and Climatic Data District-level estimates of poverty were provided by Nicholas Minot of the International Food Policy Research Institute (IFPRI). The estimates were generated through poverty mapping, an application of the small-area estimation method developed in Elbers et al (2003). This method matches detailed, small-sample survey data to less-detailed, large-sample census data across geographic units, to generate area-level estimates of an individual- or household-level phenomenon—in our case, district-level poverty incidence in Vietnam. For more detailed information, see Minot et al. (2003).
The two datasets used by Minot et al. (2003) are the 1997/8 Vietnam Living Standards Survey (VLSS) and a 33% subsample (5,553,811 households) of the 1999 Population and Housing Census. The VLSS, undertaken by the Vietnam General Statistical Office (GSO) in Hanoi with technical assistance from the World Bank, is a detailed household-level survey of 4270 rural and 1730 urban Vietnamese households. The 1999 Population and Housing Census was conducted by the GSO with technical support from the United Nations Family Planning Agency and United Nations Development Program (UNDP). We also use data from the 1992/3 and 2002 VLSS survey rounds in this paper.

50
Minot et al. use the VLSS data to estimate a household-level, log-linear regression of real cost-of-living-adjusted per capita consumption expenditure on 17 household characteristics common to both the VLSS and the Population and Housing Census. These characteristics include: household size, proportion over 60 years old, proportion under 15 years old, proportion female, highest level of education completed by head of household, whether or not head has a spouse, highest level of education completed by spouse, whether or not head is an ethnic minority, occupation of head over last 12 months, type of house (permanent; semi-permanent or wooden frame; “simple”), house type interacted with living area, whether or not household has electricity, main source of drinking water, type of toilet, whether or not household owns a television, whether or not household owns a radio, and region. Minot et al. (2003) partition the sample to undertake separate parameter estimates for the correlates of rural and urban poverty.
Predicted consumption expenditures per capita for each of the district-coded households in the 1999 Population and Housing Census sample are then generated using the parameter estimates from these regressions. Properly weighting by the size of each household, this enables Minot et al (2003) to generate an estimate of district-level poverty incidence, the percentage of the population in each district that lives below the official national poverty line of 1,789,871 Dong (VND) per person per year (GSO 2000).
All district-level topographic, geographic, and climatic data used in this paper were provided by Nicholas Minot and are identical to those used in Minot et al. (2003). The topographical data used in Minot et al. (2003) are taken from the United States Geological Survey.
Province population figures in the 1980s and 1990s are from the Vietnam Statistical Yearbooks (Vietnam General Statistical Office). Unfortunately, we have been unable to locate complete and consistently defined province level demographic data from the mid-1970s through the mid-1980s. These Yearbooks also contain information on total state investment flows by province from 1976-1985, data that is also used in the statistical analysis. (3) Data from the pre-“American War” period Pre-war, province-level demographic data on South Vietnam were taken from the 1959-1965 editions of the Statistical Yearbook of Vietnam, published by the National Institute of Statistics in Saigon, and for North Vietnam from the Vietnam Agricultural Statistics over 35 Years (1956-1990), published by the GSO Statistical Publishing House in Hanoi (1991). Province level agricultural statistics are also available (e.g., rice paddy yields), but it is widely thought that such prewar data are unreliable as a result of the prewar ideological conflict between North and South Vietnam (Banens 1999), and thus we do not use those data in the analysis.
A final data source we considered is the HAMLA/HES database collected by the U.S. government starting in South Vietnam in 1967-68 (described in Kalyvas and Kocher 2003), which collected rough proxies for village socioeconomic conditions. The two main drawbacks of this data is that first, the exact procedure for assigning the local SES measures is not transparent or well-described in existing sources, and second the data was collected several years into the war, and thus may be endogenous to earlier U.S. bombing patterns. For these reasons we do not utilize this data in the analysis.