Embed Size (px)
Citation preview

8460 Tyco Road, Suite E
Vienna, Virginia 22182-2219, U.S.A. (703) 847-4380, www.ExperientialWealth.com
January 15, 2021 The Long and Winding Road The sudden and severe economic crisis that started in the Spring of 2020 was a consequence of a once in a generation exogenous shock. It has always been clear that until and unless we manage and hopefully control the SARS-CoV-2 (a.k.a. COVID-19) virus, the U.S. and the global economy cannot fully recover. The virus and the efforts used to contain it delivered the most severe blow to the U.S. economy since the Great Depression. As 2020 came to an end, the U.S. surpassed 20 million infections, with more than 346,000 deaths. Globally, cases rose to 83,832,334 and 1,824,590 deaths.
According to the CDC, although overall mortality increases with age, the proportion of death associated with COVID-19 is similar across middle-age and older adults (data as of 12-16-2020). It is unfortunate that the virus, prevention, public health policies and now vaccine have all been politicized. This has added fear, confusion and
disinformation to an already complicated systemic challenge. This is a time that should unite us to combat a common enemy by taking the necessary steps to safeguard our neighbors and our communities from unnecessary risks. However, the reasons that divide us have been emphasized and thus contributed to prolong suffering and pain on both human and economic level. Cases in parts of the U.S. began surging again in the weeks after Thanksgiving; the same
outcome likely will be experienced in January with the extensive travel for the Christmas and
gatherings. The Transportation Security Administration said it screened the most passengers
(1.3 million) on the Sunday before Christmas, the highest one-day travel in the U.S. since
March 15.

2
Rt or the virus spread rate intends to measure the average rate by which one infected person
will pass on a virus. A value greater than 1 means the number of cases will increases
exponentially. But if the Rt number is lower, the virus will eventually stop spreading because
not enough new people are being infected to sustain the outbreak; at which point, we have
reached herd immunity1. Currently, according to the COVID-19 Tracking Project as
reported by www.statista.com, only 13 less densely populated states have a Rt less than 1.
The complexity of vaccinating the population to reach herd immunity is based on the four
“A’s” of Approval, Availability, Acceptance and Adoption. On December 11th, the FDA issued
an Emergency Use Authorization (EUA) for use of the Pfizer-BioNTech2 vaccine and on December 18th, the FDA issued an EUA for the use of the Moderna3 vaccine4. The available
data continues to support the use of two specified doses of each authorized vaccine at specified
intervals. For the Pfizer-BioNTech vaccine, the interval is 21 days between the first and
second dose. And for the Moderna vaccine, the interval is 28 days between the first and
second dose. As of December 28, 2020, large-scale (Phase 3) clinical trials are in progress or
being planned for three COVID-19 vaccines from AstraZeneca, Janssen and Novavax. In the
U.S., we are well on our way to approving vaccines, EUA or otherwise.
The issuance of an EUA is different than an FDA approval. In determining whether to issue
an EUA, the FDA evaluates the totality of available scientific evidence and carefully balances
1 https://www.jhsph.edu/covid-19/articles/achieving-herd-immunity-with-covid19.html 2 https://www.fda.gov/emergency-preparedness-and-response/coronavirus-disease-2019-covid-19/pfizer-biontech-covid-19-vaccine 3 https://www.fda.gov/emergency-preparedness-and-response/coronavirus-disease-2019-covid-19/moderna-covid-19-vaccine 4 https://www.webmd.com/vaccines/covid-19-vaccine/news/20201214/closer-look-at-three-covid-19-vaccines
3
any known or potential risks with any known or potential benefits of the product for use
during an emergency.
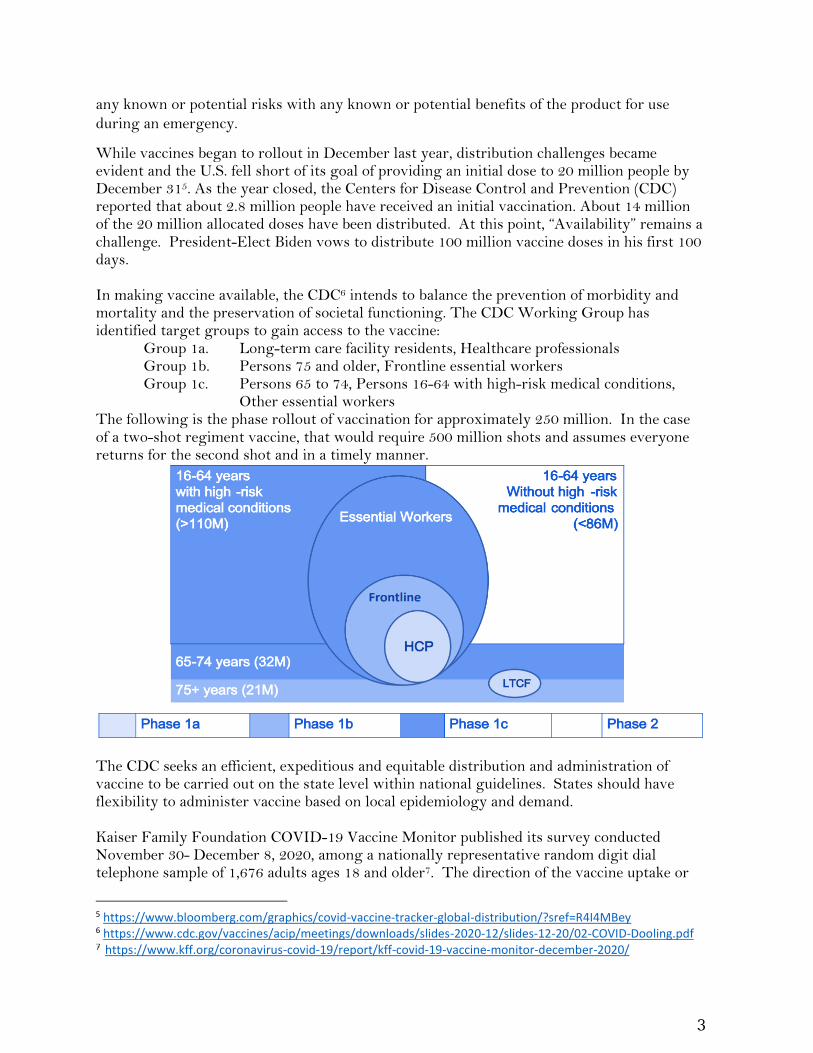
While vaccines began to rollout in December last year, distribution challenges became evident and the U.S. fell short of its goal of providing an initial dose to 20 million people by December 315. As the year closed, the Centers for Disease Control and Prevention (CDC) reported that about 2.8 million people have received an initial vaccination. About 14 million of the 20 million allocated doses have been distributed. At this point, “Availability” remains a challenge. President-Elect Biden vows to distribute 100 million vaccine doses in his first 100 days. In making vaccine available, the CDC6 intends to balance the prevention of morbidity and mortality and the preservation of societal functioning. The CDC Working Group has identified target groups to gain access to the vaccine: Group 1a. Long-term care facility residents, Healthcare professionals Group 1b. Persons 75 and older, Frontline essential workers
Group 1c. Persons 65 to 74, Persons 16-64 with high-risk medical conditions, Other essential workers
The following is the phase rollout of vaccination for approximately 250 million. In the case of a two-shot regiment vaccine, that would require 500 million shots and assumes everyone returns for the second shot and in a timely manner.
The CDC seeks an efficient, expeditious and equitable distribution and administration of vaccine to be carried out on the state level within national guidelines. States should have flexibility to administer vaccine based on local epidemiology and demand. Kaiser Family Foundation COVID-19 Vaccine Monitor published its survey conducted November 30- December 8, 2020, among a nationally representative random digit dial telephone sample of 1,676 adults ages 18 and older7. The direction of the vaccine uptake or
5 https://www.bloomberg.com/graphics/covid-vaccine-tracker-global-distribution/?sref=R4I4MBey 6 https://www.cdc.gov/vaccines/acip/meetings/downloads/slides-2020-12/slides-12-20/02-COVID-Dooling.pdf 7 https://www.kff.org/coronavirus-covid-19/report/kff-covid-19-vaccine-monitor-december-2020/

4
acceptance rate is encouraging but continues to suggest that herd immunity is still in the distant. Here is a summary of the survey’s findings.
• If it was determined to be safe by scientists and available for free to everyone who wanted it, there is an increase in the share of the public saying they would definitely or probably get a COVID-19 vaccine.
• 27% surveyed remain vaccine hesitant, saying they probably or definitely would not get a COVID-19 vaccine even if it were available for free and deemed safe by scientists.
• A large majority (71%) of the public believes a vaccine will be widely available for
anyone who wants it in the U.S. by the summer of 2021.
• Two-thirds of the public now say they are at least somewhat confident that when a COVID-19 vaccine becomes available, it will be distributed in a way that is fair, up from about half (52%) in September.
• People’s personal health care providers are the most trusted source for information on COVID-19 vaccines.
5
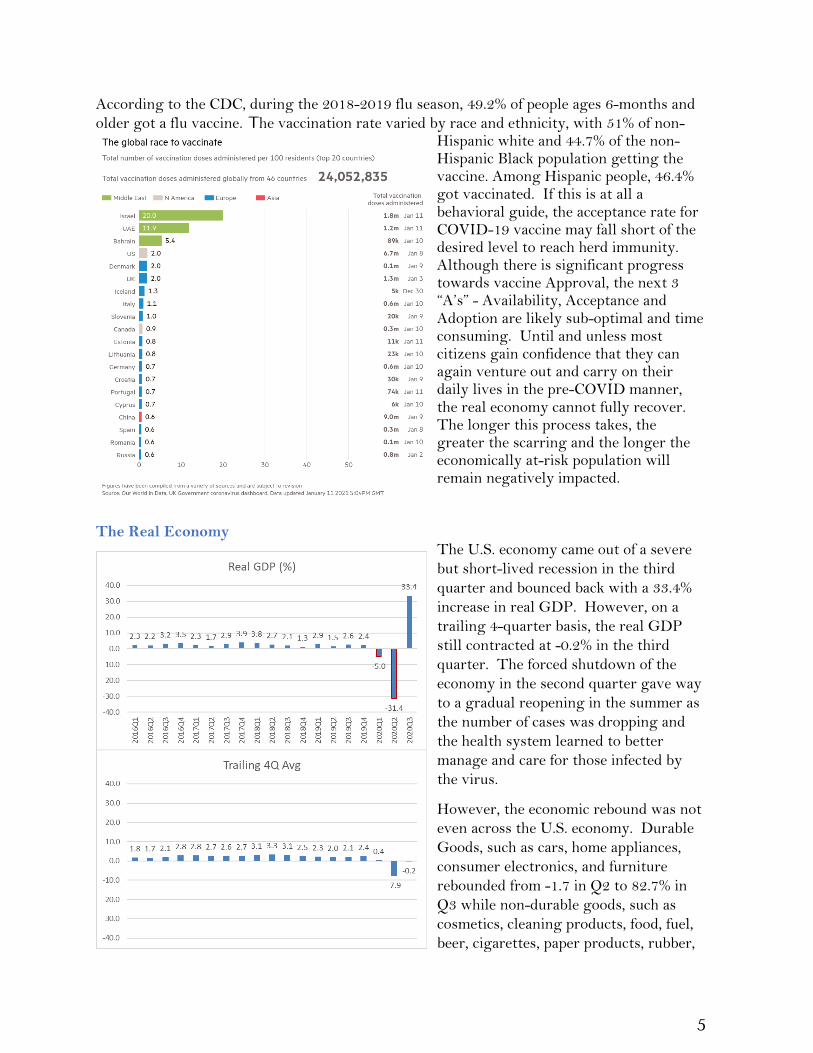
According to the CDC, during the 2018-2019 flu season, 49.2% of people ages 6-months and
older got a flu vaccine. The vaccination rate varied by race and ethnicity, with 51% of non-Hispanic white and 44.7% of the non-Hispanic Black population getting the vaccine. Among Hispanic people, 46.4% got vaccinated. If this is at all a behavioral guide, the acceptance rate for COVID-19 vaccine may fall short of the desired level to reach herd immunity. Although there is significant progress towards vaccine Approval, the next 3 “A’s” - Availability, Acceptance and Adoption are likely sub-optimal and time consuming. Until and unless most citizens gain confidence that they can again venture out and carry on their daily lives in the pre-COVID manner, the real economy cannot fully recover. The longer this process takes, the greater the scarring and the longer the economically at-risk population will remain negatively impacted.
The Real Economy
The U.S. economy came out of a severe
but short-lived recession in the third
quarter and bounced back with a 33.4%
increase in real GDP. However, on a
trailing 4-quarter basis, the real GDP
still contracted at -0.2% in the third
quarter. The forced shutdown of the
economy in the second quarter gave way
to a gradual reopening in the summer as
the number of cases was dropping and
the health system learned to better
manage and care for those infected by
the virus.
However, the economic rebound was not
even across the U.S. economy. Durable
Goods, such as cars, home appliances,
consumer electronics, and furniture
rebounded from -1.7 in Q2 to 82.7% in
Q3 while non-durable goods, such as
cosmetics, cleaning products, food, fuel,
beer, cigarettes, paper products, rubber,

6
textiles, clothing and footwear, rebounded from -15% to a positive 31.1%. On the other hand,
Services went from a -41.8% in Q2 to 38% in Q3. And in the case of capital investment, there
was a recovery from -35.9% for equipment spending in Q2 to 68.2% in Q3 but a depressed
recovery in spending for physical structure and intellectual properties. Not surprisingly
however, the residential component went from a -35.6% in Q2 to a +63 in Q3. At historically
low interest rates, residential real estate became more affordable. Also, during a pandemic,
many looked to move away from crowded urban areas and purchased new homes in suburbs
or even rural areas.
With COVID-19, hospitalizations and deaths on the rise since November8 and being expected
to continue through January, the fourth quarter GDP is likely to slow again. There are signs
that the pace of improvement has moderated.
Depending on how the Biden Administration will manage the current COVID-19 outbreak
and how quickly and orderly vaccines are distributed, we are not expecting a more
sustainable economic recovery until the back half of this year.
Interest Rate & the Treasury Yield Curve
The Federal Reserve has been explicit about their stance on interest rates since September
last year. The Fed is to maintain an accommodative stance of monetary policy and the zero
bound interest rate (ZIRP) until (1) labor market conditions have reached levels consistent
with its assessments of maximum employment and (2) inflation is on track to moderately
exceed 2 percent for some time. This is in addition to continuing to increase its holdings of
Treasury securities by at least $80 billion per month and holdings of agency mortgage-
backed securities by at least $40 billion per month (Quantitative Easing or “QE”).
Furthermore, according to vice-chair Richard Clarida’s January 8th prepared remarks at the
International Economics Council on Foreign Relations, he said that “going forward, a low
unemployment rate, in and of itself, will not be sufficient to trigger a tightening of monetary
policy absent any evidence from other indicators that inflation is at risk of moving above
mandate-consistent levels.” The new Monetary Policy Framework introduced last year looks
to “achieve inflation that averages 2% over time, and following periods when inflation has
been running persistently below 2%, appropriate monetary policy will likely aim to achieve
inflation moderately above 2% for some time.”
8 https://www.npr.org/sections/health-shots/2020/09/01/816707182/map-tracking-the-spread-of-the-coronavirus-in-the-u-s

7
Two things to note here: first is the Federal Reserve’s abandonment of identifying and using
the illusionary u*, the natural rate of employment or NAIRU, as a trigger for adjusting
interest rate in anticipation of inflation. And second, the Federal Reserve is doubling up its
focus on attaining a persistent 2% inflation rate. To put it another way, the Federal Reserve
remains committed to the Phillips’ Curve relationship between unemployment rate and
inflation (aggregate demand). The decade of economic recovery since the Great Recession has
brought unemployment down to 3.5% (which is deemed to be much lower than the expected
u*), yet inflation stubbornly remained below the 2% target. This means that the Federal
Reserve will remain patient and continue its extraordinarily dovish monetary policies to
return to full employment which should ultimately return inflation that averages 2% over
time.
It is important to note that interest rate represents the market expectation of future inflation.
This means that the higher the inflation expectation investors have, the higher their interest
rate expectation for bonds. Currently, the Bloomberg Barclays Capital U.S. Aggregate Bond
Index (representing investment grade bonds including U.S. government securities) has an
effective duration9 of 5.93. The bond index would lose 5.93% for every 1% rise in interest
rate. With the 12-month trailing yield at 2.16%, a rise of 1% interest rate, the index would
lose 3.77%. Under the current interest rate policy, the risk for bond investing has
significantly increased when inflation returns.
Two components contribute to the total return of a bond: interest payments and capital
appreciation. With interest rates at historical lows, the bond yield has plummeted and is
insufficient to make up losses in the event interest rate increases. Further, capital
appreciation happens when interest rate drops. However, under the ZIRP environment,
capital appreciation is simply not available for bonds, unless interest rates go negative (as in
the case of Europe and Japan). Thus far, the Federal Reserve has pushed against going into
negative rates.
9 Measures the sensitivity of the price of a bond with or without embedded options to changes in interest rates, taking into account the likelihood of the bond being called, put and/or sunk prior to its final maturity date while incorporating after-tax impact on the bond.
8
The upper left graph on the prior page shows the yield curve continues to steepen, with the
front end of the curve (Federal Reserve setting rates and using QE to buy bonds in this
segment) remaining anchored while the long end of the yield curve moves higher. This is
illustrated in the upper right chart that shows the 5-, 7-, 10-, 20- and 30-year “real” or
inflation-adjusted treasury yield since January last year. Under accommodative monetary
policies, the entire Treasury yield curve is in negative territory. With the Federal Reserve’s
emphasis on the shorter end of the yield curve, this is naturally the segment that experiences
the greatest yield pain (financial repression).
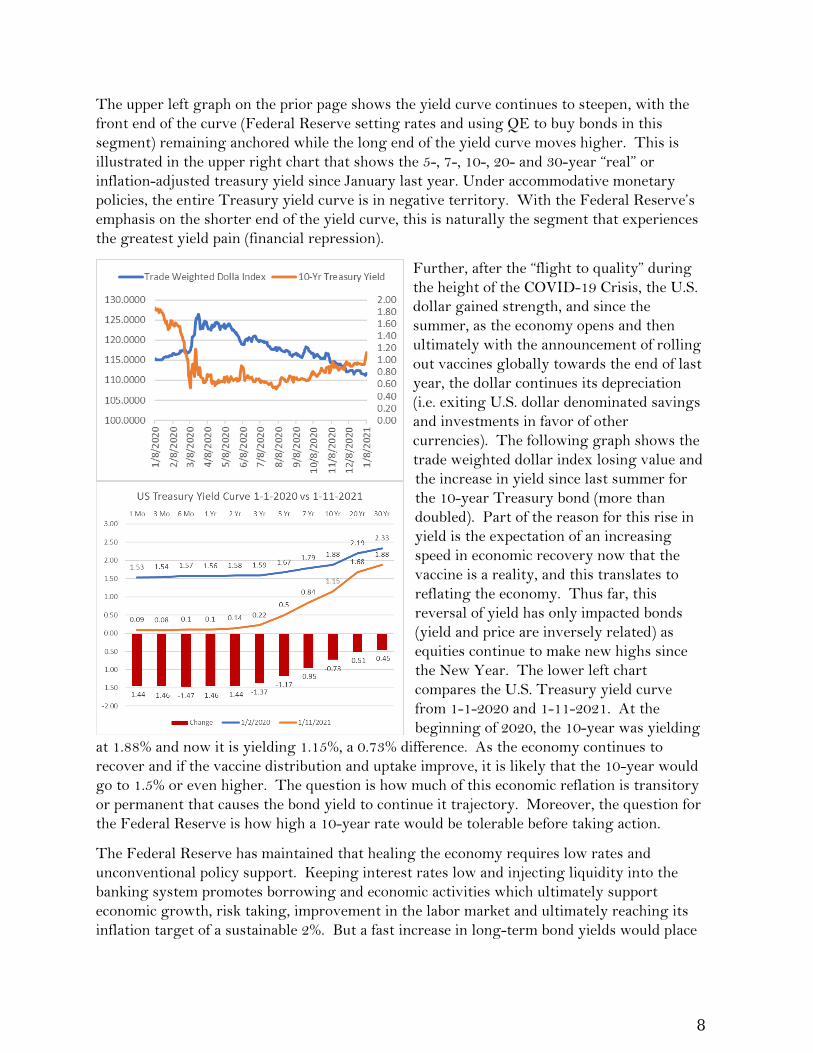
Further, after the “flight to quality” during
the height of the COVID-19 Crisis, the U.S.
dollar gained strength, and since the
summer, as the economy opens and then
ultimately with the announcement of rolling
out vaccines globally towards the end of last
year, the dollar continues its depreciation
(i.e. exiting U.S. dollar denominated savings
and investments in favor of other
currencies). The following graph shows the
trade weighted dollar index losing value and
the increase in yield since last summer for
the 10-year Treasury bond (more than
doubled). Part of the reason for this rise in
yield is the expectation of an increasing
speed in economic recovery now that the
vaccine is a reality, and this translates to
reflating the economy. Thus far, this
reversal of yield has only impacted bonds
(yield and price are inversely related) as
equities continue to make new highs since
the New Year. The lower left chart
compares the U.S. Treasury yield curve
from 1-1-2020 and 1-11-2021. At the
beginning of 2020, the 10-year was yielding
at 1.88% and now it is yielding 1.15%, a 0.73% difference. As the economy continues to
recover and if the vaccine distribution and uptake improve, it is likely that the 10-year would
go to 1.5% or even higher. The question is how much of this economic reflation is transitory
or permanent that causes the bond yield to continue it trajectory. Moreover, the question for
the Federal Reserve is how high a 10-year rate would be tolerable before taking action.
The Federal Reserve has maintained that healing the economy requires low rates and
unconventional policy support. Keeping interest rates low and injecting liquidity into the
banking system promotes borrowing and economic activities which ultimately support
economic growth, risk taking, improvement in the labor market and ultimately reaching its
inflation target of a sustainable 2%. But a fast increase in long-term bond yields would place
9
stress on the financial markets and the economy. As such, it is likely that the Federal Reserve
will consider at some point to begin buying bonds, as a part of its QE efforts, in the longer
end of the yield curve to offset a rise in yield, thereby pushing the yield curve back down.
Reflation & Inflation
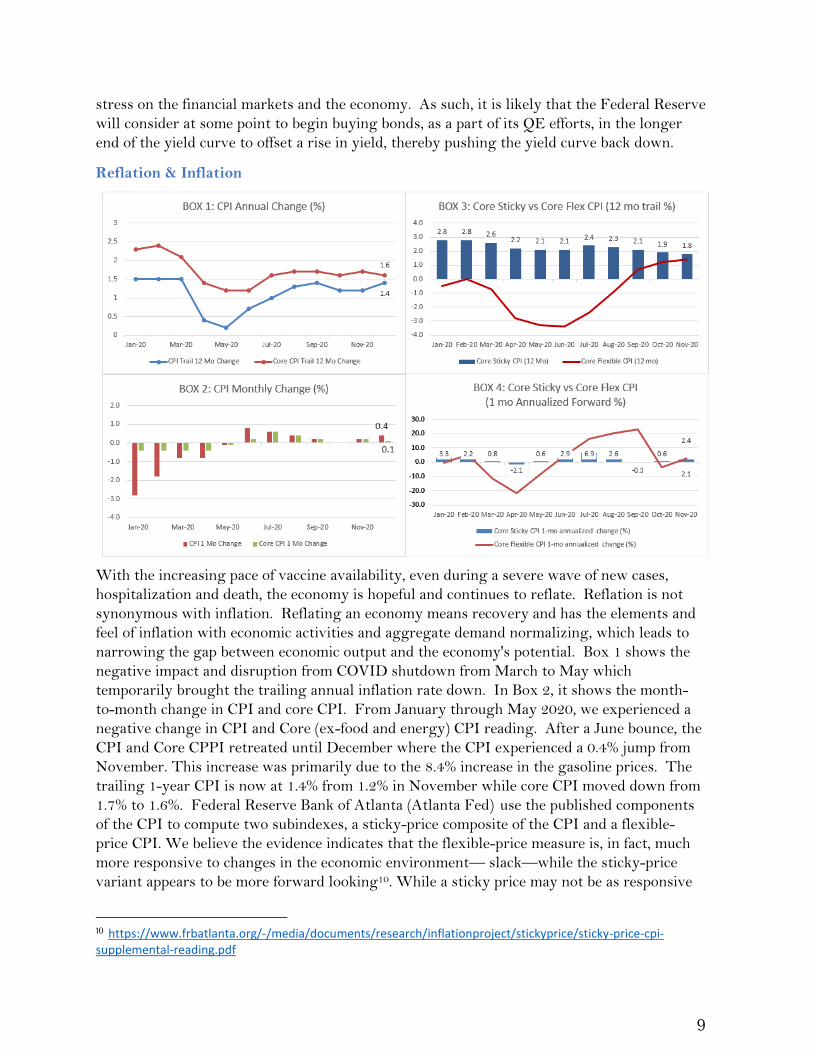
With the increasing pace of vaccine availability, even during a severe wave of new cases,
hospitalization and death, the economy is hopeful and continues to reflate. Reflation is not
synonymous with inflation. Reflating an economy means recovery and has the elements and
feel of inflation with economic activities and aggregate demand normalizing, which leads to
narrowing the gap between economic output and the economy's potential. Box 1 shows the
negative impact and disruption from COVID shutdown from March to May which
temporarily brought the trailing annual inflation rate down. In Box 2, it shows the month-
to-month change in CPI and core CPI. From January through May 2020, we experienced a
negative change in CPI and Core (ex-food and energy) CPI reading. After a June bounce, the
CPI and Core CPPI retreated until December where the CPI experienced a 0.4% jump from
November. This increase was primarily due to the 8.4% increase in the gasoline prices. The
trailing 1-year CPI is now at 1.4% from 1.2% in November while core CPI moved down from
1.7% to 1.6%. Federal Reserve Bank of Atlanta (Atlanta Fed) use the published components
of the CPI to compute two subindexes, a sticky-price composite of the CPI and a flexible-
price CPI. We believe the evidence indicates that the flexible-price measure is, in fact, much
more responsive to changes in the economic environment— slack—while the sticky-price
variant appears to be more forward looking10. While a sticky price may not be as responsive
10 https://www.frbatlanta.org/-/media/documents/research/inflationproject/stickyprice/sticky-price-cpi-supplemental-reading.pdf

10
to economic conditions as a flexible price, it may do a better job of incorporating inflation
expectations. Since price setters understand that it will be costly to change prices, they will
want their price decisions to account for inflation over the periods between their infrequent
price changes.
Box 3 shows the core sticky CPI has moved from an annualized 1.9% in October to 1.8% in
November while the core flex CPI continues to rise and moved from 1.2% to 1.4%. This
suggests that, after months in the negative territory, prices are recovering and advancing.
Box 4 shows the 1-month annualized forward change. The core flex CPI is now pointing to a
2.4% increase while the core sticky CPI is pointing to a 2.1% increase for the next 12 months.
These projections should not be deemed reliable since they are simply extending the same
rate of price change for the next 12-months. Nonetheless, both core flex and sticky CPI
indexes continue to show recovery of the economy, or economic reflation.
From a market perspective, the
5-year-5-year forward (i.e. what
investors believe 5 years from
now what the following 5 years
would be) inflation expectation
and the 10-year breakeven
inflation rate are both trending
upward from the low reached in
March last year. However, they
are still around 2% at this point,
whereas the Michigan
University consumer-based
survey of expected price change
for the next 12 months has also increased to 2.8% from the low of 2.1% in April 2020. One
interpretation is that consumers are expecting a slightly higher inflation in the near term
while market participants are pricing inflation expectation in the long run at or around 2%.
We expect CPI to continue its upward trajectory as a function of reflation. Moreover, as the
year moves on and the negative inflation months drop off from backward looking CPI
calculation, future increases would be magnified; this is known as the base effect11. It is likely
that CPI will be in the 2.5% to 3% range later this year, but the sustainability of a higher CPI
in the medium term would be a function of how well COVID-19 is contained, the successful
adoption of vaccines, the proven efficacy of vaccines, and the resulting speed and
inclusiveness of the recovery. There is no question that many of us are longing for the day
when we can gather together again and return to more normal social, travel and leisure
conditions. As such, there will sure be a surge in economic activities. Moreover, if these
activities are timed with a significant multi-year infrastructure spending, we could see a
return of sustainable inflation above 2.5% over the next decade.
11 The base effect is the distortion in a monthly inflation figure that results from abnormally high or low levels of inflation in the year-ago month. A base effect can make it difficult to accurately assess inflation levels over time. It diminishes over time if inflation levels are relatively constant.

11
The Federal Reserve Projections
According to the December FOMC meeting release of their Economic Projections, it clearly
shows that the GDP continued to be revised upward in response to the positive and
unprecedented monetary and fiscal policies unleashed. Now the U.S. economy is projected to
shrink by 2.4% for 2020 instead of the June projection of -6.5% or the September projection of
3.7%. Further, this year’s GDP projection has been revised upward by 20bp to 4.2%. In the
case of the U3 unemployment rate, it is expected to improve from 7.6% in September to 6.7%
in December’s projection. For 2021, the rate is projected to go to 5% and continue to
improve over the next two years.
This upper left chart shows the weekly initial jobless claims since the first week in2020.
After the March 28th high of 6.867 million claims, it is now, for the week January 2, 2021, at
787,000. The upper right chart shows the U3 unemployment rate of 6.7% in December from
a high of 14.7% in April. Most economists at the time were expecting a double-digit rate at

12
2020 year-end. The bounce back has been a positive surprise. However, the U6
unemployment rate (total unemployed of U3, plus all persons marginally attached to the
labor force, plus total employed part time for economic reasons, as a percent of the civilian
labor force plus all persons marginally attached to the labor force) remains in double-digits,
11.7% in December as compared to 22.8% in April. Most consider this U6 rate to be a better
reflection of the true picture of the labor economy. Also, there is the participation rate at
61.5% as compared to January 2020 (pre-COVID-19) rate of 63.2%.
Another statistic favored by economists
is the Employment-Population Ratio.
This ratio is a measure of the number of
people employed against the total
working-age population. In December,
the ratio was 57.4% compared with
61.1% in January. Once again, this
suggests that 3.7% of the eligible
working adults have left the workforce
during the 10-month period and this is
NOT reflected in the U3 or U6 statistics.
In the Great Recession, it took almost
10-years to soak up the slack in the labor force. This is a contributing factor to the Federal
Reserve to maintain very accommodative monetary policies to provide a friendly
environment for business activity and financial stability to encourage hiring. The reality is
that, unless the labor economy continues to recover, it is difficult for aggregate demand (of
the GDP) to close the gap between economic output and the economy's potential. Then again,
we need to first address the COVID-19 threat comprehensively and methodically. Until then,
fiscal policies (a new round of $600 stimulus checks, $300 weekly enhanced unemployment
benefits, unemployment extension and more PPP loans) are the only targeted way to make up
the loss of income and bridge the economy to “normal”. The problem is that the December
$900 Billion Relief Bill is only supposed to buy us 3 months of time. With the Availability,
Acceptance and Adoption challenges, the U.S. may need another $900 billion to extend the
bridge for 3 more months. These relief payments, on the one hand, keep our economy going
and mask the real challenges to those who have lost jobs, skills, homes, savings and
opportunities, and the K-shaped recovery continues.
The Federal Reserve projects 1.8% inflation this year after a 1.2% year in 2020. For many
well-known reasons, inflation is not expected to rise in the long run; technology
advancement/digitization and demographic/aging population are often mentioned. In the
intermediate term with many post-COVID challenges, aggregate demand remains weak, and
the QE policy has newly minted dollars trapped inside the banking system and has shown,
since 2009, that it is ineffective in moving inflation or inflation expectation. The one-off fiscal
relief efforts will not spur sustainable inflation. This means that any reflation (due to the
base effect) will likely be transitory, and the market and the Federal Reserve will likely look
through this transitory inflation. However, if the Biden Administration and Congress are
successful in passing major, multi-year infrastructure legislation, that could push inflation

13
(beyond reflation) higher than anticipated by the Federal Reserve. As a consequence, longer-
term rates would rise in anticipation. If this is not controlled, it could be a real headwind for
risk assets.
The Two Economies The financial economy has not only recovered when measured by the U.S. equities market, it has persistently made all-time highs. The tech heavy NASDAQ 100 Index delivered a spectacular 48.8% return. Even the Bloomberg Barclays Capital U.S. Aggregate Bond Index - investment grade and government bond – gave us a whopping 7.51% return for the year. Of course, these return numbers do not begin to show the volatility and risk investors
had to endure during a period of extraordinary uncertainty and unknowns. It is true that the zero bound interest rate has given bond prices a huge lift and the QE program has strengthened the safety net for investors to take risk. The Federal Reserve has successfully affirmed its capacity as the “buyer” of last resort. As stated earlier, there is very little income left in bonds, and going forward, there is little appreciation unless normal interest rates go negative. For individuals and institutions seeking income and return, there is no alternative (TINA) but to take on risk. Thus, even as the bottom third of the economy (unemployed service workers, marginally attached gig workers and small businesses owners) continue to struggle, the asset owners or those still secure in their jobs are able to fuel and profit from
inflating share prices. Market participants being forward looking discounts the current political and healthcare risks and looks to a full recovery. On the other hand, manufacturing in the US and globally are recovering at a faster pace than most expected. With inventory low due to virus induced supply chain disruptions and companies hunkering down during the initial outbreak, the need for replenishing inventory and supply is driving the initial sharp response. Again, if the real economy can recover more from here with COVID under control, we see a continuation of manufacturing resurgence which adds to the reflation theme. The US PMI definitively shows the recovery strength. However, retail sales continues to disappoint and reflects the weakness in certain
segments of the economy and the expiration of the first round of fiscal support for one time payment and unemployment payment extension. This will reverse somewhat with the $900
U.S. PMI
Retail Sales

14
billion fiscal support and definitely with the in-coming Administration’s go-big-or-go-home fiscal package. Moving Forward
The recent experiences from 9/11, 2008 and 2020 should clearly remind us all that the future
is unknowable. Regardless of how smart, thoughtful and experienced one may be, predicting
the future is about assigning a “personal” probability to a future outcome and is nothing more
than a speculation. The challenge is that the “we-know-what-we-know” (“Known Knowns”)
and “we-know-what-we-don’t-know” (“Known Unknowns”) occupy only small segments of
the knowledge universe. The segments of “we-don’t-know-what-we-don’t-know” (“Unknown
Unknowns”) and “Unknowables” are far greater and more impactful to investing and decision
making. The Unknown Unknowns for any one person may fall into the Known Knowns of
others and learning from such others and using the Socratic method of inquiry is essential in
expanding our Known Knowns and self-awareness. But the largest gap remains the
Unknowables.
In John Kay and Mervyn King’s book, Radical Uncertainty: Decision-Making Beyond the
Numbers, they posited that life is not a puzzle since there is always a way or someone has the
way to solve a puzzle. It reminds me of Annie Duke’s analogy in her book, Thinking in Bets:
Making Smarter Decisions When You Don't Have All. She opined that many think of decision
making as a chess game, but in reality, life is much less predictable than a chess game where
every move or countermove has been mapped out and is knowable. She suggests that life is
more like playing poker where the well laid out and thoughtful process in deriving a decision
can still result in a poor outcome because of the uncontrollable variability of “luck”. Kay and
King suggest that life is more like a mystery where the outcome is radically uncertain because
of the effects of Unknown Unknowns and Unknowables.
The Nature magazine January 13, 2021 article12 on COVID mutation states that researchers
have identified thousands of mutations in SARS-CoV-2 samples, but the vast majority are
unlikely to have much effect on the virus’s biology. But a handful of mutations to SARS-CoV-
2 can help it to escape the immune response mounted by a subset of infected people.
According to WebMd13, at least one new “super strain” of the virus is already in the U.S.
Another highly contagious strain from South Africa could be on its way. The strains are
about 50% more contagious than the virus that has been most widely circulating in the U.S.,
though it doesn’t seem to be more fatal for any one person who catches it. Mutation is part of
nature and is a Known Unknown. We need to be vigilant in testing, tracing, cooperation and
research in an attempt to guard against such mutated variants timely. If there is no new
COVID mutated strain that can be defended by current vaccines, we don’t expect to be back
to normal at the earliest in October. But there is no certainty of this. We have never left a
radically uncertain world even with all the technological advancements and we should remind
ourselves the natural human bias or intuitive preference is for stability and blind to our blind
spots for randomness. We function best when we believe the world is predictable since the
12 https://www.nature.com/articles/d41586-020-00502-w 13 https://www.webmd.com/lung/news/20210107/new-covid-super-strains-could-disrupt-life-again
15
reality of uncertainty adds significant stress to our daily living that we become unproductive
and even cease to function.
With the realization that investment, as in life, is not a puzzle or chess, that has a manageable
outcome, the only prudent approach to investment decisions is to be agile (respond to new
knowns), inquisitive (make unknowns known,) and anticipate downside surprise (guard
against unknowables).
Sincerely yours, EXPERIENTIAL WEALTH Philip Chao, Principal & CIO This quarterly commentary represents the current views of Experiential Wealth, and they are subject to change. This Firm has no obligation or responsibility to update our views. The comments and views should not be deemed as Philip Chao, or any member of this Firm, offering personal or personalized investment advice. The quarterly commentary is informational only and is insufficient to be relied upon to make any financial or investment decisions or to make any changes to your financial condition.