Embed Size (px)
Citation preview

The Logic of Flow: Some Indispensable Concepts
FLOWCON 2014San Francisco, CA
September 3, 2014
Donald G. ReinertsenReinertsen & Associates
600 Via Monte D’OroRedondo Beach, CA 90277 U.S.A.
(310)-373-5332Internet: [email protected]
Twitter: @dreinertsenwww.ReinertsenAssociates.com
No part of this presentation may be reproducedwithout the written permission of the author.

2Copyright 2014, Reinertsen & Associates
Objectives
• Discuss some key scientific and economic concepts behind flow.• Queueing• Batch size reduction• Fast feedback• Congestion control
• Interest you in exploring more advanced ideas.
3Copyright 2014, Reinertsen & Associates
Queueing

Traffic at rush hour illustrates the classic characteristics of a queueing system.
Pho
to C
opyr
ight
200
0 C
omst
ock,
Inc.

5Copyright 2014, Reinertsen & Associates
The Effect of Capacity Utilization
Queue Size vs. Capacity Utilization
0
5
10
15
20
0% 10% 20% 30% 40% 50% 60% 70% 80% 90% 100%Capacity Utilization
Que
ue S
ize Deterministic
Stochastic
1
2
qL
Notes: Assumes M/M/1/ Queue, = Capacity Utilization, Lq = Length of Queue

6Copyright 2014, Reinertsen & Associates
Total Cost
Cost of Delay
Cost of Excess Capacity
The Economic Tradeoff
Excess Product Development Resource
Dollars
To Maximize Profits, Minimize Total Cost
7Copyright 2014, Reinertsen & Associates
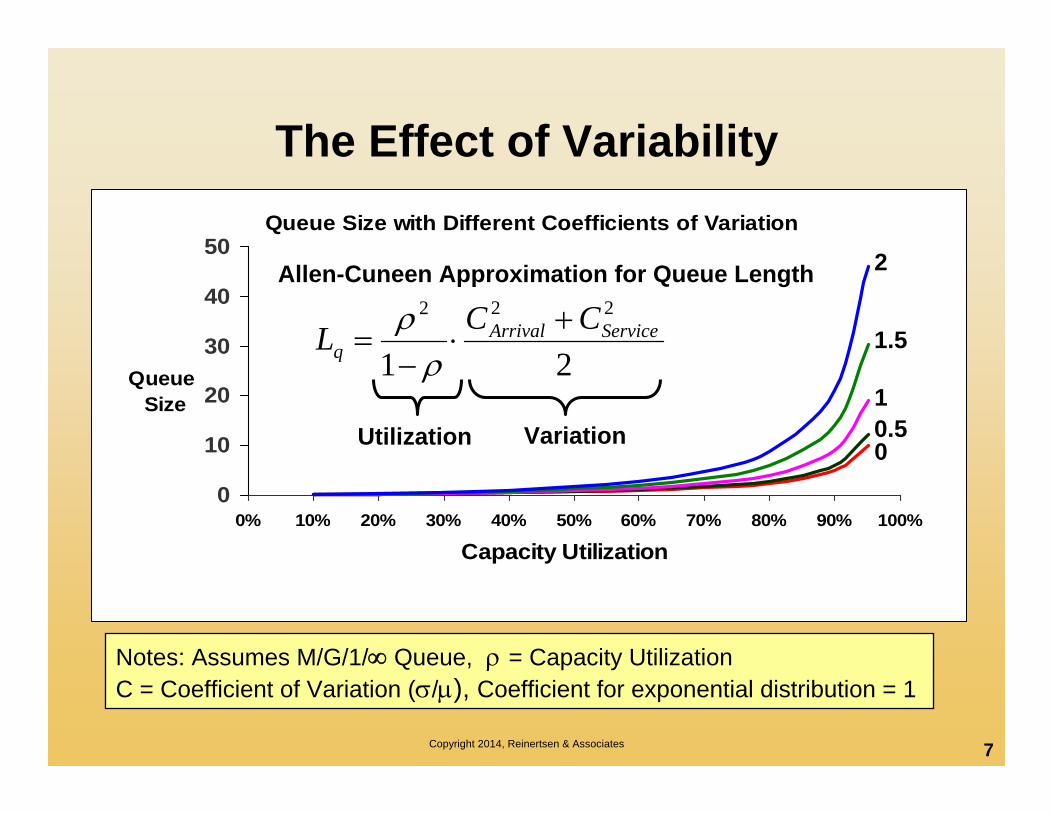
The Effect of VariabilityQueue Size with Different Coefficients of Variation
0
10
20
30
40
50
0% 10% 20% 30% 40% 50% 60% 70% 80% 90% 100%
Capacity Utilization
Queue Size
2
1.5
10.50
21
222ServiceArrival
qCCL
VariationUtilization
Allen-Cuneen Approximation for Queue Length
Notes: Assumes M/G/1/ Queue, = Capacity UtilizationC = Coefficient of Variation (/), Coefficient for exponential distribution = 1

8Copyright 2014, Reinertsen & Associates
Batch Size Reduction

9Copyright 2014, Reinertsen & Associates
Finding Optimal Batch Size
Economic Batch Size
0
5
10
15
20
25
1 2 3 4 5 6 7 8 9 10
Items per Batch
Cost
Transaction Cost Holding Cost Total Cost

10Copyright 2014, Reinertsen & Associates
Ford W. HarrisProduction Engineer
Factory, The Magazine of Management
Volume 10, Number 2 February 1913
pp. 135-136, 152
“There are not many men who understand the theoryunderlying the economic size of lots, and so a knowledgeof it should be of considerable value.”

11Copyright 2014, Reinertsen & Associates
Economic Lot Size
VHFNQ
VHFNQ
VHQFN
VHQFN
dQdC
QVHQ
FNC
CCC
T
T
htT
2
22
20
2
2
2
2
CT = Total Cost per year
Ct = Cost of all batches per year
Ch = Holding Costs per year
F = Fixed cost per batch
N = Total items per year
Q = Items per batch
H = Holding Cost per year (as percent of item cost)
V = Cost per item in batch
Optimal Lot Size!

12Copyright 2014, Reinertsen & Associates
Economic Lot Size
VHFNQ
VHFNQ
VHQFN
VHQFN
dQdC
QVHQ
FNC
CCC
T
T
htT
2
22
20
2
2
2
2
CT = Total Cost per year
Ct = Cost of all batches per year
Ch = Holding Costs per year
F = Fixed cost per batch
N = Total items per year
Q = Items per batch
H = Holding Cost per year (as percent of item cost)
V = Cost per item in batch
Optimal Lot Size

13Copyright 2014, Reinertsen & Associates
The Effect of Transaction Cost • When we decrease the fixed transaction
cost we create a smaller optimal batch size.• When we adopt this new optimal batch size
we obtain a lower total cost. • Thus, our one-time investment in enabling
smaller batches is returned in form of a recurring stream of lower total costs.
FNVHT C 2
Total Cost at Optimal Batch Size

14Copyright 2014, Reinertsen & Associates
Transaction Cost Drives Total Cost
Economic Batch Size
0
10
20
30
40
50
60
1 10 20 30 40 50 60 70 80 90 100
Batch Size
CostOld Transaction CostOld Total CostNew Transaction CostNew Total Cost
Old OptimumBatch Size
New OptimumBatch Size

15Copyright 2014, Reinertsen & Associates
Fast Feedback

16Copyright 2014, Reinertsen & Associates
1 6 11 16 21 26 31 36 41
Arrivals Departures
Time 21: 400 Passengers Arrive,
Queue up 5x by Time 22 Time 41:
Cycle Time up 2x
CumulativeQuantity
Better to Monitor Queues than Cycle Time

17Copyright 2014, Reinertsen & Associates
1 6 11 16 21 26 31 36 41
Arrivals Departures
Time 21: 400 Passengers Arrive,
Queue up 5x by Time 22
CumulativeQuantity
React Quickly to Rising Queues
QueueReduction
React by Time 24

18Copyright 2014, Reinertsen & Associates
Congestion Control

19Copyright 2014, Reinertsen & Associates
Traffic Flow
Flow = Speed x Density
Vehicles Miles VehiclesHour Hour Mile= x

20Copyright 2014, Reinertsen & Associates
0
1000
2000
3000
4000
5000
6000
0 10 20 30 40 50 60 70 80 90Miles per Hour
Vehi
cles
per
Hou
r
0
50
100
150
200
250
300
Vehi
cles
per
Mile
Mile
s pe
r H
our
Flow Speed Density
Highway Throughput
Originally observed by Bruce Greenshields in 1934.

21Copyright 2014, Reinertsen & Associates
0
1000
2000
3000
4000
5000
6000
0 10 20 30 40 50 60 70 80 90Miles per Hour
Vehi
cles
per
Hou
r
ExcessDensity
InsufficientDensity
Unstable Stable
Feedback Effects
Where should we operate this system?

22Copyright 2014, Reinertsen & Associates
Learning from Transportation Networks I.1.Maximum flow does not occur at either
maximum speed or maximum occupancy.2.Optimization requires tradeoffs between
speed vs. occupancy.3.Flow is unstable when occupancy exceeds
the optimum level and stable below this point.
4.Fast responses are critical because queues grow faster than they shrink.
5.We should exploit both provisioning and active congestion management.
6.Smoothing flows before bottlenecks raises throughput.

23Copyright 2014, Reinertsen & Associates
Learning from Transportation Networks II.
7. We should add capacity margin in zones of high variation.
8. Adaptive controls aid flow. 9. Queues produce spontaneous variation.
10. Lane changing can improve flows or worsen them.
11. Queue control improves with scale; scheduling becomes more difficult with scale.
12. We can make fast effective adjustments by combining centralized information and decentralized control.

24Copyright 2014, Reinertsen & Associates
1. Both capacity and queues cost money. 2. Quantify the economics of your tradeoffs.3. Know the Cost-of-Delay.4. Exploit the flat bottom of the U-curve. 5. Reduce batch size before adding capacity. 6. Enable smaller batches by reducing transaction costs.7. Transaction cost reduction will usually pay for itself.8. Monitor queues instead of cycle time.9. React quickly to expanding queues. 10. Design your process to tolerate variability. 11. Operate your process to minimize the effect of variability.12. Look beyond the ideas of manufacturing.
Some Take Aways

25Copyright 2014, Reinertsen & Associates
1991 / 1997 1997 2009
Going Further
Print + KindlePrint + Kindle
Print Only
“It's wonderful and dense. Filling and satisfying even in small bites. Like fine cheese.“
– Torbjörn Gyllebring (@drunkcod)