Embed Size (px)
Citation preview
Documento de Trabajo/ Working Paper
IESA 18-04
The Leisure Experience: Me and the Others
VICTORIA ATECA-AMESTOY, RAFAEL SERRANO-DEL-ROSAL &
ESPERANZA VERA-TOSCANO Instituto de Estudios Sociales de Andalucía (IESA). CSIC.
Córdoba
1
The leisure experience: Me and the others.
Victoria Ateca-Amestoy, Rafael Serrano-del-Rosal, and Esperanza Vera-Toscano, Institute for Advanced Social Studies-Andalucía (IESA-CSIC), Spain
Abstract
Research on Subjective Well-Being (SWB) recognizes the important role of individual
Leisure Satisfaction – measured by responses to a stated leisure experience valuation
question – as a mediator of individual Happiness. Leisure is a complex human need,
where “non-working time” is not the only productive factor required. In this sense,
individual heterogeneity must be taken into account due to the relevance of tastes
(each agent defines the boundaries of her own “leisure experience”), skills (since she
implements an optimal allocation of resources given a technology to produce and
consume that leisure experience), and resources availability.
The purpose of this paper is to investigate the determinants of individual Leisure
Satisfaction by using data derived from the 2003 Survey on Living Conditions and
Poverty for Andalucía (Spain).
Since we assume leisure experience is produced and consumed within the household,
utility and household production functions are the basis for our theoretical approach
and empirical specification. Then, using a self-reported measure of leisure experience
valuation (Leisure Satisfaction), ordered probit models are estimated. These models
account both for personal demographic characteristics as well as household socio-
economic variables allowing us to disentangle the impact of the latter into the allocation
of resources (time and goods) devoted to leisure experience production.
JEL classification: D60, D10, D13, J29.
Key words: Leisure satisfaction, time and goods, resource allocation, stated leisure
experience valuation.
2
1. Introduction and Motivation Following Beard and Ragheb (1980), leisure satisfaction can be defined as the
“positive perceptions or feelings that an individual forms, elicits, or gains as a result of
engaging in leisure activities and choices. It is the degree to which one is presently
content or pleased with her general leisure experiences and situations. This positive
feeling of pleasure results from the satisfaction of felt or unfelt needs of the individual”.
Above definition of leisure satisfaction recognizes the individual’s need for leisure. In
this sense, leisure is a complex human need with changing boundaries in its
conceptualisation, and in the way it is fulfilled through the consumption and production
of leisure experiences. It derives entirely from personal perceptions of what is
discretionary, enjoyable, pleasurable and satisfying (Kelly, 1982). The leisure
experience draws from the meaning of the activity to the individual, not from the activity
itself. Leisure may, in consequence, be different things to different people: an activity
which is work to one person may bring positive pleasure to another (for instance, many
of the household maintenance activities may lie in the boundaries between leisure and
childcare). These considerations will depend upon individual’s tastes and skills, and the
availability of resources (among which we can point out the relevance of time, goods,
and social interaction), which will determine individual’s optimal factor allocation among
alternative uses1. On the grounds of utility theory, increases in leisure experience are
desirable from an individual’s perspective and, in general, we assume individuals will
do their best, given a particular situation, to maximize their utility. For that reason, the
level of satisfaction derived from a given leisure experience will eventually be an
important determinant of individual happiness. Research on the concept of leisure satisfaction is relatively new, and knowledge
of this subject remains limited. A couple of studies deal with the determinants of leisure
satisfaction in an attempt to design a two layers model for the conceptualization of
general satisfaction (Van Praag, B.M.S., Frijters P., and Ferrer-i-Carbonell A., 2003;
Van Praag, B.M.S. and Ferrer-I-Carbonell, A., 2004). Donovan, Halpern and Sargeant
(2002) report some evidence on the impact of leisure activities on leisure satisfaction
and general satisfaction. For instance, a survey in the US, although rather dated, found
that for most people leisure is a less important source of satisfaction than job, marriage
or family, but for a minority leisure is more important. Among other reasons, leisure
activities increase individual well-being because they allow people to switch off
1 An alternative approach to the concept of leisure is that proposed by Gronau and Hammermesh (2003) who argue that leisure is not the complement of market work, rather is the use of discretionary time that requires the smallest expenditure on goods whose purchase is financed mostly by earnings in market work.
3
mentally or because of their social aspects. In fact, a consistent theme of research into
life satisfaction is that social relationships are very important. These same authors
report that some surveys have found that happiness is correlated with satisfaction with
leisure activities at around +0.40, declining to +0.20 when controlling for employment,
social class and other factor. In line with those reported results, a correlation of order
zero of +0.393 between leisure satisfaction and general satisfaction is derived from our
dataset, while partial correlation of +0.1718 arises when we control for the influence of
other domain satisfactions, namely environmental, financial, home, health and job2.
The purpose of this paper then is to contribute further research on the
conceptualization of individual leisure satisfaction as a particular domain of satisfaction
with life as a whole, providing empirical evidence to disentangle the effects of socio-
demographic and socio-economic characteristics on this leisure satisfaction domain
accounting for personal heterogeneity. This is made possible with a unique dataset
(Survey on Living Conditions and Poverty for Andalucía) that includes individual data
on reported leisure satisfaction and individual’s characteristics. Leisure satisfaction is
an elicited variable, expressing the degree of content that a given leisure experience
provides to an individual. Thus, the leisure satisfaction variable captures the valuation
of how the leisure need is individually satisfied by means of leisure experiences
production and consumption. Specifically, we model individual leisure satisfaction by
estimating an ordered probit.
We begin with a theoretical model (Section 2) that recognizes leisure as a
commodity from a consistent set of utility-maximizing ones including sleeping, lodging,
appearance, eating, childcare, health, travel and miscellaneous (Gronau and
Hammermesh, 2003). To simplify our approach these other commodities enter into the
analysis under the form of a composite capturing survival needs, called “household
maintenance”. Further, given the important role of individual leisure satisfaction as a
mediator of individual happiness, our empirical specification focuses on the
determinants of that individual leisure satisfaction. After discussion of our data from the
Survey on Living Conditions and Poverty in Andalucía (Section 3), we present new
evidence on the impact of both personal demographic characteristics as well as
household socio-economic variables allowing us to evaluate the impact of the latter into
leisure satisfaction, potentially through the allocation of resources (time and goods)
devoted to leisure experience production (Section 4). Section 5 concludes.
2 +0.393, Spearman correlation between LS and GS (since both outcomes are ordered variables) +0.1718, Spearman partial correlation between LS and GS accounting other domain satisfaction.
4
2. Theoretical Model and Empirical Specification
In a model of economic behaviour, individual utility depends on commodities that are
produced (using both consumption goods and time), and consumed within the
household. In our approach, we follow Becker’s (1965) idea of the household as a
factory combining market goods and time to produce the utility-maximizing set of
commodities. Whether one purchases groceries to combine them with time spent
shopping, cooking or enjoying a nice meal is up to the analyst, who must decide into
what consistent set of commodities to classify these goods and time uses. Thus, any
definition of commodities requires reasonable choices about categories and the
classification of inputs of goods and time (for further details on the topic see Gronau
and Hamermesh, 2003).
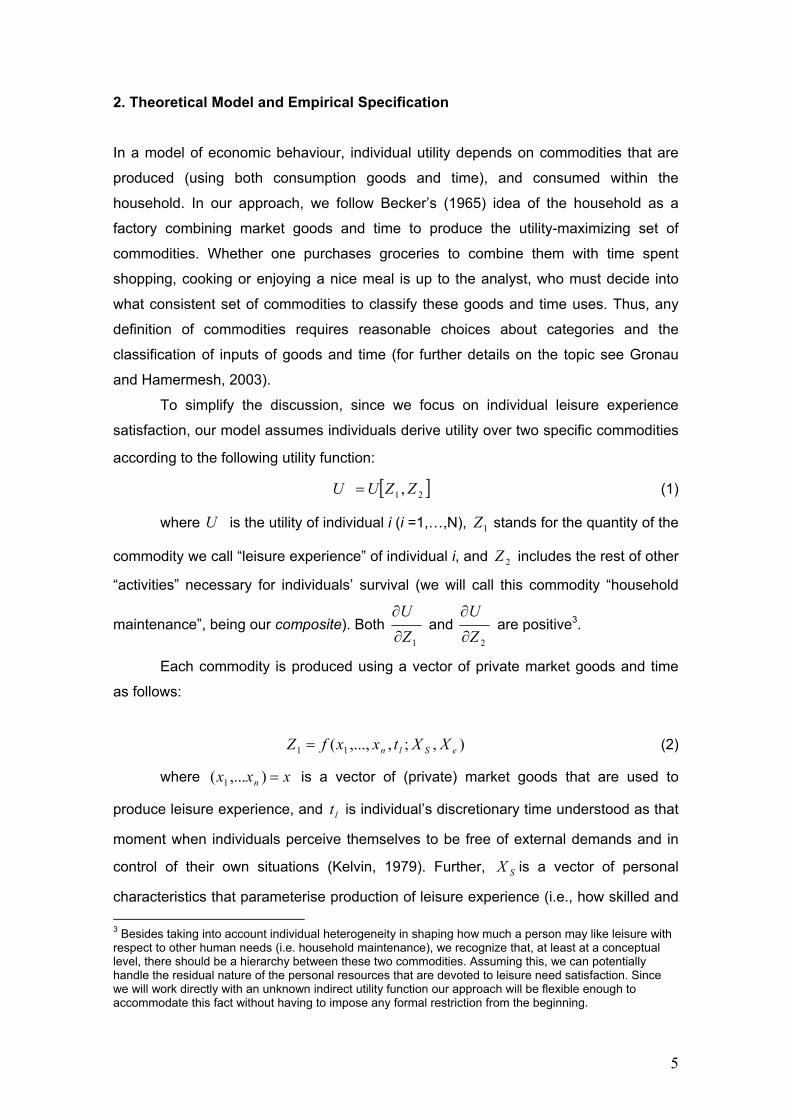
To simplify the discussion, since we focus on individual leisure experience
satisfaction, our model assumes individuals derive utility over two specific commodities
according to the following utility function:
[ 21 ,ZZUU = ] (1)
where U is the utility of individual i (i =1,…,N), stands for the quantity of the
commodity we call “leisure experience” of individual i, and includes the rest of other
“activities” necessary for individuals’ survival (we will call this commodity “household
maintenance”, being our composite). Both
1Z
2Z
1ZU∂
∂ and
2ZU∂
∂ are positive3.
Each commodity is produced using a vector of private market goods and time
as follows:
),;,,...,( 11 eSln XXtxxfZ = (2)
where ( is a vector of (private) market goods that are used to
produce leisure experience, and t is individual’s discretionary time understood as that
moment when individuals perceive themselves to be free of external demands and in
control of their own situations (Kelvin, 1979). Further, is a vector of personal
characteristics that parameterise production of leisure experience (i.e., how skilled and
xxx n =),...1
l
SX
3 Besides taking into account individual heterogeneity in shaping how much a person may like leisure with respect to other human needs (i.e. household maintenance), we recognize that, at least at a conceptual level, there should be a hierarchy between these two commodities. Assuming this, we can potentially handle the residual nature of the personal resources that are devoted to leisure need satisfaction. Since we will work directly with an unknown indirect utility function our approach will be flexible enough to accommodate this fact without having to impose any formal restriction from the beginning.
5
productive the individual is), and is the vector of environmental conditions that
shape the production function – no matter if they work as “extra” non personal public
goods or as constraints –. These “environmental variables” reflect the state of the art of
production, or the level of technology of the production process.
eX
,...1y
=
lt +
∑ ∑+x
i V=
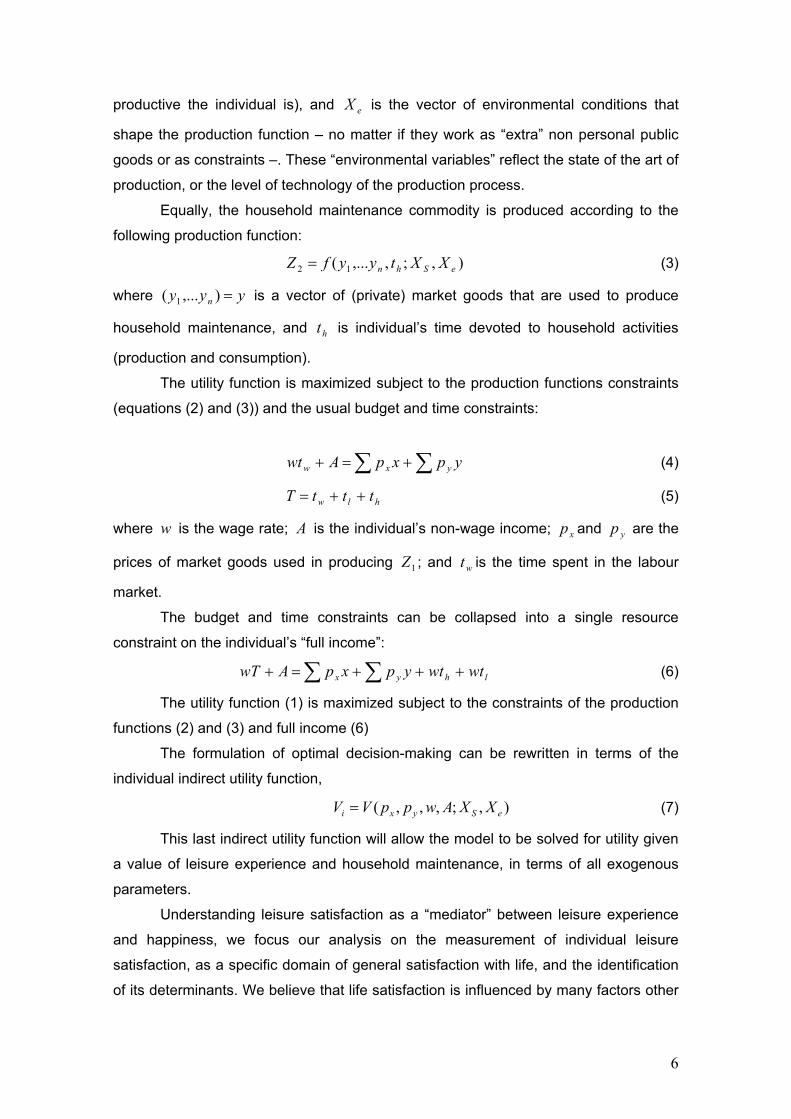
Equally, the household maintenance commodity is produced according to the
following production function:
),;,(2 eShn XXtyfZ = (3)
where is a vector of (private) market goods that are used to produce
household maintenance, and t is individual’s time devoted to household activities
(production and consumption).
yyy n =),...( 1
h
The utility function is maximized subject to the production functions constraints
(equations (2) and (3)) and the usual budget and time constraints:
∑ ∑++ ypxpAwt yxw (4)
hw ttT += (5)
where is the wage rate; is the individual’s non-wage income; and are the
prices of market goods used in producing ; and t is the time spent in the labour
market.
w A xp yp
1Z w
The budget and time constraints can be collapsed into a single resource
constraint on the individual’s “full income”:
++=+ lhyx wtwtyppAwT (6)
The utility function (1) is maximized subject to the constraints of the production
functions (2) and (3) and full income (6)
The formulation of optimal decision-making can be rewritten in terms of the
individual indirect utility function,
),;,,,( eSyx XXAwppV (7)
This last indirect utility function will allow the model to be solved for utility given
a value of leisure experience and household maintenance, in terms of all exogenous
parameters.
Understanding leisure satisfaction as a “mediator” between leisure experience
and happiness, we focus our analysis on the measurement of individual leisure
satisfaction, as a specific domain of general satisfaction with life, and the identification
of its determinants. We believe that life satisfaction is influenced by many factors other
6
than leisure experience, while leisure satisfaction has leisure experience as a major
input.
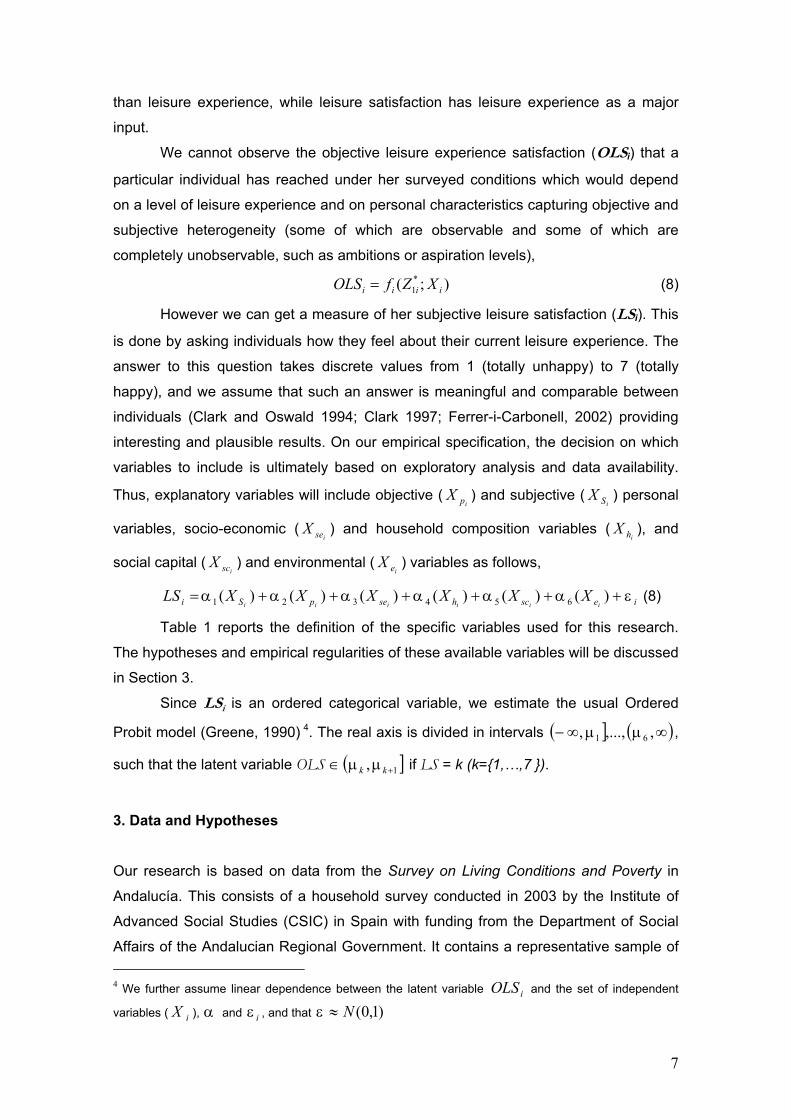
We cannot observe the objective leisure experience satisfaction (OLSi) that a
particular individual has reached under her surveyed conditions which would depend
on a level of leisure experience and on personal characteristics capturing objective and
subjective heterogeneity (some of which are observable and some of which are
completely unobservable, such as ambitions or aspiration levels),
);( *1 iiii XZfOLS = (8)
However we can get a measure of her subjective leisure satisfaction (LSi). This
is done by asking individuals how they feel about their current leisure experience. The
answer to this question takes discrete values from 1 (totally unhappy) to 7 (totally
happy), and we assume that such an answer is meaningful and comparable between
individuals (Clark and Oswald 1994; Clark 1997; Ferrer-i-Carbonell, 2002) providing
interesting and plausible results. On our empirical specification, the decision on which
variables to include is ultimately based on exploratory analysis and data availability.
Thus, explanatory variables will include objective ( ) and subjective ( ) personal
variables, socio-economic ( ) and household composition variables ( ), and
social capital ( ) and environmental ( ) variables as follows,
ipX
iSX
iseX
ihX
iscX
ieX
(8) ieschsepSi iiiiiiXXXXXXLS εαααααα ++++++= )()()()()()( 654321
Table 1 reports the definition of the specific variables used for this research.
The hypotheses and empirical regularities of these available variables will be discussed
in Section 3.
Since LSi is an ordered categorical variable, we estimate the usual Ordered
Probit model (Greene, 1990) 4. The real axis is divided in intervals ( ,
such that the latent variable OLS ∈ if LS = k (k={1,…,7 }).
] ( )∞∞− ,,...,, 61 µµ
( ]1, +kk µµ
3. Data and Hypotheses
Our research is based on data from the Survey on Living Conditions and Poverty in
Andalucía. This consists of a household survey conducted in 2003 by the Institute of
Advanced Social Studies (CSIC) in Spain with funding from the Department of Social
Affairs of the Andalucian Regional Government. It contains a representative sample of 4 We further assume linear dependence between the latent variable OLS and the set of independent
variables ( ), α and ε , and that ε i
iX i )1,0(N≈
7
approximately 6.000 household respondents providing information on a total of around
21.000 individuals. The target population is all people living in Andalucía aged 18 and
over, and the survey is designed to capture the well being of individuals and
households. This is a good resource for our analysis given the question on individual
leisure satisfaction in addition to its extensive range of individual and standard
household survey variables. Our empirical analysis focuses on full questionnaire
respondents. A sample5 was drawn of 6.393 questionnaire respondents that provided
complete information.
We now focus on the identification of determinants of individual’s leisure
experience satisfaction. Although current economic research provides little guidance on
testable hypotheses for individual’s leisure experience satisfaction, we can infer some
results from our theoretical model and bring some others reported on the literature on
time allocation in an attempt to provide a reasonable framework for testing.
Gronau and Hamermesh (2003) point out that leisure is one of the most time-
intensive commodities. Therefore, “time” is perhaps one of the most influential factors
on individual’s satisfaction with her leisure experience. However, we assume that time
is not valuable by itself. The passing of time does not provide any pleasure to a given
agent. Instead, it is an input that is combined with other productive factors in the
household production function. Hence, we begin by considering the relevance of
variables that will model the time availability that a given individual may enjoy. In doing
so, individual occupational status may be one of the most important features affecting
the level of one’s satisfaction with her leisure experience. Market work is a time
consuming activity, so it is supposed that working activities that require more in the
market working hours will reduce time availability for leisure (Z1), as well as for other
household maintenance activities (Z2). This restriction on the use of time will eventually
have a potential negative effect on the level of individual leisure satisfaction. Empirical
evidence supports this idea as Van Praag and Ferrer-i-Carbonell (2004) find how the
number of working hours has a strong negative effect on the amount of leisure
satisfaction. This result is further supported by the empirical research of Ahn, et al.
(2003). In contrast, researchers have investigated the relevant significance between
work and leisure as a quality of life measurement (Campbell, Converse & Rodgers,
1976; Haavio-Mannila, 1971; London, Crandall, & Seals, 1977). Results indicate that
market work can also deeply influence the enhancement of one's leisure satisfaction.
5 The sample is drawn using a stratified, multi-stage design using probability sampling. The principal stratification of the sample takes place by poverty levels, gender and age. Primary sampling units were selected in different ways depending upon the relevant size of municipalities combined with census units.
8

Time availability can further be constrained with the number of household
responsibilities. Thus, household composition and, in particular, the presence of children and/or of handicapped persons or elderly with continuous aid requirements may impose a higher demand of both time and resources devoted to Z2
(household maintenance). It is expected then, and empirically tested, that individuals
with household responsibilities will enjoy their leisure experience to a lesser extent
(Van Praag and Ferrer-i-Carbonell, 2004; Gronau and Hamermesh, 2003).
Besides time, personal resources, understood both as private goods and as
personal conditions are productive factors needed to produce and consume individual
leisure experience. Accordingly, reported household income is an individual’s
resource likely to be positively correlated with leisure satisfaction, as more income
means more expenditure capacity in market goods and services to produce leisure
experience. Nevertheless, there may also exist a negative relationship between
available income and leisure satisfaction (Bonke, Deding and Lausten, 2004),
especially when the bulk of household income comes from work (as it limits the
availability of time for other non-work commodities –Z1 and Z2). To overcome this
problem we specifically introduce individual’s leisure expenditure capacity as the
amount of money that potentially goes to produce leisure experience. We expect a
positive relationship between this leisure expenditure capacity and the level of leisure
satisfaction. In line with this argument, we further control for the amount of non-basic commodities within the household as the amount of market goods, services or
amenities others than basic ones (e.g., private swimming pool or green areas, garage,
dishwasher, pay-TV, PC, second house) that also enter, as resources, into the leisure
experience production function.
Equally, individual’s (reported) health status, understood as a personal
condition that enables the individual to display more physical effort activities with a
smaller level of mental stress, may additionally have a significant positive effect on both
leisure time and leisure satisfaction. Since healthier people are more likely to invest
fewer resources on health -physical care-, being this one of the components of our
composite commodity, they are supposed to choose larger amounts of leisure.
Moreover, they may also be more efficient when enjoying their leisure (Chang, W., Oh,
Sae-Sook, Oh, Sei-Yi. 2001).
Although we attempt to model individual’s satisfaction with one’s leisure
experience, utility derived from leisure time undoubtedly benefits from the presence of
companionable others. Many of the things people do in their non-work time involve
other people, and are distinctly more pleasurable if done with other; indeed many
things are impossible without others (for an empirical approach on the implications of
9
Leisure Coordination see Jenkins and Osberg, 2003). Taking into account this social
dimension of leisure, contacts with known people and participation in associations
(understood as two dimensions of social capital, namely: informal and formal
sociability), are resources that can be used to develop social leisure. Furthermore,
variables such as household type and marital status should also be relevant in the
sense that individuals may prefer to enjoy leisure with their closest relatives. However,
since many of those activities may lie in the boundaries between leisure experience
and household maintenance (depending on a personal appreciation which might also
vary with time), we cannot hypothesize a clear effect. Empirical evidence with German
panel data (GSOEP) reports a tendency for people to enjoy their leisure time most
when they live alone (Van Praag and Ferrer-i-Carbonell, 2004).
The level of satisfaction with one’s leisure experience is lastly affected by other
personal variables, which mainly capture individual’s heterogeneity. In this sense, it is
important to take into account the relevance of both tastes (as each agent define the
boundaries of her own “leisure experience”) and skills (since she implements an
optimal allocation of resources given a technology to produce and consume that leisure
experience). Individual’s age and gender are some of the factors, which are likely to
affect one’s evaluation of her own leisure experience. Empirical evidence suggests a
u-shaped behaviour of the age regressor and a greater level of leisure satisfaction
among men (Van Praag, and Ferrer-i-Carbonell, 2004). Further, we include subjective social class as a proxy for people’s status (being this a socio-economic concept with
multiple dimensions). We believe, the level of individual leisure satisfaction and the
reported definition of one’s social class are not independent areas as they may capture
personal self-perceptions and habits (unobserved individual heterogeneity).
Finally, although individual socio-demographic and socio-economic
characteristics seem clear determinants of individual’s leisure experience satisfaction,
we have to take a look at environmental factors. Some environmental conditions will
affect both tastes and skills (technology) since the environment will supply a bundle of
non-personal physical capital: green areas, public or commercial areas, cultural and
social equipment, and other amenities and services. In order to control for the potential
effect on leisure satisfaction of these environmental factors, type of habitat is included
in our analysis. Residence in small sized towns (less than 20,000 inhabitants) is likely
to decrease the level of leisure satisfaction as the services delivered in this places are
sometimes far from those claimed to be fair by their residents.
Table 2 reports the means, proportions and standard errors of all the
explanatory variables used in the regressions.
10
4. Results The next stage of the analysis examines the factors that affect individual leisure
experience satisfaction under Equation (8) framework, where we have classified the
explanatory variables into 6 different groups, namely: objective and subjective personal
variables, socio-economic and household related variables, social capital and
environmental variables. Results from the ordered probit estimations6 are presented in
Table 3 (p-values reported in column 2). In line with previous empirical findings, the
relationship between age and leisure experience satisfaction turns out to be u-shaped
(reaching its minimum at around the age of 45). No significant differences on leisure
satisfaction (ceteris paribus) have been found by gender. Having bad health reduces
leisure satisfaction whereas having good health does not have any significant effect.
We can interpret this asymmetric result considering that perceived health status affects
leisure satisfaction in the sense that health is seen as a constraint (bad health reduces
leisure satisfaction) but not as a resource (better health does not imply higher leisure
satisfaction).
Regarding subjective social class, there seems to exist a nearly symmetric
effect around “neither poor nor rich” category with those considering themselves as
poor being less likely to be satisfied with their leisure, and those feeling themselves as
living in comfortable or prosper families being significantly more satisfied with their
leisure. We can assert then, that this subjective perception of one’s social class
certainly seems to shape individuals leisure experience satisfaction.
Household composition variables are jointly interpreted, taking into account how
each of them potentially affects leisure satisfaction through the allocation of material
goods and time to household maintenance in detriment of resources available for the
production of leisure experience. As expected, the number of children (16 years or
younger) and/or handicapped with continuous aid requirements in the household
reduces leisure satisfaction. We can find an explanation in terms of the larger amount
of caring time devoted to children or handicapped. Alternatively, It could also be that
the presence of children or handicapped creates stress on the adult caregivers, so their
6 The effects of the sampling design used by our survey data and in particular, the clustering, stratification and unequal selection probabilities, means that for analysis it cannot be assumed that the sample is drawn from independent and identical distributions. If the assumption of a randomly drawn sample were valid, estimation of equations (2), (4) and (6) could use the standard maximum likelihood estimator for the ordered probit model. However, the complex sample design means that these equations must be estimated using a pseudo–maximum likelihood estimator otherwise the Type I error rates would be substantially above their nominal level α. While the estimates of the parameters β generated would therefore be not efficient, they would be consistent and the estimator of the associated covariance matrix robust (Eltinge and Sribney 1997).
11
satisfaction derived from a given leisure experience is smaller for them. In line with this
argument, it may also turn out that adult’s tastes are constrained when it comes to
enjoy leisure since they may employ their non-market time in child or sick care
boundary activities. Thus, if I take my children to the park and I like being there, it will
enrich my leisure experience; however, if it is a duty that I cannot consider in a
discretionary way, it will be one of the components of my household maintenance
commodity.
We also considered the number of additional adults that live within the
household. For analytical purposes, we split them between number of female adults
(16 to 65) and male adults living with the respondent, as well as number of older
individuals (both men and women above 65 years of age). The purpose of this
classification was to disentangle the potential effect of gender and age differences
between household activities. Calling for extra-economic arguments (laying on
sociological gender arguments) we hypothesized that the number of females could
represent extra human resources to produce household maintenance, whereas males
could not have a direct effect on discretionary time availability. However, our
hypothesis could not be confirmed since the number of adult females and that of males
are not significant in our estimations. Nevertheless, results do indicate that the number
of less potentially - household - productive ("passive" – elderly) members make
individuals more likely to be less satisfied with their leisure.
Regarding household type, as hypothesized, individuals living with their partner
report significantly higher levels of leisure satisfaction than those living alone somehow
confirming the social dimension of leisure. As for marital status, divorced people are
significantly less satisfied than their single counterparts.
We now consider the set of socio-economic variables. Results indicate that
students are significantly more satisfied with leisure that workers. This would confirm
our hypothesis that occupation influences leisure satisfaction at least through non-
working time availability. The effect of the reported definition of the family in terms of
socio-economic social class (subjective social class) has already accounted for some
of the effects of material resources in the production and appreciation of leisure
experiences; to further investigate the consistency of this effect, we have also
controlled for leisure expenditure capacity and ownership of non-basic goods. As
expected, feeling some strong restriction on leisure expenditure behaviour significantly
decreases leisure satisfaction after controlling for all our regressors, including income
level. In the same way, having more non-basic goods significantly increases the level
of individual leisure satisfaction.
12
The level of household income is not significant in our estimation confirming our
twofold hypothesis, that more money implies more expenditure capacity in market
goods to produce leisure experience, but may also implies less time for non-work
activities if most of that money comes from work.
Focusing now on the social dimension of leisure, participation in associations,
understood as the formal dimension of social capital has not a significant effect on
leisure satisfaction in Andalusia; but contacts with known people (informal sociability)
have a positive and significant effect on leisure satisfaction. This result confirms the
hypothesis that contacts and social capital enter as a productive factor into the
household leisure production function.
Finally, regarding the characterization of the type of habitat in which the agent
lives, agents living in semi-urban areas are less satisfied with their leisure experiences.
This turns out to be a regularity on satisfaction with different services (as reported on
Serrano-del-Rosal et al., 2004), it seems that this kind of semi-urban environments
provide less amenities and services that those which could be judged as "fair" by their
inhabitants.
5. Conclusions
This paper has explored individual’s leisure satisfaction in Andalucía, analysing the
effect of a number of variables related to optimal allocation of productive factors (time
and goods) after accounting for individual heterogeneity. Based on the model of utility
theory, we have estimated a model of leisure satisfaction using the Survey on Living
Conditions and Poverty in Andalucía. We believe this piece of research significantly
contributes the small empirical literature on leisure satisfaction.
Results indicate that variables determining time availability significantly
influence the production of leisure, confirming Gronau and Hamermesh’s claim of
leisure as one of the most time intensive individual’s commodities. However, there
seems to rule a hierarchy of needs between leisure production and the so-called
household maintenance activities (composite) as the latter significantly determines the
maximal amount of leisure experience to which an individual can aspire. Thus, leisure
production requires the availability of discretionary time (i.e., time when individuals
perceive themselves to be free of external demands and in control of their own
situations) and not just of any residual, non-working time.
Furthermore, the study shows that social variables shape leisure satisfaction to
a greater extent than economic ones. As previous empirical research points up,
household income is not a strong factor for leisure satisfaction. However, our proposed
13
modelling enriches the construction of leisure satisfaction since subjective social class
(i.e., reported definition of the family’s self-perception of their socio-economic position)
significantly impacts individual’s leisure satisfaction. This may be because habit and
consumption patterns and valuations are more determined by socio-economic
variables (such as leisure expenditure capacity or subjective social class) than by
income level itself.
Lastly, there is a distinctive tendency in Andalucía for people to enjoy their
leisure time most when they have companions. While the presence of both children
and adults requiring continuous aid has a significant negative effect on leisure
satisfaction, the presence of a partner, contacts with known people and close relatives
are significantly welcome. The interpretation of this effect might be the highest personal
interdependency among Andalucians to produce and enjoy leisure.
REFERENCES Beard, Jacob G. and Ragheb, Mounir G., 1980. Measuring Leisure Satisfaction.
Journal of Leisure Research, Volume 12, Number 1, pp 20-33.
Becker, G. 1965. A Theory of the Allocation of Time. Economic Journal, 75: 493-517
(September).
Bonke, J., Deding M. and Lausten, M., 2004. Time and Money –Are they Substitutes?
Presented at the 28th General Conference of The International Association for
Research in Income and Wealth, Cork (Ireland).
Campbell, A., Converse, P.E., and Rodgers, W.L. 1976. The Quality of American Life.
New York: Russell Sage Foundation.
Chang, W., Oh, S. S. and Oh, S.Y., 2001. Self-reported health status on leisure
satisfaction between the employed and the unemployed. Presented at the 2001
Leisure Research Symposium in Denver (Colorado).
Clark, A. E., 1997. Job satisfaction and gender: Why are women so happy at work?,
Labour Economics, vol. 4(4), 341-372.
Clark, A.E. and Oswald A. J., 1994. Unhappiness and Unemployment, ECONOMIC
JOURNAL vol. 104(424), 648-659.
14
Donovan, N., Halpern, D., and Sargeant, R., 2002, Life Satisfaction: the state of
knowledge and implications for government. Strategy Unit. London.
Eltinge, J. and W. Sribney. 1997. Some basic concepts for the design based analysis
of complex survey data. STB 31, (1997): 208-212. College Station, TX: Stata
Corporation.
Ferrer-i-Carbonell, A., 2002. Subjective Questions to Measure Welfare and Well-Being:
A survey. Tinbergen Institute Discussion Paper 2002-020/3
Ferrer-i-Carbonell, A. and P. Frijters, 2004. How important is methodology fro the
estimates of the determinants of happiness? Economic Journal, vol 114 (July):
641-659.
Gronau, R. and Hamermesh, D.S., 2003. Time vs. Goods: The Value of Measuring
Household Production Technologies. NBER working paper 9650, April.
Greene, W., 1990 Econometric Analysis, New York: MacMillan.
Haavio-Mannila, E. 1971. Satisfaction with family, work, leisure and life among men
and women. Human Relations 24(6):588-601.
Jenkins, S.P. and Osberg, L. 2003. Nobody to pay with? The implications of leisure
coordination. IZA DP No. 850, August.
Kelly, J.R. 1982. Leisure. Englewood Cliffs, NJ, Prentice-Hall.
Kelvin, P. 1979. A Memorandum on Leisure. London, Sports Council/Social Science
Research Council Joint Panel on Leisure and Recreation Research, mimeo.
London, M., Crandall, R. and Seals, G. 1977. The contribution of job and leisure
satisfaction to quality of life. Journal of Applied Psychology 62(3): 328-334.
Serrano-del-Rosal, R., Vera-Toscano, E. and Ateca-Amestoy, V., 2004. The disutility of
waiting time. IESA WP – 0406.
15
Van Praag, B.M.S. and Ferrer-I-Carbonell, A., 2004. Happiness Quantified. A
Satisfaction Calculus Approach, Oxford: Oxford University Press.
Van Praag, B.M.S., Frijters P., and Ferrer-i-Carbonell A., 2003. The anatomy of well-
being, Journal of Economic Behavior and Organization, vol. 51, 29-49.
16
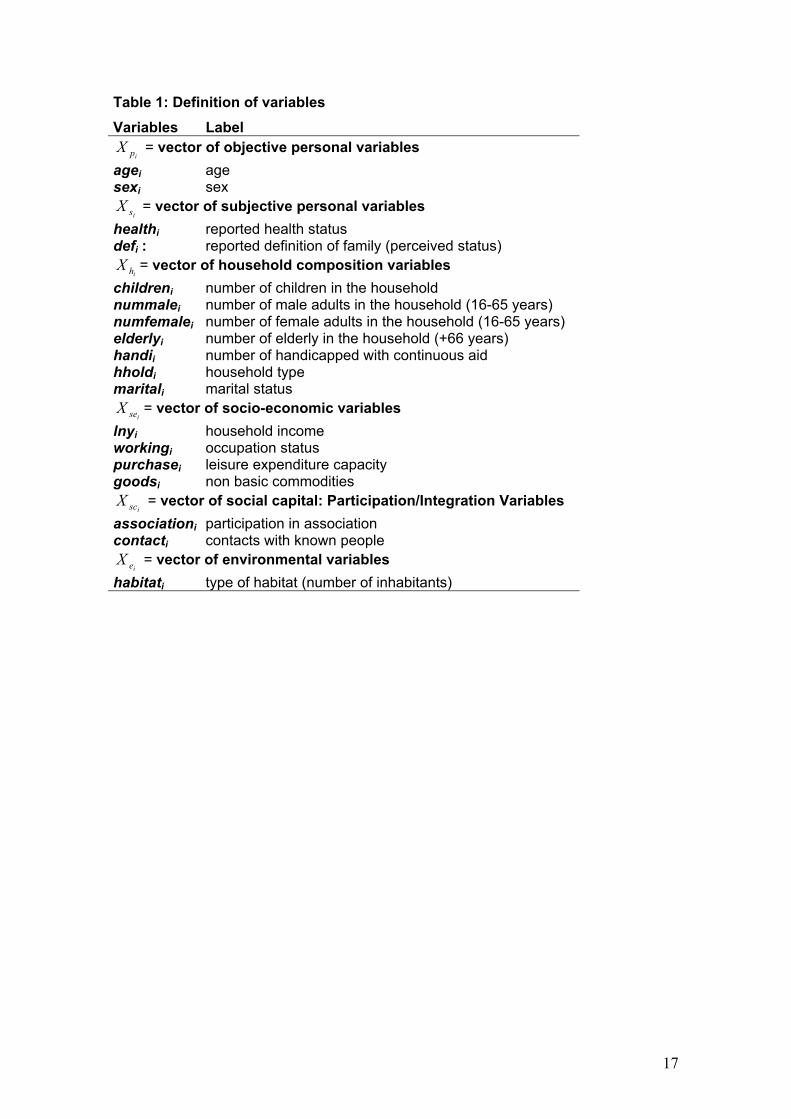
Table 1: Definition of variables Variables Label
ipX = vector of objective personal variables agei age sexi sex
isX = vector of subjective personal variables healthi reported health status defi : reported definition of family (perceived status)
ihX = vector of household composition variables childreni number of children in the household nummalei number of male adults in the household (16-65 years) numfemalei number of female adults in the household (16-65 years) elderlyi number of elderly in the household (+66 years) handii number of handicapped with continuous aid hholdi household type maritali marital status
iseX = vector of socio-economic variables lnyi household income workingi occupation status purchasei leisure expenditure capacity goodsi non basic commodities
iscX = vector of social capital: Participation/Integration Variables associationi participation in association contacti contacts with known people
ieX = vector of environmental variables habitati type of habitat (number of inhabitants)
17
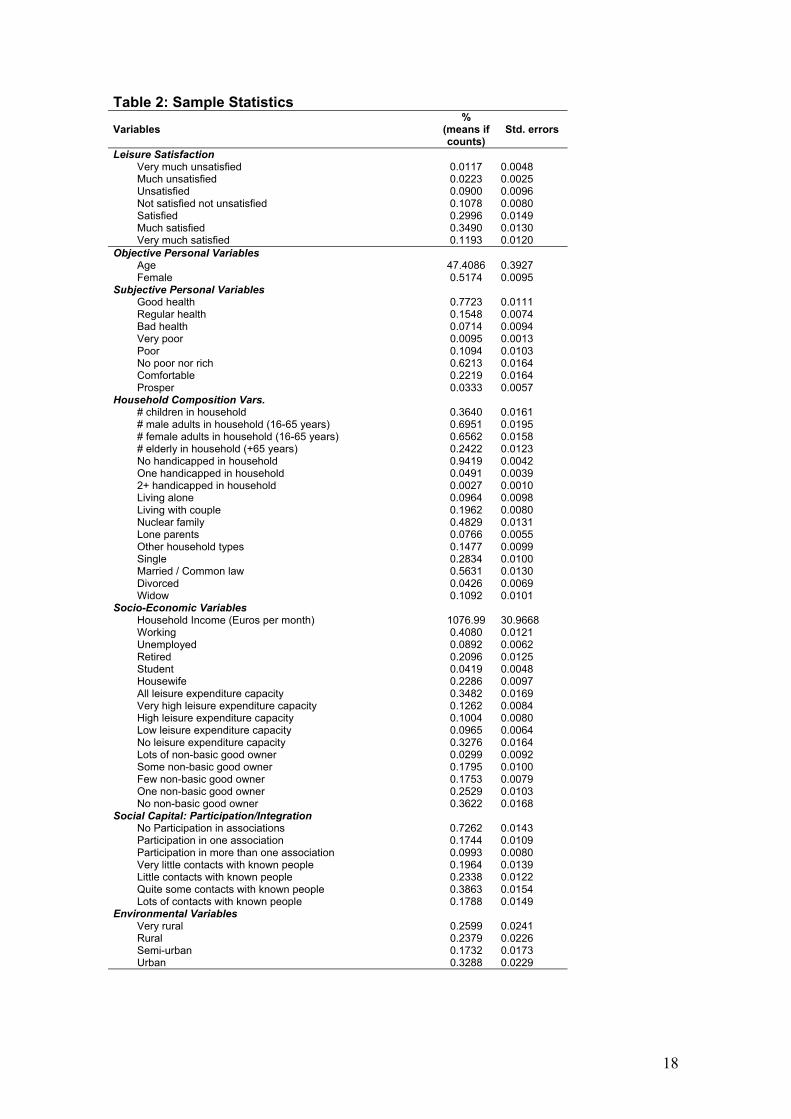
Table 2: Sample Statistics Variables
% (means if counts)
Std. errors
Leisure Satisfaction Very much unsatisfied 0.0117 0.0048 Much unsatisfied 0.0223 0.0025 Unsatisfied 0.0900 0.0096 Not satisfied not unsatisfied 0.1078 0.0080 Satisfied 0.2996 0.0149 Much satisfied 0.3490 0.0130 Very much satisfied 0.1193 0.0120
Objective Personal Variables Age 47.4086 0.3927 Female 0.5174 0.0095
Subjective Personal Variables Good health 0.7723 0.0111 Regular health 0.1548 0.0074 Bad health 0.0714 0.0094 Very poor 0.0095 0.0013 Poor 0.1094 0.0103 No poor nor rich 0.6213 0.0164 Comfortable 0.2219 0.0164 Prosper 0.0333 0.0057
Household Composition Vars. # children in household 0.3640 0.0161 # male adults in household (16-65 years) 0.6951 0.0195 # female adults in household (16-65 years) 0.6562 0.0158 # elderly in household (+65 years) 0.2422 0.0123 No handicapped in household 0.9419 0.0042 One handicapped in household 0.0491 0.0039 2+ handicapped in household 0.0027 0.0010 Living alone 0.0964 0.0098 Living with couple 0.1962 0.0080 Nuclear family 0.4829 0.0131 Lone parents 0.0766 0.0055 Other household types 0.1477 0.0099 Single 0.2834 0.0100 Married / Common law 0.5631 0.0130 Divorced 0.0426 0.0069 Widow 0.1092 0.0101
Socio-Economic Variables Household Income (Euros per month) 1076.99 30.9668 Working 0.4080 0.0121 Unemployed 0.0892 0.0062 Retired 0.2096 0.0125 Student 0.0419 0.0048 Housewife 0.2286 0.0097 All leisure expenditure capacity 0.3482 0.0169 Very high leisure expenditure capacity 0.1262 0.0084 High leisure expenditure capacity 0.1004 0.0080 Low leisure expenditure capacity 0.0965 0.0064 No leisure expenditure capacity 0.3276 0.0164 Lots of non-basic good owner 0.0299 0.0092 Some non-basic good owner 0.1795 0.0100 Few non-basic good owner 0.1753 0.0079 One non-basic good owner 0.2529 0.0103 No non-basic good owner 0.3622 0.0168
Social Capital: Participation/Integration No Participation in associations 0.7262 0.0143 Participation in one association 0.1744 0.0109 Participation in more than one association 0.0993 0.0080 Very little contacts with known people 0.1964 0.0139 Little contacts with known people 0.2338 0.0122 Quite some contacts with known people 0.3863 0.0154 Lots of contacts with known people 0.1788 0.0149
Environmental Variables Very rural 0.2599 0.0241 Rural 0.2379 0.0226 Semi-urban 0.1732 0.0173 Urban 0.3288 0.0229
18
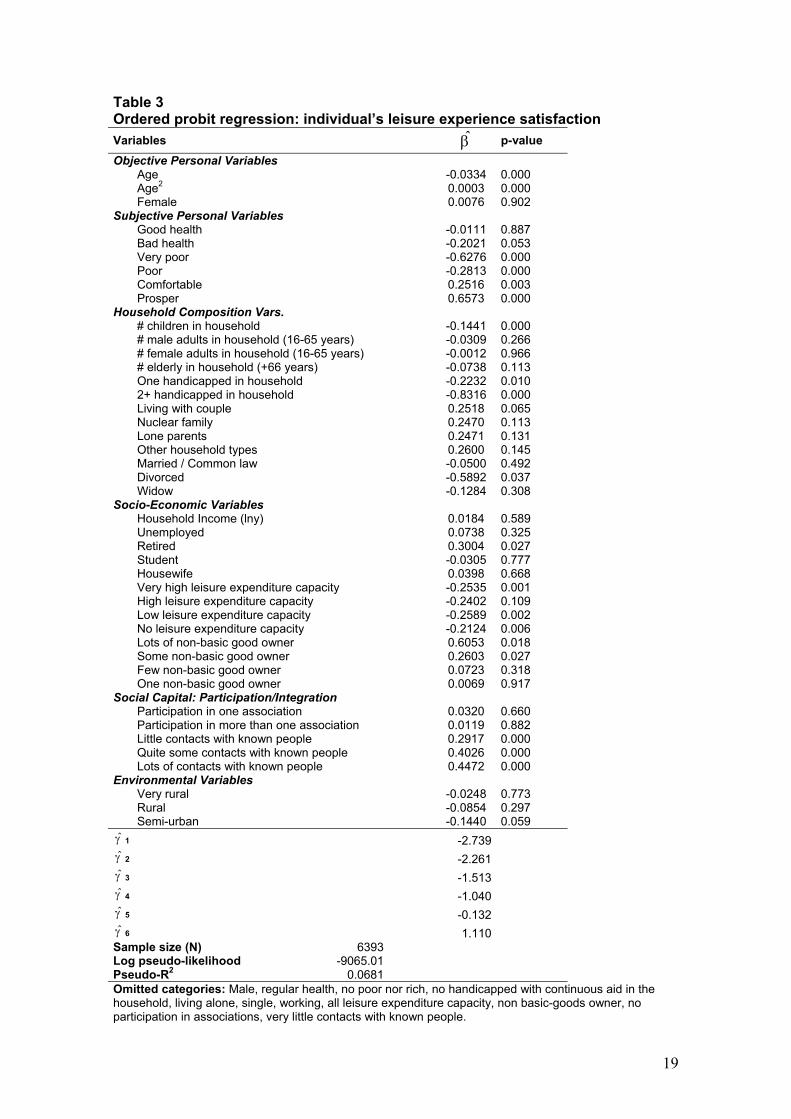
Table 3 Ordered probit regression: individual’s leisure experience satisfaction Variables β̂ p-value Objective Personal Variables
Age -0.0334 0.000 Age2 0.0003 0.000 Female 0.0076 0.902
Subjective Personal Variables Good health -0.0111 0.887 Bad health -0.2021 0.053 Very poor -0.6276 0.000 Poor -0.2813 0.000 Comfortable 0.2516 0.003 Prosper 0.6573 0.000
Household Composition Vars. # children in household -0.1441 0.000 # male adults in household (16-65 years) -0.0309 0.266 # female adults in household (16-65 years) -0.0012 0.966 # elderly in household (+66 years) -0.0738 0.113 One handicapped in household -0.2232 0.010 2+ handicapped in household -0.8316 0.000 Living with couple 0.2518 0.065 Nuclear family 0.2470 0.113 Lone parents 0.2471 0.131 Other household types 0.2600 0.145 Married / Common law -0.0500 0.492 Divorced -0.5892 0.037 Widow -0.1284 0.308
Socio-Economic Variables Household Income (lny) 0.0184 0.589 Unemployed 0.0738 0.325 Retired 0.3004 0.027 Student -0.0305 0.777 Housewife 0.0398 0.668 Very high leisure expenditure capacity -0.2535 0.001 High leisure expenditure capacity -0.2402 0.109 Low leisure expenditure capacity -0.2589 0.002 No leisure expenditure capacity -0.2124 0.006 Lots of non-basic good owner 0.6053 0.018 Some non-basic good owner 0.2603 0.027 Few non-basic good owner 0.0723 0.318 One non-basic good owner 0.0069 0.917
Social Capital: Participation/Integration Participation in one association 0.0320 0.660 Participation in more than one association 0.0119 0.882 Little contacts with known people 0.2917 0.000 Quite some contacts with known people 0.4026 0.000 Lots of contacts with known people 0.4472 0.000
Environmental Variables Very rural -0.0248 0.773 Rural -0.0854 0.297 Semi-urban -0.1440 0.059
γ̂ 1 -2.739 γ̂ 2 -2.261 γ̂ 3 -1.513 γ̂ 4 -1.040 γ̂ 5 -0.132 γ̂ 6 1.110 Sample size (N) 6393 Log pseudo-likelihood -9065.01 Pseudo-R2 0.0681 Omitted categories: Male, regular health, no poor nor rich, no handicapped with continuous aid in the household, living alone, single, working, all leisure expenditure capacity, non basic-goods owner, no participation in associations, very little contacts with known people.
19