Embed Size (px)
Citation preview
The lack of alternative income sources: the case of
fishing pressure in the Fluvial Star of Inirida, Colombian Amazon1
Daniel Guerrero Bedoya
Abstract
In this document is presented the case study of the ornamental fishing in the Fluvial Star of Inirida (FSI) in Colombia. For this purpose a fieldwork is conducted for obtaining primary data from fishermen in the zone. The results indicate that effort applied to different economical activities have no significant relation to the income of agent. Community Agreements for Responsible Fishing could be an effective policy for management of the resource; nevertheless alternative sources for income should be involved.
Keywords: Inland fisheries, Natural Resource Management, Rural Development.
JEL classification: Q22, I25, J15.
Resumen
En este documento se presenta el estudio de caso de la pesca ornamental en la Estrella Fluvial de Inírida (EFI) en Colombia. Para este propósito se condujo un estudio de campo para obtener información primaria de la zona. Los resultados indican que el esfuerzo aplicado a diferentes actividades económicas no tiene una relación estadísticamente significativa con el ingreso de los agentes. Por tanto los Acuerdos Comunitarios para la Pesca Responsable pueden ser una política efectiva para el manejo del recurso, sin embargo se deben crear fuentes alternativas de ingresos para los pescadores.
Palabras Clave: Pesquerías Continentales, Manejo de Recursos Naturales, Desarrollo Rural.
Clasificación JEL: Q22, I25, J15.
1 This research is funded by the People of the United States of America through the United States Agency for International Development (USAID) and the World Wildlife Fund (WWF), Colombia. These resources are provided by the Support Unit of the Initiative for the Conservation of the Andean Amazon (ICAA) and Conservation Strategy Fund (CSF).
2
1. Introduction
As global consensus, the status of fish stocks is worsening rather than improving. The most common indicator to diagnose this situation is the declining catch weights despite the increasing in total fishing effort (FAO, 2014). Despite this problematic affects both marine and inland fisheries, the main efforts for their sustainable management have been focused on the first ones (Allan et al., 2005).
In the case of small-scale fisheries, the causes of degradation are no doubt complex. On the one hand, some authors state that main reasons for depletion of fishing resources are the Malthusian overexploitation caused by the open access and common property nature of the fisheries (Gordon, 1954; Hardin, 1968, Pearce, 1982; Copes, 1989). As a consequence, some rent dissipation is presented and the fishermen get into poverty trap because the competitive equilibrium.
On the other hand, some other authors state that degradation of resource in small-scale fisheries is caused by the lack of opportunities for obtaining direct incomes from alternative economical activities (Anderson 1980; Smith 1979; Smith, 1981; Panayatou, 1988; Cunningham, 1993). Particularly in developing countries, small-scale fisheries are usually located in rural remote areas, with very few alternative employment opportunities (Smith, 1979; Panayotou, 1988). Due to this, fishing could be the only economical activity for providing income and food to these populations (Bailey and Jentof, 1990).
In the case of Amazon fisheries, Sirén (2006) indicates that these different causes for explaining the resource depletion are not necessarily mutually exclusive and maybe instead interact to each other. Besides these causes, some other pressures can be attributed such as market, new fishing gears, and the destruction of aquatic ecosystems (Smith, 1985; Pinedo and Soria, 2008). Specially, despite the high productivity of Amazonian fisheries, their scarcity periods are more frequent every day (Castro and McGrath, 2010).
Particularly, this research presents the case of ornamental fishing2 in Inirida Colombia, where the 90% of this resource is harvested directly from their natural stock and mostly managed by indigenous communities in the Amazon (Zúñiga, 2010; in Zuluaga and Franco-Jaramillo, 2014); according to Ajiaco-Martínez et al. (2012), for this activity there is absence of scientific evidence regarding biology of species and deficiencies in institutions that fosters deficiencies for controlling and monitoring the users of the resource.
The purpose of this research is to study the components that define the income of inhabitants of Fluvial Star of Inirida (FSI), which dedicate to small-scale ornamental fishing and other economical activities; thus testing whether alternative income sources generate significant income to inhabitants and identifying if solutions to the problem of over- 2 According to FAO (2014) ornamental fishing and aquaculture species can be considered as the ones captured and kept alive for decorative and pet purpose. Zuluaga and Franco-Jaramillo (2014), based on the Data Base of United Nations Commodity Trade Statistics Database estimate that world exported USD 142,734,000 million during 2012 of this commodity. According to Ajiaco-Martinez et al. (2012), South Asian countries are the main providers with 85% of market share, whereas the remaining 15% is distributed between Brazil, Colombia and Peru.
3
pressure of resource are found outside the fishing sector by creating alternative or supplementary income sources. Accordingly, this research bases on findings by Smith (1979), who concludes that the lack of alternative income opportunities in the rural sector intensifies fishing effort conducting to reduce income levels, even though conventional wisdom of common-pool resources (CPR) findings states that open access is the mechanism that leads to overexploitation of the resource (Gordon, 1954; Hardin, 1968; Pearce, 1982).
This research attempts to provide a contribution to the literature of studies regarding the activity of ornamental fishing, thus reducing the absence of scientific evidence and generating input for enhancing institutions in the zone. The remaining of this document contains a section 2 where is explained the context of the fishermen population in FSI. The section 3 presents a theoretical model for explaining the behavior of fishermen. The section 4 presents some empirical analysis and findings. Finally, section 5 presents some conclusions and final remarks.
2. Context of case study
This section presents the population to whom this research is conducted, which is proposed to apply the Community Agreements for Responsible Fishing3. This section provides a broad insight of the social and economic characteristics of the studied communities based on sources of information and experiences collected by Zuluaga and Franco-Jaramillo (2013), and Zuluaga and Franco-Jaramillo (2014) during their researches in the communities. These researches were carried out in the indigenous communities Yuri, Santa Rosa, La Ceiba, and Almidon, located in river Inirida, and Playa Blanca located in the river Atabapo. These communities belong to the FSI of Orinoco hydrographical basin, and to the municipalities of Inirida in the department of Guainia, and Cumaribo in the department of Vichada. These two departments are located in the northeast Amazon, frontier between Colombia and Venezuela.
3 Section 2.2 explains the definition and basis of these Community Agreements for Responsible Fishing.

4
Figure 1: Fluvial Star of Inirida
Source: Geographical Institute Agustin Codazzi, 2011.
2.1 Economical activities 4 According to Agudelo et al. (2011), in the Colombian Amazon the 52% of the regional production is based on the artisanal fishing. On the one hand, 335 of captured species are considered ornamental, and represent 50% of this commodity exported from Colombia (Ramírez-Gil and Ajiaco-Martínez, 2001). During 2005, royalties from the exportation of these species were estimated around USD $7,000,000 (INCODER, 2008; in Mancera and Alvarez-Rodriguez, 2008). However, this practice faces a progressive decrease in catching due to the overfishing among other causes (Zuluaga and Franco-Jaramillo, 2014), although users’ perception recognizes no such decrease (Ajiaco-Martinez et al., 2012). Moreover, according to local inhabitants and researchers in the zone, the prices of this commodity have remained constant over the past 10 years due to the bargaining power of local buyers. On the other hand, 132 species are destined to local consumption or marketed inside the communities (Lasso et al., 2010).
Other economical activities are recognized such as small-scale agriculture harvested in land crops called Conucos; non-timber fiber processing and manufacturing; and gold mining in some communities. This latter activity is poorly documented due to political and environmental problems involved, so the locals recognize it as profitable but infrequent.
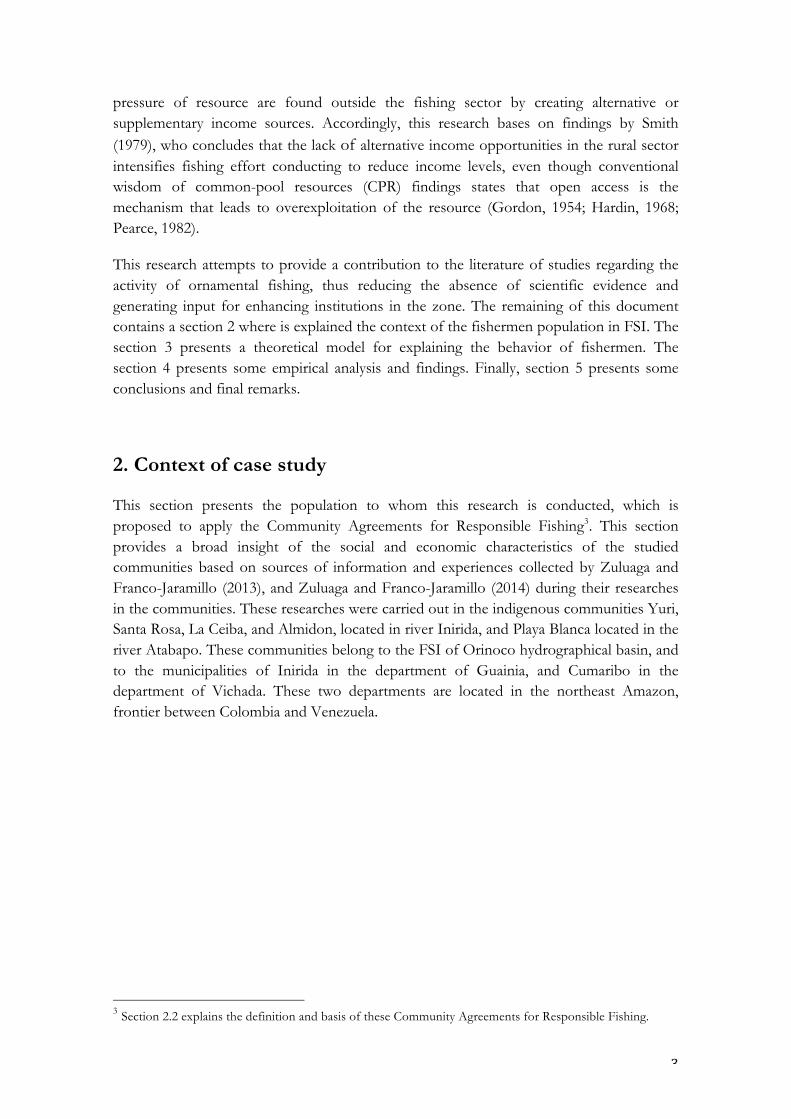
Ramírez-Gil and Ajiaco-Martínez (2001) estimate 194 fishermen in the FSI. For 2010, World Wildlife Found (WWF) estimates an approximate number of fishermen for these communities. This estimation is summarized in Table 1 below:
4 Due to importance the economical, ecosystem and biodiversity importance, the FSI have been declared as objective for wetland protection since 2004 (Londoño-Calle 2012). In July 8, 2014 the FSI was declared Ramsar wetland of international importance. Thus, the FSI becomes the sixth Ramsar site in Colombia and the first in the Orinoco-Amazon region in South America.
5
Table 1: Population of fishermen in the zone
Community Families
Approximated account Ethnicity
of fishermen Yurí 83 180 Puinave Santa Rosa 12 40 Puinave La Ceiba 28 28 Puinave, Guajivo, Cubeo Almidón 8 16 Puinave, Guajivo, Tucano Playa Blanca 16 15 Curripaco
Source: World Wildlife Found, 2010
2.2 Community Agreements for Responsible Fishing
The process of fisheries management in FSI is based on the Technical Guidelines for Responsible Fisheries of FAO (1995) and the model of conservation agreements proposed by International Conservation (2007). This process has been promoted by the National Authority for Aquaculture and Fisheries (AUNAP for its acronyms in Spanish) of the Ministry of Agriculture of Colombia and executed by WWF. The process begins in 2011 diagnosing nine indigenous communities from the rivers Inirida and Atabapo, identifying and evaluating their different fishing sites, objective species, and socio-economic implications of the fishery. By the end of 2012 begins the formulation and adjustment of Community Agreements for Responsible Fishing, and subsequently some communities in the river Guaviare and some more in Inirida are included. Basically, these Community Agreements for Responsible Fishing aim at the regulation of fishing gear and intensity of effort, delimitation of territory, and access to fishing areas. The process continues adjusting these agreements to achieve sustainable management of fishery resources by implementing different sorts of monitoring.
These agreements follow the concept of Territorial Use Rights in Fisheries (TURFs) developed by Christy (1982), where local institutional arrangements provide exclusive access to a community or group of fishermen. In FSI, the creation of these agreements has been motivated due to increasing in human pressure encouraged by market demand, which have threatened the biodiversity of the FSI and compromised the local food security, nutrition, and equitable development.
According to Mora et al. (2010), previous experience of conservation agreements applied during 2007 in La Pedrera, located in the Colombian Amazon, ensured the recovery of the fishing resource population after a downfall registered from 2007 to 2008. Although, it was found that the communities involved in the program experienced a decline in revenue due to the implementation of these agreements (Moreno-Arias and Moreno-Arias, 2010).
Besides, West and Brechin (1991) indicate that findings regarding management agreements of resources had negative effects on the livelihoods. Therefore, it has been argued that local impacts of establishing biodiversity protection policies can lead to sub-optimal result, especially when small-scale fishermen face limited set of opportunities for obtaining incomes, which should be also targets for governance reform. Due to this, small-scale

6
fisheries management is also about creating opportunities instead of merely solving the problem (Kooiman et al. 2005; Allison and Horemans 2006). Thereby, any agreement should contain governance reform aiming at providing small-scale fishermen with a set of opportunities and capabilities to improve their livelihoods, thus enhancing their possibilities for development (Sen, 1983).
However, Community Agreements for Responsible Fishing are a feasible mechanism for managing the resource in FSI; nevertheless, they face a risk for failing due to fishing provides higher income than other economical activities in the zone.
3. Theoretical framework
This analysis is based on the theoretical model proposed by Anderson (1980) with a slight modification, which does not alter the main conclusions. Firstly, lets assume that all the arguments that define the income of a fisherman are expressed in terms of the income received by ornamental fishing IO and a complementary/substitute activity IA, which in the case of FSI are commercial activities such as selling agriculture products, non-timber manufactures, and fish-food.
I = IO f (L) + IA f (L) (1)
In this model, incomes depend on the effort applied to the activity plus the opportunity incomes involved, expressed by a psychic return to the activity defined as worker satisfaction bonus (WSB). Assuming an open-access equilibrium in a two-activity model, the net real wage is equal in both industries (2).
IO + WSBO = IA + WSBA (2)
Since this is the case, there will be no incentive for agents to change activities (2). Furthermore as Anderson (1980) states, as WSB seems to be less variable than monetary incomes, it is probably the latter that drives the fishery to equilibrium. Then, the reason for explaining why fishermen remain in the activity is because fishing provides a total net wage higher than the other activities due to a rent earned from the fish stock (3).
IO + WSBO > IA + WSBA (3)
In the contrary case, it can be assumed that fisherman will leave the fishing activity and reduce the pressure on the resource (4).
IO + WSBO < IA + WSBA (4)
As a final remark, Anderson (1980) concludes that optimal management of the fishery can increase net fishing income, but it seems to be based on a confusion of wealth and income effects.

7
4. Empirical analysis
This section presents the analysis of the data collected during August 2014. The information is obtained from 45 male fishermen through a semi-structured survey. This section also presents a brief descriptive analysis of information and the statistical estimations.
4.1 The Data
This sample takes into account only artisanal ornamental fishermen from 5 communities located inside the FSI. These fishermen also perform alternative activities for obtaining income.
Table 2. Sample
Community Fishermen Yuri 14
La Ceiba 8 Playa Blanca 3
Almidon 8 Santa Rosa 12
Total 45
Source: The author. The survey collects data related to average weekly income by fishing, commercializing fish-food and non-timber manufactures, and working for other employers. The latter activity entails full or part time waged-occupations that provide income by selling labor inside or outside the communities. Data regarding the weekly hours destined to the different activities is also obtained.5
Table 3: Economical activities in FSI
Activity Weekly income6
Weekly hours
Principal activity
Alternative activity
Ornamental Fishing 127,200 49.86 32 13 Fish-food 75,000 37.06 1 10 Conucos 37,500 33.68 12 16
Non-timber manufactures 25,000 43.5 - 4 Working for other 75,000 40 - 2
Full-income 231.000 - - - Source: The author.
Information collected also contains information of the mobilization of the fishermen, indicating if the fisherman displaces using a row or outboard propeller. The variable ow indicates if the fishermen are owner-operators of their vessels in order to distinguish returns to labor and other capital services. Cunningham (1993) states that if fisherman is capitalist rather than laborer finds difficult to leave the fishery. Regarding education of 5 The details of the field strategy are documented in Appendix A1. In Appendix 2 and 3 we also present the previous interviews in the zone plus the questionnaire to conduct the survey. 6 The exchange rate by the date for dollar was 1,880 COP/USD. For euro was 2,450 COP/€.

8
fishermen, it is observed that every fisherman has some level of schooling. Variable dhs indicates if fisherman has attended to any level of high schooling.7 Particularly in this zone, the schooling coverage in every community is up to 5 grades of elementary school. In order to continue the formal education, inhabitants of the communities have to displace up to urban side of the municipality of Inirida. For this purpose they have to incur in fluvial transportation, which entails a high cost. This is one reasons of the high abandonment of high school. Information about the familiar composition is also collected; the variable cs indicates whether the fisherman is married or not. This variable indicates when fisherman is head of household. Finally, fpa indicates if the fishing is the principal activity of the agent. This variable contains information about self-recognition in the activity, but most important, this variable tries to obtain information about the bargaining power of the fishermen when face the local buyer. Table 4 summarizes this information.
Table 4: Socio-economic characteristics of agents in FSI
Variable Definition Quantity
r Row mobilization 32 ow Owners of vessels 34 dhs High-schooled fishermen 24 cs Civil status 36 fpa Fishing as principal activity 32
Source: The author.
4.2 Results of estimations
In order to measure the relation between the effort and the average income, an OLS model is estimated with the information obtained from fishermen. This estimation considers the weekly average income obtained from fishing and alternative activities as a dependent variable. As independent variables, it considers f as the weekly hours applied to fishing and oa as the weekly hours applied to commercializing alternative commodities. It also considers the weekly hours dedicated to sell different products. These weekly hours also contain the time for displacing to the urban zone in Inirida. Additionally, some other variables are taken into account such as of row mobilization r, which takes value of 1 if fisherman displace using row, 0 if displaces using outboard propeller. The ownership of vessel is indicated by the variable ow, which takes value of 1 if the fisherman owns the vessel, 0 otherwise. The variable dhs defines the schooling of fisherman; this variable takes value of 1 if the fisherman has received any kind of secondary schooling, 0 otherwise. Civil status cs, which is a dummy variable, takes value 1 if the fishermen is head of household, 0 otherwise. Dummy variable fpa takes value 1 if fishing is a principal activity for the agent, 0 otherwise. Finally, a control for activities is applied to identify differences among each one. The results of this estimation are presented in table 4.
7 Formal elementary schooling in Colombia is 5 years. High schooling is 6 years. Technician tertiary schooling entails up to 3 years of schooling. Tertiary professional is up to 5 years for obtaining a Bachelor Diploma.

9
Table 5: Estimations of the model
Variable8 Description Coefficient f Weekly effort in fishing -840.4921 (867.58)
oa Weekly effort in other activities -668.1858 (735.95) r Row mobilization -65046.97*** (17169.43)
ow Ownership 40537.69*** (15198.91) dhs High-schooled Fishermen 29774.99* (15411.29) cs Civil Status 34588.34** (14911.53) ff Fish-food -63426.71 (55665.47) ch Conucos -36243.22 (52391.42) nm Non-timber manufactures -40137.4 (64414.2) w Working for other -6311.173 (57889.44)
fpa Fishing as principal activity 55077.26*** (17499.3) Constant 106737.8** (42802.74)
Source: The author. * Significance at 10%. ** Significance at 5%. *** Significance at 1%
Table 4 presents that neither f nor oa express significant statistical relation to income of fishermen9; moreover, the different activities represented by ff, ch, nm, and w, provide no statistically significant higher incomes than ornamental fishing in FSI.10
This result presents some evidence to consider, as Smith (1979) states, that the lack of alternative income opportunities in the FSI intensifies fishing pressure. According to authors such as Townsley (1998), Bailey and Jentouf (1990), and Panayotou, (1988), open access fisheries constitute a last resort for rural households when exists failure for obtaining alternative incomes, or access to other rural economical activities. As a consequence they are often unlikely to subsist by other activities rather than fishing (Dunn, 1989). Besides, according to Payne (2000), Mackenzie (1979), Bailey (1988) and Cunningham (1993), both marine and inland small-scale fisheries tend to include non-skilled, poor, and landless people; thereby fishermen rely their livelihood only on fishing (Bailey, 1988). Therefore, the reduction of effort applied to the resource proposed by the Community Agreements for Responsible Fishing are not enough to ensure the effective management of the ornamental fishery and solve the dual long-term problem in fisheries.
Regarding the non-significant difference between alternative activities income of fishermen, some possible explanations arise. According to Sachs and Warner (2001), the full dependence on the natural resources tend to crowd out other economical activities that could promote economical growth. The authors define the situation as the Resource Curse, and base on the criterion that a population dedicated to exploit natural capital tends to neglect other activities because the high revenues obtained from exploitation. Table 3 shows that average income from ornamental fishing provides almost twice the income than the alternative activity with the higher income. 8 Weekly income i as independent variable. R2=0.2838. F=0. 9 One of the reasons for explaining the non-statistical relation between the income and the effort applied to fishing is the dynamic of distribution. The fishermen are paid once the commodity arrives to the final buyer having no control over the surplus chain and the species that arrive alive; thus facing the total mortality of the commodity. See Appendix 3. 10 Inhabitants declare that manufactured and agricultural products, and other activities do not provide enough income to inhabitants of FSI communities. See Appendix 3.

10
Furthermore, according to Copes (1989), Ikiara and Odink (2000), and Doulman (2004), the opportunity cost of fishing for most fishermen is very low, thereby the opportunity cost of other activities is relatively higher than fishing, this way they rely less on other activities remaining them underdeveloped or for sporadic dedication. It is also necessary to remark in the context of schooling of agents. It means, despite 26 fishermen have received some kind of secondary school, 42 of 45 fishermen have not completed the official basic schooling of 11 grades, and only 3 of them have a tertiary schooling. As an explanation it is presumed that due to schooling coverage in the communities of FSI reaches only 5 grades, fishermen have to displace to urban zone of Inirida in order continue their schooling at a high opportunity cost; thereby a high abandonment of schooling is plausible. Taken into account this abandonment, possible consequences are low human capital accumulation, no skills formation, and lower specialization in technical activities. According to Gylfason (2001), population involved in exploitation of natural resources tend to have low schooling enrolment rates due to they fully rely on the revenues from this activity. As a consequence, lower levels of growth and development are presented. This is linked to findings from Sachs and Warner (2001), where population involved in natural resource exploitation faces a curse.
Now, some explanations arise regarding the schooling of fishermen and why the more-schooled ones obtain higher incomes. Firstly, due to the isolation of fishing communities in FSI, more-schooled agents are not necessarily linked to alternative employment opportunities, although the concept of a quality of life effect promoted by educational achievement generally encourage them to obtain higher incomes (Smith, 1979). Secondly, the level of education of the fisherman is important to determine his opportunity cost and opportunities outside the fishing sector, respectively (Ikiara and Odink, 2000). Thereby, informational or educational power results into knowledge for obtaining better selling prices and sale alternatives (Smith, 1979). Thirdly, Gylfason (2001) argues that relying on natural resources brings risks. Moreover, the cost of collecting and processing information about the risks and returns in an asset might be lower for more educated individuals (Black, Devereux, Lundborg, and Majlesi, 2015), then the more-schooled fishermen could perceived the risks associated with the fully dependence on the resource, therefore being encouraged to obtain higher income in order to compensate the risk involved in the activity.
Results regarding the technology of mobilization indicate that those fishermen who displace by row have significant lower income. In this case, it is assume the hypothesis that those fishermen who have outboard propeller can travel longer distances and find less exploited fishing zones, thereby capture more fishes.
The ownership of the vessel indicates that those fishermen who perform the activity as capitalists rather than employers have some incentives to earn higher incomes to recompense their opportunity costs. This is an important result considering that Panayotou (1982) argues that fishermen may continue fishing even if they earn far less than their opportunity costs. In this case, those who hold an ownership face an explicit opportunity

11
cost for referencing whether the activity is profitable or not, thereby these owners perceive ornamental fishing businesslike.
The coefficient of variable cs indicates that those fishermen who are head of household obtain higher income than those that are not head of household. In this case, it can be presumed that those fishermen who face obligations for support a family are encouraged to obtain higher incomes, nevertheless is an assumption that requires to be proved.
The variable fpa encloses some information about the identification to the activity, but most important, includes some information about the know-how of the activity. Considering these results, it can be asserted that those fishermen, who perform the activity as a principal one, are more frequent in the same. Thereby can ensure better methods for avoiding the mortality of the fishes due to better techniques or equipment, proximity to the local buyer, or just because they are experienced. Moreover, this result also can provide an approximation of the bargaining power of fisherman, due to those who perform more frequently the activity can ensure better payments for the quality of their captures in terms of the health of the species.
5. Conclusion and final remarks
In the case of FSI, the findings show that the income of fishermen elicits no statistical relation to the levels of efforts applied to any activity. Then, policy objectives aimed at reducing pressure on the resource and increasing fishermen’s incomes not necessarily might be achieved by reducing the level of effort. Furthermore, it is observed that the income derived from alternative activities is not significantly higher than ornamental fishing. Thereby and following Smith (1979), the evidence provides an argument to state that the lack of alternative income opportunities in the FSI intensifies the pressure in the fishing resource, which could lead to overfishing; in particular, because fishing is the activity that provides the higher incomes to inhabitants of FSI.
In this research, findings indicate that the increasing of income related to higher schooling is not necessarily related to the human capital accumulation and the substitution of effort in fishing to other activities that promote economic growth. According to Gylfason (2001), population involved in exploitation of natural resources fully relies on the revenues obtained from these activities. Nevertheless, the schooling can provide information to fishermen for perceiving opportunity costs involved in the activity.
Furthermore, those fishermen owners or vessels are subject to higher opportunity costs that somehow are subject to be recompensed; besides, frequent fishing provide abilities that reduce the mortality of species, therefore a bargaining power that provides them higher incomes.
Finally, the Community Agreements for Responsible Fishing can be an effective policy to manage the resource in the short run. Nevertheless, the entitlements provided by these agreements should include investments outside of the fisheries sector to enhance the set of

12
capabilities (Sen, 1983) such as education, healthcare, sanitation, electricity, communication, transportation, credit, and alternative and supplementary livelihood activities in order to strengthen the income of small-scale fishermen; thus, ensuring the community development and the reduction of their vulnerability (Bailey and Jentoft, 1990; Béné and Friend 2009; Kraan, 2009).

13
References Ajiaco-Martínez, R.E, Ramírez-Gil, H., Sánchez-Duarte, P., Lasso, C. and Trujillo, F. (2012). Diagnóstico de la pesca ornamental en Colombia, vol. IV. Instituto de Investigación de Recursos Biológicos Alexander von Humboldt . Agudelo, E., Sánchez, C.L., Rodríguez C.L., Bonilla-Castillo, C.A., and Gómez, C.A. (2011). Diagnóstico de la pesquería en la cuenca del Amazonas. In: Lasso, C.A, Gutierrez, FP., Morales-Betancourt, M.A, Agudelo, E. Ramírez-Gil, H., Ajiaco-Martínez, R.E. II. Pesquerías continentales en Colombia: Cuenca Magdalena-Cauca, Sinú, Canalete, Atrato, Orinoco, Amazonas y vertiente del Pacífico. Instituto de Investigación de Recursos Biológicos Alexander von Humboldt. Allan, J.D., Abell, R., Hogan, Z., Revenga, C., Taylor, B.W., Welcomme, R.L. and Winemiller, K. (2005). Overfishing of inland waters. BioScience, vol. 55 (12), pp. 1041-1051. Allison, E.H. and Horemans, B. (2006). Putting the Principles of the Sustainable Livelihoods Approach into Fisheries Development Policy and Practice. Marine Policy, vol. 30, pp. 757–766.
Anderson, L.G. (1980). Necessary components of economics surplus in fisheries economics. Canadian Journal of Fisheries and Aquatic Sciences 37, 858-870.
Bailey, C. (1988). The political economy of fishery development. Agricultural and Human Values Winter- Spring, 35-48.
Bailey, C. and Jentoft, S. (1990). Hard Choices in Fisheries Development. Marine Policy, July 1990, pp. 333–344. Black, S.E, Devereux P.J, Lundborg, P., and Majlesi, K. (2015). Learning to Take Risks? The Effect of Education on Risk-Taking in Financial Markets. IZA Discussion paper No. 8905.
Béné, C., and Friend, R.M. (2009). Water, Poverty and Inland Fisheries: Lessons from Africa and Asia. Water International, vol. 34 (1), pp. 47–61. Castro, F. and McGrath, D. (2010). O manejo comunitario de lagos na Amazônia. Parcerías Estratégicas, vol. 6 (12), pp.112-116. Christy, F. (1982). Territorial use rights in marine fisheries: definitions and conditions. FAO Fisheries Technical Paper 227, Rome: Food and Agriculture Organization.
Commission of the European Communities CEC. (1991). Report 1991 From the Commission to the Council and the European Parliament on the Common Fisheries Policy. SEC (91) 2288 final, Brussels, 18 December. Copes, P. (1989). Why are fishing incomes often low? A critical review of the conventional wisdom. 89-1, Burnaby, Canada. Institute of Fisheries Analysis, Simon Fraser University, Discussion Paper 21. Cunningham, S. (1993). Fishermen's incomes and fisheries management. Research Paper

14
No.61, Portsmouth. CEMARE, University of Portsmouth, 22 pp.
Doulman, D.J. (2004). Fisheries Management, Poverty Alleviation And The Implementation Of The Code Of Conduct For Responsible Fisheries. In: Neiland, A.E and Bené, C. (2004). Poverty And Small-Scale Fisheries In West Africa. Springer Science+Business Media, B.V.
Dunn L.G. (1989). Development of inland fisheries under constraints from other uses of land and water resources: guidelines for planners, Rome: FAO, 53 pp.
FAO (2014). The state of world fisheries and Aquaculture 2014. Rome. 223 pp. FAO (1995). Código de Conducta para la Pesca Responsable. Organización de las Naciones Unidas para fa Agricultura y la Alimentación. Roma, Italia, 46 pp.
Gordon S.H. (1954). The economic theory of a common property resources: the fishery. Journal of Political Economy, vol. 62, pp.124-142.
Gylfason, T. (2001). Natural resources, education and economic development. European Economics Review, vol. 45, pp. 847-859.
Hardin, G. (1968). The Tragedy of the Commons. Science, vol. 162, pp. 1243–1248. Ikiara, M.M. and Odink, J.G. (2000). Fishermen Resistance to Exit Fisheries Marine. Resource Economics, vol., 14, pp. 199–213
International Conservation, (2007). Conservation Agreements: Model, Design and Implementation. Conservation International, Arlington.
Kraan, M. (2009). Creating Space for Fishermen’s Livelihoods. Anlo-Ewe Beach Seine Fishermen’s Negotiations for Livelihood Space within Multiple Governance Structures in Ghana. PhD thesis. Amsterdam: University of Amsterdam. Kooiman, J., Bavinck, M., Jentoft, S., and Pullin, R. (2005). Fish for Life: Interactive Governance for Fisheries. Amsterdam: Amsterdam University Press. Lasso, C., Usma, J.S., Trujillo, F., and Rial, A. (2010). Biodiversidad de la Cuenca del Orinoco: bases científicas para la identificación de áreas prioritarias para la conservación y uso sostenible de la biodiversidad. Instituto de Investigaciones de Recursos Biológicos Alexander von Humboldt, WWF Colombia, Fundación Omacha. Londoño-Calle, V. (2012). El Orinoco, a la espera de una firma. El Espectador. Online source: http://www.elespectador.com/impreso/vivir/articulo- 359808-el-orinoco-espera-de-una-firma
Mancera-Rodriguez, N.J. and Alvarez-Leon, R. (2008). Comercio de peces ornamentales en Colombia. Acta Biológica Colombiana, vol.13 (1), pp. 23-52.
McKenzie W. (1979). Rational fishery management in a depressed region: the Atlantic ground fishery. Journal of the Fisheries Research Board of Canada, vol. 36, pp. 811-826.
Mora, M., Niesten, E., Palacios, E., Palacios, F., Victorio, I. (2010). Proceedings of the Berlin Conferences on Human Dimensions of Global Environmental Change. Freie Universität Berlin.

15
Moreno-Arias, C. and Moreno-Arias, L. (2010). Ecología participativa para el manejo integral de humedales y recursos pesqueros en los lagos de la cuenca baja del río Caquetá y Apaporis (Amazonía Colombiana). Fase III: Informe final. Universidad de Antioquia y Conservación Internacional Colombia. En Mora et al. (2010).
Panayotou, T. (1988). Management concept for small-scale fisheries. FAO Fisheries Technical Paper No. 228, Rome: FAO, 53 pp.
Payne I. (2000). The changing role of fisheries in development policy. Natural Resource Perspectives No.59: DFIDOD, London, 4 p.
Pearse P.H. (1982). Turning the tide: a new policy for Canada's Pacific fisheries. Final report of the Commission on Pacific Fisheries Policy, Vancouver B.C Pinedo, D. and Soria, C. (2008). El manejo de las pesquerías en los ríos tropicales de Sudamérica. Instituto del Bien Común. Ramírez-Gil, H. and Ajiaco-Martínez, R.E. (2001). La pesca de especies ornamentals en el area de influencia de Inírida. In: Instituto Nacional de Pesca y Acuicultura. La pesca en la baja Orinoquía colombiana: una vision integral. Sachs, J.F. and Warner, A.M. (2001). Natural Resources and Economic Development. The course of natural resources. European Economic Review, vol. 45, pp. 827-838. Schaefer, M.B. (1954). Some Aspects of the Dynamics of Populations important to the Management of Commercial Marine Fisheries. Bulletin of the Inter-American tropical tuna commission, vol. 1 (2) pp. 25-56. Sen, A. (1983). Development: Which Way Now? The Economic Journal, vol. 93 (372), pp. 745–762. Singh, I., Squire, L., and Strauss, J. (1986). Agricultural Household Models. Extensions, Applications, and Policy. World Bank. The Johns Hopkins University Press, Baltimore and London.
Sirén, A.H. (2006). Natural Resources in Indigenous People´s Land in Amazonia: a tragedy of Commons? International Journal of Sustainable Development and World Ecology, vol. 13, pp. 363-374.
Smith, I. (1981). Improving fishing incomes when resources are overfished. Marine Policy vol. 5 (1), pp. 17-22.
Smith, I. (1979). A research framework for traditional fisheries. ICLARM Studies Review (2), Manila. 45p.
Smith, N. (1985). The impact of Cultural and Ecological Change on Amazonian Fisheries. Biological Conservation, vol. 32, pp. 355-373.
Townsley P. (1998). Aquatic resources and sustainable rural livelihoods. In Carney Diana editor, Sustainable rural livelihoods: what contribution can we make? London: Department for International Development, pp. 139-153.

16
West, P.C. and Brechin, S.R. (1991). Resident Peoples and National Parks: Social Dilemmas and Strategies in International Conservation. The University of Arizona Press.Tucson, AZ.
WWF Colombia (2010). Ficha información Ramsar entregada al Ministerio de Ambiente.
Zuluaga, P.A. and Franco-Jaramillo, M. (2013). Acuerdos de pesca sostenible en las comunidades de la Estrella Fluvial Inírida. Report. ICAA. 56 pp.
Zuluaga, P.A. and Franco-Jaramillo, M. (2014). Comportamiento de pescadores frente a distintos arreglos institucionales en la Estrella Fluvial de Inírida Amazonía colombiana. Programa de Investigaciones Económicas Aplicadas para la Conservación en la Amazonía Andina. Conservation Strategy Fund. Technical Series No. 28. Zúñiga, P.T. (2010). Lineamientos de gestión ambiental para el control del tráfico ilícito de peces ornamentales dulceacuícolas de las cuencas Amazonas y Orinoco. Master Thesis Dissertation. Pontificia Universidad Javeriana, Bogotá.

17
Appendix 1. Strategy for empirical analysis
In order to obtain the relevant data, firstly the main activities of the population, the surrogate activities, and relevant socioeconomic indicators derived from information extracted by co-investigator of this work on previous experience in the zone were identified.
A1.1 Definition of the object of study.
FSI is located in the Orinoco-Amazon transitional zone between Colombia and Venezuela (Figure 1). It belongs to the Orinoco hydrographical basin, has an area of approximately 283,000 hectares, and contains high levels of endemism and diversity (WWF Colombia, 2010). This is a continental wetland in which AUNAP intends to apply fisheries agreements to prevent deterioration of the resource.
A1.2 Relevant population
The population is ornamental artisanal fishermen from FSI, who live within communities and receive direct income from the fishing. Population from urban areas, are not taken into account.
A1.3 Definition of the problem
In FSI, the overfishing is caused because the lack of opportunities to obtain direct incomes from alternative economical activities. Besides, Community Agreements Responsible Fisheries reduce pressure of efforts in the resources. This could lead to a increasing in the incomes of fishermen. Nevertheless, agreements face the risk to fail because the alternative activities do not provide higher incomes than fishing.
A1.4 Interviews
The proposed interview is a semi-structured survey, which was designed in Spanish and translated to native languages. These translations were evaluated together with researchers, community leaders and translators to identify whether there were problems of transmission or dualities to submit questions. It may be added that translators are native people of the zone with experience in conducting surveys in the communities.
A1.5 Sampling
This process although it is random, has a large deterministic component due to the population of fishermen in the communities is very small. Zuluaga and Franco-Jaramillo (2013) indicate that the fishermen population is around 250 agents. Besides, they indicate that this estimation have low heterogeneity, which provides reliable information.
A1.6 Questionnaire
The questionnaire has two parts. The first part refers to main economic activities, alternative activities, and the conditions in which the ornamental fishing is performed. The second part asks questions about socio-economic indicators. We made special emphasis on income from fishing and alternative activities. This questionnaire is designed to answer in 30 minutes maximum.

18
To design the questionnaire took into account the previous experience of the co-investigator of this project, who has been working in the population around 4 years. This survey takes into account the relevant socio-economic indicators in the area and other conventional omitted. Previous focus group and interviews with community leaders were also conducted to identify and define the relevant population sample. Thus, avoid ethical problems in the community.
A1.7 Conducting interviews
The interviews were performed personally in each community. For this, community leaders were contacted, who gathered the relevant population, presented the researchers and sometimes helped to interpretation of the questions.
A1.8 Results
Quantitative variables were transcribed identically to the response, while qualitatively transcribed designed according to the scales in the questionnaire. Monetary values were obtained in national current, which is Colombian Pesos COP. Also dichotomous responses were transcribed according to the values agreed in the survey design. After completing the base outliers, missing data and irrelevant information to process were reviewed. In this way it ensured that the data processing was truthfulness and objectivity in the analysis.

19
Appendix 2. Focus group with community leaders and fishermen
Date: ________________________________
Community: ____________________________
Name: ________________________________
Considering that we are in the process of Community Agreements for Responsible Fishing, we would like to deepen some issues to be clear about this.
Before starting we would ask you please sign the informed consent. This is a document where you authorize us or not, to record and disclose your name if we publish this information at some point.
1. Firstly, I would like you to tell me how are the dynamics of ornamental fishing. That is, when is the season in the year with the more activity and when the less.
2. In that season, what species are harvested?
3. How much a fisherman is currently harvested in a good day of work? (Mentioning at least 5 of the most important species of ornamental fish)
4. To harvest that amount, how many hours should go fishing?
5. What are the main transportations? (Motor, rowing, several people)
6. After fishing, what is the next step? Who buy the fishes? Where they come from?
7. Tell me, what is the current price of different ornamental fish at different times?
8. How is the payment system?
9. Besides fishing, what other activities do you do?
10. These activities are for self-consumption, or some of those are sold?
11. Finally tell me how many people live in your community today?
12. How many are currently engaged in ornamental fishing? How much are their average income?
20
Appendix 3. Transcription of focus groups
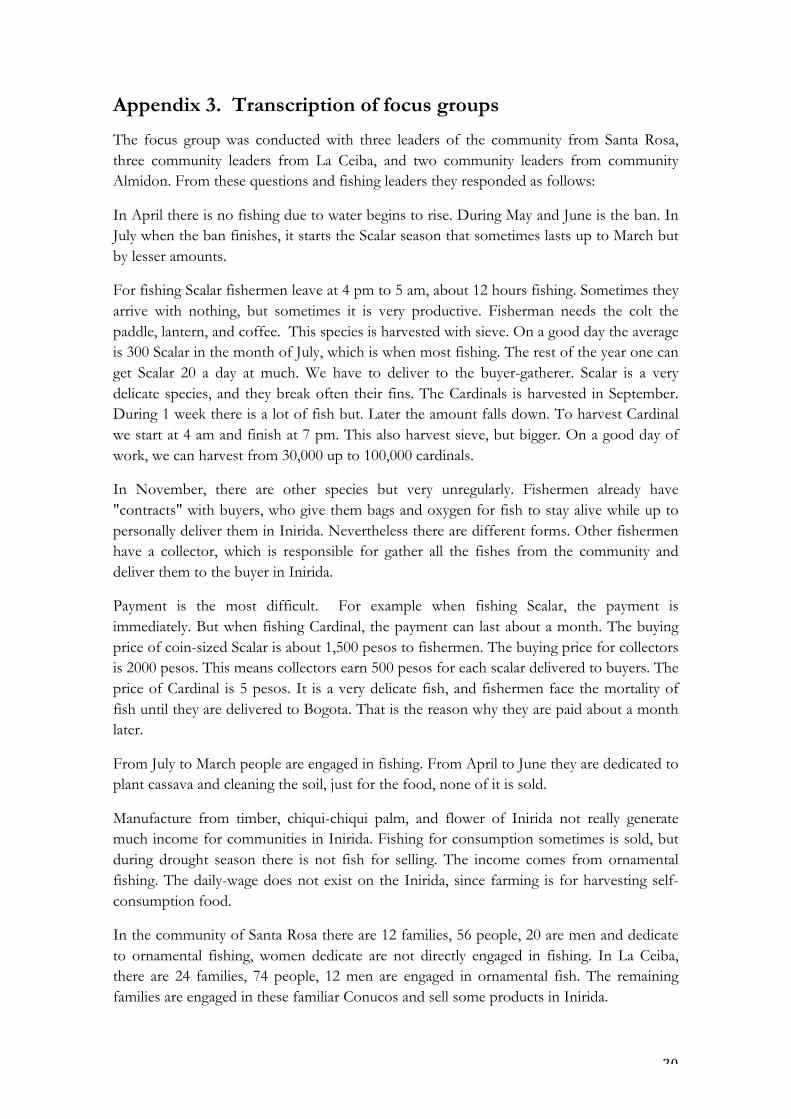
The focus group was conducted with three leaders of the community from Santa Rosa, three community leaders from La Ceiba, and two community leaders from community Almidon. From these questions and fishing leaders they responded as follows:
In April there is no fishing due to water begins to rise. During May and June is the ban. In July when the ban finishes, it starts the Scalar season that sometimes lasts up to March but by lesser amounts.
For fishing Scalar fishermen leave at 4 pm to 5 am, about 12 hours fishing. Sometimes they arrive with nothing, but sometimes it is very productive. Fisherman needs the colt the paddle, lantern, and coffee. This species is harvested with sieve. On a good day the average is 300 Scalar in the month of July, which is when most fishing. The rest of the year one can get Scalar 20 a day at much. We have to deliver to the buyer-gatherer. Scalar is a very delicate species, and they break often their fins. The Cardinals is harvested in September. During 1 week there is a lot of fish but. Later the amount falls down. To harvest Cardinal we start at 4 am and finish at 7 pm. This also harvest sieve, but bigger. On a good day of work, we can harvest from 30,000 up to 100,000 cardinals.
In November, there are other species but very unregularly. Fishermen already have "contracts" with buyers, who give them bags and oxygen for fish to stay alive while up to personally deliver them in Inirida. Nevertheless there are different forms. Other fishermen have a collector, which is responsible for gather all the fishes from the community and deliver them to the buyer in Inirida.
Payment is the most difficult. For example when fishing Scalar, the payment is immediately. But when fishing Cardinal, the payment can last about a month. The buying price of coin-sized Scalar is about 1,500 pesos to fishermen. The buying price for collectors is 2000 pesos. This means collectors earn 500 pesos for each scalar delivered to buyers. The price of Cardinal is 5 pesos. It is a very delicate fish, and fishermen face the mortality of fish until they are delivered to Bogota. That is the reason why they are paid about a month later.
From July to March people are engaged in fishing. From April to June they are dedicated to plant cassava and cleaning the soil, just for the food, none of it is sold.
Manufacture from timber, chiqui-chiqui palm, and flower of Inirida not really generate much income for communities in Inirida. Fishing for consumption sometimes is sold, but during drought season there is not fish for selling. The income comes from ornamental fishing. The daily-wage does not exist on the Inirida, since farming is for harvesting self-consumption food.
In the community of Santa Rosa there are 12 families, 56 people, 20 are men and dedicate to ornamental fishing, women dedicate are not directly engaged in fishing. In La Ceiba, there are 24 families, 74 people, 12 men are engaged in ornamental fish. The remaining families are engaged in these familiar Conucos and sell some products in Inirida.

21
A bunch of bananas can be sold at 5,000 COP. Nearby communities all have the same dynamics, i.e. the communities of Santa Rosa, Almidon, La Ceiba, Yuri, Laguna Morocoto.

22
Appendix 4. Questionnaire for survey
Fecha: ________________________________
Comunidad: _____________________________
Resguardo: _____________________________
Buenos días/Buenas tardes. Mi nombre es__________________________________. Y trabajo para WWF Colombia. Teniendo en cuenta que estamos hablamos de los acuerdos de pesca responsable de cada una de las comunidades, queremos conocer su opinión al respecto. Solamente le tomará de 10 a 15 minutos. La información obtenida en esta entrevista es confidencial, en ningún momento será revelado su identidad/nombre.
I. Información sobre la actividad económica
1. ¿Cuál es de estas actividades económicas es su actividad principal? es decir que le genera mayores ingresos a su hogar. (Elija solamente 1)
i.. Pesca ornamental ________
ii. Pesca para consumo ________
iii. Cacería ________
iv. Cultivo en conucos _________
v. Extracción de fibras de palma _______
vi. Fabricación de artesanías _______
vii. Extracción de oro __________
viii. Trabajar para otro (jornalero, peón, obrero)_______
ix. Negocio propio _________
x. Otra_____ Cuál? _____________________________________________________
Si contesta a. continue con la pregunta 2. De lo contrario pase a la pregunta 7.
2. ¿Cuántas horas al día trabaja en la pesca ornamental en la época de Agosto a Noviembre? (hacer énfasis que se pregunta esta época, porque es donde más se pescan peces ornamentales) _____________________
3. ¿Desde hace cuánto tiempo es pescador de peces ornamentales? (¿Desde qué edad empezó en la actividad?)
_____ años
_____ meses
4. ¿Cuál es el medio de transporte que utiliza para pescar peces ornamentales? (Si es lancha pasar a la siguiente pregunta, de lo contrario pase a la pregunta 6):_______________________
5. ¿Cómo se moviliza su lancha?

23
Con remo______ Con motor______ ¿Qué capacidad tiene el motor que utiliza?__________
6. La lancha en que se moviliza es:
Propia______
Ajena______ (incluida las lanchas comunitarias o grupales)
7. ¿Cuál de las siguientes actividades económicas le generan ingresos cuando no está haciendo su actividad principal? (Elija solamente 1. Tener cuidad de no nombrar la actividad principal nuevamente)
i.. Pesca ornamental ________
ii. Pesca para consumo ________
iii. Cacería ________
iv. Cultivo en conucos _________
v. Extracción de fibras de palma _______
vi. Fabricación de artesanías _______
vii. Extracción de oro __________
viii. Trabajar para otro (jornalero, peón, obrero)_______
ix. Negocio propio _________
x.Otra_____ Cuál? _____________________________________________________
8. ¿Cuántas horas al día le dedica a esta actividad?________
9. ¿Desde hace cuánto tiempo realiza esta actividad? (¿Desde qué edad empezó en la actividad?)
_____ años
_____ meses
II. Información socioeconómica
10. Sexo:
Femenino:_____
Masculino:_____
11. ¿Cuántos años tiene?: _______
12. Estado civil:
Soltero______
Casado______
24
Unión libre_____
13. ¿Cuál es su grado de educación?
i. Sin instrucción_______
ii. Primaria Incompleta
iii. Primaria Completa:_____
iv. Secundaria Completa _____
v. Técnica Completa:_______
vi. Universitaria Completa:_____
14. ¿Cuál es su etnia? ___________________________
15. ¿Cuántas personas viven en su hogar? ____________
16. ¿Cuantos menores de 18 años viven en su hogar? ___________
17. ¿Hace cuánto tiempo vive usted en esta comunidad?
Años:_______
Toda la vida________
18. ¿En su casa hay planta eléctrica?
Si ____ No ____
19. ¿Cuantas horas al día prende la planta? _____
20. ¿En su casa hay televisor?
Si ____ No ____
21. ¿En cuál de los siguientes rangos se encuentran los gastos semanales totales de su hogar? (incluya todos los gastos en los que incurre a la semana; por ejemplo, alimentación, vestuario, insumos pesca, caza y agricultura, transporte, educación, etc.)
A. Menos de 50.000 pesos ________
B. Entre 51.000 a 100.000 pesos ______
C. Entre 101.000 y 150.000 pesos _______
D. Entre 151.000 y 200.000 pesos ________
E. Entre 201.000 y 250.000. pesos _______
F Entre 251.000 y 300.000. pesos
G. Más de 301.000 de pesos ________

25
22. ¿En cuál de los siguientes rangos se encuentran los ingresos semanales recibidos por la pesca ornamental es decir de Agosto a Noviembre? (incluya todos los ingresos que generan todos los miembros económicamente activos del hogar)
A. Menos de 50.000 pesos ________
B. Entre 51.000 a 100.000 pesos ______
C. Entre 101.000 y 150.000 pesos _______
D. Entre 151.000 y 200.000 pesos ________
E. Entre 201.000 y 250.000. pesos _______
F Entre 251.000 y 300.000. pesos
G. Más de 301.000 de pesos ________
23. En cuál de los siguientes rangos se encuentran los ingresos semanales totales de su hogar recibidos por otra actividad que le genere ingresos, que no sean por la pesca ornamental? (incluya todos los ingresos que generan todos los miembros económicamente activos del hogar)
A. Menos de 50.000 pesos ________
B. Entre 51.000 a 100.000 pesos ______
C. Entre 101.000 y 150.000 pesos _______
D. Entre 151.000 y 200.000 pesos ________
E. Entre 201.000 y 250.000. pesos _______
F Entre 251.000 y 300.000. pesos
G. Más de 301.000 de pesos ________

26
Appendix 5. Additional statistical treatments and estimations
A6.1 Additional statistical treatments
Table 3 presents the estimation of the model. Some statistical treatments regarding the model are presented:
Bondage of adjustment R2= 0.2838. This index indicates that the variables only explain 28,38% of the variation of the index. Further investigations are required to contain more variables for estimations.
Conjoint significance estimator F (p-value)=0.000 indicates that at least one of the variables are different from zero.
Graphical approach of the residuals indicates normality.
Normality test Doornik-Hansen DH (p-value)=0.8761 indicates no statistical evidence to reject the null hypothesis that residuals are normally distributed.
A6.2 Additional estimation for alternative incomes
The additional estimation indicates that weekly effort applied to alternative activities have no significance relation to the income obtained from this activities. This support the results presented in Table 4.
Table A6.1: Additional estimations
Variable Description Coefficient
loa Weekly effort in other activities -875.47
(1139.21)
Ag Age 471.66
(1034.88)

27
FES Finished Elementary School 41703.88
(37318.24)
NFHS Non-Finished High School 67602.04*
(33533.96)
FHS Finished High School 23750.11
(38749.17)
TS Tertiary School 14019.09
(32895.31)
CN Agriculture from Conucos 31771.44
(21742.14)
NTM Non-timber Manufactures 54709.50
(41576.23)
WFO Working for other 61821.83***
(19253.12)
cs Head of Household 18489.95
(25995.49)
C Constant 32535.86
(71996.09)
Source: The Authors. * Significance at 10%. ** Significance at 5%. *** Significance at 1%
Table A6.2: Correlation Matrix
lf fpa age NFES FES NFHS FHS TS FF CN NTM WFO cs
lf 1.00 fpa 0.35 1.00 age 0.06 0.19 1.00 NFES -0.17 -0.09 0.44 1.00 FES 0.09 0.10 0.12 -0.30 1.00 NFHS 0.09 -0.09 -0.49 -0.53 -0.50 1.00 FHS 0.24 0.10 -0.10 -0.09 -0.08 -0.14 1.00 TS -0.23 0.14 0.11 -0.12 -0.12 -0.20 -0.03 1.00
FF 0.05 0.25 0.00 -0.08 0.07 0.09 -0.09 -0.12 1.00 CN -0.07 -0.40 0.07 -0.09 0.09 -0.10 0.12 0.17 -0.73 1.00 NTM -0.06 0.20 -0.08 0.37 -0.17 -0.14 -0.05 -0.07 -0.18 -0.40 1.00 WFO 0.15 0.14 -0.05 -0.12 -0.12 0.23 -0.03 -0.05 -0.12 -0.28 -0.07 1.00 cs -0.11 -0.20 0.40 0.28 0.00 -0.20 -0.30 0.11 -0.49 0.41 0.16 -0.16 1.00
Source: The author