Embed Size (px)
Citation preview

PhUSE 2011 - Paper TS10
Alternative Approaches to Creating Disposition
Flow Diagrams
Brian Fairfield-Carter, ICON Clinical Research,
Redwood City, CA
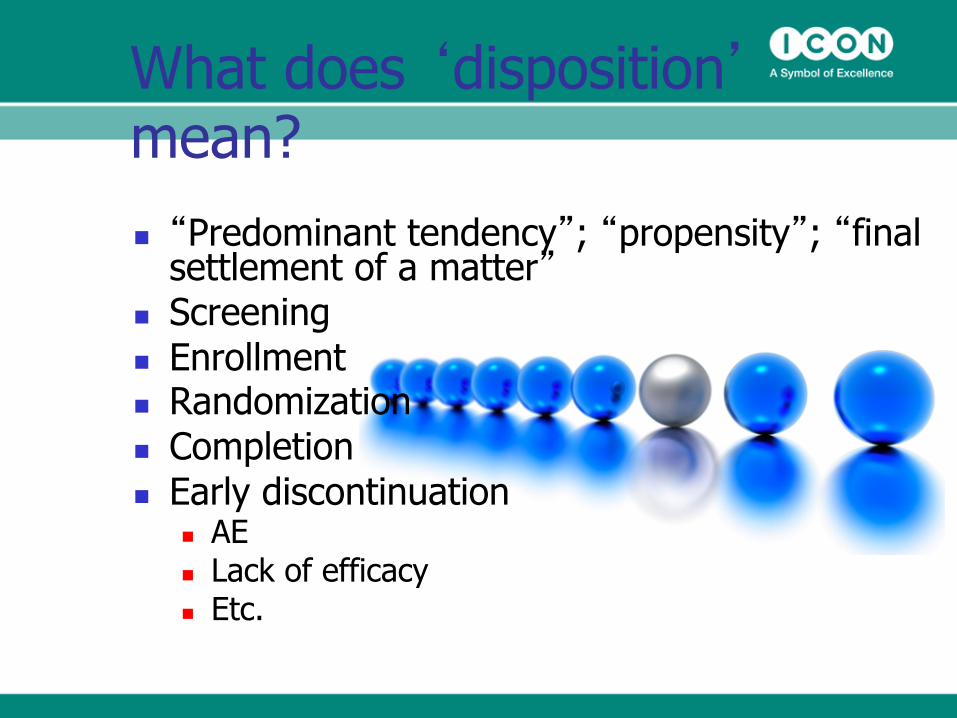
What does ‘disposition’ mean? n “Predominant tendency”; “propensity”; “final
settlement of a matter” n Screening n Enrollment n Randomization n Completion n Early discontinuation
n AE n Lack of efficacy n Etc.
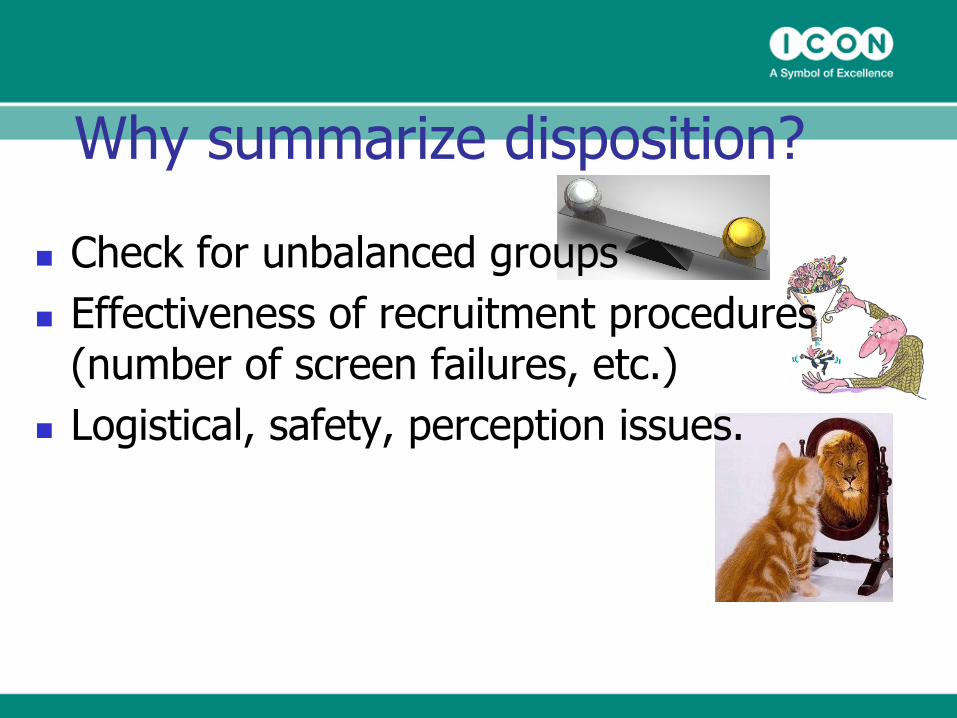
Why summarize disposition?
n Check for unbalanced groups n Effectiveness of recruitment procedures
(number of screen failures, etc.) n Logistical, safety, perception issues.
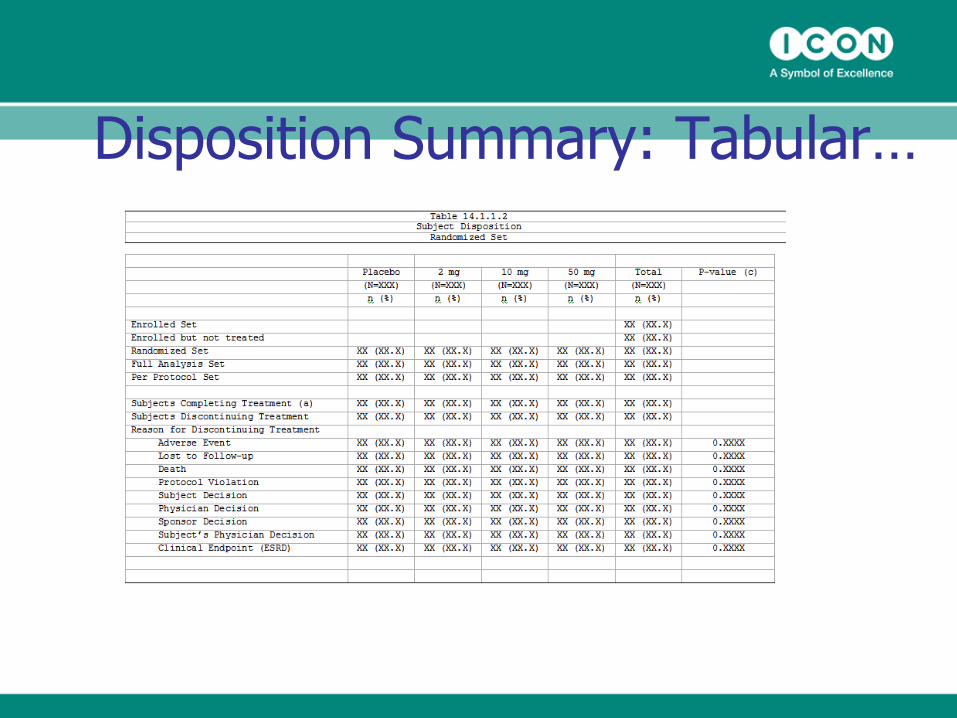
Disposition Summary: Tabular…
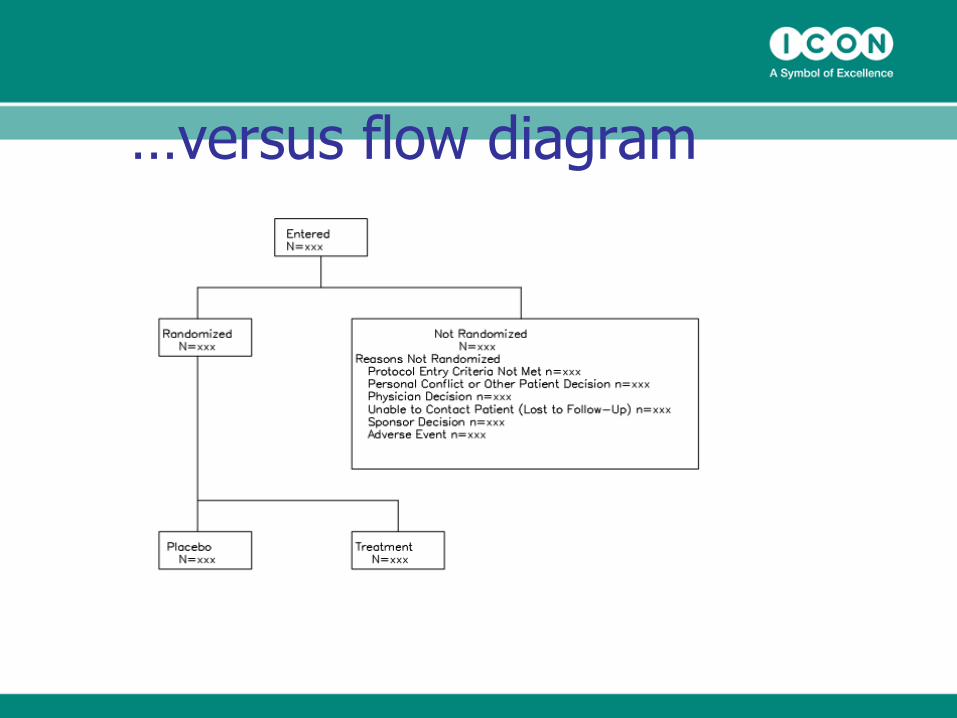
…versus flow diagram
Trade-offs
n Flow diagram may be easier to interpret (debatable)…
n …but more complicated and time-consuming to produce (in fact, just how do you program a flow chart?)
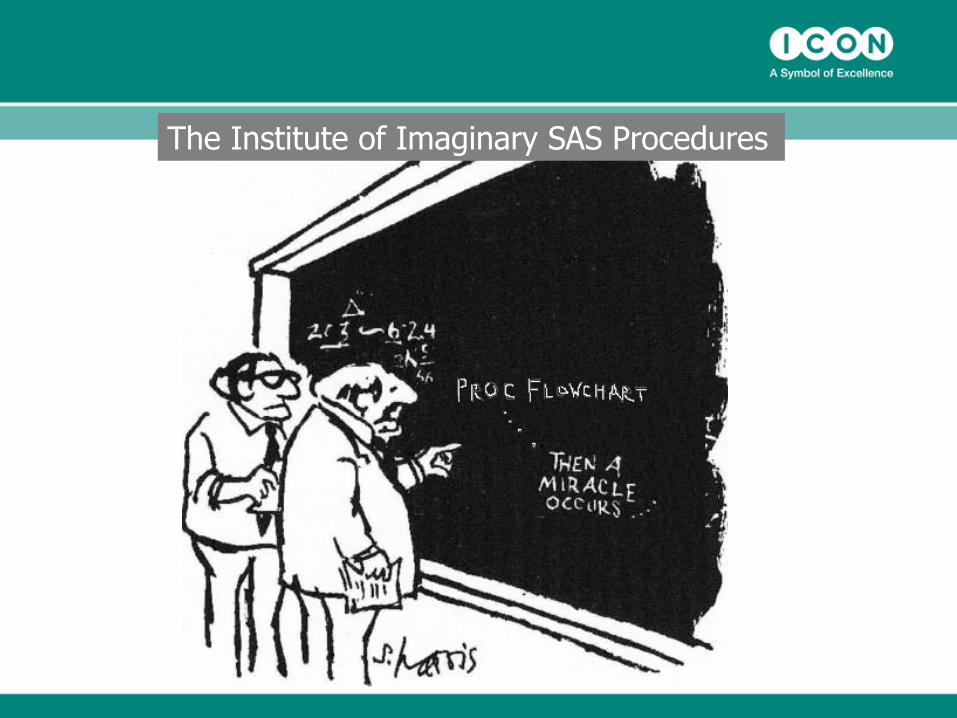
The Institute of Imaginary SAS Procedures
Purpose: Present three alternative methods for disposition flow diagrams.
n Annotate (purely SAS-based) n Annotate/Excel/Visual Basic (hybrid) n Word template/script-driven
transcription (hybrid)
Keeping in mind…
n Validation implications n Time/effort/cost n Flexibility n ‘Interoperability’ (operating system,
programming environment, programmer knowledge)
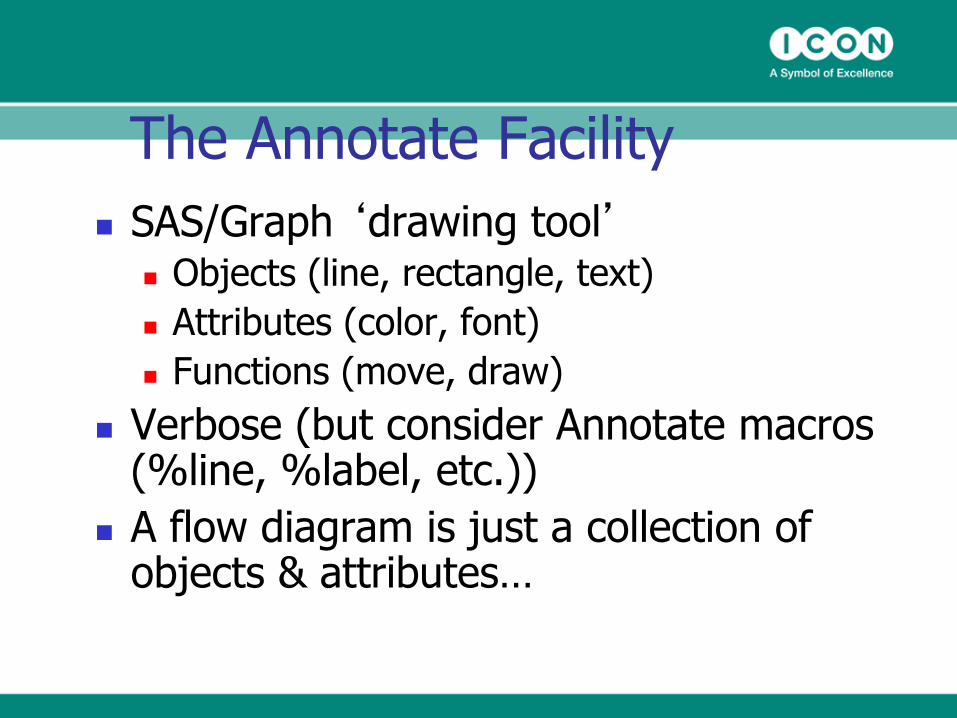
The Annotate Facility n SAS/Graph ‘drawing tool’
n Objects (line, rectangle, text) n Attributes (color, font) n Functions (move, draw)
n Verbose (but consider Annotate macros (%line, %label, etc.))
n A flow diagram is just a collection of objects & attributes…
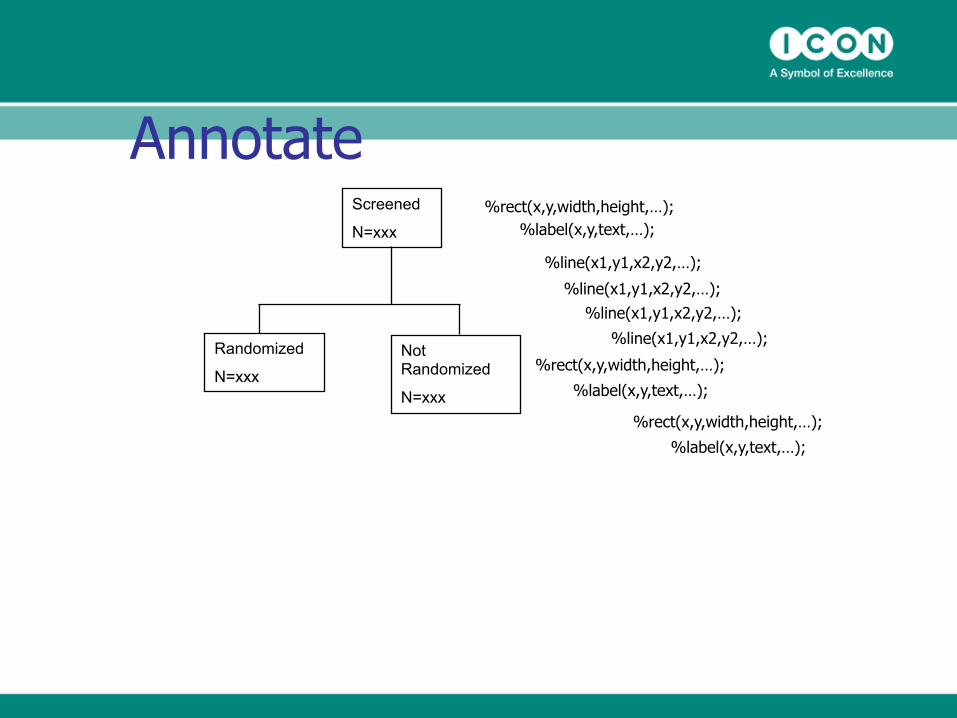
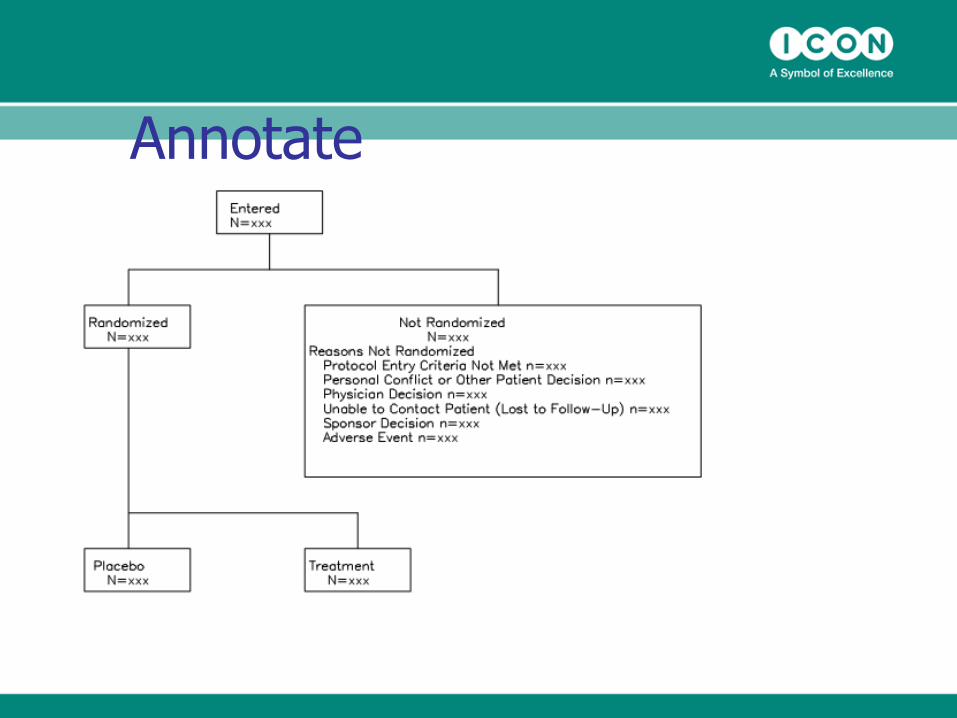
Annotate Screened
N=xxx
Randomized
N=xxx Not Randomized
N=xxx
%rect(x,y,width,height,…);
%line(x1,y1,x2,y2,…);
%label(x,y,text,…);
%line(x1,y1,x2,y2,…);
%line(x1,y1,x2,y2,…);
%line(x1,y1,x2,y2,…);
%rect(x,y,width,height,…);
%label(x,y,text,…);
%rect(x,y,width,height,…);
%label(x,y,text,…);
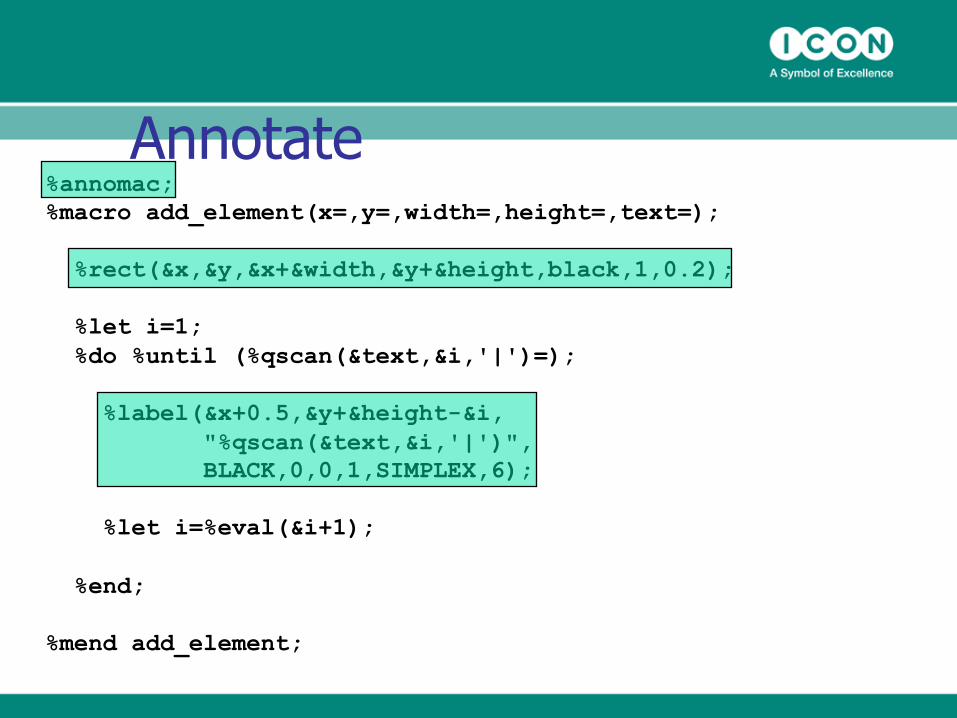
Annotate %annomac; %macro add_element(x=,y=,width=,height=,text=); %rect(&x,&y,&x+&width,&y+&height,black,1,0.2); %let i=1; %do %until (%qscan(&text,&i,'|')=); %label(&x+0.5,&y+&height-&i, "%qscan(&text,&i,'|')", BLACK,0,0,1,SIMPLEX,6); %let i=%eval(&i+1); %end; %mend add_element;
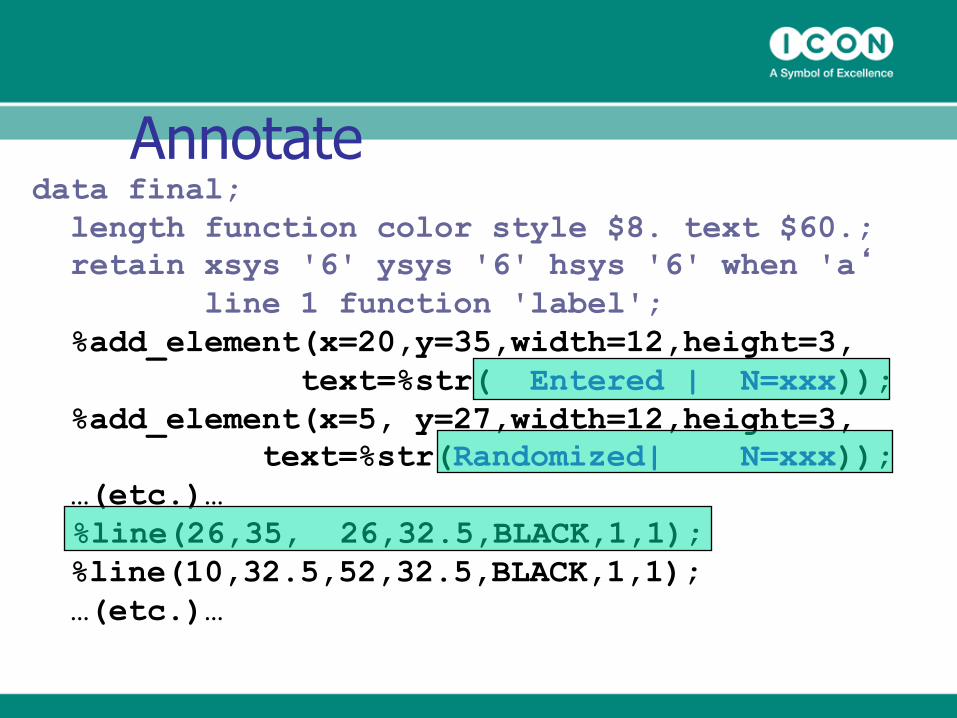
Annotate data final; length function color style $8. text $60.; retain xsys '6' ysys '6' hsys '6' when 'a‘ line 1 function 'label'; %add_element(x=20,y=35,width=12,height=3, text=%str( Entered | N=xxx)); %add_element(x=5, y=27,width=12,height=3, text=%str(Randomized| N=xxx)); …(etc.)… %line(26,35, 26,32.5,BLACK,1,1); %line(10,32.5,52,32.5,BLACK,1,1); …(etc.)…
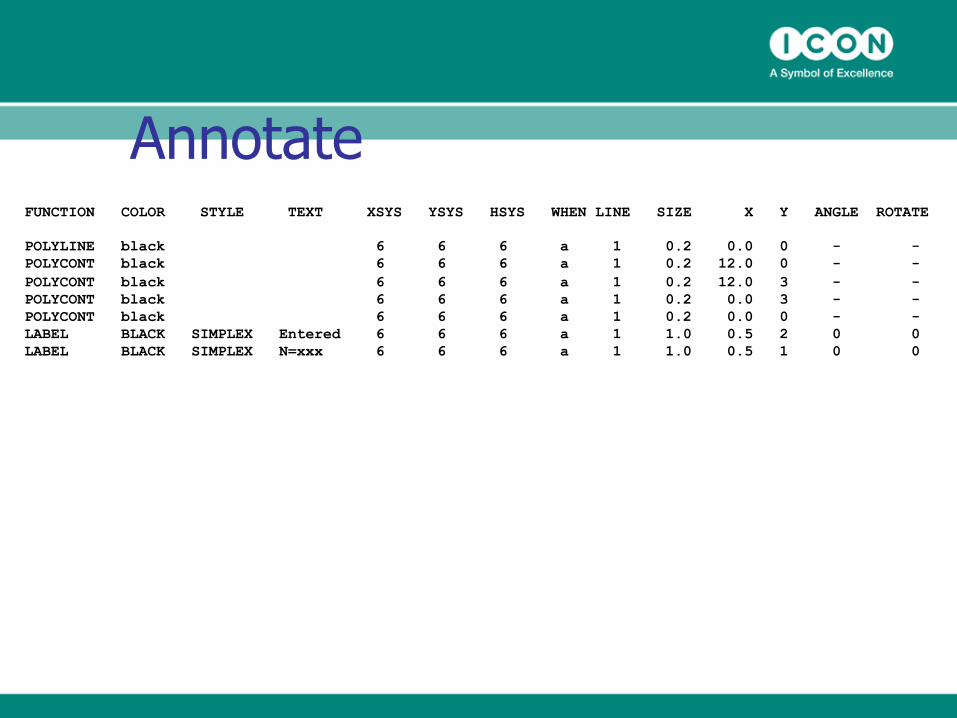
Annotate FUNCTION COLOR STYLE TEXT XSYS YSYS HSYS WHEN LINE SIZE X Y ANGLE ROTATE POLYLINE black 6 6 6 a 1 0.2 0.0 0 - - POLYCONT black 6 6 6 a 1 0.2 12.0 0 - - POLYCONT black 6 6 6 a 1 0.2 12.0 3 - - POLYCONT black 6 6 6 a 1 0.2 0.0 3 - - POLYCONT black 6 6 6 a 1 0.2 0.0 0 - - LABEL BLACK SIMPLEX Entered 6 6 6 a 1 1.0 0.5 2 0 0 LABEL BLACK SIMPLEX N=xxx 6 6 6 a 1 1.0 0.5 1 0 0
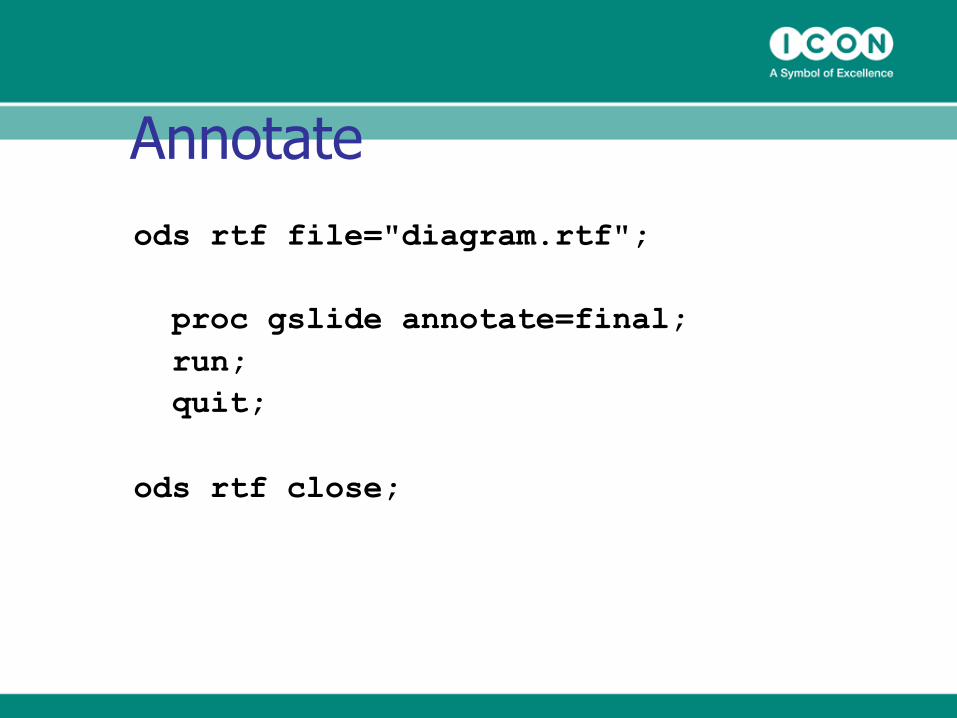
Annotate ods rtf file="diagram.rtf"; proc gslide annotate=final; run; quit; ods rtf close;
Annotate
Annotate
n This is ok, but… n ‘Dynamic’ positioning of elements? (see
instead Saradha & Veeravel (2008)) n Output file is ‘static’ n Increase in diagram complexity=increase in
code size/complexity…
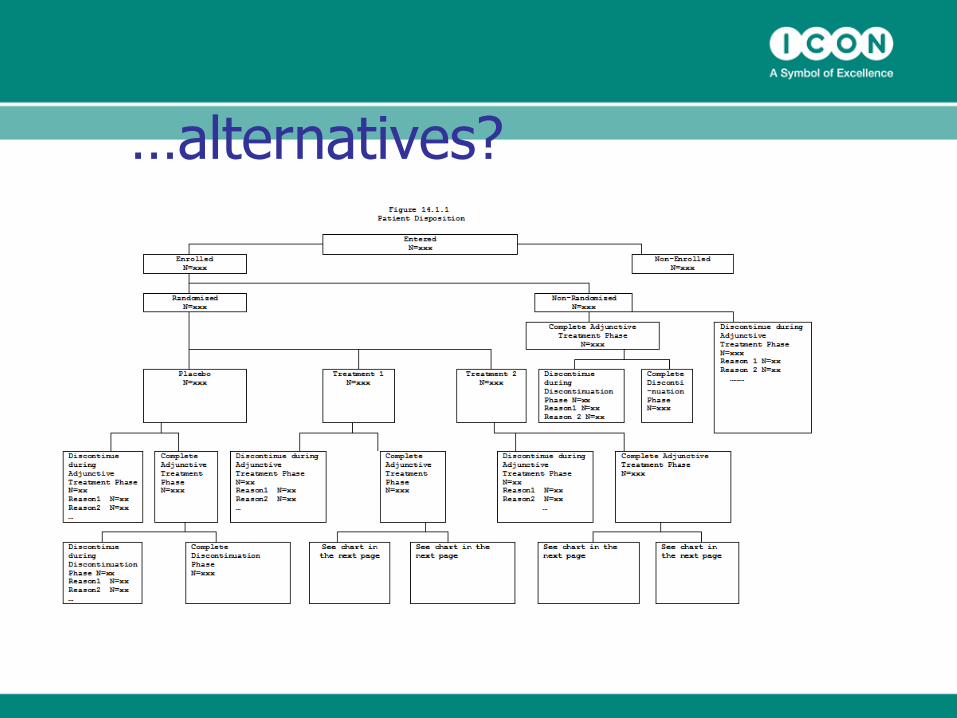
…alternatives?
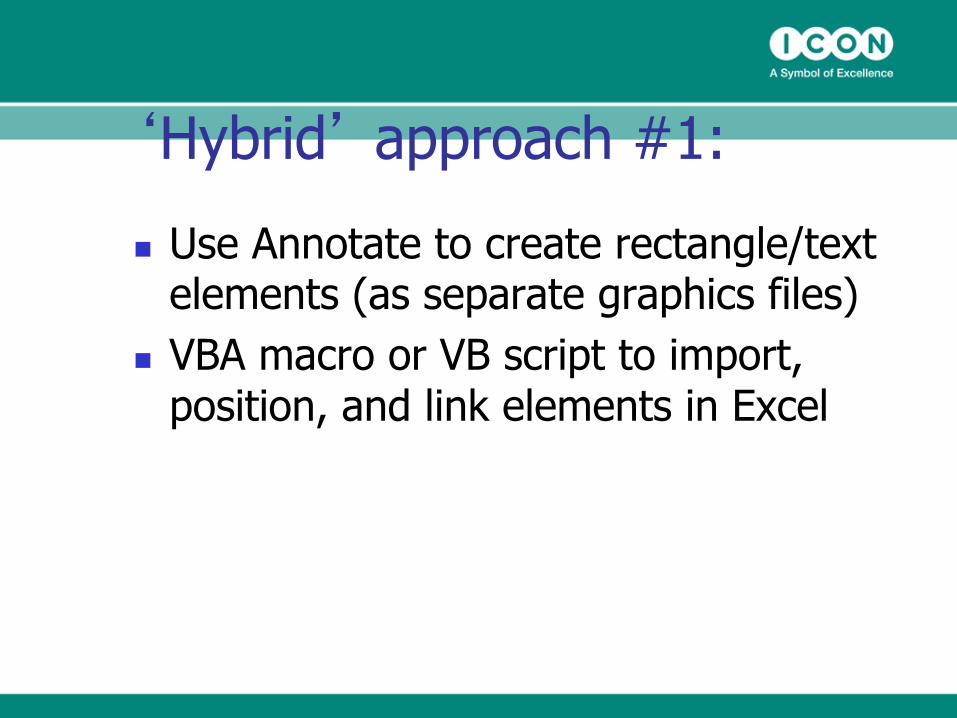
‘Hybrid’ approach #1:
n Use Annotate to create rectangle/text elements (as separate graphics files)
n VBA macro or VB script to import, position, and link elements in Excel
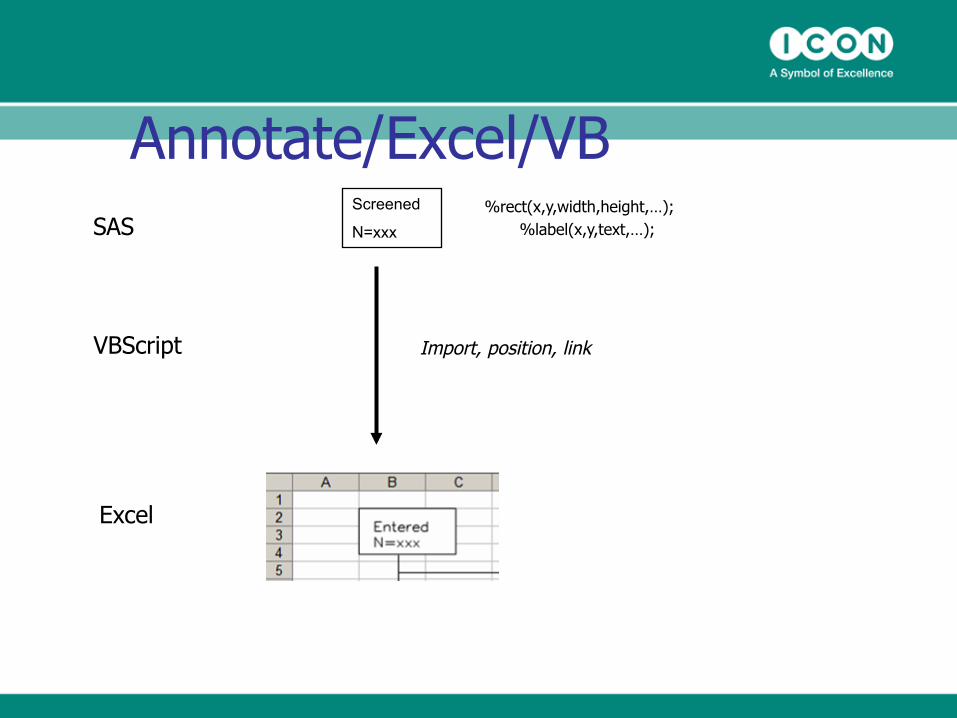
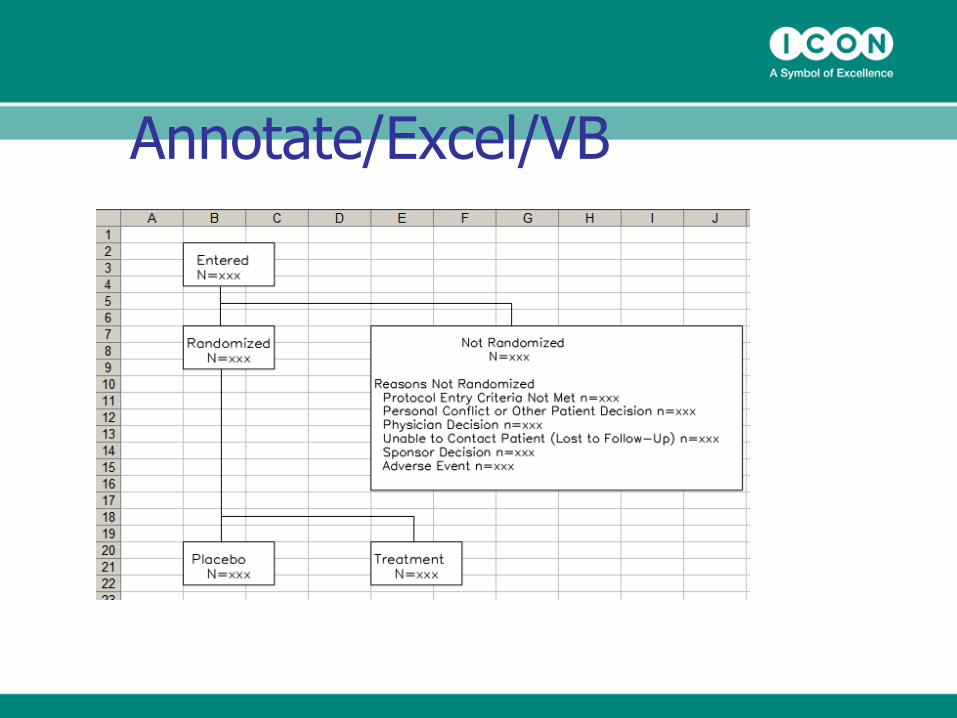
Annotate/Excel/VB Screened
N=xxx %rect(x,y,width,height,…);
%label(x,y,text,…); SAS
VBScript
Excel
Import, position, link
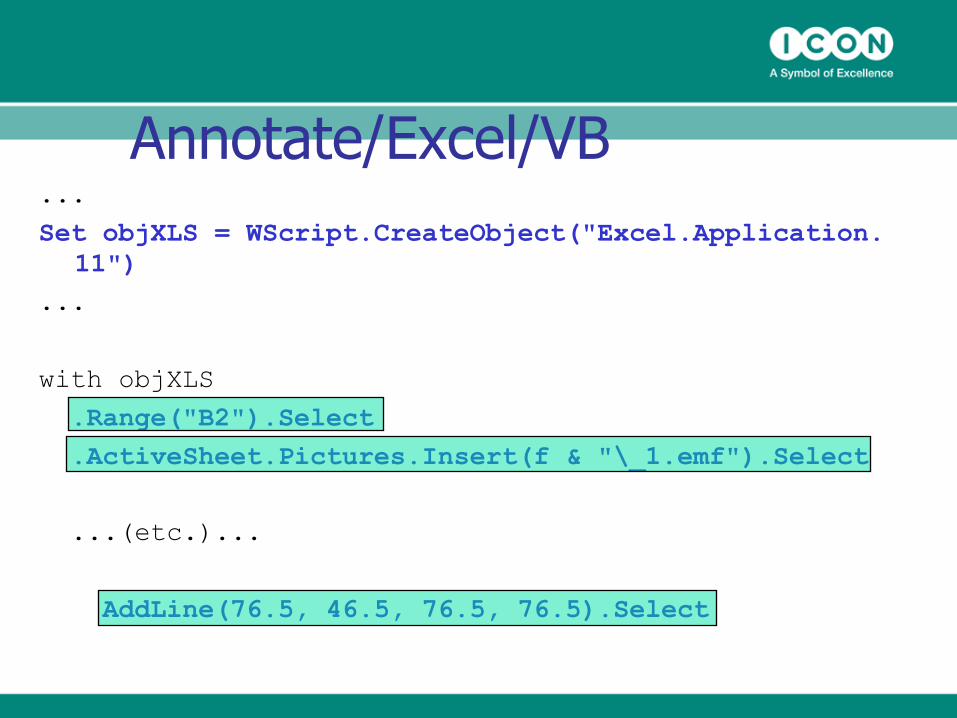
Annotate/Excel/VB ...
Set objXLS = WScript.CreateObject("Excel.Application.11")
...
with objXLS
.Range("B2").Select .ActiveSheet.Pictures.Insert(f & "\_1.emf").Select
...(etc.)...
AddLine(76.5, 46.5, 76.5, 76.5).Select
Annotate/Excel/VB
Annotate/Excel/VB
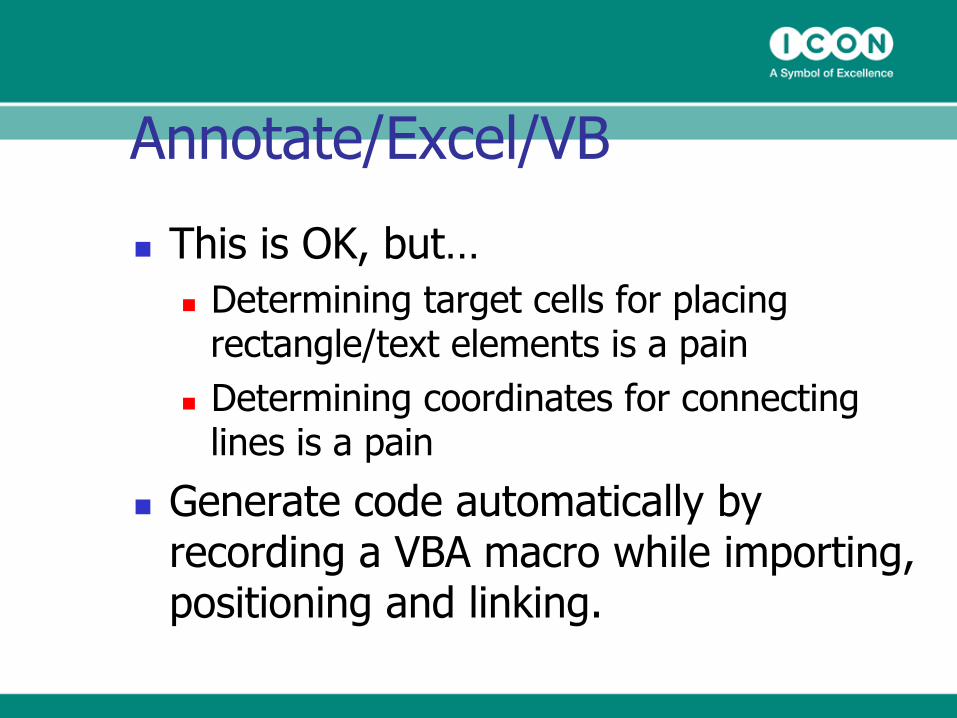
n This is OK, but… n Determining target cells for placing
rectangle/text elements is a pain n Determining coordinates for connecting
lines is a pain
n Generate code automatically by recording a VBA macro while importing, positioning and linking.
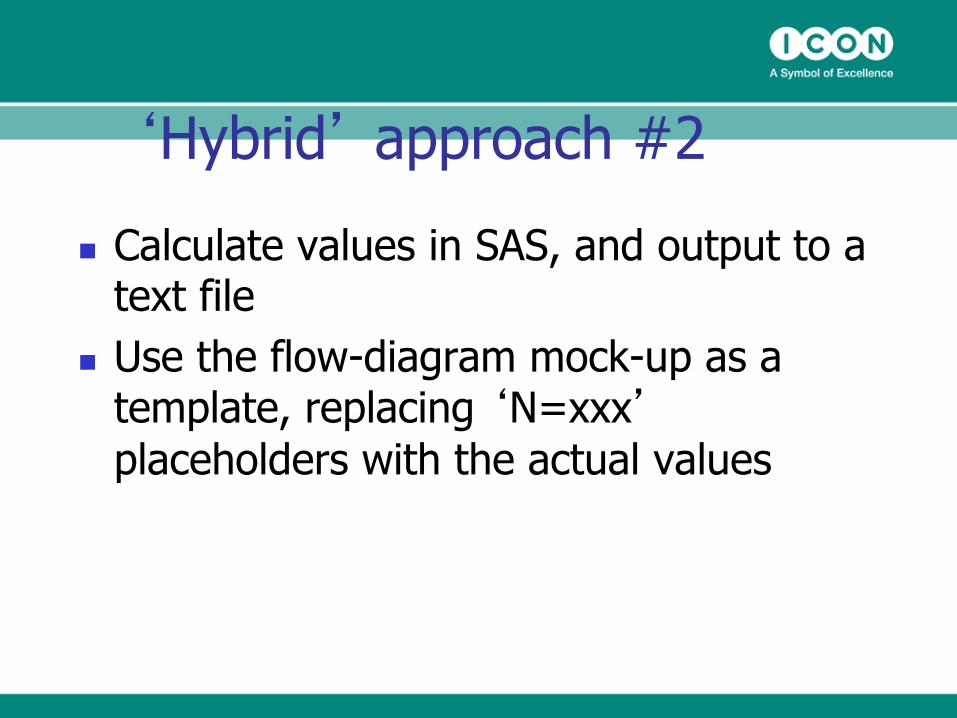
‘Hybrid’ approach #2
n Calculate values in SAS, and output to a text file
n Use the flow-diagram mock-up as a template, replacing ‘N=xxx’ placeholders with the actual values
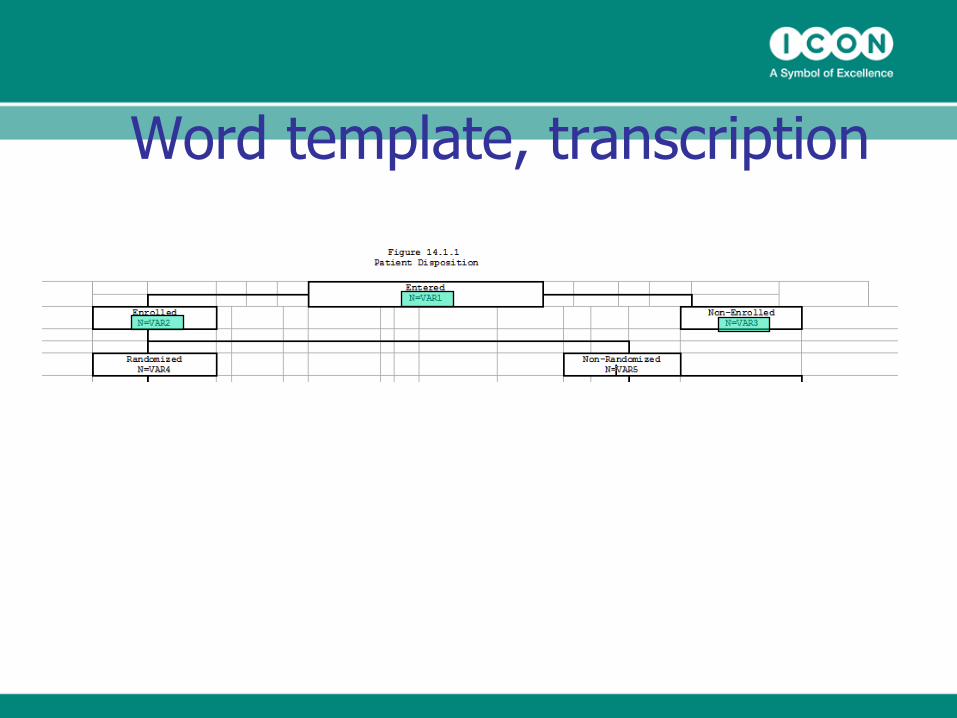
Word template, transcription
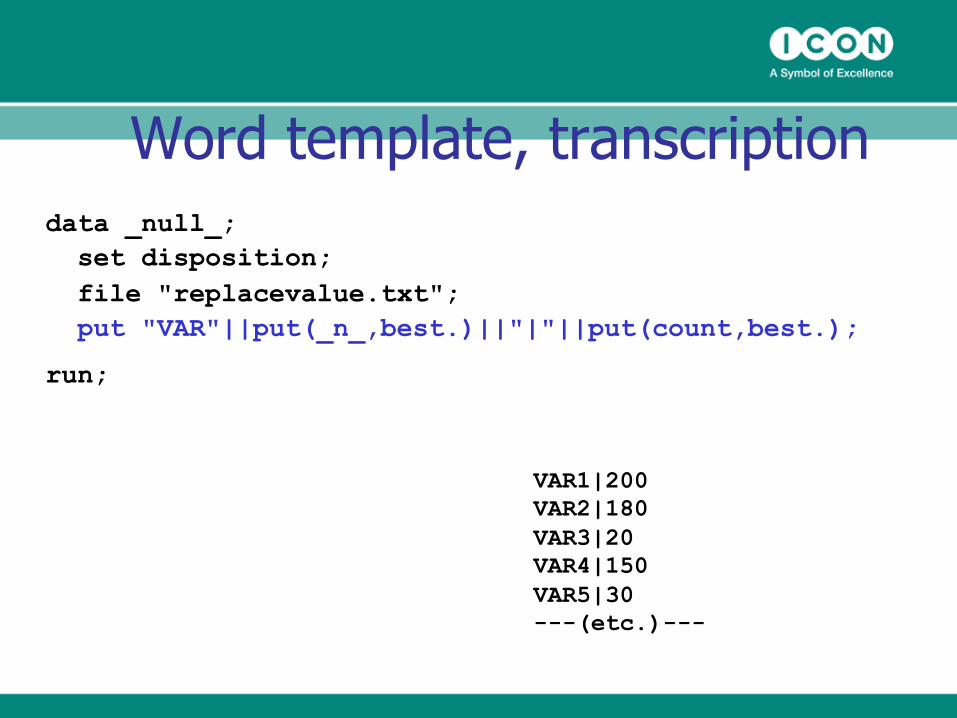
Word template, transcription data _null_; set disposition; file "replacevalue.txt"; put "VAR"||put(_n_,best.)||"|"||put(count,best.);
run;
VAR1|200 VAR2|180 VAR3|20 VAR4|150 VAR5|30 ---(etc.)---
Word template, transcription
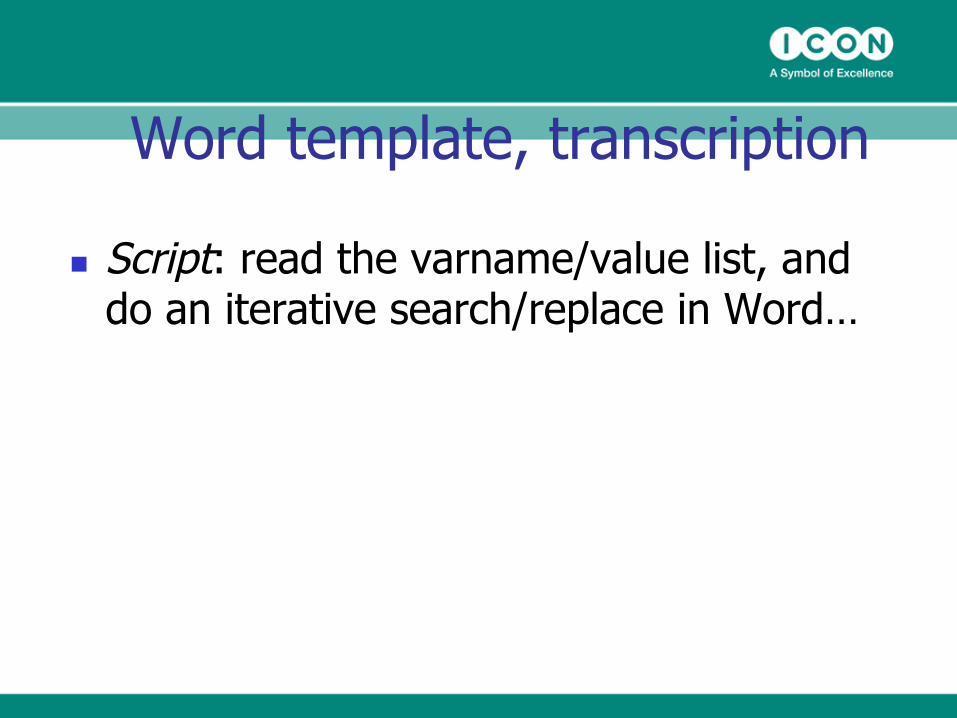
n Script: read the varname/value list, and do an iterative search/replace in Word…
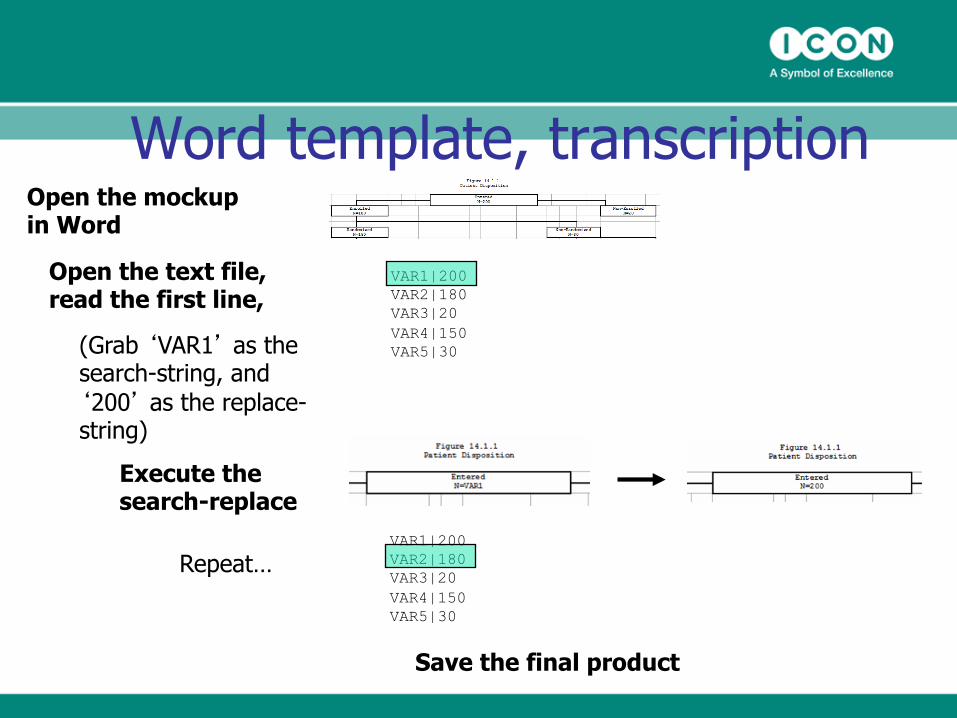
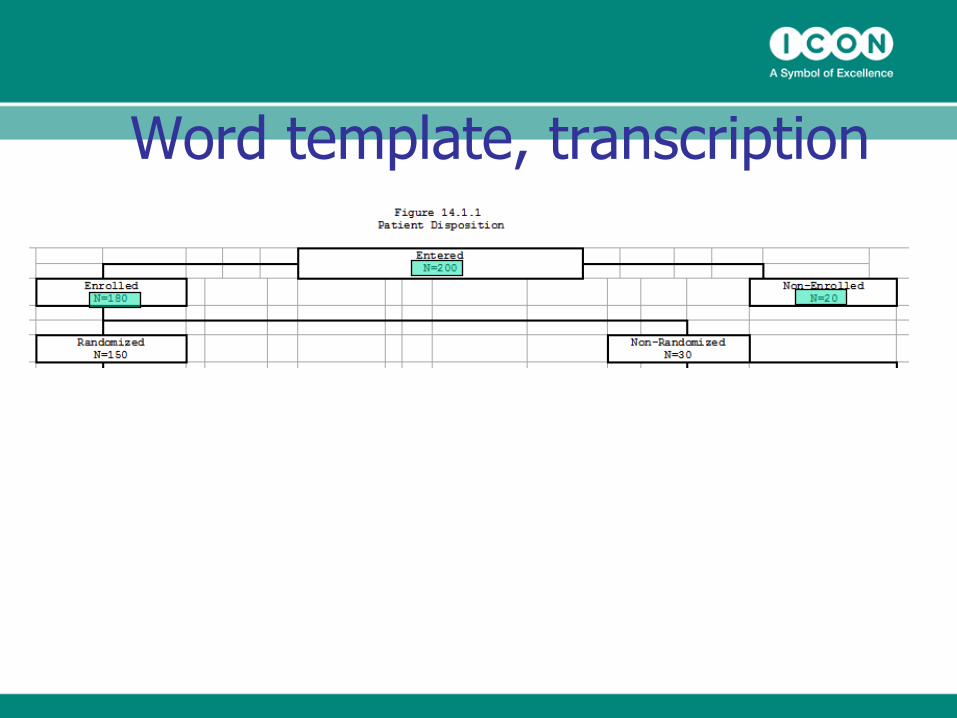
Word template, transcription Open the mockup in Word
Open the text file, read the first line,
(Grab ‘VAR1’ as the search-string, and ‘200’ as the replace-string)
Execute the search-replace
Repeat…
Save the final product
VAR1|200 VAR2|180 VAR3|20 VAR4|150 VAR5|30
VAR1|200 VAR2|180 VAR3|20 VAR4|150 VAR5|30
Word template, transcription
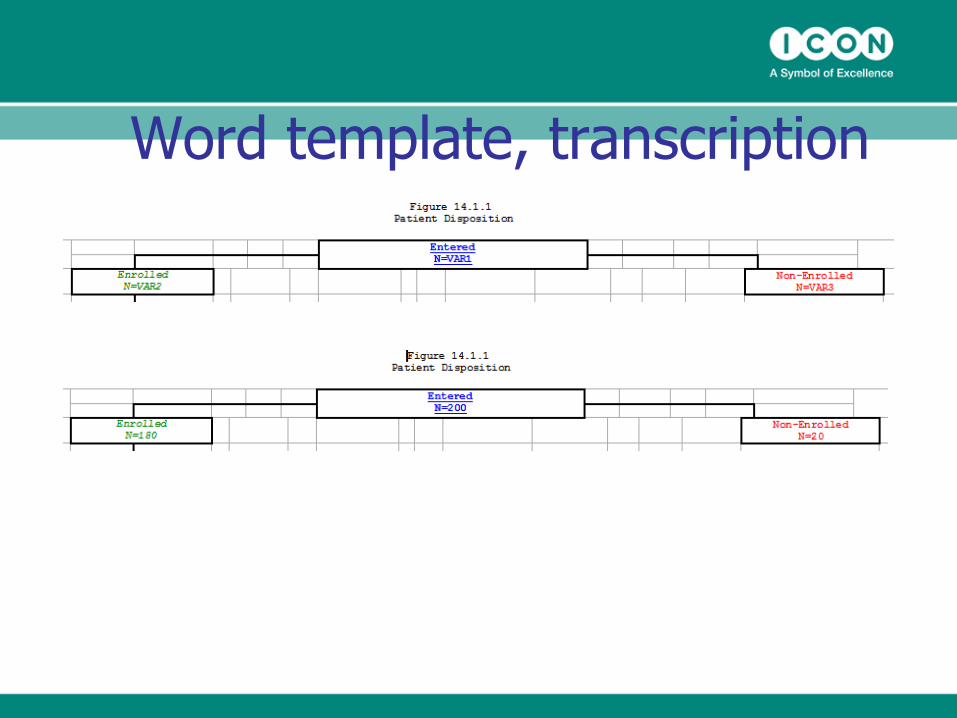
Word template, transcription
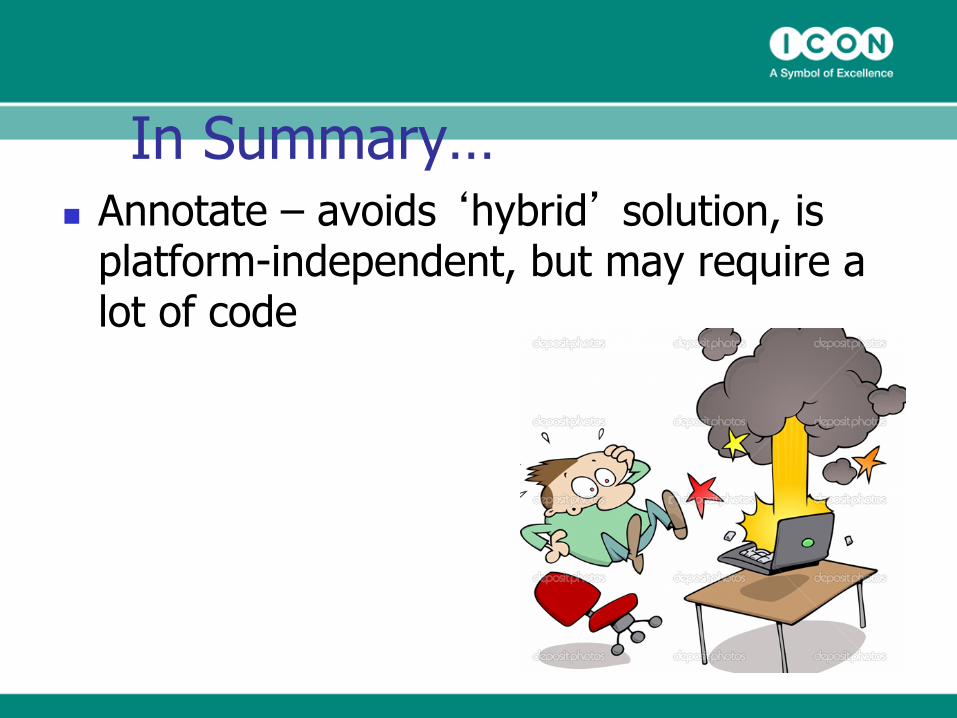
In Summary… n Annotate – avoids ‘hybrid’ solution, is
platform-independent, but may require a lot of code
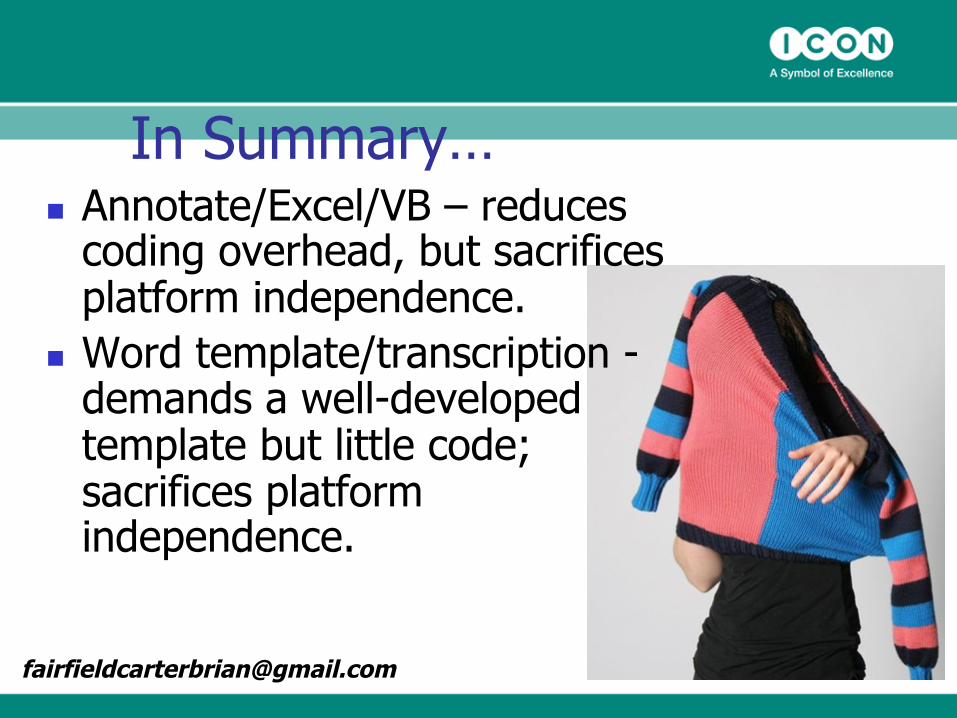
In Summary… n Annotate/Excel/VB – reduces
coding overhead, but sacrifices platform independence.
n Word template/transcription - demands a well-developed template but little code; sacrifices platform independence.