Embed Size (px)
Citation preview

The Kyoto Protocol and the Science of CO2 Stabilization
AOSC 433/633 & CHEM 433/633
Ross Salawitch
Class Web Site: http://www.atmos.umd.edu/~rjs/class/spr2013
Topics for today:
• Fossil Fuel Emission as a Function of Population & Standard of Living
• Kyoto Protocol: More than just CO2
• Attempts to regulate future atmospheric CO2 via:
− Public policy
− Engineering
433 students:
Please have a look at Problem Set 6, which has been posted
Lecture 19
18 April 2013
1Copyright © 2013 University of MarylandThis material may not be reproduced or redistributed, in whole or in part, without written permission from Ross Salawitch or Tim Canty
Fossil Fuel Emissions: Population & Standard of Living
Emissions from coal, oil, gas & cement prod, 1950 to 2011: 313.5 Gt C
• Many sources of future emissions of fossil fuel (e.g., central to IPCC forecasts)
• Some postulate can not decouple studies of future climate & population projections
(e.g., http://www.atmos.umd.edu/IMO-Population-Kalnay.pdf)
• Changes in the standard of living also likely to be extremely important
• How can we assess population vs standard of living ?!?
2Copyright © 2013 University of MarylandThis material may not be reproduced or redistributed, in whole or in part, without written permission from Ross Salawitch or Tim Canty

Atmospheric CO2 is long-lived and clearly associated with increased surface radiative forcing & rising temperature
Figures from IPCC (2007)
3Copyright © 2013 University of MarylandThis material may not be reproduced or redistributed, in whole or in part, without written permission from Ross Salawitch or Tim Canty
Atmospheric CO2 is long-lived and clearly associated with increased surface radiative forcing & rising temperature
Figures from IPCC (2007)
Models
driven
only by
natural
forcing
4Copyright © 2013 University of MarylandThis material may not be reproduced or redistributed, in whole or in part, without written permission from Ross Salawitch or Tim Canty
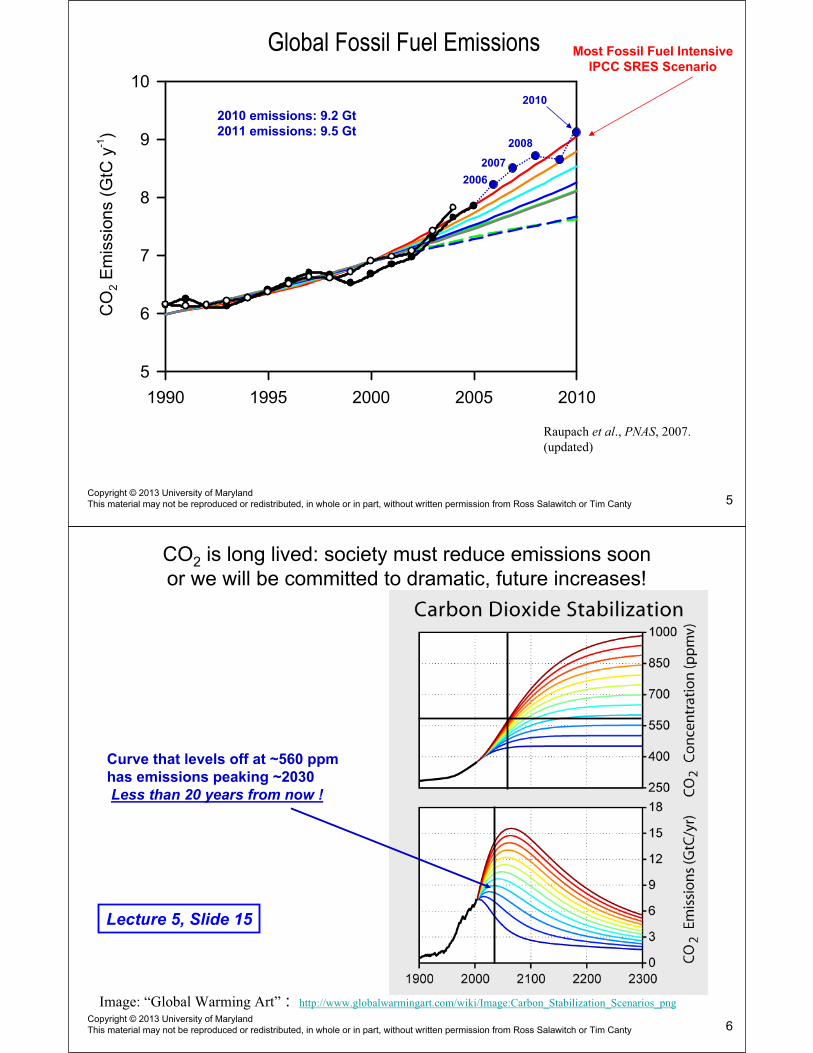
Global Fossil Fuel Emissions
1990 1995 2000 2005 2010
CO
2 E
mis
sio
ns (
GtC
y-1)
5
6
7
8
9
10Actual emissions: CDIAC
Actual emissions: EIA
450ppm stabilisation
650ppm stabilisation
A1FI
A1B
A1T
A2
B1
B2
2006
Most Fossil Fuel Intensive
IPCC SRES Scenario
2010 emissions: 9.2 Gt
2011 emissions: 9.5 Gt2008
2007
2010
Raupach et al., PNAS, 2007.
(updated)
5Copyright © 2013 University of MarylandThis material may not be reproduced or redistributed, in whole or in part, without written permission from Ross Salawitch or Tim Canty
Image: “Global Warming Art” : http://www.globalwarmingart.com/wiki/Image:Carbon_Stabilization_Scenarios_png
Curve that levels off at ~560 ppm
has emissions peaking ~2030
Less than 20 years from now !
CO2 is long lived: society must reduce emissions soonor we will be committed to dramatic, future increases!
Lecture 5, Slide 15
6Copyright © 2013 University of MarylandThis material may not be reproduced or redistributed, in whole or in part, without written permission from Ross Salawitch or Tim Canty
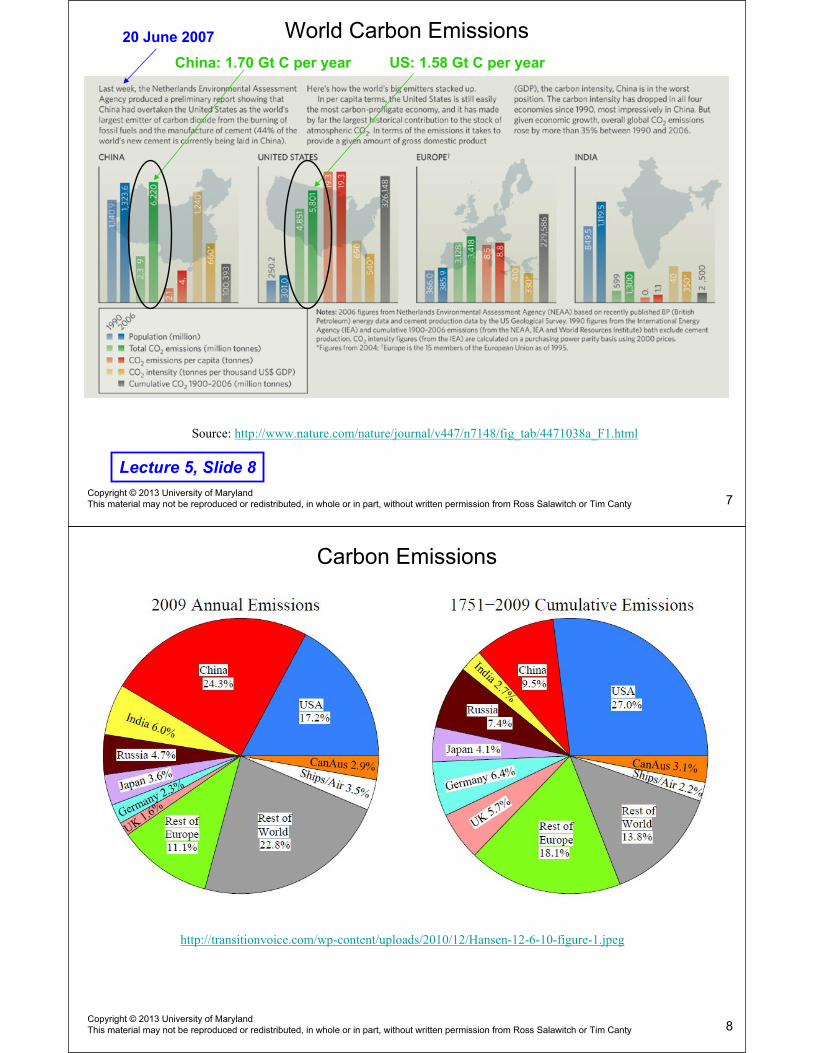
World Carbon Emissions20 June 2007
7Copyright © 2013 University of MarylandThis material may not be reproduced or redistributed, in whole or in part, without written permission from Ross Salawitch or Tim Canty
China: 1.70 Gt C per year US: 1.58 Gt C per year
Source: http://www.nature.com/nature/journal/v447/n7148/fig_tab/4471038a_F1.html
Lecture 5, Slide 8
Carbon Emissions
http://transitionvoice.com/wp-content/uploads/2010/12/Hansen-12-6-10-figure-1.jpeg
8Copyright © 2013 University of MarylandThis material may not be reproduced or redistributed, in whole or in part, without written permission from Ross Salawitch or Tim Canty

Kyoto Protocol
• Negotiated in Kyoto, Japan in November 1997
− Annex I countries: Developed countries (Table 10.1 of Houghton) with varying
emission targets, 2008-2012 relative to 1990, ranging from +10% (Iceland)to −8% (EU-15)
−Annex II countries: sub-group of Annex I countries that agree to pay cost of
technology for emission reductions in developing countries
Australia, Austria, Belgium, Canada, Denmark, Finland, France, Germany, Greece, Iceland,
Ireland, Italy, Japan, Luxembourg, Netherlands, New Zealand, Norway, Portugal, Spain,Sweden, Switzerland, United Kingdom, United States of America
−Developing countries: all countries besides those in Table 10.1 of Houghton
• Went into effect in 16 February 2005 after signed by _________
• Annex I countries:
−agree to reduce GHG emissions to target tied to 1990 emissions. If they cannotdo so, they must buy emission credits or invest in conservation
• Developing countries:
− no restrictions on GHG emissions
− encouraged to use new technology, funded by Annex II countries, to reduce emissions
− can not sell emission credits
9Copyright © 2013 University of MarylandThis material may not be reproduced or redistributed, in whole or in part, without written permission from Ross Salawitch or Tim Canty
Kyoto Protocol
Article 3
1. The Parties included in Annex I shall, individually or jointly, ensure that their aggregate anthropogenic carbon dioxide equivalent emissions of the greenhouse gases listed in Annex A do not exceed their assigned amounts, calculated pursuant to their quantified emission limitation and reduction commitments inscribed in Annex B and in accordance with the provisions of this Article, with a view toreducing their overall emissions of such gases byat least 5 per cent below 1990 levels in the commitment period 2008 to 2012.
2. Each Party included in Annex I shall, by 2005, have made demonstrable progress in achieving its commitments under this Protocol.
3. The net changes in greenhouse gas emissions bysources and removals by sinks resulting fromdirect human-induced land-use change andforestry activities, limited to afforestation, reforestation and deforestation since 1990,measured as verifiable changes in carbon stocks in each commitment period, shall be used to meet thecommitments under this Article of each Party included in Annex I. The greenhouse gas emissionsby sources and removals by sinks associated with those activities shall be reported in a transparent and verifiable manner and reviewed in accordance with Articles 7 and 8.
KYOTO PROTOCOL TO THE
UNITED NATIONS
FRAMEWORK CONVENTION ON
CLIMATE CHANGE
Page 10Copyright © 2013 University of MarylandThis material may not be reproduced or redistributed, in whole or in part, without written permission from Ross Salawitch or Tim Canty 10

Kyoto Protocol
19 June 2009
Today
11Copyright © 2013 University of MarylandThis material may not be reproduced or redistributed, in whole or in part, without written permission from Ross Salawitch or Tim Canty
Kyoto Protocol Targets CO2 emissions
Does not include:
LULUCF (land use, land-use
change and forestry)
GHGs other than CO2
12Copyright © 2013 University of MarylandThis material may not be reproduced or redistributed, in whole or in part, without written permission from Ross Salawitch or Tim Canty
The Collapse of the Kyoto Protocol and the Struggle to Slow Global Warming
David G. Victor, Princeton University Press, 2001.

Kyoto Mechanisms
• Joint Implementation− Allows developed countries to implement projects that reduce emissions or increase
natural GHG sinks in other developed countries; such projects can be counted towardsthe emission reductions of the investing country
• Clean Development Mechanism
− Allows developed countries to implement projects that reduce emissions or increase
natural GHG sinks in developing countries; such projects can be counted towardsthe emission reductions of the investing country
− Australian Carbon Data Accounting Model
http://www.climatechange.gov.au/en/government/initiatives/ncat.aspx
being discussed as pilot for international metric for quantifying effects of reforestationon the carbon fluxes
• Emissions Trading
− Annex I countries can purchase emission units from other Annex I countries thatfind it easier to reduce their own emissions
13Copyright © 2013 University of MarylandThis material may not be reproduced or redistributed, in whole or in part, without written permission from Ross Salawitch or Tim Canty
Kyoto Gases
GHG GWP, 100-yr Industrial Use Lifetime
CO2 1Fossil fuel combustion;
Land use changes
Fossil fuel combustion;
Rice paddies; Animal waste;
Sewage treatment and landfills;
Biomass burning
Agriculture & river chemistry associated with pollution
Biomass burning & fossil fuel combustion
Refrigerant (HFC−134a: CH2FCF3), foam blowingagent, and by product of HCFC manufacture
Aluminum smelting (CF4)
Semiconductor manufacturing (CF4)
Insulator in high voltage electrical equipment
Magnesium casting
Shoes and tennis balls (minor source)
Multiple, ~172 yrs
CH4 25 ~10 yrs
N2O 298 ~115 yrs
HFCs 124 to 15000Range from 1.5 to
270 yrs
PFCs 7400 to 12200 1000 to 50,000 yrs
SF6 22800 3200 yrs
14Copyright © 2013 University of MarylandThis material may not be reproduced or redistributed, in whole or in part, without written permission from Ross Salawitch or Tim Canty
GWP − Global Warming Potential
time final
HFC 134a
time initial
time final
CO2 2
time initial
[HFC 134a(t)] dt
GWP (HFC 134a)
[CO (t) dt]
− × −− =
×
a
a
where:
aHFC 134a = Radiative Efficiency (W m−2 ppb−1) due to an increase in HFC-134a
aCO2 = Radiative Efficiency (W m−2 ppb−1) due to an increase in CO2
HFC-134a (t) = time-dependent response to an instantaneous release of a pulse of HFC-134a
CO2 (t) = time-dependent response to an instantaneous release of a pulse of CO2
Note: HFC-134a is CH2FCF
HFC-134a 14 yrs Time Horizon
20-yr 100-yr 500-yr
GWP
HFC-134a
15Copyright © 2013 University of MarylandThis material may not be reproduced or redistributed, in whole or in part, without written permission from Ross Salawitch or Tim Canty
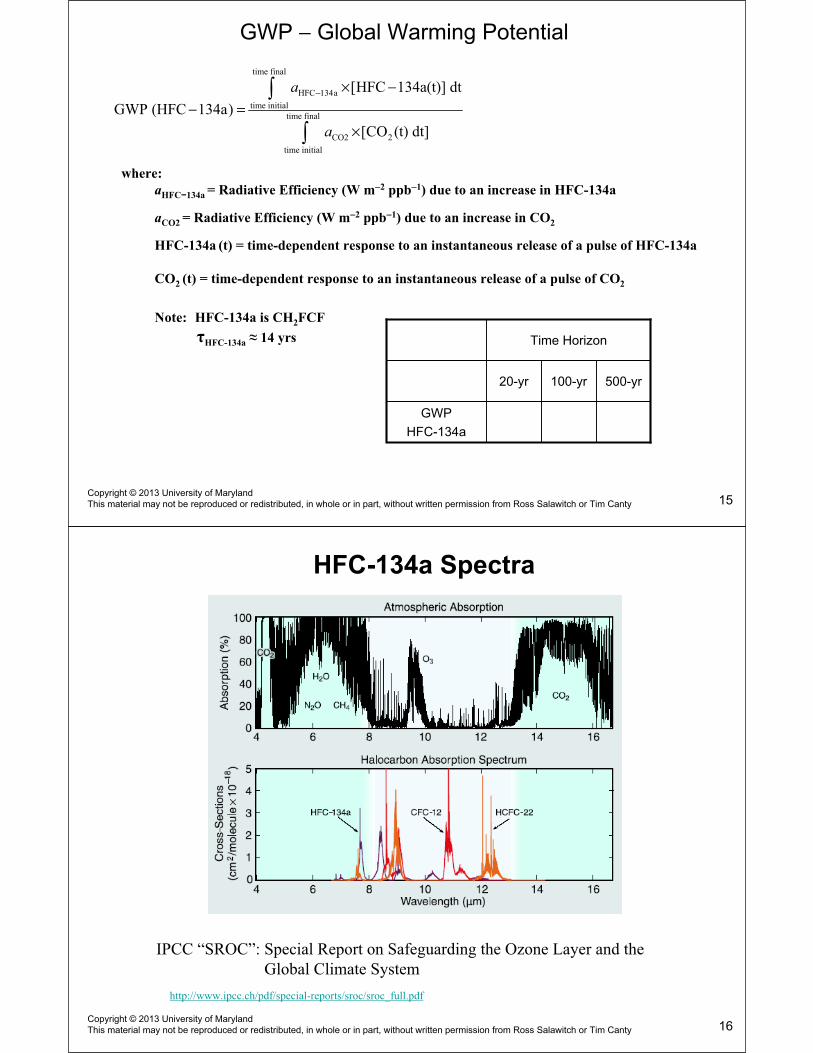
HFC-134a Spectra
IPCC “SROC”: Special Report on Safeguarding the Ozone Layer and the
Global Climate System
http://www.ipcc.ch/pdf/special-reports/sroc/sroc_full.pdf
16Copyright © 2013 University of MarylandThis material may not be reproduced or redistributed, in whole or in part, without written permission from Ross Salawitch or Tim Canty
Not all HFCs are equal wrt Global Warming
WMO/UNEO 2011 “Twenty Questions”
http://esrl.noaa.gov/csd/assessments/ozone/2010/twentyquestions
17Copyright © 2013 University of MarylandThis material may not be reproduced or redistributed, in whole or in part, without written permission from Ross Salawitch or Tim Canty
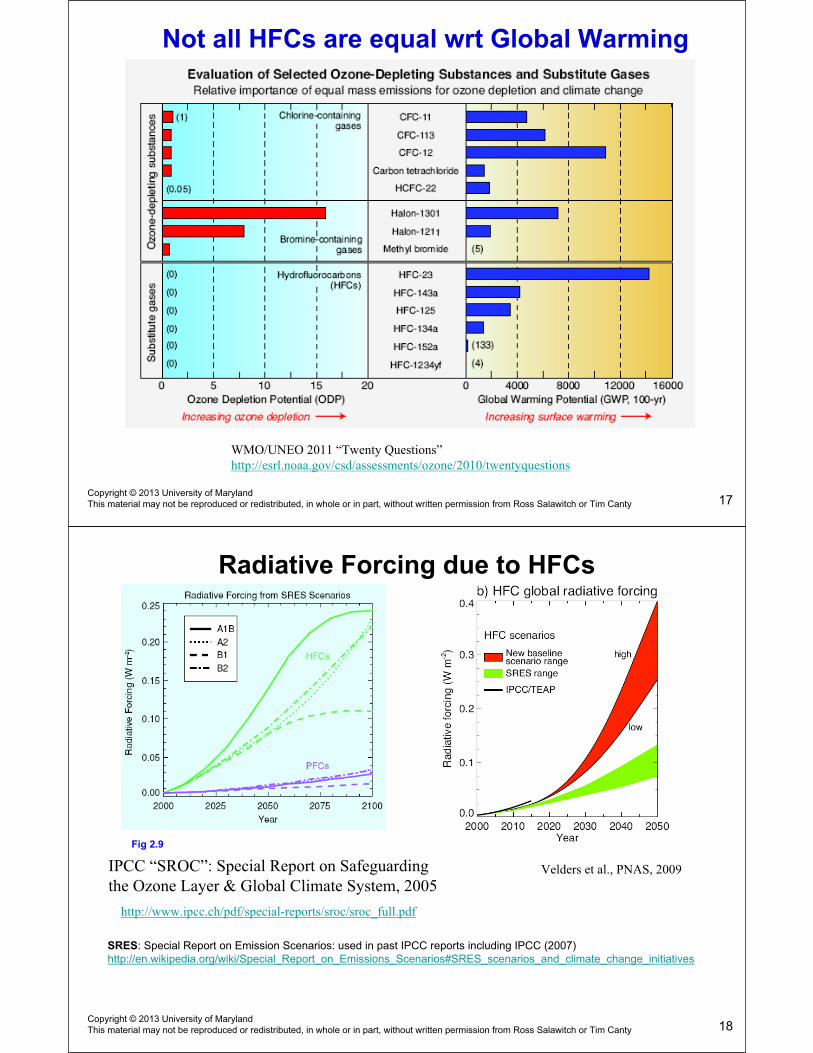
Radiative Forcing due to HFCs
Fig 2.9
IPCC “SROC”: Special Report on Safeguarding
the Ozone Layer & Global Climate System, 2005Velders et al., PNAS, 2009
http://www.ipcc.ch/pdf/special-reports/sroc/sroc_full.pdf
SRES: Special Report on Emission Scenarios: used in past IPCC reports including IPCC (2007)http://en.wikipedia.org/wiki/Special_Report_on_Emissions_Scenarios#SRES_scenarios_and_climate_change_initiatives
18Copyright © 2013 University of MarylandThis material may not be reproduced or redistributed, in whole or in part, without written permission from Ross Salawitch or Tim Canty
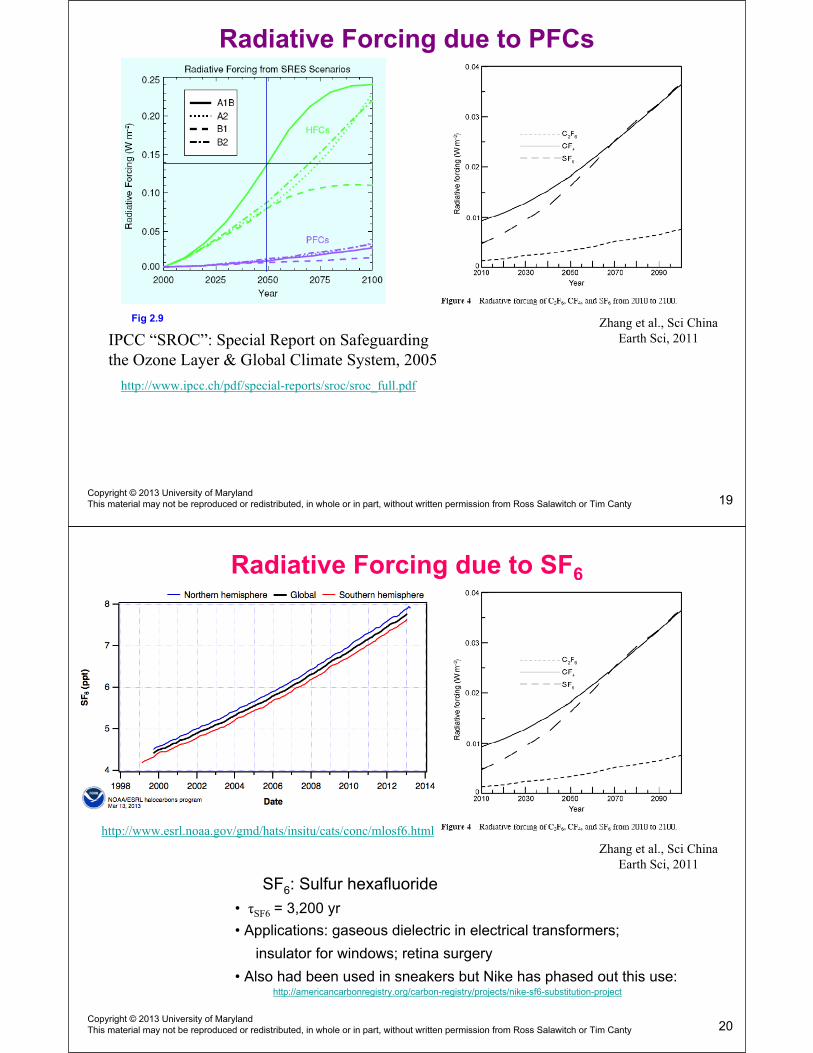
Radiative Forcing due to PFCs
IPCC “SROC”: Special Report on Safeguarding
the Ozone Layer & Global Climate System, 2005
Fig 2.9 Zhang et al., Sci China
Earth Sci, 2011
http://www.ipcc.ch/pdf/special-reports/sroc/sroc_full.pdf
19Copyright © 2013 University of MarylandThis material may not be reproduced or redistributed, in whole or in part, without written permission from Ross Salawitch or Tim Canty
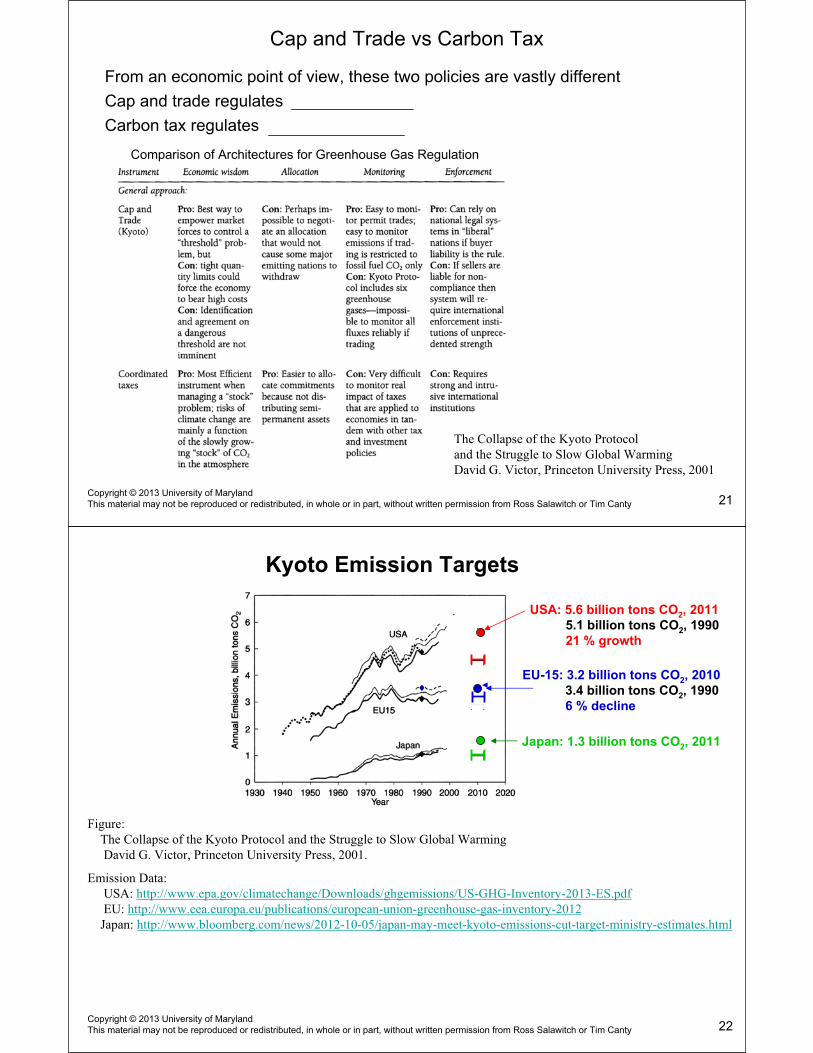
Radiative Forcing due to SF6
Zhang et al., Sci China
Earth Sci, 2011
SF6: Sulfur hexafluoride
• SF6 = 3,200 yr
• Applications: gaseous dielectric in electrical transformers;
insulator for windows; retina surgery
• Also had been used in sneakers but Nike has phased out this use:
20Copyright © 2013 University of MarylandThis material may not be reproduced or redistributed, in whole or in part, without written permission from Ross Salawitch or Tim Canty
http://americancarbonregistry.org/carbon-registry/projects/nike-sf6-substitution-project
http://www.esrl.noaa.gov/gmd/hats/insitu/cats/conc/mlosf6.html
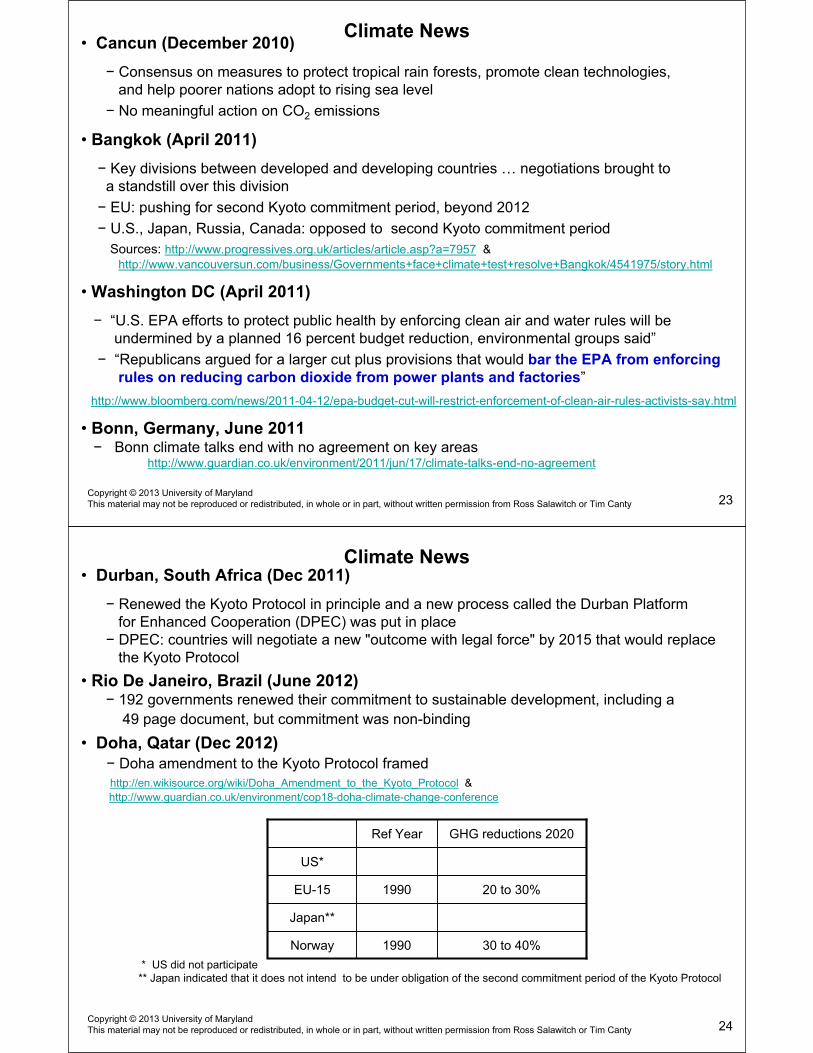
Cap and Trade vs Carbon Tax
From an economic point of view, these two policies are vastly different
Cap and trade regulates amount emitted
Carbon tax regulates price of emission
Comparison of Architectures for Greenhouse Gas Regulation
The Collapse of the Kyoto Protocol
and the Struggle to Slow Global Warming
David G. Victor, Princeton University Press, 2001
21Copyright © 2013 University of MarylandThis material may not be reproduced or redistributed, in whole or in part, without written permission from Ross Salawitch or Tim Canty
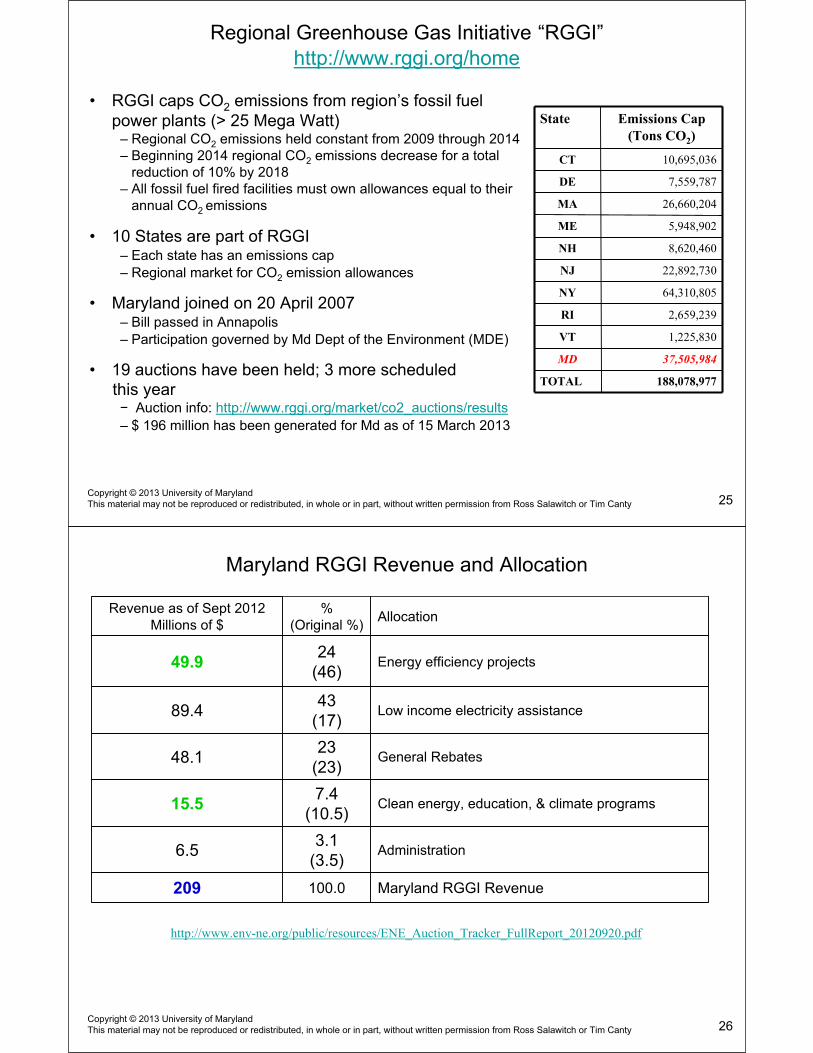
Kyoto Emission Targets
EU-15: 3.2 billion tons CO2, 2010
3.4 billion tons CO2, 1990
6 % decline
Japan: 1.3 billion tons CO2, 2011
USA: 5.6 billion tons CO2, 2011
5.1 billion tons CO2, 1990
21 % growth
♦
Figure:
The Collapse of the Kyoto Protocol and the Struggle to Slow Global Warming
David G. Victor, Princeton University Press, 2001.
Emission Data:
USA: http://www.epa.gov/climatechange/Downloads/ghgemissions/US-GHG-Inventory-2013-ES.pdf
EU: http://www.eea.europa.eu/publications/european-union-greenhouse-gas-inventory-2012
Japan: http://www.bloomberg.com/news/2012-10-05/japan-may-meet-kyoto-emissions-cut-target-ministry-estimates.html
22Copyright © 2013 University of MarylandThis material may not be reproduced or redistributed, in whole or in part, without written permission from Ross Salawitch or Tim Canty
• Cancun (December 2010)
Consensus on measures to protect tropical rain forests, promote clean technologies,and help poorer nations adopt to rising sea level
No meaningful action on CO2 emissions
• Bangkok (April 2011)
Key divisions between developed and developing countries … negotiations brought toa standstill over this division
EU: pushing for second Kyoto commitment period, beyond 2012
U.S., Japan, Russia, Canada: opposed to second Kyoto commitment period
Sources: http://www.progressives.org.uk/articles/article.asp?a=7957 &
http://www.vancouversun.com/business/Governments+face+climate+test+resolve+Bangkok/4541975/story.html
• Washington DC (April 2011)
“U.S. EPA efforts to protect public health by enforcing clean air and water rules will beundermined by a planned 16 percent budget reduction, environmental groups said”
“Republicans argued for a larger cut plus provisions that would bar the EPA from enforcing
rules on reducing carbon dioxide from power plants and factories”
http://www.bloomberg.com/news/2011-04-12/epa-budget-cut-will-restrict-enforcement-of-clean-air-rules-activists-say.html
• Bonn, Germany, June 2011Bonn climate talks end with no agreement on key areas
http://www.guardian.co.uk/environment/2011/jun/17/climate-talks-end-no-agreement
Climate News
23Copyright © 2013 University of MarylandThis material may not be reproduced or redistributed, in whole or in part, without written permission from Ross Salawitch or Tim Canty
• Durban, South Africa (Dec 2011)
Renewed the Kyoto Protocol in principle and a new process called the Durban Platformfor Enhanced Cooperation (DPEC) was put in placeDPEC: countries will negotiate a new "outcome with legal force" by 2015 that would replacethe Kyoto Protocol
• Rio De Janeiro, Brazil (June 2012)192 governments renewed their commitment to sustainable development, including a
49 page document, but commitment was non-binding
• Doha, Qatar (Dec 2012)
Doha amendment to the Kyoto Protocol framedhttp://en.wikisource.org/wiki/Doha_Amendment_to_the_Kyoto_Protocol &
http://www.guardian.co.uk/environment/cop18-doha-climate-change-conference
Climate News
Ref Year GHG reductions 2020
US*
EU-15 1990 20 to 30%
Japan**
Norway 1990 30 to 40%
* US did not participate** Japan indicated that it does not intend to be under obligation of the second commitment period of the Kyoto Protocol
24Copyright © 2013 University of MarylandThis material may not be reproduced or redistributed, in whole or in part, without written permission from Ross Salawitch or Tim Canty
Regional Greenhouse Gas Initiative “RGGI”
http://www.rggi.org/home
• RGGI caps CO2 emissions from region’s fossil fuel power plants (> 25 Mega Watt)
– Regional CO2 emissions held constant from 2009 through 2014– Beginning 2014 regional CO2 emissions decrease for a total
reduction of 10% by 2018– All fossil fuel fired facilities must own allowances equal to their
annual CO2 emissions
• 10 States are part of RGGI– Each state has an emissions cap
– Regional market for CO2 emission allowances
• Maryland joined on 20 April 2007– Bill passed in Annapolis
– Participation governed by Md Dept of the Environment (MDE)
• 19 auctions have been held; 3 more scheduledthis year
Auction info: http://www.rggi.org/market/co2_auctions/results
– $ 196 million has been generated for Md as of 15 March 2013
1,225,830VT
State Emissions Cap
(Tons CO2)
CT 10,695,036
DE 7,559,787
MA 26,660,204
ME 5,948,902
NH 8,620,460
NJ 22,892,730
NY 64,310,805
RI 2,659,239
MD 37,505,984
TOTAL 188,078,977
25Copyright © 2013 University of MarylandThis material may not be reproduced or redistributed, in whole or in part, without written permission from Ross Salawitch or Tim Canty
Revenue as of Sept 2012Millions of $
%(Original %)
Allocation
49.924
(46)Energy efficiency projects
89.443
(17)Low income electricity assistance
48.123
(23)General Rebates
15.57.4
(10.5)Clean energy, education, & climate programs
6.53.1
(3.5)Administration
209 100.0 Maryland RGGI Revenue
Maryland RGGI Revenue and Allocation
http://www.env-ne.org/public/resources/ENE_Auction_Tracker_FullReport_20120920.pdf
26Copyright © 2013 University of MarylandThis material may not be reproduced or redistributed, in whole or in part, without written permission from Ross Salawitch or Tim Canty
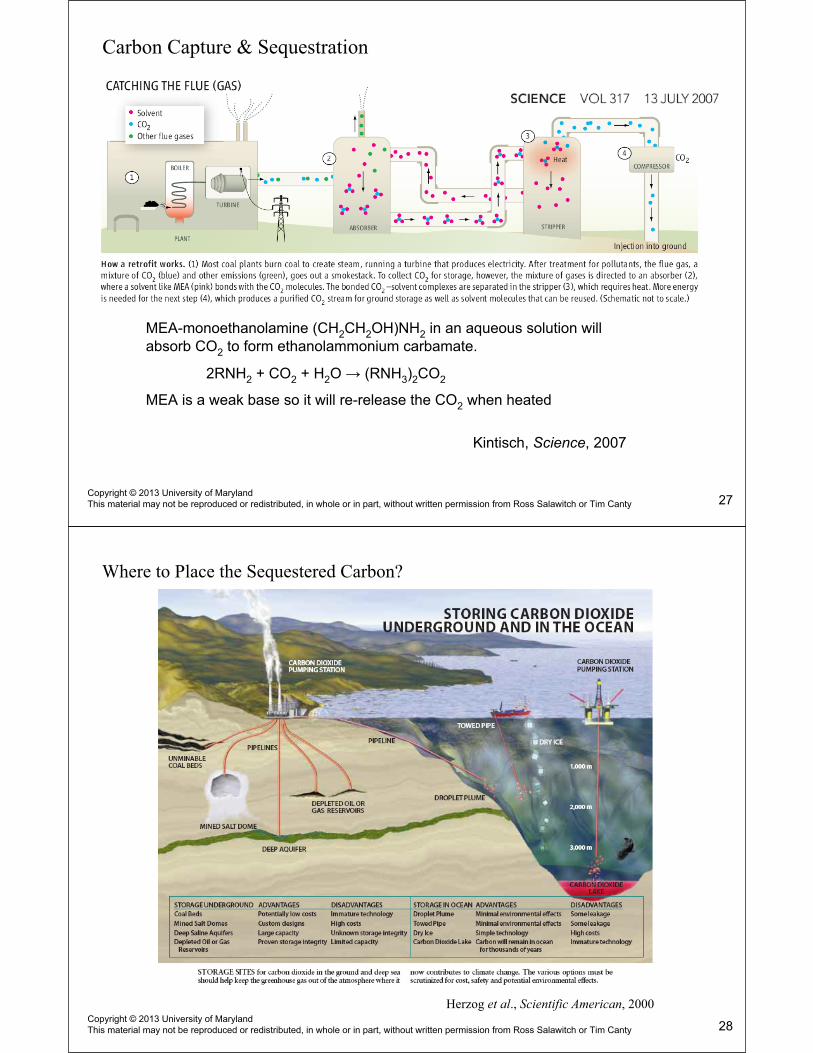
Carbon Capture & Sequestration
MEA-monoethanolamine (CH2CH2OH)NH2 in an aqueous solution will absorb CO2 to form ethanolammonium carbamate.
2RNH2 + CO2 + H2O (RNH3)2CO2
MEA is a weak base so it will re-release the CO2 when heated
Kintisch, Science, 2007
27Copyright © 2013 University of MarylandThis material may not be reproduced or redistributed, in whole or in part, without written permission from Ross Salawitch or Tim Canty
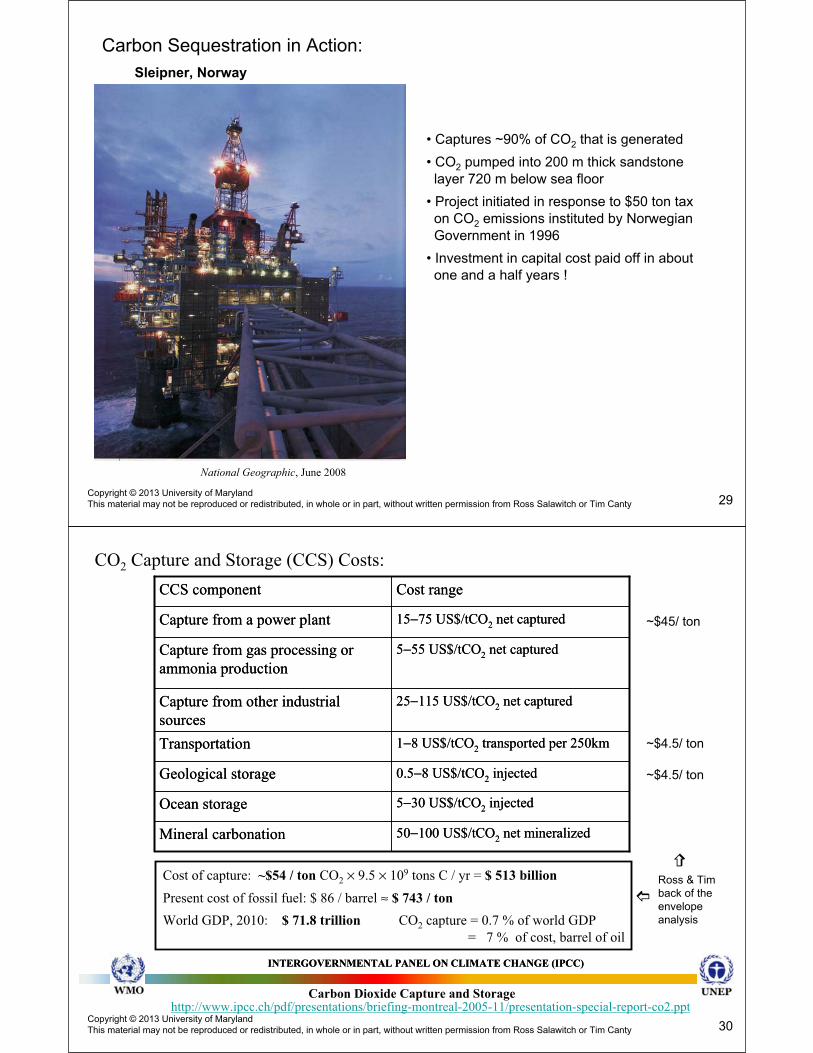
Where to Place the Sequestered Carbon?
Herzog et al., Scientific American, 2000
28Copyright © 2013 University of MarylandThis material may not be reproduced or redistributed, in whole or in part, without written permission from Ross Salawitch or Tim Canty
Carbon Sequestration in Action:
Sleipner, Norway
• Captures ~90% of CO2 that is generated
• CO2 pumped into 200 m thick sandstonelayer 720 m below sea floor
• Project initiated in response to $50 ton taxon CO2 emissions instituted by NorwegianGovernment in 1996
• Investment in capital cost paid off in aboutone and a half years !
National Geographic, June 2008
29Copyright © 2013 University of MarylandThis material may not be reproduced or redistributed, in whole or in part, without written permission from Ross Salawitch or Tim Canty
CO2 Capture and Storage (CCS) Costs:
50−100 US$/tCO2 net mineralizedMineral carbonation
5−30 US$/tCO2 injectedOcean storage
0.5−8 US$/tCO2 injectedGeological storage
1−8 US$/tCO2
transported per 250kmTransportation
25−115 US$/tCO2 net capturedCapture from other industrial
sources
5−55 US$/tCO2 net capturedCapture from gas processing or
ammonia production
15−75 US$/tCO2
net capturedCapture from a power plant
Cost rangeCCS component
~$45/ ton
~$4.5/ ton
~$4.5/ ton
Cost of capture: ~$54 / ton CO2 × 9.5 × 109 tons C / yr = $ 513 billion
Present cost of fossil fuel: $ 86 / barrel ≈ $ 743 / ton
World GDP, 2010: $ 71.8 trillion CO2 capture = 0.7 % of world GDP
= 7 % of cost, barrel of oil
Ross & Timback of theenvelopeanalysis
INTERGOVERNMENTAL PANEL ON CLIMATE CHANGE (IPCC)INTERGOVERNMENTAL PANEL ON CLIMATE CHANGE (IPCC)
Carbon Dioxide Capture and Storage
30Copyright © 2013 University of MarylandThis material may not be reproduced or redistributed, in whole or in part, without written permission from Ross Salawitch or Tim Canty
http://www.ipcc.ch/pdf/presentations/briefing-montreal-2005-11/presentation-special-report-co2.ppt
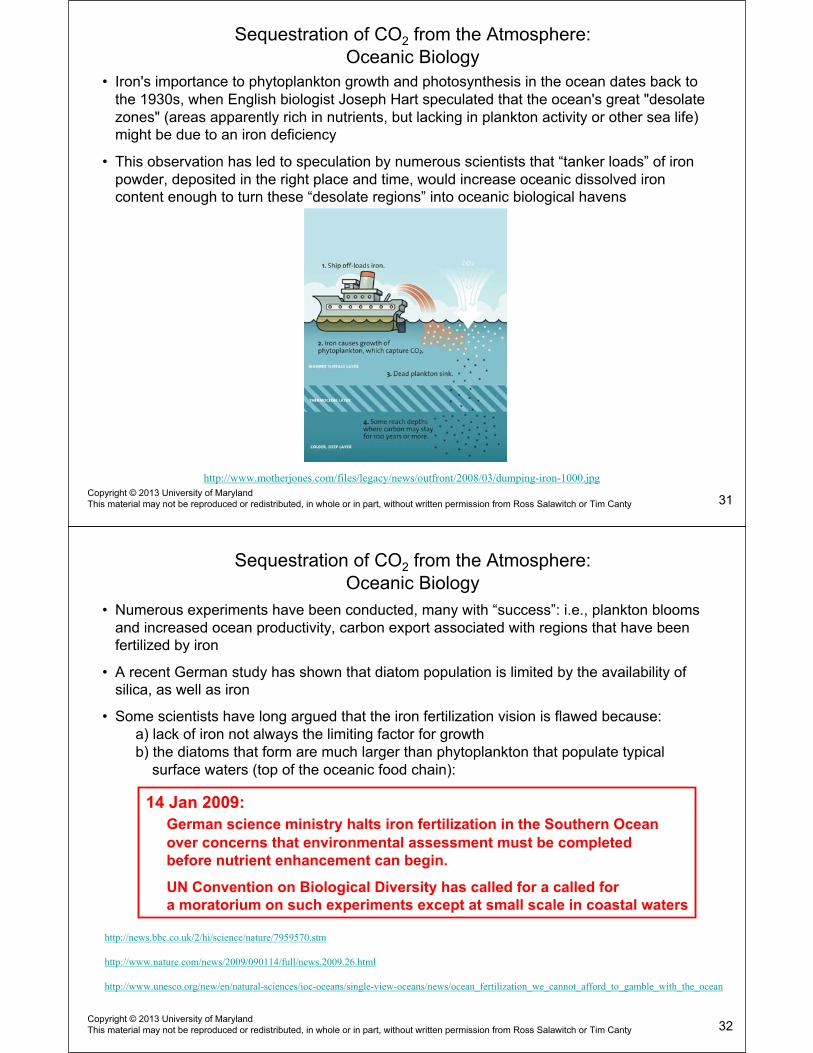
Sequestration of CO2 from the Atmosphere:Oceanic Biology
• Iron's importance to phytoplankton growth and photosynthesis in the ocean dates back tothe 1930s, when English biologist Joseph Hart speculated that the ocean's great "desolate zones" (areas apparently rich in nutrients, but lacking in plankton activity or other sea life) might be due to an iron deficiency
• This observation has led to speculation by numerous scientists that “tanker loads” of iron powder, deposited in the right place and time, would increase oceanic dissolved iron content enough to turn these “desolate regions” into oceanic biological havens
http://www.motherjones.com/files/legacy/news/outfront/2008/03/dumping-iron-1000.jpg
31Copyright © 2013 University of MarylandThis material may not be reproduced or redistributed, in whole or in part, without written permission from Ross Salawitch or Tim Canty
Sequestration of CO2 from the Atmosphere:Oceanic Biology
• Numerous experiments have been conducted, many with “success”: i.e., plankton blooms and increased ocean productivity, carbon export associated with regions that have been fertilized by iron
• A recent German study has shown that diatom population is limited by the availability of silica, as well as iron
• Some scientists have long argued that the iron fertilization vision is flawed because:a) lack of iron not always the limiting factor for growthb) the diatoms that form are much larger than phytoplankton that populate typical
surface waters (top of the oceanic food chain):
14 Jan 2009:
German science ministry halts iron fertilization in the Southern Ocean
over concerns that environmental assessment must be completed
before nutrient enhancement can begin.
UN Convention on Biological Diversity has called for a called for
a moratorium on such experiments except at small scale in coastal waters
http://news.bbc.co.uk/2/hi/science/nature/7959570.stm
http://www.nature.com/news/2009/090114/full/news.2009.26.html
http://www.unesco.org/new/en/natural-sciences/ioc-oceans/single-view-oceans/news/ocean_fertilization_we_cannot_afford_to_gamble_with_the_ocean
32Copyright © 2013 University of MarylandThis material may not be reproduced or redistributed, in whole or in part, without written permission from Ross Salawitch or Tim Canty
Sequestration of CO2 from the Atmosphere:Oceanic Biology
• Numerous experiments have been conducted, many with “success”: i.e., plankton blooms and increased ocean productivity, carbon export associated with regions that have been fertilized by iron
• A recent German study has shown that diatom population is limited by the availability of silica, as well as iron
• Some scientists have long argued that the iron fertilization vision is flawed because:a) lack of iron not always the limiting factor for growthb) the diatoms that form are much larger than phytoplankton that populate typical
surface waters (top of the oceanic food chain)
• Academic research continues:
http://www.biogeosciences.net/7/4017/2010/bg-7-4017-2010.html
33Copyright © 2013 University of MarylandThis material may not be reproduced or redistributed, in whole or in part, without written permission from Ross Salawitch or Tim Canty
Sequestration of CO2 from the Atmosphere:Carbon Burial
• Prof Ning Zeng (UMCP) advocates planting, harvesting, and burial of rapidly growingtrees (proposal is to collect dead trees on forest floor and selectively log live trees)
• Meetings have been held to discuss this idea:
• A UMd Gemstone Project has addressed this issuehttp://teams.gemstone.umd.edu/classof2010/carbonsinks
• Statements from Zeng, Carbon Sequestration Via Wood Burial, Carbon Balance and
Management, 2008 http://www.cbmjournal.com/content/3/1/1 :
Here I suggest an approach in which wood from old or dead trees in the world's forests is harvested & buried in trenches under a layer of soil, where the anaerobic condition slows the decomposition of the buried wood.
Because of low oxygen below the soil surface, decomposition of buried wood is expected to be slow
34Copyright © 2013 University of MarylandThis material may not be reproduced or redistributed, in whole or in part, without written permission from Ross Salawitch or Tim Canty
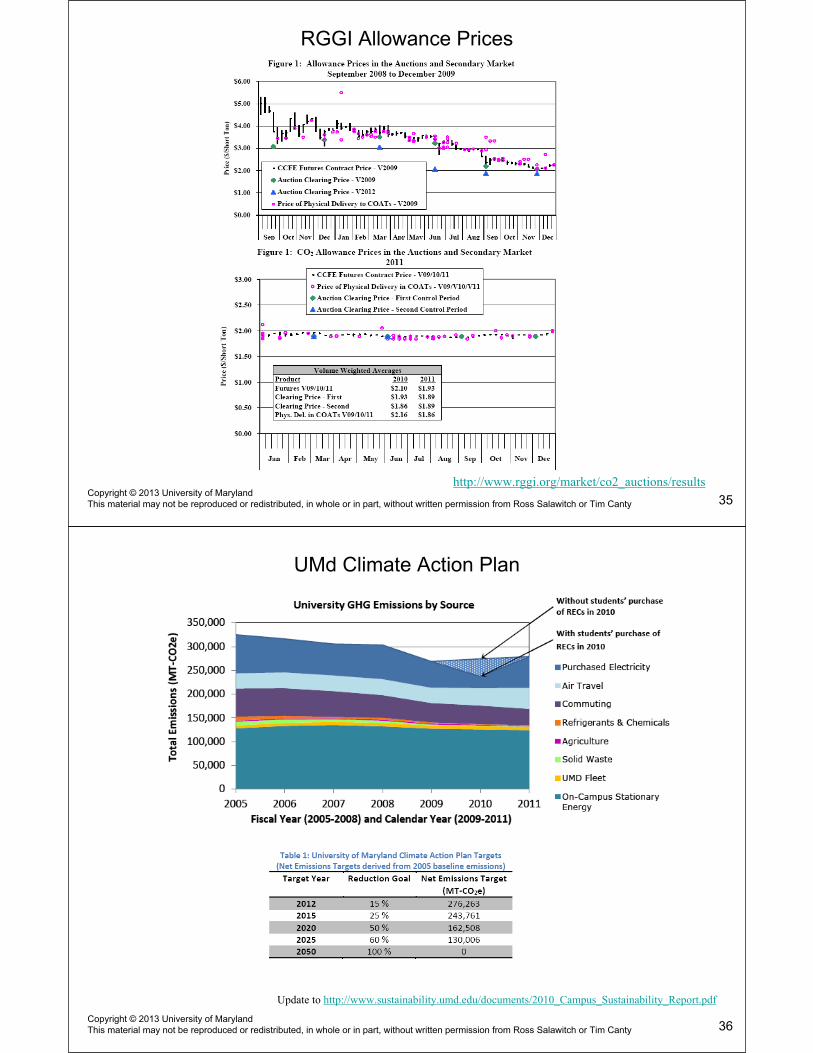
RGGI Allowance Prices
35Copyright © 2013 University of MarylandThis material may not be reproduced or redistributed, in whole or in part, without written permission from Ross Salawitch or Tim Canty
http://www.rggi.org/market/co2_auctions/results
UMd Climate Action Plan
Update to http://www.sustainability.umd.edu/documents/2010_Campus_Sustainability_Report.pdf
36Copyright © 2013 University of MarylandThis material may not be reproduced or redistributed, in whole or in part, without written permission from Ross Salawitch or Tim Canty
![Random Numbers Certi ed by Bell’s Theorem · The randomness of the output string rcan be quanti ed by the min-entropy [21] H 1(RjS) = log 2 [max rP(rjs)], where P(rjs) is the conditional](https://img.pdfslide.us/doc/110x75/60158a278605a67ab738a8d4/random-numbers-certi-ed-by-bellas-theorem-the-randomness-of-the-output-string.jpg)