Embed Size (px)
Citation preview

The Kyoto Protocol and the Science of CO2 Stabilization
AOSC 434/658R & CHEM 434/678A
Ross Salawitch
Class Web Site: http://www.atmos.umd.edu/~rjs/class/spr2011
Topics for today:
• Fossil fuel reserves
• Numerous slides tying to first part of class (climate change)
• Overview of attempts to regulate future atmospheric CO2 via:
− Public policy
− Engineering
Lecture 18
14 April 2011
1Copyright © 2011 University of MarylandThis material may not be reproduced or redistributed, in whole or in part, without written permission from Ross Salawitch or Tim Canty
Fossil Fuel Emissions and Reserves
Kharecha and Hansen, GBC, 2008.
2Copyright © 2011 University of MarylandThis material may not be reproduced or redistributed, in whole or in part, without written permission from Ross Salawitch or Tim Canty

World Carbon Emissions20 June 2007
3Copyright © 2011 University of MarylandThis material may not be reproduced or redistributed, in whole or in part, without written permission from Ross Salawitch or Tim Canty
China: 1.70 Gt C per year US: 1.58 Gt C per year
Historic Carbon Emissions
http://climateprogress.org/2008/04/28/tipping-point-a-non-technical-perspective-by-hansen
4Copyright © 2011 University of MarylandThis material may not be reproduced or redistributed, in whole or in part, without written permission from Ross Salawitch or Tim Canty

How Much Fossil Fuel Reserve Does The World Really Have?
Hubbert’s Peak
• M. King Hubbert: Shell geophysicist
• 1956 : presented a paper “Nuclear Energy and Fossil Fuels”
that predicted US oil production would peak in 1970
• Paper was met with skepticism & ridicule
• But: this prediction was remarkably accurate !
5Copyright © 2011 University of MarylandThis material may not be reproduced or redistributed, in whole or in part, without written permission from Ross Salawitch or Tim Canty
Global Oil Production Predicted to Peak Next Decade !
Hubbert-like analysis applied to 47 major oil producing countries leads to conclusion that global production of oil will peak near 2014.
Actual production curve shows effects of economic and geo-political events
Cumulative (cum.) production curve indicates known oil reserves are ~ 2.1 TSTN(trillion stock tank barrels), half of which
have been produced
Nashawi et al., Energy Fuels, 2010
http://pubs.acs.org/doi/abs/10.1021/ef901240p
6Copyright © 2011 University of MarylandThis material may not be reproduced or redistributed, in whole or in part, without written permission from Ross Salawitch or Tim Canty
Many countries have experienced peak oil production
http://www.energywatchgroup.org/fileadmin/global/pdf/2008-02_EWG_Oil_Report_updated.pdf
7Copyright © 2011 University of MarylandThis material may not be reproduced or redistributed, in whole or in part, without written permission from Ross Salawitch or Tim Canty
Extensive Literature on This Subject
8Copyright © 2011 University of MarylandThis material may not be reproduced or redistributed, in whole or in part, without written permission from Ross Salawitch or Tim Canty

Fossil Fuel Projections
BAU: Business As Usual
Kharecha and Hansen, GBC, 2008.
LU: Land Use
9Copyright © 2011 University of MarylandThis material may not be reproduced or redistributed, in whole or in part, without written permission from Ross Salawitch or Tim Canty
Coal Reserves by Country
http://www.theglobaleducationproject.org/earth/energy-supply.php
10Copyright © 2011 University of MarylandThis material may not be reproduced or redistributed, in whole or in part, without written permission from Ross Salawitch or Tim Canty

Canadian oil sands (tar sands)
May represent 2/3 of world's total petroleum resource
Not considered in many estimates of fossil fuel reserves
Because of oil sands production, Canada is largestsupplier of oil to US
“Gold rush” like economic boom in Alberta Canada
Fossil fuel extraction energy and water intensive:forests flattened and large waste water lakes created
See http://en.wikipedia.org/wiki/Tar_sands and http://oilsands.alberta.ca/ for more info.
11Copyright © 2011 University of MarylandThis material may not be reproduced or redistributed, in whole or in part, without written permission from Ross Salawitch or Tim Canty
Future Use of Fossil Fuels
• If society decides to continue to reply on fossil fuels, we will become increasinglyreliant on coal (in the short term) and oil sands (in the long term)
Why is this a concern?
Why else might reliance on coal and oil sands be a concern?
12Copyright © 2011 University of MarylandThis material may not be reproduced or redistributed, in whole or in part, without written permission from Ross Salawitch or Tim Canty

Future Use of Fossil Fuels
• If society decides to continue to reply on fossil fuels, we will become increasinglyreliant on coal (in the short term) and oil sands (in the long term)
Why else might reliance on coal and oil sands be a concern?
13Copyright © 2011 University of MarylandThis material may not be reproduced or redistributed, in whole or in part, without written permission from Ross Salawitch or Tim Canty
Removal of NOx from Power Plants
NOx Control:SCR Selective Catalytic Reduction
4NO + 4NH3 + O2 4N2 + 6H2O
6NO2 + 8NH3 7N2 + 12H2O
CatalystMaximize NOx N2
Minimize SO2 SO3
Slide courtesy John Sherwell, Md Dept of Natural Resources
http://www.dnr.maryland.gov/bay/pprp
Brandon Shores, Md
Coal Power Plant
14Copyright © 2011 University of MarylandThis material may not be reproduced or redistributed, in whole or in part, without written permission from Ross Salawitch or Tim Canty

Removal of NOx from Power Plants
Brandon Shores, Md
Coal Power Plant
Slide courtesy John Sherwell, Md Dept of Natural Resources
15Copyright © 2011 University of MarylandThis material may not be reproduced or redistributed, in whole or in part, without written permission from Ross Salawitch or Tim Canty
http://www.dnr.maryland.gov/bay/pprp
SCR at Brandon Shores
SO2 emissions: largely driven by coal combustion
Projection of SO2 emissions made in 1997:
http://earthtrends.wri.org/text/climate-atmosphere/feature-27.html
China has implemented flue
gas desulphurization at more than 50%
of its coal fired power plants as of 2008.
SO2 emissions are stable from China
and the rest of Asia !
Lu et al., ACP, 2010
SO2 Emissions, China
16Copyright © 2011 University of MarylandThis material may not be reproduced or redistributed, in whole or in part, without written permission from Ross Salawitch or Tim Canty

Atmospheric CO2 is long-lived and clearly associated with increased surface radiative forcing & rising temperature
Figures from IPCC (2007)
17Copyright © 2011 University of MarylandThis material may not be reproduced or redistributed, in whole or in part, without written permission from Ross Salawitch or Tim Canty
Atmospheric CO2 is long-lived and clearly associated with increased surface radiative forcing & rising temperature
Figures from IPCC (2007)
Models
driven
only by
natural
forcing
18Copyright © 2011 University of MarylandThis material may not be reproduced or redistributed, in whole or in part, without written permission from Ross Salawitch or Tim Canty

Global Fossil Fuel Emissions
1990 1995 2000 2005 2010
CO
2 E
mis
sio
ns (
GtC
y-1)
5
6
7
8
9
10Actual emissions: CDIAC
Actual emissions: EIA
450ppm stabilisation
650ppm stabilisation
A1FI
A1B
A1T
A2
B1
B2
2006
Most Fossil Fuel Intensive
IPCC Emission Scenario
2009 emissions: 8.4 Gt
20082007
2009
Raupach et al., PNAS, 2007.
(updated)
19Copyright © 2011 University of MarylandThis material may not be reproduced or redistributed, in whole or in part, without written permission from Ross Salawitch or Tim Canty
Image: “Global Warming Art” : http://www.globalwarmingart.com/wiki/Image:Carbon_Stabilization_Scenarios_png
Curve that levels off at ~550 ppm
has emissions peaking in 2027
(less than 20 years from now!)
CO2 is long lived: society must reduce emissions soonor we will be committed to dramatic, future increases!
20Copyright © 2011 University of MarylandThis material may not be reproduced or redistributed, in whole or in part, without written permission from Ross Salawitch or Tim Canty

Kyoto Protocol
• Negotiated in Kyoto, Japan in November 1997
− Annex I countries: Developed countries (Table 10.1 of Houghton) with varying
emission targets, 2008-2012 relative to 1990, ranging from +10% (Iceland)to −8% (EU-15)
−Annex II countries: sub-group of Annex I countries that agree to pay cost of
technology for emission reductions in developing countries
Australia, Austria, Belgium, Canada, Denmark, Finland, France, Germany, Greece, Iceland,
Ireland, Italy, Japan, Luxembourg, Netherlands, New Zealand, Norway, Portugal, Spain,Sweden, Switzerland, United Kingdom, United States of America
−Developing countries: all countries besides those in Table 10.1 of Houghton
• Went into effect in 16 February 2005 after signed by _________
• Annex I countries:
−agree to reduce GHG emissions to target tied to 1990 emissions. If they cannotdo so, they must buy emission credits or invest in conservation
• Developing countries:
− no restrictions on GHG emissions
− encouraged to use new technology, funded by Annex II countries, to reduce emissions
− can not sell emission credits
21Copyright © 2011 University of MarylandThis material may not be reproduced or redistributed, in whole or in part, without written permission from Ross Salawitch or Tim Canty
Kyoto Protocol
Article 3
1. The Parties included in Annex I shall, individually or jointly, ensure that their aggregate anthropogenic carbon dioxide equivalent emissions of the greenhouse gases listed in Annex A do not exceed their assigned amounts, calculated pursuant to their quantified emission limitation and reduction commitments inscribed in Annex B and in accordance with the provisions of this Article, with a view toreducing their overall emissions of such gases byat least 5 per cent below 1990 levels in the commitment period 2008 to 2012.
2. Each Party included in Annex I shall, by 2005, have made demonstrable progress in achieving its commitments under this Protocol.
3. The net changes in greenhouse gas emissions bysources and removals by sinks resulting fromdirect human-induced land-use change andforestry activities, limited to afforestation, reforestation and deforestation since 1990,measured as verifiable changes in carbon stocks in each commitment period, shall be used to meet thecommitments under this Article of each Party included in Annex I. The greenhouse gas emissionsby sources and removals by sinks associated with those activities shall be reported in a transparent and verifiable manner and reviewed in accordance with Articles 7 and 8.
KYOTO PROTOCOL TO THE
UNITED NATIONS
FRAMEWORK CONVENTION ON
CLIMATE CHANGE
Page 22Copyright © 2011 University of MarylandThis material may not be reproduced or redistributed, in whole or in part, without written permission from Ross Salawitch or Tim Canty

Kyoto Protocol
Today
23Copyright © 2011 University of MarylandThis material may not be reproduced or redistributed, in whole or in part, without written permission from Ross Salawitch or Tim Canty
Kyoto Protocol Targets
24Copyright © 2011 University of MarylandThis material may not be reproduced or redistributed, in whole or in part, without written permission from Ross Salawitch or Tim Canty
The Collapse of the Kyoto Protocol and the Struggle to Slow Global Warming
David G. Victor, Princeton University Press, 2001.

Kyoto Mechanisms
• Joint Implementation− Allows developed countries to implement projects that reduce emissions or increase
natural GHG sinks in other developed countries; such projects can be counted towardsthe emission reductions of the investing country
• Clean Development Mechanism
− Allows developed countries to implement projects that reduce emissions or increase
natural GHG sinks in developing countries; such projects can be counted towardsthe emission reductions of the investing country
− Australian Carbon Data Accounting Model
http://www.greenhouse.gov.au/ncas/activities/modelling.html
being discussed as pilot for international metric for quantifying effects of reforestationon the carbon fluxes
• Emissions Trading
− Annex I countries can purchase emission units from other Annex I countries thatfind it easier to reduce their own emissions
25Copyright © 2011 University of MarylandThis material may not be reproduced or redistributed, in whole or in part, without written permission from Ross Salawitch or Tim Canty
Kyoto Gases
GHG GWP Industrial Use Lifetime
CO2 1Fossil fuel combustion;
Land use changes
Fossil fuel combustion;
Rice paddies; Animal waste;
Sewage treatment and landfills;
Biomass burning
Agriculture & river chemistry associated with pollution
Biomass burning & fossil fuel combustion
Refrigerant (HFC−134a: CH2FCF3), foam blowingagent, and by product of HCFC manufacture
Aluminum smelting (CF4)
Semiconductor manufacturing (CF4)
Insulator in high voltage electrical equipment
Magnesium casting
Shoes and tennis balls (minor source)
Multiple, ~172 yrs
CH4 23 ~10 yrs
N2O 296 ~115 yrs
HFCs 12 to 12000Range from 1.5 to
270 yrs;
14 yr for HFC-134a
PFCs 5000 to 12000 1000 to 50,000 yrs
SF6 22200 3200 yrs
26Copyright © 2011 University of MarylandThis material may not be reproduced or redistributed, in whole or in part, without written permission from Ross Salawitch or Tim Canty

GWP − Global Warming Potential
time final
SF6 6
time initial6 time final
CO2 2
time initial
[SF (t)] dt
GWP (SF )
[CO (t) dt]
×=
×
a
a
where:
aSF6 = Radiative Efficiency (W m−2 ppb−1) due to an increase in SF6
aCO2 = Radiative Efficiency (W m−2 ppb−1) due to an increase in CO2
SF6 (t) = time-dependent response to an instantaneous release of a pulse of SF6
CO2 (t) = time-dependent response to an instantaneous release of a pulse of CO2
27Copyright © 2011 University of MarylandThis material may not be reproduced or redistributed, in whole or in part, without written permission from Ross Salawitch or Tim Canty
HFCs Spectra
IPCC “SROC”: Special Report on Safeguarding the Ozone Layer and the
Global Climate System
http://arch.rivm.nl/env/int/ipcc/pages_media/SROC-final/SpecialReportSROC.html
28Copyright © 2011 University of MarylandThis material may not be reproduced or redistributed, in whole or in part, without written permission from Ross Salawitch or Tim Canty
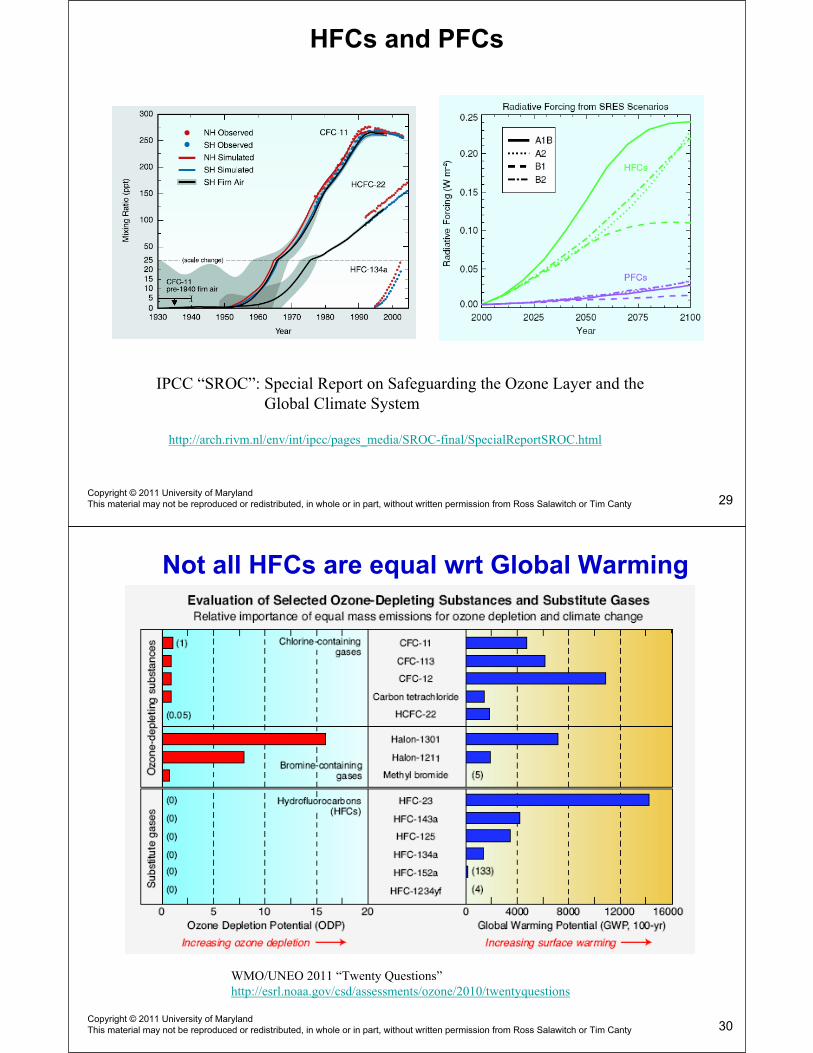
HFCs and PFCs
IPCC “SROC”: Special Report on Safeguarding the Ozone Layer and the
Global Climate System
http://arch.rivm.nl/env/int/ipcc/pages_media/SROC-final/SpecialReportSROC.html
29Copyright © 2011 University of MarylandThis material may not be reproduced or redistributed, in whole or in part, without written permission from Ross Salawitch or Tim Canty
Not all HFCs are equal wrt Global Warming
WMO/UNEO 2011 “Twenty Questions”
http://esrl.noaa.gov/csd/assessments/ozone/2010/twentyquestions
30Copyright © 2011 University of MarylandThis material may not be reproduced or redistributed, in whole or in part, without written permission from Ross Salawitch or Tim Canty
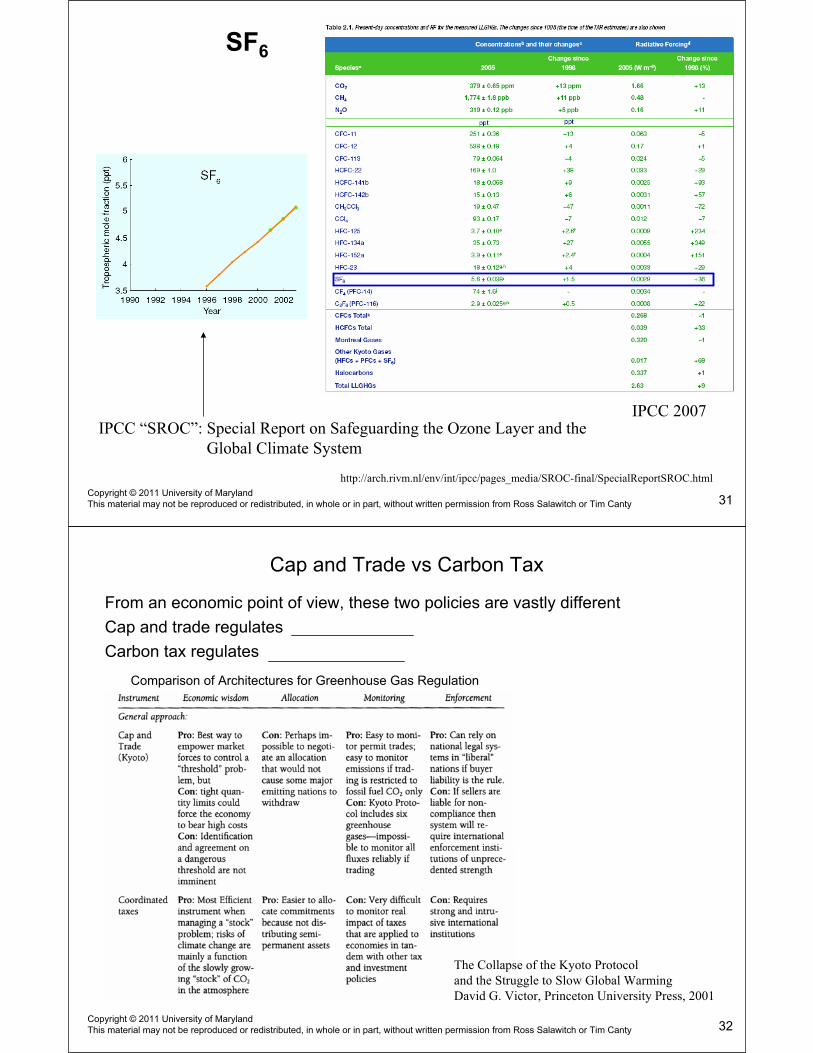
SF6
IPCC “SROC”: Special Report on Safeguarding the Ozone Layer and the
Global Climate System
IPCC 2007
http://arch.rivm.nl/env/int/ipcc/pages_media/SROC-final/SpecialReportSROC.html
31Copyright © 2011 University of MarylandThis material may not be reproduced or redistributed, in whole or in part, without written permission from Ross Salawitch or Tim Canty
Cap and Trade vs Carbon Tax
From an economic point of view, these two policies are vastly different
Cap and trade regulates amount emitted
Carbon tax regulates price of emission
Comparison of Architectures for Greenhouse Gas Regulation
The Collapse of the Kyoto Protocol
and the Struggle to Slow Global Warming
David G. Victor, Princeton University Press, 2001
32Copyright © 2011 University of MarylandThis material may not be reproduced or redistributed, in whole or in part, without written permission from Ross Salawitch or Tim Canty

Kyoto Emission Targets
Japan: 1.3 billion tons CO2, 2009
EU-15: 3.7 billion tons CO2, 2009
USA: 5.5 billion tons CO2, 2009
Kyoto Emission Targets
Figure:
The Collapse of the Kyoto Protocol and the Struggle to Slow Global Warming
David G. Victor, Princeton University Press, 2001.
Emission Data:
USA: http://www.epa.gov/climatechange/emissions/downloads11/US-GHG-Inventory-2011-Chapter-2-Trends.pdf
EU: http://www.eea.europa.eu/themes/climate/ghg-country-profiles
Japan: http://www.reuters.com/article/2010/11/09/us-climate-japan-co-idUSTRE6A82VV20101109
33Copyright © 2011 University of MarylandThis material may not be reproduced or redistributed, in whole or in part, without written permission from Ross Salawitch or Tim Canty
The EU-15 should meet its collective target of cutting greenhouse gas emissions
by 8% for the period 2008–2012.
Based on recent EEA estimates … EU-15 average emissions for 2008 and 2009(the two first years of the commitment period) were lower than target by 94 MtCO2-equivalent per year (2.2 % of base-year emissions). This over-achievement …increases to more than 253 Mt CO2-equivalent per year when two factors are takeninto account:
• governments' planned net annual acquisition of emissions units through theKyoto Protocol's flexible mechanisms to comply with their targets (2.7 % of baseyear emissions)
• expected annual carbon sequestration from LULUCF activities (1.0 % of base-year emissions)
LULUCF: land use, land-use change and forestry
http://www.eea.europa.eu/publications/progress-towards-kyoto
Info in 2.0 Mb file that is available at hot text “Tracking progress towards Kyoto and 2020
targets in Europe”
34Copyright © 2011 University of MarylandThis material may not be reproduced or redistributed, in whole or in part, without written permission from Ross Salawitch or Tim Canty
Kyoto Emission Penalties
What happens if a country fails to reach its Kyoto emissions target?
The Kyoto Protocol contains measures to assess performance and progress. It also contains some penalties. Countries that fail to meet their emissions targetsby the end of the first commitment period (2012) must make up the difference plus a penalty of 30 per cent in the second commitment period
Their ability to sell credits under emissions trading will also be suspended
http://www.cbc.ca/news/background/kyoto/
35Copyright © 2011 University of MarylandThis material may not be reproduced or redistributed, in whole or in part, without written permission from Ross Salawitch or Tim Canty
• Cancun (December 2010)
Consensus on measures to protect tropical rain forests, promote clean technologies,and help poorer nations adopt to rising sea level
No meaningful action on CO2 emissions
• Bangkok (April 2011 … last week)
Key divisions between developed and developing countries … negotiations brought toa standstill over this division
EU: pushing for second Kyoto commitment period, beyond 2012
U.S., Japan, Russia, Canada: opposed to second Kyoto commitment period
Sources: http://www.progressives.org.uk/articles/article.asp?a=7957 &
http://www.vancouversun.com/business/Governments+face+climate+test+resolve+Bangkok/4541975/story.html
• Washington DC (April 2011 … last week … related to Continuing Resolution)
“U.S. EPA efforts to protect public health by enforcing clean air and water rules will beundermined by a planned 16 percent budget reduction, environmental groups said”
“Republicans argued for a larger cut plus provisions that would bar the EPA from enforcing
rules on reducing carbon dioxide from power plants and factories”
http://www.bloomberg.com/news/2011-04-12/epa-budget-cut-will-restrict-enforcement-of-clean-air-rules-activists-say.html
• Next round of talks: Bonn, Germany, June 2011
Climate News
36Copyright © 2011 University of MarylandThis material may not be reproduced or redistributed, in whole or in part, without written permission from Ross Salawitch or Tim Canty

Regional Greenhouse Gas Initiative “RGGI”
http://www.rggi.org/home
• RGGI caps CO2 emissions from region’s fossil fuel power plants (> 25 Mega Watt)
– Regional CO2 emissions held constant from 2009 through 2014– Beginning 2014 regional CO2 emissions decrease for a total
reduction of 10% by 2018– All fossil fuel fired facilities must own allowances equal to their
annual CO2 emissions
• 10 States are part of RGGI– Each state has an emissions cap
– Regional market for CO2 emission allowances
• Maryland joined on 20 April 2007– Bill passed in Annapolis
– Participation governed by Md Dept of the Environment (MDE)
• Eleven auctions have been held; 3 more scheduledthis year
Auction info: http://www.rggi.org/market/co2_auctions/results
– $162.5 million has been generated for Md
1,225,830VT
State Emissions Cap
(Tons CO2)
CT 10,695,036
DE 7,559,787
MA 26,660,204
ME 5,948,902
NH 8,620,460
NJ 22,892,730
NY 64,310,805
RI 2,659,239
MD 37,505,984
TOTAL 188,078,977
37Copyright © 2011 University of MarylandThis material may not be reproduced or redistributed, in whole or in part, without written permission from Ross Salawitch or Tim Canty
Revenue as of March 2011Millions of $
%(Original %)
Allocation
38.246
(17.5)Energy efficiency projects
84.250
(17)Low income electricity assistance
43.523
(23)General Rebates
13.96.5
(10.5)Clean energy, education, & climate programs
6.03.0
(3.5)Administration
162.5 100.0 Maryland Total: $ 162.5 million
Maryland RGGI Revenue and Allocation
http://www.env-ne.org/public/resources/pdf/ENE_Auction_Tracker_110317.pdf
38Copyright © 2011 University of MarylandThis material may not be reproduced or redistributed, in whole or in part, without written permission from Ross Salawitch or Tim Canty

Carbon Capture & Sequestration
MEA-monoethanolamine (CH2CH2OH)NH2 in an aqueous solution will absorb CO2 to form ethanolammonium carbamate.
2RNH2 + CO2 + H2O (RNH3)2CO2
MEA is a weak base so it will re-release the CO2 when heated
Kintisch, Science, 2007
39Copyright © 2011 University of MarylandThis material may not be reproduced or redistributed, in whole or in part, without written permission from Ross Salawitch or Tim Canty
Where to Place the Sequestered Carbon?
Herzog et al., Scientific American, 2000
40Copyright © 2011 University of MarylandThis material may not be reproduced or redistributed, in whole or in part, without written permission from Ross Salawitch or Tim Canty

Carbon Sequestration in Action:
Sleipner, Norway
• Captures ~90% of CO2 that is generated
• CO2 pumped into 200 m thick sandstonelayer 720 m below sea floor
• Project initiated in response to $50 ton taxon CO2 emissions instituted by NorwegianGovernment in 1996
• Investment in capital cost paid off in aboutone and a half years !
National Geographic, June 2008
41Copyright © 2011 University of MarylandThis material may not be reproduced or redistributed, in whole or in part, without written permission from Ross Salawitch or Tim Canty
CO2 Capture and Storage (CCS) Costs:
50−100 US$/tCO2 net mineralizedMineral carbonation
5−30 US$/tCO2 injectedOcean storage
0.5−8 US$/tCO2 injectedGeological storage
1−8 US$/tCO2
transported per 250kmTransportation
25−115 US$/tCO2 net capturedCapture from other industrial
sources
5−55 US$/tCO2 net capturedCapture from gas processing or
ammonia production
15−75 US$/tCO2
net capturedCapture from a power plant
Cost rangeCCS component
http://www.ipcc.ch/pdf/presentations/briefing-montreal-2005-11/presentation-special-report-co2.ppt
INTERGOVERNMENTAL PANEL ON CLIMATE CHANGE (IPCC)INTERGOVERNMENTAL PANEL ON CLIMATE CHANGE (IPCC)
Carbon Dioxide Capture and Storage
42Copyright © 2011 University of MarylandThis material may not be reproduced or redistributed, in whole or in part, without written permission from Ross Salawitch or Tim Canty


![Kyoto Protocol Durban Preparation[1]](https://img.pdfslide.us/doc/110x75/577d24821a28ab4e1e9c9bda/kyoto-protocol-durban-preparation1.jpg)