Embed Size (px)
Citation preview

THE KNOWLEDGE, ATTITUDE AND ORAL HEALTH BEHAVIOR OF
ADULTS ATTENDING BIR HOSPITAL DENTAL DEPARTMENT
Research Report
Submitted to
Nepal Health Research Council
Submitted by:
Dr. Madhurima Bhadra, BDS
Submission Date:
31 December 2003

THE KNOWLEDGE, ATTITUDE AND ORAL HEALTH BEHAVIOR OF
ADULTS ATTENDING BIR HOSPITAL DENTAL DEPARTMENT
EXECUTIVE SUMMARY
1. The objective of the survey was to study the knowledge, attitude and oral
health behavior of adult patients who come to Bir Hospital Dental Department
for treatment in order to find out if there is any association of education to
their knowledge, attitude and oral health behavior, so that recommendations
can be made to oral health promoters, professionals, policy makers and
stakeholders.
2. The study was carried out in adults who came to Bir Hospital Dental
Department, Kathmandu, Nepal. The population studied was the adults who
came for treatment. The sample identified was the first 10 males and females
(five each) who came to the dental department. Purposive sampling was used
along with the quantitative method of research. Data was collected for a
period of 30 working days by two enumerators who filled out a questionnaire
while interviewing the adults.
3. The limitations of this survey would be that Bir Hospital is not representative
of the country or Kathmandu in terms of ethnic, economic and geographic
distribution.
4. Data analysis was done using the SPSS package, where simple descriptive
frequency statistics were used to describe the sample. To analyze the
association of education to knowledge, attitude and behavior and the
association of sex to consumption behavior cross-tabulation statistic was used.
A Chi-square test was used to test the significance.
5. People mostly visit the hospital only if they have tooth ache. Most people are
happy with the state of their teeth despite high incidence of toothache. People
are unaware of what advice the dentist would give them no matter what their
educational level is.

6. Cleaning of the teeth with a toothbrush is common but there is a lack in
awareness about fluoridated toothpastes. The current consumption of sugar
containing foods was not very high but, their childhood sugar consumption
also needs to be taken into consideration.
7. Majority of the respondents have reported not to use harmful substances like
tobacco, areca nut and alcohol. There was no significant association between
education and frequency of consumption of these products but a significant
association was seen between the sex of the respondent and their consumption
habits with males having higher frequency of consumption.
8. There was a general consensus that it is not necessary to visit a dentist unless
there is a major problem. No significant association was seen between the
respondents’ educational levels and their knowledge, attitude and oral health
behavior.
9. For a more holistic research, the survey should be augmented by a clinical
examination of the oral cavity and observation of the patients’ habits.
10. Rigorous effort has to be made in the direction of oral health education for the
general public and special target groups as well. Active campaigning and a
strong advocacy are called for against the effects of tobacco containing
products and their promotion and unrestricted marketing.

TABLE OF CONTENTS PAGE
1. CHAPTER I Introduction 1
Statement of the problem 1
Objectives 2
Rationale/Justification 2
2. CHAPTER II Literature Review 4
3. CHAPTER III Methodology 6
Selection of the sample 6
Collection of data 6
Instruments/tools for data collection 6
Limitations of the study 6
Use of statistics for data analysis 7
4. CHAPTER IV Results/Findings
4.1 Description of the sample 8
4.2 General findings 9
4.3 Findings about the association of education
level with knowledge, attitude and oral
oral health behavior 24
4.4 Findings about the association of gender
and habits 25
5. CHAPTER V Conclusions and Recommendations 26
Conclusions 26
Recommendations 27
REFERENCES 29
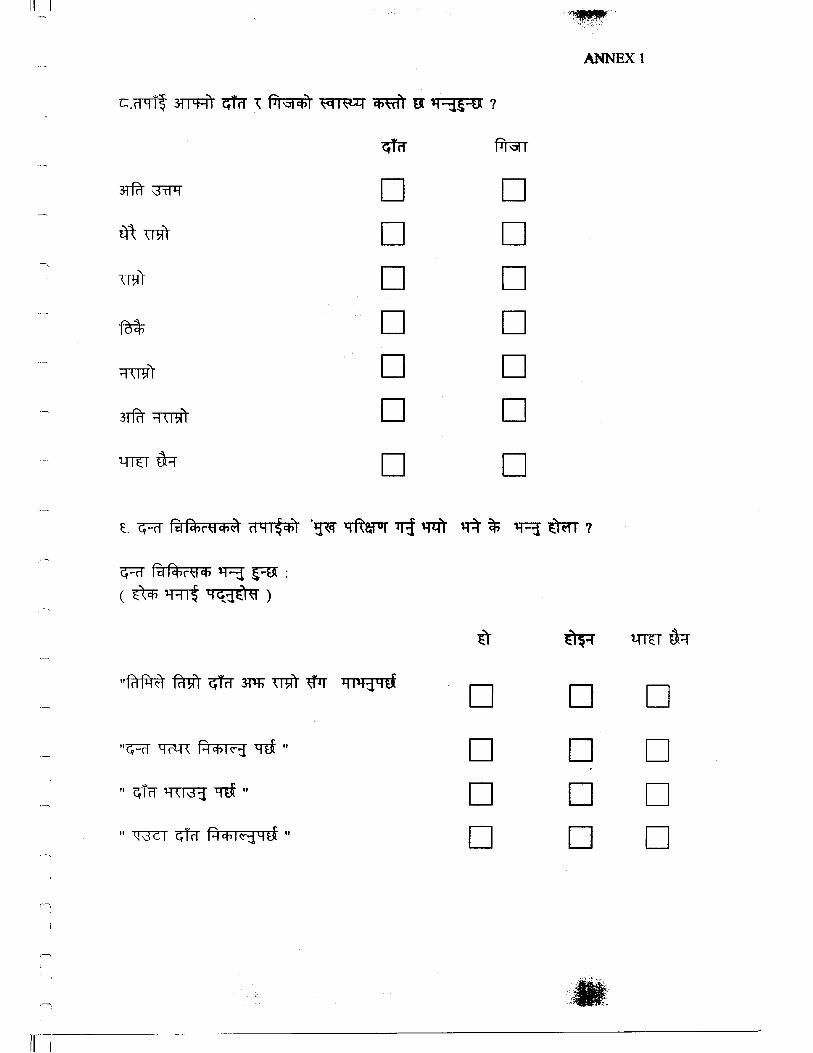
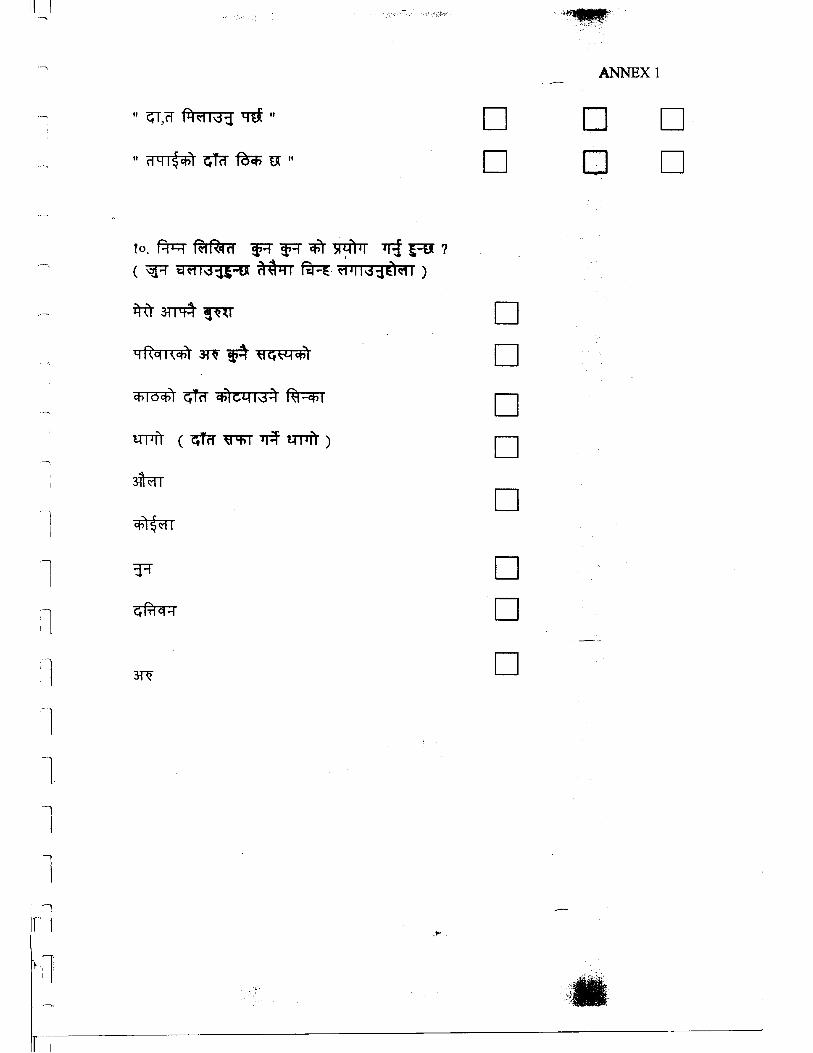
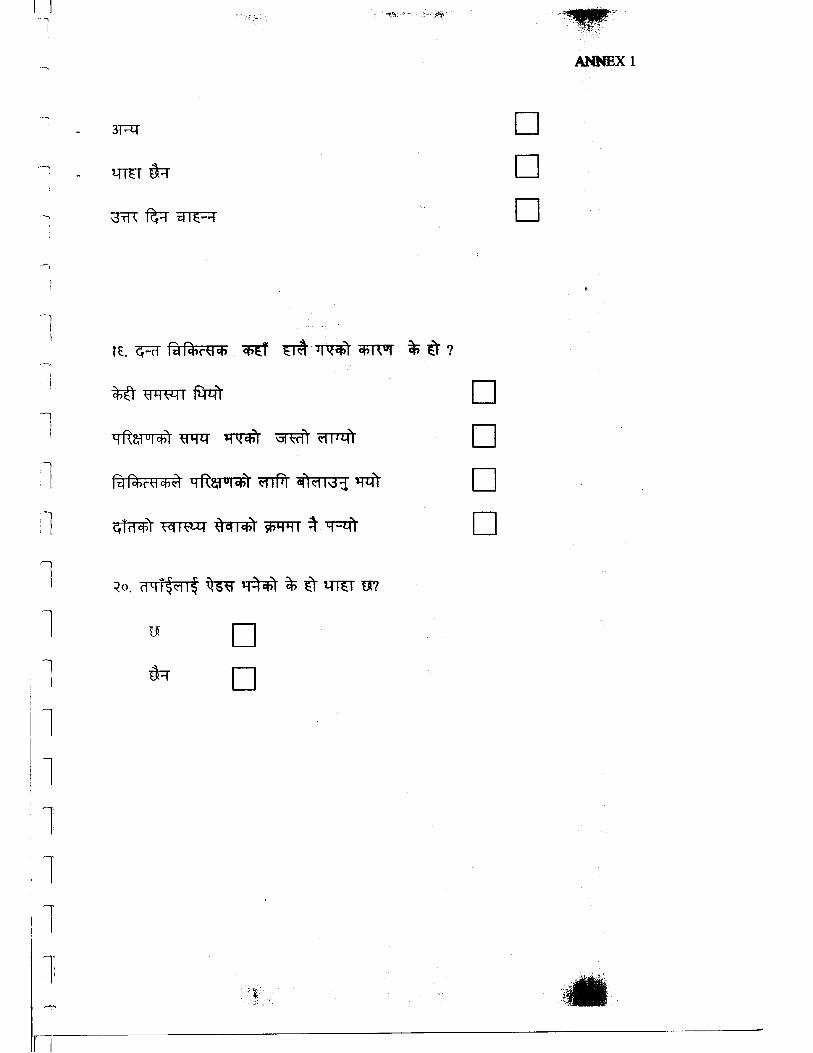
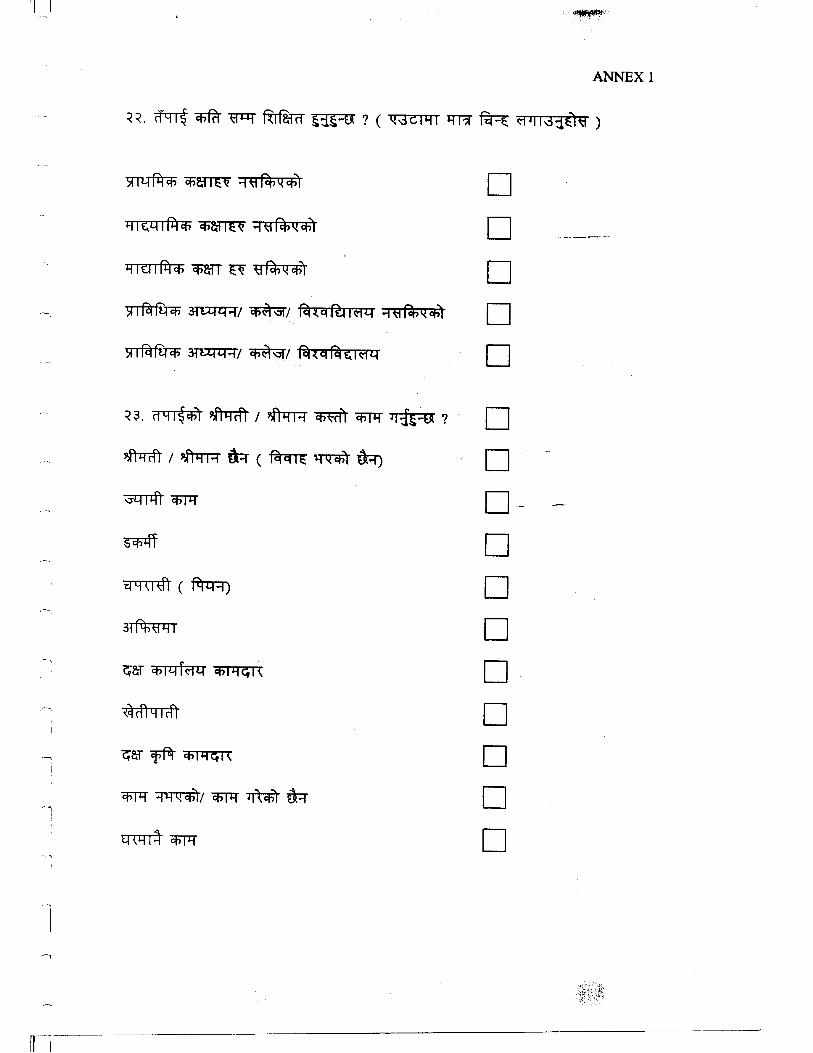
ANNEX 1 Questionnaire
ANNEX 2 Cross tabulation tables of education and other
variables
THE KNOWLEDGE, ATTITUDE AND ORAL HEALTH BEHAVIOR OF
ADULTS ATTENDING BIR HOSPITAL DENTAL DEPARTMENT
CHAPTER I INTRODUCTION
Oral disease is the most prevalent disease in the world. Nepal is no exception. Oral health
has been recognized as an integral part of general human health especially since studies
have revealed that lot of diseases manifest in the mouth.
As one of the prominent dentists Federation Dentaire Internationale (FDI) President Dato
Dr.A.Ratnanesan says,
"There exists a documented link between oral health and diabetes and cardio
vascular disease. Since prevention is the base of controlling disease, education
materials should be developed by incorporating the importance of oral health
preferably from the primary level." (The Himalayan Times, 16 February 2003).
The current literacy level in Nepal is 65.1% in males and 42.5% in females. Only 39.3%
of males and 45.9% females have Primary School level education. With such statistics it
is clear that it is necessary to concentrate on educating the populace by either formal or
informal channels. Awareness depends on access to knowledge, which influences one's
attitude that in turn shapes the behavior of an individual.
After centuries of isolation from the outside world the rapid urban growth in Nepal is
changing the people from hill farmers to low land dwellers employed in the emerging
industries. Such change has both drawbacks and benefits on health. Oral health is also
impacted but this is yet to be quantified in Nepal where data is scarce.
Statement of the Problem
1

What level of awareness do the Nepalese have about causes of Oral disease? Do patients
who seek treatment for oral disease have the knowledge about what causes their teeth to
get cavities? What causes their gums to bleed? Or why they suffer from non-healing
ulcerations in their mouths?
Dental caries is a disease wherein the tooth structure is destroyed by acids produced by
bacteria, which feed on refined carbohydrates, and sugars stagnated in the mouth. Too
much destruction of tooth causes loss of tooth that in turn will affect the masticatory
efficiency of the person. Tooth loss is also caused by periodontal disease, which is caused
by bacteria lodged in calculus that deposits around the gingival margins of the teeth. Loss
of teeth can lead to temporomandibular disorders and trauma from occlusion in adults
while the loss of primary teeth prematurely causes malocclusion of permanent teeth.
Often when teeth are missing there is danger of cheek bite and trauma to other oral
structures. When trauma becomes chronic it can lead to oral cancer. The main cause of
oral cancer is the use of tobacco and its products, areca nut and alcohol consumption. Are
people in general aware about the oral diseases or the causes of oral diseases? What
factors contribute to peoples’ awareness or lack of it which influence their behavior and
the oral health status?
Objectives
The objectives of the study are as follows:
General Objective
To assess the knowledge, attitude and oral health behavior of adult patients
attending the Bir Hospital Dental Department.
Specific Objectives
1. To examine the association of education to knowledge, attitude and oral health
behavior.
2. To make recommendations to the dentists, policy makers and other
stakeholders.
Rationale/Justification
2

Nepal is one of the world's least urbanized countries (Sharma, 1989). However, in one
generation (by 2011) Nepal may be transformed from a society with a miniscule urban
population to one in which more than a third of its people live in urban areas (Goldstein,
1993). Currently 86% of Nepalese live in rural areas where lack of accessibility to
education is a big problem and media reach is also very low. But, the urbanization that is
taking place is causing the rural immigrants to adopt a 'modern society' behavior and
change their dietary habits. There is disappearance of traditional foods and an increase in
sugar consumption and refined foods. There is easy availability of tobacco products and
alcohol as well as the traditional use of areca nut but little knowledge about their
harmfulness. So, this research will assess peoples’ awareness levels affecting their food
habits leading to oral health problems. Based on these findings awareness campaigns can
be formulated. This will help in making of oral health policies regarding policy analysis
in preventive and curative dentistry and in creating awareness through oral health
education. The benefits would be enormous as once preventive measures are adopted
there will be a reduction in the cost for curative dentistry which is beyond the financial
capabilities of a developing nation like Nepal. In order to prevent a disease there should
be awareness of the causes of the disease and also from where to get the treatment and
from whom to get the treatment.
3

CHAPTER II LITERATURE REVIEW
A nation's economy is commonly a yardstick of a nation's health. Nepal is one of the least
developed countries in the world. However, in one generation Nepal is leaping from a
country with a miniscule urban population to one in which more than a third of its people
will be living in urban areas by 2011(Goldstein 1993).
Urban growth is occurring via reduction in the crude infant and child mortality;
reclassification of areas from rural to urban; migration from hills to lowlands; migration
from rural hills to rural terai and 'GATEWAY' model of urban development where there
is establishment of settlements along the trading posts of Indo-Nepal border. Dental
health is commonly adversely affected by urbanization with gradual replacement of
traditional foods by processed and sugared alternatives leading to increase in caries.
Lennon and Olojuba (1986) suggest that urbanization has lead to increase in dental caries
on account of a decrease in available farmland, increase in food processing factories and
easier distribution of cariogenic food stuff. Periodontal disease is similar but often worse
in rural and lower socio-economic urban groups because of poorer oral hygiene
procedures and malnutrition. Oral cancer is the 6th most common cancer that occurs. In
Nepal the incidence ranges from 29.69-36.32% of all the cancers and it seems to be
growing especially in the younger populace.
The Himalayan Times of Feb16th 2003 quotes Dr. A. Ratnanesan as having said "Lack of
awareness and appreciation of its importance and financial constraints, have given oral
health a low priority in developing countries. A primary health care approach must be
considered and adapted to meet the community needs and demands to commensurate
with the availability of resources."
In a study of the oral health profile of school children, mothers and school teachers in
Zanzibar done to analyze oral health status and practices to assess oral health knowledge,
attitudes and practices of mothers and knowledge of teachers, it was concluded that
training in oral health topics is needed for school teachers to provide for school-based
4

health education of children. The interview method was chosen for the mothers and
structured questionnaires were made for the children and teachers. Caries examination
was done in daylight. The study indicated that the need for health education showed that
mothers could be reached through several formal or informal channels of communication.
Another way to improve oral health practices would be to give accurate information to
the parents.
In China a study was conducted to evaluate the changes of oral health knowledge and
behavior among Wuhan citizens after six years of 'Love Tooth Day' (LTD) campaigns
(1987-95) the findings showed significantly higher improvements in oral health
knowledge and tooth brushing behavior. The interview method was used to collect the
data as many people were not familiar with questionnaire surveys. The study concludes
that positive changes in oral health related attitudes and practices were observed. This
development was attributed to a multitude of factors among which the health education
campaign LTD may be one part.
5

CHAPTER III METHODOLOGY
The study of "The Knowledge, Attitude and Oral Health behavior of Adults attending the
Bir Hospital Dental Department" was held in the Bir Hospital Dental Department,
Kathmandu, Nepal, in September-October 2003.
Selection of Sample
The population studied was the adults who came for curative and restorative treatment to
Bir Hospital Dental Department. The sample was identified as the first five adult female
and first five adult male totaling ten adults a day, who came to visit the department. The
technique used for sample selection was Purposive sampling. The quantitative method of
research was used for this survey wherein the inclusion criterion was that the respondent
had to be an adult i.e. 18years of age.
Collection of Data
Data was collected in September-October 2003 for 30 working days. Two enumerators
were hired to collect the data for 30 working days.
Instrument/Tool for Data Collection
The data collection was done by a questionnaire (see ANNEX 1).
Limitations of the Study
1. There are certain limitations of the study, one being that Bir Hospital is not
representative of the entire country or Kathmandu in terms of caste, economic
background or geographical distribution of the population.
2. The study is only representative of those patients who attended Bir Hospital Dental
Department during the month of September-October 2003.
6

Use of Statistics for Data Analysis
1. In order to describe the sample and to analyze the knowledge, attitude and oral health
behavior of the respondents, simple descriptive and frequency statistics were used.
2. To analyze the relation of education to the knowledge, attitude and oral health
behavior, cross-tabulation statistic was used.
3. To analyze the relation of sex of the respondents to their consumption behavior, cross-
tabulation statistic was used.
4. In order to perform the test of significance Chi-square tests were done.
7

CHAPTER IV RESULTS/ FINDINGS
4.1 Description of the Sample
Sex of the respondent
Frequency Percent Valid Percent Cumulative Percent
male 140 49.6 49.6 49.6
female 142 50.4 50.4 100.0
Total 282 100.0 100.0
Out of 282 respondents 50.4% were women and 49.6% were men. So the respondents
consisted of almost equal sex proportion.
Age of the respondent
N Minimum Maximum Mean Std. Deviation
Age of the respondent 281 18 82 35.00 13.90
As the study is of adult population the minimum age sampled is 18 years of age. The
maximum age of the respondents was 82 years and the mean age was 35 years.
Address of respondent
Frequency Valid Percent Cumulative Percent
City/town 177 63.2 63.2
Outskirts of town 53 18.9 82.1
Village 50 17.9 100.0
Total 280 100.0
Out of the 280 who responded about their address of residence, majority (63%) resided in
the city or town. Nineteen percent commuted to the hospital from the outskirts of town
and 18% came from villages.
Caste of the respondents
Frequency Valid Percent Cumulative Percent
Brahmin 91 33.8 33.8
Chhetri 62 23.0 56.9
Newar 65 24.2 81.0
Gurung 6 2.2 83.3
Rai 5 1.9 85.1
Magar 6 2.2 87.4
Limbu 1 .4 87.7
Others 33 12.3 100.0
Total 269 100.0
Only 269 respondents volunteered their caste, out of which a majority (57%) belonged to
the Bhramin/Chhetri caste. They belong to the so called Upper caste group. Only about a
fourth (24%) belonged to the Newar community, who are the majority of residents in the
8
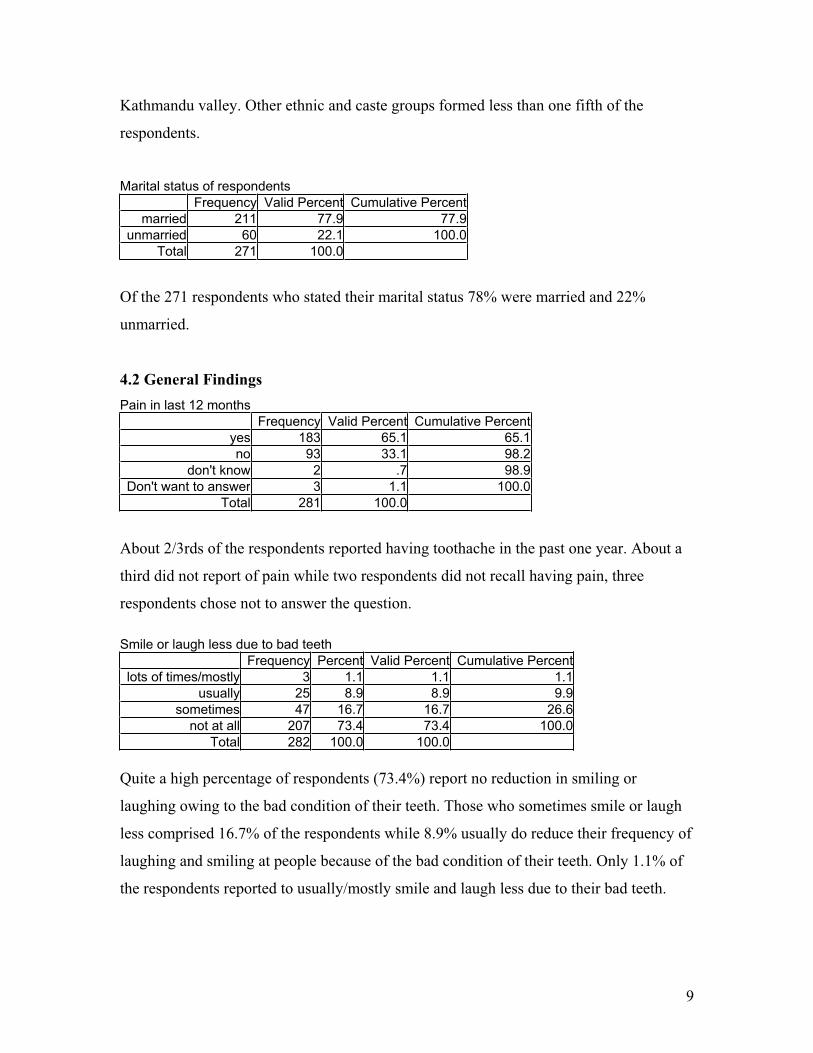
Kathmandu valley. Other ethnic and caste groups formed less than one fifth of the
respondents.
Marital status of respondents
Frequency Valid Percent Cumulative Percent
married 211 77.9 77.9
unmarried 60 22.1 100.0
Total 271 100.0
Of the 271 respondents who stated their marital status 78% were married and 22%
unmarried.
4.2 General Findings
Pain in last 12 months
Frequency Valid Percent Cumulative Percent
yes 183 65.1 65.1
no 93 33.1 98.2
don't know 2 .7 98.9
Don't want to answer 3 1.1 100.0
Total 281 100.0
About 2/3rds of the respondents reported having toothache in the past one year. About a
third did not report of pain while two respondents did not recall having pain, three
respondents chose not to answer the question.
Smile or laugh less due to bad teeth
Frequency Percent Valid Percent Cumulative Percent
lots of times/mostly 3 1.1 1.1 1.1
usually 25 8.9 8.9 9.9
sometimes 47 16.7 16.7 26.6
not at all 207 73.4 73.4 100.0
Total 282 100.0 100.0
Quite a high percentage of respondents (73.4%) report no reduction in smiling or
laughing owing to the bad condition of their teeth. Those who sometimes smile or laugh
less comprised 16.7% of the respondents while 8.9% usually do reduce their frequency of
laughing and smiling at people because of the bad condition of their teeth. Only 1.1% of
the respondents reported to usually/mostly smile and laugh less due to their bad teeth.
9

Less talk due to bad teeth or bad breath
Frequency Percent Valid Percent Cumulative Percent
lots of times/mostly 6 2.1 2.1 2.1
usually 30 10.6 10.6 12.8
sometimes 54 19.1 19.1 31.9
not at all 192 68.1 68.1 100.0
Total 282 100.0 100.0
Even when it came to reducing their talking to others due to bad teeth or bad breath,
majority (68.1%) reported no change, followed by 19% who sometimes talk less with
others due to bad breath. A very less percent of about 11% reported to usually talking less
with others if they thought they had bad breath and only 2% said they talked less with
others mostly when they had bad breath.
Can you chew apple or roti
Frequency Percent Valid Percent Cumulative Percent
yes 194 68.8 68.8 68.8
no 88 31.2 31.2 100.0
Total 282 100.0 100.0
More than 2/3rds of the respondents said that they can chew roti and apples and the
remaining 1/3rd reported not being able to chew these foods.
Happy with the state of their teeth
Frequency Percent Valid Percent Cumulative Percent
very happy 27 9.6 9.6 9.6
happy 189 67.0 67.0 76.6
Others say they are good 4 1.4 1.4 78.0
not very happy 43 15.2 15.2 93.3
not happy 19 6.7 6.7 100.0
Total 282 100.0 100.0
Most of the respondents (67%) report to being happy with the state of their teeth despite
the high percentage (65%) of toothache in the past one year being reported. About 15%
are not very happy with the state of their teeth and about 10% are very happy with their
teeth. Approximately 7% of the respondents are not happy with their teeth and 1.4% says
that others think their teeth are good.
10

Respondent's feeling on the health of their teeth
Frequency Percent Valid Percent Cumulative Percent
excellent 2 .7 .7 .7
very good 8 2.8 2.8 3.5
good 49 17.4 17.4 20.9
okay 113 40.1 40.1 61.0
bad 92 32.6 32.6 93.6
very bad 15 5.3 5.3 98.9
don't know 3 1.1 1.1 100.0
Total 282 100.0 100.0
Of the 282 respondents 113 (40%) feel the health of their teeth is okay, while a third say
the health of their teeth is bad and 5% think the health of their teeth is very bad.
Seventeen percent feel their teeth are of good health. Of the respondents three don't know
what the health of their teeth is and only 2 feel they have excellently healthy teeth.
Respondent's feelings on the health of their gums
Frequency Valid Percent Cumulative Percent
excellent 3 1.1 1.1
very good 8 2.8 3.9
good 76 27.0 31.0
okay 133 47.3 78.3
bad 50 17.8 96.1
Very bad 8 2.8 98.9
don't know 3 1.1 100.0
Total 281 100.0
Of the 281 respondents who answered the question about the health of their gums almost
half i.e. 47% think their gums are in an okay state of health. Twenty seven percent feel
their gums are in good health while about 18% report to having bad gums. Each of the
categories of very bad and very good represent about 3% each of the respondent's
feelings on the health of their gums. One percent of the respondents felt their gums were
in excellent condition and another 1% don't know how healthy their gums are.
11
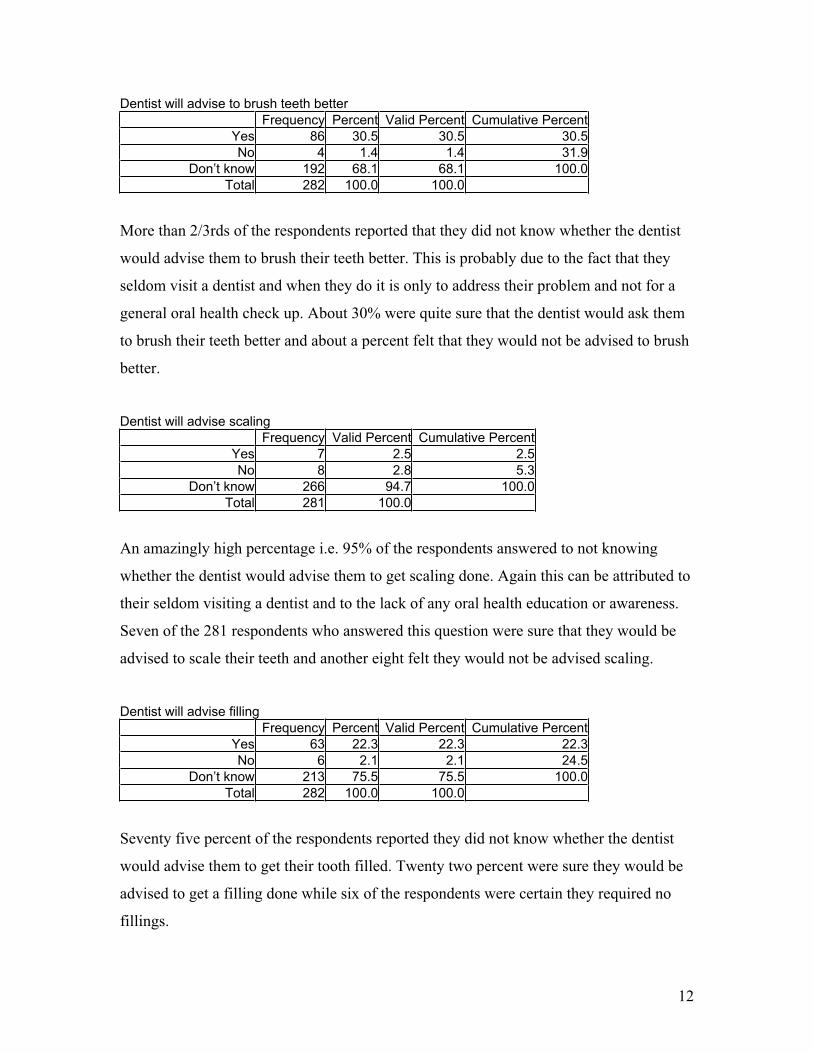
Dentist will advise to brush teeth better
Frequency Percent Valid Percent Cumulative Percent
Yes 86 30.5 30.5 30.5
No 4 1.4 1.4 31.9
Don’t know 192 68.1 68.1 100.0
Total 282 100.0 100.0
More than 2/3rds of the respondents reported that they did not know whether the dentist
would advise them to brush their teeth better. This is probably due to the fact that they
seldom visit a dentist and when they do it is only to address their problem and not for a
general oral health check up. About 30% were quite sure that the dentist would ask them
to brush their teeth better and about a percent felt that they would not be advised to brush
better.
Dentist will advise scaling
Frequency Valid Percent Cumulative Percent
Yes 7 2.5 2.5
No 8 2.8 5.3
Don’t know 266 94.7 100.0
Total 281 100.0
An amazingly high percentage i.e. 95% of the respondents answered to not knowing
whether the dentist would advise them to get scaling done. Again this can be attributed to
their seldom visiting a dentist and to the lack of any oral health education or awareness.
Seven of the 281 respondents who answered this question were sure that they would be
advised to scale their teeth and another eight felt they would not be advised scaling.
Dentist will advise filling
Frequency Percent Valid Percent Cumulative Percent
Yes 63 22.3 22.3 22.3
No 6 2.1 2.1 24.5
Don’t know 213 75.5 75.5 100.0
Total 282 100.0 100.0
Seventy five percent of the respondents reported they did not know whether the dentist
would advise them to get their tooth filled. Twenty two percent were sure they would be
advised to get a filling done while six of the respondents were certain they required no
fillings.
12

Dentist will advise extraction of teeth
Frequency Percent Valid Percent Cumulative Percent
Yes 114 40.4 40.4 40.4
No 9 3.2 3.2 43.6
Don’t know 159 56.4 56.4 100.0
Total 282 100.0 100.0
Out of the 282 respondents about 40% of the respondents think that the dentist will
advise them to extract their teeth while 56% don't know whether their dentist will advise
extraction and about 3% feel that they will not be advised extraction.
Dentist will advise orthodontic treatment
Frequency Percent Valid Percent Cumulative Percent
Yes 13 4.6 4.6 4.6
No 15 5.3 5.3 9.9
Don’t know 254 90.1 90.1 100.0
Total 282 100.0 100.0
There was a very high percent of respondents i.e. 90% who report to not knowing
whether they will be advised orthodontic treatment by the dentist. About 5% think they
will be advised to get orthodontic treatment done and another 5% think that the dentist
will not advise orthodontic treatment to them. The high percentage of don't knows can
probably be attributed to the scarcity of information about various dental treatments that
are available.
Dentist will say teeth are fine
Frequency Percent Valid Percent Cumulative Percent
Yes 32 11.3 11.3 11.3
No 5 1.8 1.8 13.1
Don’t know 245 86.9 86.9 100.0
Total 282 100.0 100.0
Eighty seven percent of the respondents do not know whether the dentist will tell them
their teeth are fine while 11% feel they will be told they have fine teeth and about 2%
report that they will not be told their teeth are fine.
13

Teeth cleaning device used
Frequency Percent Valid Percent Cumulative Percent
own brush 243 86.2 86.2 86.2
tooth pick 1 .4 .4 86.5
fingers 1 .4 .4 86.9
coal 2 .7 .7 87.6
salt 2 .7 .7 88.3
daatiwan 1 .4 .4 88.7
more than 2 26 9.2 9.2 97.9
More than3 6 2.1 2.1 100.0
Total 282 100.0 100.0
The majority of the respondents (86%) use their own brushes to brush their teeth. One
person reported using a toothpick and another used fingers to clean their teeth. Two use
coal to clean their teeth and another two use salt. Daatiwan was used by one person for
cleaning. About 9% use more than two devices to clean their teeth and 2% use more than
three of the above listed devices in tooth cleaning.
Frequency of tooth cleaning
Frequency Percent Valid Percent Cumulative Percent
never 3 1.1 1.1 1.1
1/month 1 .4 .4 1.4
2-3/month 6 2.1 2.1 3.5
1/week 1 .4 .4 3.9
2-3/week 5 1.8 1.8 5.7
1/day 142 50.4 50.4 56.0
2 or more/day 124 44.0 44.0 100.0
Total 282 100.0 100.0
The reported frequency for brushing once a day was 50% and 44% reported to brushing
twice or more a day. Six respondents said that they brush 2-3 times a month and five
persons brush 2-3 times a week. One person had never brushed before and another
reported to brushing once a week.
14

Use of fluoridated toothpaste
Frequency Valid Percent Cumulative Percent
yes 38 13.9 13.9
no 8 2.9 16.8
Don't know 222 81.3 98.2
don't use toothpaste 5 1.8 100.0
Total 273 100.0
Out of the 273 who responded to the question about which tooth paste they use 81% don't
know if the paste has fluoride in it. Only about 14% know if they use fluoridated
toothpaste and three percent say there is no fluoride in the toothpaste they use. Five
people reported to not use toothpaste at all.
Type of toothpaste used
Frequency Percent Valid Percent Cumulative Percent
colgate 71 25.2 25.6 25.6
pepsodent 49 17.4 17.7 43.3
close-up 54 19.1 19.5 62.8
dabur lal 47 16.7 17.0 79.8
brighter 11 3.9 4.0 83.8
anchor 1 .4 .4 84.1
cibaka 2 .7 .7 84.8
flura 1 .4 .4 85.2
everest 3 1.1 1.1 86.3
others 38 13.5 13.7 100.0
Total 277 98.2 100.0
The most popular brand of toothpaste was reported to be colgate with a little more than
25% followed by close up which is closely followed by dabur lal and pepsodent.
Having any false teeth
Frequency Percent Valid Percent Cumulative Percent
yes 22 7.8 9.6 9.6
no 206 73.0 90.4 100.0
Total 228 80.9 100.0
Out of the 228 who answered the question of having false teeth about 10% had false
teeth.
15

Frequency of eating fresh fruits
Frequency Percent Valid Percent Cumulative Percent
many times a day 2 .7 .7 .7
daily 55 19.5 19.5 20.2
2-3/week 100 35.5 35.5 55.7
1/week 19 6.7 6.7 62.4
2-3/month 90 31.9 31.9 94.3
don't take 16 5.7 5.7 100.0
Total 282 100.0 100.0
Only two of the 282 respondents reported to eating fresh fruit many times a day. Highest
percentage (36%) reported of eating fresh fruit was 2-3 times a week i.e. 36% closely
followed by 2-3 times a month contributing to 32%. About 20% consume fresh fruit daily
and 6% don't take fresh fruit at all.
Frequency of eating biscuits
Frequency Percent Valid Percent Cumulative Percent
many times a day 4 1.4 1.4 1.4
daily 53 18.8 18.8 20.2
2-3/week 28 9.9 9.9 30.1
1/week 10 3.5 3.5 33.7
2-3/month 103 36.5 36.5 70.2
don't take 84 29.8 29.8 100.0
Total 282 100.0 100.0
Biscuits were reported to be consumed 2-3 times a month by 37% while another 30% do
not take biscuits at all. About 19% of the respondents reported daily intake of biscuits.
Ten percent take biscuits 2-3 times a week and 4% eat biscuits at least once a week with
daily intake by only 1% of the respondents.
16

Frequency of drinking soda
Frequency Percent Valid Percent Cumulative Percent
many times a day 2 .7 .7 .7
daily 26 9.2 9.2 9.9
2-3/week 43 15.2 15.2 25.2
1/week 16 5.7 5.7 30.9
2-3/month 112 39.7 39.7 70.6
Don't take 83 29.4 29.4 100.0
Total 282 100.0 100.0
The frequency of drinking sodas was not very high with only two of the respondents
consuming sodas more than one time a day and only 9% having it daily. The highest
percentage of respondents report to having sodas 2-3 times a month and 29% say they
don't take sodas at all. Fifteen percent take sodas at least 2-3 times a week, with 6%
having sodas at least once a week.
Frequency of drinking juice with sugar
Frequency Valid Percent Cumulative Percent
many times a day 4 1.4 1.4
daily 8 2.9 4.3
2-3/week 28 10.0 14.3
1/week 6 2.2 16.5
2-3/month 77 27.6 44.1
don't take 156 55.9 100.0
Total 279 100.0
Drinking juice with sugar added to it is not common in the patients attending Bir Hospital
Dental Department, 56% claim to not take juice with sugar at all. Of those who do take
juice with sugar the highest frequency of consumption was reported to be 2-3 times a
month representing 28% of the respondents. About 10% of the respondents report to
taking juice with sugar 2-3 times a week, with daily consumption by 3% and a mere 1%
having it many times daily.
Frequency of having chewing gum
Frequency Valid Percent Cumulative Percent
many times a day 3 1.1 1.1
daily 15 5.4 6.5
2-3/week 13 4.7 11.1
1/week 3 1.1 12.2
2-3/month 68 24.4 36.6
don't take 177 63.4 100.0
Total 279 100.0
17

Of the 279 who answered to the frequency of having chewing gum, the majority i.e. two
thirds do not take chewing gum at all. The highest frequency of consumption is 2-3 times
a month represented by 24%. The other frequencies being represented by 1% who take it
many times a day and also one time a week. About 5% have chewing gum daily and
another 5% 2-3 times a week.
Frequency of having mithai and chocolates
Frequency Valid Percent Cumulative Percent
many times a day 5 1.8 1.8
daily 11 3.9 5.7
2-3/week 17 6.0 11.7
1/week 5 1.8 13.5
2-3/month 77 27.4 40.9
don't take 166 59.1 100.0
Total 281 100.0
When it comes to the consumption of mithai and chocolates like the other sweet foods the
percentage of people who don't take it are the majority represented by 59%. Those who
consume it many times a day are a mere 2%. Another 2% have mithai and chocolates
only once a week. Of those who do take sweets the highest frequency of consumption
(27%) seems to be 2-3 times a month while six percent report having them 2-3 times a
week.
Frequency of drinking coffee with sugar
Frequency Valid Percent Cumulative Percent
many times a day 1 .4 .4
daily 29 11.2 11.6
2-3/week 4 1.5 13.1
1/week 3 1.2 14.3
2-3/month 54 20.8 35.1
don't take 168 64.9 100.0
Total 259 100.0
Coffee is not a very popular drink with only 35% actually having it. Of the 259
respondents who answered the question 21% take coffee at least 2-3 times a month and
11% have it daily. Only one of the respondents had coffee many times a day. One and
two percent of the respondents have coffee once a week and 2-3 times a week
respectively.
18

Frequency of drinking tea with sugar
Frequency Valid Percent Cumulative Percent
many times a day 61 21.8 21.8
daily 157 56.1 77.9
2-3/week 9 3.2 81.1
1/week 1 .4 81.4
2-3/month 18 6.4 87.9
don't take 34 12.1 100.0
Total 280 100.0
There was high percentage of reports for consumption of tea with sugar daily i.e. 56%
and 22% report to having tea with sugar many times a day. Twelve percent don't have tea
at all. Six percent of the respondents have tea with sugar 2-3 times a month and one
person reported to having tea once a week.
Frequency of smoking cigarettes
Frequency Valid Percent Cumulative Percent
many times a day 22 8.3 8.3
daily 21 7.9 16.2
2-3/week 2 .8 17.0
1/week 3 1.1 18.1
don't take 217 81.9 100.0
Total 265 100.0
Seventeen respondents chose not to answer the question asked about smoking. Of the 265
that did answer the question, 82% reported to not smoke while 8% said that they smoke
many times a day. About 8% said they smoke daily and the rest smoke no more than once
or 2-3 times a week.
Frequency of smoking bidi
Frequency Valid Percent Cumulative Percent
many times a day 3 1.2 1.2
daily 1 .4 1.6
2-3/week 2 .8 2.3
2-3/month 1 .4 2.7
don't take 251 97.3 100.0
Total 258 100.0
The majority (97%) of the respondents said they don't smoke. Only 1% claimed to smoke
many bidis a day.
19

Frequency of having khaini
Frequency Valid Percent Cumulative Percent
many times a day 7 2.7 2.7
daily 3 1.2 3.9
2-3/week 1 .4 4.2
1/week 1 .4 4.6
2-3/month 4 1.5 6.2
don't take 243 93.8 100.0
Total 259 100.0
Twenty-three of the respondents did not answer to the question if they had khaini. Of the
remaining 259 who answered the question 94% said they don't use khaini. Three percent
reported to using khaini many times a day and 1% use khaini daily.
Frequency of having supari
Frequency Valid Percent Cumulative Percent
daily 4 1.5 1.5
2-3/week 3 1.1 2.7
1/week 7 2.7 5.3
2-3/month 45 17.1 22.4
don't take 204 77.6 100.0
Total 263 100.0
Majority of the respondents (78%) said they do not have supari at all. At most those of the
respondents who do have supari report their most frequent consumption to be 2-3 times a
month. About three percent take supari once a week and only about two percent take it
daily.
Frequency of having paan
Frequency Percent Valid Percent Cumulative Percent
daily 2 .7 .8 .8
2-3/week 1 .4 .4 1.2
1/week 1 .4 .4 1.6
2-3/month 16 5.7 6.2 7.8
don't take 238 84.4 92.2 100.0
Total 258 91.5 100.0
Of the 258 respondents who answered the question 92% reported not to consume paan,
followed by 6% consuming it 2-3 times a month and less than three percent are having
paan less than 2-3 times a week.
20

Frequency of having surti
Frequency Valid Percent Cumulative Percent
many times a day 6 2.3 2.3
daily 5 1.9 4.3
1/week 1 .4 4.7
2-3/month 4 1.6 6.2
don't take 241 93.8 100.0
Total 257 100.0
Like the above cases there was a 93% report to not consuming surti, with two percent
taking surti daily and also many times a day. Another two percent report to having surti
2/3 month while less than a percent consume it weekly.
Frequency of drinking raksi
Frequency Valid Percent Cumulative Percent
many times a day 6 2.3 2.3
1/week 2 .8 3.0
2-3/month 32 12.1 15.2
don't take 224 84.8 100.0
Total 264 100.0
Like seen with many of the products that are considered to be socially unacceptable,
about 18 interviewees did not respond to the question about raksi. Of the 264 who did
answer that question, 85% reported not to take alcohol. About 12% consume it 2-3 times
monthly and two percent take it many times a day with less than one percent taking it
once a week.
How long since the respondent visited a dentist
Frequency Valid Percent Cumulative Percent
less than 6 months 49 17.4 17.4
6-12 months 21 7.5 24.9
more than1year less than 2year 29 10.3 35.2
more than 2year less than 5year
32 11.4 46.6
more than 5 year 35 12.5 59.1
never been 115 40.9 100.0
Total 281 100.0
Forty-one percent of the respondents had never been to a dentist before. Of those who
had visited a dentist before 17% had visited the dentist in less than six months and 7.5%
in the past 6-12 months. Ten percent had been to the dentist more than a year but less
than two years ago. Those who had visited the dentist more than two years but less than
five years ago were 11% while 13% had not been to a dentist in more than 5 years.
21

Reason for not visiting the dentist
Frequency Valid Percent Cumulative Percent
Not enough money 12 5.7 5.7
don't to spend on teeth 2 .9 6.6
afraid 1 .5 7.1
bad experience 3 1.4 8.5
no time 12 5.7 14.2
no need 145 68.4 82.5
problem was not so bad 23 10.8 93.4
problem will go away on it's own
7 3.3 96.7
Clinic far away 6 2.8 99.5
others 1 .5 100.0
Total 212 100.0
On being asked what reason they had for not visiting the dentist 70 interviewees chose
not to answer this question. Of the 212 respondents who did answer the question, 68%
felt there was no need for them to do so; another 11% felt the problem was not so bad
that they had to visit a dentist. About 6% felt that they did not have enough money or did
not have enough time to spend to go to dentist. There is about three percent who feel that
the problem will go away on its own. While another three percent think the clinic is too
far away. There was one percent who did not want to spend on teeth. About two percent
said that they were either afraid or had a bad experience at the dentists before.
Reason for visiting the dentist now
Frequency Valid Percent Cumulative Percent
problem 203 75.5 75.5
time for check up 4 1.5 77.0
was called for check up 1 .4 77.3
during treatment 8 3.0 80.3
patient's companion 53 19.7 100.0
Total 269 100.0
More than 75% of the respondents only visited the dentist if they had a problem. Twenty
percent of the people were there primarily as patients companions. Three percent of the
respondents were there during their treatment and about one percent felt it was their time
for check up and less than one percent was on recall visit to the dentist.
Knowledge about AIDS
Frequency Valid Percent Cumulative Percent
yes 244 87.1 87.1
no 36 12.9 100.0
Total 280 100.0
When questioned about their knowledge of AIDS majority 87% responded to being
aware of what it is.
22

Way of brushing the teeth
Frequency Valid Percent Cumulative Percent
up down 63 23.2 23.2
left & right 82 30.3 53.5
circular 12 4.4 57.9
more than one 114 42.1 100.0
Total 271 100.0
Majority of the respondents (42%) used more than one method to brush their teeth. The
up and down method was used by 23% and 30% brush their teeth left and right. Four
percent of the respondents use circular motion to brush their teeth.
Type of work of the respondents
Frequency Valid Percent Cumulative Percent
farmer 25 9.0 9.0
Business 43 15.5 24.5
government and other service 58 20.9 45.5
manual laborers 9 3.2 48.7
student 32 11.6 60.3
household 74 26.7 87.0
others 29 10.5 97.5
home based product 7 2.5 100.0
Total 277 100.0
Of the 277 respondents 9% worked as farmers and 16% were in their own business.
About 21% of the respondents work for the government services. Only three percent of
the respondents were manual laborers. Eleven percent of the respondents were students.
27% of the respondents were working in their own households. Ten percent of the
respondents worked in other places and two percent had a home based production for
employment.
Education of the respondents
Frequency Valid Percent Cumulative Percent
unfinished primary 77 28.1 28.1
primary finished 21 7.7 35.8
unfinished secondary 46 16.8 52.6
secondary finished 47 17.2 69.7
unfinished university 44 16.1 85.8
university finished 21 7.7 93.4
Uneducated 18 6.6 100.0
Total 274 100.0
Seven percent of the respondents were uneducated and 28% had not completed their
primary level of education. About 8% had finished their primary education. Seventeen
percent had finished secondary schooling and another 17% had not completed their
secondary education. Sixteen percent of the respondents had attended university but not
completed it, with 8% of the respondents having finished university.
23
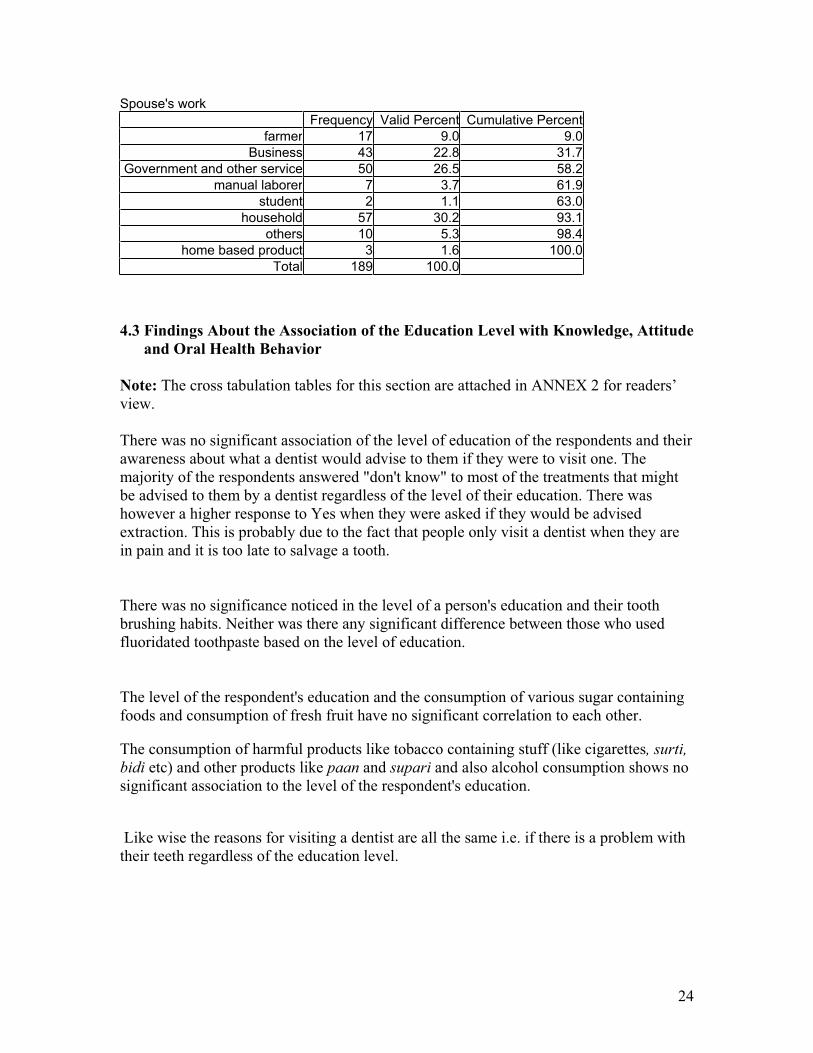
Spouse's work
Frequency Valid Percent Cumulative Percent
farmer 17 9.0 9.0
Business 43 22.8 31.7
Government and other service 50 26.5 58.2
manual laborer 7 3.7 61.9
student 2 1.1 63.0
household 57 30.2 93.1
others 10 5.3 98.4
home based product 3 1.6 100.0
Total 189 100.0
4.3 Findings About the Association of the Education Level with Knowledge, Attitude
and Oral Health Behavior
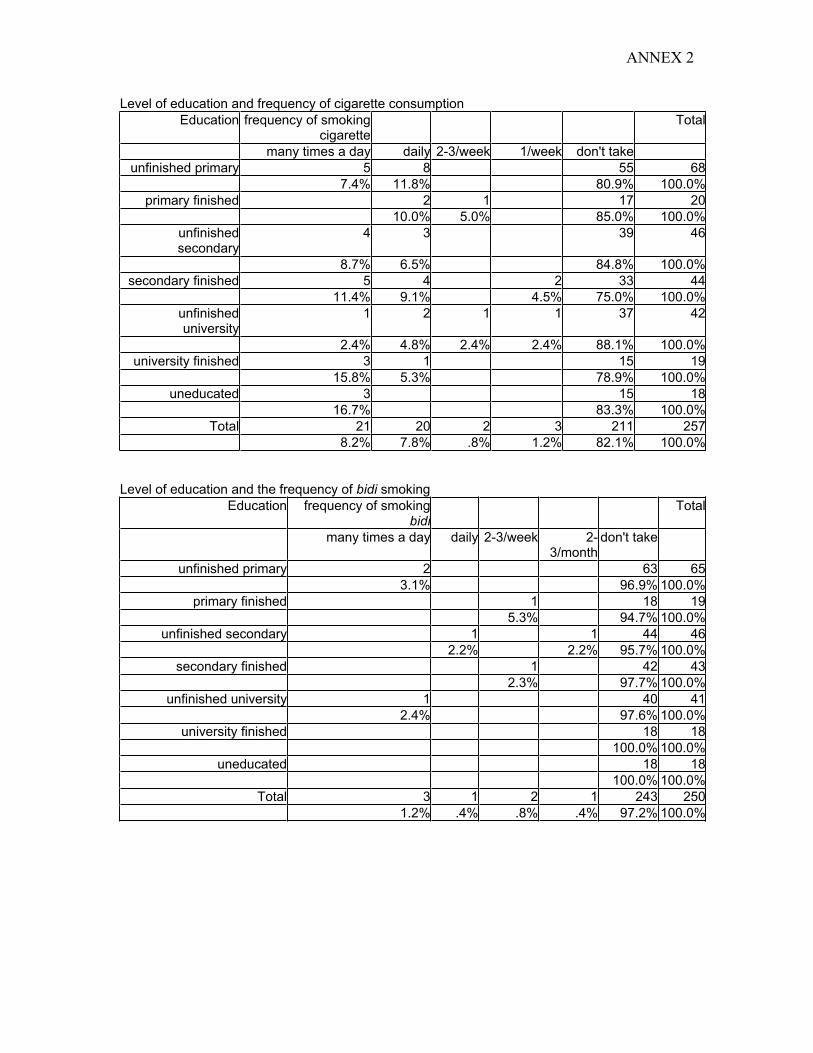
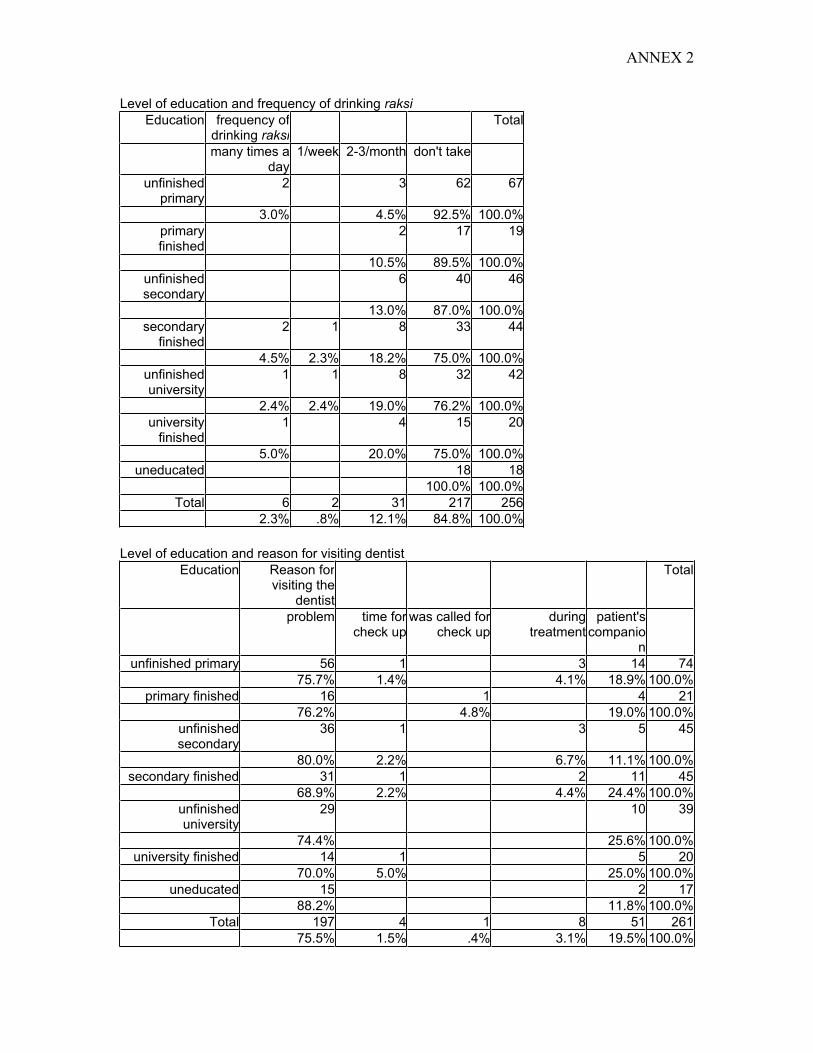
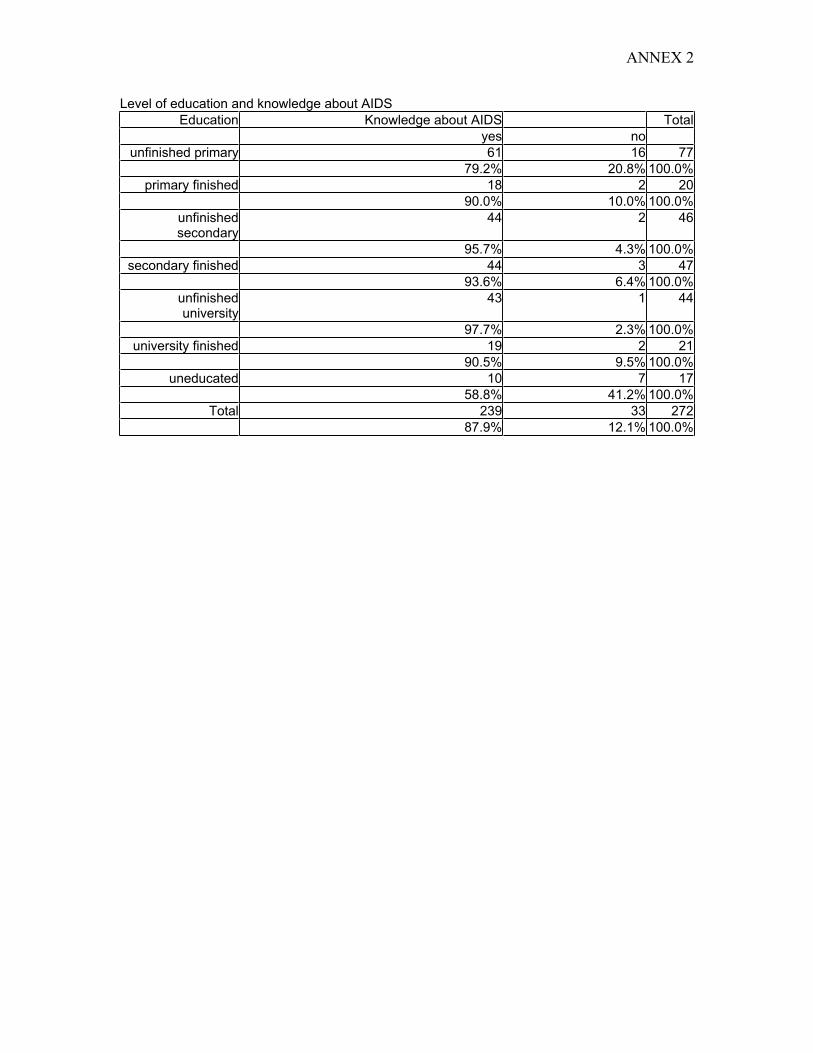
Note: The cross tabulation tables for this section are attached in ANNEX 2 for readers’
view.
There was no significant association of the level of education of the respondents and their
awareness about what a dentist would advise to them if they were to visit one. The
majority of the respondents answered "don't know" to most of the treatments that might
be advised to them by a dentist regardless of the level of their education. There was
however a higher response to Yes when they were asked if they would be advised
extraction. This is probably due to the fact that people only visit a dentist when they are
in pain and it is too late to salvage a tooth.
There was no significance noticed in the level of a person's education and their tooth
brushing habits. Neither was there any significant difference between those who used
fluoridated toothpaste based on the level of education.
The level of the respondent's education and the consumption of various sugar containing
foods and consumption of fresh fruit have no significant correlation to each other.
The consumption of harmful products like tobacco containing stuff (like cigarettes, surti,
bidi etc) and other products like paan and supari and also alcohol consumption shows no
significant association to the level of the respondent's education.
Like wise the reasons for visiting a dentist are all the same i.e. if there is a problem with
their teeth regardless of the education level.
24

There was an increase in percentage of the awareness about AIDS along with the increase
in the educational levels of the respondents.
4.4 Findings About the Association of Gender and Habits
Sex * Frequency of smoking cigarette
frequency of smokingcigarette
Total
many times a day daily 2-3/week 1/week don't take
Sex of the respondent male 17 17 2 3 93 132
female 5 4 124 133
Total 22 21 2 3 217 265
A highly significant (p=.000) association was found between sex of the respondents and
their frequency of smoking cigarettes. This may be so due to the society accepting this
habit more from males than females especially in urban areas.
Sex * Frequency of having Surti
frequency of having surti
Total
many times a day daily 1/week 2-3/month don't take
Sex of the respondent male 6 5 4 111 126
female 1 130 131
Total 6 5 1 4 241 257
Although very few reported of taking surti, a significant (p=.002) association with the sex of the respondents was seen, which like above can be attributed to the acceptance from the society to the males having this habit.Sex * Frequency of drinking raksi
frequency of drinking raksi Total
many times a day 1/week 2-3/month don't take
Sex of the respondent male 5 2 28 97 132
female 1 4 127 132
Total 6 2 32 224 264
Similar to smoking habit the habit of taking raksi (alcohol) there was a highly significant
(p=.000) association between the sex of the respondent and the consumption of alcohol,
again attributed to the societal acceptance to males sporting this habit.
25

CHAPTER V CONCLUSIONS AND RECOMMENDATIONS
CONCLUSIONS
1. People generally visit the hospital after they experience toothache.
2. Most of those who visit the hospital do not smile less or laugh less or speak less
with others due to bad oral hygiene or bad breath. The majority seem to be happy
with the state of their teeth despite the high incidence of reported toothache. This
may be attributed to the lack of information, awareness and their attitudes about
oral health and hygiene.
3. In spite of the high incidence of toothache, most of the people perceive no
problems with their oral health.
4. The lack of awareness was also quite obvious as majority did not know about
what their dentist would advise them in terms of treatment such as filling, scaling,
and orthodontic treatment or if the dentist would say their teeth were fine.
5. However, more patients were sure about the dentist advising extraction. This is
probably due to the fact that people don't visit the dentist unless they have severe
pain and it is too late to salvage the tooth.
6. The toothbrush is quite commonly used to clean the teeth, but most of the people
do not have knowledge about fluoridated toothpastes. The use of toothbrushes
may be due to the ready availability of toothbrushes in the market and the
proximity of the respondents to a market. Additionally, most people are aware
that they should brush their teeth daily though they do not know how many times
a day is recommended.
7. The current consumption of sugar containing foods by the patients is not very
high. However it must be taken into account that the sample consisted of adults
only and that their childhood consumption of sugar containing foods do affect
their present oral health status. This implies that information about past sugar
consumption is very important to be obtained to find out its impact on present
status of oral health.
8. Though majority of the patients have reported not to use or chosen not to answer
the questions about consumption of harmful substances like tobacco, paan,
supari, alcohol, etc., it may be so because of them being questioned in a hospital
atmosphere or due to the social stigmas attached to the consumption of these
substances. It implies that mere administering of questionnaires do not yield the
precise information, therefore along with the questionnaire some sensitive
behavioral information can only be obtained through close observation.
26
9. Generally people do not visit a dentist because they perceive no need for it. They
seem to visit the dentist only when they experience toothache or some other
related problems. This shows that people generally feel that visiting a dentist is
only for curative purpose.
10. The high awareness about AIDS can be attributed to the rigorous and widespread
awareness campaigns about AIDS. However the knowledge about the risk of
transmission during dental treatment is lacking.
11. This study points out that there is no association between the education of the
patients and their attitudes, knowledge and oral health behavior despite about 40%
having education secondary level and above. This maybe so because there is no
oral health awareness in the school curriculum.
12. Interestingly enough the sex of the respondents was significantly associated to the
increased consumption of alcohol and tobacco products with more males using
these harmful products than females. This can be attributed to the cultural
freedom which is enjoyed by male gender.
13. It is realized that for a holistic research, survey of patients has to be supplemented
with a clinical examination of their oral health status. This will enable to link the
association of patients’ socio-economic status and their awareness level to their
oral health status.
RECOMMENDATIONS
1. Conscientious efforts have to be made towards oral health promotion.
2. Oral health education for public in general and the special target groups like
school children, pregnant and nursing mothers, AIDS patients in particular is
deemed necessary, which can be achieved through inclusion in health IEC
materials and inclusion in the school health curriculum.
3. There should be rigorous awareness campaigns regarding tobacco, alcohol, supari
and paan and their association with oral cancer. Moreover, there should be a
strong advocacy by heath professionals against the unrestricted promotion and
marketing of these products.
4. Awareness should also be campaigned about AIDS and Hepatitis-B and their risk
of transmission during dental treatment. Awareness should be made to both the
general public and the oral health care workers who provide their services in
remote areas of Nepal.
5. There should be a day designated to campaign for oral health education and
promotion such as a ‘Love Tooth Day’ held in Wuhan City, China.
27

6. For future studies of similar kind, the survey should be supplemented with clinical
check-ups and observation of patients’ habits.
28

REFERENCES
1. Petersen Paul E., Mzee Omar M. Oral Health Profile of school children, mothers
and teachers in Zanzibar. Community Dental Health 1998; 15:256-262.
2. Bin Peng, Petersen Paul E. Changes in oral health knowledge and behavior 1987-
95 among inhabitants of Wuhan City, PR China. International Dental Journal
1997; 47: 142-147.
3. Bin Peng, Petersen Paul E, Ming Wen Fan, Bao Jun Tai. Oral health status and
oral health behavior of 12-yr old urban school children in the People's Republic of
China Community Dental Health1997;14:238-244.
4. Petersen Paul E, Zhou Esheng. Dental caries and oral health behavior situation of
children, mothers and school teachers in Wuhan, People's Republic of China.
International Dental Journal1998;48: 210-216.
5. Yee Robert, Sheiham Aubrey. The burden of restorative dental treatment for
children in Third World countries. International Dental Journal 2002;52:1-9.
6. Johnson Newell W. Oral Cancer. FDI World Dental Press Ltd. 7 Carlisle Street,
London W1V 5RG, UK.1999:7-8.
7. McDonald Neil, Nepal's Oral Health. Abbey Bookbinding Co., Cardiff, South
Whales.1996.
29


ANNEX 2
CROSS TABULATION TABLES OF EDUCATION AND OTHER VARIABLES
Level of education and awareness what dentist will advise
Education Dentist will say to brush your teeth
Total
Yes No Don't know
unfinished primary 23 54 77
29.9% 70.1% 100.0%
primary finished 5 16 21
23.8% 76.2% 100.0%
unfinished secondary 16 1 29 46
34.8% 2.2% 63.0% 100.0%
secondary finished 13 2 32 47
27.7% 4.3% 68.1% 100.0%
unfinished university 17 1 26 44
38.6% 2.3% 59.1% 100.0%
university finished 8 13 21
38.1% 61.9% 100.0%
uneducated 3 15 18
16.7% 83.3% 100.0%
Total 85 4 185 274
31.0% 1.5% 67.5% 100.0%
Level of education and awareness if dentist will advise to get teeth cleaned
Education Dentist will say to clean your teeth
Total
Yes No Don’t know
unfinished primary 3 73 76
3.9% 96.1% 100.0%
primary finished 2 19 21
9.5% 90.5% 100.0%
unfinished secondary 1 45 46
2.2% 97.8% 100.0%
secondary finished 2 45 47
4.3% 95.7% 100.0%
unfinished university 1 2 41 44
2.3% 4.5% 93.2% 100.0%
university finished 2 19 21
9.5% 90.5% 100.0%
uneducated 1 17 18
5.6% 94.4% 100.0%
Total 6 8 259 273
2.2% 2.9% 94.9% 100.0%

ANNEX 2
Level of education and awareness if dentist will advise filling
Education Dentist will say you need filling in your
teeth
Total
Yes No Don’t know
unfinished primary 17 2 58 77
22.1% 2.6% 75.3% 100.0%
primary finished 6 1 14 21
28.6% 4.8% 66.7% 100.0%
unfinished secondary 9 37 46
19.6% 80.4% 100.0%
secondary finished 11 1 35 47
23.4% 2.1% 74.5% 100.0%
unfinished university 10 2 32 44
22.7% 4.5% 72.7% 100.0%
university finished 3 18 21
14.3% 85.7% 100.0%
uneducated 5 13 18
27.8% 72.2% 100.0%
Total 61 6 207 274
22.3% 2.2% 75.5% 100.0%
Level of education and awareness if dentist will advise extraction
Education Dentist will say to take out your teeth
Total
Yes No Don’t know
unfinished primary 34 2 41 77
44.2% 2.6% 53.2% 100.0%
primary finished 10 2 9 21
47.6% 9.5% 42.9% 100.0%
unfinished secondary 21 25 46
45.7% 54.3% 100.0%
secondary finished 20 2 25 47
42.6% 4.3% 53.2% 100.0%
unfinished university 14 3 27 44
31.8% 6.8% 61.4% 100.0%
university finished 2 19 21
9.5% 90.5% 100.0%
uneducated 9 9 18
50.0% 50.0% 100.0%
Total 110 9 155 274
40.1% 3.3% 56.6% 100.0%

ANNEX 2
Level of education and awareness if dentist will advise orthodontic treatment
Education Dentist will say to fixyour teeth
Total
Yes No Don’t know
unfinished primary 3 74 77
3.9% 96.1% 100.0%
primary finished 3 18 21
14.3%
85.7% 100.0%
unfinished secondary 1 2 43 46
2.2% 4.3% 93.5% 100.0%
secondary finished 5 3 39 47
10.6% 6.4% 83.0% 100.0%
unfinished university 4 4 36 44
9.1% 9.1% 81.8% 100.0%
university finished 2 19 21
9.5% 90.5% 100.0%
uneducated 18 18
100.0% 100.0%
Total 12 15 247 274
4.4% 5.5% 90.1% 100.0%
Level of education and awareness if dentist will say that their teeth are fine
Education Dentist will say the teeth is fine
Total
Yes No Don’t know
unfinished primary 5 1 71 77
6.5% 1.3% 92.2% 100.0%
primary finished 5 16 21
23.8% 76.2% 100.0%
unfinished secondary 2 3 41 46
4.3% 6.5% 89.1% 100.0%
secondary finished 6 1 40 47
12.8% 2.1% 85.1% 100.0%
unfinished university 7 37 44
15.9% 84.1% 100.0%
university finished 6 15 21
28.6% 71.4% 100.0%
uneducated 1 17 18
5.6% 94.4% 100.0%
Total 32 5 237 274
11.7% 1.8% 86.5% 100.0%

ANNEX 2
Level of education and education and frequency of tooth cleaning
Education Frequency oftooth cleaning
Total
never 1/month
2-3/month
1/week 2-3/week 1/day2 or more/day
unfinishedprimary
3 1 2 44 27 77
3.9% 1.3% 2.6% 57.1% 35.1% 100.0%
primary finished 1 10 10 21
4.8% 47.6% 47.6% 100.0%
unfinishedsecondary
1 24 21 46
2.2% 52.2% 45.7% 100.0%
secondary finished
2 1 23 21 47
4.3% 2.1% 48.9% 44.7% 100.0%
unfinisheduniversity
20 24 44
45.5% 54.5% 100.0%
university finished
2 8 11 21
9.5% 38.1% 52.4% 100.0%
uneducated 1 1 9 7 18
5.6% 5.6% 50.0% 38.9% 100.0%
Total 2 1 6 1 5 138 121 274
.7% .4% 2.2% .4% 1.8% 50.4% 44.2% 100.0%
Level of education and use of fluoridated toothpaste
Education Use offluoridatedtoothpaste
Total
yes no don't know don't use toothpaste
unfinished primary 3 66 2 71
4.2% 93.0% 2.8% 100.0%
primary finished 2 1 18 21
9.5% 4.8% 85.7% 100.0%
unfinished secondary 5 1 39 45
11.1% 2.2% 86.7% 100.0%
secondary finished 11 3 32 1 47
23.4% 6.4% 68.1% 2.1% 100.0%
unfinished university 12 1 29 1 43
27.9% 2.3% 67.4% 2.3% 100.0%
university finished 4 1 15 20
20.0% 5.0% 75.0% 100.0%
uneducated 1 1 15 1 18
5.6% 5.6% 83.3% 5.6% 100.0%
Total 38 8 214 5 265
14.3% 3.0% 80.8% 1.9% 100.0%

ANNEX 2
Level of education and frequency of eating fresh fruit
Education frequency of eatingfresh fruits
Total
many times a day daily 2-3/week 1/week 2-3/month don'ttake
unfinishedprimary
10 24 4 33 6 77
13.0% 31.2% 5.2% 42.9% 7.8% 100.0%
primary finished
6 8 1 6 21
28.6% 38.1% 4.8% 28.6% 100.0%
unfinishedsecondary
1 8 20 4 12 1 46
2.2% 17.4% 43.5% 8.7% 26.1% 2.2% 100.0%
secondary finished
1 9 14 4 16 3 47
2.1% 19.1% 29.8% 8.5% 34.0% 6.4% 100.0%
unfinisheduniversity
9 21 3 9 2 44
20.5% 47.7% 6.8% 20.5% 4.5% 100.0%
university finished
7 9 4 1 21
33.3% 42.9% 19.0% 4.8% 100.0%
uneducated 4 2 3 6 3 18
22.2% 11.1% 16.7% 33.3% 16.7% 100.0%
Total 2 53 98 19 86 16 274
.7% 19.3% 35.8% 6.9% 31.4% 5.8% 100.0%
Level of education and frequency of biscuit consumption
Education Frequency ofeating biscuits
Total
many times a day daily 2-3/week 1/week 2-3/month don't take
unfinishedprimary
4 14 9 3 24 23 77
5.2% 18.2% 11.7% 3.9% 31.2% 29.9% 100.0%
primary finished 5 11 5 21
23.8% 52.4% 23.8% 100.0%
unfinishedsecondary
10 6 4 10 16 46
21.7% 13.0% 8.7% 21.7% 34.8% 100.0%
secondary finished
10 2 21 14 47
21.3% 4.3% 44.7% 29.8% 100.0%
unfinisheduniversity
4 7 3 20 10 44
9.1% 15.9% 6.8% 45.5% 22.7% 100.0%
university finished 5 2 7 7 21
23.8% 9.5% 33.3% 33.3% 100.0%
uneducated 2 2 8 6 18
11.1% 11.1% 44.4% 33.3% 100.0%
Total 4 50 28 10 101 81 274
1.5% 18.2% 10.2% 3.6% 36.9% 29.6% 100.0%

ANNEX 2
Level of education and frequency of drinking soda
Education Frequency ofdrinking soda
Total
many times a day daily 2-3/week 1/week 2-3/month don't take
unfinishedprimary
3 11 5 27 31 77
3.9% 14.3% 6.5% 35.1% 40.3% 100.0%
primary finished 1 2 2 13 3 21
4.8% 9.5% 9.5% 61.9% 14.3% 100.0%
unfinishedsecondary
9 6 2 19 10 46
19.6% 13.0% 4.3% 41.3% 21.7% 100.0%
secondary finished
1 5 9 1 17 14 47
2.1% 10.6% 19.1% 2.1% 36.2% 29.8% 100.0%
unfinisheduniversity
1 5 10 2 17 9 44
2.3% 11.4% 22.7% 4.5% 38.6% 20.5% 100.0%
university finished 1 3 2 10 5 21
4.8% 14.3% 9.5% 47.6% 23.8% 100.0%
uneducated 1 1 1 4 11 18
5.6% 5.6% 5.6% 22.2% 61.1% 100.0%
Total 2 25 42 15 107 83 274
.7% 9.1% 15.3% 5.5% 39.1% 30.3% 100.0%
Level of education and frequency of drinking juice with sugar
Education Frequency ofdrinking juice with
sugar
Total
many times a day daily 2-3/week 1/week 2-3/month don't take
unfinishedprimary
6 1 14 55 76
7.9% 1.3% 18.4% 72.4% 100.0%
primary finished 1 11 9 21
4.8% 52.4% 42.9% 100.0%
unfinishedsecondary
1 3 6 15 19 44
2.3% 6.8% 13.6% 34.1% 43.2% 100.0%
secondary finished
2 1 4 1 14 25 47
4.3% 2.1% 8.5% 2.1% 29.8% 53.2% 100.0%
unfinisheduniversity
1 2 7 1 10 23 44
2.3% 4.5% 15.9% 2.3% 22.7% 52.3% 100.0%
university finished
4 1 5 11 21
19.0% 4.8% 23.8% 52.4% 100.0%
uneducated 1 1 5 11 18
5.6% 5.6% 27.8% 61.1% 100.0%
Total 4 8 27 5 74 153 271
1.5% 3.0% 10.0% 1.8% 27.3% 56.5% 100.0%

ANNEX 2
Level and education and frequency of having chewing gum
Education frequency of havingchewing gum
Total
many times a day daily 2-3/week 1/week 2-3/month don't take
unfinished primary 1 5 2 16 53 77
1.3% 6.5% 2.6% 20.8% 68.8% 100.0%
primary finished 8 12 20
40.0% 60.0% 100.0%
unfinished secondary 1 3 3 1 10 26 44
2.3% 6.8% 6.8% 2.3% 22.7% 59.1% 100.0%
secondary finished 1 2 3 1 9 31 47
2.1% 4.3% 6.4% 2.1% 19.1% 66.0% 100.0%
unfinished university 4 4 1 14 21 44
9.1% 9.1% 2.3% 31.8% 47.7% 100.0%
university finished 7 14 21
33.3% 66.7% 100.0%
uneducated 1 2 15 18
5.6% 11.1% 83.3% 100.0%
Total 3 14 13 3 66 172 271
1.1% 5.2% 4.8% 1.1% 24.4% 63.5% 100.0%
Level of education and frequency of mithai/chocolate consumption
Education frequency of havingmithai and chocolates
Total
many times a day daily 2-3/week 1/week 2-3/month don't take
unfinishedprimary
2 5 2 21 47 77
2.6% 6.5% 2.6% 27.3% 61.0% 100.0%
primary finished 1 1 1 6 12 21
4.8% 4.8% 4.8% 28.6% 57.1% 100.0%
unfinishedsecondary
1 1 4 13 26 45
2.2% 2.2% 8.9% 28.9% 57.8% 100.0%
secondary finished
1 3 3 1 10 29 47
2.1% 6.4% 6.4% 2.1% 21.3% 61.7% 100.0%
unfinisheduniversity
1 1 7 1 15 19 44
2.3% 2.3% 15.9% 2.3% 34.1% 43.2% 100.0%
university finished 1 8 12 21
4.8% 38.1% 57.1% 100.0%
uneducated 1 3 14 18
5.6% 16.7% 77.8% 100.0%
Total 5 11 17 5 76 159 273
1.8% 4.0% 6.2% 1.8% 27.8% 58.2% 100.0%

ANNEX 2
Level of education and frequency of consumption of coffee with sugar
Education frequency ofdrinking coffee with
sugar
Total
many times a day daily 2-3/week 1/week 2-3/month don't take
unfinished primary 1 4 13 49 67
1.5% 6.0% 19.4% 73.1% 100.0%
primary finished 3 5 12 20
15.0% 25.0% 60.0% 100.0%
unfinished secondary 6 2 8 27 43
14.0% 4.7% 18.6% 62.8% 100.0%
secondary finished 7 1 13 24 45
15.6% 2.2% 28.9% 53.3% 100.0%
unfinished university 7 1 1 8 21 38
18.4% 2.6% 2.6% 21.1% 55.3% 100.0%
university finished 1 1 3 15 20
5.0% 5.0% 15.0% 75.0% 100.0%
uneducated 1 1 16 18
5.6% 5.6% 88.9% 100.0%
Total 1 28 4 3 51 164 251
.4% 11.2% 1.6% 1.2% 20.3% 65.3% 100.0%
Level of education and frequency consuming tea with sugar
Education frequency ofdrinking tea
with sugar
Total
many times a day
daily 2-3/week 1/week 2-3/month don't take
unfinishedprimary
24 35 2 1 6 9 77
31.2% 45.5% 2.6% 1.3% 7.8% 11.7% 100.0%
primary finished 6 13 1 1 21
28.6% 61.9% 4.8% 4.8% 100.0%
unfinishedsecondary
6 32 1 2 5 46
13.0% 69.6% 2.2% 4.3% 10.9% 100.0%
secondary finished
10 23 2 4 7 46
21.7% 50.0% 4.3% 8.7% 15.2% 100.0%
unfinisheduniversity
6 28 2 3 5 44
13.6% 63.6% 4.5% 6.8% 11.4% 100.0%
university finished
3 12 1 5 21
14.3% 57.1% 4.8% 23.8% 100.0%
uneducated 4 8 2 3 17
23.5% 47.1% 11.8% 17.6% 100.0%
Total 59 151 9 1 18 34 272
21.7% 55.5% 3.3% .4% 6.6% 12.5% 100.0%
ANNEX 2
Level of education and frequency of cigarette consumption
Education frequency of smoking cigarette
Total
many times a day daily 2-3/week 1/week don't take
unfinished primary 5 8 55 68
7.4% 11.8% 80.9% 100.0%
primary finished 2 1 17 20
10.0% 5.0% 85.0% 100.0%
unfinishedsecondary
4 3 39 46
8.7% 6.5% 84.8% 100.0%
secondary finished 5 4 2 33 44
11.4% 9.1% 4.5% 75.0% 100.0%
unfinisheduniversity
1 2 1 1 37 42
2.4% 4.8% 2.4% 2.4% 88.1% 100.0%
university finished 3 1 15 19
15.8% 5.3% 78.9% 100.0%
uneducated 3 15 18
16.7% 83.3% 100.0%
Total 21 20 2 3 211 257
8.2% 7.8% .8% 1.2% 82.1% 100.0%
Level of education and the frequency of bidi smoking
Education frequency of smokingbidi
Total
many times a day daily 2-3/week 2-3/month
don't take
unfinished primary 2 63 65
3.1% 96.9% 100.0%
primary finished 1 18 19
5.3% 94.7% 100.0%
unfinished secondary 1 1 44 46
2.2% 2.2% 95.7% 100.0%
secondary finished 1 42 43
2.3% 97.7% 100.0%
unfinished university 1 40 41
2.4% 97.6% 100.0%
university finished 18 18
100.0% 100.0%
uneducated 18 18
100.0% 100.0%
Total 3 1 2 1 243 250
1.2% .4% .8% .4% 97.2% 100.0%

ANNEX 2
Level of education and frequency of having khaini
Education frequency of having khaini Total
many times a day daily 2-3/week
1/week 2-3/month
don't take
unfinishedprimary
1 1 1 1 61 65
1.5% 1.5% 1.5% 1.5% 93.8% 100.0%
primary finished
1 18 19
5.3% 94.7% 100.0%
unfinishedsecondary
2 44 46
4.3% 95.7% 100.0%
secondary finished
3 1 40 44
6.8% 2.3% 90.9% 100.0%
unfinisheduniversity
1 1 1 38 41
2.4% 2.4% 2.4% 92.7% 100.0%
university finished
1 17 18
5.6% 94.4% 100.0%
uneducated
1 17 18
5.6% 94.4% 100.0%
Total 7 3 1 1 4 235 251
2.8% 1.2% .4% .4% 1.6% 93.6% 100.0%
Level of education and frequency of supari consumption
Education frequency of having supari Total
daily 2-3/week 1/week 2-3/month don't take
unfinishedprimary
3 1 2 8 53 67
4.5% 1.5% 3.0% 11.9% 79.1% 100.0%
primary finished 1 2 16 19
5.3% 10.5% 84.2% 100.0%
unfinishedsecondary
12 34 46
26.1% 73.9% 100.0%
secondary finished
1 2 11 29 43
2.3% 4.7% 25.6% 67.4% 100.0%
unfinisheduniversity
2 2 10 29 43
4.7% 4.7% 23.3% 67.4% 100.0%
university finished 2 17 19
10.5% 89.5% 100.0%
uneducated 18 18
100.0% 100.0%
Total 4 3 7 45 196 255
1.6% 1.2% 2.7% 17.6% 76.9% 100.0%

ANNEX 2
Level of education and frequency of having paan
Education frequency of having paan Total
daily 2-3/week 1/week 2-3/month don't take
unfinished primary 4 61 65
6.2% 93.8% 100.0%
primary finished 1 18 19
5.3% 94.7% 100.0%
unfinishedsecondary
1 4 41 46
2.2% 8.7% 89.1% 100.0%
secondary finished 1 6 35 42
2.4% 14.3% 83.3% 100.0%
unfinisheduniversity
1 1 1 39 42
2.4% 2.4% 2.4% 92.9% 100.0%
university finished 18 18
100.0% 100.0%
uneducated 18 18
100.0% 100.0%
Total 2 1 1 16 230 250
.8% .4% .4% 6.4% 92.0% 100.0%
Level of education and frequency of having surti
Education frequency ofhaving surti
Total
many times a day
daily 1/week 2-3/month don't take
unfinishedprimary
4 3 59 66
6.1% 4.5% 89.4% 100.0%
primary finished
1 18 19
5.3% 94.7% 100.0%
unfinishedsecondary
44 44
100.0% 100.0%
secondary finished
2 1 40 43
4.7% 2.3% 93.0% 100.0%
unfinisheduniversity
1 1 38 40
2.5% 2.5% 95.0% 100.0%
university finished
3 16 19
15.8% 84.2% 100.0%
uneducated 18 18
100.0% 100.0%
Total 6 5 1 4 233 249
2.4% 2.0% .4% 1.6% 93.6% 100.0%
ANNEX 2
Level of education and frequency of drinking raksi
Education frequency ofdrinking raksi
Total
many times a day
1/week 2-3/month don't take
unfinishedprimary
2 3 62 67
3.0% 4.5% 92.5% 100.0%
primary finished
2 17 19
10.5% 89.5% 100.0%
unfinishedsecondary
6 40 46
13.0% 87.0% 100.0%
secondary finished
2 1 8 33 44
4.5% 2.3% 18.2% 75.0% 100.0%
unfinisheduniversity
1 1 8 32 42
2.4% 2.4% 19.0% 76.2% 100.0%
university finished
1 4 15 20
5.0% 20.0% 75.0% 100.0%
uneducated 18 18
100.0% 100.0%
Total 6 2 31 217 256
2.3% .8% 12.1% 84.8% 100.0%
Level of education and reason for visiting dentist
Education Reason forvisiting the
dentist
Total
problem time forcheck up
was called forcheck up
during treatment
patient'scompanio
n
unfinished primary 56 1 3 14 74
75.7% 1.4% 4.1% 18.9% 100.0%
primary finished 16 1 4 21
76.2% 4.8% 19.0% 100.0%
unfinishedsecondary
36 1 3 5 45
80.0% 2.2% 6.7% 11.1% 100.0%
secondary finished 31 1 2 11 45
68.9% 2.2% 4.4% 24.4% 100.0%
unfinisheduniversity
29 10 39
74.4% 25.6% 100.0%
university finished 14 1 5 20
70.0% 5.0% 25.0% 100.0%
uneducated 15 2 17
88.2% 11.8% 100.0%
Total 197 4 1 8 51 261
75.5% 1.5% .4% 3.1% 19.5% 100.0%
ANNEX 2
Level of education and knowledge about AIDS
Education Knowledge about AIDS Total
yes no
unfinished primary 61 16 77
79.2% 20.8% 100.0%
primary finished 18 2 20
90.0% 10.0% 100.0%
unfinishedsecondary
44 2 46
95.7% 4.3% 100.0%
secondary finished 44 3 47
93.6% 6.4% 100.0%
unfinisheduniversity
43 1 44
97.7% 2.3% 100.0%
university finished 19 2 21
90.5% 9.5% 100.0%
uneducated 10 7 17
58.8% 41.2% 100.0%
Total 239 33 272
87.9% 12.1% 100.0%