Embed Size (px)
Citation preview
University of Central Florida University of Central Florida
STARS STARS
Electronic Theses and Dissertations
2016
Examination of Attitude-Behavior Discrepancy in Familism and its Examination of Attitude-Behavior Discrepancy in Familism and its
Relation to Symptoms of Depression among Latinos Relation to Symptoms of Depression among Latinos
Andel Nicasio University of Central Florida
Part of the Child Psychology Commons
Find similar works at: https://stars.library.ucf.edu/etd
University of Central Florida Libraries http://library.ucf.edu
This Masters Thesis (Open Access) is brought to you for free and open access by STARS. It has been accepted for
inclusion in Electronic Theses and Dissertations by an authorized administrator of STARS. For more information,
please contact [email protected].
STARS Citation STARS Citation Nicasio, Andel, "Examination of Attitude-Behavior Discrepancy in Familism and its Relation to Symptoms of Depression among Latinos" (2016). Electronic Theses and Dissertations. 5279. https://stars.library.ucf.edu/etd/5279
EXAMINATION OF ATTITUDE-BEHAVIOR DISCREPANCY IN FAMILISM AND ITS
RELATION TO SYMPTOMS OF DEPRESSION AMONG LATINOS
by
ANDEL V. NICASIO
B.A. Madre y Maestra Pontifical Catholic University, 2000
MSEd. Hunter College of The City University of New York, 2006
A thesis submitted in partial fulfillment of the requirements
for the degree of Master of Science
in the Department of Psychology
in the College of Sciences
at the University of Central Florida
Orlando, Florida
Fall Term
2016
Major Professor: Jeffrey Cassisi

ii
© 2016 Andel V. Nicasio
iii
ABSTRACT
This research examines the discrepancy between attitudinal and behavioral familism and
its relation to depressive symptoms. The overarching hypothesis was that discrepancy between
family values and the actual experiences of those values influences psychological health.
Previous research has primarily focused on self-report measures of familial attitudes, and not
whether these values are actually experienced by the individual. To address this gap in the
literature, this study developed a new behavioral familism scale. A total of 431 Latinos and non-
Latino Whites from a large university in Florida participated in this study. Overall, the new
behavioral familism scale demonstrated good psychometric properties. Test-retest reliability was
established with a sample of 109 participants who completed the measures twice, two weeks
apart. Test-retest reliability was high (r = .85) and excellent (ICC = .92) for the total composite
score. The internal consistency was examined with a sample of 323 participants. Results showed
good internal consistency for the total composite score (Cronbach Alpha = .85). The convergent
validity was evaluated with another measure of familism, as well as measures of perceived social
support and family environment. Correlation analyses indicated significant positive relationships
with all related measures in the expected direction. The divergent validity was evaluated with
measures of social desirability and acculturation. Correlation analyses indicated non-significant
and low relationships with both measures as expected. Polynomial regression and response
surface analyses demonstrated that discrepancy between attitudinal and behavioral familism
scores predicted symptoms of depression in a sample of 118 Latinos. Specifically, this study
found that depressive symptoms increased as the discrepancy between the total composite scores
of attitudinal and behavioral familism increased in either direction. Furthermore, the discrepancy
iv
in the family interconnectedness subscale indicated that symptoms of depression increased when
attitudinal family interconnectedness was higher than behavioral family interconnectedness, but
not when the relationship was reversed. Discrepancies between attitudinal and behavioral
familism total composite scores and subscales did not predict symptoms of anxiety. These
findings highlight the importance of understanding the role that culturally specific variables,
such as familism, play in the psychological health of Latinos.

v
TABLE OF CONTENTS
LIST OF FIGURES ........................................................................................................... ix
LIST OF TABLES .............................................................................................................. x
LIST OF ACRONYMS .................................................................................................... xii
CHAPTER ONE: INTRODUCTION AND LITERATURE REVIEW ............................. 1
Latino Mental Health ...................................................................................................... 2
Familism ......................................................................................................................... 4
Attitudinal Familism ................................................................................................... 6
Behavioral Familism ................................................................................................... 8
Statement of Purpose ...................................................................................................... 9
CHAPTER TWO: METHODOLOGY ............................................................................. 11
Participants .................................................................................................................... 11
Procedure ...................................................................................................................... 11
Development of Behavioral Familism Scales ............................................................... 11
Measures ....................................................................................................................... 12
Attitudinal and Behavioral Familism Measures ....................................................... 12
Convergent Validity Measures ................................................................................. 13
Divergent Validity Measures .................................................................................... 14
Outcome Measures.................................................................................................... 15

vi
Demographic Questions ............................................................................................ 16
Data Quality Check Items ......................................................................................... 16
Statistical Analyses ....................................................................................................... 17
Demographic Characteristics .................................................................................... 17
Test-retest Reliability Analyses ................................................................................ 17
Internal Consistency Reliability Analyses ................................................................ 18
Convergent Validity Analyses .................................................................................. 18
Divergent Validity Analyses ..................................................................................... 18
Discrepancy Analyses ............................................................................................... 19
CHAPTER THREE: RESULTS ....................................................................................... 22
Demographic Characteristics ........................................................................................ 22
Sample 1.................................................................................................................... 22
Sample 2.................................................................................................................... 23
Demographic Comparison between Latinos and Non-Latinos Whites within Samples
1-2 ......................................................................................................................................... 24
Test-retest Reliability of the Attitudinal and Behavioral Familism Scales................... 27
Internal Consistency of the Attitudinal and Behavioral Familism Scales .................... 29
AFS and B-AFS with both Racial/Ethnic Groups Combined ................................... 29
Convergent Validity of the Attitudinal and Behavioral Familism Scales..................... 31
vii
Familism Scales ........................................................................................................ 32
Perceived Social Support .......................................................................................... 34
Family Environment ................................................................................................. 36
Divergent Validity of the Attitudinal and Behavioral Familism Scales ....................... 38
Social Desirability ..................................................................................................... 39
Acculturation............................................................................................................. 40
Discrepancy Analysis.................................................................................................... 40
Polynomial Regression and Response Surface Analyses with the AFS and B-AFS 42
Exploratory Analyses .................................................................................................... 47
CHAPTER FOUR: DISCUSSION ................................................................................... 48
Conclusion .................................................................................................................... 54
APPENDIX A: IRB APPROVAL LETTER .................................................................... 55
APPENDIX B: THE NEW B-AFS ................................................................................... 57
APPENDIX C: FS AND B-FS SCALES ......................................................................... 60
APPENDIX D: PSYCHOMETRIC PROPERTIES OF THE B-FS ................................. 63
Development of a Behavioral Familism Scale: A Manuscript Describing the
Psychometric Properties of the FS and B-FS ............................................................................ 64
B-FS Scale Development .......................................................................................... 64
Test-Retest Reliability .............................................................................................. 64
viii
Internal Consistency.................................................................................................. 66
Convergent Validity of the FS and B-FS .................................................................. 69
Divergent Validity of FS and B-FS .......................................................................... 72
APPENDIX E: DEMOGRAPHIC QUESTIONNAIRE ................................................... 74
Demographic Questionnaire ......................................................................................... 75
APPENDIX F: AFS AND B-AFS SKEWNESS AND KURTOSIS ................................ 78
Skewness and Kurtosis Values for the AFS and B-AFS in Sample 2 .......................... 79
APPENDIX G: DESCRIPTIVE STATISTICS FOR MSPSS, FES, MCSDS-SF ........... 80
Means and Standard Deviations for the MSPSS, FES and MCSDS-SF for Both
Racial/Ethnic Groups Combined and Separated ....................................................................... 81
REFERENCES ................................................................................................................. 82

ix
LIST OF FIGURES
Figure 1: Flow Chart for Sample 1 ................................................................................... 23
Figure 2: Flow Chart Sample 2 ......................................................................................... 24
Figure 3: Surface Graph of Total Composite Scores of AFS and B-AFS with BDI-II .... 44
Figure 4: Surface Graph of AFS Family Interconnectedness and the B-AFS Family
Interconnectedness Subscales with BDI-II ................................................................................... 46
x
LIST OF TABLES
Table 1 Definitions of Familism ......................................................................................... 5
Table 2 Demographic Characteristics by Samples ........................................................... 26
Table 3 Test-Retest Reliability for the AFS and the B-AFS ............................................ 28
Table 4 Means, Standard Deviations and Cronbach’s Alpha Coefficients for the AFS and
the B-AFS ..................................................................................................................................... 30
Table 5 Means, Standard Deviations and Cronbach’s Alpha Coefficients for the AFS and
the B-AFS by Racial/Ethnic Groups ............................................................................................. 31
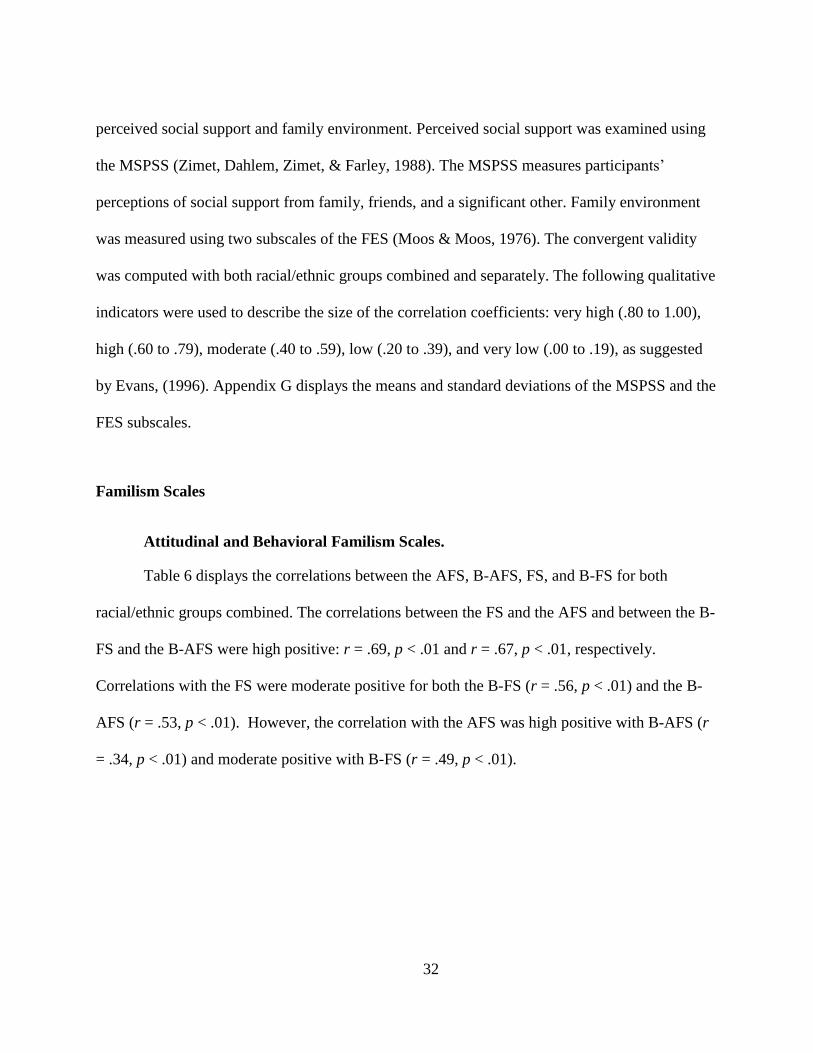
Table 6 Correlations between the Total Composite Scores of the AFS, B-AFS, FS and B-
FS .................................................................................................................................................. 33
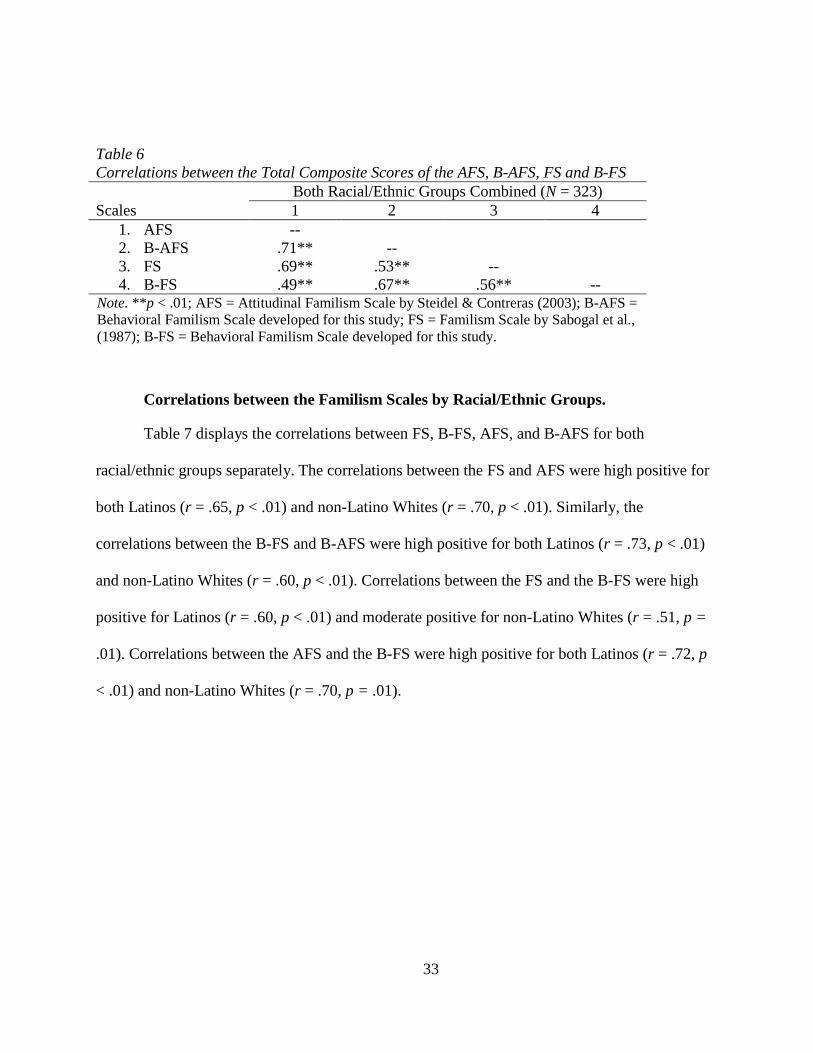
Table 7 Correlations between the Total Composite Scores of the AFS, B-AFS, FS, and B-
FS by Racial/Ethnic Groups......................................................................................................... 34
Table 8 Correlations between the Total Composite Scores from the Familism Scales and
the MSPSS .................................................................................................................................... 35
Table 9 Correlations between the Total Composite Scores of the AFS and B-AFS and the
MSPSS by Racial/Ethnic Groups.................................................................................................. 36
Table 10 Correlations between the Total Composite Scores from the Familism Scales and
the FES Subscales ......................................................................................................................... 37
Table 11 Correlations between the Total Composite Scores from the Familism Scales and
the FES Subscales for Sample 2 by Racial/Ethnic Groups ........................................................... 38
Table 12 Correlations between the Total Composite Scores of the AFS, B-FS and the
MCSDS-SF ................................................................................................................................... 39
xi
Table 13 Correlations between the Total Composite Scores of the Familism Scales and
SMAS among Latinos ................................................................................................................... 40
Table 14 Frequencies and Means of the Levels of Agreement and Discrepancy between
the Total Composite Scores of the AFS and B-AFS among Latinos ............................................ 41
Table 15 Frequencies and Means of the Levels of Agreement and Discrepancy between
the AFS and B-AFS among Latinos ............................................................................................. 42
Table 16 Results from the Polynomial Regression of the Total Composite Score of the
AFS on the Total Composite Score of the B-FS with the BDI-II among Latinos ........................ 43
Table 17 Results from the Polynomial Regression of the AFS Family Interconnectedness
subscale on the B-FS Family Interconnectedness with the BDI-II among Latinos ...................... 45
xii
LIST OF ACRONYMS
AFS Attitudinal Family Scale (Steidel & Contreras, 2003)
B-AFS Behavioral-Attitudinal Familism
B-FS Behavioral-Familism Scale
FS Familism Scale (Sabogal, Marín, Otero-Sabogal, VanOss Marín & Perez-Stable, 1987)
1
CHAPTER ONE: INTRODUCTION AND LITERATURE REVIEW
Latinos represent the largest ethnic minority group in the United States. As a group, the
Latino population is projected to increase more than twofold between 2014 (55 million; 17.4%)
and 2060 (119 million; 28.6%) (Colby & Ortman, 2015). This demographic trend has resulted in
increased attention to understanding the mental health needs of this population. Previous
research indicates higher rates of mental health disparities among Latinos (Institute of Medicine,
2003; President’s New Freedom Commission on Mental Health, 2003) and underscores the need
to examine the effects of culture on the development, course and treatment of mental health (U.S.
Departmemt of Health and Human Services, 2001). Despite research advances, little is known
about the impact culture has on the risk and prevention of mental health disorders among
Latinos. Given the importance of family in Latino culture, researchers have called attention to
the need to study both the challenges and opportunities facing Latinos within the context of
family interactions (Cauce & Domenech-Rodriguez, 2002).
Familism is the term used to describe a core cultural value that emphasizes strong and
close family ties (Sabogal, Marin, Otero-Sabogal, VanOss Marin, & Perez-Stable, 1987), and has
been associated with both good psychological health (Campos, Ullman, Aguilera, & Dunkel
Schetter, 2014; German, Gonzales, & Dumka, 2008) and increased symptoms of anxiety and
depression (Schwartz, 2007). A gap in the literature lies with the measurement of the construct
itself, where few studies comprehensively assess key aspects of familism, such as the
relationship between attitudinal and behavioral domains. That is, most studies focus on
attitudinal familism values, disregarding whether the person is actually having these values met.
Despite scholarly interest in familism, there has only been one attempt to develop a behavioral
2
familism measure. Comeau (2002) developed a behavioral familism measure based on frequency
of family contact. Although this is a step forward in understanding behavioral familism, this
behavioral familism measure does not assess people’s actions in relation to their familism values.
Thus, there is a need to develop a more comprehensive behavioral familism scale that could be
used in conjunction with existing attitudinal measures in order to measure the two main
dimensions of familism altogether. As such, the goal of this study is to bridge the gap in the
understanding of the relationship between attitudinal values and the experience of familism
among Latinos.
Latino Mental Health
There is evidence that approximately 60% of Latinos meet lifetime diagnostic criteria for
depressive, anxiety, or substance use disorders, whereas 30% meet 12-month criteria for similar
disorders (Alegría, Mulvaney-Day, Woo, et al., 2007). However, research on racial-ethnic
diversity found that the lifetime prevalence and risk for mood disorders, anxiety and for any
psychiatric disorder among Latinos are lower compared to non-Latino Whites (Alegría et al.,
2008; Breslau, Borges, Hagar, Tancredi, & Gilman, 2009) despite facing more severe
socioeconomic and healthcare barriers (Turner & Lloyd, 2004). These findings suggest the
existence of protective factors that might account for the reduced prevalence of mental health
disorders among Latinos.
Although Latinos report lower prevalence of mental health disorders, those who become
ill report more chronic disorders (Breslau et al., 2006; Breslau, Kendler, Su, Gaxiola-Aguilar, &
Kessler, 2005; Himle, Baser, Taylor, Campbell, & Jackson, 2009) and higher rates of mental
health comorbidities (Ortega, Feldman, Canino, Steinman, & Alegría, 2006). A recent study with
3
a sample of individuals with anxiety disorders showed worse psychological functioning among
Latinos compared to non-Latino Whites (Moitra et al., 2014).
Furthermore, the underutilization of mental health services by Latinos represents a
significant problem and has been a consistent theme in the literature (Alegría et al., 2014; Vega
& Lopez, 2001). In the 1990s, research found that fewer than 1 in 11 Latinos with a mental
disorder sought specialty mental health services, with rates even lower for Latino immigrants
(Vega, Kolody, Aguilar-Gaxiola, & Catalano, 1999). Recent research also highlights underuse of
treatment and receipt of poorer quality mental health services among Latinos (Harris, Edlund, &
Larson, 2005; Institute of Medicine, 2003). Research examining mental health illness among
suicide victims documented that, compared to non-Latino Whites and non-Latino Blacks,
Latinos were less likely to have received a professional mental health diagnosis, or have been
treated either currently or ever in their lives (Karch, Barker, & Strine, 2006). These findings
suggest that there may be underlying factors that exacerbate the course, treatment, and
recurrence of mental illness among Latinos.
In the past decade, research showed heterogeneity in prevalence patterns for mental
disorders among Latinos. Although in the aggregate, Latinos have lower rates of mental health
disorders, research documented increased prevalence of mental disorders as a function of years
living in the United States and acculturation (Alegría, Sribney, Woo, Torres, & Guarnaccia,
2007; Ortega, Rosenheck, Alegria, & Desai, 2000; Vega, Sribney, Aguilar-Gaxiola, & Kolody,
2004). Further, findings from the National Latino and Asian American Study (NLAAS)
demonstrated that U.S.-born Latinos are more at risk of any lifetime mental disorders than
foreign born Latinos (Alegría et al., 2008). However, the protective effects of immigrant status
varied by nativity, years living in the U.S., and age at immigration (Alegria et al., 2007).
4
Particularly, Puerto Ricans experienced higher risk of developing any mental illness than
Mexicans, Cubans, and other Latino subgroups, and at a rate comparable to non-Latino White
individuals. Additionally, higher rates of mental disorders were reported by U.S.-born, English-
proficient, and third-generation Latinos (Alegría, Mulvaney-Day, Torres, et al., 2007).
In an effort to better understand what aspects of U.S. exposure are related to Latino
mental health and account for variance among Latino subgroups, researchers have examined
other social and cultural covariates: family cultural conflict, family cohesion, family support,
family ties, and family conflict, amongst others. Taken together these cultural factors are referred
to as familism. Familism may contribute to the understanding of Latino mental health as it has
been found to capture the importance of close family ties and family support. Further, familism
may be a potential indicator to understand the risk and protective factors associated with Latino
mental health.
Familism
Familism is a core cultural value among Latinos that emphasizes strong and close family
ties. Familism was first defined as a universal concept referring to “strong in-group feelings,
emphasis on family goals, common property, mutual support, and the desire to pursue the
perpetuation of the family” (Bardis, 1959, p. 340). According to Sabogal et al. (1987), familism
involves familial commitment, perceived support, emotional closeness, and viewing family as a
referent. Recent cross-cultural studies have supported the universality and cultural variability of
this concept (Nicholas, Stepick, & Stepick, 2008; Schwartz, 2007; Weine et al., 2006). Although
familism is a value commonly found across groups of different cultural backgrounds, Latinos
5
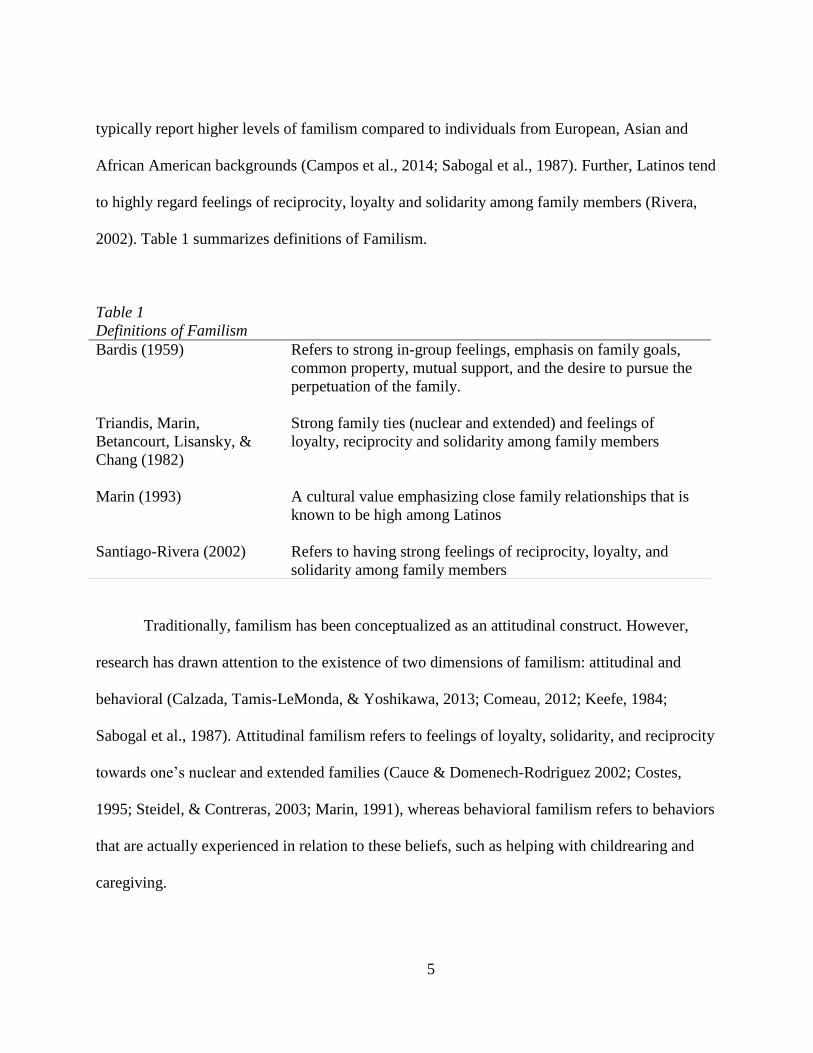
typically report higher levels of familism compared to individuals from European, Asian and
African American backgrounds (Campos et al., 2014; Sabogal et al., 1987). Further, Latinos tend
to highly regard feelings of reciprocity, loyalty and solidarity among family members (Rivera,
2002). Table 1 summarizes definitions of Familism.
Traditionally, familism has been conceptualized as an attitudinal construct. However,
research has drawn attention to the existence of two dimensions of familism: attitudinal and
behavioral (Calzada, Tamis-LeMonda, & Yoshikawa, 2013; Comeau, 2012; Keefe, 1984;
Sabogal et al., 1987). Attitudinal familism refers to feelings of loyalty, solidarity, and reciprocity
towards one’s nuclear and extended families (Cauce & Domenech-Rodriguez 2002; Costes,
1995; Steidel, & Contreras, 2003; Marin, 1991), whereas behavioral familism refers to behaviors
that are actually experienced in relation to these beliefs, such as helping with childrearing and
caregiving.
Table 1
Definitions of Familism
Bardis (1959) Refers to strong in-group feelings, emphasis on family goals,
common property, mutual support, and the desire to pursue the
perpetuation of the family.
Triandis, Marin,
Betancourt, Lisansky, &
Chang (1982)
Strong family ties (nuclear and extended) and feelings of
loyalty, reciprocity and solidarity among family members
Marin (1993)
A cultural value emphasizing close family relationships that is
known to be high among Latinos
Santiago-Rivera (2002) Refers to having strong feelings of reciprocity, loyalty, and
solidarity among family members
6
Given that research has primarily focused on attitudinal familism (Sabogal, Marin, Otero-
Sabogal, Marin, & Perez-Stable, 1987; Villarreal et al., 2005), a gap in the literature lies with the
measurement of the construct itself, where few studies have comprehensively assessed the
behavioral domain of familism (Calzada et al., 2013). The current study seeks to fill this gap by
measuring both, the attitudinal and the behavioral domains, simultaneously.
Attitudinal Familism
Attitudinal familism has been implicated in promoting both good psychological health
and psychological distress. Several studies have found an association between familism and
lower rates of substance abuse (Gil, Wagner, & Vega, 2000; Horton & Gil, 2008), lower rates of
behavioral problems (German, Gonzales, & Dumka, 2009) and better psychological adjustment
(Contreras, López, Rivera-Mosquera, Raymond-Smith, & Rothstein, 1999), while others have
found a link between familism and greater distress (Schwartz, 2010) and psychological
maladjustment (Rodriguez, Mira, Myers, Morris, & Cardoza, 2003).
Gamble and Modry-Mandell (2008) found that familism moderated the relationship
between family relations, as measured by mother-child closeness and sibling-warmth, and
emotional adjustment, indicating that mothers who reported high levels of familism have
children who appeared to be functioning better in school. Another study found a significant
correlation between family cohesion, (a proxy variable for familism) and lower psychological
distress among a nationally representative sample of U.S. Latinos. However, when examining
subgroups, this study found no association between family variables and psychological distress
for Puerto Ricans (Rivera et al., 2008), highlighting the importance of understanding variance
across Latino subgroups.
7
In another study examining familism and psychological health, social support, and stress
among pregnant women, high familism was negatively correlated with stress and pregnancy
anxiety among U.S.-born and foreign-born Latinas and European American women. Among this
sample, Latinas scored higher on familism than European American women (Campos et al.,
2008). This study suggests that familism may serve as a form of social support that may buffer
Latinos from the development of anxiety and depressive symptoms. In fact, studies show that
social support derived from relatives and friends reduces the risk of psychological distress,
particularly depression (Rivera, 2007; Rodriguez et al., 2003; Vega, Kolody, Valle, & Weir,
1991). However, a recent study using a nationally representative sample of English- and
Spanish-speaking Latinos found that the protective effect of patterns of familism is only present
in the country of origin and lost rapidly after arrival in the U.S. (Alegria et al., 2007).
Although less documented, studies on attitudinal familism also point to the negative
effects and weaker relationship between familism and psychological health. Schwartz et al
(2010) measured familism using an attitudinal familism scale among a sample of college
students and found that the overall family primacy factor was associated with both greater
wellbeing and greater distress. Distress was measured in terms of symptoms of anxiety and
depression. Further, a recent study found a weaker association between familism and
psychological health. Campos, Ullman, Aguilera, and Dunkel Schetter (2014) found an indirect
effect of attitudinal familism on better psychological health through greater closeness to family
members and greater perceived social support in a sample of university students. Although
research suggests that familism can function both as a protective and a risk factor, most empirical
studies fail to adequately measure the main dimensions of familism (attitudinal and behavioral)
8
or the link between behavioral indicators of familism and psychological health (Calzada et al.,
2013; Comeau, 2012).
Behavioral Familism
Behaviorally, familism has been observed in five tangible areas: financial support, shared
daily activities, shared living, shared childrearing, and immigration support (Calzada et al.,
2013). A recent qualitative study with Mexican and Dominican families living in the U.S. found
that, along with the benefits of actual family support (e.g., shared childrearing), Latina mothers
also struggled with the expectations and norms of familism, increasing a sense of distress
(Calzada et al., 2013). As such, familism can be a source of risk and a protective factor for low-
income, urban Latino families.
A review of the literature identified only one behavioral familism measure derived from
the 2002 General Social Survey (GSS). This measure focuses on the frequency of contact with
family members (Comeau, 2012). The frequency of in-person visits is measured by the number
of interactions with nuclear family members, while frequency of contact, which could be by
telephone, in-person, or by other means, is measured by the number of interactions with
extended families. However, looking at the frequency of contact and limiting the type of
interactions excludes other important behavioral aspects that are more reflective of the multiple
ways in which immigrants maintain meaningful relationships with their relatives. For example,
some immigrants may not be able to visit their relatives in person, depending on their legal status
and economical resources, but they may have frequent telephone contact with their relatives
residing in their country of origin. Further, frequency of contact does not adequately measure the
quality of contact. That is, frequent contact prompted by family conflict or involving frequent
9
arguments would not be conducive to favorable mental health outcomes (Rivera et al., 2008). As
such, there is a great need to expand the understanding of the behavioral dimension of familism
and its relation to attitudinal familism. Although attitudes are perceived as precursors of
behaviors, the link between attitudes and behaviors, as it relates to familism, has not been
previously studied.
Statement of Purpose
The literature review points to two key conclusions. First, familism may represent a
source of strength or weakness of psychological health for Latinos. Second, our understanding of
familism is limited by the gap in measurement development, which has focused traditionally on
the attitudinal dimension of familism, disregarding the behavioral dimension. The development
of a new measure of behavioral familism will be helpful to better understand the construct itself
and how it is experienced by individuals. Additionally, it will allow the examination of the
relationship between familism and psychological health and symptoms of distress. As such, the
purpose of this study was to develop and establish the psychometric properties of a new self-
report measure of behavioral familism and to test its relationship to attitudinal familism and
psychological distress.
The first step in this study was to develop behavioral familism companion items for an
existing attitudinal familism scale. Despite scholarly interest in familism, there are no existing
scales that assess behavioral familism or quantify how familism is experienced by individuals.
The second step in this study was to establish the reliability and validity of the new behavioral
familism scale.
10
After developing and testing the psychometrics of the existing attitudinal familism scale
and the new behavioral familism scale, the third step was to examine the discrepancy between
attitudinal and behavioral familism scales and establish whether discrepancies predict symptoms
of anxiety and depression. Research provides support for attitudinal familism as both a risk and
protective factor for Latinos. However, the influence of discrepancies between attitudinal and
behavioral familism has not been empirically studied.
11
CHAPTER TWO: METHODOLOGY
Participants
Two samples were drawn from a large university in the state of Florida. The first sample
of 109 participants was recruited from an undergraduate psychology class. The measures
described below were distributed and collected in class. The second sample of 323 participants
was recruited from an online research participation system that allows university students to self-
enroll in psychology studies. The demographics for both samples are described in the results
section.
Procedure
Participants in Sample 1 completed a paper-and-pencil survey, whereas participants in
Sample 2 completed an online version of the same survey. Participants in Sample 1 were asked
to complete the survey twice, two weeks apart, in order to examine the test-retest reliability of
the behavioral familism scale. All participants provided informed consent and received research
credits for their participation. Study procedures were reviewed and approved by the university’s
institutional Review Board. Appendix A displays the Institutional Review Board Approval letter
pertaining to this study.
Development of Behavioral Familism Scales
One of the most widely used familism scales is the Attitudinal Familism Scale (AFS;
Steidel & Contreras, 2003). This scale measures individuals’ ideal familism values while
disregarding the behavioral dimension of familism or the actual experiences of familism. Given
this measurement limitation, this study developed a compatible scale of behavioral familism to

12
address this issue. First, face and content validity were examined for each existing attitudinal
scale through expert analysis consensus. Face validity is defined as the degree to which a test
seems to measure what it purports to measure (DeVellis, 2016). Content validity examines the
items against the content domain with expert judges (DeVellis, 2016). Expert analysis was
conducted by three researchers, two of whom were bilingual (English-Spanish) and bicultural.
For the purpose of this study, no modification was made to the AFS.
The original AFS quantifies individuals’ ideal expectation of familism values. Behavioral
companion items were developed by changing modal verbs (e.g. should, would) to auxiliary (e.g.
have) or action (e.g. do, can) verbs. Overall content, direction of wording and Likert scale
responses otherwise remained the same.
In this study, the corresponding scale to the AFS is termed Behavioral-Attitudinal
Familism Scale (B-AFS). Appendix B shows the behavioral familism scale developed for this
study.
Measures
Attitudinal and Behavioral Familism Measures
Attitudinal Familism Scale (AFS; Steidel & Contreras, 2003). The Attitudinal
Familism Scale (AFS) is one of the most widely used self-report measures of attitudinal
familism. The scale is composed of 18 items that assess four main components of attitudinal
familism: familial support, familial interconnectedness, familial honor, and subjugation of self
for family. Items are answered on a 10-point Likert-type scale ranging from 1 (strongly disagree)
to 10 (strongly agree). This measure is intended to assess all aspects of attitudinal familism
building on previous research (Bardis, 1959; Sabogal et al., 1987). Through a factor analysis,
13
Steidel and Contreras (2003) found the four factors accounted for 51.23% of the variance on a
sample of 124 Latino adults. Cronbach’s alphas were .83 for the overall scale, .72 for Familial
Support, .69 for Familial Interconnectedness, .68 for Familial Honor, and .56 for Subjugation of
Self for Family. The entire AFS was used in this study without edits.
Behavioral-Attitudinal Familism Scale (B-AFS). The B-AFS consists of 18 companion
items developed from the original version of the Attitudinal Familism Scale (Steidel &
Contreras, 2003). Items were answered in a 5-point Likert-type scale, ranging from 1 (strongly
disagree) to 5 (strongly agree). The internal consistency and test-retest reliability for this new
instrument is reported in the results section.
Convergent Validity Measures
Familism Scale (FS; Sabogal et al., 1987). The FS was utilized to establish the
convergent validity for the AFS. The modified version used in this study consists of 12 items that
measure three factors: Familial Obligations, Perceived Support from the Family, and Family as
Referents. Items were answered in a 5-point Likert-type scale, ranging from 1 (strongly disagree)
to 5 (strongly agree). Sabogal et al. (1987) conducted a factor analysis with a sample of 452
Latinos compared to 227 non-Latino Whites and found that the three factors accounted for
48.4% of the variance. Cronbach’s alphas were.76 for Familial Obligations, .70 for Perceived
Support from the Family, and .64 for Family as Referents.
Behavioral-Familism Scale (B-FS). The B-FS was used to establish the convergent
validity for the B-AFS. It consists of 12 companion items developed from the original version of
the FS. Items were answered in a 5-point Likert-type scale, ranging from 1 (strongly disagree) to
5 (strongly agree). Both the FS and B-FS are displayed in Appendix C. The psychometric
14
properties of these measures are reported in a monograph by Nicasio (2016) which is found in
Appendix D.
Multidimensional Scale of Perceived Social Support (MSPSS; Zimet, Dahlem,
Zimet, Farley, 1988). The MSPSS is a 12-item self-report scale that measures three sources of
support: 1) Family, 2) Friends, and 3) Significant Other. Items were responded using a 7-point
Likert scale from Very Strongly Disagree (1) to Very Strongly Agree (7). Zimet et al. (1988)
reported high to adequate Cronbach’s alpha scores for the total scale (.88) and the Family (.87),
Friends (.85) and Significant Other subscales (.91).
Family Environment Scale (FES; Moos & Moos, 1986). The FES measures family
social environment. The total scale consists of 90 items and is organized into three dimensions:
relationships, personal growth, and system maintenance. The relationship dimension comprises
three subscales (cohesion, expressiveness and conflict), each containing nine true-false items. In
this study, two subscales were used: Family Cohesion and Family Conflict. Moos and Moos
(1986) reported low to adequate Cronbach’s alphas for the subscales, ranging from .61 to .78.
Divergent Validity Measures
Marlowe-Crowne Social Desirability Scale – Short Form (MCSDS-SF); Zook &
Sipps, 1985). The MCSDS consists of 33 true-false items that measures social desirability
response tendencies (Crowne & Marlow, 1960). The MCSDS-SF used in this study contains 13
true-false items. Zook and Sipps (1985) reported adequate Cronbach’s alpha scores for the
MCSDS short form (.74).
Stephenson Multigroup Acculturation Scale (SMAS; Stephenson, 2000), consists of
32 items assessing behavioral and attitudinal aspects of acculturation that can be applied across

15
ethnic groups. Items were responded using a four-point Likert-type scale where 1 = True, 2 =
Partly True, 3 = Partly False, and 4 = False. The SMAS comprises two subscales: ethnic group
identification (EGIS) and dominant group identification (DGIS). Stephenson (2000) reported
high to adequate Cronbach’s alphas for EGIS (.94) and DGIS (.75).
Outcome Measures
Beck Depression Inventory (BDI-II; Beck, Steer, & Brown, 1996). The BDI-II is a 21-
item self-report inventory that measures depressive symptoms experienced in the past two
weeks. Responses to each item ranged from 0 to 3 according to the severity of the statement.
Previous studies have shown internal consistency scores of Cronbach’s alpha ranging from .91 to
.93 in college student samples (Beck et al., 1996; Dozois, Dobson, & Ahnberg, 1998). Further, a
recent study using a sample of Latinos and non-Latino Whites evidenced adequate internal
consistency for the BDI-II, reporting Cronbach’s alphas ≥ .82 for both groups (Contreras et al.,
2004).
Beck Anxiety Inventory (BAI; Beck, Epstein, Brown, & Steer, 1988; Beck & Steer,
1993). The BAI is a 21-item self-report inventory that measures anxiety symptoms experienced
in the past two weeks. Each item is rated on a 4-point scale ranging from 0 (Not at all) to 3
(Severely - I could barely stand it). Beck et al. (1988) reported a high Cronbach’s alpha score for
the total BAI scale (.92). Further, a recent study using a sample of Latinos and non-Latino
Whites evidenced adequate internal consistency for the BAI reporting Cronbach’s alphas ≥ .88
for both groups (Contreras et al., 2004).
16
Demographic Questions
Participants reported demographic information, which included race, ethnicity, age,
gender, generational status, level of education, income, marital status, employment, and
indicators of exposure to the U.S. culture (e.g. country of birth, years living in the U.S., language
spoken at home). Table 2 displays the demographic characteristics by samples. Appendix E
shows the demographic questionnaire used in this study.
Data Quality Check Items
There is considerable debate about the veracity of participants completing online surveys.
Researchers often are concerned that online participants may be inattentive to instructions,
respond randomly or otherwise distort their responses to items and therefore provide poor-quality
data (Chandler, Mueller, & Paolacci, 2014). Recent research suggests the use of validity
measures to identify questionable response behaviors (Smith, Roster, Golden, & Albaum,
2016a), such as lack of attention to instructions and items. Inattentiveness is identified when
participants provide incorrect responses to obvious or preposterous questions requiring specific
responses (e.g., Please answer “yes” to this question) or questions that require existing
knowledge (e.g., “Obama is the first American President”) (Smith, Roster, Golden, & Albaum,
2016b). To ensure quality of data, three indicators or validity response items were distributed
throughout the survey. Therefore, the data from participants who answered one or more of the
three validity response items incorrectly were excluded from analyses. The three response
validity items were: Obama was the first American President? (Yes/No), The 911 terrorist
attacks happened in South America? (Yes/No), and How are you feeling today? Please ignore
how you are feeling today and instead check only the “All of the above” choice.
17
Statistical Analyses
Data were analyzed using Statistical Package for Social Sciences (SPSS) version 23
(IBM, 2015). Prior to analyses, data from each sample were inspected separately for data entry
accuracy, missing values, outliers, and violation of assumptions of normality following the steps
outlined by Tabachnick and Fidell (2013). In both samples, missing data ranged from 0 – 2.8%
across all variables, except for immigrant generational status (0.9 – 4.6%) and income (3.1 -
9.2%). Participants’ data with missing values were eliminated from analyses using listwise
deletion.
Demographic Characteristics
Differences between samples and racial/ethnic groups were computed when appropriate.
Chi-square tests were used for categorical data and independent samples t tests were used for
continuous variables.
Test-retest Reliability Analyses
To examine whether the scales and subscales scores were consistent over time,
participants in Sample 1 (Psychology Class) completed two pencil-and-paper questionnaires one
week apart. Although Pearson’s Product Moment Correlation coefficient [Pearson’s (r)] is
typically used to quantify test-retest reliability, researchers argue its limitation in detecting
systematic errors inherent in the applied measurement (Vaz, Falkmer, Passmore, Parsons, &
Andreou, 2013; Weir, 2005). Increasingly, Intraclass correlation coefficient (ICC) is often used
in place of or in combination with Pearson’s r to provide a more in-depth evaluation of the test-
retest reliability. The ICC quantifies both the consistency in performance from test to retest
18
(within-subject change), and change in means (group level change) over time (Chicchetti, 1994;
Lexell & Downham, 2005). As a result, the test-retest reliability was evaluated two ways:
Pearson’s Product Moment correlations and Intraclass correlation coefficients.
Internal Consistency Reliability Analyses
Cronbach’s alpha coefficients were computed to estimate the internal consistency
reliability of both the attitudinal and their corresponding behavioral familism scales using data
from Sample 2 (Online Survey). Cronbach’s alpha coefficients equal to or greater than .70 are
typically considered acceptable (Nunally, 1978).
Convergent Validity Analyses
Convergent validity was examined using correlation analyses and when appropriate
variables were transformed. First, convergent validity was evaluated between the attitudinal
(AFS) and behavioral familism scales (B-AFS) using data from Sample 2. Convergent validity
also was examined with the Multidimensional Scale of Perceived Social Support (MSPSS;
Zimet, Dahlem, Zimet, Farley, 1988) and the Family Environment Scale (FES; Moos & Moos,
1986). The MSPSS and FES have been used in previous studies to determine the convergent
validity of familism scales.
Divergent Validity Analyses
Divergent validity was examined using correlation analyses and, when appropriate,
variables were transformed. The divergent validity of the familism scales was examined using
19
the Marlowe-Crowne Social Desirability Scale – Short Form (MCSDS-SF; Zook & Sipps, 1985)
and the Stephenson Multigroup Acculturation Scale (SMAS; Stephenson, 2000).
Discrepancy Analyses
Historically, discrepancy analysis has relied on the simple difference between two
measures or indices. However, researchers have long noted that the traditional way of measuring
discrepancies with difference scores suffer from methodological flaws (Cronbach & Furby,
1970; Edwards, 1994b; Tisak & Smith, 1994). The major concerns of simple difference scores
include reduced reliability, ambiguity, confounded effects, untested constraints, and dimensional
reduction (Cronbach & Furby, 1970; Edwards, 2001; Edwards, 1994a).
To circumvent methodological problems with simple difference scores, emerging
methods have been proposed. Both, polynomial regression and response surface analyses
mitigate the methodological problems with discrepancy scores and provide a critical view of the
relationships between combined predictor variables and the outcome variable (Edwards, 2001;
Edwards, 1994c; Tisak & Smith, 1994). For instance, polynomial regression sustains the
conceptual integrity of the predictor variables and treats discrepancies as statements of
hypotheses to be tested empirically (Edwards, 2001). Essentially, polynomial regression uses the
component measures that constitute the difference and higher order-terms (i.e. squares and
products of the squares) instead of just a simple difference. This approach allows a more
comprehensive view of the relationships of an outcome variable with difference scores creating
new opportunities for theory development (Edwards, 1994a). Moreover, response surface
methodology allows for a three dimensional examination of the relationship between the
combined predictor variables and an outcome variable. This is an extension to the two-
20
dimensional relationship evaluated through regression analyses. Therefore, response surface
analyses provide more information about how the combinations of predictor variables may affect
an outcome variable.
Further, recent empirical studies have elucidated the benefits of using polynomial
regression and response surface modeling over traditional computations of difference scores. For
example, a study examining the relationship between two sources of work support and affective
commitment illustrated the confounding effect of discrepancy scores on each of the predictor
variables as related to the outcome measure. Further, the independent effect of each predictor
variable on the outcome variable would otherwise be obscured with traditional difference cores.
Another study assessing body image dissatisfaction demonstrated data constrains imposed by the
use of difference scores. For instance, the difference in the proportion of variance varied from
2.7% to 17.7% across the two measures. The study concluded that the use of discrepancy scores
can result in inaccurate conclusions and mis-estimation of the magnitude of the relationship
between the two predictors and the outcome variable (Cafri, van den Berg, & Brannick, 2010).
Following this polynomial regression and response surface analyses were used here to
evaluate the overarching hypothesis that discrepancy between attitudinal and behavioral familism
predict psychological distress. Data from Latinos in Sample 2 were used to examine the
discrepancy between the familism scales and outcome variables as related to depression and
anxiety. Discrepancy analyses were computed following the steps outlined by Shanock et al.
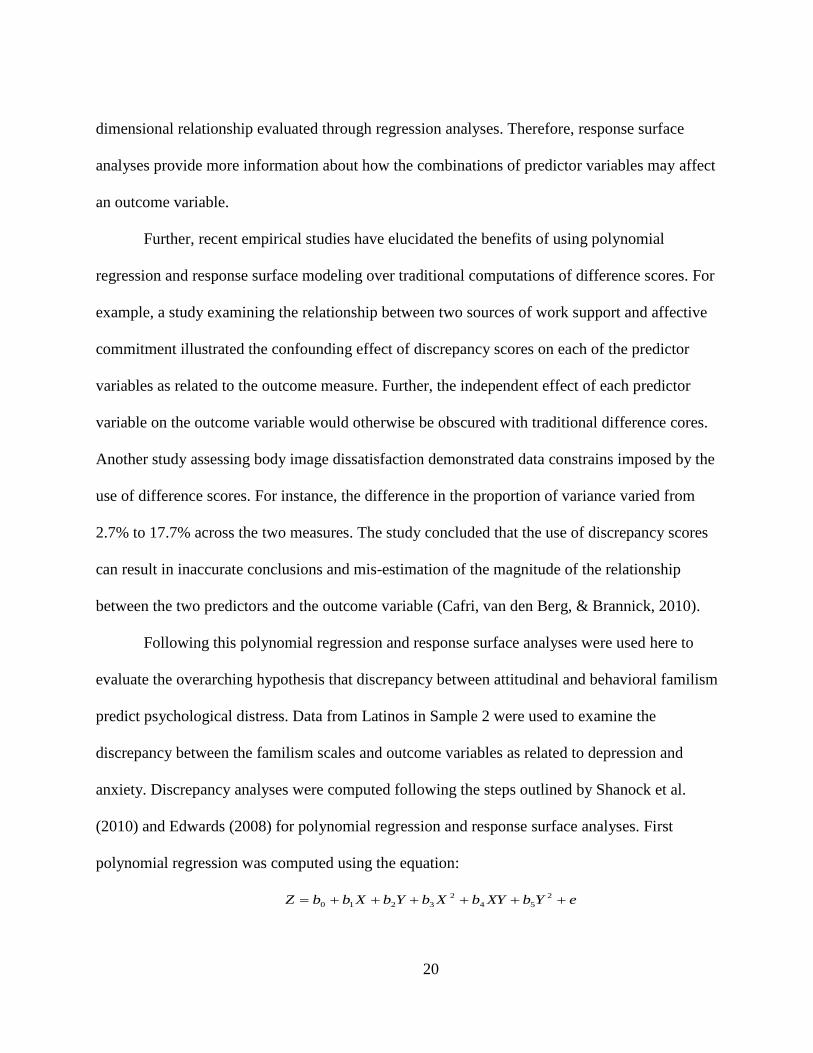
(2010) and Edwards (2008) for polynomial regression and response surface analyses. First
polynomial regression was computed using the equation:
eYbXYbXbYbXbbZ 2
54
2
3210
21
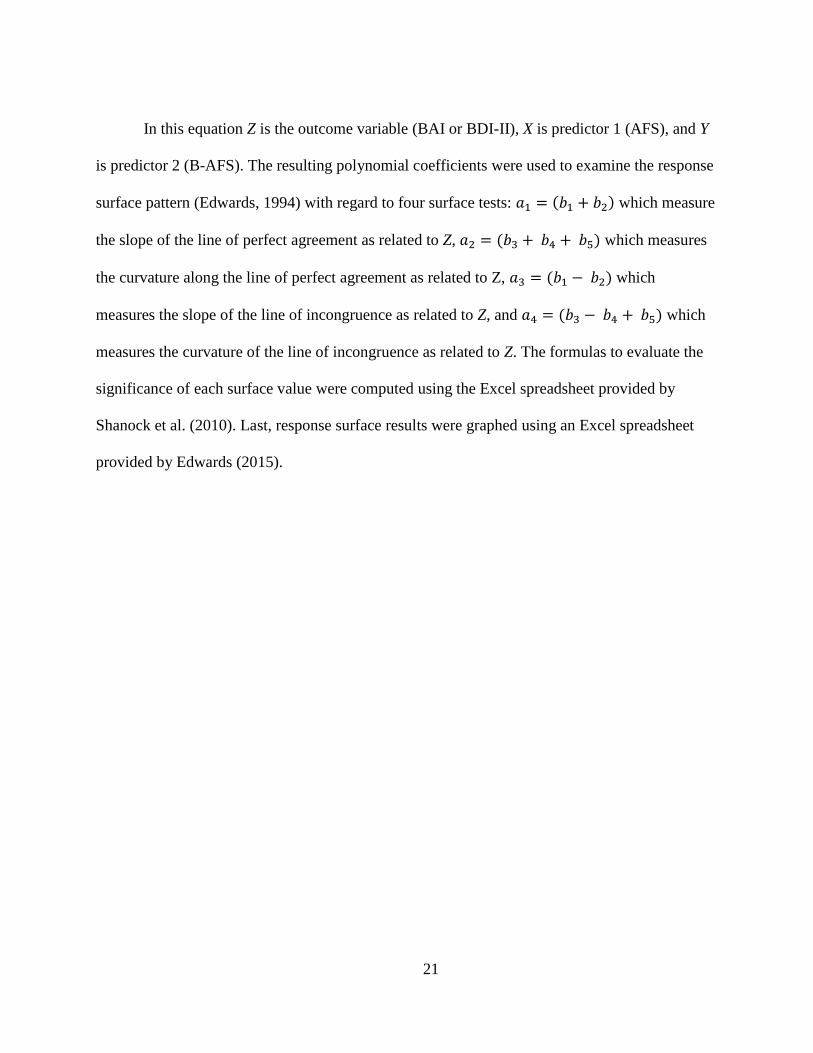
In this equation Z is the outcome variable (BAI or BDI-II), X is predictor 1 (AFS), and Y
is predictor 2 (B-AFS). The resulting polynomial coefficients were used to examine the response
surface pattern (Edwards, 1994) with regard to four surface tests: 𝑎1 = (𝑏1 + 𝑏2) which measure
the slope of the line of perfect agreement as related to Z, 𝑎2 = (𝑏3 + 𝑏4 + 𝑏5) which measures
the curvature along the line of perfect agreement as related to Z, 𝑎3 = (𝑏1 − 𝑏2) which
measures the slope of the line of incongruence as related to Z, and 𝑎4 = (𝑏3 − 𝑏4 + 𝑏5) which
measures the curvature of the line of incongruence as related to Z. The formulas to evaluate the
significance of each surface value were computed using the Excel spreadsheet provided by
Shanock et al. (2010). Last, response surface results were graphed using an Excel spreadsheet
provided by Edwards (2015).
22
CHAPTER THREE: RESULTS
Demographic Characteristics
Sample 1
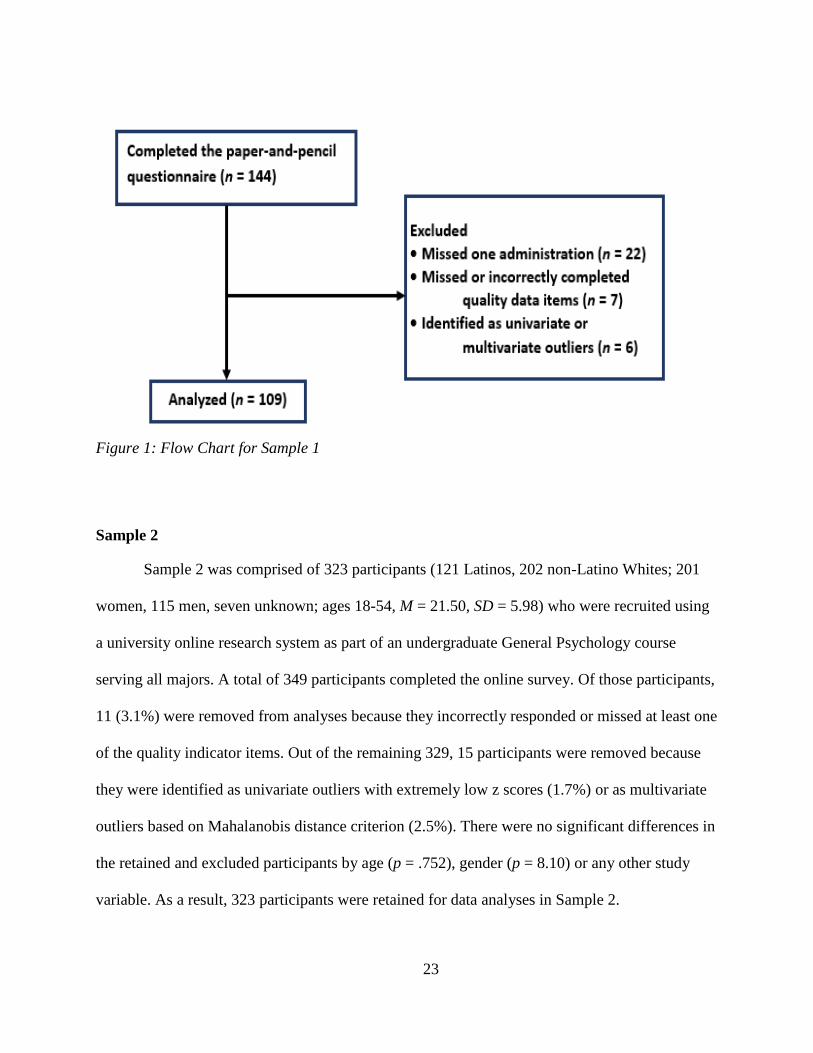
Sample 1 was comprised of 109 participants (47 Latinos, 62 non-Latino Whites; 80
women, 28 men, one unknown; ages 18-28, M = 21.34, SD = 2.05) who were recruited in-person
from an undergraduate psychology elective course. A total of 144 participants completed the
paper-and-pencil version of the survey at time 1 and time 2. Of those participants, 22 (15.3%)
mismatched cases were removed from analyses. Additionally, seven (4.9%) participants were
removed from analyses because they incorrectly responded or missed at least one of the quality
indicator items. Out of the remaining 115, six participants were removed because they were
identified as univariate outliers with extremely low z scores (2.7%) or as multivariate outliers
based on Mahalanobis distance criterion (1.3%). There were no significant differences between
the retained and excluded participants in age (p = .163), gender (p = .826), race/ethnicity (p =
.150) or other study variables. As a result, 109 matched cases were retained for data analyses in
sample 1. Figure 1 displays the flow chart for Sample 1.
23
Figure 1: Flow Chart for Sample 1
Sample 2
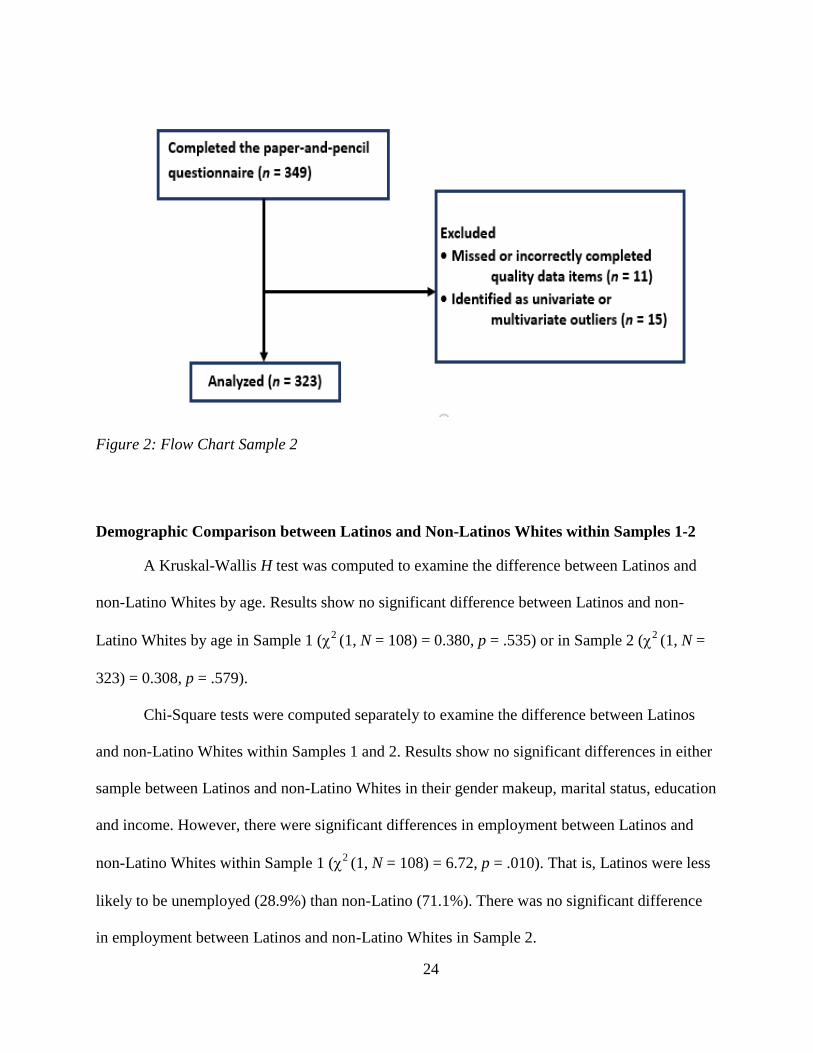
Sample 2 was comprised of 323 participants (121 Latinos, 202 non-Latino Whites; 201
women, 115 men, seven unknown; ages 18-54, M = 21.50, SD = 5.98) who were recruited using
a university online research system as part of an undergraduate General Psychology course
serving all majors. A total of 349 participants completed the online survey. Of those participants,
11 (3.1%) were removed from analyses because they incorrectly responded or missed at least one
of the quality indicator items. Out of the remaining 329, 15 participants were removed because
they were identified as univariate outliers with extremely low z scores (1.7%) or as multivariate
outliers based on Mahalanobis distance criterion (2.5%). There were no significant differences in
the retained and excluded participants by age (p = .752), gender (p = 8.10) or any other study
variable. As a result, 323 participants were retained for data analyses in Sample 2.
24
Figure 2: Flow Chart Sample 2
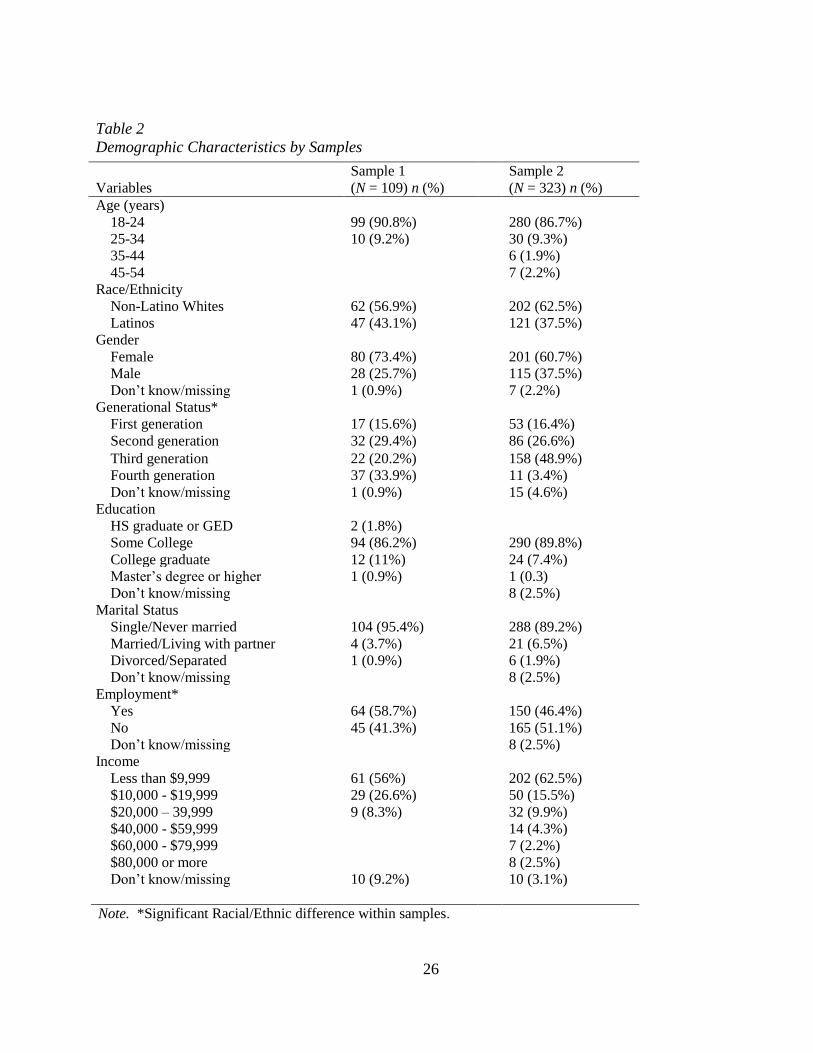
Demographic Comparison between Latinos and Non-Latinos Whites within Samples 1-2
A Kruskal-Wallis H test was computed to examine the difference between Latinos and
non-Latino Whites by age. Results show no significant difference between Latinos and non-
Latino Whites by age in Sample 1 (2
(1, N = 108) = 0.380, p = .535) or in Sample 2 (2
(1, N =
323) = 0.308, p = .579).
Chi-Square tests were computed separately to examine the difference between Latinos
and non-Latino Whites within Samples 1 and 2. Results show no significant differences in either
sample between Latinos and non-Latino Whites in their gender makeup, marital status, education
and income. However, there were significant differences in employment between Latinos and
non-Latino Whites within Sample 1 (2
(1, N = 108) = 6.72, p = .010). That is, Latinos were less
likely to be unemployed (28.9%) than non-Latino (71.1%). There was no significant difference
in employment between Latinos and non-Latino Whites in Sample 2.
25
There were significant differences between Latinos and non-Latino Whites by immigrant
generational status within both samples (2
(3, N = 108) = 45.55, p < .001 and 2 (3, N = 308) =
129.65, p = .000). Latinos were more likely to self-identify as first- and second-generation
immigrant whereas non-Latino Whites were more likely to self-identify as third- and fourth-
generation immigrant within each sample.
In both samples, there was a significant difference between Latinos and non-Latino
Whites in terms of having been diagnosed with a mental health disorder (2
(1, N = 108) = 6.23,
p = .013 and 2
(1, N = 315) = 10.49, p = .001). In both Samples 1 and 2, Latinos (13.3% and
17.6%, respectively) were less likely to report that they had ever been diagnosed with a mental
health condition compared to non-Latino Whites (86.7% and 82.4%, respectively).
26
Table 2
Demographic Characteristics by Samples
Variables
Sample 1
(N = 109) n (%)
Sample 2
(N = 323) n (%)
Age (years)
18-24
25-34
35-44
45-54
Race/Ethnicity
99 (90.8%)
10 (9.2%)
280 (86.7%)
30 (9.3%)
6 (1.9%)
7 (2.2%)
Non-Latino Whites 62 (56.9%) 202 (62.5%)
Latinos 47 (43.1%) 121 (37.5%)
Gender
Female 80 (73.4%) 201 (60.7%)
Male 28 (25.7%) 115 (37.5%)
Don’t know/missing 1 (0.9%) 7 (2.2%)
Generational Status*
First generation 17 (15.6%) 53 (16.4%)
Second generation 32 (29.4%) 86 (26.6%)
Third generation
Fourth generation
22 (20.2%)
37 (33.9%)
158 (48.9%)
11 (3.4%)
Don’t know/missing 1 (0.9%) 15 (4.6%)
Education
HS graduate or GED 2 (1.8%)
Some College 94 (86.2%) 290 (89.8%)
College graduate 12 (11%) 24 (7.4%)
Master’s degree or higher 1 (0.9%) 1 (0.3)
Don’t know/missing 8 (2.5%)
Marital Status
Single/Never married 104 (95.4%) 288 (89.2%)
Married/Living with partner 4 (3.7%) 21 (6.5%)
Divorced/Separated 1 (0.9%) 6 (1.9%)
Don’t know/missing 8 (2.5%)
Employment*
Yes 64 (58.7%) 150 (46.4%)
No 45 (41.3%) 165 (51.1%)
Don’t know/missing 8 (2.5%)
Income
Less than $9,999 61 (56%) 202 (62.5%)
$10,000 - $19,999 29 (26.6%) 50 (15.5%)
$20,000 – 39,999 9 (8.3%) 32 (9.9%)
$40,000 - $59,999 14 (4.3%)
$60,000 - $79,999 7 (2.2%)
$80,000 or more
Don’t know/missing
10 (9.2%)
8 (2.5%)
10 (3.1%)
Note. *Significant Racial/Ethnic difference within samples.
27
Test-retest Reliability of the Attitudinal and Behavioral Familism Scales
The test-retest reliability of the AFS (Steidel and Contreras, 2003) and its corresponding
B-AFS was examined using Sample 1 for both racial/ethnic groups combined. Analyses were not
performed by racial/ethnic group separately due to an insufficient number of Latinos in this
sample. Participants completed the scales twice one week apart. Correlation analyses were
conducted to examine the test-retest reliability between Time 1 and Time 2 administrations. The
following qualitative indicators were used to describe the size of the correlation coefficients, as
suggested by Evans (1996): very high (.80 to 1.00), high (.60 to .79), moderate (.40 to .59), low
(.20 to .39), and very low (.00 to .19). Intraclass Coefficients were also computed to examine
test-retest reliability. The following qualitative indicators were used to describe the intraclass
coefficients (ICC) scores: excellent (.75 to 1.00), good (.60 to .74), fair (.40 to .59), and poor
(less than .40) (Cichetti, 1994).
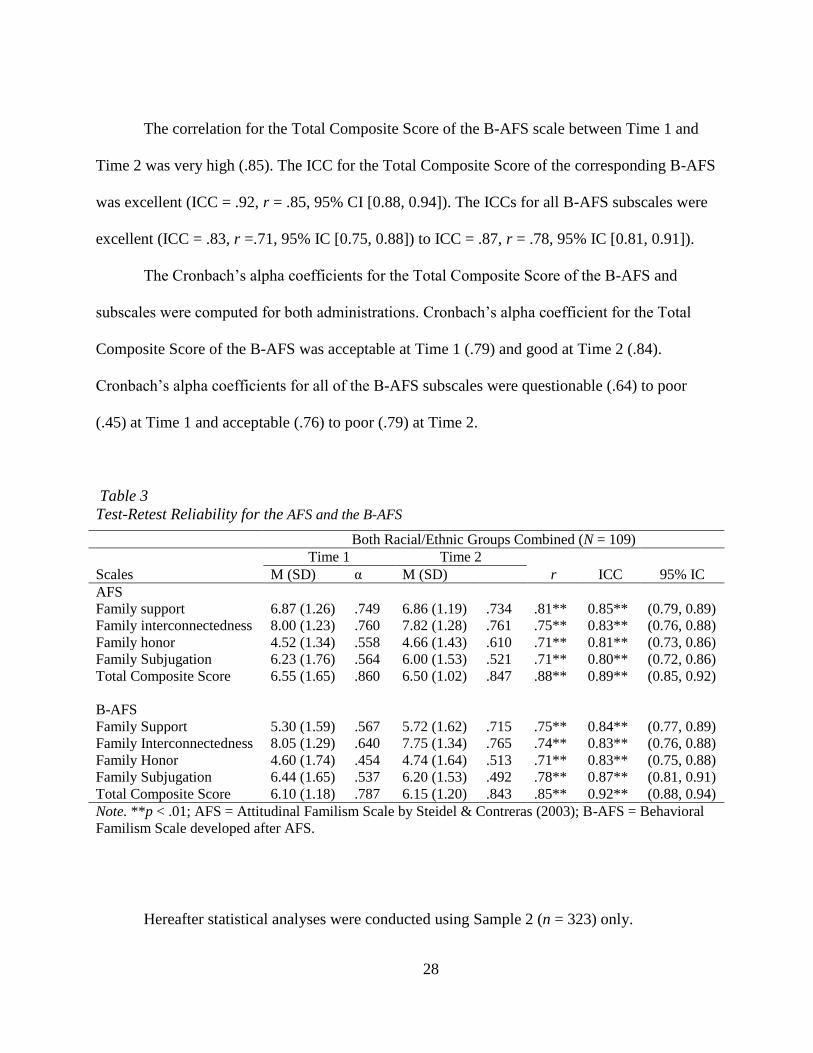
Table 3 shows the results of the test-retest reliability analyses for the AFS and the B-
AFS. The correlation for the Total Composite Score of the AFS between Time 1 and Time 2 was
high (.74). The correlations for all the AFS subscales were very high (.81) to high (.71). The ICC
for the Total Composite Score of the AFS was excellent (ICC = .89, r = .88, 95% CI [0.85,
0.92]). The ICC for all AFS subscales were excellent (ICC = .80, r = .71, 95% IC [0.72, 0.86]) to
.85 (ICC = 85, r = .81, 95% IC [0.79, 0.89]).
The Cronbach’s alpha coefficients for the Total Composite Score of the AFS and
subscales were computed for both administrations. Cronbach’s alpha coefficients for the Total
Composite Score of the AFS were good for both Time 1 (.86) and Time 2 (.85). Cronbach’s
alpha coefficients for all of the AFS subscales were acceptable (.76) to poor (.56) at Time 1 and
also acceptable (.76) to poor (.52) at Time 2.
28
The correlation for the Total Composite Score of the B-AFS scale between Time 1 and
Time 2 was very high (.85). The ICC for the Total Composite Score of the corresponding B-AFS
was excellent (ICC = .92, r = .85, 95% CI [0.88, 0.94]). The ICCs for all B-AFS subscales were
excellent (ICC = .83, r =.71, 95% IC [0.75, 0.88]) to ICC = .87, r = .78, 95% IC [0.81, 0.91]).
The Cronbach’s alpha coefficients for the Total Composite Score of the B-AFS and
subscales were computed for both administrations. Cronbach’s alpha coefficient for the Total
Composite Score of the B-AFS was acceptable at Time 1 (.79) and good at Time 2 (.84).
Cronbach’s alpha coefficients for all of the B-AFS subscales were questionable (.64) to poor
(.45) at Time 1 and acceptable (.76) to poor (.79) at Time 2.
Table 3
Test-Retest Reliability for the AFS and the B-AFS
Hereafter statistical analyses were conducted using Sample 2 (n = 323) only.
Both Racial/Ethnic Groups Combined (N = 109)
Time 1 Time 2
Scales M (SD) α M (SD) r ICC 95% IC
AFS
Family support
6.87 (1.26)
.749
6.86 (1.19)
.734
.81**
0.85**
(0.79, 0.89)
Family interconnectedness 8.00 (1.23) .760 7.82 (1.28) .761 .75** 0.83** (0.76, 0.88)
Family honor 4.52 (1.34) .558 4.66 (1.43) .610 .71** 0.81** (0.73, 0.86)
Family Subjugation 6.23 (1.76) .564 6.00 (1.53) .521 .71** 0.80** (0.72, 0.86)
Total Composite Score 6.55 (1.65) .860 6.50 (1.02) .847 .88** 0.89** (0.85, 0.92)
B-AFS
Family Support 5.30 (1.59) .567 5.72 (1.62) .715 .75** 0.84** (0.77, 0.89)
Family Interconnectedness 8.05 (1.29) .640 7.75 (1.34) .765 .74** 0.83** (0.76, 0.88)
Family Honor 4.60 (1.74) .454 4.74 (1.64) .513 .71** 0.83** (0.75, 0.88)
Family Subjugation 6.44 (1.65) .537 6.20 (1.53) .492 .78** 0.87** (0.81, 0.91)
Total Composite Score 6.10 (1.18) .787 6.15 (1.20) .843 .85** 0.92** (0.88, 0.94)
Note. **p < .01; AFS = Attitudinal Familism Scale by Steidel & Contreras (2003); B-AFS = Behavioral
Familism Scale developed after AFS.
29
Internal Consistency of the Attitudinal and Behavioral Familism Scales
The internal consistency reliability of the attitudinal familism scales and their
corresponding behavioral familism scales were examined in Sample 2 with both racial/ethnic
groups combined and separately. Cronbach’s alpha coefficients were computed to test the
internal consistency reliability of the AFS and its corresponding behavioral scale (B-AFS). The
following qualitative indicators were used to describe Cronbach’s alpha numerical scores:
excellent (0.90 to 1.00), good (0.89 to 0.80), acceptable (0.79 to 0.70), questionable (0.69 to .60),
poor (less than 0.59). Cronbach’s alpha coefficients were also examined for item removal and in
no case was a scale found to be significantly improved with this approach. Appendix F displays
the skewness and kurtosis values for the AFS and B-FS.
AFS and B-AFS with both Racial/Ethnic Groups Combined
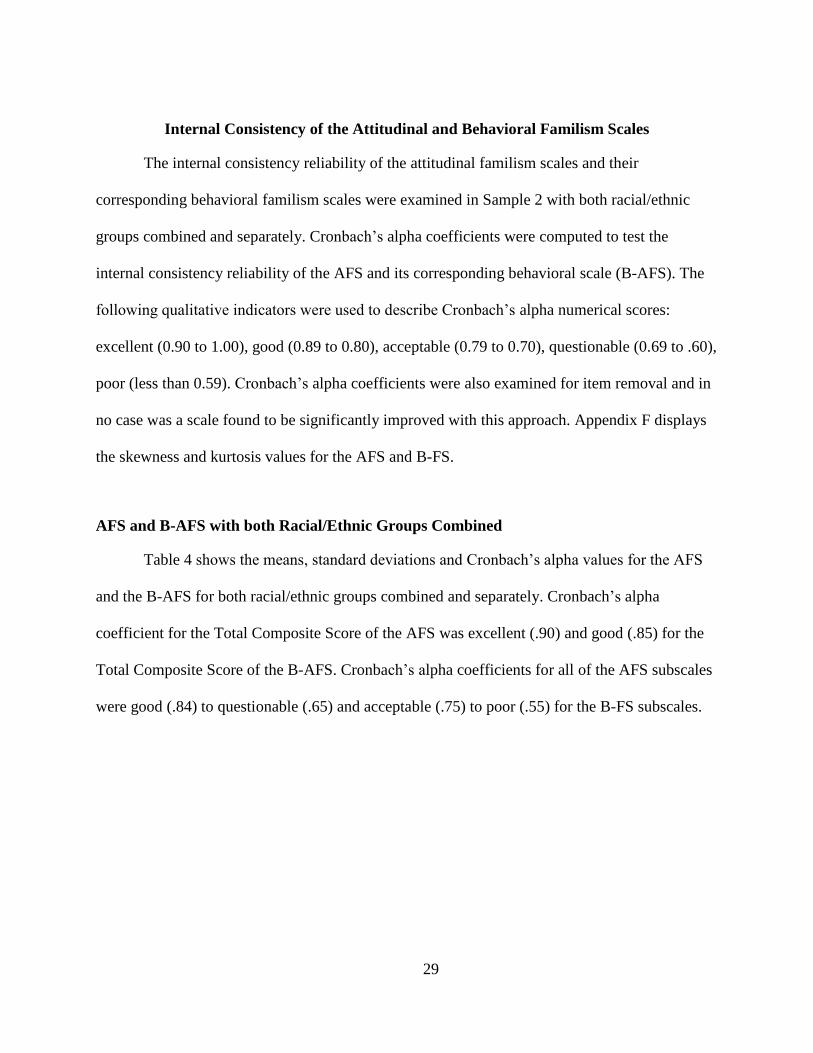
Table 4 shows the means, standard deviations and Cronbach’s alpha values for the AFS
and the B-AFS for both racial/ethnic groups combined and separately. Cronbach’s alpha
coefficient for the Total Composite Score of the AFS was excellent (.90) and good (.85) for the
Total Composite Score of the B-AFS. Cronbach’s alpha coefficients for all of the AFS subscales
were good (.84) to questionable (.65) and acceptable (.75) to poor (.55) for the B-FS subscales.
30
Table 4
Means, Standard Deviations and Cronbach’s Alpha Coefficients for the AFS
and the B-AFS
Scales
Both Racial/Ethnic Groups Combined
(N = 323)
# of
items
M(SD)
α
AFS
Family support 6 6.82 (1.54) .821
Family interconnectedness 5 7.90 (1.51) .838
Family honor 4 4.62 (1.64) .648
Subjugation of self for family 3 6.48 (1.97) .723
Total Composite Score
18 6.58 (1.34) .895
B-AFS
Family support 6 5.43 (1.91) .707
Family interconnectedness 5 7.87 (1.56) .722
Family honor 4 4.52 (1.90) .551
Subjugation of self for family 3 6.58 (1.79) .554
Total Composite Score 18 6.10 (1.44) .853 Note. AFS = Attitudinal Familism Scale by Steidel & Contreras (2003); B-AFS =
Behavioral Familism Scale developed for this study.
AFS and B-AFS by Racial/Ethnic Group.
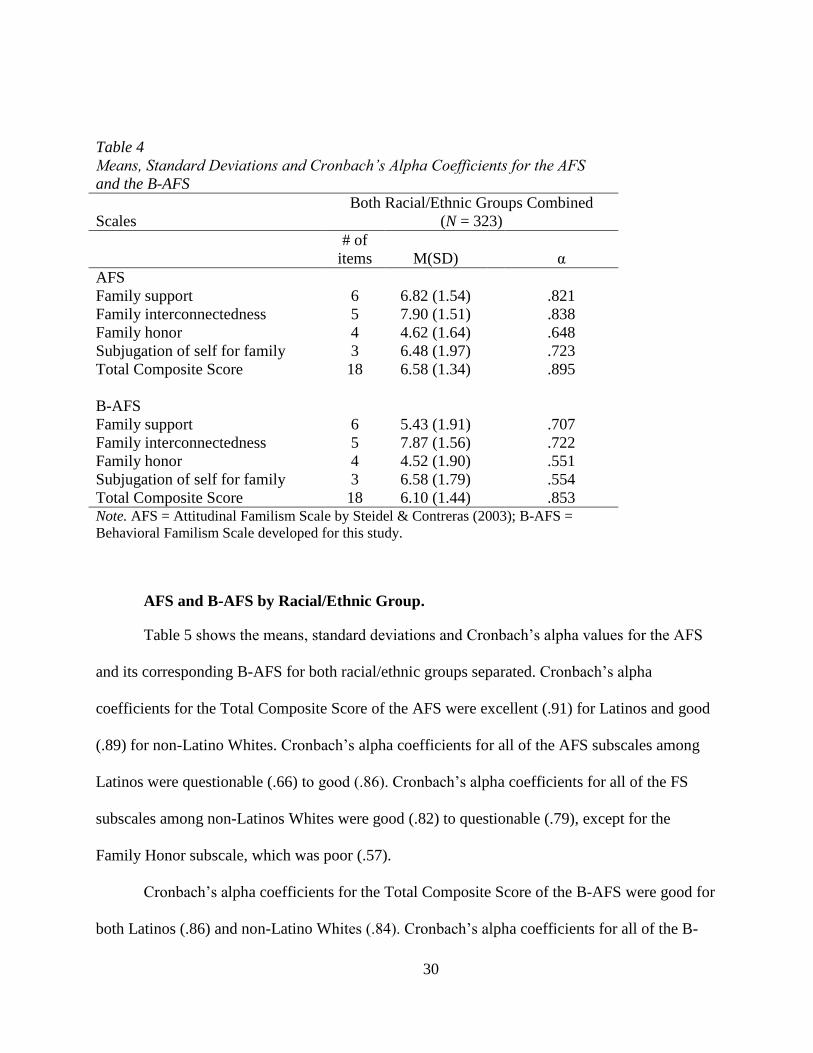
Table 5 shows the means, standard deviations and Cronbach’s alpha values for the AFS
and its corresponding B-AFS for both racial/ethnic groups separated. Cronbach’s alpha
coefficients for the Total Composite Score of the AFS were excellent (.91) for Latinos and good
(.89) for non-Latino Whites. Cronbach’s alpha coefficients for all of the AFS subscales among
Latinos were questionable (.66) to good (.86). Cronbach’s alpha coefficients for all of the FS
subscales among non-Latinos Whites were good (.82) to questionable (.79), except for the
Family Honor subscale, which was poor (.57).
Cronbach’s alpha coefficients for the Total Composite Score of the B-AFS were good for
both Latinos (.86) and non-Latino Whites (.84). Cronbach’s alpha coefficients for all of the B-
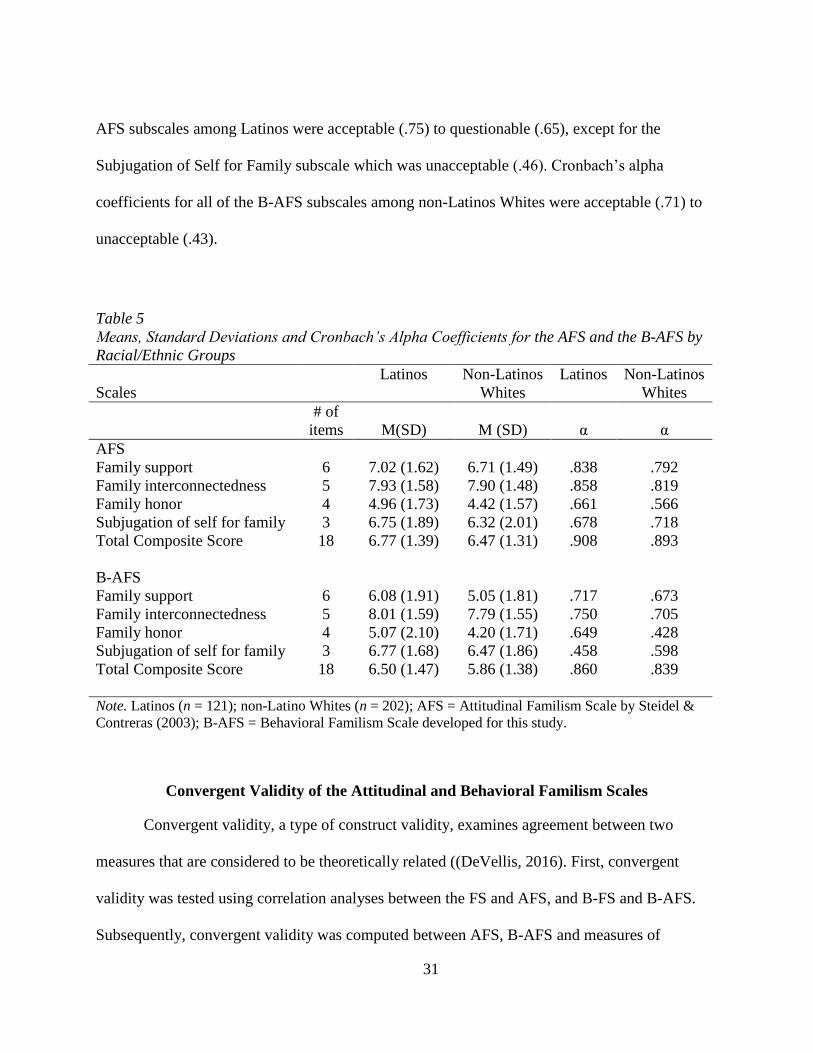
31
AFS subscales among Latinos were acceptable (.75) to questionable (.65), except for the
Subjugation of Self for Family subscale which was unacceptable (.46). Cronbach’s alpha
coefficients for all of the B-AFS subscales among non-Latinos Whites were acceptable (.71) to
unacceptable (.43).
Convergent Validity of the Attitudinal and Behavioral Familism Scales
Convergent validity, a type of construct validity, examines agreement between two
measures that are considered to be theoretically related ((DeVellis, 2016). First, convergent
validity was tested using correlation analyses between the FS and AFS, and B-FS and B-AFS.
Subsequently, convergent validity was computed between AFS, B-AFS and measures of
Table 5
Means, Standard Deviations and Cronbach’s Alpha Coefficients for the AFS and the B-AFS by
Racial/Ethnic Groups
Scales
Latinos
Non-Latinos
Whites
Latinos
Non-Latinos
Whites
# of
items
M(SD)
M (SD)
α
α
AFS
Family support 6 7.02 (1.62) 6.71 (1.49) .838 .792
Family interconnectedness 5 7.93 (1.58) 7.90 (1.48) .858 .819
Family honor 4 4.96 (1.73) 4.42 (1.57) .661 .566
Subjugation of self for family 3 6.75 (1.89) 6.32 (2.01) .678 .718
Total Composite Score 18 6.77 (1.39) 6.47 (1.31) .908 .893
B-AFS
Family support 6 6.08 (1.91) 5.05 (1.81) .717 .673
Family interconnectedness 5 8.01 (1.59) 7.79 (1.55) .750 .705
Family honor 4 5.07 (2.10) 4.20 (1.71) .649 .428
Subjugation of self for family 3 6.77 (1.68) 6.47 (1.86) .458 .598
Total Composite Score 18 6.50 (1.47) 5.86 (1.38) .860 .839
Note. Latinos (n = 121); non-Latino Whites (n = 202); AFS = Attitudinal Familism Scale by Steidel &
Contreras (2003); B-AFS = Behavioral Familism Scale developed for this study.
32
perceived social support and family environment. Perceived social support was examined using
the MSPSS (Zimet, Dahlem, Zimet, & Farley, 1988). The MSPSS measures participants’
perceptions of social support from family, friends, and a significant other. Family environment
was measured using two subscales of the FES (Moos & Moos, 1976). The convergent validity
was computed with both racial/ethnic groups combined and separately. The following qualitative
indicators were used to describe the size of the correlation coefficients: very high (.80 to 1.00),
high (.60 to .79), moderate (.40 to .59), low (.20 to .39), and very low (.00 to .19), as suggested
by Evans, (1996). Appendix G displays the means and standard deviations of the MSPSS and the
FES subscales.
Familism Scales
Attitudinal and Behavioral Familism Scales.
Table 6 displays the correlations between the AFS, B-AFS, FS, and B-FS for both
racial/ethnic groups combined. The correlations between the FS and the AFS and between the B-
FS and the B-AFS were high positive: r = .69, p < .01 and r = .67, p < .01, respectively.
Correlations with the FS were moderate positive for both the B-FS (r = .56, p < .01) and the B-
AFS (r = .53, p < .01). However, the correlation with the AFS was high positive with B-AFS (r
= .34, p < .01) and moderate positive with B-FS (r = .49, p < .01).
33
Correlations between the Familism Scales by Racial/Ethnic Groups.
Table 7 displays the correlations between FS, B-FS, AFS, and B-AFS for both
racial/ethnic groups separately. The correlations between the FS and AFS were high positive for
both Latinos (r = .65, p < .01) and non-Latino Whites (r = .70, p < .01). Similarly, the
correlations between the B-FS and B-AFS were high positive for both Latinos (r = .73, p < .01)
and non-Latino Whites (r = .60, p < .01). Correlations between the FS and the B-FS were high
positive for Latinos (r = .60, p < .01) and moderate positive for non-Latino Whites (r = .51, p =
.01). Correlations between the AFS and the B-FS were high positive for both Latinos (r = .72, p
< .01) and non-Latino Whites (r = .70, p = .01).
Table 6
Correlations between the Total Composite Scores of the AFS, B-AFS, FS and B-FS
Both Racial/Ethnic Groups Combined (N = 323)
Scales 1 2 3 4
1. AFS --
2. B-AFS .71** --
3. FS .69** .53** --
4. B-FS .49** .67** .56** -- Note. **p < .01; AFS = Attitudinal Familism Scale by Steidel & Contreras (2003); B-AFS =
Behavioral Familism Scale developed for this study; FS = Familism Scale by Sabogal et al.,
(1987); B-FS = Behavioral Familism Scale developed for this study.
34
Perceived Social Support
Appendix G displays the means and standard deviations for the MSPSS with both
racial/ethnic groups combined and separately. Correlations between the Total Composite Scores of
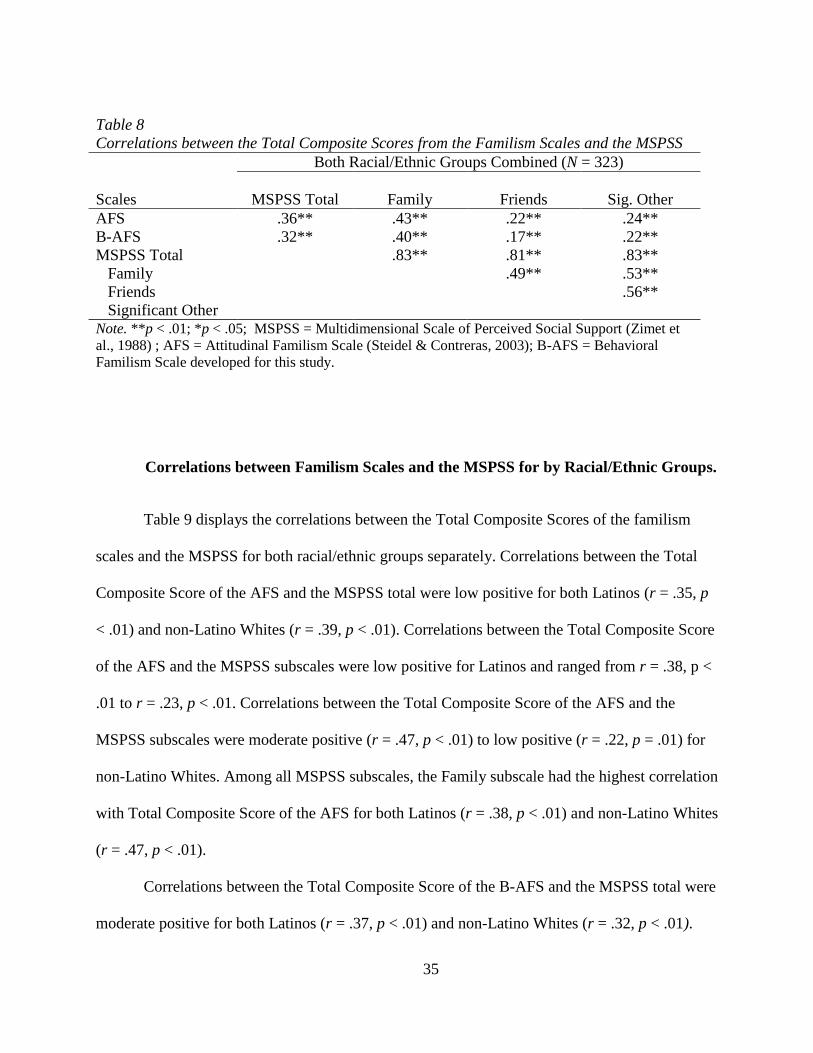
the attitudinal and behavioral familism scales and the MSPSS were computed using both
racial/ethnic groups combined and these are displayed in Table 8.
The correlation between the Total Composite Score of the AFS and the MSPSS total was
low positive (r = .36, p < .01). Correlations between the Total Composite Score of the AFS and
the MSPSS subscales were moderate positive (r = .43, p < .01) to low positive (r = .24, p < .01).
Among all MSPSS subscales, the Family subscale had the highest correlation with AFS (r = .43,
p < .01). The correlation between the Total Composite Score of the B-AFS and the MSPSS total
was low positive (r = .33, p < .01). Correlations between the Total Composite Score of the B-
AFS and the MSPSS subscales were moderate positive (r = .40, p < .01) to very low positive (r =
.17, p = < .01). Similarly, among all MSPSS subscales, the Family subscale had the highest
correlation with B-AFS (r = .40, p < .01).
Table 7
Correlations between the Total Composite Scores of the AFS, B-AFS, FS, and B-FS by
Racial/Ethnic Groups
Latinos (n =121)
Non-Latinos Whites (n = 202)
Scales 1 2 3 4 1 2 3 4
1. AFS -- --
2. B-AFS .72** -- .70**
3. FS .65** .53** -- .70** .51**
4. B-FS .53** .73** .60** -- .44* .60** .51** --
Note. **p < .01; AFS = Attitudinal Familism Scale by Steidel & Contreras (2003); B-AFS = Behavioral
Familism Scale developed for this study; FS = Familism Scale by Sabogal et al., (1987); B-FS =
Behavioral Familism Scale developed for this study.
35
Correlations between Familism Scales and the MSPSS for by Racial/Ethnic Groups.
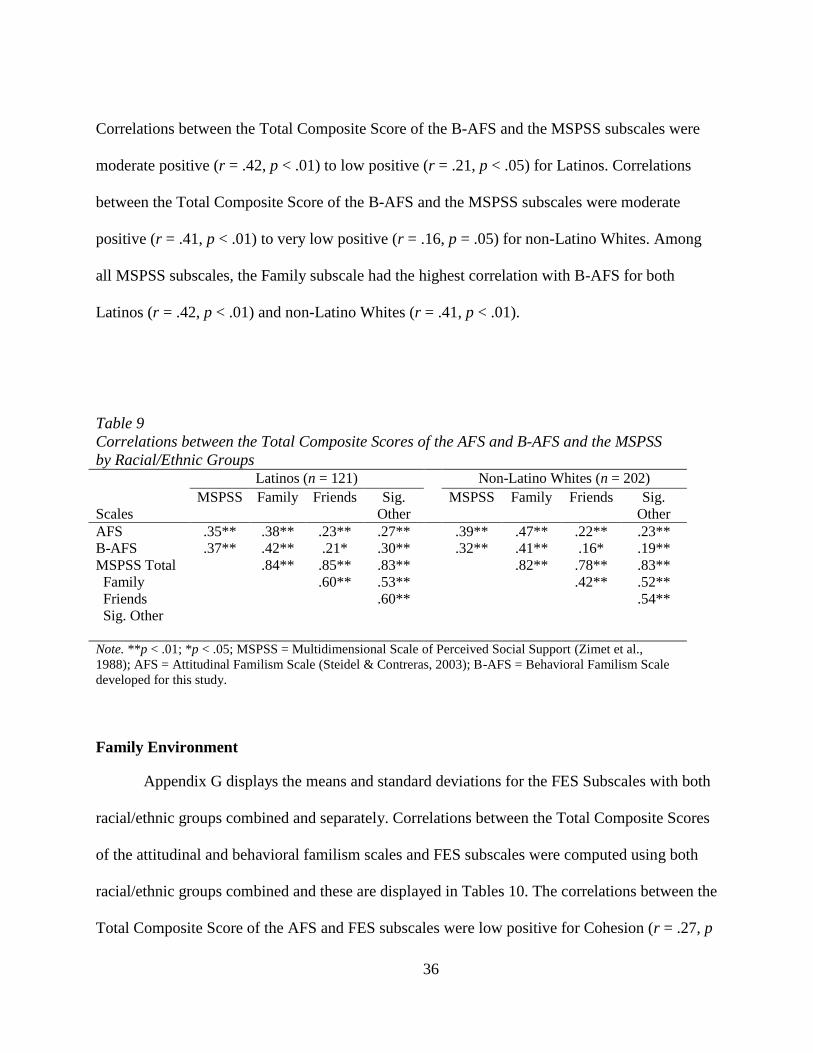
Table 9 displays the correlations between the Total Composite Scores of the familism
scales and the MSPSS for both racial/ethnic groups separately. Correlations between the Total
Composite Score of the AFS and the MSPSS total were low positive for both Latinos (r = .35, p
< .01) and non-Latino Whites (r = .39, p < .01). Correlations between the Total Composite Score
of the AFS and the MSPSS subscales were low positive for Latinos and ranged from r = .38, p <
.01 to r = .23, p < .01. Correlations between the Total Composite Score of the AFS and the
MSPSS subscales were moderate positive (r = .47, p < .01) to low positive (r = .22, p = .01) for
non-Latino Whites. Among all MSPSS subscales, the Family subscale had the highest correlation
with Total Composite Score of the AFS for both Latinos (r = .38, p < .01) and non-Latino Whites
(r = .47, p < .01).
Correlations between the Total Composite Score of the B-AFS and the MSPSS total were
moderate positive for both Latinos (r = .37, p < .01) and non-Latino Whites (r = .32, p < .01).
Table 8
Correlations between the Total Composite Scores from the Familism Scales and the MSPSS
Both Racial/Ethnic Groups Combined (N = 323)
Scales
MSPSS Total
Family
Friends
Sig. Other
AFS .36** .43** .22** .24**
B-AFS .32** .40** .17** .22**
MSPSS Total .83** .81** .83**
Family .49** .53**
Friends .56**
Significant Other Note. **p < .01; *p < .05; MSPSS = Multidimensional Scale of Perceived Social Support (Zimet et
al., 1988) ; AFS = Attitudinal Familism Scale (Steidel & Contreras, 2003); B-AFS = Behavioral
Familism Scale developed for this study.
36
Correlations between the Total Composite Score of the B-AFS and the MSPSS subscales were
moderate positive (r = .42, p < .01) to low positive (r = .21, p < .05) for Latinos. Correlations
between the Total Composite Score of the B-AFS and the MSPSS subscales were moderate
positive (r = .41, p < .01) to very low positive (r = .16, p = .05) for non-Latino Whites. Among
all MSPSS subscales, the Family subscale had the highest correlation with B-AFS for both
Latinos (r = .42, p < .01) and non-Latino Whites (r = .41, p < .01).
Family Environment
Appendix G displays the means and standard deviations for the FES Subscales with both
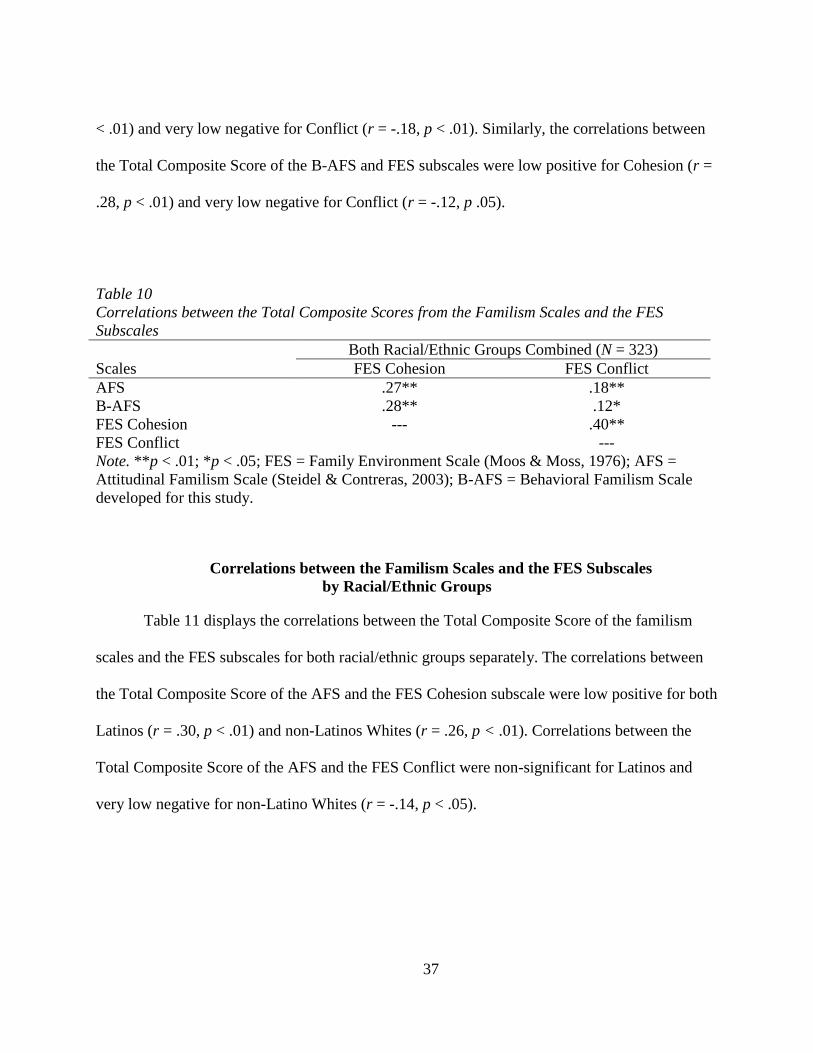
racial/ethnic groups combined and separately. Correlations between the Total Composite Scores
of the attitudinal and behavioral familism scales and FES subscales were computed using both
racial/ethnic groups combined and these are displayed in Tables 10. The correlations between the
Total Composite Score of the AFS and FES subscales were low positive for Cohesion (r = .27, p
Table 9
Correlations between the Total Composite Scores of the AFS and B-AFS and the MSPSS
by Racial/Ethnic Groups
Latinos (n = 121) Non-Latino Whites (n = 202)
Scales
MSPSS Family Friends Sig.
Other
MSPSS Family Friends Sig.
Other
AFS .35** .38** .23** .27** .39** .47** .22** .23**
B-AFS .37** .42** .21* .30** .32** .41** .16* .19**
MSPSS Total .84** .85** .83** .82** .78** .83**
Family .60** .53** .42** .52**
Friends .60** .54**
Sig. Other
Note. **p < .01; *p < .05; MSPSS = Multidimensional Scale of Perceived Social Support (Zimet et al.,
1988); AFS = Attitudinal Familism Scale (Steidel & Contreras, 2003); B-AFS = Behavioral Familism Scale
developed for this study.
37
< .01) and very low negative for Conflict (r = -.18, p < .01). Similarly, the correlations between
the Total Composite Score of the B-AFS and FES subscales were low positive for Cohesion (r =
.28, p < .01) and very low negative for Conflict (r = -.12, p .05).
Table 10
Correlations between the Total Composite Scores from the Familism Scales and the FES
Subscales
Both Racial/Ethnic Groups Combined (N = 323)
Scales FES Cohesion FES Conflict
AFS .27** .18**
B-AFS .28** .12*
FES Cohesion --- .40**
FES Conflict ---
Note. **p < .01; *p < .05; FES = Family Environment Scale (Moos & Moss, 1976); AFS =
Attitudinal Familism Scale (Steidel & Contreras, 2003); B-AFS = Behavioral Familism Scale
developed for this study.
Correlations between the Familism Scales and the FES Subscales
by Racial/Ethnic Groups
Table 11 displays the correlations between the Total Composite Score of the familism
scales and the FES subscales for both racial/ethnic groups separately. The correlations between
the Total Composite Score of the AFS and the FES Cohesion subscale were low positive for both
Latinos (r = .30, p < .01) and non-Latinos Whites (r = .26, p < .01). Correlations between the
Total Composite Score of the AFS and the FES Conflict were non-significant for Latinos and
very low negative for non-Latino Whites (r = -.14, p < .05).
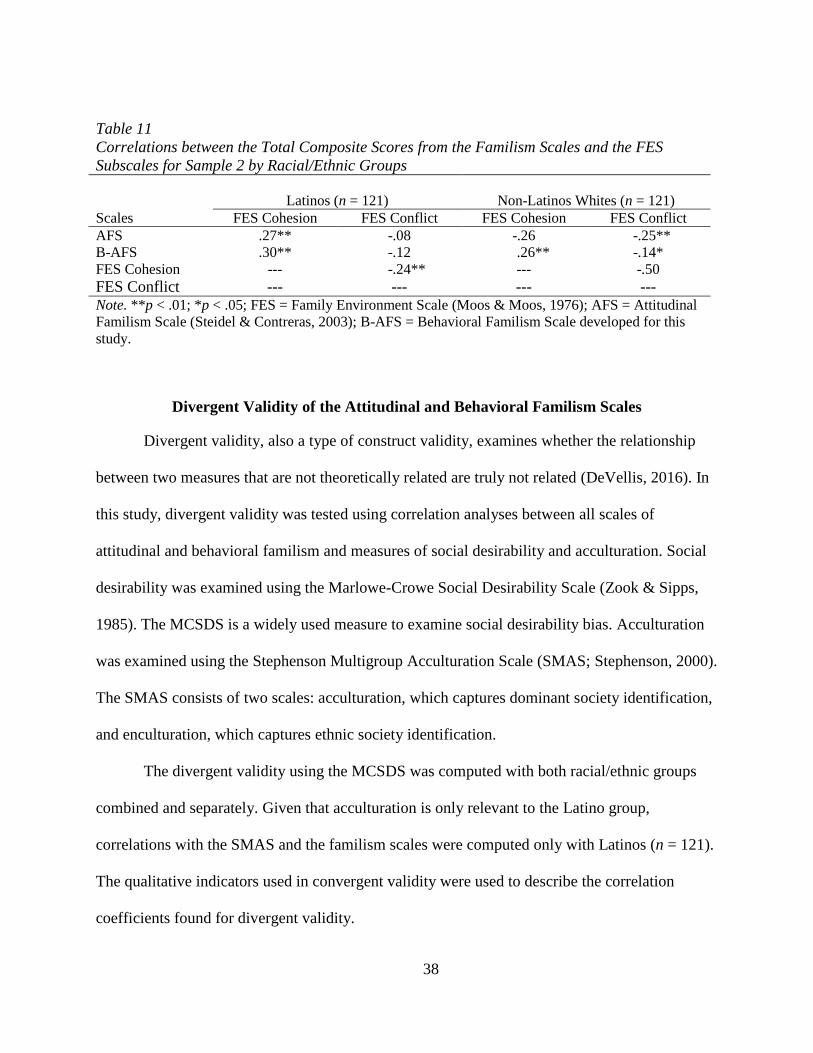
38
Table 11
Correlations between the Total Composite Scores from the Familism Scales and the FES
Subscales for Sample 2 by Racial/Ethnic Groups
Latinos (n = 121)
Non-Latinos Whites (n = 121)
Scales FES Cohesion FES Conflict FES Cohesion FES Conflict
AFS .27** -.08 -.26 -.25**
B-AFS .30** -.12 .26** -.14*
FES Cohesion --- -.24** --- -.50
FES Conflict --- --- --- --- Note. **p < .01; *p < .05; FES = Family Environment Scale (Moos & Moos, 1976); AFS = Attitudinal
Familism Scale (Steidel & Contreras, 2003); B-AFS = Behavioral Familism Scale developed for this
study.
Divergent Validity of the Attitudinal and Behavioral Familism Scales
Divergent validity, also a type of construct validity, examines whether the relationship
between two measures that are not theoretically related are truly not related (DeVellis, 2016). In
this study, divergent validity was tested using correlation analyses between all scales of
attitudinal and behavioral familism and measures of social desirability and acculturation. Social
desirability was examined using the Marlowe-Crowe Social Desirability Scale (Zook & Sipps,
1985). The MCSDS is a widely used measure to examine social desirability bias. Acculturation
was examined using the Stephenson Multigroup Acculturation Scale (SMAS; Stephenson, 2000).
The SMAS consists of two scales: acculturation, which captures dominant society identification,
and enculturation, which captures ethnic society identification.
The divergent validity using the MCSDS was computed with both racial/ethnic groups
combined and separately. Given that acculturation is only relevant to the Latino group,
correlations with the SMAS and the familism scales were computed only with Latinos (n = 121).
The qualitative indicators used in convergent validity were used to describe the correlation
coefficients found for divergent validity.
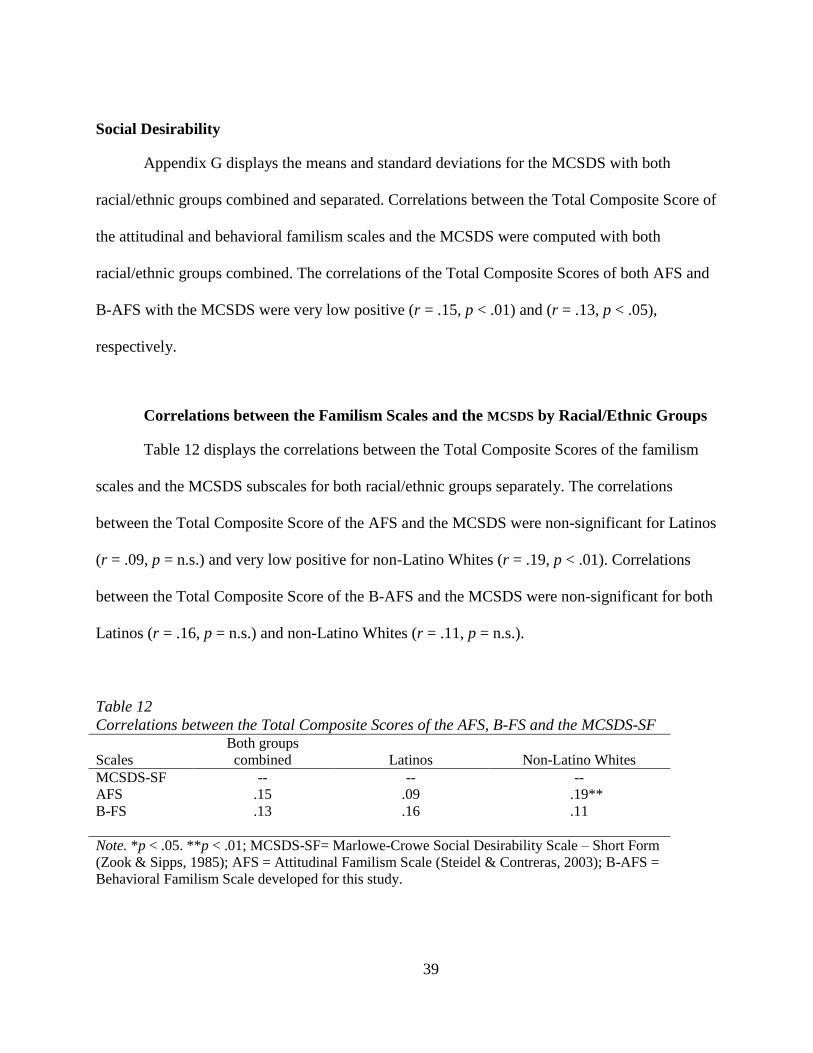
39
Social Desirability
Appendix G displays the means and standard deviations for the MCSDS with both
racial/ethnic groups combined and separated. Correlations between the Total Composite Score of
the attitudinal and behavioral familism scales and the MCSDS were computed with both
racial/ethnic groups combined. The correlations of the Total Composite Scores of both AFS and
B-AFS with the MCSDS were very low positive (r = .15, p < .01) and (r = .13, p < .05),
respectively.
Correlations between the Familism Scales and the MCSDS by Racial/Ethnic Groups
Table 12 displays the correlations between the Total Composite Scores of the familism
scales and the MCSDS subscales for both racial/ethnic groups separately. The correlations
between the Total Composite Score of the AFS and the MCSDS were non-significant for Latinos
(r = .09, p = n.s.) and very low positive for non-Latino Whites (r = .19, p < .01). Correlations
between the Total Composite Score of the B-AFS and the MCSDS were non-significant for both
Latinos (r = .16, p = n.s.) and non-Latino Whites (r = .11, p = n.s.).
Table 12
Correlations between the Total Composite Scores of the AFS, B-FS and the MCSDS-SF
Scales
Both groups
combined
Latinos
Non-Latino Whites
MCSDS-SF
AFS
--
.15
--
.09
--
.19**
B-FS .13 .16 .11
Note. *p < .05. **p < .01; MCSDS-SF= Marlowe-Crowe Social Desirability Scale – Short Form
(Zook & Sipps, 1985); AFS = Attitudinal Familism Scale (Steidel & Contreras, 2003); B-AFS =
Behavioral Familism Scale developed for this study.
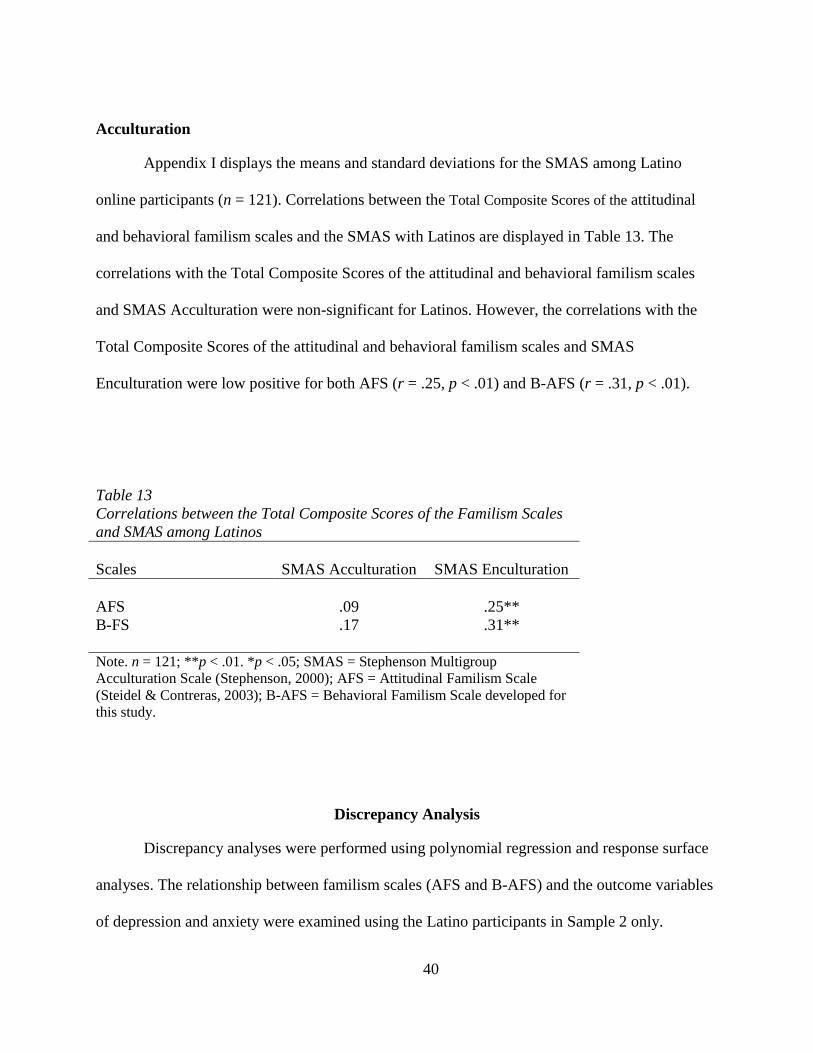
40
Acculturation
Appendix I displays the means and standard deviations for the SMAS among Latino
online participants (n = 121). Correlations between the Total Composite Scores of the attitudinal
and behavioral familism scales and the SMAS with Latinos are displayed in Table 13. The
correlations with the Total Composite Scores of the attitudinal and behavioral familism scales
and SMAS Acculturation were non-significant for Latinos. However, the correlations with the
Total Composite Scores of the attitudinal and behavioral familism scales and SMAS
Enculturation were low positive for both AFS (r = .25, p < .01) and B-AFS (r = .31, p < .01).
Discrepancy Analysis
Discrepancy analyses were performed using polynomial regression and response surface
analyses. The relationship between familism scales (AFS and B-AFS) and the outcome variables
of depression and anxiety were examined using the Latino participants in Sample 2 only.
Table 13
Correlations between the Total Composite Scores of the Familism Scales
and SMAS among Latinos
Scales
SMAS Acculturation
SMAS Enculturation
AFS .09 .25**
B-FS .17 .31**
Note. n = 121; **p < .01. *p < .05; SMAS = Stephenson Multigroup
Acculturation Scale (Stephenson, 2000); AFS = Attitudinal Familism Scale
(Steidel & Contreras, 2003); B-AFS = Behavioral Familism Scale developed for
this study.
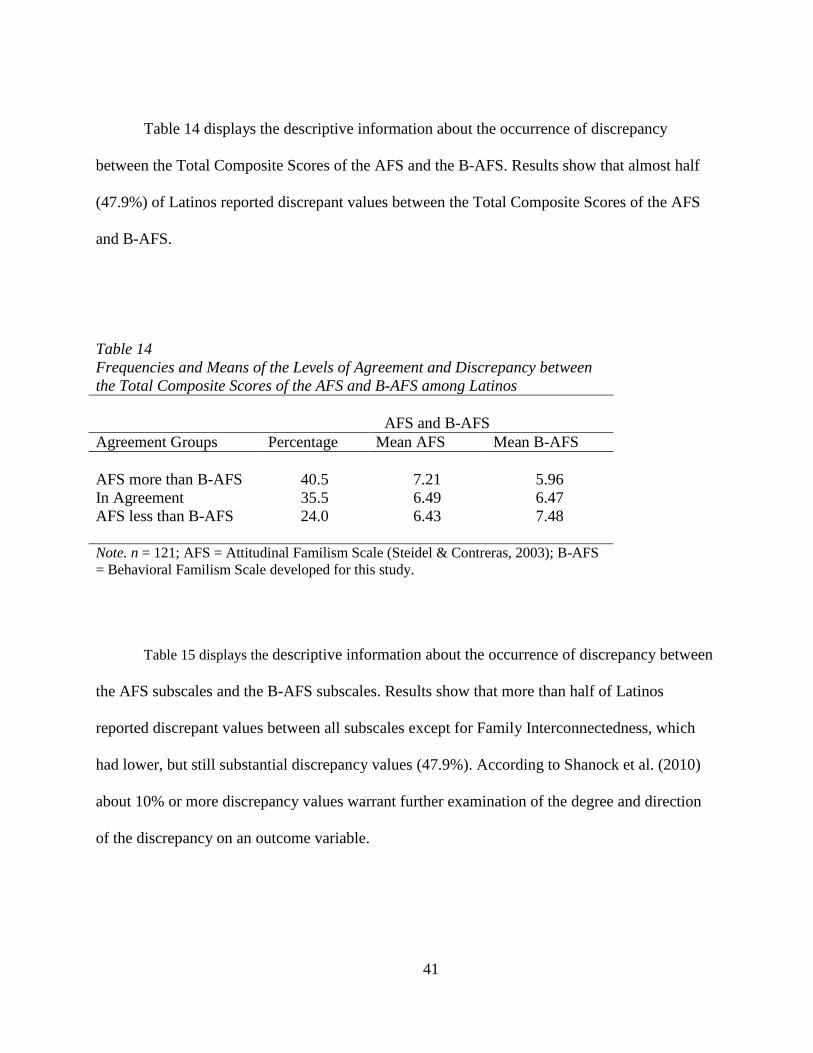
41
Table 14 displays the descriptive information about the occurrence of discrepancy
between the Total Composite Scores of the AFS and the B-AFS. Results show that almost half
(47.9%) of Latinos reported discrepant values between the Total Composite Scores of the AFS
and B-AFS.
Table 14
Frequencies and Means of the Levels of Agreement and Discrepancy between
the Total Composite Scores of the AFS and B-AFS among Latinos
AFS and B-AFS
Agreement Groups Percentage Mean AFS Mean B-AFS
AFS more than B-AFS 40.5 7.21 5.96
In Agreement 35.5 6.49 6.47
AFS less than B-AFS 24.0 6.43 7.48
Note. n = 121; AFS = Attitudinal Familism Scale (Steidel & Contreras, 2003); B-AFS
= Behavioral Familism Scale developed for this study.
Table 15 displays the descriptive information about the occurrence of discrepancy between
the AFS subscales and the B-AFS subscales. Results show that more than half of Latinos
reported discrepant values between all subscales except for Family Interconnectedness, which
had lower, but still substantial discrepancy values (47.9%). According to Shanock et al. (2010)
about 10% or more discrepancy values warrant further examination of the degree and direction
of the discrepancy on an outcome variable.
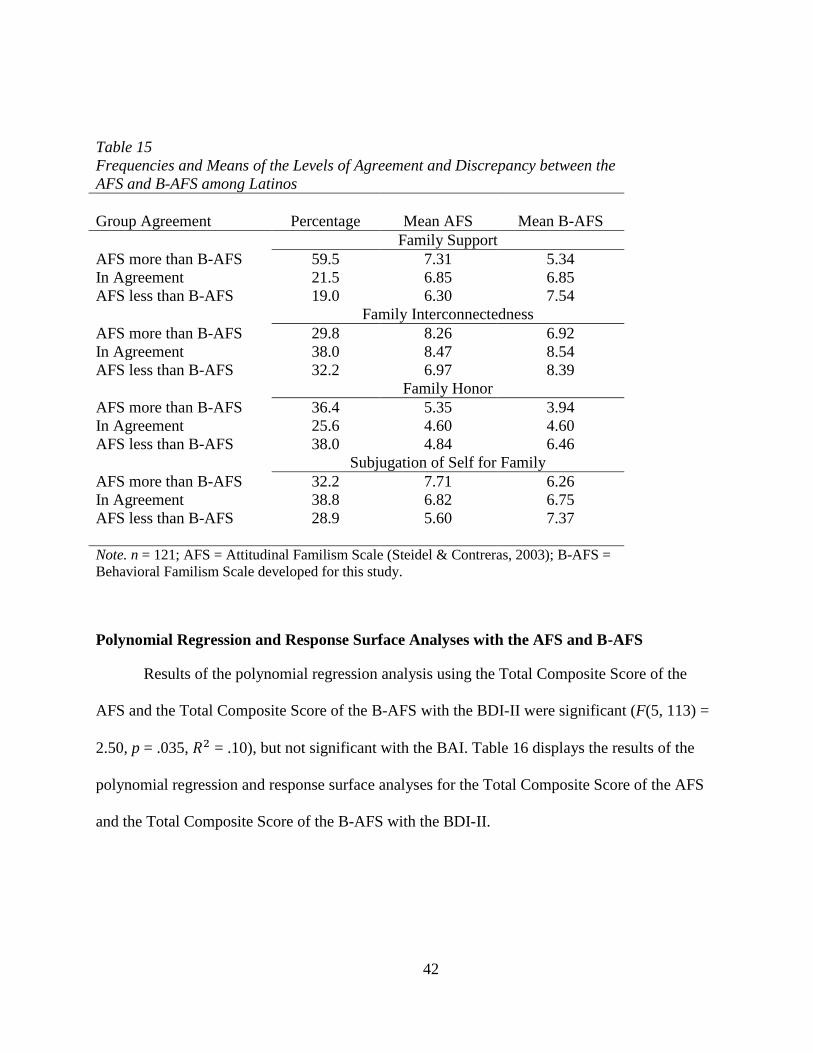
42
Table 15
Frequencies and Means of the Levels of Agreement and Discrepancy between the
AFS and B-AFS among Latinos
Group Agreement
Percentage
Mean AFS
Mean B-AFS
Family Support
AFS more than B-AFS 59.5 7.31 5.34
In Agreement 21.5 6.85 6.85
AFS less than B-AFS 19.0 6.30 7.54
Family Interconnectedness
AFS more than B-AFS 29.8 8.26 6.92
In Agreement 38.0 8.47 8.54
AFS less than B-AFS 32.2 6.97 8.39
Family Honor
AFS more than B-AFS 36.4 5.35 3.94
In Agreement 25.6 4.60 4.60
AFS less than B-AFS 38.0 4.84 6.46
Subjugation of Self for Family
AFS more than B-AFS 32.2 7.71 6.26
In Agreement 38.8 6.82 6.75
AFS less than B-AFS
28.9 5.60 7.37
Note. n = 121; AFS = Attitudinal Familism Scale (Steidel & Contreras, 2003); B-AFS =
Behavioral Familism Scale developed for this study.
Polynomial Regression and Response Surface Analyses with the AFS and B-AFS
Results of the polynomial regression analysis using the Total Composite Score of the
AFS and the Total Composite Score of the B-AFS with the BDI-II were significant (F(5, 113) =
2.50, p = .035, 𝑅2 = .10), but not significant with the BAI. Table 16 displays the results of the
polynomial regression and response surface analyses for the Total Composite Score of the AFS
and the Total Composite Score of the B-AFS with the BDI-II.
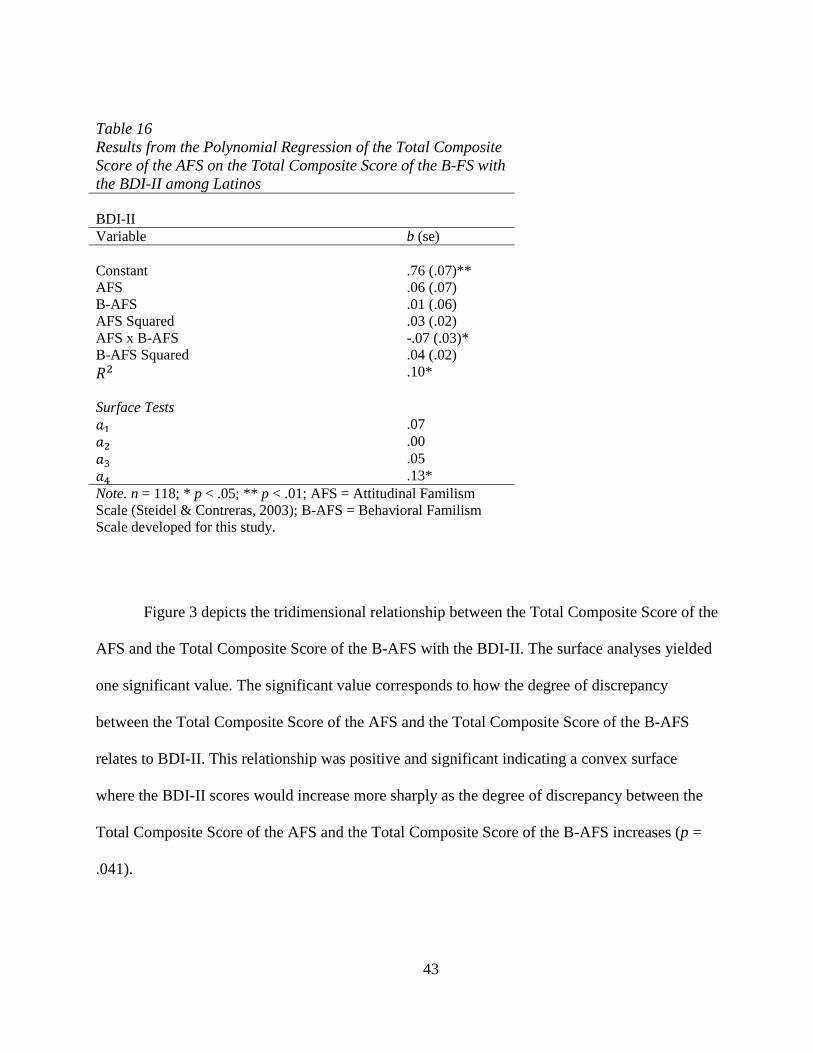
43
Table 16
Results from the Polynomial Regression of the Total Composite
Score of the AFS on the Total Composite Score of the B-FS with
the BDI-II among Latinos
BDI-II
Variable b (se)
Constant
.76 (.07)**
AFS .06 (.07)
B-AFS .01 (.06)
AFS Squared .03 (.02)
AFS x B-AFS -.07 (.03)*
B-AFS Squared .04 (.02)
𝑅2 .10*
Surface Tests
𝑎1 .07
𝑎2 .00
𝑎3 .05
𝑎4 .13*
Note. n = 118; * p < .05; ** p < .01; AFS = Attitudinal Familism
Scale (Steidel & Contreras, 2003); B-AFS = Behavioral Familism
Scale developed for this study.
Figure 3 depicts the tridimensional relationship between the Total Composite Score of the
AFS and the Total Composite Score of the B-AFS with the BDI-II. The surface analyses yielded
one significant value. The significant value corresponds to how the degree of discrepancy
between the Total Composite Score of the AFS and the Total Composite Score of the B-AFS
relates to BDI-II. This relationship was positive and significant indicating a convex surface
where the BDI-II scores would increase more sharply as the degree of discrepancy between the
Total Composite Score of the AFS and the Total Composite Score of the B-AFS increases (p =
.041).
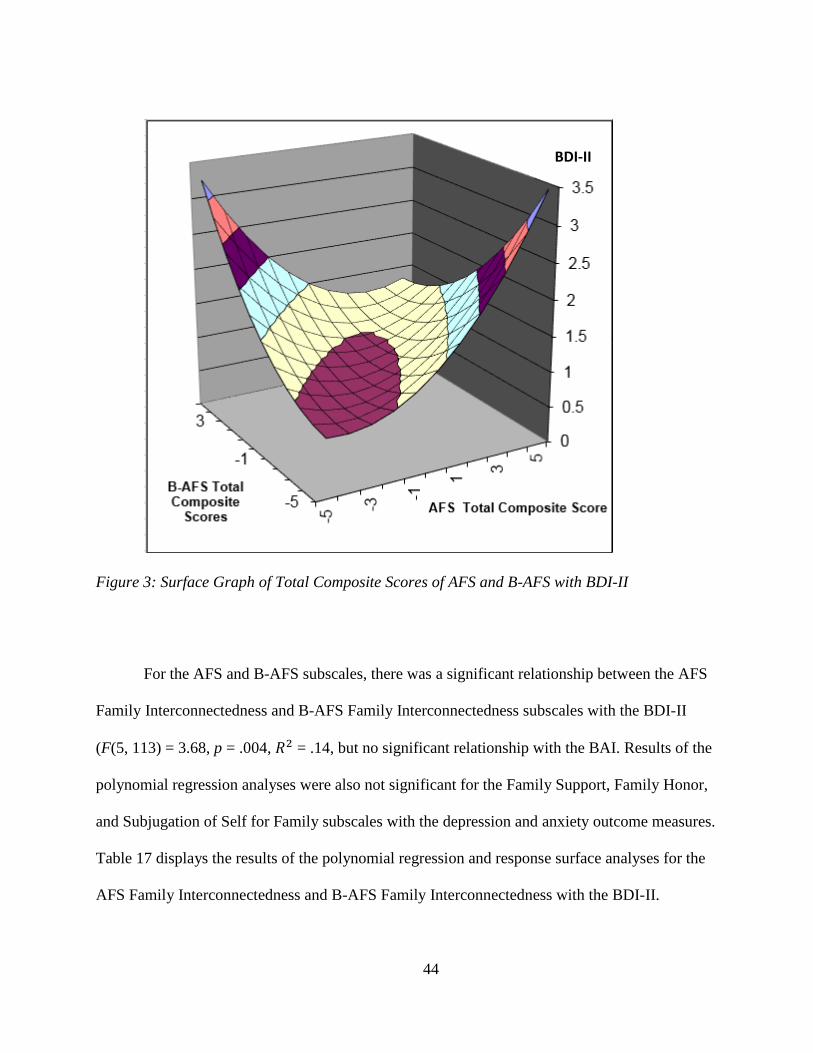
44
Figure 3: Surface Graph of Total Composite Scores of AFS and B-AFS with BDI-II
For the AFS and B-AFS subscales, there was a significant relationship between the AFS
Family Interconnectedness and B-AFS Family Interconnectedness subscales with the BDI-II
(F(5, 113) = 3.68, p = .004, 𝑅2 = .14, but no significant relationship with the BAI. Results of the
polynomial regression analyses were also not significant for the Family Support, Family Honor,
and Subjugation of Self for Family subscales with the depression and anxiety outcome measures.
Table 17 displays the results of the polynomial regression and response surface analyses for the
AFS Family Interconnectedness and B-AFS Family Interconnectedness with the BDI-II.
BDI-II
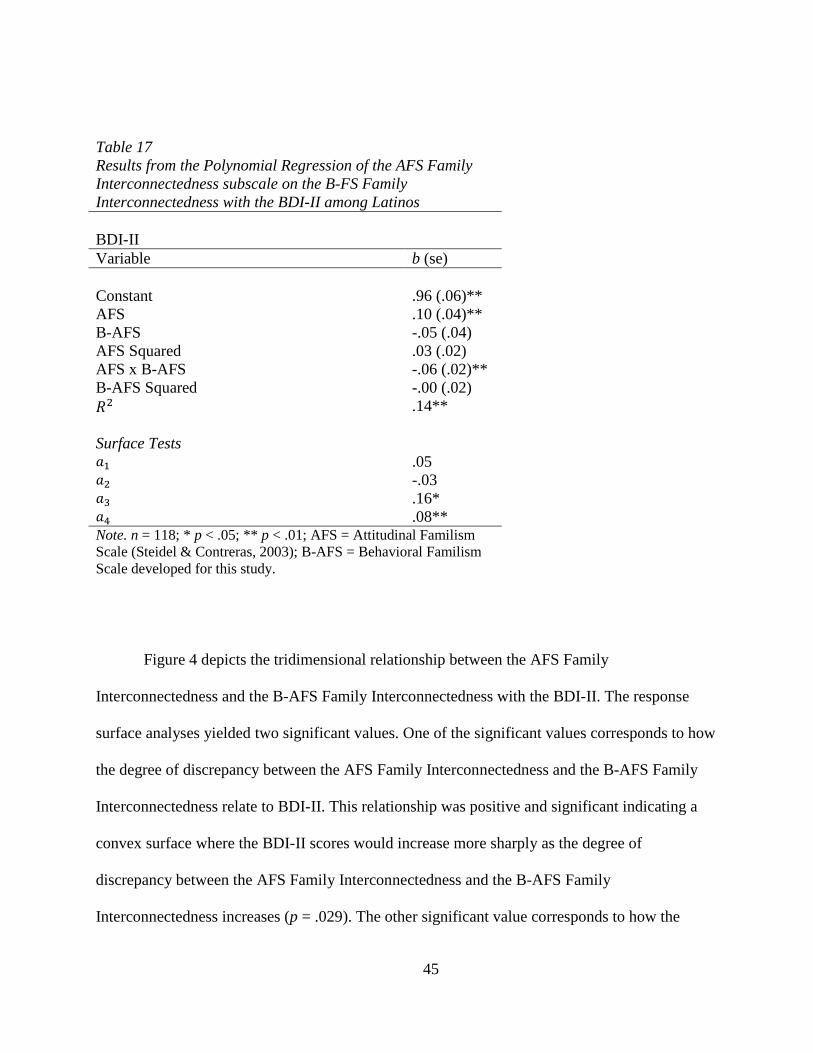
45
Table 17
Results from the Polynomial Regression of the AFS Family
Interconnectedness subscale on the B-FS Family
Interconnectedness with the BDI-II among Latinos
BDI-II
Variable b (se)
Constant
.96 (.06)**
AFS .10 (.04)**
B-AFS -.05 (.04)
AFS Squared .03 (.02)
AFS x B-AFS -.06 (.02)**
B-AFS Squared -.00 (.02)
𝑅2 .14**
Surface Tests
𝑎1 .05 𝑎2 -.03 𝑎3 .16* 𝑎4 .08** Note. n = 118; * p < .05; ** p < .01; AFS = Attitudinal Familism
Scale (Steidel & Contreras, 2003); B-AFS = Behavioral Familism
Scale developed for this study.
Figure 4 depicts the tridimensional relationship between the AFS Family
Interconnectedness and the B-AFS Family Interconnectedness with the BDI-II. The response
surface analyses yielded two significant values. One of the significant values corresponds to how
the degree of discrepancy between the AFS Family Interconnectedness and the B-AFS Family
Interconnectedness relate to BDI-II. This relationship was positive and significant indicating a
convex surface where the BDI-II scores would increase more sharply as the degree of
discrepancy between the AFS Family Interconnectedness and the B-AFS Family
Interconnectedness increases (p = .029). The other significant value corresponds to how the
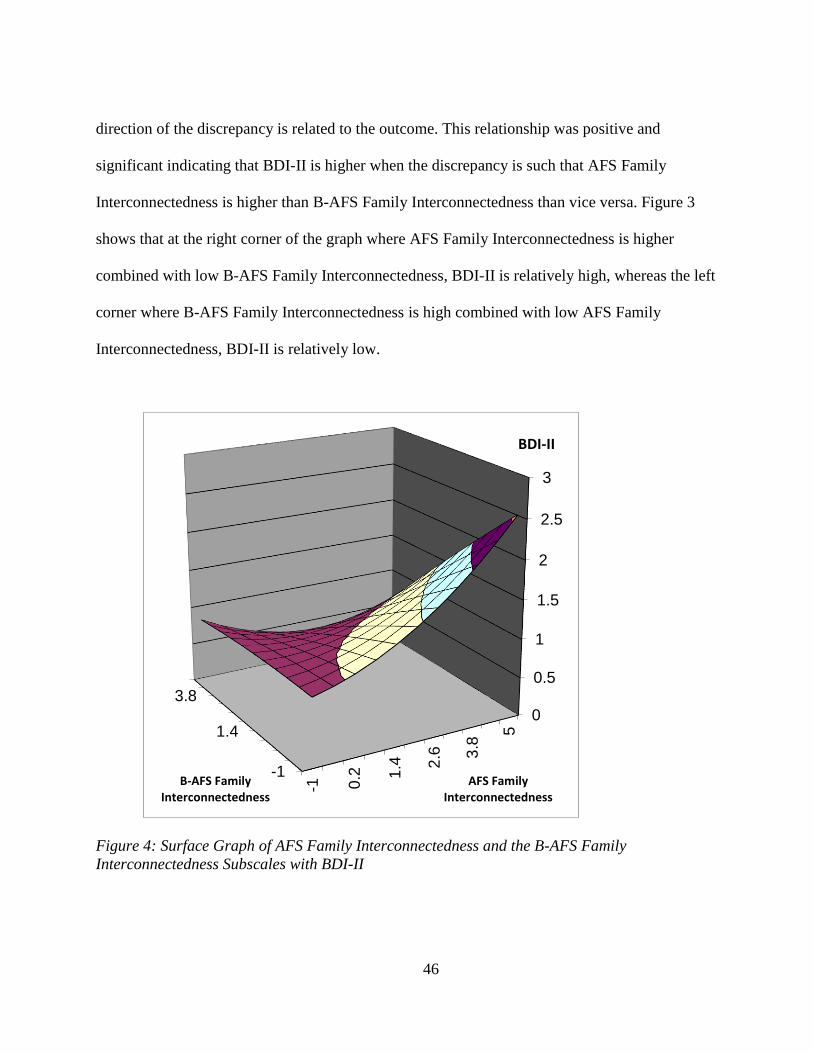
46
direction of the discrepancy is related to the outcome. This relationship was positive and
significant indicating that BDI-II is higher when the discrepancy is such that AFS Family
Interconnectedness is higher than B-AFS Family Interconnectedness than vice versa. Figure 3
shows that at the right corner of the graph where AFS Family Interconnectedness is higher
combined with low B-AFS Family Interconnectedness, BDI-II is relatively high, whereas the left
corner where B-AFS Family Interconnectedness is high combined with low AFS Family
Interconnectedness, BDI-II is relatively low.
Figure 4: Surface Graph of AFS Family Interconnectedness and the B-AFS Family
Interconnectedness Subscales with BDI-II
-1
1.4
3.8
0
0.5
1
1.5
2
2.5
3
-1 0.2 1
.4 2.6 3
.8
5
BDI-II
AFS Family Interconnectedness
B-AFS Family Interconnectedness
47
Exploratory Analyses
Given the extant literature on perceived social support as a predictor of depression
(Coyne & Downey, 1991; Oxman & Hull, 2001; Roohafza et al., 2014), analyses were conducted
to explore this relationship among Latinos and non-Latino Whites. Regression analyses show
that perceived social support as measured by MSPSS had a weak, but significant relationship to
depression for non-Latino Whites (F(1, 198) = 4.83, p = .029, 𝑅2= .02), but not for Latinos.
Although not conclusive, these findings suggest that the culturally specific variable of
familism is a stronger predictor of depression among Latinos than traditional measures of social
support.
48
CHAPTER FOUR: DISCUSSION
The purpose of this study was to examine the relation between familism, a presumed core
cultural variable for many Latinos (Alvarez & Bean, 1976; Ferrari, 2002; Steidel & Contreras),
and psychological distress (depression and anxiety). The extant literature points to limitations on
existing familism measures, the main one being that most studies rely on attitudinal measures
and do not assess behavioral familism or how individuals actually experience or engage in
familism thereby constraining the understanding and effects of familism as a construct.
The main hypothesis was that psychological distress is created when the individual
experiences a discrepancy between attitudinal and behavioral familism, or their expectations and
experiences. Thus we postulate that when an individual’s attitudes and behaviors track closely to
one another, no dissonance is created. Thus if the value placed on familism is low, but the
behavioral experience is also low, no distress is experienced (and vice versa). Conversely, if the
value placed on familism is high, but the behavioral experience is low, psychological distress
ensues (and vice versa). The challenge to testing this hypothesis is that most familism measures
available only assess features of attitudinal familism (Esparza & Gonzalez, 2008; Gaines et al.,
1997; Knight, 1998; Rodriguez, Mira, Paez, & Myers, 2007; Sabogal et al., 1987; Steidel &
Contreras, 2003; Villarreal, Blozis, & Widaman, 2005). Therefore the first steps in this study
were to develop and establish the psychometric appropriateness of a measure of behavioral
familism. To our knowledge, there is only one documented effort to develop a behavioral
measure focused on frequency of family contact using questions from the 2002 General Social
Survey (GSS) data (Comeau, 2012). However, this effort does not encompass significant
domains of familism.
49
Although the study of Comeau (2012) is an important step in understanding the
behavioral dimension of familism, the present study developed a behavioral measure of familism
drawing from an existing attitudinal familism measure (Steidel & Contreras, 2003) which
captures more aspects of behavior than merely frequency of family contact. In line with the
current concern on how to better study cultural variables and their relation with clinical outcomes
(U.S. Departmemt of Health and Human Services, 2001), this study also examined how both
attitudinal and behavioral familism relate to depression and anxiety among Latinos..
Previous research established the psychometric properties of the Attitudinal Familism
Scale (AFS) developed by Steidel & Contreras (2003). Studies using AFS consistently report
high internal consistency (Baumann, Kuhlberg, & Zayas, 2010; Campos et al., 2014). A rigorous
examination of the psychometric properties of the B-AFS was undertaken as the first step in this
study, because it is a newly developed measure of behavioral familism. Consistent with precious
research, the B-AFS showed similar Cronbach’s Alpha scores for the total composite scores and
subscales. Aside from having equivalent Cronbach Alphas as in other studies, the low scores
found in the Family Honor and Subjugation to Self for Family subscales could be attributed to
the low number of items that constitute these scales. Additionally, it is possible that familism is
not a unified construct and these items are not highly reliable for this study population, mainly
emerging young adults. Further, these items may be more salient when a person is experiencing a
family emergency or crisis. Nonetheless, the t B-AFS showed high internal consistency
reliability. As a result, the B-AFS has the potential to extend the study of familism, how it is
viewed, manifested and relates to other social and clinical variables.
The results of the test-retest reliability of the B-AFS showed excellent stability over time
indicating that it has applicability to both Latinos and non-Latino Whites. This is relevant as
50
more research is needed to understand whether familism has social and clinical implications to
all cultural groups or is unique to one or certain specific groups. The examination of the internal
consistency of the B-AFS was also good for the overall sample and across racial/ethnic groups.
These findings also lend support to the notion that the B-AFS is appropriate for use with Latinos
and non-Latino Whites.
Convergent validity was examined using a comparable scale of behavioral familism. In
this study the correlations between the B-AFS and the B-FS were significant and positive with
one another. Additionally, convergent validity was examined with family support and family
cohesion. The relation between the B-AFS and the Family Support subscale of the
Multidimensional Scale of perceived Social Support (MSPSS) was significant and positive. The
relation between the B-AFS and family cohesion as measured by the Family Environment Scale
(Moos & Moos, 1976) also was significant and positive. These findings are in line with previous
research that suggests that family support and family cohesion are integral parts of familism
(Burgess and Locke, 1945; Sabogal et al., 1987; Steidel & Contreras, 2003). The correlations
were positive, but not so high as to imply that the AFS and B-AFS measured the same constructs
as the traditional measures of social support and family environment. These findings suggest that
the B-AFS measures the behavioral familism construct adequately for both Latinos and non-
Latino Whites.
The correlations between the Total Composite Score of the B-AFS and social desirability
and acculturation provided evidence of adequate divergent validity. The relation between the
Total Composite Score of the B-AFS and social desirability as measured by the MCSDS-SF was
non-significant for Latinos and for both racial/ethnic groups combined. Although the correlation
between the Total Composite Score of the B-AFS and the MCSDS-SF was significant, it was
51
low for non-Latino Whites. These findings suggest that participants did not merely respond in a
socially desirable way whether they were Latino or non-Latino Whites. Additionally, the
correlation between the Total Composite Scores of the AFS and B-AFS and acculturation were
non-significant whereas the correlation between the Total Composite Score of the AFS and B-
AFS and enculturation while significant were low. Together, these findings indicate that the
Total Composite Score of the AFS and B-AFS are not merely measuring acculturation or
enculturation among Latinos. These findings are also consistent with previous studies (Sabogal
et al., 1987; Steidel & Contreras, 2003; Zea, Asner-Self, Birman, & Buki, 2003).
After establishing that the newly developed behavioral familism scale is reliable and
valid, the discrepancy between attitudinal and behavioral familism was examined. Past research
points to the potential correlation between familism and psychological distress (Schwartz, 2007).
This study found that depressive symptoms increase as the discrepancy between the Total
Composite Scores of the AFS and B-AFS increases in either direction. However, no relation
between discrepancy scores for the AFS and B-AFS measures and anxiety was found. Although
many Latinos appear to have high levels of attitudinal familism, it is possible that not being able
to act on those values promote distress among Latinos. It is also possible that for Latinos with
low levels of attitudinal familism the demands imposed on executing such values lead to
symptoms of depression. Research on Latina adolescence and suicide attempts supports these
findings. Baumann, Kuhlberg and Zayas (2010) found that difference scores on attitudinal
familism where mothers scored higher than daughters predicted more externalizing behaviors. In
contrast, mother-daughter mutuality was negatively related to both internalizing and
externalizing behaviors. This is the first evidence, to our knowledge, that discrepancy values
between attitudinal and behavioral familism predicts symptoms of depression among Latinos.
52
This study provides further evidence to understand the underlying mechanism by which familism
impact psychological health.
Additionally, the findings indicate that across the components of familism, family
interconnectedness is a predictor of depressive symptoms. Family interconnectedness refers to
the belief that family members should maintain strong emotional bonds and be involved in each
other’s daily lives (Steidel & Contreras, 2003). The emotional and daily demands on familism
when in disagreement with familism values may lead to symptoms of depression among Latinos.
More specifically, findings demonstrated worse outcome for those with high levels of attitudinal
familism and low levels of behavioral familism, but not vice versa. Interestingly, these findings
indicate that having high familial values, but do not engaging in behaviors congruent with such
values may lead to symptoms of depression. However, for those with low familial values
engaging in behaviors or activities congruent with familial values has no impact on
psychological distress. These findings suggest a complex interplay between the emotional and
daily demands of familism among Latinos.
Clinical implications for these findings support the development of interventions for
depression that address the optimum balance of values and practices of familism in cases where
the family appears to be related to individuals’ psychological distress. Interventions should be
sensitive to both familism values and behaviors. Additionally, interventions should pay attention
to the emotional and daily demands related to familism values and behaviors. Culturally sensitive
interventions have shown promising results for improving depression among Latinos
(Domenech-Rodriguez et al., 2008; Hinton et al., 2010). Additionally, an exploratory analysis
conducted here suggests that a comprehensive assessment of familism may prove to be more
useful than assessing perceived social support in predicting depressive symptoms among Latinos.
53
Future research should focus on understanding the underlying mechanisms by which Latinos
developed psychopathology. Special interest should be paid to cultural variables that can serve as
predictors, moderators, or mediators in the development and prevention of mental illnesses.
Additionally, future research should examine the efficacy of culturally sensitive interventions
that reduce depression among Latinos.
There are some limitations to this study. First, the use of a sample of emerging young adults
limits the generalizability of the findings. Results may extend only to young highly educated
Latinos living in the south-east of the United States. Second, sample size precluded further
analyses with the Latino subgroup. Future research should include larger and representative
samples of Latinos to examine variations within Latino subgroups (e.g. Puerto Ricans, Cubans)
and the interplay of other socio-cultural variables. Third, the study did not test factor analysis of
the newly developed scale. Future studies should focus on further examining the psychometric
properties of the B-AFS. Further, the data collected was correlational in nature, and therefore
causal relations between familism and outcome measures, such as symptoms of depression,
cannot be drawn.
Future research should focus on translating the B-AFS into Spanish in order to involve
monolingual Spanish-speaking participants in studies on familism. Past research suggests that
monolingual Spanish-speaking Latinos tend to be first generation and report higher familism
values. It is possible that familism values serve as protective factors, but the toll of immigration
and lack of financial and social resources experienced by first generation immigrants may deter
behavioral familism impacting their psychological health. With larger samples, future research
may include moderating and mediating relationships along with discrepancy analyses. Future
samples should include clinical samples (i.e. treatment seeking or in-treatment participants) and

54
better representation of Latinos subgroups. This study could be extended to examining and
creating other behavioral familism scales and their relationship to psychological outcomes.
Conclusion
The AFS and its new companion measure the B-AFS are useful instruments for
measuring attitudinal and behavioral familism. The main advantage of administering both
instruments simultaneously is the additional information provided on how individuals experience
the ideals of familism in their lives. Further, by assessing both attitudinal and behavioral
familism, researchers can study their relationship to clinical variables. Results suggest that
discrepancy between attitudinal and behavioral familism predicts depression among young adult
Latinos, but not anxiety.

55
APPENDIX A: IRB APPROVAL LETTER
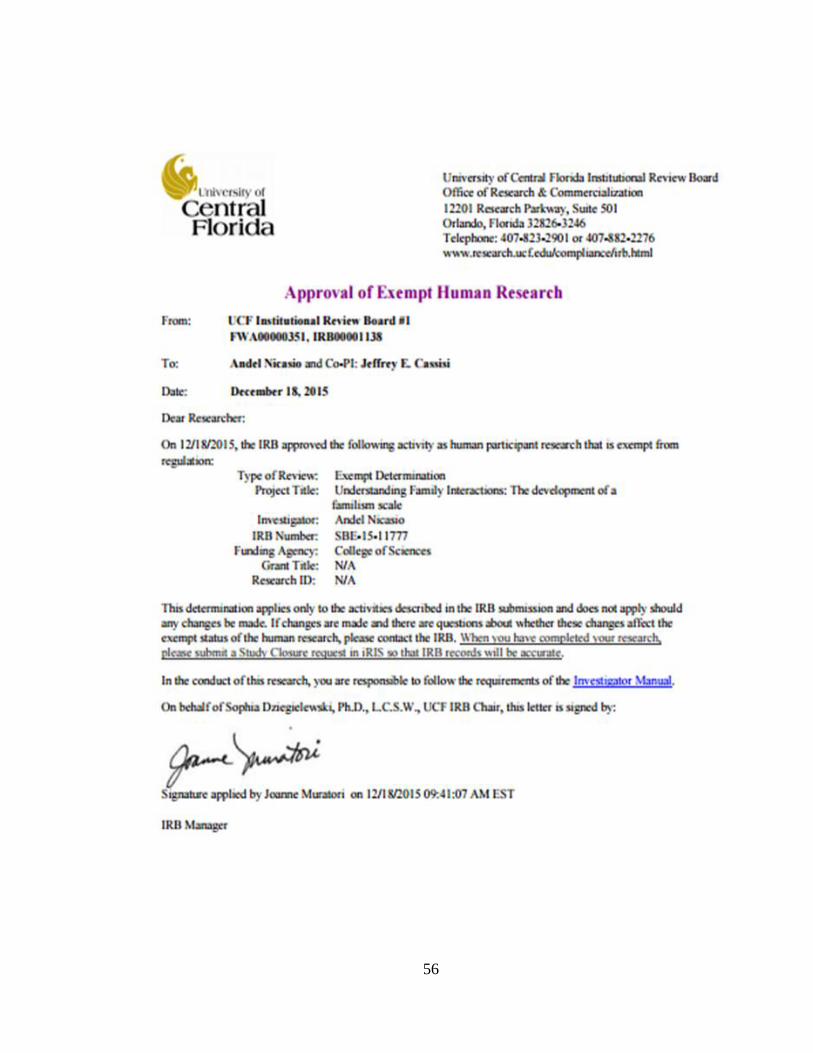
56

57
APPENDIX B: THE NEW B-AFS
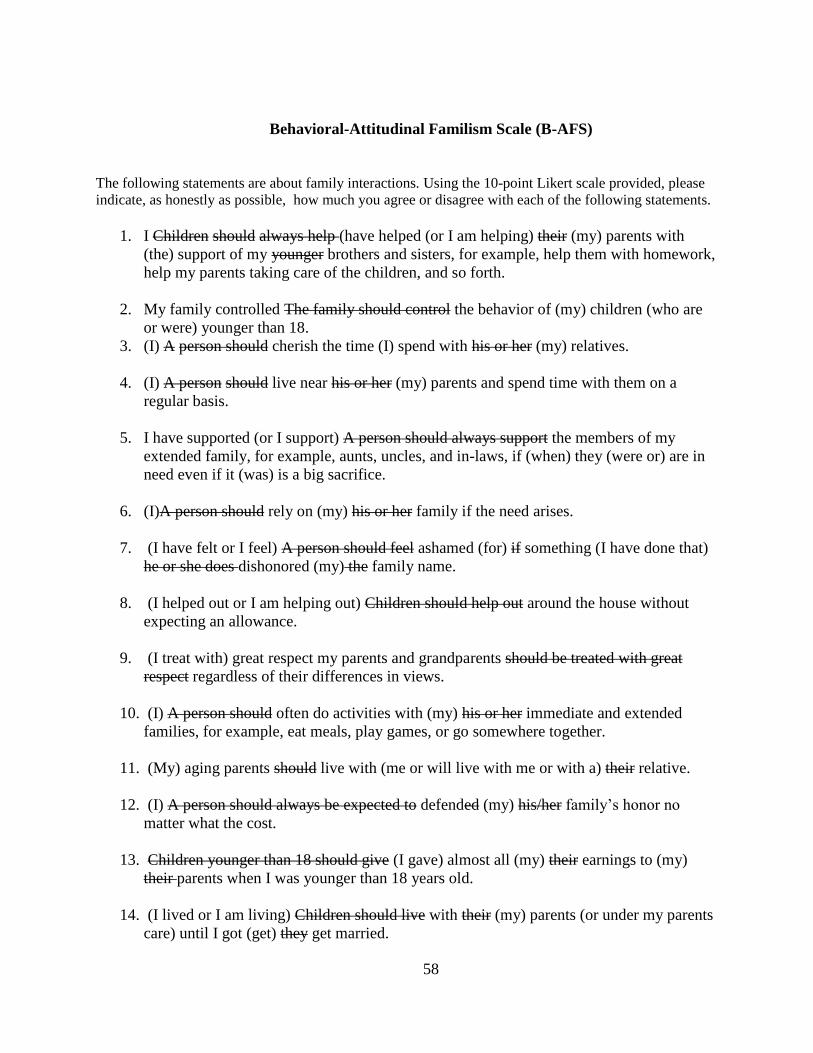
58
Behavioral-Attitudinal Familism Scale (B-AFS)
The following statements are about family interactions. Using the 10-point Likert scale provided, please
indicate, as honestly as possible, how much you agree or disagree with each of the following statements.
1. I Children should always help (have helped (or I am helping) their (my) parents with
(the) support of my younger brothers and sisters, for example, help them with homework,
help my parents taking care of the children, and so forth.
2. My family controlled The family should control the behavior of (my) children (who are
or were) younger than 18.
3. (I) A person should cherish the time (I) spend with his or her (my) relatives.
4. (I) A person should live near his or her (my) parents and spend time with them on a
regular basis.
5. I have supported (or I support) A person should always support the members of my
extended family, for example, aunts, uncles, and in-laws, if (when) they (were or) are in
need even if it (was) is a big sacrifice.
6. (I)A person should rely on (my) his or her family if the need arises.
7. (I have felt or I feel) A person should feel ashamed (for) if something (I have done that)
he or she does dishonored (my) the family name.
8. (I helped out or I am helping out) Children should help out around the house without
expecting an allowance.
9. (I treat with) great respect my parents and grandparents should be treated with great
respect regardless of their differences in views.
10. (I) A person should often do activities with (my) his or her immediate and extended
families, for example, eat meals, play games, or go somewhere together.
11. (My) aging parents should live with (me or will live with me or with a) their relative.
12. (I) A person should always be expected to defended (my) his/her family’s honor no
matter what the cost.
13. Children younger than 18 should give (I gave) almost all (my) their earnings to (my)
their parents when I was younger than 18 years old.
14. (I lived or I am living) Children should live with their (my) parents (or under my parents
care) until I got (get) they get married.
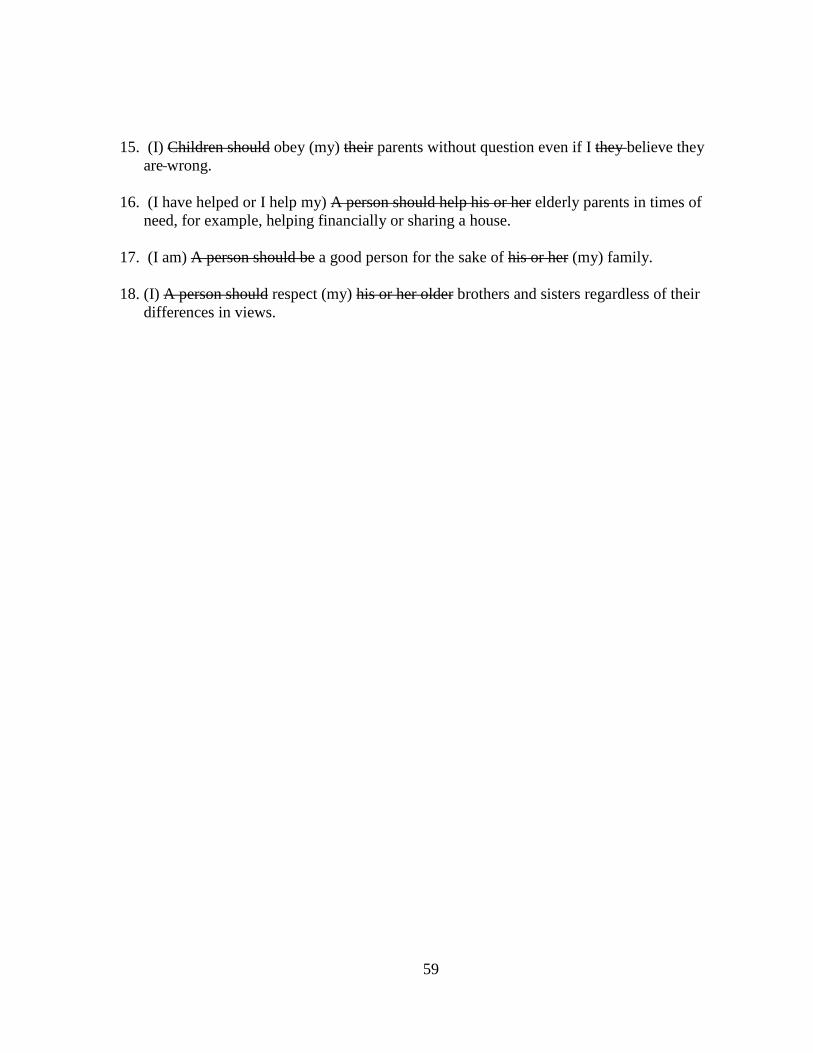
59
15. (I) Children should obey (my) their parents without question even if I they believe they
are wrong.
16. (I have helped or I help my) A person should help his or her elderly parents in times of
need, for example, helping financially or sharing a house.
17. (I am) A person should be a good person for the sake of his or her (my) family.
18. (I) A person should respect (my) his or her older brothers and sisters regardless of their
differences in views.

60
APPENDIX C: FS AND B-FS SCALES
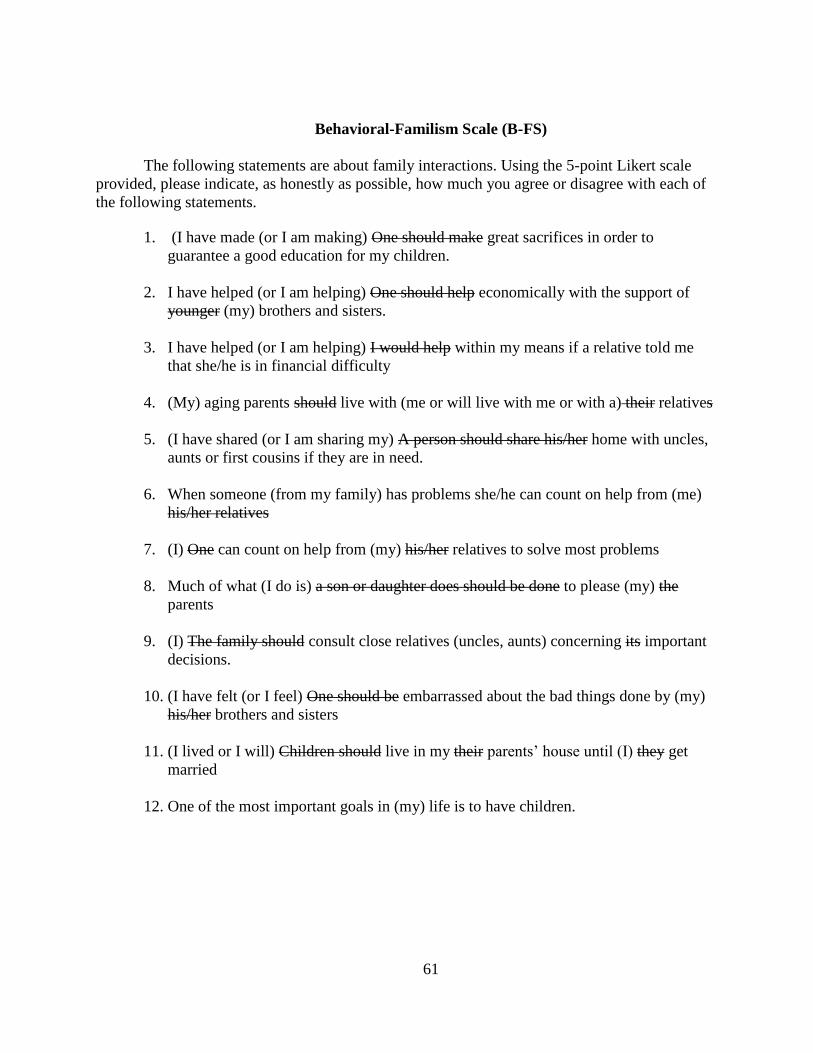
61
Behavioral-Familism Scale (B-FS)
The following statements are about family interactions. Using the 5-point Likert scale
provided, please indicate, as honestly as possible, how much you agree or disagree with each of
the following statements.
1. (I have made (or I am making) One should make great sacrifices in order to
guarantee a good education for my children.
2. I have helped (or I am helping) One should help economically with the support of
younger (my) brothers and sisters.
3. I have helped (or I am helping) I would help within my means if a relative told me
that she/he is in financial difficulty
4. (My) aging parents should live with (me or will live with me or with a) their relatives
5. (I have shared (or I am sharing my) A person should share his/her home with uncles,
aunts or first cousins if they are in need.
6. When someone (from my family) has problems she/he can count on help from (me)
his/her relatives
7. (I) One can count on help from (my) his/her relatives to solve most problems
8. Much of what (I do is) a son or daughter does should be done to please (my) the
parents
9. (I) The family should consult close relatives (uncles, aunts) concerning its important
decisions.
10. (I have felt (or I feel) One should be embarrassed about the bad things done by (my)
his/her brothers and sisters
11. (I lived or I will) Children should live in my their parents’ house until (I) they get
married
12. One of the most important goals in (my) life is to have children.
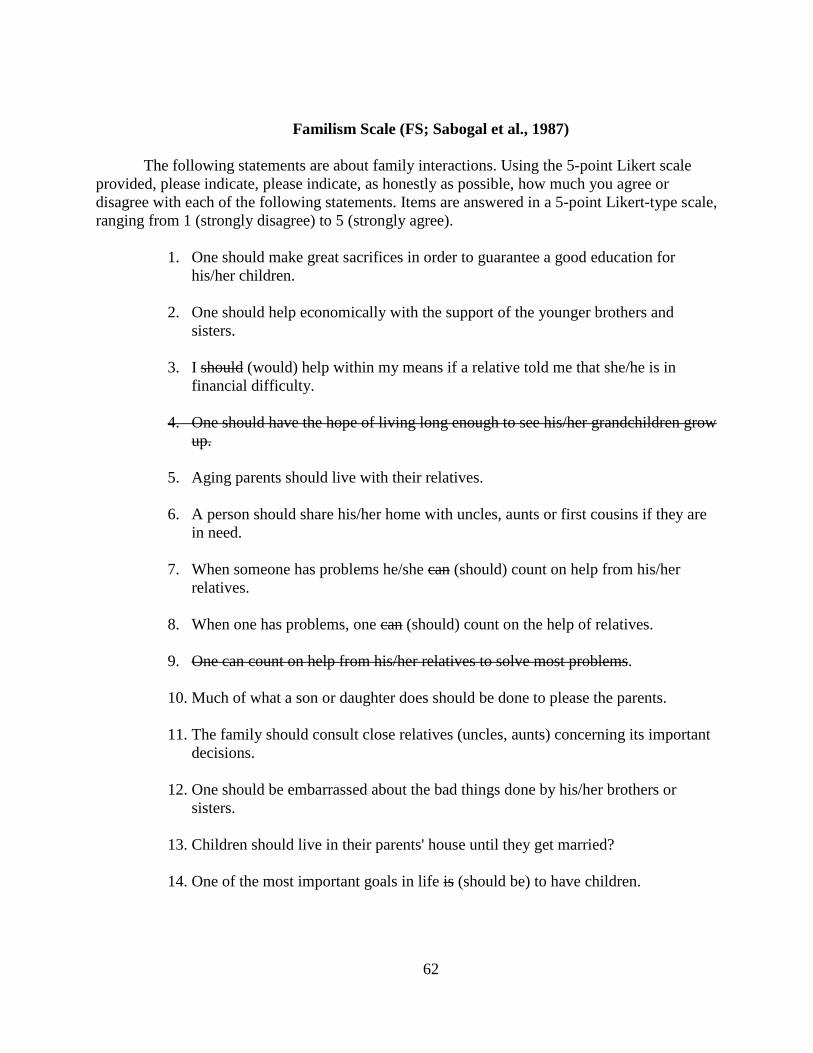
62
Familism Scale (FS; Sabogal et al., 1987)
The following statements are about family interactions. Using the 5-point Likert scale
provided, please indicate, please indicate, as honestly as possible, how much you agree or
disagree with each of the following statements. Items are answered in a 5-point Likert-type scale,
ranging from 1 (strongly disagree) to 5 (strongly agree).
1. One should make great sacrifices in order to guarantee a good education for
his/her children.
2. One should help economically with the support of the younger brothers and
sisters.
3. I should (would) help within my means if a relative told me that she/he is in
financial difficulty.
4. One should have the hope of living long enough to see his/her grandchildren grow
up.
5. Aging parents should live with their relatives.
6. A person should share his/her home with uncles, aunts or first cousins if they are
in need.
7. When someone has problems he/she can (should) count on help from his/her
relatives.
8. When one has problems, one can (should) count on the help of relatives.
9. One can count on help from his/her relatives to solve most problems.
10. Much of what a son or daughter does should be done to please the parents.
11. The family should consult close relatives (uncles, aunts) concerning its important
decisions.
12. One should be embarrassed about the bad things done by his/her brothers or
sisters.
13. Children should live in their parents' house until they get married?
14. One of the most important goals in life is (should be) to have children.

63
APPENDIX D: PSYCHOMETRIC PROPERTIES OF THE B-FS
64
Development of a Behavioral Familism Scale: A Manuscript Describing the Psychometric
Properties of the FS and B-FS
B-FS Scale Development
One of most widely used attitudinal familism scales is the Familism Scale (FS; Sabogal et
al., 1987). This scale measures individuals’ ideal familial values while disregarding the
behavioral dimension of familism or individuals’ actual experiences of familism. Given this
measurement limitation, this study developed a behavioral scale compatible with the FS to
address this issue. First, face and content validity were examined for each existing attitudinal
scale through expert analysis consensus. Expert analysis was conducted by three researchers, two
of whom were bilingual (English-Spanish) and bicultural. Minimal edits were deemed necessary
to the original FS. These modifications included changes in modal verbs (e.g. should) to improve
consistency across items and deletion of redundant items. Additionally, an alternate item was
developed for college students to capture typical living arrangements of this population. The
slightly edited FS included 12 items, instead of 14 items as the original scale. Appendix B
displays the modified FS used in this study.
Test-Retest Reliability
The test-retest reliability of the FS and its corresponding B-FS were examined using
Sample 1 for both racial/ethnic groups combined. Analyses were not performed by racial/ethnic
group separately due to insufficient number of Latinos in this sample. Participants completed the
scales two times one week apart. Table C1 shows the results of the test-retest reliability between
Time 1 and Time 2 administrations.
65
Familism Scale
The correlation for the Total Composite Score of the FS between Time 1 and Time 2 was
high (.74). The correlations for all the FS subscales were moderate, except for the Family as
Source of Support, which was moderate (.47). The ICC for the Total Composite Score of the FS
was excellent .85 (ICC = .85, r = .74, 95% CI [0.78, 0.89]. The ICCs for all FS subscales were
excellent (ICC = .80, r = .67, 95% IC [0.71, 0.86] to ICC = .80, r = .66, 95% IC [0.71, 0.86]),
except for the Family as a Source of Support subscale, which was good (ICC = .64, r = .47, 95%
IC [0.47, 0.75]).
Behavioral Familism Scale
The correlations for the Total Composite Score of the corresponding B-FS between Time
1 and Time 2 was very high (.80). The correlations for all the FS subscales were high and ranged
from .68) to .75. The ICCs for the Total Composite Score of the B-FS was excellent (ICC = .88,
r = .80, 95% CI [0.83, 0.92]). The ICCs for all B-FS subscales were excellent (ICC = .78, r =
.68, 95% IC [0.68, 0.85]) to (ICC = .86, r = .75, 95% IC [0.79, 0.90]).
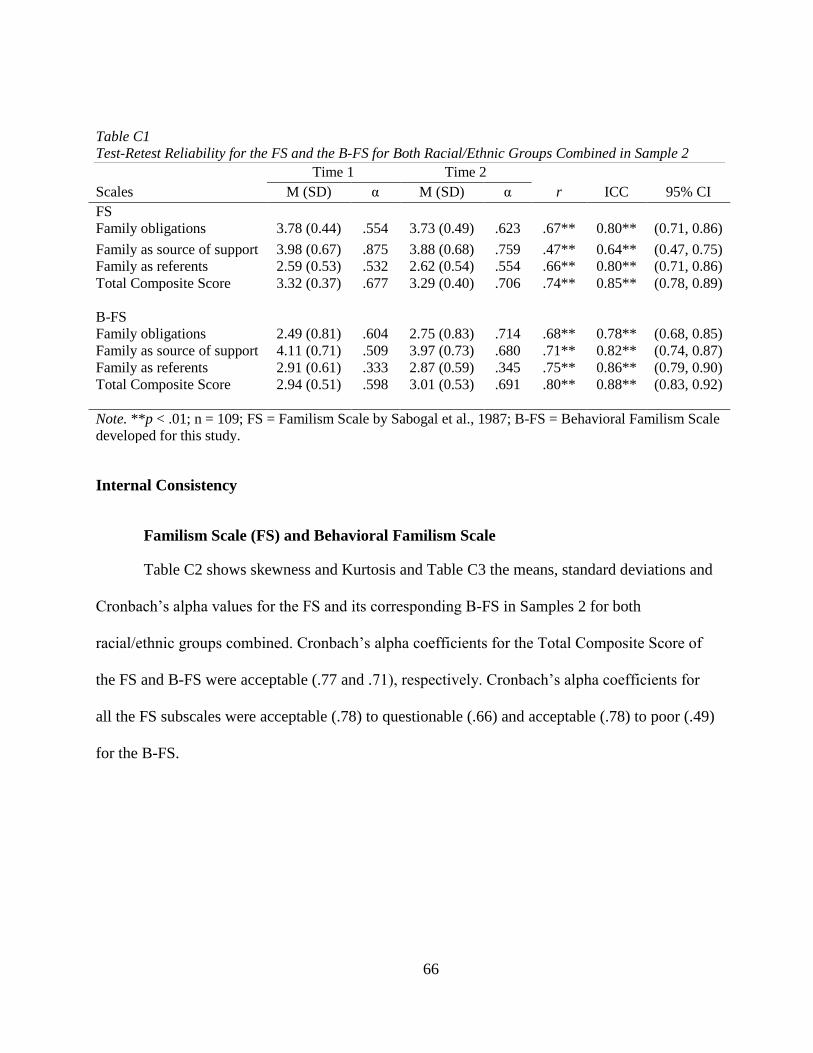
66
Internal Consistency
Familism Scale (FS) and Behavioral Familism Scale
Table C2 shows skewness and Kurtosis and Table C3 the means, standard deviations and
Cronbach’s alpha values for the FS and its corresponding B-FS in Samples 2 for both
racial/ethnic groups combined. Cronbach’s alpha coefficients for the Total Composite Score of
the FS and B-FS were acceptable (.77 and .71), respectively. Cronbach’s alpha coefficients for
all the FS subscales were acceptable (.78) to questionable (.66) and acceptable (.78) to poor (.49)
for the B-FS.
Table C1
Test-Retest Reliability for the FS and the B-FS for Both Racial/Ethnic Groups Combined in Sample 2
Time 1 Time 2
Scales M (SD) α M (SD) α r ICC 95% CI
FS
Family obligations
3.78 (0.44)
.554
3.73 (0.49)
.623
.67**
0.80**
(0.71, 0.86)
Family as source of support 3.98 (0.67) .875 3.88 (0.68) .759 .47** 0.64** (0.47, 0.75)
Family as referents 2.59 (0.53) .532 2.62 (0.54) .554 .66** 0.80** (0.71, 0.86)
Total Composite Score 3.32 (0.37) .677 3.29 (0.40) .706 .74** 0.85** (0.78, 0.89)
B-FS
Family obligations 2.49 (0.81) .604 2.75 (0.83) .714 .68** 0.78** (0.68, 0.85)
Family as source of support 4.11 (0.71) .509 3.97 (0.73) .680 .71** 0.82** (0.74, 0.87)
Family as referents 2.91 (0.61) .333 2.87 (0.59) .345 .75** 0.86** (0.79, 0.90)
Total Composite Score 2.94 (0.51) .598 3.01 (0.53) .691 .80** 0.88** (0.83, 0.92)
Note. **p < .01; n = 109; FS = Familism Scale by Sabogal et al., 1987; B-FS = Behavioral Familism Scale
developed for this study.
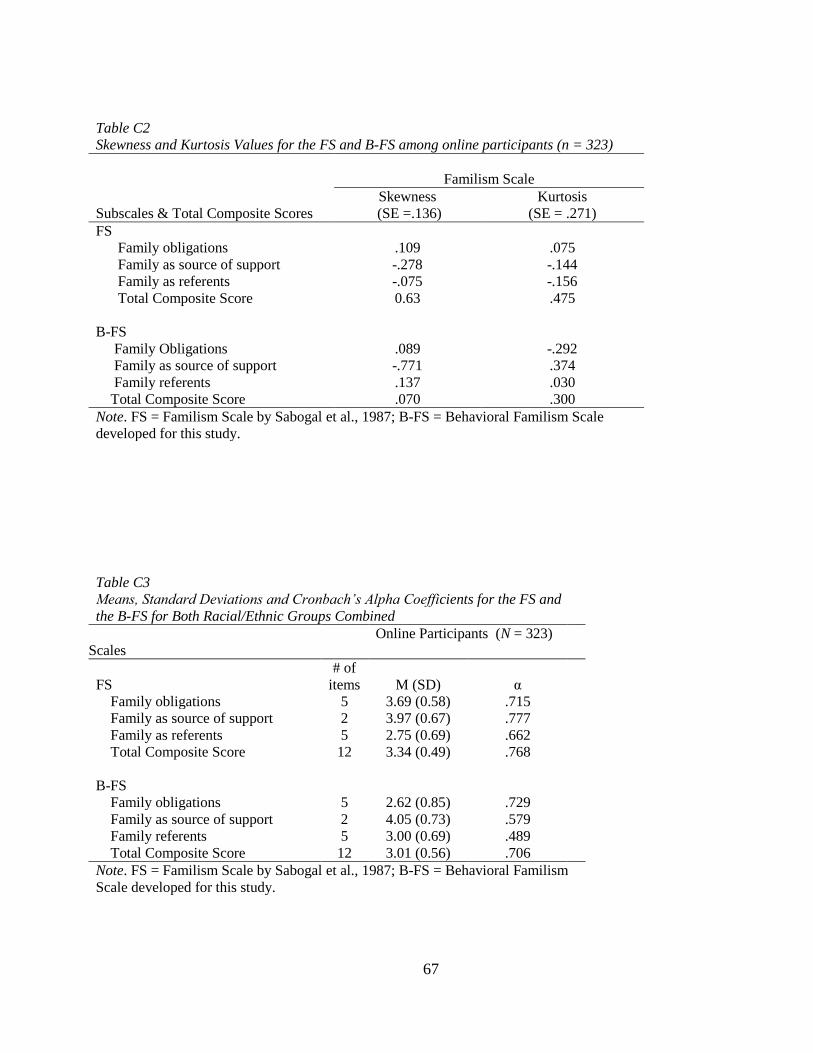
67
Table C2
Skewness and Kurtosis Values for the FS and B-FS among online participants (n = 323)
Familism Scale
Subscales & Total Composite Scores
Skewness
(SE =.136)
Kurtosis
(SE = .271)
FS
Family obligations .109 .075
Family as source of support -.278 -.144
Family as referents -.075 -.156
Total Composite Score 0.63 .475
B-FS
Family Obligations .089 -.292
Family as source of support -.771 .374
Family referents .137 .030
Total Composite Score .070 .300
Note. FS = Familism Scale by Sabogal et al., 1987; B-FS = Behavioral Familism Scale
developed for this study.
Table C3
Means, Standard Deviations and Cronbach’s Alpha Coefficients for the FS and
the B-FS for Both Racial/Ethnic Groups Combined
Scales
Online Participants (N = 323)
FS
# of
items
M (SD)
α
Family obligations 5 3.69 (0.58) .715
Family as source of support 2 3.97 (0.67) .777
Family as referents 5 2.75 (0.69) .662
Total Composite Score 12 3.34 (0.49) .768
B-FS
Family obligations 5 2.62 (0.85) .729
Family as source of support 2 4.05 (0.73) .579
Family referents 5 3.00 (0.69) .489
Total Composite Score 12 3.01 (0.56) .706
Note. FS = Familism Scale by Sabogal et al., 1987; B-FS = Behavioral Familism
Scale developed for this study.
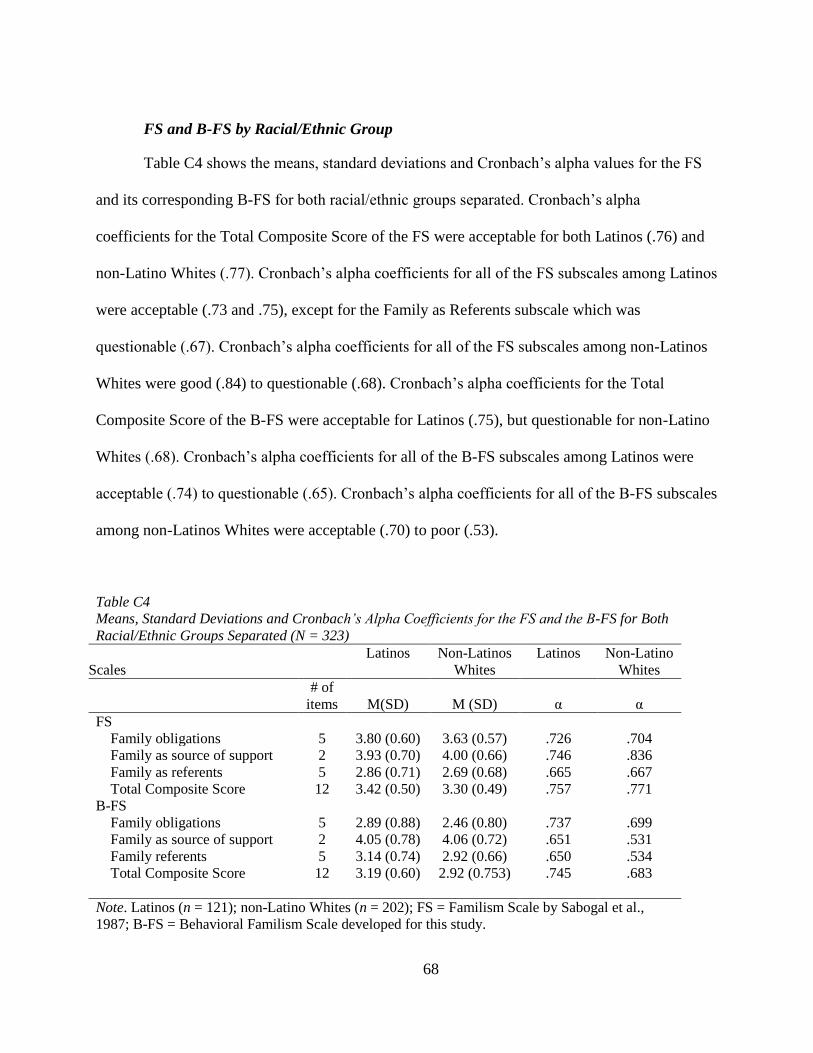
68
FS and B-FS by Racial/Ethnic Group
Table C4 shows the means, standard deviations and Cronbach’s alpha values for the FS
and its corresponding B-FS for both racial/ethnic groups separated. Cronbach’s alpha
coefficients for the Total Composite Score of the FS were acceptable for both Latinos (.76) and
non-Latino Whites (.77). Cronbach’s alpha coefficients for all of the FS subscales among Latinos
were acceptable (.73 and .75), except for the Family as Referents subscale which was
questionable (.67). Cronbach’s alpha coefficients for all of the FS subscales among non-Latinos
Whites were good (.84) to questionable (.68). Cronbach’s alpha coefficients for the Total
Composite Score of the B-FS were acceptable for Latinos (.75), but questionable for non-Latino
Whites (.68). Cronbach’s alpha coefficients for all of the B-FS subscales among Latinos were
acceptable (.74) to questionable (.65). Cronbach’s alpha coefficients for all of the B-FS subscales
among non-Latinos Whites were acceptable (.70) to poor (.53).
Table C4
Means, Standard Deviations and Cronbach’s Alpha Coefficients for the FS and the B-FS for Both
Racial/Ethnic Groups Separated (N = 323)
Scales
Latinos
Non-Latinos
Whites
Latinos
Non-Latino
Whites
# of
items
M(SD)
M (SD)
α
α
FS
Family obligations 5 3.80 (0.60) 3.63 (0.57) .726 .704
Family as source of support 2 3.93 (0.70) 4.00 (0.66) .746 .836
Family as referents 5 2.86 (0.71) 2.69 (0.68) .665 .667
Total Composite Score 12 3.42 (0.50) 3.30 (0.49) .757 .771
B-FS
Family obligations 5 2.89 (0.88) 2.46 (0.80) .737 .699
Family as source of support 2 4.05 (0.78) 4.06 (0.72) .651 .531
Family referents 5 3.14 (0.74) 2.92 (0.66) .650 .534
Total Composite Score 12 3.19 (0.60) 2.92 (0.753) .745 .683
Note. Latinos (n = 121); non-Latino Whites (n = 202); FS = Familism Scale by Sabogal et al.,
1987; B-FS = Behavioral Familism Scale developed for this study.
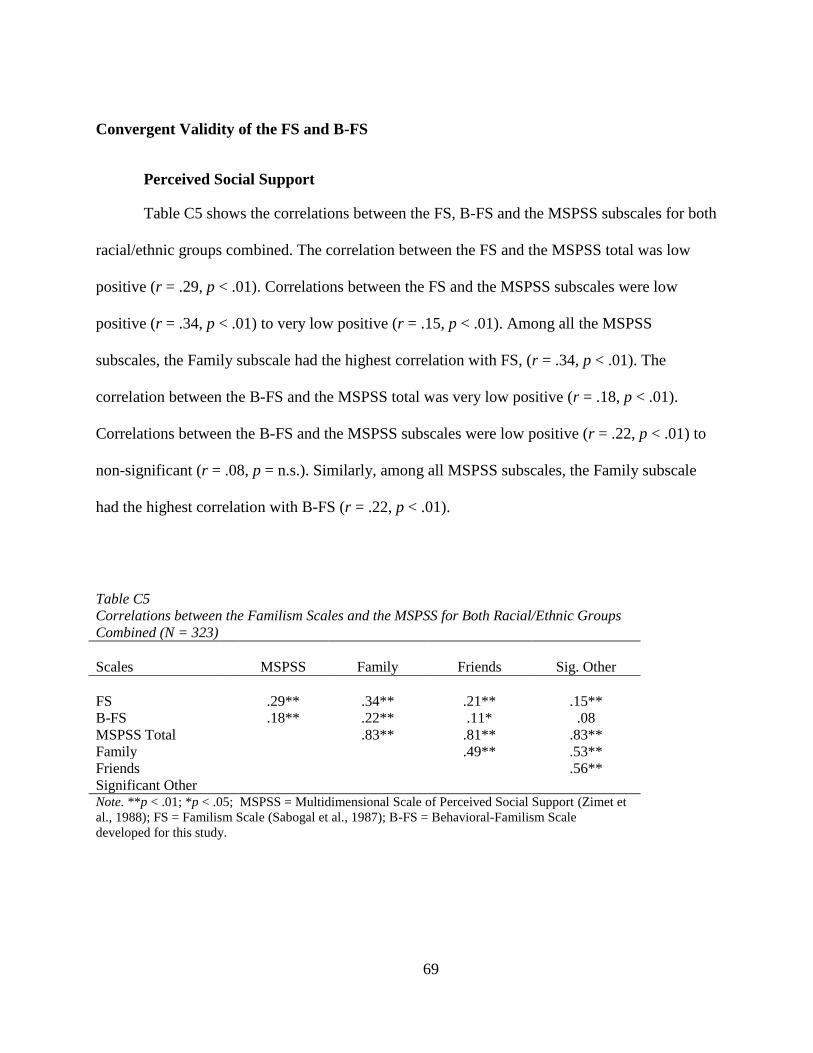
69
Convergent Validity of the FS and B-FS
Perceived Social Support
Table C5 shows the correlations between the FS, B-FS and the MSPSS subscales for both
racial/ethnic groups combined. The correlation between the FS and the MSPSS total was low
positive (r = .29, p < .01). Correlations between the FS and the MSPSS subscales were low
positive (r = .34, p < .01) to very low positive (r = .15, p < .01). Among all the MSPSS
subscales, the Family subscale had the highest correlation with FS, (r = .34, p < .01). The
correlation between the B-FS and the MSPSS total was very low positive (r = .18, p < .01).
Correlations between the B-FS and the MSPSS subscales were low positive (r = .22, p < .01) to
non-significant (r = .08, p = n.s.). Similarly, among all MSPSS subscales, the Family subscale
had the highest correlation with B-FS (r = .22, p < .01).
Table C5
Correlations between the Familism Scales and the MSPSS for Both Racial/Ethnic Groups
Combined (N = 323)
Scales
MSPSS
Family
Friends
Sig. Other
FS
.29**
.34**
.21**
.15**
B-FS .18** .22** .11* .08
MSPSS Total .83** .81** .83**
Family .49** .53**
Friends .56**
Significant Other Note. **p < .01; *p < .05; MSPSS = Multidimensional Scale of Perceived Social Support (Zimet et
al., 1988); FS = Familism Scale (Sabogal et al., 1987); B-FS = Behavioral-Familism Scale
developed for this study.
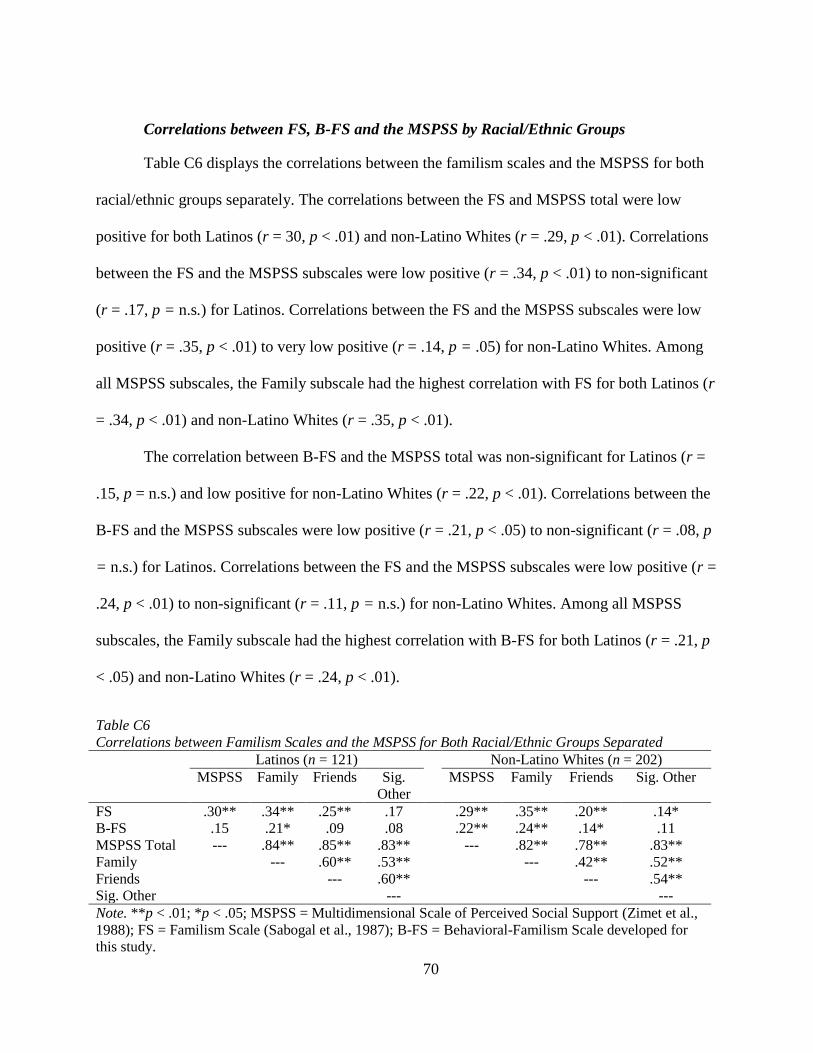
70
Correlations between FS, B-FS and the MSPSS by Racial/Ethnic Groups
Table C6 displays the correlations between the familism scales and the MSPSS for both
racial/ethnic groups separately. The correlations between the FS and MSPSS total were low
positive for both Latinos (r = 30, p < .01) and non-Latino Whites (r = .29, p < .01). Correlations
between the FS and the MSPSS subscales were low positive (r = .34, p < .01) to non-significant
(r = .17, p = n.s.) for Latinos. Correlations between the FS and the MSPSS subscales were low
positive (r = .35, p < .01) to very low positive (r = .14, p = .05) for non-Latino Whites. Among
all MSPSS subscales, the Family subscale had the highest correlation with FS for both Latinos (r
= .34, p < .01) and non-Latino Whites (r = .35, p < .01).
The correlation between B-FS and the MSPSS total was non-significant for Latinos (r =
.15, p = n.s.) and low positive for non-Latino Whites (r = .22, p < .01). Correlations between the
B-FS and the MSPSS subscales were low positive (r = .21, p < .05) to non-significant (r = .08, p
= n.s.) for Latinos. Correlations between the FS and the MSPSS subscales were low positive (r =
.24, p < .01) to non-significant (r = .11, p = n.s.) for non-Latino Whites. Among all MSPSS
subscales, the Family subscale had the highest correlation with B-FS for both Latinos (r = .21, p
< .05) and non-Latino Whites (r = .24, p < .01).
Table C6
Correlations between Familism Scales and the MSPSS for Both Racial/Ethnic Groups Separated
Latinos (n = 121) Non-Latino Whites (n = 202)
MSPSS Family Friends Sig.
Other
MSPSS Family Friends Sig. Other
FS .30** .34** .25** .17 .29** .35** .20** .14*
B-FS .15 .21* .09 .08 .22** .24** .14* .11
MSPSS Total --- .84** .85** .83** --- .82** .78** .83**
Family --- .60** .53** --- .42** .52**
Friends --- .60** --- .54**
Sig. Other --- ---
Note. **p < .01; *p < .05; MSPSS = Multidimensional Scale of Perceived Social Support (Zimet et al.,
1988); FS = Familism Scale (Sabogal et al., 1987); B-FS = Behavioral-Familism Scale developed for
this study.
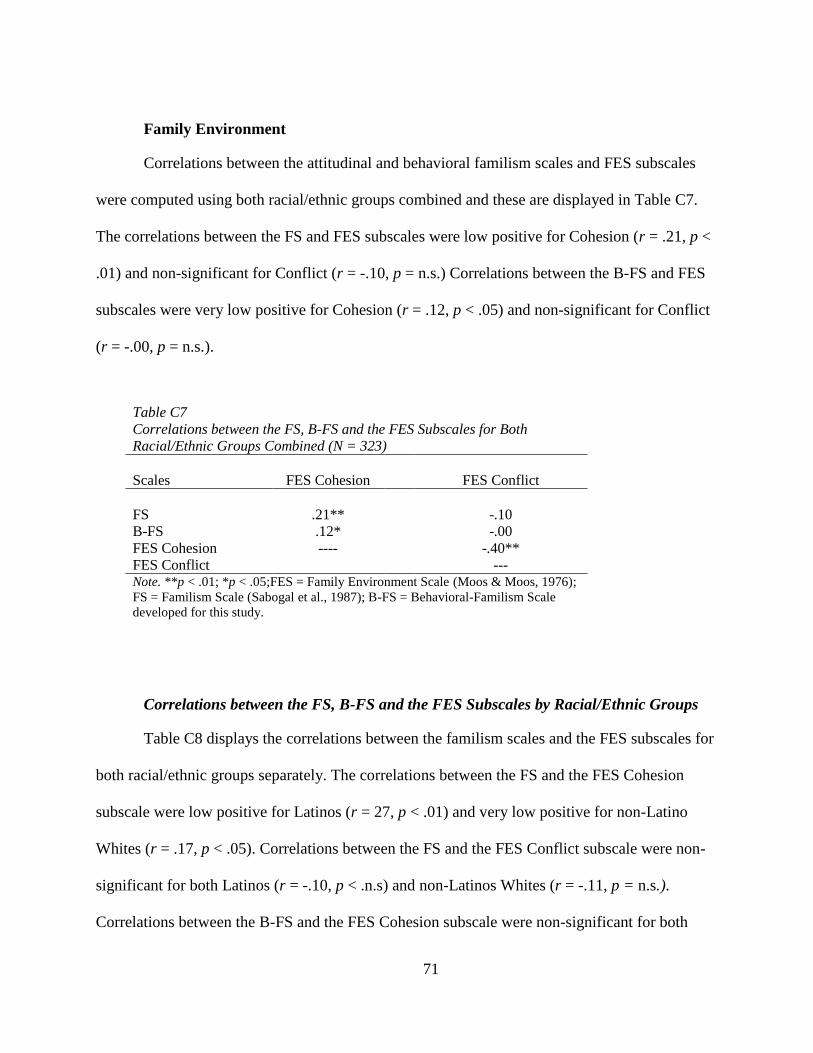
71
Family Environment
Correlations between the attitudinal and behavioral familism scales and FES subscales
were computed using both racial/ethnic groups combined and these are displayed in Table C7.
The correlations between the FS and FES subscales were low positive for Cohesion (r = .21, p <
.01) and non-significant for Conflict (r = -.10, p = n.s.) Correlations between the B-FS and FES
subscales were very low positive for Cohesion (r = .12, p < .05) and non-significant for Conflict
(r = -.00, p = n.s.).
Correlations between the FS, B-FS and the FES Subscales by Racial/Ethnic Groups
Table C8 displays the correlations between the familism scales and the FES subscales for
both racial/ethnic groups separately. The correlations between the FS and the FES Cohesion
subscale were low positive for Latinos (r = 27, p < .01) and very low positive for non-Latino
Whites (r = .17, p < .05). Correlations between the FS and the FES Conflict subscale were non-
significant for both Latinos (r = -.10, p < .n.s) and non-Latinos Whites (r = -.11, p = n.s.).
Correlations between the B-FS and the FES Cohesion subscale were non-significant for both
Table C7
Correlations between the FS, B-FS and the FES Subscales for Both
Racial/Ethnic Groups Combined (N = 323)
Scales
FES Cohesion
FES Conflict
FS
.21**
-.10
B-FS .12* -.00
FES Cohesion ---- -.40**
FES Conflict --- Note. **p < .01; *p < .05;FES = Family Environment Scale (Moos & Moos, 1976);
FS = Familism Scale (Sabogal et al., 1987); B-FS = Behavioral-Familism Scale
developed for this study.
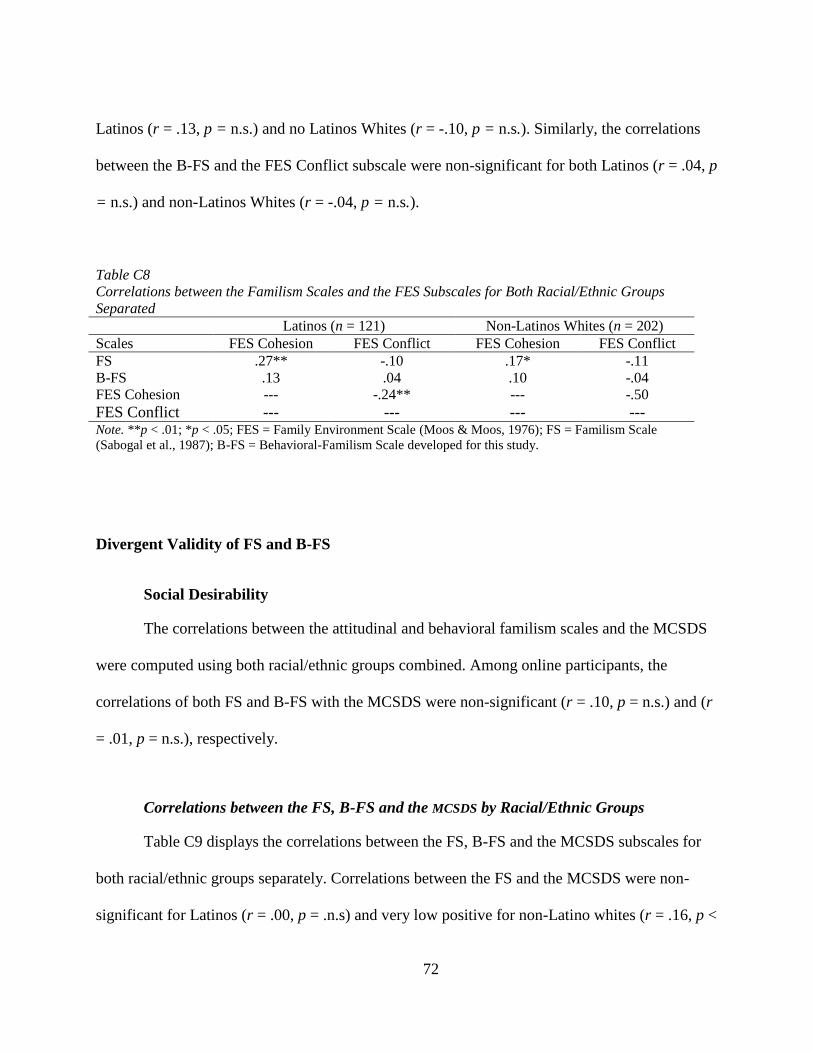
72
Latinos (r = .13, p = n.s.) and no Latinos Whites (r = -.10, p = n.s.). Similarly, the correlations
between the B-FS and the FES Conflict subscale were non-significant for both Latinos (r = .04, p
= n.s.) and non-Latinos Whites (r = -.04, p = n.s.).
Table C8
Correlations between the Familism Scales and the FES Subscales for Both Racial/Ethnic Groups
Separated Latinos (n = 121) Non-Latinos Whites (n = 202)
Scales FES Cohesion FES Conflict FES Cohesion FES Conflict
FS .27** -.10 .17* -.11
B-FS .13 .04 .10 -.04
FES Cohesion --- -.24** --- -.50
FES Conflict --- --- --- --- Note. **p < .01; *p < .05; FES = Family Environment Scale (Moos & Moos, 1976); FS = Familism Scale
(Sabogal et al., 1987); B-FS = Behavioral-Familism Scale developed for this study.
Divergent Validity of FS and B-FS
Social Desirability
The correlations between the attitudinal and behavioral familism scales and the MCSDS
were computed using both racial/ethnic groups combined. Among online participants, the
correlations of both FS and B-FS with the MCSDS were non-significant (r = .10, p = n.s.) and (r
= .01, p = n.s.), respectively.
Correlations between the FS, B-FS and the MCSDS by Racial/Ethnic Groups
Table C9 displays the correlations between the FS, B-FS and the MCSDS subscales for
both racial/ethnic groups separately. Correlations between the FS and the MCSDS were non-
significant for Latinos (r = .00, p = .n.s) and very low positive for non-Latino whites (r = .16, p <
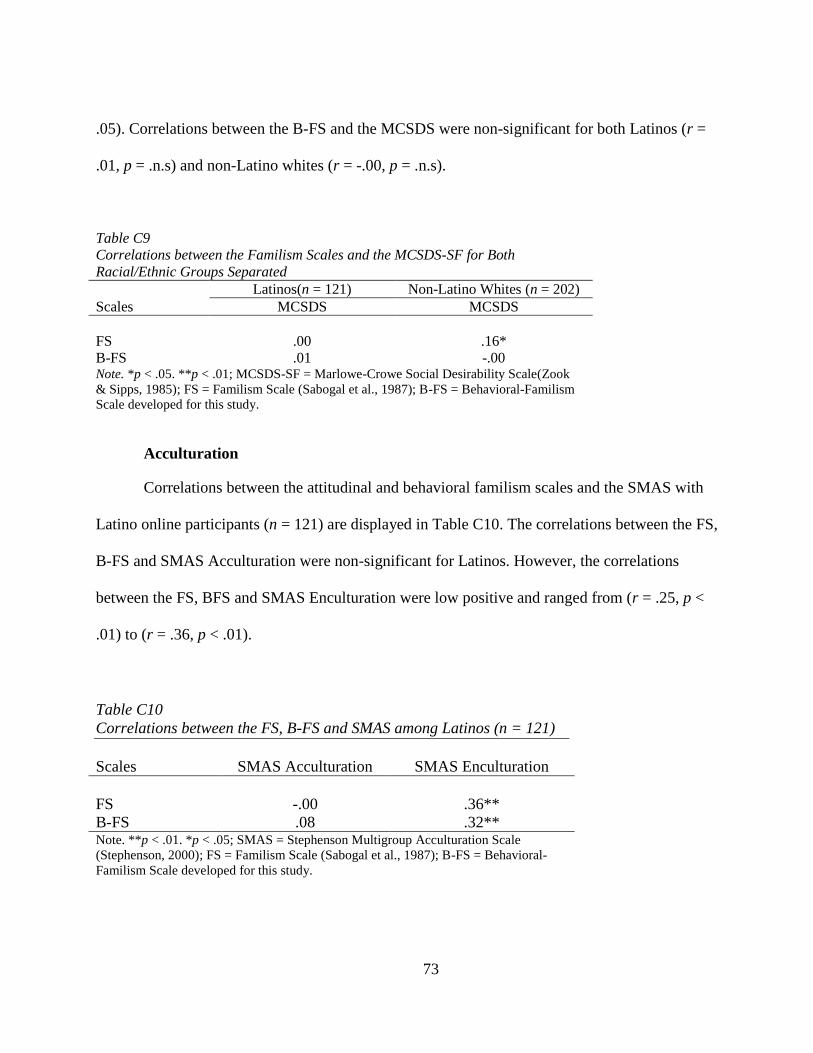
73
.05). Correlations between the B-FS and the MCSDS were non-significant for both Latinos (r =
.01, p = .n.s) and non-Latino whites (r = -.00, p = .n.s).
Table C9
Correlations between the Familism Scales and the MCSDS-SF for Both
Racial/Ethnic Groups Separated
Latinos(n = 121) Non-Latino Whites (n = 202)
Scales MCSDS MCSDS
FS
.00
.16*
B-FS .01 -.00 Note. *p < .05. **p < .01; MCSDS-SF = Marlowe-Crowe Social Desirability Scale(Zook
& Sipps, 1985); FS = Familism Scale (Sabogal et al., 1987); B-FS = Behavioral-Familism
Scale developed for this study.
Acculturation
Correlations between the attitudinal and behavioral familism scales and the SMAS with
Latino online participants (n = 121) are displayed in Table C10. The correlations between the FS,
B-FS and SMAS Acculturation were non-significant for Latinos. However, the correlations
between the FS, BFS and SMAS Enculturation were low positive and ranged from (r = .25, p <
.01) to (r = .36, p < .01).
Table C10
Correlations between the FS, B-FS and SMAS among Latinos (n = 121)
Scales
SMAS Acculturation
SMAS Enculturation
FS -.00 .36**
B-FS .08 .32** Note. **p < .01. *p < .05; SMAS = Stephenson Multigroup Acculturation Scale
(Stephenson, 2000); FS = Familism Scale (Sabogal et al., 1987); B-FS = Behavioral-
Familism Scale developed for this study.

74
APPENDIX E: DEMOGRAPHIC QUESTIONNAIRE
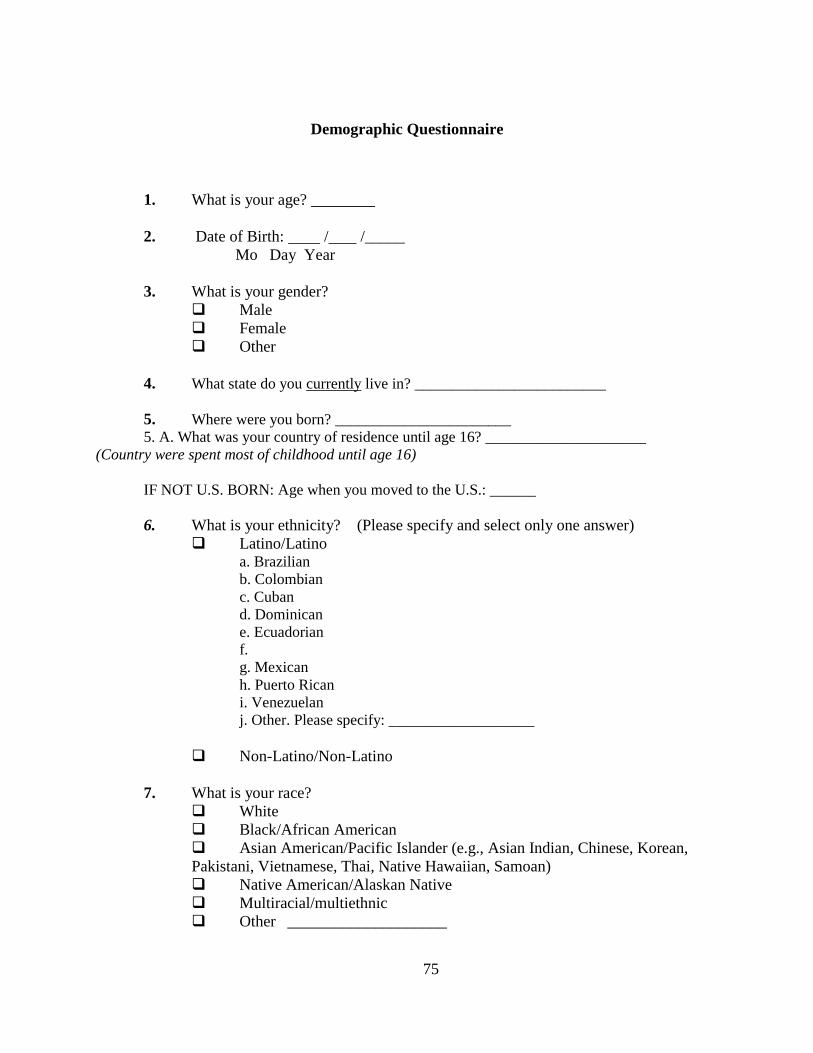
75
Demographic Questionnaire
1. What is your age? ________
2. Date of Birth: / /_____
Mo Day Year
3. What is your gender?
Male
Female
Other
4. What state do you currently live in? _________________________
5. Where were you born? _______________________
5. A. What was your country of residence until age 16? _____________________
(Country were spent most of childhood until age 16)
IF NOT U.S. BORN: Age when you moved to the U.S.: ______
6. What is your ethnicity? (Please specify and select only one answer)
Latino/Latino a. Brazilian
b. Colombian
c. Cuban
d. Dominican
e. Ecuadorian
f.
g. Mexican
h. Puerto Rican
i. Venezuelan
j. Other. Please specify: ___________________
Non-Latino/Non-Latino
7. What is your race?
White
Black/African American
Asian American/Pacific Islander (e.g., Asian Indian, Chinese, Korean,
Pakistani, Vietnamese, Thai, Native Hawaiian, Samoan)
Native American/Alaskan Native
Multiracial/multiethnic
Other ____________________
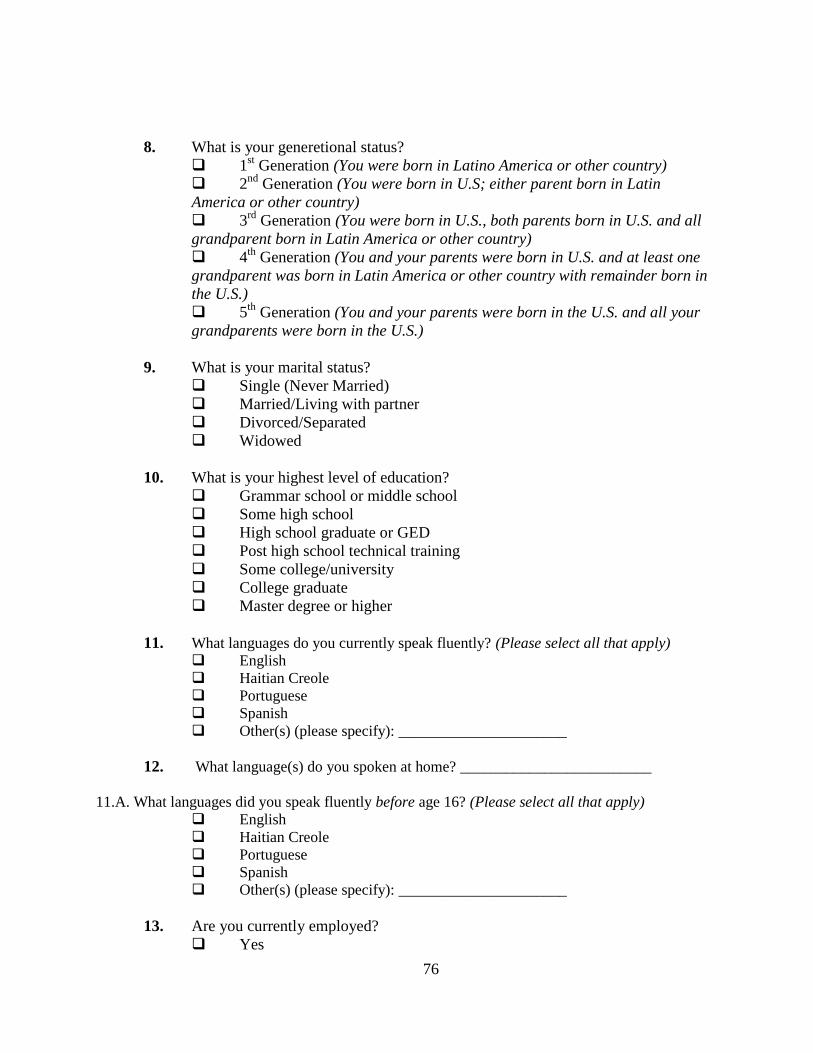
76
8. What is your generetional status?
1st Generation (You were born in Latino America or other country)
2nd
Generation (You were born in U.S; either parent born in Latin
America or other country)
3rd
Generation (You were born in U.S., both parents born in U.S. and all
grandparent born in Latin America or other country)
4th
Generation (You and your parents were born in U.S. and at least one
grandparent was born in Latin America or other country with remainder born in
the U.S.)
5th
Generation (You and your parents were born in the U.S. and all your
grandparents were born in the U.S.)
9. What is your marital status?
Single (Never Married)
Married/Living with partner
Divorced/Separated
Widowed
10. What is your highest level of education?
Grammar school or middle school
Some high school
High school graduate or GED
Post high school technical training
Some college/university
College graduate
Master degree or higher
11. What languages do you currently speak fluently? (Please select all that apply)
English
Haitian Creole
Portuguese
Spanish
Other(s) (please specify): ______________________
12. What language(s) do you spoken at home? _________________________
11.A. What languages did you speak fluently before age 16? (Please select all that apply)
English
Haitian Creole
Portuguese
Spanish
Other(s) (please specify): ______________________
13. Are you currently employed?
Yes
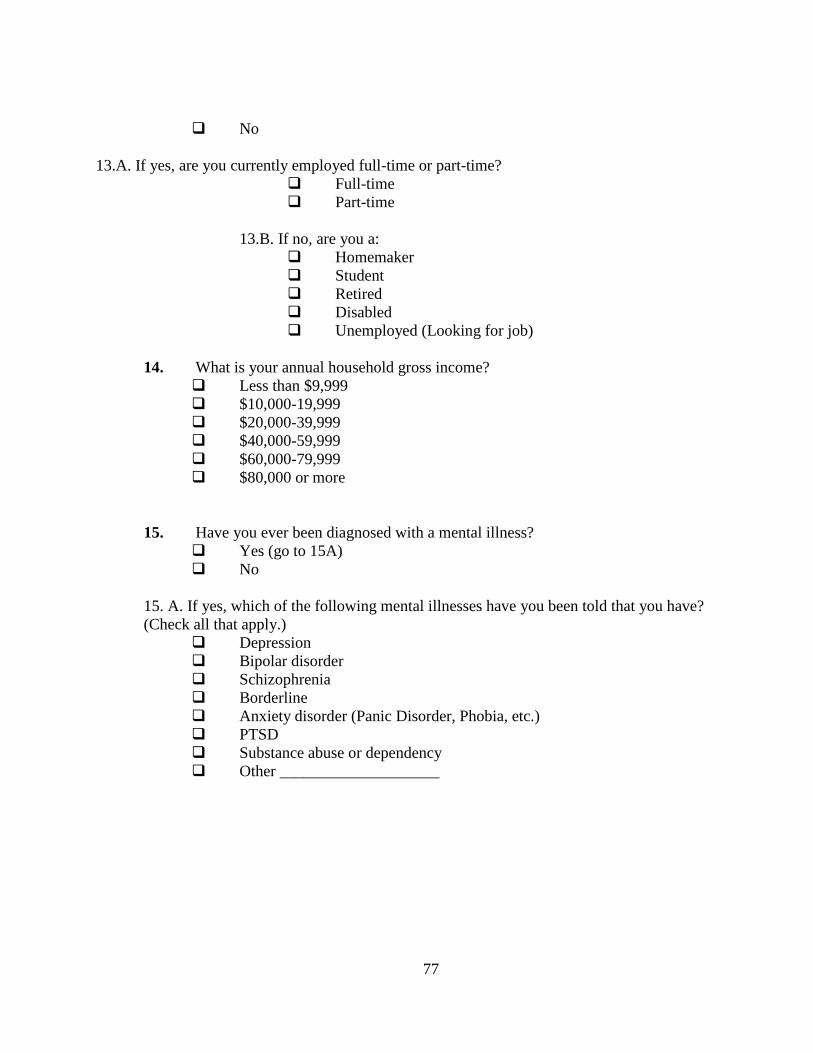
77
No
13.A. If yes, are you currently employed full-time or part-time?
Full-time
Part-time
13.B. If no, are you a:
Homemaker
Student
Retired
Disabled
Unemployed (Looking for job)
14. What is your annual household gross income?
Less than $9,999
$10,000-19,999
$20,000-39,999
$40,000-59,999
$60,000-79,999
$80,000 or more
15. Have you ever been diagnosed with a mental illness?
Yes (go to 15A)
No
15. A. If yes, which of the following mental illnesses have you been told that you have?
(Check all that apply.)
Depression
Bipolar disorder
Schizophrenia
Borderline
Anxiety disorder (Panic Disorder, Phobia, etc.)
PTSD
Substance abuse or dependency
Other ____________________

78
APPENDIX F: AFS AND B-AFS SKEWNESS AND KURTOSIS

79
Skewness and Kurtosis Values for the AFS and B-AFS in Sample 2
Skewness and Kurtosis Values for the AFS and B-AFS in Sample 2 (n = 323)
Familism Scale
Subscales & Total Composite
Scores
Skewness
(SE =.136)
Kurtosis
(SE = .271)
AFS
Family support -.088 -.168
Family interconnectedness -.612 -.267
Family honor .194 .1683
Subjugation of self for family -.334 -.130
Total Composite Score -.182 -.087
B-AFS
Family support .274 -.572
Family interconnectedness -.599 -.283
Family honor .498 -.131
Subjugation of self for family -.276 -.227
Total Composite Score .060 -.297

80
APPENDIX G: DESCRIPTIVE STATISTICS FOR MSPSS, FES, MCSDS-SF
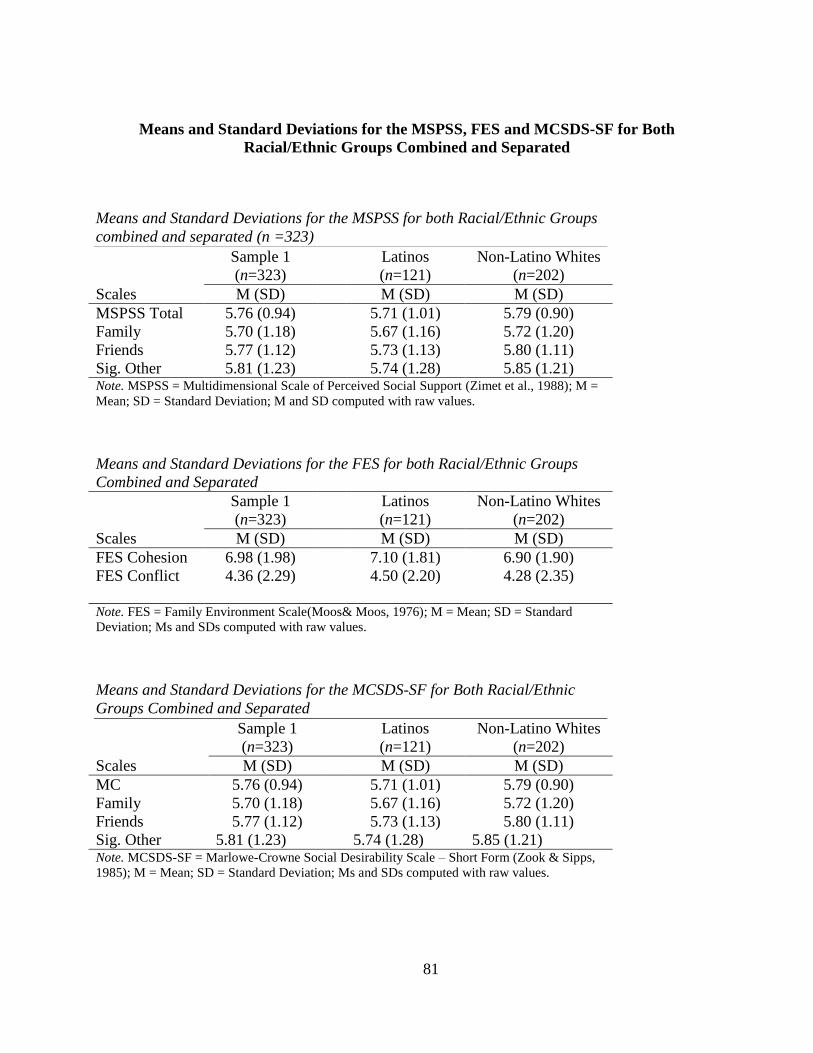
81
Means and Standard Deviations for the MSPSS, FES and MCSDS-SF for Both
Racial/Ethnic Groups Combined and Separated
Means and Standard Deviations for the MSPSS for both Racial/Ethnic Groups
combined and separated (n =323)
Sample 1
(n=323)
Latinos
(n=121)
Non-Latino Whites
(n=202)
Scales M (SD) M (SD) M (SD)
MSPSS Total 5.76 (0.94) 5.71 (1.01) 5.79 (0.90)
Family 5.70 (1.18) 5.67 (1.16) 5.72 (1.20)
Friends 5.77 (1.12) 5.73 (1.13) 5.80 (1.11)
Sig. Other 5.81 (1.23) 5.74 (1.28) 5.85 (1.21) Note. MSPSS = Multidimensional Scale of Perceived Social Support (Zimet et al., 1988); M =
Mean; SD = Standard Deviation; M and SD computed with raw values.
Means and Standard Deviations for the FES for both Racial/Ethnic Groups
Combined and Separated
Sample 1
(n=323)
Latinos
(n=121)
Non-Latino Whites
(n=202)
Scales M (SD) M (SD) M (SD)
FES Cohesion 6.98 (1.98) 7.10 (1.81) 6.90 (1.90)
FES Conflict 4.36 (2.29) 4.50 (2.20) 4.28 (2.35)
Note. FES = Family Environment Scale(Moos& Moos, 1976); M = Mean; SD = Standard
Deviation; Ms and SDs computed with raw values.
Means and Standard Deviations for the MCSDS-SF for Both Racial/Ethnic
Groups Combined and Separated
Sample 1
(n=323)
Latinos
(n=121)
Non-Latino Whites
(n=202)
Scales M (SD) M (SD) M (SD)
MC 5.76 (0.94) 5.71 (1.01) 5.79 (0.90)
Family 5.70 (1.18) 5.67 (1.16) 5.72 (1.20)
Friends 5.77 (1.12) 5.73 (1.13) 5.80 (1.11)
Sig. Other 5.81 (1.23) 5.74 (1.28) 5.85 (1.21) Note. MCSDS-SF = Marlowe-Crowne Social Desirability Scale – Short Form (Zook & Sipps,
1985); M = Mean; SD = Standard Deviation; Ms and SDs computed with raw values.
82
REFERENCES
Alegría, M., Canino, G., Shrout, P. E., Woo, M., Duan, N., Vila, D., … Meng, X. L. (2008).
Prevalence of mental illness in immigrant and non-immigrant U.S. Latino groups. American
Journal of Psychiatry, 165(3), 359–369.
Alegría, M., Carson, N., Flores, M., Li, X., Shi, P., Lessios, A. S., … Interian, A. (2014).
Activation, self-management, engagement, and retention in behavioral health care: a
randomized clinical trial of the DECIDE intervention. JAMA Psychiatry, 71(5), 557–565.
Alegría, M., Mulvaney-Day, N., Torres, M., Polo, A., Cao, Z., & Canino, G. (2007). Prevalence
of Psychiatric Disorders Across Latino Subgroups in the United States. American Journal of
Public Health, 97(1), 68–75. http://doi.org/10.2105/AJPH.2006.087205
Alegría, M., Mulvaney-Day, N., Woo, M., Torres, M., Gao, S., & Oddo, V. (2007). Correlates of
Past-Year Mental Health Service Use Among Latinos: Results From the National Latino
and Asian American Study. American Journal of Public Health, 97(1), 76–83.
http://doi.org/10.2105/AJPH.2006.087197
Alegria, M., Shrout, P. E., Woo, M., Guarnaccia, P., Sribney, W., Vila, D., … Torres, M. (2007).
Understanding differences in past year psychiatric disorders for Latinos living in the US.
Social Science & Medicine, 65(2), 214–230.
Alegría, M., Sribney, W., Woo, M., Torres, M., & Guarnaccia, P. (2007). Looking beyond
nativity: The relation of age of immigration, length of residence, and birth cohorts to the
risk of onset of psychiatric disorders for Latinos. Research in Human Development, 4(1-2),
19–47.
Bardis, P. D. (1959). A familism scale. Marriage & Family Living.
Baumann, A. A., Kuhlberg, J. A., & Zayas, L. H. (2010). Familism, mother-daughter mutuality,
and suicide attempts of adolescent Latinas. Journal of Family Psychology, 24(5), 616–624.
http://doi.org/10.1037/a0020584
Breslau, J., Aguilar-Gaxiola, S., Kendler, K. S., Su, M., Williams, D., & Kessler, R. C. (2006).
Specifying race-ethnic differences in risk for psychiatric disorder in a USA national sample.
Psychological Medicine, 36(1), 57–68. Retrieved from
https://login.ezproxy.net.ucf.edu/login?auth=shibb&url=http://search.ebscohost.com/login.a
spx?direct=true&db=psyh&AN=2006-00963-007&site=ehost-live
Breslau, J., Kendler, K. S., Su, M., Gaxiola-Aguilar, S., & Kessler, R. C. (2005). Lifetime risk
and persistence of psychiatric disorders across ethnic groups in the United States.
Psychological Medicine, 35(03), 317–327.
Cafri, G., van den Berg, P., & Brannick, M. T. (2010). What Have the Difference Scores Not
Been Telling Us? A Critique of the Use of Self--Ideal Discrepancy in the Assessment of
Body Image and Evaluation of an Alternative Data-Analytic Framework. Assessment, 17(3),
361–376. http://doi.org/10.1177/1073191109357028
Calzada, E. J., Tamis-LeMonda, C. S., & Yoshikawa, H. (2013). Familismo in Mexican and
83
Dominican families from low-income, urban communities. Journal of Family Issues,
34(12), 1696–1724.
Campos, B., Schetter, C. D., Abdou, C. M., Hobel, C. J., Glynn, L. M., & Sandman, C. A.
(2008). Familialism, social support, and stress: Positive implications for pregnant Latinas.
Cultural Diversity and Ethnic Minority Psychology, 14(2), 155.
Campos, B., Ullman, J. B., Aguilera, A., & Dunkel Schetter, C. (2014). Familism and
psychological health: the intervening role of closeness and social support. Cultural
Diversity & Ethnic Minority Psychology, 20(2), 191–201. Retrieved from
http://www.ncbi.nlm.nih.gov/pubmed/24773004
Chandler, J., Mueller, P., & Paolacci, G. (2014). Nonnaïveté among Amazon Mechanical Turk
workers: Consequences and solutions for behavioral researchers. Behavior Research
Methods, 46(1), 112–130. http://doi.org/10.3758/s13428-013-0365-7
Chicchetti, D. V. (1994). Guidelines, criteria, and rules of thumb for evaluating normed and
standardized assessment instruments in psychology. Psychological Assessment.
Psychological Assessment, 6(4), 290–294.
Colby, S. L., & Ortman, J. M. (2015). Projections of the Size and Composition of the US
Population: 2014 to 2060. Retrived from: Https://www. Census.
gov/content/dam/Census/library/publications/2015/demo/p25-1143. Pdf.
Comeau, J. A. (2012). Race/ethnicity and family contact: Toward a behavioral measure of
familialism. Hispanic Journal of Behavioral Sciences, 0739986311435899.
Contreras, J. M., López, I. R., Rivera-Mosquera, E. T., Raymond-Smith, L., & Rothstein, K.
(1999). Social support and adjustment among Puerto Rican adolescent mothers: The
moderating effect of acculturation. Journal of Family Psychology, 13(2), 228–243.
http://doi.org/10.1037/0893-3200.13.2.228
Coyne, J. C., & Downey, G. (1991). Social Factors and Psychopathology: Stress, social support,
and coping processes. Annual Review of Psychology, 42, 401–425.
Cronbach, L. J., & Furby, L. (1970). How we should measure “change” - or should we?
Psychological Bulletin, 74(1), 68–80.
DeVellis, R. F. (2016). Scale Development;Theory and Applications (Vol. 26). SAGE
Publications.
Edwards, J. R. (1994a). Regression Analysis as an Alternative to Difference Scores. Journal of
Management, 20(3), 683–689.
Edwards, J. R. (1994b). The study of congruence in organizational behavior research: Critique
and a proposed alternative. Organizational Behavior and Human Decision Processes.
http://doi.org/10.1006/obhd.1994.1029
Edwards, J. R. (1994c). The study of congruence in organizational behavior research: Critique
and a proposed alternative. Organizational Behavior and Human Decision Processes.
http://doi.org/10.1006/obhd.1994.1029
84
Edwards, J. R. (2001). Ten Difference Score Myths. Organizational Research Methods, 4(3),
265–287.
Gamble, W. C., & Modry-Mandell, K. (2008). Family Relations and the Adjustment of Young
Children of Mexican Descent: Do Family Cultural Values Moderate These Associations?
Social Development, 17(2), 358–379. http://doi.org/10.1111/j.1467-9507.2007.00429.x
German, M., Gonzales, N. A., & Dumka, L. (2008). Familism Values as a Protective Factor for
Mexican-Origin Adolescents Exposed to Deviant Peers. The Journal of Early Adolescence,
29(1), 16–42. http://doi.org/10.1177/0272431608324475
Harris, K. M., Edlund, M. J., & Larson, S. (2005). Racial and ethnic differences in the mental
health problems and use of mental health care. Medical Care, 43(8), 775–84. Retrieved
from http://www.ncbi.nlm.nih.gov/pubmed/16034291
Himle, J. A., Baser, R. E., Taylor, R. J., Campbell, R. D., & Jackson, J. S. (2009). Anxiety
disorders among African Americans, blacks of Caribbean descent, and non-Hispanic whites
in the United States. Journal of Anxiety Disorders, 23(5), 578–590.
IBM Corp. Released. (2015). IBM SPSS Statistics for Windows, Version 23.0. 2015.
Institute of Medicine. (2003). Unequal treatment: Confronting racial and ethnic disparities in
health care. (B. D. Smedley, A. Y. Stith, & A. R. Nelson, Eds.), Unequal treatment:
Confronting racial and ethnic disparities in health care. Washington, DC: National
Academies Press. Retrieved from
http://search.ebscohost.com/login.aspx?direct=true&db=psyh&AN=2003-02632-
000&site=ehost-live
Karch, D. L., Barker, L., & Strine, T. W. (2006). Race/ethnicity, substance abuse, and mental
illness among suicide victims in 13 US states: 2004 data from the National Violent Death
Reporting System. Injury Prevention, 12(suppl_2), ii22–ii27.
http://doi.org/10.1136/ip.2006.013557
Keefe, S. (1984). Real and ideal extended familism among Mexican Americans and Anglo
Americans: On the meaning of“ close” family ties. Human Organization, 43(1), 65–70.
Lexell, J. E., & Downham, D. Y. (2005). How to Assess the Reliability of Measurements in
Rehabilitation. American Journal of Physical Medicine & Rehabilitation, 84(9), 719–723.
http://doi.org/10.1097/01.phm.0000176452.17771.20
Moitra, E., Lewis-Fernández, R., Stout, R. L., Angert, E., Weisberg, R. B., & Keller, M. B.
(2014). Disparities in psychosocial functioning in a diverse sample of adults with anxiety
disorders. Journal of Anxiety Disorders, 28(3), 335–343.
http://doi.org/10.1016/j.janxdis.2014.02.002
Moos, R. H. & Moos, B. S. (1976). A typology of family social environments. Family Process,
15(4), 357–371.
Moos, R. H. & Moos, B. S. (1986). The Family Environment Scale: The Manual. Palo Alto, CA:
Consulting Psychology Press.
Ortega, A. N., Feldman, J. M., Canino, G., Steinman, K., & Alegría, M. (2006). Co-occurrence

85
of mental and physical illness in US Latinos. Social Psychiatry and Psychiatric
Epidemiology, 41(12), 927–934. http://doi.org/10.1007/s00127-006-0121-8
Ortega, A. N., Rosenheck, R., Alegria, M., & Desai, R. A. (2000). Acculturation and the lifetime
risk of psychiatric and substance use disorders among Hispanics. The Journal of Nervous
and Mental Disease, 188(11), 728–735.
Oxman, T. E., & Hull, J. G. (2001). Social support and treatment response in older depressed
primary care patients. The Journals of Gerontology. Series B, Psychological Sciences and
Social Sciences, 56(1), P35–45. http://doi.org/10.1093/geronb/56.1.P35
President’s New Freedom Commission on Mental Health. (2003). Achieving the Promise:
Transforming Mental Health Care in America. Mental Health Care.
Rivera, F. I. (2007). Contextualizing the experience of young Latino adults: Acculturation, social
support and depression. Journal of Immigrant and Minority Health, 9(3), 237–244.
Rivera, F. I., Guarnaccia, P. J., Mulvaney-Day, N., Lin, J. Y., Torres, M., & Alegria, M. (2008).
Family cohesion and its relationship to psychological distress among Latino groups.
Hispanic Journal of Behavioral Sciences, 30(3), 357–378.
Rodriguez, N., Mira, C. B., Myers, H. F., Morris, J. K., & Cardoza, D. (2003). Family or friends:
Who plays a greater supportive role for Latino college students? Cultural Diversity and
Ethnic Minority Psychology, 9(3), 236–250. http://doi.org/10.1037/1099-9809.9.3.236
Roohafza, H. R., Afshar, H., Keshteli, A. H., Mohammadi, N., Feizi, A., Taslimi, M., & Adibi,
P. (2014). What’s the role of perceived social support and coping styles in depression and
anxiety? Journal of Research in Medical Sciences : The Official Journal of Isfahan
University of Medical Sciences, 19(10), 944–9. Retrieved from
http://www.ncbi.nlm.nih.gov/pubmed/25538777\nhttp://www.pubmedcentral.nih.gov/article
render.fcgi?artid=PMC4274570
Sabogal, F., Marin, G., Otero-Sabogal, R., Marin, B. V., & Perez-Stable, E. J. (1987). Hispanic
Familism and Acculturation: What Changes and What Doesn’t? Hispanic Journal of
Behavioral Sciences.
Schwartz, S. J. (2007). The applicability of familism to diverse ethnic groups: a preliminary
study. The Journal of Social Psychology, 147(2), 101–118.
Smith, S. M., Roster, C. A., Golden, L. L., & Albaum, G. S. (2016a). A multi-group analysis of
online survey respondent data quality: Comparing a regular USA consumer panel to MTurk
samples. Journal of Business Research, 69(8), 3139–3148.
http://doi.org/10.1016/j.jbusres.2015.12.002
Smith, S. M., Roster, C. A., Golden, L. L., & Albaum, G. S. (2016b). A multi-group analysis of
online survey respondent data quality: Comparing a regular USA consumer panel to MTurk
samples. Journal of Business Research, 69(8), 3139–3148.
http://doi.org/10.1016/j.jbusres.2015.12.002
Steidel, A. G. L., & Contreras, J. M. (2003). A New Familism Scale for Use with Latino
Populations. Hispanic Journal of Behavioral Sciences , 25 (3 ), 312–330.
86
http://doi.org/10.1177/0739986303256912
Stephenson, M. (2000). Development and validation of the Stephenson Multigroup Acculturation
Scale (SMAS). Psychological Assessment, 12(1), 77.
Tisak, J., & Smith, C. S. (1994a). Defending and Extending Difference Score Methods. Journal
of Management, 20(3), 675–682. http://doi.org/10.1177/014920639402000310
Tisak, J., & Smith, C. S. (1994b). Defending and Extending Difference Score Methods. Journal
of Management, 20(3), 675–682. http://doi.org/10.1177/014920639402000310
Triandis, H. C., Marin, G., Betancourt, H., Lisansky, J., & Chang, B.-H. (1982). Dimensions of
familism among Hispanic and mainstream Navy recruits. DTIC Document.
U.S. Departmemt of Health and Human Services. (2001). Mental Health: Culture, Race, and
Ethnicity: a supplement to mental health: a report of the surgeon general. US Public Health
Service: Substance Abuse and Mental Health Services Administration.
Vaz, S., Falkmer, T., Passmore, A. E., Parsons, R., & Andreou, P. (2013). The Case for Using
the Repeatability Coefficient When Calculating Test-Retest Reliability. PLoS ONE, 8(9).
Vega, W. A., Kolody, B., Aguilar-Gaxiola, S., & Catalano, R. (1999). Gaps in Service
Utilization by Mexican Americans With Mental Health Problems. American Journal of
Psychiatry, 156(6), 928–934. http://doi.org/10.1176/ajp.156.6.928
Vega, W. A., Sribney, W. M., Aguilar-Gaxiola, S., & Kolody, B. (2004). 12-month prevalence of
DSM-III-R psychiatric disorders among Mexican Americans: nativity, social assimilation,
and age determinants. The Journal of Nervous and Mental Disease, 192(8), 532–541.
Vega, W., Kolody, B., Valle, R., & Weir, J. (1991). Social networks, social support, and their
relationship to depression among immigrant Mexican women. Human Organization, 50(2),
154–162.
Vega, W., & Lopez, S. R. (2001). Priority issues in Latino mental health services research.
Mental Health Services Research, 3(4), 189–200. Retrieved from
http://www.ncbi.nlm.nih.gov/pubmed/11859965
Weir, J. P. (2005). Quantifying test-retest reliability using the intraclass correlation coefficient
and the SEM. The Journal of Strength & Conditioning Research, 19(1), 231–240.
Zimet, G. D., Dahlem, N. W., Zimet, S. G., & Farley, G. K. (1988). The Multidimensional Scale
of Perceived Social Support. Journal of Personality Assessment, 52(1), 30–41.
http://doi.org/10.1207/s15327752jpa5201_2
Zook, A & Sipps, G. J. (1985). Cross-validation of a short form of the Marlowe-Crowne Social
Desirability Scale. Journal of Clinical Psychology, 41, 236–238.