Embed Size (px)
Citation preview

THE KILTS CENTER FOR MARKETING
NIELSEN DATA SEMINAR
AN INTRODUCTION TO SCANNER DATA
NOVEMBER 5, 2012

KILTS DATA CENTER • What is the Data Center? In partnership with the Nielsen company, the Kilts
Center provides select marketing data to approved academic researchers. • Why is this important? The Nielsen data available at Chicago Booth are unique,
compared to other types of data widely available to academics, in their breadth (e.g. # of years, # product categories, etc.). For academic researchers, these data provide new opportunities for cutting edge research in marketing, economics, public policy, and other areas.
• What do faculty do with the data? Academic questions being explored with these data:
– What are the trends of consumers use of probiotics that are present in many consumer products & goods?
– How do consumers buying habits differ between types of retailers? – How are consumers’ WOP (willingness to pay) changed over time when markets are volatile.
• Who can have access to the data? Raw data are available to U.S.-based tenured
and tenured-track faculty and PhD students who are pursuing academic research. This is stipulated by our licensing agreement with Nielsen. The Kilts Center is working on providing Booth MBA students non-research based opportunities to work with and learn from these data in ways that contribute to their career success.

3
3 NIELSEN DATA SETS AT THE KILTS CENTER
• Consumer Panel Data: data starting in 2004 include a demographically balanced, longitudinal panel of ~40,000-60,000 U.S. households who continually provide information about their households, products bought, and when and where they make purchases from any retail outlet.
• Retail Scanner Data (i.e. POS): weekly pricing, sales volume, and causal
data provided by participating retail store point-of-sale systems in all U.S. markets (~30,000-35,000 grocery, drug, mass merchandiser, and other stores), starting in 2006.
• TV Advertising Data: advertising occurrences, expenditures and
impressions across a range of TV media in all U.S. markets, beginning in 2004
4
HOW STUDENTS CAN BENEFIT FROM NIELSEN DATA Courses:
o 37103 – Data-Driven Marketing (Prof. Hitsch). Scanner data.
o 37202 – Pricing Strategies (Prof. Dubé). Scanner data.
o 41201 – Data Mining (Prof. Taddy). Consumer Panel data.
Nielsen Data Student Seminar: The annual Kilts Center offers students an opportunity learn more about the Nielsen data - what it is and how to use it. Students hear a panel of second-year students share their experiences with Nielsen data during their Marketing internships and receive a glossary of terms. Watch the event recording > http://media.chicagobooth.edu/mediasite/Viewer/?peid=2b1b2555024b4408be65bec0e93964a11d
5
ONLINE NIELSEN DATA RESOURCE FOR STUDENTS Nielsen Academics is an online learning portal focused exclusively on the needs of students and faculty. Suggested modules and resources for Booth MBA students: • Nielsen Company Information outlines the ways that brand managers
might utilize Nielsen throughout the course of their work • Resources about consumer and retail measurement, which is helpful for
describing types of data available and how they were collected. This includes detail on available dimensions and metrics plus their definitions.
• Quick reference guides to datasets (e.g. Homescan, Retail Scanner, and Spectra) that introduce the data and list terms and facts.
Site registration required. Email [email protected] for details.
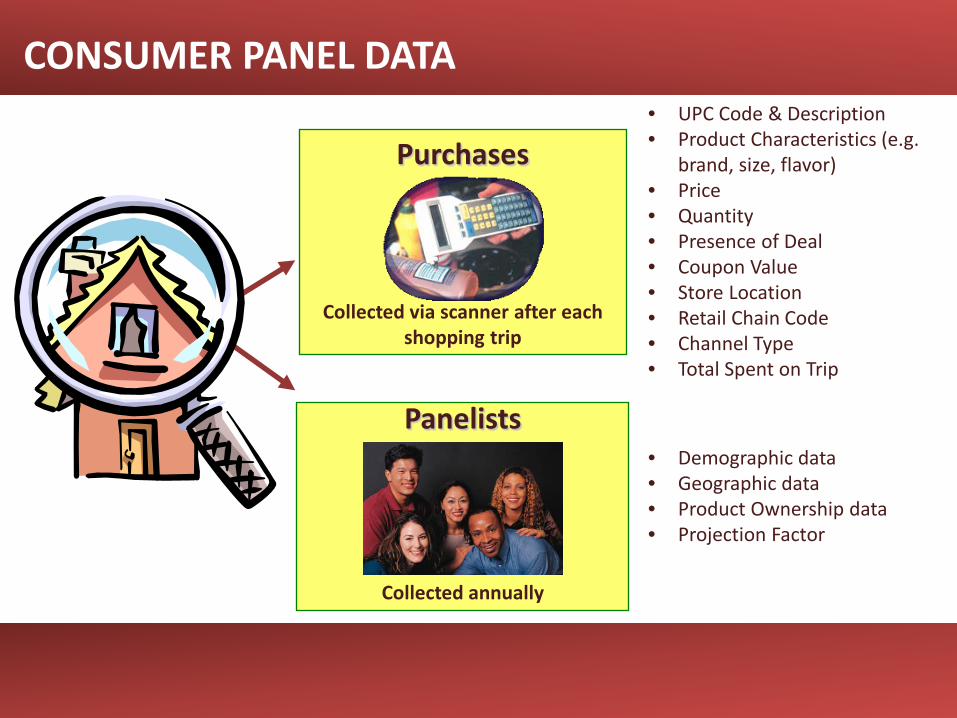
CONSUMER PANEL DATA
6
Panelists
Purchases
Collected via scanner after each shopping trip
Collected annually
• UPC Code & Description • Product Characteristics (e.g.
brand, size, flavor) • Price • Quantity • Presence of Deal • Coupon Value • Store Location • Retail Chain Code • Channel Type • Total Spent on Trip
• Demographic data • Geographic data • Product Ownership data • Projection Factor

7
RETAIL SCANNER DATA • Week Ending Date
• UPC Code and Description
• Product Characteristics (e.g. brand, size, flavor)
• Units Sold
• Average Price
• Feature Indicator
• Display Indicator
• Store Location
• Retail Chain Code and Channel Type
Sent weekly by stores to Nielsen

CONSUMER PANEL AND RETAIL SCANNER DATA PRODUCT HIERARCHY
10 Departments
~1,100 Product Modules
~3.6 million UPC Codes
~125 Product Groups
~175,000 Brands
Nielsen Defined
Manufacturer Defined
Dry Grocery
Gum
Sugar-free Chewing Gum
Wrigley’s Extra
Size, Flavor, Form, etc.
8
Example

9
EXAMPLES OF FACULTY RESEARCH USING NIELSEN DATA
“The Evolution of Brand Preferences: Evidence from Consumer Migration,” Bart J. Bronnenberg, Jean-Pierre H. Dubé, and Matthew Gentzkow. American Economic Review, (forthcoming). http://faculty.chicagobooth.edu/matthew.gentzkow/research/brands.pdf
“Investigating brand preferences across social groups and consumption contexts,” Minki Kim · Pradeep K. Chintagunta. Quantitative Marketing and Economics (2012). http://link.springer.com/article/10.1007/s11129-011-9117-0/fulltext.html
“Brand History, Geography, and the Persistence of Brand Shares,” Bart J. Bronnenberg, Sanjay K. Dhar, and Jean‐Pierre H. Dubé. Journal of Political Economy, 117(1), 87-115 (2009). http://papers.ssrn.com/sol3/papers.cfm?abstract_id=1273022
“Do Switching Costs Make Markets Less Competitive?” Jean-Pierre H. Dube, Günter Hitsch, and Peter E. Rossi. Journal of Marketing Research, 46(4), 435-45 (2009). http://papers.ssrn.com/sol3/papers.cfm?abstract_id=907227
“The Effect of Competitive Advertising Interference on Sales for Packaged Goods,” Peter J. Danahaer , André Bonfrer, and Sanjay Dhar. Journal of Marketing Research, 45(2), 211-25 (2008). http://research.chicagobooth.edu/marketing/databases/dominicks/docs/2008_The_Effect_of_Competitive.pdf
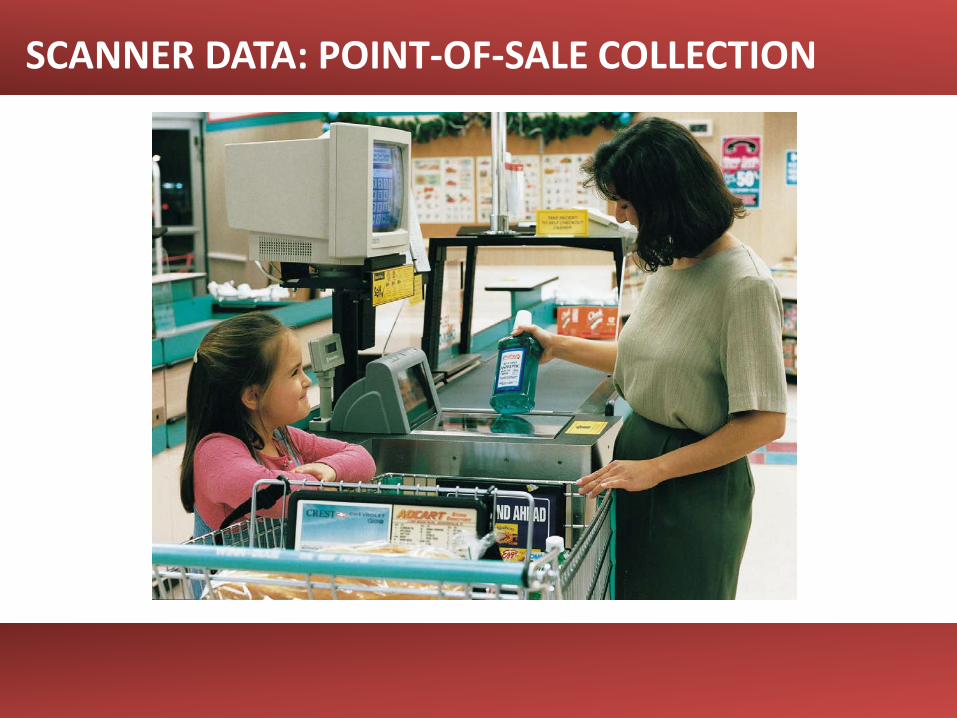
SCANNER DATA: POINT-OF-SALE COLLECTION

WAYS TO LOOK AT DATA
POPULAR EXAMPLES OF HOW DATA CAN BE “CUT”
1. MARKETS • REGIONS (SOUTHWEST VS. NORTHEAST) • CITIES (TOM’S OF MAINE SELLS BETTER IN PORTLAND THAN IN BILOXI, MI) • CUSTOMERS (WAL-MART, HARRIS-TEETER, KROGER, ETC.)
2. PRODUCT “HIERARCHIES” • CATEGORY (E.G., EVERY LAUNDRY DETERGENT SOLD IN THE U.S.) • MANUFACTURER (E.G., ALL LAUNDRY DETERGENTS SOLD BY P&G) • BRAND (E.G., ALL TIDE-BRANDED LAUNDRY DETEGENTS) • CHARACTERISTICS (E.G., ALL MOUNTAIN FRESH SCENTED TIDE LAUNDRY DETERGENTS) • SKU (E.G., ONE SPECIFIC PRODUCT – SIZE, SCENT)
1. TIMEFRAME
WHAT INFORMATION DOES NIELSEN CAPTURE?
THERE ARE FOUR VARIABLE “FAMILIES” THAT MATTER MOST
1. VOLUME
2. PRICES
3. MERCHANDISING/PROMOTION
4. DISTRIBUTION

VOLUME METRICS
TOTAL VS. PROMOTED VS. BASELINE VOLUME
• TOTAL VOLUME SOLD • CAPTURES EVERYTHING THAT WAS SOLD
• VOLUME SOLD ON PROMO
• CAPTURES VOLUME SOLD WITH ANY ASSOCIATION WITH A PROMOTION (FEATURE, DISPLAY, OR BOTH)
• OFTEN, BUT NOT NECESSARILY, IMPLIES A LIST PRICE REDUCTION
• BASE VOLUME • A CALCULATION OF VOLUME THAT WOULD HAVE BEEN SOLD WITHOUT A PROMOTION • BASELINE IS NOT [(TOTAL UNITS) – (UNITS SOLD ON PROMO)]
• GOAL IS TO CAPTURE WHAT WOULD HAVE BEEN SOLD WITHOUT THE PROMOTION (E.G., I WILL BUY OLD SPICE WHEN I NEED IT, ON SALE OR NOT)
• INCLUDES SOME UNITS SOLD ON PROMO
VOLUME METRICS
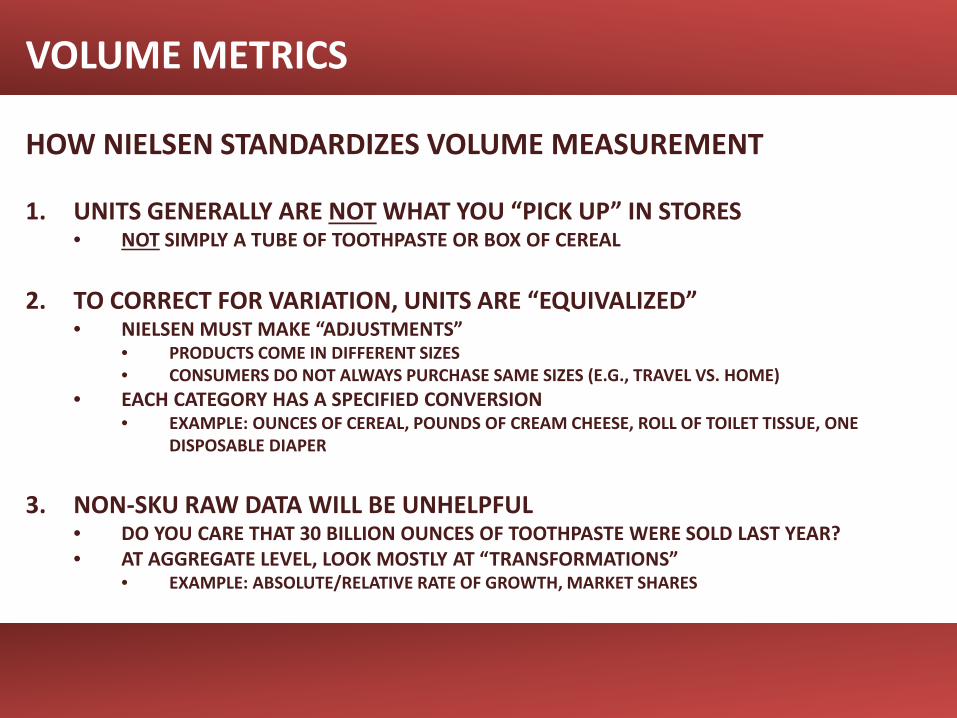
HOW NIELSEN STANDARDIZES VOLUME MEASUREMENT
1. UNITS GENERALLY ARE NOT WHAT YOU “PICK UP” IN STORES • NOT SIMPLY A TUBE OF TOOTHPASTE OR BOX OF CEREAL
2. TO CORRECT FOR VARIATION, UNITS ARE “EQUIVALIZED”
• NIELSEN MUST MAKE “ADJUSTMENTS” • PRODUCTS COME IN DIFFERENT SIZES • CONSUMERS DO NOT ALWAYS PURCHASE SAME SIZES (E.G., TRAVEL VS. HOME)
• EACH CATEGORY HAS A SPECIFIED CONVERSION • EXAMPLE: OUNCES OF CEREAL, POUNDS OF CREAM CHEESE, ROLL OF TOILET TISSUE, ONE
DISPOSABLE DIAPER
3. NON-SKU RAW DATA WILL BE UNHELPFUL
• DO YOU CARE THAT 30 BILLION OUNCES OF TOOTHPASTE WERE SOLD LAST YEAR? • AT AGGREGATE LEVEL, LOOK MOSTLY AT “TRANSFORMATIONS”
• EXAMPLE: ABSOLUTE/RELATIVE RATE OF GROWTH, MARKET SHARES

VOLUME METRICS
VOLUME REPRESENTS SELL-THROUGH, NOT SELL-IN
• WHAT IS THE DIFFERENCE? • SELL-IN: MANUFACTURER STORE (FROM WAREHOUSE) • SELL-THROUGH: STORE CONSUMER (FROM SHELF)
• WHY DOES IT MATTER? • NIELSEN MEASURES RETAILER SALES, NOT MANUFACTURER SALES; MOST COMPANIES
TRACK MANUFACTURER SALES THROUGH OTHER MEANS • PACE OF SELL-THROUGH MAY NOT REFLECT SELL-IN
• EXAMPLE: INVENTORY BUILD = RATE OF SELL-THROUGH < RATE OF SELL-IN

PRICE METRICS
AVERAGE VS. PROMOTED VS. BASELINE PRICES
• AVERAGE EQUIVALIZED PRICES • THE WEIGHTED AVERAGE OF ALL RETAIL PRICES
• INCLUDES BOTH SALE AND NON-SALE PRICES • NO ADJUSTMENTS FOR VARIATION IN PRICING (GEOGRAPHIC, CHANNEL
• PROMO PRICES
• THE WEIGHTED AVERAGE OF ALL RETAIL PRICES FOR UNITS SOLD ON PROMO
• BASELINE PRICES • A CALCULATION OF THE AVERAGE RETAIL PRICE FOR NON-PROMOTED UNITS • BEST ANALOG FOR “LIST PRICE” (WHAT WHOLESALERS REQUEST RETAILERS TO CHARGE)
PRICE METRICS
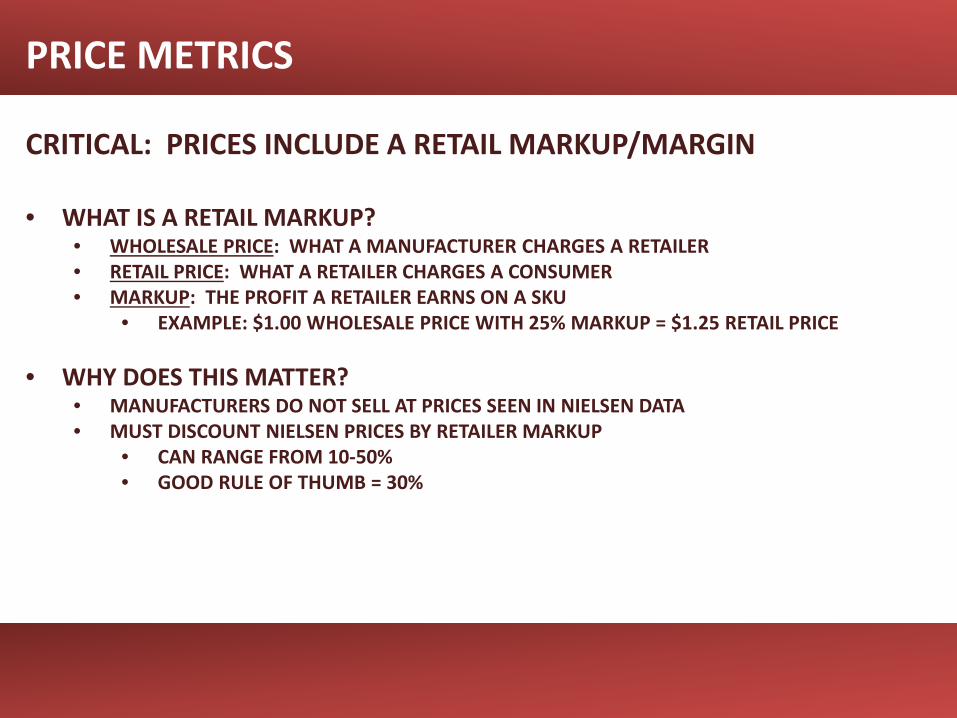
CRITICAL: PRICES INCLUDE A RETAIL MARKUP/MARGIN • WHAT IS A RETAIL MARKUP?
• WHOLESALE PRICE: WHAT A MANUFACTURER CHARGES A RETAILER • RETAIL PRICE: WHAT A RETAILER CHARGES A CONSUMER • MARKUP: THE PROFIT A RETAILER EARNS ON A SKU
• EXAMPLE: $1.00 WHOLESALE PRICE WITH 25% MARKUP = $1.25 RETAIL PRICE • WHY DOES THIS MATTER?
• MANUFACTURERS DO NOT SELL AT PRICES SEEN IN NIELSEN DATA • MUST DISCOUNT NIELSEN PRICES BY RETAILER MARKUP
• CAN RANGE FROM 10-50% • GOOD RULE OF THUMB = 30%

PROMOTION METRICS
THREE TYPES OF PROMOS • FEATURE
• AN ADVERTISEMENT SPONSORED BY A RETAILER IN A WEEKLY NEWSPAPER, A SUNDAY PAPER, AN IN-STORE SUPPLEMENT, OR A DIRECT MAIL CAMPAIGN FROM THE RETAILER
• DISPLAY
• AN EXHIBIT OF GOODS, SOMETIMES WITH DECORATIVE MATERIAL AND ADVERTISING. • CALLS ATTENTION TO MERCHANDISE TO INDUCE PURCHASE
• EXAMPLES: END-OF-AISLE DISPLAY, SHELF “TALKERS”
• TEMPORARY PRICE REDUCTION (TPR)
• TEMPORARY (7 WEEKS OR LESS) DECREASE OF 5% OR GREATER FROM THE NORMAL SELLING OF A PRODUCT
PROMOTION METRICS
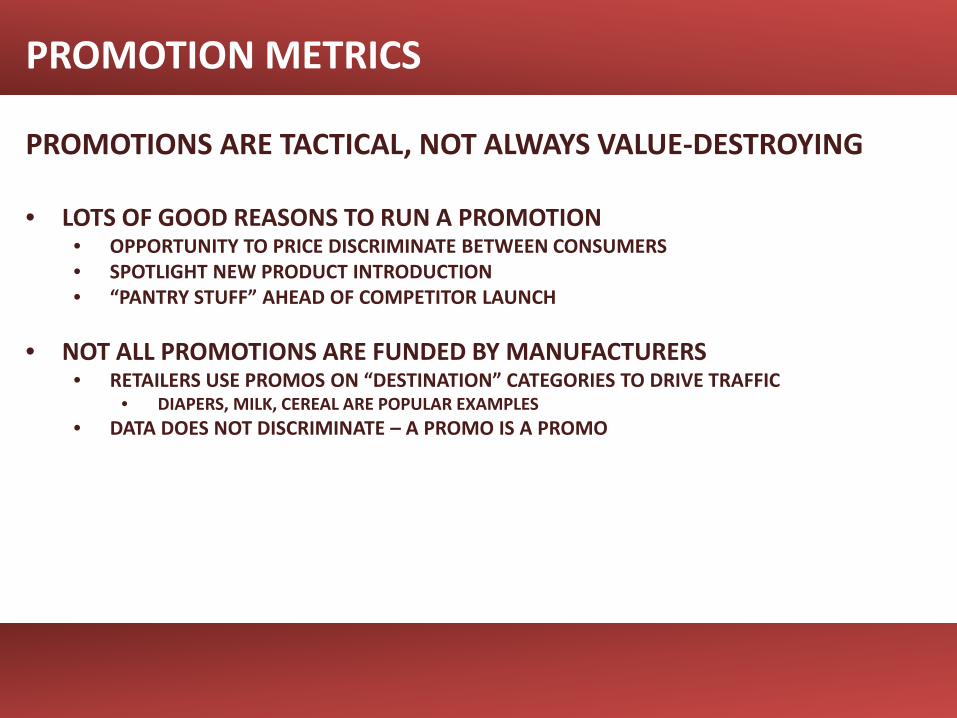
PROMOTIONS ARE TACTICAL, NOT ALWAYS VALUE-DESTROYING • LOTS OF GOOD REASONS TO RUN A PROMOTION
• OPPORTUNITY TO PRICE DISCRIMINATE BETWEEN CONSUMERS • SPOTLIGHT NEW PRODUCT INTRODUCTION • “PANTRY STUFF” AHEAD OF COMPETITOR LAUNCH
• NOT ALL PROMOTIONS ARE FUNDED BY MANUFACTURERS
• RETAILERS USE PROMOS ON “DESTINATION” CATEGORIES TO DRIVE TRAFFIC • DIAPERS, MILK, CEREAL ARE POPULAR EXAMPLES
• DATA DOES NOT DISCRIMINATE – A PROMO IS A PROMO
DISTRIBUTION METRICS
ALL COMMODITY VOLUME (% ACV) IS A DISTRIBUTION VARIABLE • WHAT IS % ACV?
• % ACV FOR A BRAND IS ITS DISTRIBUTION, WEIGHTED BY THE SIZE OF THE STORE • ADJUSTS FOR FACT THAT NOT ALL STORES SEE SAME CONSUMER TRAFFIC
• EXAMPLES OF HOW DO WE USE DISTRIBUTION IN ANALYSIS?
• NEW PRODUCT INTRODUCTION • PACE OF ROLLOUT TO STORES HOW QUICKLY IS IT AVAILABLE FOR PURCHASE?
• ONGOING BUSINESS REVIEW • UNDERPERFORMING BRANDS GET PULLED OFF SHELVES (% ACV DECREASES)
• NORMALIZING WHEN EVALUATING COMPETITION OR PORTFOLIOS OF SKUS • HOW WELL DO GLAD TRASH BAGS SELL AT STORES THAT ALSO SELL HEFTY TRASH BAGS? • DOES OLD SPICE DEODORANT SELL BETTER AT STORES THAT ALSO SELL OLD SPICE BODY WASH?

% ACV METRICS
EXAMPLE OF HOW % ACV WORKS • WORLD HAS TWO STORES
• STORE A = $400 IN TOTAL SALES (ALL PRODUCTS) • STORE B = $100 IN TOTAL SALES (ALL PRODUCTS) • TOTAL UNIVERSE = $400 + $100 = $500
• WHAT HAPPENS IF SARA LEE MEAT IS SOLD ONLY IN STORE A?
• IF SOLD IN 1 OF 2 STORES, DOES THAT MEAN SARA LEE’S DISTRIBUTION IS 50%? • NO! THIS MAKES LITTLE SENSE AS STORE A IS MORE ATTRACTIVE B/C MORE PEOPLE SHOP THERE
(AS DETERMINED BY QUANTITY OF MONEY SPENT IN THE STORE)
• WHAT IS THE % ACV? • SARA LEE HAS AN ACV OF 80%
• STORE A % ACV = ($400 STORE A SALES)/($500 TOTAL UNIVERSE SALES) = 80% • STORE B % ACV = ($100 STORE A SALES)/($500 TOTAL UNIVERSE SALES) = 20%
ADDITIONAL WORDS OF WARNING
MITIGATING VOLATILITY DUE TO PROMOTIONS • DATA IS EXTREMELY MESSY WEEK-TO-WEEK
• PROMOTIONS DRAMATICALLY SKEW BRAND PERFORMANCE • EXAMPLE: VOLUME CAN INCREASE OR DECREASE BY +50%
• SOME WAYS TO SMOOTH DATA (GOOD BETTER BEST) 1. DROP DATA POINTS (STORES) WHERE THERE WAS A PROMO 2. LOOK ONLY AT 4+ WEEK PERIODS 3. CONSTRUCT ROLLING 12 WEEK PERIODS 4. COMPARE THIS WEEK TO THE SAME WEEK A YEAR AGO

REAL-WORLD APPLICATION
FIVE TYPES OF PROJECTS WHERE NIELSEN CAN HELP
1. ANALYZING CATEGORY DYNAMICS
2. BUSINESS REVIEW
3. COMPETITIVE ANALYSIS
4. NEW PRODUCT INTRODUCTIONS
5. EVALUATING LIFT/ROI FROM PROMOTIONS