Embed Size (px)
Citation preview

The Kiel Institute for the World Economy Duesternbrooker Weg 120
24105 Kiel (Germany)
Kiel Working Paper No. 1284
Firm size and innovation in European manufacturing
by
Andrea Vaona and Mario Pianta
July 2006
The responsibility for the contents of the working papers rests with the authors, not the Institute. Since working papers are of a preliminary nature, it may be useful to contact the authors of a particular working paper about results or caveats before referring to, or quoting, a paper. Any comments on working papers should be sent directly to the authors.
Firm size and innovation in European manufacturing1
Andrea Vaona and Mario Pianta Kiel Institute for the World Economy and University of Verona, [email protected]
Università di Urbino, [email protected]
Abstract
The paper investigates the differences between small, medium-sized and large firms regarding their performance in the introduction of new products and processes. After a review of the relevant literature, two models are proposed and tested in search for different business strategies and innovation inputs connected to product and process innovations. The empirical analysis uses innovation survey (CIS 2) data at the industry level for 22 manufacturing sectors, broken down in three firm size classes, for eight European countries. Special attention is devoted to tackling the issues of possible endogeneity of the regressors and of unobserved sectoral heterogeneity. The results - strengthening the findings of previous studies - show that product and process innovations, though having some complementarities, are associated to different innovative inputs and strategies pursued by firms. Systematic differences also emerge between the behaviour of large firms and SMEs.
JEL codes: L11, O31, O33
Keywords:
Product innovation; Process innovation; Firm size; Determinants of innovation; European industries
1 The authors would like to thank Marco Vivarelli, Martin Carree and an anonymous referee for their helpful comments. The usual disclaimer applies.
1. Introduction How different are large and small firms in their innovative performance? Do they pursue different strategies in terms of product and process innovation? Do they use different inputs to introduce innovations? Such questions have been addressed by an extensive literature that has moved from the simplifications of the "Schumpeterian hypotesis" (Schumpeter, 1942) and the limitations of R&D and patent data, to careful studies of the types of innovations introduced, of the influence of market structure, industry and country specificities, and of the variety of factors affecting innovative performances (Acs and Audretsch, 1990). This paper proposes a model where a clear distinction is made between different technological strategies by firms and industries. Product innovations are assumed to result from a search for technological competitiveness, based on efforts for market-oriented innovation, such as a strategy of market expansion and patenting activity. Process innovations are assumed to emerge from a strategy of active price competitiveness dominated by a search for efficiency, rooted in the pursuit of production flexibility, larger markets and greater expenditure for innovation-related machinery (Pianta, 2001, Antonucci and Pianta, 2002). In the product based strategy, small firms are expected to rely more on innovative dynamics, while large firms are expected to rely more on market power strategies. In a strategy based on process innovations, small firms critically depend on greater production flexibility, while large firms may invest more new machinery and search for larger markets. Differently from much of the literature that considers individual firms, this paper carries out the study at the industry level, considering 22 sectors covering all manufacturing industry. Information for each sector is broken down for small, medium-sized and large firms. This approach makes it possible to identify systematic patterns within manufacturing, showing the importance of firm size, in combination with sectoral and country specificities. Data are drawn from the Community Innovation Survey 2 (CIS2) and cover eight European countries. A major strength of the results is that they refer to the whole of manufacturing in a large number of European countries. We also address in detail the problems of possible endogeneity of the regressors and of unobserved sectoral heterogeneity. Section 2 of this paper offers a brief review of the relevant literature. The database used is illustrated in section 3. Section 4 is devoted to econometric issues. Section 5 shows the estimation results. Section 6 concludes. The Appendix offers further details on the data and on the methods adopted in this analysis. 2. Concepts and literature The nature of innovation and the role of firm size have been addressed by two streams of literature that have rarely overlapped. Both will be briefly reviewed in this section, pointing out the possibilities for integrating the two approaches. The distinction between product and process innovation Building on a crucial Schumpeterian distiction, and on a well-established literature (Scherer, 1991; Cohen and Klepper 1994; Pianta, 2001; Antonucci and Pianta, 2002; Edquist, Hommen and McKelvey, 2001) we argue that a clear conceptual distinction can be made between product and process innovations, and we test its strength in the empirical estimation of our model. Product innovations, either incremental or radical ones, developed through internal (and external) innovative activities, increase the quality and variety of goods and may open up opportunities for firms' growth in output through larger quantities and/or prices. Conversely, process innovations lead to improvements in the efficiency of production of particular goods, lowering their prices, and are associated with investment embodying new technology.
Early studies of innovation in firms of different sizes have pointed out that the share of process R&D relatively to that of product R&D increases as firm size grows (Scherer, 1991) and that in R&D intensive industries the same share rises as markets become more concentrated (Link, 1982). Building on such evidence, Cohen and Klepper (1994) have argued that, as the benefits of innovation to firms are mainly in increased output (due to appropriability constraints), large firms tend to have an advantage in process innovations because their innovation costs can be spread over larger volumes of output. In fact, although the two types of innovation are closely interlinked, and in many innovative firms they are often present together,2 they are the results of separate innovative processes, pursuing different objectives with different means. Product innovations are usually associated with a search for technological competitiveness, based on high productivity rooted in quality advantages in niche markets for small firms, and in the control of new and dynamic markets for larger firms. On the other hand, process innovations mainly emerge from a strategy of active price competitiveness dominated by a search for efficiency, where productivity growth is rooted in capital-intensive developments, with the acquisition of new machinery by small firms, or with cost-cutting restructuring by large firms (Pianta, 2001). Such a distinction provides a new perspective for the analysis of firm size and innovation. The relationship between firm size and innovation and its qualifying factors A very large literature has explored the relationship between firm size, market structure and innovation, showing a frequent polarisation between a creative destruction view, where innovation leads to concentration and market power of new dynamic firms - a Schumpeter Mark I perspective - and the cumulative perspective emphasising that high present output leads to high future output and innovation is incremental - a view closer to a Schumpeter Mark II model. The literature on this issue has developed at the plant, firm and industry levels, and includes analyses of the factors affecting the relationship between firm size and innovation, such as market concentration and the knowledge environment, and contributions assessing this direct link, using different indicators for innovative performance. A first line of research has emphasised the role of industry factors, especially the evolution of the industry life cycle, as key determinants of the relationship between innovation and firm size (Rothwell and Dodgson 1994, Rogers, 2004). According to Rothwell and Dodgson (1994:323) the role of small firms is more relevant where entry costs are lower and niche markets exist, although the forms of interaction between firms of different sizes (from subcontracting to licensing and to collaborative innovation) influence the final results. Along an industry life-cycle, this relationship is likely to evolve from a more favourable environment for small firms in the early stage, to a mature situation where a higher concentration is found in both innovation and markets. The role of market conditions has emerged in different studies. Considering innovation counts, Acs and Audretsch (1987) found that large firms are more innovative in monopolistic markets and concentrated industries with high barriers to entry, whereas small ones perform better in competitive markets. Using the same indicator, Love and Ashcroft (1999) shifted the attention from firm to plant level data, considering 3000 manufacturing plants in Scotland, and found that market
2 In the third EU Community Innovation Survey, for the years 1998-2000, 41% of all EU firms were successful innovators, of which 23% were both product and process innovators; 10% innovated only in products and 7% innovated only in processes. In the second EU Community Innovation Survey, for the years 1994-1996, used in the empirical analysis of this paper, 51% of firms were innovators, of which 31% were both product and process innovators; 13% innovated only in products and 7% innovated only in processes (European Commission-Eurostat, 2001:20; 2004:18).
structure is less relevant for innovation than corporate structure. Their findings point to the fact that plant size, foreign ownership and the presence of R&D enhance innovation 3. Considering the share of R&D personnel on total employees, the analysis of a panel of Dutch firms (van Dijk et al.,1997) showed that concentration has a positive effect, regardless of firm size, while market growth is very important for large firms and irrelevant for small ones. The knowledge environment in which firms operate has also emerged as a factor influencing the relationship between firm size and innovation. Small firms appear to be better at exploiting external economies deriving from a more innovative environment, due to the proximity to R&D centres of large firms and to universities (Acs et al., 1994, Audretsch and Vivarelli, 1994). Similar results were obtained by Rogers (2004) using Australian survey data; he finds that in manufacturing small firms are better at capturing the benefits of networking for innovation, whereas the opposite holds for non manufacturing firms. A second body of work has investigated the direct link between innovation activity and firm size, and has evolved alongside the availability of different indicators of innovation. At first, studies had to rely on R&D as a proxy for innovation, and found that, at the firm level, R&D increased more than proportionately than firm size up to a treshold point, when a direct relationship emerged (Scherer, 1965). This has been explained by the size advantages of large firms in terms of internal knowledge, financial resources for innovation, sales base and market power (Cohen and Klepper, 1996). When patents and innovation counts are considered as indicators of innovative output, it emerges that R&D productivity tends to decline either when measured as patents per R&D (Bound et. al., 1984), or when measured by innovations per unit of R&D (Acs and Audretsch, 1990,1991). Studies focusing on industries rather than on firms or plants paint a somewhat different picture. Here the large firm advantage in R&D efforts tends to disappear (Soete, 1979; Scherer, 1984), innovative output (in terms of number of inventions) tends to fall as concentration grows, while the returns to R&D inputs decrease with firm size (Acs and Audretsch, 1988), suggesting that industry specificities are key factors in affecting innovative performances (Cohen, 1995). This line of analysis has led to emphasize the importance of technological regimes as determinants of both market structures and the innovative performances. Technological opportunities, appropriability conditions, sectoral innovation systems, growth potential and actual demand are likely to shape at the same time innovation and market structure (Malerba, 2004). Integrating firm size with product and process innovation Further progress is now possible using the evidence of European innovation surveys that provide data on a variety of aspects of innovation. Building on such evidence, in this article we bring together the two streams of literature reviewed above: the distinction between product and process innovations and the relationship between innovation and firm size. We argue that innovation performances of sectors and firm size classes are associated to separate types of innovative efforts aiming at the introduction of new products or new processes. We expect that different resources and strategies are connected to the different innovative performances that can be observed in small and large firms across industries. In the next sections we develop a model and an empirical analysis that moves beyond the state of the art in the following directions:
- we conceptualise the distinction between the dynamics and strategies leading to the emergence of new products and new processes, and we introduce it in the analysis of the relationship between firm size and innovation;
- we consider an original indicator of innovation (the share of firms that have introduced a product or a process innovation over a three year period), capturing the actual innovative
3 Similar results were obtained in the case of Swiss firms by Arvanitis (1997) and of Dutch firms by de Jong and Vermeulen (2004).
performance of firms, and we search for a better identification of the determinants of innovation, in terms of firms' objectives, strategies and resources;
- we carry out an industry level analysis referred to the universe of firms, with a breakdown of industries by three size classes, with an econometric specification that explicitly accounts for the group structure of the dataset, moving beyond OLS or Least Squares Dummy Variables (LSDV) models. While they are pervasive in the reviewed literature, they are not always the best econometric tools in order to deal with unobserved heterogeneity. We also directly address the issue of the possible endogeneity of the regressors.
3. The model Technological change opens up opportunities for a variety of innovative strategies of firms, associated to particular competitive strategies in given markets. A strategy of technological competitiveness, associated to a dominance of product innovation, requires substantial internal innovative efforts (research, development, design, as well as new investment), a strong inventive activity reflected in patenting, a stream of new products, with the objective of increasing market shares and opening up new markets. A strategy of active price competitiveness, rooted in process innovation, focuses on increased efficiency achieved through innovation in cost-saving processes, introduction of new machinery, larger markets associated to a decrease in price, with a key relevance of the objective of increasing production flexibility. While there is a complementarity between innovation in products and processes (as shown by the evidence of European innovation surveys), the determinants of success in either strategy are different and should be investigated separately. Therefore this article proposes two separate models to test whether these two types of innovation are associated with different strategies and activities rooted in different models of innovation. However, in the section presenting the results, the opposite hypothesis that no difference exists between the proposed models is also tested. Product innovation In the first model we propose, we aim to identify the determinants of product innovations (PDIN), measured as the share of firms that have introduced a product innovation in 1994-1996. The presence of product innovation is expected to be associated to a deliberate market expansion strategy and to the presence of patenting activities for the protection of firms' inventions, that are preliminary to the introduction of new products. The variables we intend to use in the model include the following. - M: the share of firms declaring the aim of opening up new markets or increasing market share, that is a key condition for the emergence of product innovation; - P: the share of firms that have patented an invention in 1994-1996. While not all patents turn out as new products in the market, the effort devoted by firms to inventing and patenting is a good indicator of the capabilities, competences and determination to introduce product innovations. In the analysis of different firm size classes, it will be possible to identify which factors dominate the innovative performance of each group. The model is the following: PDINdij = k + aMdij + bPdij + e with firm size classes d, sectors i, countries j; k is the constant; e is the error term. Process innovation In the model for the determinants of process innovations (PCIN), measured as the share of firms that have introduced a process innovation in 1994-1996, the key determinants are a strategy for making the production process more efficient and flexible, and for expanding markets (mainly through the price reduction made possible by new processes), while a key role is played by the resources available for the acquisition of new machinery and equipment.
The variables we intend to use in the model include the following. - F: the production flexibility objectives of firms, that is measured as the share of firms declaring that increasing production flexibility is very important or moderately important; - M: the share of firms declaring the aim of opening up new markets or increasing market share, that is a key condition for the emergence of product innovation; - K: the amount of innovative expenditure in new machinery and equipment per employee in 1996, that quantifies the economic resources invested in new processes; The differences across firm size classes will make it possible to identify the relative importace of each variable. The model is the following: PCINdij = k + aFdij + bMdij + cKdij + e with firm size classes d, sectors i, and countries j; k is the constant; e is the error term. These basic models for the determinants of product and process innovation will be used both for the pooling of all three size classes, and separately for small, medium sized and large firms, testing for country, industry and firm size effects. 4. The econometric method The dataset used in this paper collects observations referring to three groups: countries, sectors and class sizes. It is well known in the literature that the presence of unobserved variables for each of the groups of a dataset can lead either to correlation between the regressors and the errors, or to correlation between the errors. In both the cases, OLS is highly misleading: it provides biased estimates in the first case and biased standard errors, and therefore unreliable significance test statistics, in the second case. The econometric tool developed to cope with these problems is the error components model (ECM). Balestra and Nerlove (1973), Wallace and Hussain (1969), Amemya (1971), Nerlove (1971a, b), Mazodier (1972) and Fuller and Batese (1974) developed the one- and two-way ECM for balanced datasets, distinguishing between the fixed effects (FE)4 and the random effects (RE) models. In order to check which model best fits the data, Hausman (1978) suggested to compare the two estimators above, on the ground that in the first case they are “distant”, because the random effect estimator is biased, and in the second case they are “close”, as under this hypothesis they are both consistent. Traditionally, the debate between fixed effects and random effects focused on the question whether the error components should be considered as random variables or as fixed parameters. In the context of sectoral studies of innovation this has led to interpret sectoral dummies as indexes of technological opportunities. However, modern econometrics has overcome this approach to the choice between a FE model and a RE model. The first one is generally recommended when regressors are correlated with the errors due to group unobserved variables; the latter when unobserved variables induce correlations between the errors, but not between the regressors and the errors. In the present study the Hausman test points to the random effect model as the most suitable to our dataset. However, this should not be interpreted as implying that either industries, or countries, or firm size classes play no role: their role is not that of introducing a bias in the point estimate of the regressors, but rather of increasing the variance of the residuals (Wooldridge, 2001).5
4 Also known as LSDV. 5 It is also worth recalling that sticking to a fixed effect estimator when the Hausman test favours the random effect estimator would be against the general econometric principle of “love for parsimony”, as one includes dummy variables when they are not necessary. This would imply

One of the shortcomings of the econometric literature discussed above is that practitioners often have to deal with datasets with missing values and with more than two groups of observations. Regarding the first aspect, Baltagi (1985) and Wansbeek and Kapetyn (1989) developed respectively the one- and the two-way ECM for unbalanced data. Finally, Davis (2002), that is the main methodological reference for this paper, showed that the one- and the two-way ECM for unbalanced data are only special cases of a multi-way ECM; he provided the FE, the RE and the Maximum Likelihood (MLE) estimators for unbalanced datasets.6 In essence the model we are going to estimate is the following
y xdij dij d i j dij= + + + + +α β γ λ µ ν where y is the dependent variable, α is the constant, x is the vector of regressors, γ is the class size effect, λ is the sector effect, µ is the country effect and v is the error. The RE estimator is just a GLS estimator, correcting the variance covariance matrix of the residuals by allowing for within group correlation. Like all GLS estimators, what is actually possible to compute are their Feasible GLS (FGLS) counterpart and many possible routes have been proposed (reviewed in Baltagi, 2003). Here, a quadratic unbiased estimator (QUE) and a minimum norm quadratic unbiased estimator (MINQUE7) have been computed in order to check for model misspecification by comparing the two results. The QUE estimator is reported in the Appendix, together with the OLS and the FE estimators.8 This approach makes it possible to take into account the presence of the three dimensions of our study - firm size classes, industries and countries - while obtaining a sound econometric relationship. A second econometric problem is the possible endogeneity that might come from correlation between the regressors and the residuals νdij. In order to tackle this problem, we follow Davis (2002) using a GMM error component model. The choice of the instruments is discussed in the section with the econometric results. 5. The database The empirical analysis uses the SIEPI-CIS2 database developed at the University of Urbino, based on CIS 2 data at the industry level for 22 manufacturing sectors, broken down in three firm size classes (20-49; 50-249; above 250 employees)9. Eight European countries are considered: Austria, France, Italy, Norway, the Netherlands, Portugal, Sweden and the United Kingdom. The innovation survey data provide information on quantitative and qualitative aspects of firms' innovative activities, including product or process innovations, the variety of innovative efforts (research, design and engineering and investment related to innovation), the objectives pursued by firms' innovative strategies (European Commission-Eurostat 2001,2004). judging the significance of the regressors on the ground of biased standard errors, loosing degrees of freedom and trying to extrapolate economic information from dummies that are often estimated on the basis of few observations only. 6 It is also worth recalling that Davis (2003) provided a multiway system ECM estimators for unbalanced datasets. 7 In its MV3 variant, as labelled by Davis (2002). 8 Davis (2002) performed Montecarlo Simulations and concluded that the maximum likelihood estimator (MLE) is computationally more intensive, has a higher mean squared error than RE estimators when the group variances are different from zero, but offers huge advantages when some of the group variances are equal to zero. The FE estimator displayed a much worse performance than all alternatives. 9 It should be emphasised that the EU CIS boundaries of firm size classes differ significantly from other classifications. In Acs and Audrestch (1988) small firms are those with less than 500 employees; van Dijk et al. (1997) defines small firms as those from 10 to 100 full time equivalent employees.

The main innovation indicators involved in the present study are: - the percentage of firms introducing at least one product innovation in the period 1994-
1996; - the percentage of firms introducing at least one process innovation in the period 1994-
1996; - the percentage of firms which have applied for patents between 1994 and 1996 - innovation expenditure per employee due to acquisition of machinery and equipment linked
to innovations; - the percentage of firms perceiving the objective of opening up new markets or increase
market share as moderately important or very important; - the percentage of firms perceiving the objective of improving production flexibility as
moderately important or very important. An overview of descriptive statistics on these variables may be helpful in order to highlight the differences along the three dimensions under study - countries, firm size classes and sectors. Table I shows the average values of the variables by country. They confirm the well established picture that South European countries are less innovative than Northern European ones. Austria, the Netherlands and the UK appears to be the most innovative countries, whereas Italy and Portugal are among the least innovative ones. Countries are closer when we consider variables reflecting a strategy of active price competitiveness, such as innovation expenditure per employee due to the acquisition of machinery and equipment, or the percentage of firms perceiving the objective of improving production flexibility as moderately important or very important. Conversely, cross-country differences are greater in patenting activities. Table II shows the firm size breakdown. A clear direct relationship emerges between firms size and innovative performances, with the exception of the expenditure for new machinery, which is lower for large firms and higher for medium and small firms. This is hardly surprising, as this is a major source for introducing (process) innovation in smaller firms, while large firms can spread the investment over a larger number of employees. Finally Table III is concerned with sectoral differences. As in Table I, differences among values are greater when we look at variables reflecting a strategy of technological competitiveness, such as product innovation, patenting and the percentage of firms aiming at opening up new markets. As expected, Machinery and Equipment, Electrical and Optical Equipment and Chemicals are among the most innovative sectors, wheras Textiles, Wearing, Leather and Footwear and Wood, Pulp, Paper and Printing among the least innovative ones.
(Tables I, II and III about here) 6. Tests and results Tests and procedure The first analysis to be carried out concerns the test on the presence of systematic differences between the relevance of product and process innovations. In a first model, we have included all the variables listed above in order to explain the shares of firms introducing product or process innovations, testing the hypothesis that the same set of factors is affecting both types of innovative behaviour. The results are contained in Table IV. While some commonalities emerge in the results, there are strong differences in the significance and relevance of the coefficients, leading to suggest that we are facing two distinct models of innovation. Looking at the independent variables, patenting is significantly correlated with the share of product innovators and not with that of process innovators. The opposite happens for the percentage of firms aiming at introducing production flexibility and for the expenditure in innovation related new machinery and equipment. Finally, the percentage of firms aiming at opening new markets or increasing market share is positively related with both, but with a higher
coefficient for product innovation. The importance of product and process innovation across European industries and firm size classes appears to be associated to two largely separate sets of variables, confirming the approach discussed in section 3 above, that has led us to propose two distinct models.
(Table IV about here) In order to estimate the two models for product and process innovation, we build on these preliminary results by dropping insignificant variables and by computing, for the regression pooling all firm size classes, the OLS, FE, QUE RE and MINQUE RE estimators. We perform a Hausman test to detect whether the FE estimator is better than the RE estimator, concluding that the random effect estimator better suits the data for both the product and process innovation models (Tables V and VI). In order to exploit the computational advantages of the RE estimators without incurring into mispecification problems, we support our estimates with an SLM test10 for each of the components of the error, in order to check whether group variances were significantly different than zero. Following the results of these tests, we impose the appropriate group variances to be zero. We also check for possible biases that can arise due to endogneity of the regressors. Once detected that the RE estimator suits our data better, we estimate a GMM MINQUE RE estimator, following Davis (2002). Given that our dataset is a cross-section of firm size classes within sectors belonging to different countries, we used an instrument set very similar to that used by both Berry (1994) and Davis (2002), both dealing with cross-sectional datasets. In order to identify the coefficients of the estimated model they partitioned their data into nests and, for each observation, they instrumented their regressors by using the data of the other observations belonging to the same nest. In the same fashion, we divided the “Nace 22” sectors of our dataset (see the Appendix) into high and low innovation industries, following the procedure of Crespi and Pianta (2005). For each country we defined the nests as all the firm size classes of high innovation industries, and the same for low innovation sectors. Considering 8 countries, we ended up with 16 nests. However, alternative definitions of the nests (e.g. including only the firms of the same size class as instruments) did not prove to significantly alter parameter estimates. This strategy allowed us to test whether the coefficient estimates are affected by a large endogeneity bias comparing the MINQUE RE and the GMM MINQUE RE estimates. For example, it is possible to argue that patenting and the introduction of new products are often two faces of the same coin: a new product is patented, so one firm is both an applicant and an innovator. However, this problem can be easily overcome by instrumenting the percentage of patent applicants with that of sectors having similar innovative features, that is belonging to the same nest as defined above. Another example may regard the percentage of firms aiming at opening up new markets. Its positive effect on product innovation can be interpreted as a sign that firms aiming at opening up new markets introduce new products, but it may also be the other way around: once a firm has a new product, it wants to open up new markets. So in order to extrapolate the exogenous part of our regressor we instrumented the share of firms aiming at opening new markets in each firm size class within a sector with those of the sectors belonging to the same nest. The same reasoning has been applied to the other regressors, that have all been instrumented in this fashion. Finally, in order to check whether pooling over the three size classes is a good approximation and does not impose too much bias on the coefficients of the regressions, we performed a Roy-Zellner test after Roy (1957) and Zellner (1962) and, according to the obtained results, we have carried out separate regressions for small, medium and large firms.
10 After Moulton and Randolph (1989).

The results for product innovation Table V shows the results for the estimation of the model on product innovation. In the first column, the pooled regression provides an overview of the key relationships among the variables. The relevance of a market expansion strategy and the presence of patenting activity are all positive and significant. In order to test for endogeneity, the GMM estimator is presented in the second column; the results of the instrumented variables do not substantially change the results11, and therefore the non-instrumental variable estimators are preferred. The Hausman test points to the superiority of the random effect estimator and the SLM test shows that the variance of the firm size error component is not statistically different from zero. The effects due to country, industry and firm size differences (shown by σµ, σλ and σγ in Table V) suggests that most unobserved heterogeneity comes from the variety of country, followed by that of sectors, without affecting coefficient estimates. Finally the Roy-Zellner test rejects poolability across firm size classes and therefore additional tests are carried out separately for small, medium and large firms in the last three columns of the Table. Considering separately the three firm size classes, we find a general confirmation of the results, with some qualifications. The coefficients for small and medium firms appear to be rather similar, while large firms have a more distinct behaviour. The strategy of opening new markets is a key factor for product innovation in large firms, where patenting loses its significance. For larger firms, with greater financial resources, a market power strategy may be dominant over a technological strategy based on patent applications, which appear to be less associated with the effective introduction of new products.
(Table V and VI here) The results for process innovation Table VI shows the findings for process innovation. In the pooled estimation, the aims of production flexibility and opening new markets, and the expenditure for innovation-related machinery are positively and significantly associated with process innovations, confirming the expectation of our model. The test for endogeneity, with the GMM estimator in the second column, shows that the instrumented variables do not substantially change the results (and the J-test does not reject the overidentifying restrictions), and therefore the non-instrumental variable estimators are again preferred. The Hausman test again prefers the RE model to the FE one. The SLM test supports a zero variance restriction for the sector error component, and the values of σµ, σλ and σγ show that most unobserved heterogeneity comes from differences in firm size, followed by those among countries, without affecting coefficient point estimates. 12 Again, pooling is rejected by the Roy-Zellner test, and separate regressions for firm size classes are carried out.
11 It is worth noting that the J-test did not reject the overidentifying restrictions. 12 Further tests of the models have been carried out introducing dummy variables for industries, when the SLM test did not find a significant variance for the industry error component, and the results show little change. The sectors with an above average impact include for process innovation and small firms Manufacturing NEC and Recycling; Wood, Pulp, Paper, Publishing and Printing; Rubber, Plastics and other Non Metallic Mineral Products and Food and Beverages. For process innovation and large firms they include Food and Beverages; Coke, Refined Petroleum Products, Nuclear Fuel and Chemicals; Basic Metals and Fabricated Metal Products; Transport Equipment and Manufacturing NEC and Recycling.
Greater similarities emerge between small and medium-sized firms than with larger ones. For introducing new processes, the former rely more on strategies for production flexibility. Large firms, on the other hand, show a greater role for the acquisition of new machinery and for strategies aiming at opening new markets, pursued through the cost reductions made possible by new processes. This last finding is convergent with that of the previous table, and points out the importance of market power strategies for large firms when introducing both product and process innovation. For large firms only, to some extent, the distinction between the two may be less relevant.13
6. Conclusions The results provide solid evidence on two important dimensions of the innovation-firm size issue: the differences in the determinants of product and process innovation, and the patterns emerging across firm size in European manufacturing industries. Both are made possible by the use of innovation survey data that provide a variety of detailed measures of firms’ innovative activities and performances. Moreover, our study has suggested improvements in the econometric techniques that are most appropriate to detect whether industrial heterogeneity has an effect on the parameter estimates or on their variability, and to deal with endogeneity. The first finding confirms the conceptualisation of the differences between strategies of technological competitiveness relying on new products, and those of active price competitiveness, based on new processes. While product innovation is explained by a growth-oriented strategy, described by the relevance of firms pursuing new markets and carrying out patenting activities, process innovation is associated to the acquisition of new machinery, the restructuring of production, based on a search for flexibility and on strategies of market expansion. These distinct models identify two trajectories for innovation that are largely separate from one another, although some complementarities exists and they are stronger for large firms. The second finding is that firm size does matter in identifying the determinants of both product and process innovations (and in fact pooling was never accepted in our tests). While small and medium sized firms (below 249 employees) largely behave in similar ways, with patenting leading to new products and the search for flexibility leading to new processes, innovation in larger firms appears to be characterised by a crucial role of market expansion strategies, with the acquisition of new machinery having a major effect in the case of process innovations. These are the specific mechanisms that can be identified in European industries behind the evidence that large firms perform better than medium sized and small ones in both product and process innovations. The main policy implications of this results are that innovation policies should explicitly identify their major objective and target group of firms. First, efforts for stimulating new products should favour the strategies of market expansion by firms, through, for instance, an expansionary demand
13 An interesting addition is the interpretation of the size of the estimation coefficients. If we consider the results for process innovation in large firms, the lowest values of the variables are found for Norway in the sector “Wood, Pulp, Paper, Publishing and Printing”; here the percentage of firms introducing process innovations was 8%, and this outcome was associated to €1096 per employee spent for new machinery related to innovation, and a percentage of firms aiming at opening new markets or at enlarging their market share that was 14% only. If we consider the equations of the model, we can observe the quantitative effect of each coefficient. If expenditure for new machinery had been equal to the average value of € 1934, then the associated percentage of firms introducing process innovations would have moderately risen to 9.32%. By the same token, if the percentage of firms aiming at opening new markets had been equal to the average value of the sample, 54%, then the associated percentage of firms introducing process innovations would have substantially increased to 27%.

policy, organisation of new markets and targeted procurement. At the same time, when innovation in small and medium sized firms is targeted, the effectiveness shown by patenting in the introduction of new products suggests a strong policy potential of actions stimulating research and invention efforts by SMEs. This appears to be particularly important in countries, such as in Southern Europe, where SMEs and low innovation industries are over-represented, and the industrial structure has a relative weakness in the innovative activities capable to support the introduction of new products and the growth of new markets (European Commission, 2003). Second, a policy for greater industrial efficiency based on new processes should rely - as it already does in many countries - on the role of the acquisition of new machinery incorporating process innovations, via incentives and credit for such investment. While such a mechanism has appeared to be effective for large firms in particular, it could be equally effective for SMEs, once appropriate policy tools and financial arrangements are put in place. New processes are often the results of strategies searching for greater flexibility and organisational change in firms. This is the typical path followed by SMEs that have less complex organisations and can develop strong network relationships. Policies in this direction could provide firms with greater access to knowledge and to more skilled labour, taking advantage of the complementarities with ICTs pointed out by the large literature on skill biased technical change (see, for instance, Berman, Bound and Machin, 1998), while favouring the diffusion of new organisational arrangements could contribute to spread in large and small firms new and more efficient production processes (see, for instance, Black and Lynch, 2001). The emphasis on the distinctiveness of the dynamics of product and process innovation, and on the specificities of small, medium and large firms, however, should not lead to neglect the importance of an appropriate integration of different types of innovative efforts, building on the complementarities between technological and organisational change, and between innovation and market dynamics, both in business strategies and in public policies.
References
Acs, Z. J. and Audretsch, D. B., 1987, ‘Innovation, Market Structure and Firm Size’, Review of Economics and Statistics, 69, 567-575. Acs, Z. J. and Audretsch, D. B., 1988, ‘Innovation in Large and Small Firms: An Empirical Analysis’, American Economic Review, 78, 678-690. Acs, Z. J. and Audretsch, D. B., 1990, Innovation and Small Firms, Cambridge, MA, MIT Press. Acs, Z. J. and Audretsch, D. B., 1991, ‘R&D, Firm Size and Innovative Activity’, in Acs, Z. J. and Audretsch, D. B. (eds.), Innovation and Technological Change, London, Harvester Wheatsheaf, 39-59. Acs, Z. J., Audretsch, D. B. and Feldman, M. P., 1994, ‘R&D Spillovers and Recipient Firm Size’, Review of Economics and Statistics, 76 (2), 336 – 339. Amemya, T., 1971, ‘The estimation of the variances in a variance-covariance model’, International Economic Review, 12, 1–13. Antonucci, T. and Pianta M., 2002, ‘The employment effects of product and process innovations in Europe’, International Review of Applied Economics, 16 (3) 295-308. Audretsch, D. and Vivarelli, M., 1994, ‘Small Firms and R&D Spillovers: Evidence from Italy’, Revue d’Economie Industrielle, 67 (1), 225-37 Balestra, P. and Nerlove, M, 1973, ‘Pooling cross section and time series data in the estimation of error components models’, Journal of Econometrics, 1, 17-28. Baltagi, B. H., 1985, ‘Pooling cross sections with unequal time series length’, Economics Letters, 18, 133-136. Baltagi, B. H., 2003, Econometric Analysis of Panel Data, Wiley, New York.

Berman, E., Bound, J. and Machin, S. (1998) Implications of skill biased technological change: international evidence. Quarterly Journal of Economics, 113, 1245-79 Berry, S., 1994, ‘Estimating dicrete-choice models of product differentiation’, Rand Journal of Economics, 25, 242 – 262. Black, S. and Lynch, L. (2001). ‘How to compete: The Impact of Workplace Practices and Information Technology on Productivity’. Review of Economics and Statistics, 83, 3 Bound, J., C. Cummins, Z. Griliches, B.H. Hall, and A. Jaffe, 1984, ‘Who does R&D and who patents’, in Z. Griliches (ed.), R&D Patents and Productivity, Chicago: University of Chicago Press for the NBER. Cohen, W., 1995, Empirical Studies of Innovation Activity, Oxford: Blackwell. Cohen, W. M. and S. Klepper, 1994, ‘Firm size and the nature of innovation within industries: the case of process and product R&D’, Review of Economics and Statistics, 788 (2) 232-243. Cohen, W. and Klepper, S., 1996, ‘A Reprise of Size and R&D’, Economic Journal, 106, 925-951. Crespi, F. and M. Pianta, 2005, ‘Technical Strategies, Demand and Innovation’, mimeo. Davis, P., 2002, ‘Estimating multi-way error components models with unbalanced data structures’, Journal of Econometrics, 106, 67-95. Davis, P., 2003, ‘System Estimation of Multi-way Error Component Models using Unbalanced Data Structures’, mimeo de Jong, J. and Vermeulen, P., 2004, ‘Determinants of product innovation in small firms: a comparison across industries’ , SCALES paper N200410, EIM, Zoetermeer, the Netherlands. Edquist, C., Hommen, L. and McKelvey, M., 2001, Innovation and employment: product versus process innovation, Cheltenham, Elgar. European Commission, 2003, Observatory of European SMEs. SMEs in Europe 2003/7. Luxembourg, European Commission. European Commission-Eurostat, 2001, Statistics on innovation in Europe. Data 1996-1997. Luxembourg, European Commission. European Commission-Eurostat, 2004, Innovation in Europe. Results for the EU, Iceland and Norway. Data 1998-2001. Luxembourg, European Commission Fuller, W. A. and Batese, G.E., 1973, ‘Estimation of linear functions with crossed-error structure’, Journal of Econometrics, 2, 67-78. Hausman, J. A., 1978, ‘Specification tests in econometrics’, Econometrica 46, 1251 – 1271. Link, A., 1982, ‘A disaggregated analysis of industrial R&D product versus process innovation’, in Sahal, D. (ed.) The transfer and utilization of technical knowledge, Lexington, MA: Lexington Books. Love, JH, and Ashcroft, B., 1999, ‘Market versus corporate structure in plant-level innovation performance’, Small Business Economics, 13(2), 97-109. Malerba, F. (ed.), 2004, Sectoral systems of innovation, Cambridge, Cambridge University Press. Mazodier, P., 1972, ‘L’Estimation de modèles à errors composées’, Annales de l’INSEE 7, 43 – 72. Moulton, B. R. and Randolph, W.C., 1989, ‘Alternative tests of the error components model’, Econometrica 57, 685 – 693. Moulton, B. R., 1986, ‘Random group effects and the precision of regression estimates’, Journal of Econometrics, 32, 385 – 397. Nerlove, A., 1971a, ‘Further evidence on the estimation of dynamic economic relations from time series of cross sections’, Econometrica, 39, 359-382. Nerlove, B., 1971b, ‘A note on error components models’, Econometrica, 39, 383 – 396. Pianta, M., 2001, ‘Innovation, Demand and Employment’, in Petit, P. and Soete, L. (eds), Technology and the future of European Employment. Cheltenham, Elgar, 142-165. Rogers, M., 2004, ‘Networks, Firm Size and Innovation’, Small Business Economics, 22, 141-153. Rothwell, R. and Dodgson, M., 1994, ‘Innovation and Size of Firm’, in Dodgson, M. and Rothwell, R. (eds.), The Handbook of Industrial Innovation, Cheltenham, UK, Edward Elgar. Roy, S. N., 1957, Some Aspects of Multivariate Analysis, Wiley, New York.
Scherer F. M. (1991) ‘Changing perspectives on the firm size problem’ in ZJ. Arcs et D.B. Audretsch (eds.) Innovation and technological change : an international comparison, Ann Arbor : University of Michigan Press. Scherer, F. M., 1965, ‘Firm Size, market structure, opportunity and the output patented inventions’, American Economic Review, 55, 1097-1125. Scherer, F. M., 1984, Innovation and Growth: Schumpeterian Perspectives, Cambridge, Mass., MIT Press. Schumpeter, J.A., 1942, Theory of Economic Development, Cambridge (Mass.), Harvard University Press (1st edn 1911) Soete, L. L. G., 1979, ‘Firm size and innovative activity: the evidence reconsidered’, European Economic Review, 12, 319-340. Van Dijk, B., Hertog, R., Menkveld, B. and Thurik, R., 1997, ‘Some New Evidence on the Determinants of Large and Small – Firm Innovation’, Small Business Economics, 9, 335-343. Wallace, T. D. and Hussain, A., 1969, ‘The use of error components models in combining cross-section and time-series data’, Econometrica 37, 55-72. Wansbeek, T. and Kapeteyn, A., 1989, ‘Estimation of error –components model with incomplete panels’, Journal of Econometrics, 41(3), 341-361. Zellner, A., 1962, ‘An efficient method of estimating seemingly unrelated regression and tests for aggregation bias’, Journal of American Statistical Association, 57, 348–368.

Table I
Descriptive statistics per country
country
% of firms introducing a
product innovation
% of firms introducing a process innovation
expenditure for innovation-related new machinery per employee (hundred
of thousands of euro per employee)
% of patent applicants
% of firms aiming at
opening new markets
% of firms aiming at improving production flexibility
AT 0.73 0.59 0.022 0.41 0.72 0.60FR 0.48 0.39 0.007 0.21 0.51 0.31IT 0.44 0.50 0.024 0.18 0.43 0.32NL 0.69 0.56 0.021 0.26 0.53 0.46NO 0.43 0.44 0.026 0.14 0.48 0.40PT 0.14 0.21 0.008 0.12 0.41 0.42SE 0.53 0.42 0.018 0.25 0.55 0.44UK 0.62 0.43 0.028 0.21 0.76 0.60
Total 0.51 0.45 0.019 0.21 0.54 0.42
Note: the table contains the average values for each country of the variables used in the present study.
Table II
Descriptive statistics by firm size class
size
% of firms introducing a
product innovation
% of firms introducing a process innovation
expenditure for innovation-related new machinery per employee (hundred
of thousands of euro per employee)
% of patent applicants
% of firms aiming at
opening new markets
% of firms aiming at improving production flexibility
large 0.68 0.62 0.016 0.40 0.68 0.56medium 0.51 0.44 0.021 0.18 0.55 0.42small 0.36 0.32 0.021 0.08 0.41 0.31
Total 0.51 0.45 0.019 0.21 0.54 0.42
Note: the table contains the average values for each firm size class of the variables used in the present study.
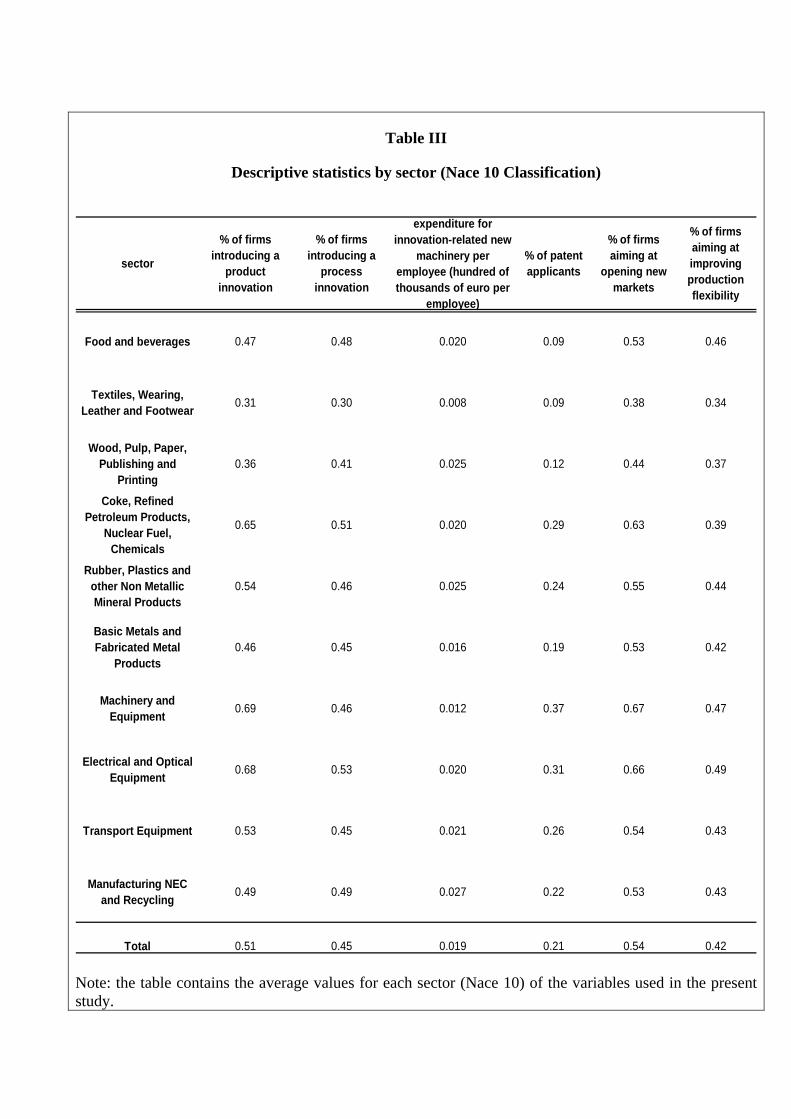
Table III
Descriptive statistics by sector (Nace 10 Classification)
sector
% of firms introducing a
product innovation
% of firms introducing a
process innovation
expenditure for innovation-related new
machinery per employee (hundred of thousands of euro per
employee)
% of patent applicants
% of firms aiming at
opening new markets
% of firms aiming at improving production flexibility
Food and beverages 0.47 0.48 0.020 0.09 0.53 0.46
Textiles, Wearing, Leather and Footwear 0.31 0.30 0.008 0.09 0.38 0.34
Wood, Pulp, Paper, Publishing and
Printing0.36 0.41 0.025 0.12 0.44 0.37
Coke, Refined Petroleum Products,
Nuclear Fuel, Chemicals
0.65 0.51 0.020 0.29 0.63 0.39
Rubber, Plastics and other Non Metallic Mineral Products
0.54 0.46 0.025 0.24 0.55 0.44
Basic Metals and Fabricated Metal
Products0.46 0.45 0.016 0.19 0.53 0.42
Machinery and Equipment 0.69 0.46 0.012 0.37 0.67 0.47
Electrical and Optical Equipment 0.68 0.53 0.020 0.31 0.66 0.49
Transport Equipment 0.53 0.45 0.021 0.26 0.54 0.43
Manufacturing NEC and Recycling 0.49 0.49 0.027 0.22 0.53 0.43
Total 0.51 0.45 0.019 0.21 0.54 0.42 Note: the table contains the average values for each sector (Nace 10) of the variables used in the present study.
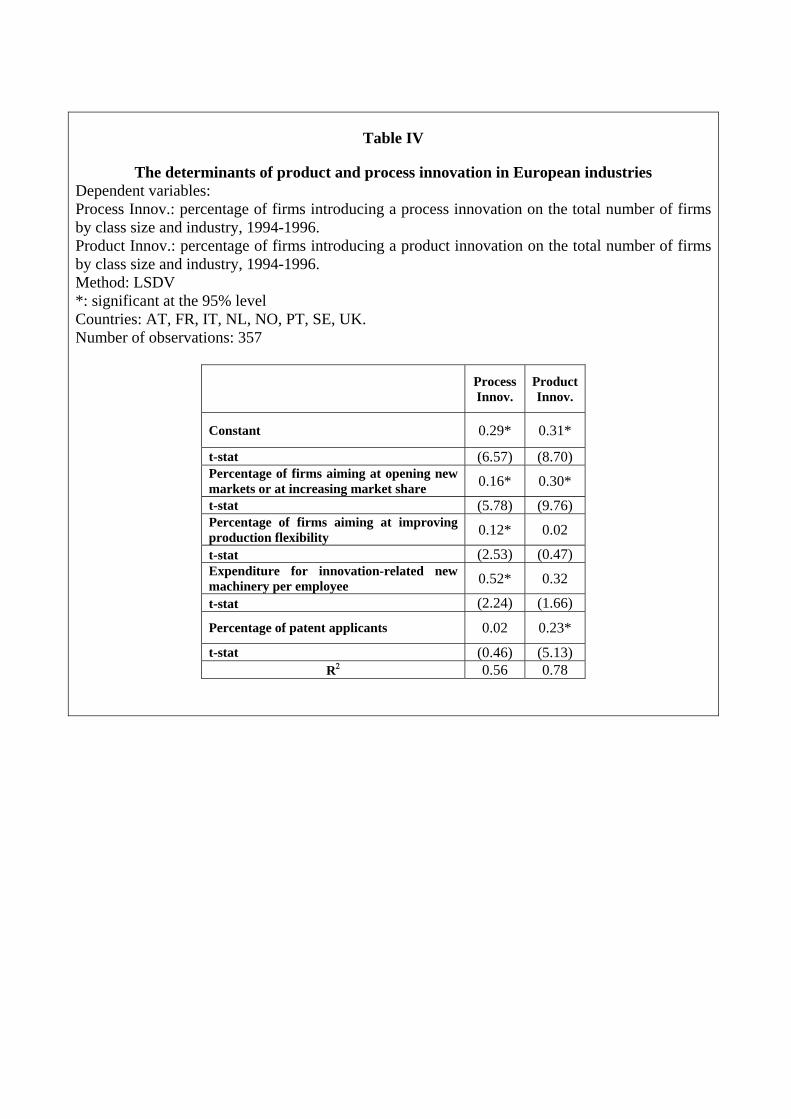
Table IV
The determinants of product and process innovation in European industries Dependent variables: Process Innov.: percentage of firms introducing a process innovation on the total number of firms by class size and industry, 1994-1996. Product Innov.: percentage of firms introducing a product innovation on the total number of firms by class size and industry, 1994-1996. Method: LSDV *: significant at the 95% level Countries: AT, FR, IT, NL, NO, PT, SE, UK. Number of observations: 357
Process Innov.
Product Innov.
Constant 0.29* 0.31*
t-stat (6.57) (8.70) Percentage of firms aiming at opening new markets or at increasing market share 0.16* 0.30*
t-stat (5.78) (9.76) Percentage of firms aiming at improving production flexibility 0.12* 0.02
t-stat (2.53) (0.47) Expenditure for innovation-related new machinery per employee 0.52* 0.32
t-stat (2.24) (1.66)
Percentage of patent applicants 0.02 0.23*
t-stat (0.46) (5.13) R2 0.56 0.78
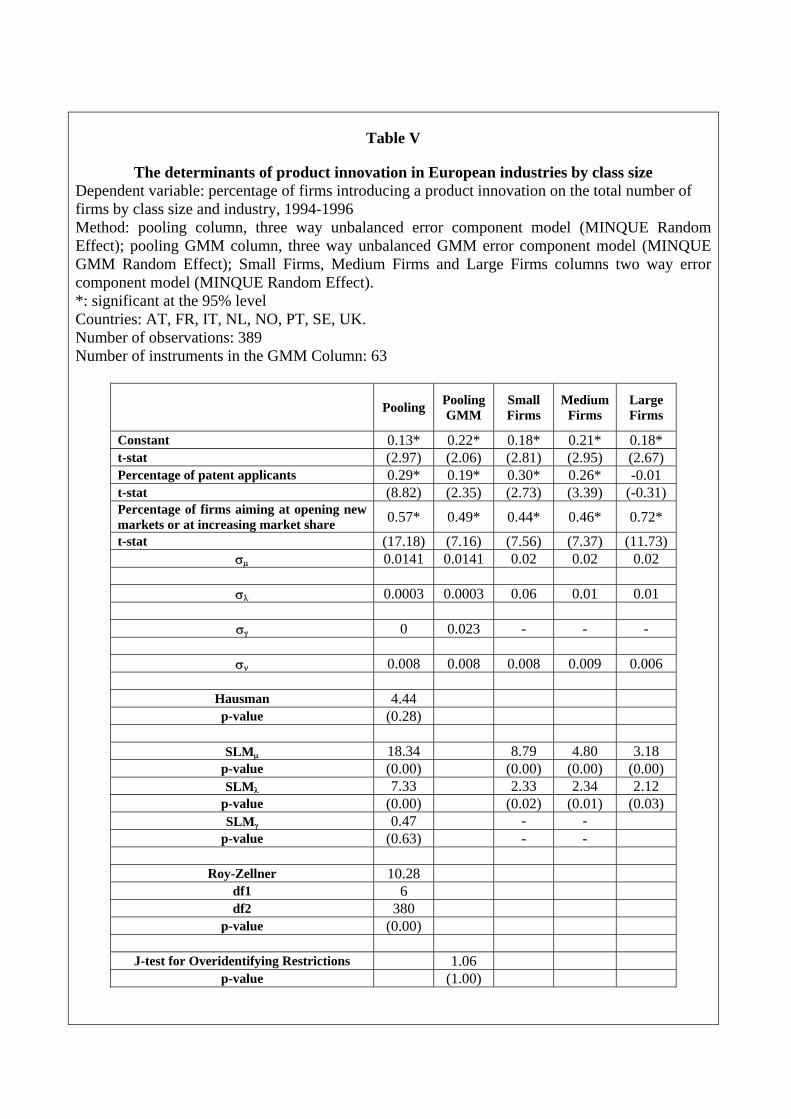
Table V
The determinants of product innovation in European industries by class size Dependent variable: percentage of firms introducing a product innovation on the total number of firms by class size and industry, 1994-1996 Method: pooling column, three way unbalanced error component model (MINQUE Random Effect); pooling GMM column, three way unbalanced GMM error component model (MINQUE GMM Random Effect); Small Firms, Medium Firms and Large Firms columns two way error component model (MINQUE Random Effect). *: significant at the 95% level Countries: AT, FR, IT, NL, NO, PT, SE, UK. Number of observations: 389 Number of instruments in the GMM Column: 63
Pooling Pooling GMM
Small Firms
Medium Firms
Large Firms
Constant 0.13* 0.22* 0.18* 0.21* 0.18* t-stat (2.97) (2.06) (2.81) (2.95) (2.67) Percentage of patent applicants 0.29* 0.19* 0.30* 0.26* -0.01 t-stat (8.82) (2.35) (2.73) (3.39) (-0.31) Percentage of firms aiming at opening new markets or at increasing market share 0.57* 0.49* 0.44* 0.46* 0.72*
t-stat (17.18) (7.16) (7.56) (7.37) (11.73) σµ 0.0141 0.0141 0.02 0.02 0.02
σλ 0.0003 0.0003 0.06 0.01 0.01
σγ 0 0.023 - - -
σν 0.008 0.008 0.008 0.009 0.006
Hausman 4.44 p-value (0.28)
SLMµ 18.34 8.79 4.80 3.18
p-value (0.00) (0.00) (0.00) (0.00) SLMλ 7.33 2.33 2.34 2.12
p-value (0.00) (0.02) (0.01) (0.03) SLMγ 0.47 - -
p-value (0.63) - -
Roy-Zellner 10.28 df1 6 df2 380
p-value (0.00)
J-test for Overidentifying Restrictions 1.06 p-value (1.00)

Table VI
The determinants of process innovation in European industries by class size Dependent variable: percentage of firms introducing a process innovation on the total number of firms by class size and industry, 1994-1996 Method: pooling column, three way unbalanced error component model (MINQUE Random Effect); pooling GMM column, three way unbalanced GMM error component model (MINQUE GMM Random Effect); Small Firms, Medium Firms and Large Firms columns two way error component model (MINQUE Random Effect). Countries: AT, FR, IT, NL, NO, PT, SE, UK. Number of observations: 389. Number of instruments in the GMM Column: 97
Pooling Pooling GMM
Small Firms
Medium Firms
Large Firms
Constant 0.13* 0.14* 0.11* 0.14* 0.14* t-stat (1.61) (1.63) (2.42) (2.25) (2.04) Expenditure for innovation-related new machinery per employee 0.79* 0.64* 0.67* 0.88* 1.57*
t-stat (4.16) (2.20) (2.36) (2.99) (2.21) Percentage of firms aiming at opening new markets or at increasing market share 0.33* 0.34* 0.23* 0.21* 0.49* t-stat (8.23) (5.36) (3.45) (2.80) (5.88) Percentage of firms aiming at improving production flexibility 0.25* 0.23* 0.29* 0.33* 0.16
t-stat (5.14) (3.39) (3.57) (4.29) (1.54) σµ 0.010 0.010 0.010 0.02 0.01
σλ 0 0.0007 0 0.01 0
σγ 0.015 0.015 - - -
σν 0.012 0.012 0.012 0.01 0.016
Hausman 3.03 p-value (0.38)
SLMµ 31.60 6.77 12.95 5.10
p-value (0.00) (0.00) (0.00) (0.00) SLMλ 1.46 0 2.89 1.65
p-value (0.14) (1.00) (0.00) (0.10) SLMγ 28.28
p-value (0.00)
Roy-Zellner 11.32 df1 8 df2 377
p-value (0.00)
J-test for Overidentifying Restrictions 1.21 p-value (1.00)

Appendix
Data The data used in this paper come from the SIEPI-CIS2 database produced at the University of Urbino, a product of the SIEPI project “The structure of innovation and economic performance indicators” partly funded by the European Commission (contract HPV2-CT-2002-00017). National sources have provided innovation indicators, from the CIS2 (Second Community Innovation Survey for 1994-1996), for 22 industrial sectors – Nace Rev.1 subsections – and for 10 European countries – Austria, Germany, France, Italy, Norway, Finland, Spain, Sweden, the Netherlands and the UK. Data were available for three size classes: 20-49 employees; 50-249 employees; 250 employees or more. The sectors included are the following: 1. Food and Beverages (Nace Rev. 1 classes 15); 2. Textiles, Dressing and Leather (17); 3. Wearing Apparel, Dressing and Dying of Fur (18); 4. Leather, Leather Products and Footwear (19); 5. Wood and Products of Wood and Cork (20); 6. Pulp, Paper and Paper Products (21); 7. Printing and Publishing (22); 8. Coke, Refined Petroleum Products and Nuclear Fuel (23); 9. Chemicals and Chemical Products (24); 10. Rubber and Plastics Products (25); 11. Other Non-Metallic Mineral Products (26); 12. Basic Metals (27); 13. Fabricated Metal Products, except Machinery and Equipment (28); 14. Machinery and Equipment, (29); 15. Office, Accounting and Computing Machinery (30) 16. Electrical Machinery (31) 17. Radio, Television and Communication Equipment (32); 18. Medical, Precision and Optical Instruments (33); 19. Motor Vehicles, Trailers and Semi-trailers (34); 20. Other Transport Equipment (35); 21. Manufacturing NEC (36) 22. Recycling (37). The dataset has many missing values, mainly due to the privacy policy of the statistical offices taking part to the CIS2 survey.
Methodology In order to have a better grasping of the methodological procedure we adopted, it is worth consulting Table VII, referring to the model explaining product innovation. As a first step we performed an OLS estimation. The results are very nice: all the variables are positively correlated with product innovation and they all have a high level of significance. However, the niceness itself of this results is suspicious as Moulton (1986) showed that OLS standard errors can be downward biased in presence of unobserved group variables. In order to detect if unobserved group variables generate correlation between the regressors and the error term or within the error term and to check for model mispecification, we computed the FE and two RE estimators. The result is that the FE and the RE estimators are not far from one another implying that the latter two better fit the data - as showed also by the two Hausman’s tests computed both for QUE and MINQUE – and also that specification errors do not cause any harm. Therefore, we concluded that the Random Effect model is the most suitable for the datasets used in this paper.
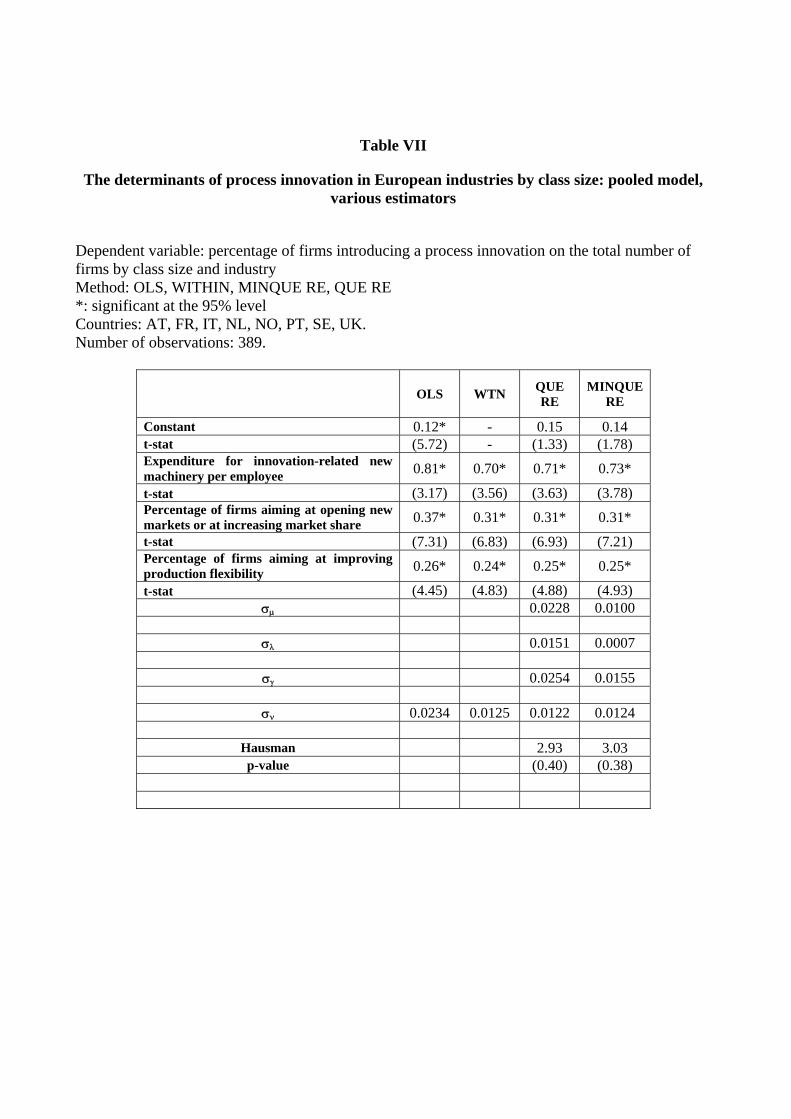
Table VII
The determinants of process innovation in European industries by class size: pooled model, various estimators
Dependent variable: percentage of firms introducing a process innovation on the total number of firms by class size and industry Method: OLS, WITHIN, MINQUE RE, QUE RE *: significant at the 95% level Countries: AT, FR, IT, NL, NO, PT, SE, UK. Number of observations: 389.
OLS WTN QUE RE
MINQUE RE
Constant 0.12* - 0.15 0.14 t-stat (5.72) - (1.33) (1.78) Expenditure for innovation-related new machinery per employee 0.81* 0.70* 0.71* 0.73*
t-stat (3.17) (3.56) (3.63) (3.78) Percentage of firms aiming at opening new markets or at increasing market share 0.37* 0.31* 0.31* 0.31* t-stat (7.31) (6.83) (6.93) (7.21) Percentage of firms aiming at improving production flexibility 0.26* 0.24* 0.25* 0.25*
t-stat (4.45) (4.83) (4.88) (4.93) σµ 0.0228 0.0100
σλ 0.0151 0.0007
σγ 0.0254 0.0155
σν 0.0234 0.0125 0.0122 0.0124
Hausman 2.93 3.03 p-value (0.40) (0.38)