Embed Size (px)
DESCRIPTION
Welfare Systems Kiel
Citation preview

How to Deal with Inequality Welfare System Challenges and European Responses
Andreas Friedl, Dennis Görlich, Sebastian Horn, Christiane Krieger-Boden, Matthias Lücke
No. 85│May 2015
Kiel Policy Brief
Institut für Weltwirtschaft Kiel Kiel Institute for the World Economy
ISSN 2195–7525
Kiel Policy Brief 85 1 / 34
How to Deal with Inequality
Welfare System Challenges and European Responses
Andreas Friedl
Dennis Görlich*
Sebastian Horn**
Christiane Krieger-Boden
Matthias Lücke
The Kiel Institute for the World Economy
Kiellinie 66, 24105 Kiel, Germany
http://www.ifw-kiel.de/
Content
1 Introduction ........................................................................................................................ 2
2 Inequality and Redistribution ............................................................................................. 3
3 Types of European Welfare Systems ................................................................................ 8
3.1 Decommodification ................................................................................................. 10
3.2 Stratification ........................................................................................................... 12
3.3 Social Investment Expenditure ............................................................................... 13
3.4 Convergence of European welfare systems? ........................................................ 14
4 Impact on Inequality and Economic Performance ........................................................... 17
5 Welfare Systems and Underlying Norms and Values...................................................... 21
5.1 Survey Data on values regarding inequality and redistribution .............................. 21
5.2 Experimental Data on values regarding inequality and redistribution .................... 24
6 Challenges and Adjustment Requirements ..................................................................... 26
6.1 Welfare system reactions on the financial and debt crisis ..................................... 26
6.2 Challenges ahead for European welfare systems .................................................. 28
7 Conclusions ..................................................................................................................... 30
References ............................................................................................................................. 32
* Corresponding author: [email protected] **Affiliation deviating from other authors: Ludwig-Maximilian-Universität Munich. The responsibility for the contents of the Kiel Policy Briefs rests with the author, not the Institute. Für den Inhalt der Kiel Policy Briefs ist allein der Autor verantwortlich, nicht das Institut.
Kiel Policy Brief 85 2 / 34
1 Introduction
In many countries across the world, there is concern about persistent poverty, an increas-
ingly unequal income distribution, and an eroding commitment to equity and fairness among
citizens. Against this background, Dadush and Dervis (2013) call the maintenance of social
cohesion a key policy challenge of the 21st century. Absolute poverty, although it still affects
approximately one out of seven world citizens, has declined during the last three decades.
Income inequality, however, is on the rise in many countries, fuelling social and political in-
stability. The financial and economic crisis in Europe and North America during the late
2000s has profoundly changed the context in which inequality occurs: median incomes are
stagnating, the share of income earned by the richest 1 % is increasing, unemployment rates
are at record highs, and government resources are severely strained by austerity measures.
Under these circumstances, limiting the increase in inequality becomes even more important.
Welfare systems in Europe are now facing several simultaneous, though not necessarily
related challenges. First, growing inequality in market incomes, such as through technologi-
cal progress and globalization, puts upward pressure on inequality in household disposable
incomes. Second, because of the Great Recession since 2008, welfare systems in Europe
have to provide for a growing number of unemployed individuals while facing funding con-
straints due to tight fiscal policies. Third, there are concerns that demographic change may
increase the dependency ratio (the ratio of transfer recipients to contributors) to unsustain-
able levels and that the design of some national welfare systems may inappropriately reduce
incentives to work.
In this paper, we seek to identify innovative ways to limit inequality in households’ dispos-
able incomes and living standards while keeping welfare systems fiscally sustainable. We
focus on the welfare systems of EU countries in comparison, to better understand their key
features. To set the scene, we review trends in income inequality in Europe in relation to
other major world regions. We compare inequality before and after taxes and transfers
across European countries to gain insights into the extent of redistribution and, hence, the
impact of the national welfare systems (Section 2).
Next we review the experience of five European countries that have been identified as
examples of distinct welfare system models. We characterize national welfare systems in
terms of the extent to which they decommodify labour, emphasize or relax stratification, and
engage in social investment rather than income replacement during spells of unemployment
(Section 3). We go on to assess the performance of our selected countries in terms of
income redistribution, economic growth, polarization between rich and poor, and labour mar-
ket developments (Section 4). We complement the picture by looking closely at evidence
from surveys and economic experiments to assess inequality aversion in our selected coun-
tries and relate our findings to the extent of redistribution and other features of the national
welfare systems (Section 5). We look for recent challenges for and responses by the welfare
systems and reflect on adjustment requirements that lie ahead (Section 6). The final section
concludes (Section 7).
Kiel Policy Brief 85 3 / 34
Our findings may be summarized briefly:
Compared with other world regions, inequality in disposable income in Europe is relatively
low and has not increased sharply during the last two decades.
Welfare systems in Europe may be distinguished based on (1) the extent to which they
decommodify labour; (2) whether they emphasize or relax stratification; and (3) the extent
to which they emphasize social investment rather than income replacement during unem-
ployment spells.
When putting together the characteristics of welfare systems and the economic perfor-
mance of each country during the last quarter century, Sweden with its Nordic-type wel-
fare system has done particularly well. Economic growth was robust, polarization between
the rich and the poor remained limited, and high employment rates - overall and for
women in particular - sustained the tax base and ensured that government expenditures,
including welfare payments and social investment, remained fiscally sustainable.
The UK also experienced relatively rapid GDP growth, but suffered from growing polariza-
tion between the rich and the poor. At the same time, both survey and experimental evidence
suggest that the UK citizen's aversion to inequality is lower than elsewhere in Europe.
Germany, France, and Italy experienced only modest GDP growth. Italy’s welfare system
which privileges insiders over outsiders has resulted in polarization, low employment
rates, and an unsustainable fiscal situation. France managed to avoid growing polariza-
tion, but suffers from high unemployment and growing doubts about the sustainability of
the fiscal situation. Germany’s labour market reforms during the early 2000s resulted in
favourable labour market indicators with low unemployment and high total and female
employment. However, incomes have become more polarized and total GDP as well as
most workers’ incomes have grown only slowly.
We find little correlation between national attitudes towards inequality and the actual
extent of redistribution through the national welfare system.
Real challenges lie ahead of the welfare systems, and they require considerate public
debates for efficient rather than sham solutions.
2 Inequality and Redistribution
Compared to other parts of the world, Europe stands out in that household income inequality
after taxes and transfers (i) is lower than elsewhere and (ii) has not increased much during
the last three decades (Figure 1). The population weighted average Gini coefficient for major
European countries grew by less than two percentage points and remains below 0.31 during
the late 2000s. In China, by contrast, the corresponding Gini coefficient grew from 0.28 in the
Kiel Policy Brief 85 4 / 34
mid-1980s to 0.42 in the late 2000s reflecting systemic transformation, rapid economic
growth and structural change. In the US, the Gini coefficient increased from 0.34 to 0.38.1
Figure 1: Gini Coefficients after taxes and transfers since mid-1980s
Source: OECD Statistical Database (2013), Worldbank World Development Indicators (2013).
Probably, European welfare systems were responsible in large measure for this
favourable performance. In fact, income inequality before taxes and transfers in selected
European countries increased sharply in Italy, the UK, and Germany, and more modestly in
Sweden (Figure 2). “Pre-government” inequality, i.e. the unequal distribution of market
incomes before households pay taxes and receive transfers from the government, is mainly
the result of households’ initial “factor endowments” – the education and skill levels of their
working members, their productive and financial wealth, etc. Over time, wages, employment
opportunities, and household income from other sources are affected by changes in the
global supply and demand for capital and labour as well as a wide range of government
policies that affect product or factor markets. Specifically, the observed increase in pre-
government inequality in many high-income countries since the 1970s has probably been
driven by a combination of two global trends: first, technological progress biased against low-
skilled workers and benefitting high-skilled workers along with the owners of capital, and
second, the globalization of markets for goods, services, capital, and labour. At the same
time, of course, technological progress and globalization have generated large economy-
wide benefits through higher output and better living standards.
1 While several statistical measures of income inequality exist, we rely on the Gini coefficient because it is the most widely used by far.
0,25
0,27
0,29
0,31
0,33
0,35
0,37
0,39
0,41
0,43
0,45
mid‐80s around 1990 mid‐90s around 2000 mid‐2000s late‐2000s
United States Japan New Zealand Canada Australia China Europe
Kiel Policy Brief 85 5 / 34
Figure 2: Gini Coefficients before taxes and transfers since mid-1980s
Source: OECD Statistical Database (2013).
But welfare systems in most European countries have apparently dampened the upward
pressure from market incomes on inequality in disposable incomes, re-distributing market
incomes across households through a combination of progressive taxation, transfers to
various categories of individuals, and the provision of free public services. By contrast, the
Gini coefficient for US income inequality increased by similar amounts for both, inequality
before (Figure 2) and after taxes and transfers (Figure 1). The US welfare system apparently
did little to absorb market pressures leading to greater income inequality.
The important role of European welfare systems in limiting income inequality is confirmed
by a country-by-country analysis (Figure 3). Gini coefficients before taxes and transfers
varied from 0.53 in Italy to 0.41 in Switzerland during the late 2000s, largely reflecting diverse
labour market outcomes that in turn are shaped by labour market institutions, working hours
and unemployment rates (OECD 2012b). Gini coefficients after taxes and transfers are typi-
cally 15 to 20 percentage points lower, reflecting a wide variety of redistributive institutions.
Remarkably, the relatively high Gini coefficients after taxes and transfers in the US and
Japan can largely be attributed to a small impact of the welfare system, rather than to high
income inequality before taxes and transfers. Figure 3 also demonstrates that, although the
Europe experience is distinct from the US overall, there is also considerable heterogeneity
across European countries in terms of pre-government inequality as well as the reach of the
welfare system as measured by the difference between the Gini coefficients before and after
taxes and transfers.
0,4
0,45
0,5
0,55
0,6
mid‐80s around 1990 mid‐90s around 2000 mid‐2000s late‐2000s
Germany France Sweden Italy Greece United Kingdom United States
Kiel Policy Brief 85 6 / 34
Figure 3: Gini reduction through taxes and transfers during the late 2000s
Source: OECD Statistical Database.
While the Gini coefficient is a useful comprehensive measure of income inequality, it is not
very sensitive to changes in the income shares of small subgroups of the population that may
nevertheless be important from a normative point of view (such as the richest 1 % or poorest
10 %). To complement our analysis based on Gini coefficients, we review the evolution of the
average income of each income decile in selected European countries (Figure 4).
Figure 4: Disposable Income Growth by decile
Note: Dots correspond to observations for Denmark, Finland, France, Germany, Italy, Luxembourg, the Netherlands, Sweden and the United Kingdom.
Source: Bonesmo Fredriksen (2012).
Income growth per cent
Income growth per cent
Average annual change between mid-1980s and 2008
Income decile from lowest to highest
Kiel Policy Brief 85 7 / 34
Although the overall distribution of disposable income in Europe has only become a little
more unequal over time (Figure 1), the disaggregated analysis shows a distinct polarization:
The richest 10 % of income recipients (the 10th decile) have seen their average income
increase much faster (at between 1.3 and 3.4 % per year) than the poorest 10 % (the first
decile), whose income growth ranged from a small decline to just over 2 %. By contrast,
income growth patterns were remarkably similar for deciles three to eight (Bonesmo
Fredriksen 2012).
The polarization at the extremes of the income distribution entails an increased risk of
social exclusion for the poor. Recent research has identified several drivers of growing
polarization:
The lowest decile has been affected particularly by unemployment, which is by far the
single greatest risk factor for poverty and one of the main characteristics of the lowest
decile (Eurostat 2010).
But even in those European countries with low unemployment rates such as Germany and
the Netherlands, wage moderation and labour market reforms aimed at increasing labour
flexibility have led to beneath average income growth for the lowest decile (Bonesmo
Fredriksen 2012)
At the other extreme, above average income growth for the highest decile was mainly
driven by the effects of globalization and technological progress that have caused a
steady rise in the returns to skilled labour (Goos, Manning and Salomon 2009).
On a policy level, this trend has been supported by declines in the progressivity of tax
rates in some European countries, where reduced top marginal tax rates and the
abolishment of wealth taxes have increased the disposable incomes of the rich.
In this section, we have used the difference in Gini coefficients for household income
before and after taxes and transfers as a broad measure of the size of national welfare
systems (Figure 3). However, real-life welfare systems have a far more complex set of tasks
than simply redistributing income to reduce the Gini coefficient. Guaranteeing all citizens a
minimum standard of living, preventing social exclusion of those whose incomes
systematically lag behind the vast majority of the population (such as households in the first
income decile – Figure 4), ensuring access to essential services like health care and basic
education to all citizens irrespective of income, and providing insurance against major life
risks such as unemployment and disability are all part of the widely recognized
responsibilities of modern European welfare states. The extent to which individual countries
take on these tasks as well as the broad strategies pursued and policy instruments employed
vary widely. This is the context for our discussion, in Section 3 below, of the different types of
European welfare systems and the challenges faced by the Continental approach in
particular.
Kiel Policy Brief 85 8 / 34
3 Types of European Welfare Systems
Although reference is often made to a “European social model”, no such uniform European
model exists. Even the term “model” is misleading as it suggests completeness of institutions,
clear system boundaries between inside and outside, and no needs for adjustments (Hemerijck
2013: 153f). Rather, as has been established by the pioneer work of Esping-Andersen (1990)
and resumed by others, there exist at least three to five different types of European welfare
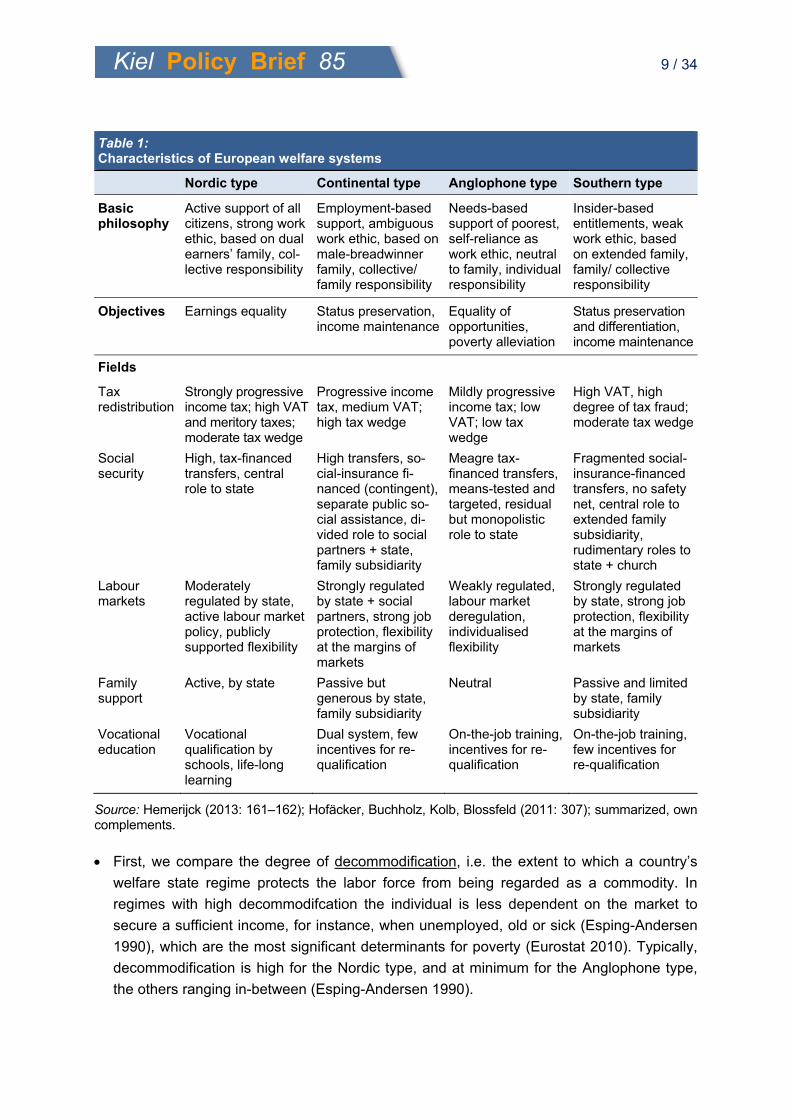
systems. A recent characterization by Hemerijck (2013: 155ff) distinguishes four different
types, labelled Nordic, Continental, Anglophone and Southern type (Table 1). Cluster analyses
by different authors, by and large, sustain this kind of characterization.2
The Nordic or social democratic type of welfare system, which is usually said to apply to
all Scandinavian countries, is based on collective responsibility and universal social citizen-
ship rights (Kangas and Kvist 2013), pursuing the idea of a citizens’ “folkhem”. The Conti-
nental, conservative or corporatist type, often attributed to Germany, the Benelux countries,
Austria and perhaps France, is based - in a Bismarckian tradition - on the principles of status
and income maintenance; traditionally, it has supported male-breadwinner nuclear family
structures (Hemerijck 2013: 158). The Anglophone or liberal type, represented primarily by
the UK and perhaps Ireland, is characterised mainly by its strong reliance on market mecha-
nisms in welfare production and by the limited and residual role it assigns to the state
(Hemerijck 2013: 159). The Southern type, usually attributed to Italy, Spain, Portugal and
Greece, resembles the Continental type in the important role assigned to welfare production
by the family; at the same time, it exhibits distinct institutional features such as strong insider
outsider cleavages between regulated and peripheral markets (Ferrera 1996). To these four
types one may add the Central and Eastern European transformation countries which display
a rather heterogeneous mixture of elements also found in the four other types (Hemerijck
2013: 160). However, as the Central and Eastern European welfare systems are still under-
going far-reaching changes and do not yet represent a distinctive type, we do not consider
them here.
In order to explore further the validity of the distinction between the four types of welfare
systems and to understand better the specific challenges faced by the Continental European
model, we now discuss key characteristics of the national welfare systems of Sweden,
France, Germany, the United Kingdom, and Italy. These countries are not only the largest
European economies in terms of GDP, but they also represent the four types of welfare
states. We structure our discussion along three dimensions that existing research has
identified as important:
2 See, for instance, Kammer, Niehues, Peichl (2012), Obinger and Wagschal (1998). The latter also show all European systems to be closer to each other (and to Australia and New Zealand) than to the systems of Canada, Switzerland, Japan and the United States. Our own attempts, applying various characteristics of welfare systems, yield similar results, although they also reveal a considerable sensitivity of the results to variations of the indicator set.
Kiel Policy Brief 85 9 / 34
Table 1: Characteristics of European welfare systems
Nordic type Continental type Anglophone type Southern type
Basic philosophy
Active support of all citizens, strong work ethic, based on dual earners’ family, col-lective responsibility
Employment-based support, ambiguous work ethic, based on male-breadwinner family, collective/ family responsibility
Needs-based support of poorest, self-reliance as work ethic, neutral to family, individual responsibility
Insider-based entitlements, weak work ethic, based on extended family, family/ collective responsibility
Objectives Earnings equality Status preservation, income maintenance
Equality of opportunities, poverty alleviation
Status preservation and differentiation, income maintenance
Fields
Tax redistribution
Strongly progressive income tax; high VAT and meritory taxes; moderate tax wedge
Progressive income tax, medium VAT; high tax wedge
Mildly progressive income tax; low VAT; low tax wedge
High VAT, high degree of tax fraud; moderate tax wedge
Social security
High, tax-financed transfers, central role to state
High transfers, so-cial-insurance fi-nanced (contingent), separate public so-cial assistance, di-vided role to social partners + state, family subsidiarity
Meagre tax-financed transfers, means-tested and targeted, residual but monopolistic role to state
Fragmented social-insurance-financed transfers, no safety net, central role to extended family subsidiarity, rudimentary roles to state + church
Labour markets
Moderately regulated by state, active labour market policy, publicly supported flexibility
Strongly regulated by state + social partners, strong job protection, flexibility at the margins of markets
Weakly regulated, labour market deregulation, individualised flexibility
Strongly regulated by state, strong job protection, flexibility at the margins of markets
Family support
Active, by state Passive but generous by state, family subsidiarity
Neutral Passive and limited by state, family subsidiarity
Vocational education
Vocational qualification by schools, life-long learning
Dual system, few incentives for re-qualification
On-the-job training, incentives for re-qualification
On-the-job training, few incentives for re-qualification
Source: Hemerijck (2013: 161–162); Hofäcker, Buchholz, Kolb, Blossfeld (2011: 307); summarized, own complements.
First, we compare the degree of decommodification, i.e. the extent to which a country’s
welfare state regime protects the labor force from being regarded as a commodity. In
regimes with high decommodifcation the individual is less dependent on the market to
secure a sufficient income, for instance, when unemployed, old or sick (Esping-Andersen
1990), which are the most significant determinants for poverty (Eurostat 2010). Typically,
decommodification is high for the Nordic type, and at minimum for the Anglophone type,
the others ranging in-between (Esping-Andersen 1990).
Kiel Policy Brief 85 10 / 34
Second, we look at the degree of stratification, i.e. the degree to which the social layers of
a society are actively arranged or re-arranged (Esping-Andersen 1990). Primarily, this is
done through redistribution via the tax and transfer systems. Typically, the instruments of
the welfare state are inclusive of all citizens for the Nordic type; involve segmentation into
different groups and social classes (with privileges for middle class workers, entrepre-
neurs, civil servants, etc.) for the Continental and Southern type; and lead to social exclu-
sion of the poorest for the Anglophone type where there is a dualism between the stigma-
tized poor and others left to fend for themselves in a market environment (Heien, Hofäcker
1999:11).
Finally, we compare the magnitude of social investment to account for transformative
changes in many European welfare states since the emergence of the social investment
paradigm in the late 1990s (Hemerijck 2013). In fact, social investment had a much longer
tradition in the Nordic welfare states, whereas Anglophone and Continental-type systems
embarked on it only when the new paradigm emerged; Southern-type welfare systems are
still reluctant to utilize it.
3.1 Decommodification
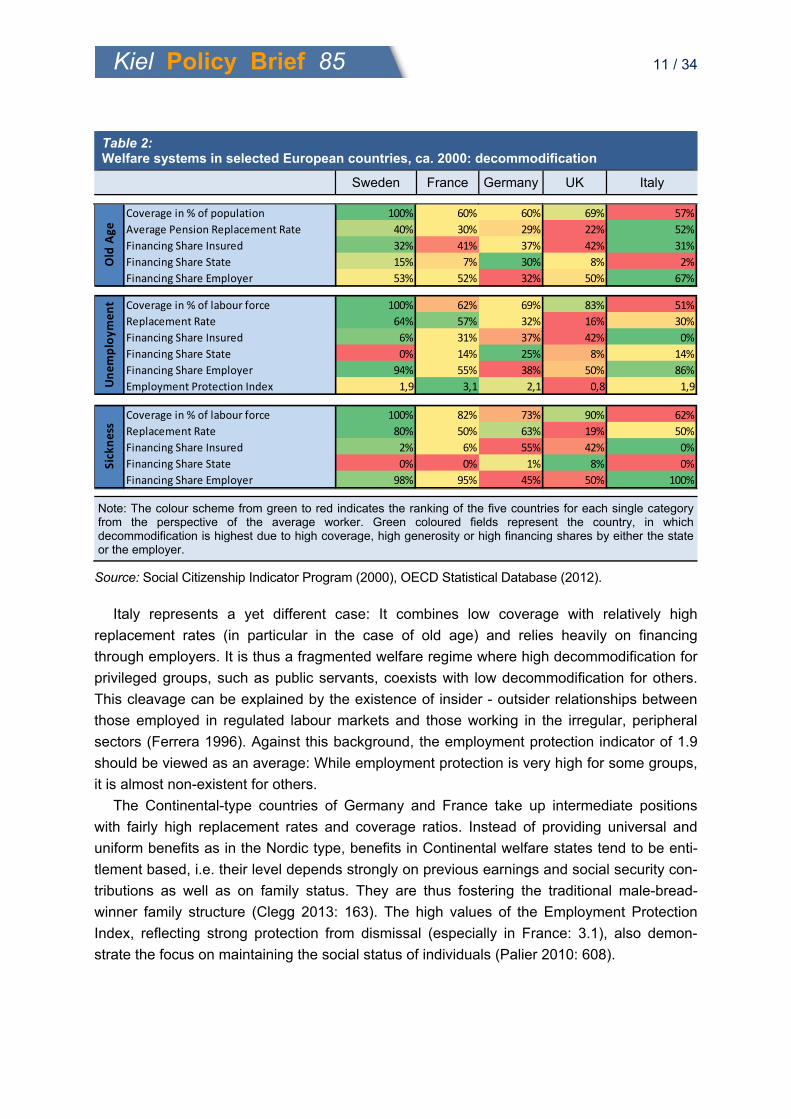
Table 2 shows the latest available data from the Social Citizenship Indicator Programme that
measures decommodification by how well the average worker is taken care of in case of old
age, unemployment, or sickness. For each situation, Table 2 indicates the coverage (i.e. the
share of the work force eligible to receive benefits), the replacement rate (i.e. benefits rela-
tive to previous income), and how benefits are funded by the insured individuals themselves,
the state, and the employer. For unemployment, we add the OECD Employment Protection
Index that measures the “costs and inconveniences” for firms to dismiss employees (OECD
2013), giving us a measure of the extent to which workers are exposed to market forces and
the flexibility of labour markets.
The five countries differ widely. Decommodification is most pronounced in Sweden which
has coverage rates of 100 % for temporary unemployment, old age, and sickness, along with
relatively high replacement rates (as much as 80 % in the case of sickness). This reflects the
notion of social protection as a universal citizenship right (Hemerijck 2013: 155). Financing
rests mainly with employers, while the state and the individual contribute for old age provi-
sion only.
By contrast, decommodification is lowest in the UK: Despite rather high coverage, re-
placement rates are the lowest in the sample. Financing relies largely on contributions by the
individuals themselves. These figures are in line with the traditional Beveridgean or liberal
position according to which only minimum income provision is a social right. Furthermore, it
should be targeted to those in most dire need, while citizens are otherwise expected to self-
reliantly turn to the market for earning a sufficient income (Hemerijck 2013: 156). This
general trust in the welfare-maximizing qualities of free markets can also be seen by the low
employment protection indicator that signals a highly flexible labour market.
Kiel Policy Brief 85 11 / 34
Table 2: Welfare systems in selected European countries, ca. 2000: decommodification
Sweden France Germany UK Italy
Note: The colour scheme from green to red indicates the ranking of the five countries for each single category from the perspective of the average worker. Green coloured fields represent the country, in which decommodification is highest due to high coverage, high generosity or high financing shares by either the state or the employer.
Source: Social Citizenship Indicator Program (2000), OECD Statistical Database (2012).
Italy represents a yet different case: It combines low coverage with relatively high
replacement rates (in particular in the case of old age) and relies heavily on financing
through employers. It is thus a fragmented welfare regime where high decommodification for
privileged groups, such as public servants, coexists with low decommodification for others.
This cleavage can be explained by the existence of insider - outsider relationships between
those employed in regulated labour markets and those working in the irregular, peripheral
sectors (Ferrera 1996). Against this background, the employment protection indicator of 1.9
should be viewed as an average: While employment protection is very high for some groups,
it is almost non-existent for others.
The Continental-type countries of Germany and France take up intermediate positions
with fairly high replacement rates and coverage ratios. Instead of providing universal and
uniform benefits as in the Nordic type, benefits in Continental welfare states tend to be enti-
tlement based, i.e. their level depends strongly on previous earnings and social security con-
tributions as well as on family status. They are thus fostering the traditional male-bread-
winner family structure (Clegg 2013: 163). The high values of the Employment Protection
Index, reflecting strong protection from dismissal (especially in France: 3.1), also demon-
strate the focus on maintaining the social status of individuals (Palier 2010: 608).
Coverage in % of population 100% 60% 60% 69% 57%
Average Pension Replacement Rate 40% 30% 29% 22% 52%
Financing Share Insured 32% 41% 37% 42% 31%
Financing Share State 15% 7% 30% 8% 2%
Financing Share Employer 53% 52% 32% 50% 67%
Coverage in % of labour force 100% 62% 69% 83% 51%
Replacement Rate 64% 57% 32% 16% 30%
Financing Share Insured 6% 31% 37% 42% 0%
Financing Share State 0% 14% 25% 8% 14%
Financing Share Employer 94% 55% 38% 50% 86%
Employment Protection Index 1,9 3,1 2,1 0,8 1,9
Coverage in % of labour force 100% 82% 73% 90% 62%
Replacement Rate 80% 50% 63% 19% 50%
Financing Share Insured 2% 6% 55% 42% 0%
Financing Share State 0% 0% 1% 8% 0%
Financing Share Employer 98% 95% 45% 50% 100%
Old Age
Unemploym
ent
Sickness
Kiel Policy Brief 85 12 / 34
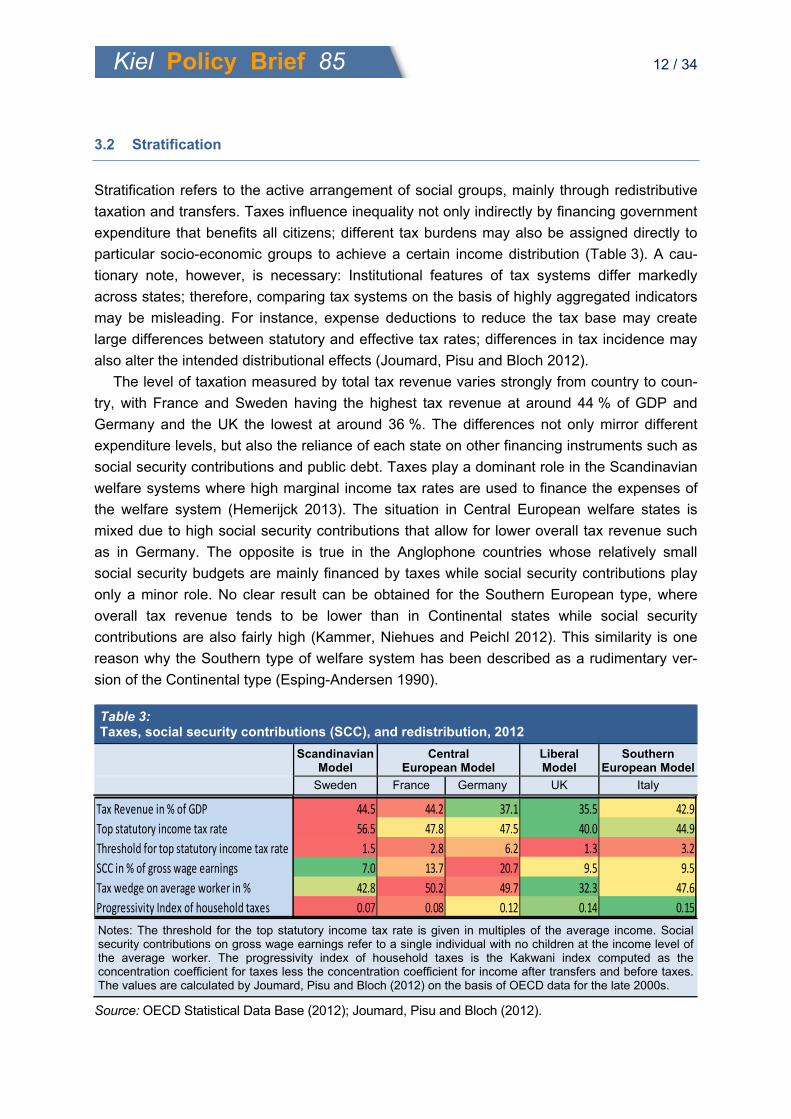
3.2 Stratification
Stratification refers to the active arrangement of social groups, mainly through redistributive
taxation and transfers. Taxes influence inequality not only indirectly by financing government
expenditure that benefits all citizens; different tax burdens may also be assigned directly to
particular socio-economic groups to achieve a certain income distribution (Table 3). A cau-
tionary note, however, is necessary: Institutional features of tax systems differ markedly
across states; therefore, comparing tax systems on the basis of highly aggregated indicators
may be misleading. For instance, expense deductions to reduce the tax base may create
large differences between statutory and effective tax rates; differences in tax incidence may
also alter the intended distributional effects (Joumard, Pisu and Bloch 2012).
The level of taxation measured by total tax revenue varies strongly from country to coun-
try, with France and Sweden having the highest tax revenue at around 44 % of GDP and
Germany and the UK the lowest at around 36 %. The differences not only mirror different
expenditure levels, but also the reliance of each state on other financing instruments such as
social security contributions and public debt. Taxes play a dominant role in the Scandinavian
welfare systems where high marginal income tax rates are used to finance the expenses of
the welfare system (Hemerijck 2013). The situation in Central European welfare states is
mixed due to high social security contributions that allow for lower overall tax revenue such
as in Germany. The opposite is true in the Anglophone countries whose relatively small
social security budgets are mainly financed by taxes while social security contributions play
only a minor role. No clear result can be obtained for the Southern European type, where
overall tax revenue tends to be lower than in Continental states while social security
contributions are also fairly high (Kammer, Niehues and Peichl 2012). This similarity is one
reason why the Southern type of welfare system has been described as a rudimentary ver-
sion of the Continental type (Esping-Andersen 1990). Table 3: Taxes, social security contributions (SCC), and redistribution, 2012
Scandinavian
Model Central
European Model Liberal Model
Southern European Model
Sweden France Germany UK Italy
Notes: The threshold for the top statutory income tax rate is given in multiples of the average income. Social security contributions on gross wage earnings refer to a single individual with no children at the income level of the average worker. The progressivity index of household taxes is the Kakwani index computed as the concentration coefficient for taxes less the concentration coefficient for income after transfers and before taxes. The values are calculated by Joumard, Pisu and Bloch (2012) on the basis of OECD data for the late 2000s.
Source: OECD Statistical Data Base (2012); Joumard, Pisu and Bloch (2012).
Tax Revenue in % of GDP 44.5 44.2 37.1 35.5 42.9
Top statutory income tax rate 56.5 47.8 47.5 40.0 44.9
Threshold for top statutory income tax rate 1.5 2.8 6.2 1.3 3.2
SCC in % of gross wage earnings 7.0 13.7 20.7 9.5 9.5
Tax wedge on average worker in % 42.8 50.2 49.7 32.3 47.6
Progressivity Index of household taxes 0.07 0.08 0.12 0.14 0.15
Kiel Policy Brief 85 13 / 34
Somewhat surprisingly, countries with high tax levels tend to have less progressive
household tax designs. For instance, Sweden and France have the highest total tax revenue
but the lowest degree of progressivity as measured by the Progressivity Index put forward by
Joumard, Pisu and Bloch (2012). Despite the large differences in total tax revenue, the over-
all redistributive effect of household taxes therefore differs little across countries.
While European welfare systems differ widely in terms of the decommodification achieved
(Section 3.1 above), tax policy is apparently not a distinguishing feature of national strategies
to limit income inequality. Rather, it reflects differences in social expenditures and in the extent
to which these are financed from social security contributions. However, while different financ-
ing mixes do not have a large impact on the reduction in income inequality, they do affect
labour markets by generating varying tax wedges. Due to high social security contributions, the
tax wedge is highest in the Continental and Southern European welfare systems, while Anglo-
phone countries have relatively low tax wedges. Scandinavian countries take an intermediate
position due to high marginal tax rates combined with low social security contributions.
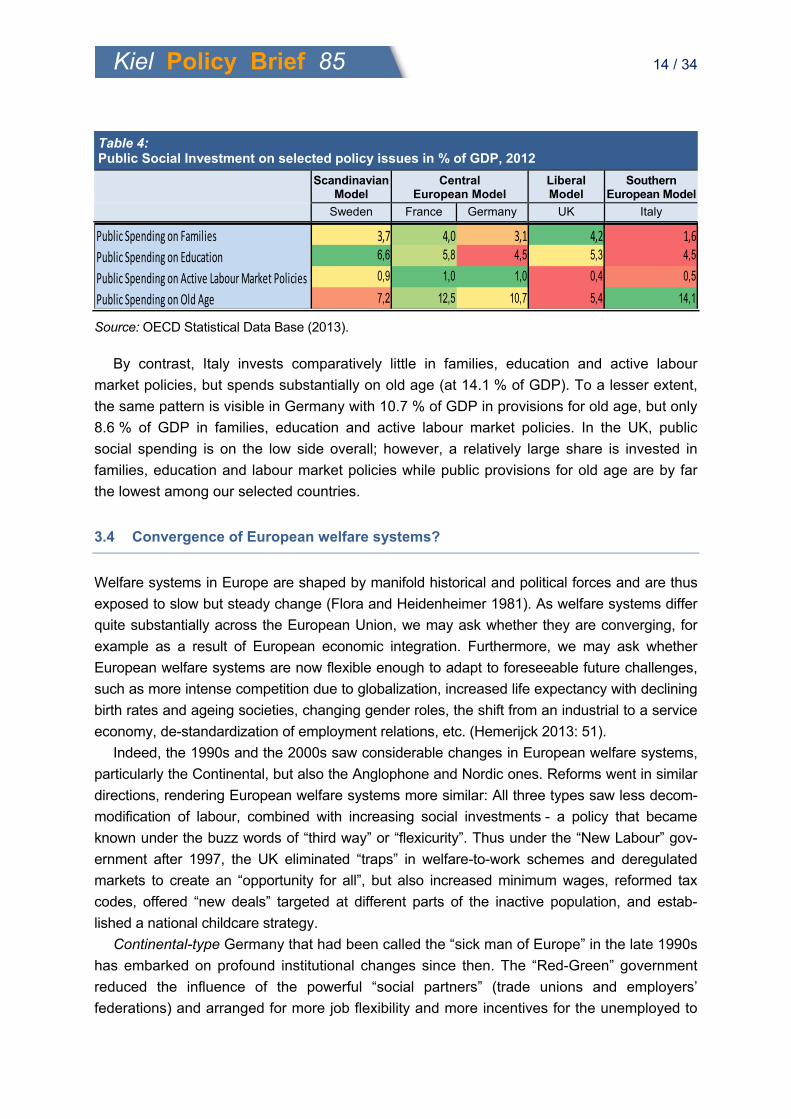
3.3 Social Investment Expenditure
Public social investment may be defined as expenditures that promote labour market partici-
pation and employment through human capital development. Rather than supplementing low
incomes with “decommodification“ cash benefits and replacing labour income during spells of
unemployment, social investment aims to empower as many individuals as possible to par-
ticipate productively in today’s highly specialised and knowledge-based economies (Morel,
Palier and Palme 2012). Typical areas for social investments are families, education, and
active labour market policies.
Accordingly, the new social investment paradigm that has become prominent since the
late 1990s views the welfare state and the economy as mutually re-enforcing factors, rather
than focussing on possible trade-offs between equality (to be achieved through income re-
distribution) and efficiency. Social investment is thought to equally promote social protection
and the productive potential of the population (Hemerijck 2013: 133).
OECD data in Table 4 show public spending on families, education, and active labour
market policies, plus on provisions for old age. Spending on old age is not part of social
investment because senior citizens are no longer part of the labour force. However, it is a
large category of social spending that may throw light on countries’ approaches to social
spending.
Sweden and France have most strongly embraced the social investment approach to the
welfare state, with aggregate expenditures on families, education and active labour market
policies of 11.2 % of GDP in Sweden and 10.8 % of GDP in France. France, moreover,
spends 12.5 % of GDP on old age provisions, whereas Sweden, with expenditure on old age
at 7.2 % of GDP, appears to pursue a more carefully targeted approach to its social spending.
Kiel Policy Brief 85 14 / 34
Table 4: Public Social Investment on selected policy issues in % of GDP, 2012
Scandinavian
Model Central
European Model Liberal Model
Southern European Model
Sweden France Germany UK Italy
Source: OECD Statistical Data Base (2013).
By contrast, Italy invests comparatively little in families, education and active labour
market policies, but spends substantially on old age (at 14.1 % of GDP). To a lesser extent,
the same pattern is visible in Germany with 10.7 % of GDP in provisions for old age, but only
8.6 % of GDP in families, education and active labour market policies. In the UK, public
social spending is on the low side overall; however, a relatively large share is invested in
families, education and labour market policies while public provisions for old age are by far
the lowest among our selected countries.
3.4 Convergence of European welfare systems?
Welfare systems in Europe are shaped by manifold historical and political forces and are thus
exposed to slow but steady change (Flora and Heidenheimer 1981). As welfare systems differ
quite substantially across the European Union, we may ask whether they are converging, for
example as a result of European economic integration. Furthermore, we may ask whether
European welfare systems are now flexible enough to adapt to foreseeable future challenges,
such as more intense competition due to globalization, increased life expectancy with declining
birth rates and ageing societies, changing gender roles, the shift from an industrial to a service
economy, de-standardization of employment relations, etc. (Hemerijck 2013: 51).
Indeed, the 1990s and the 2000s saw considerable changes in European welfare systems,
particularly the Continental, but also the Anglophone and Nordic ones. Reforms went in similar
directions, rendering European welfare systems more similar: All three types saw less decom-
modification of labour, combined with increasing social investments - a policy that became
known under the buzz words of “third way” or “flexicurity”. Thus under the “New Labour” gov-
ernment after 1997, the UK eliminated “traps” in welfare-to-work schemes and deregulated
markets to create an “opportunity for all”, but also increased minimum wages, reformed tax
codes, offered “new deals” targeted at different parts of the inactive population, and estab-
lished a national childcare strategy.
Continental-type Germany that had been called the “sick man of Europe” in the late 1990s
has embarked on profound institutional changes since then. The “Red-Green” government
reduced the influence of the powerful “social partners” (trade unions and employers’
federations) and arranged for more job flexibility and more incentives for the unemployed to
Public Spending on Families 3,7 4,0 3,1 4,2 1,6
Public Spending on Education 6,6 5,8 4,5 5,3 4,5
Public Spending on Active Labour Market Policies 0,9 1,0 1,0 0,4 0,5
Public Spending on Old Age 7,2 12,5 10,7 5,4 14,1
Kiel Policy Brief 85 15 / 34
accept low-paid employment, leading to a prolonged decline in real wages. Germany also
began reforms towards a more inclusive and activating welfare state and gradually cut back
on status maintenance and outdated family-related privileges (not without backlashes). To
some but quite limited degree, France pursued a similar policy.
Nordic-type Sweden more or less continued along the path it had already pursued.
Measures to activate individuals were strengthened from the mid-1990s, including more
active family support and a deliberate strategy for human capital formation. At the same time,
inactivity was made less attractive by cutting back on early retirement and generous sick pay
schemes.
Only Southern-type Italy seems to have missed the road to convergence: While lip service
was paid to the slogan “more to children, less to fathers” (Hemerijk 2013: 199), attempted
reforms, e.g. towards more “activating” family support, suffered serious setbacks in the
2000s. While the run-up to Italy’s entry into European Monetary Union put some productive
external pressure for reform on the Italian government, this pressure subsided once the Euro
was introduced.
While these national developments were mostly unrelated, there were also efforts by the EU
Commission, EU Council and European Parliament to harmonize welfare system regulations.
These would usually take place under the heading of competition policy, purportedly aiming to
eliminate unfair restrictions to trade in the Single Market. Institutionally, social policy initiatives
at the EU level find themselves in a “double bind” (Scharpf 1999, Hemerijck 2013): on the one
hand, to European institutions that are committed primarily to economic integration by the
relevant treaties; and on the other hand, to member states that are committed to their national
consensuses on social policies and therefore tend to resist all-European initiatives.
Nevertheless, in the early 1990s, a coalition of European trade unions, several national
governments, and the EU Commission began to work towards a social union that was meant to
complement economic union and comprise Europe-wide minimum social standards, labour
market regulations, and a pro-active European employment policy including fiscal transfers (for
surveys of this policy initiative see O’Connor 2005, Addison 2009, Stuchlík, Kellermann2009,
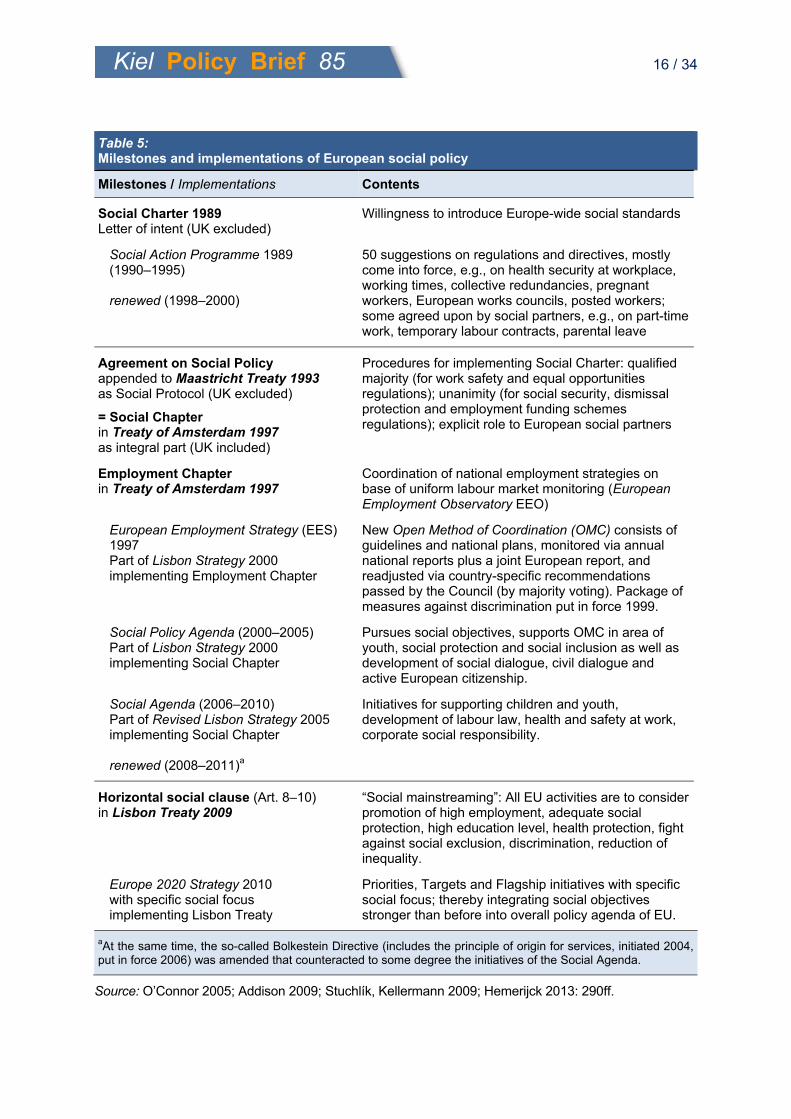
Hemerijck 2013: 290ff). The milestones of this initiative over the years (Table 5) range from the
1989 Social Charter, a letter of intent on Europe-wide social standards, most of which have
since been implemented, to the Horizontal Social Clause of the Lisbon Treaty which requires
the EU to consider explicitly the social and environmental impact of any action it takes.
Throughout the process of European integration, there has always been an underlying
notion that economic integration would also promote political and social integration. This idea
was most explicit and unchallenged during the early years of the then European Economic
Community. It also underpinned European Commission President Jacques Delors’ strategy
for the creation of the Single Market, even though, at the surface, the Single Market seemed
to shift the balance towards purely economic integration. More recently, the European
Commission’s Europe 2020 Strategy outlines policy visions inspired by social investment
policy thinking and represents a renewed commitment to a Social Europe (Hemerijk 2013:
324f).
Kiel Policy Brief 85 16 / 34
Table 5: Milestones and implementations of European social policy
Milestones / Implementations Contents
Social Charter 1989 Letter of intent (UK excluded)
Willingness to introduce Europe-wide social standards
Social Action Programme 1989 (1990–1995) renewed (1998–2000)
50 suggestions on regulations and directives, mostly come into force, e.g., on health security at workplace, working times, collective redundancies, pregnant workers, European works councils, posted workers; some agreed upon by social partners, e.g., on part-time work, temporary labour contracts, parental leave
Agreement on Social Policy appended to Maastricht Treaty 1993 as Social Protocol (UK excluded)
= Social Chapter in Treaty of Amsterdam 1997 as integral part (UK included)
Procedures for implementing Social Charter: qualified majority (for work safety and equal opportunities regulations); unanimity (for social security, dismissal protection and employment funding schemes regulations); explicit role to European social partners
Employment Chapter in Treaty of Amsterdam 1997
Coordination of national employment strategies on base of uniform labour market monitoring (European Employment Observatory EEO)
European Employment Strategy (EES) 1997 Part of Lisbon Strategy 2000 implementing Employment Chapter
New Open Method of Coordination (OMC) consists of guidelines and national plans, monitored via annual national reports plus a joint European report, and readjusted via country-specific recommendations passed by the Council (by majority voting). Package of measures against discrimination put in force 1999.
Social Policy Agenda (2000–2005) Part of Lisbon Strategy 2000 implementing Social Chapter
Pursues social objectives, supports OMC in area of youth, social protection and social inclusion as well as development of social dialogue, civil dialogue and active European citizenship.
Social Agenda (2006–2010) Part of Revised Lisbon Strategy 2005 implementing Social Chapter renewed (2008–2011)a
Initiatives for supporting children and youth, development of labour law, health and safety at work, corporate social responsibility.
Horizontal social clause (Art. 8–10) in Lisbon Treaty 2009
“Social mainstreaming”: All EU activities are to consider promotion of high employment, adequate social protection, high education level, health protection, fight against social exclusion, discrimination, reduction of inequality.
Europe 2020 Strategy 2010 with specific social focus implementing Lisbon Treaty
Priorities, Targets and Flagship initiatives with specific social focus; thereby integrating social objectives stronger than before into overall policy agenda of EU.
aAt the same time, the so-called Bolkestein Directive (includes the principle of origin for services, initiated 2004, put in force 2006) was amended that counteracted to some degree the initiatives of the Social Agenda.
Source: O’Connor 2005; Addison 2009; Stuchlík, Kellermann 2009; Hemerijck 2013: 290ff.
Kiel Policy Brief 85 17 / 34
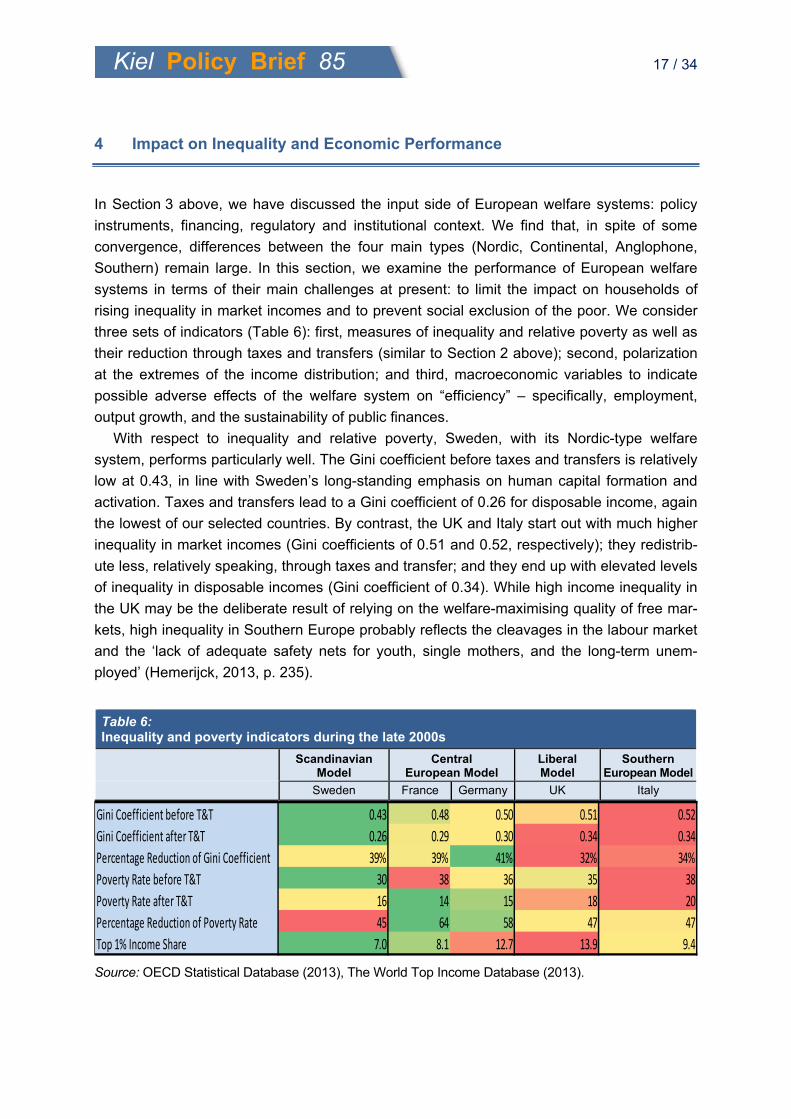
4 Impact on Inequality and Economic Performance
In Section 3 above, we have discussed the input side of European welfare systems: policy
instruments, financing, regulatory and institutional context. We find that, in spite of some
convergence, differences between the four main types (Nordic, Continental, Anglophone,
Southern) remain large. In this section, we examine the performance of European welfare
systems in terms of their main challenges at present: to limit the impact on households of
rising inequality in market incomes and to prevent social exclusion of the poor. We consider
three sets of indicators (Table 6): first, measures of inequality and relative poverty as well as
their reduction through taxes and transfers (similar to Section 2 above); second, polarization
at the extremes of the income distribution; and third, macroeconomic variables to indicate
possible adverse effects of the welfare system on “efficiency” – specifically, employment,
output growth, and the sustainability of public finances.
With respect to inequality and relative poverty, Sweden, with its Nordic-type welfare
system, performs particularly well. The Gini coefficient before taxes and transfers is relatively
low at 0.43, in line with Sweden’s long-standing emphasis on human capital formation and
activation. Taxes and transfers lead to a Gini coefficient of 0.26 for disposable income, again
the lowest of our selected countries. By contrast, the UK and Italy start out with much higher
inequality in market incomes (Gini coefficients of 0.51 and 0.52, respectively); they redistrib-
ute less, relatively speaking, through taxes and transfer; and they end up with elevated levels
of inequality in disposable incomes (Gini coefficient of 0.34). While high income inequality in
the UK may be the deliberate result of relying on the welfare-maximising quality of free mar-
kets, high inequality in Southern Europe probably reflects the cleavages in the labour market
and the ‘lack of adequate safety nets for youth, single mothers, and the long-term unem-
ployed’ (Hemerijck, 2013, p. 235).
Table 6: Inequality and poverty indicators during the late 2000s
Scandinavian
Model Central
European Model Liberal Model
Southern European Model
Sweden France Germany UK Italy
Source: OECD Statistical Database (2013), The World Top Income Database (2013).
Gini Coefficient before T&T 0.43 0.48 0.50 0.51 0.52
Gini Coefficient after T&T 0.26 0.29 0.30 0.34 0.34
Percentage Reduction of Gini Coefficient 39% 39% 41% 32% 34%
Poverty Rate before T&T 30 38 36 35 38
Poverty Rate after T&T 16 14 15 18 20
Percentage Reduction of Poverty Rate 45 64 58 47 47
Top 1% Income Share 7.0 8.1 12.7 13.9 9.4
Kiel Policy Brief 85 18 / 34
France and Germany with their Continental welfare systems stand on middle ground.
Market incomes before taxes and transfers are relatively unequal (Gini coefficients of 0.48
and 0.50, respectively); however, national welfare systems redistribute income on a large
scale, resulting in Gini coefficients (0.29 and 0.30, respectively) that are located between
Sweden, on the one hand, and Italy and the UK, on the other. The relative poverty rate (the
share of the population whose income is below 60 % of median income) is relatively low at
14 % in France and 15 % in Germany, compared to 16 % in Sweden, 18 % in the UK and as
much as 20 % in Italy. Since the median income may be viewed as indicative of the “normal”
standard of living in a society, the relative poverty rate is usually interpreted as the share of
the population that is “at risk” of poverty and social exclusion.
The final inequality indicator in Table 6 is the income share of the top one percent of
income earners. The Occupy movement has recently drawn attention to the high income
level and rapid income growth enjoyed by these very rich individuals in many countries,
including in Europe. Across Europe, the top one percent share closely reflects overall
inequality, ranging from 7 % in Sweden to 14 % in the UK but still lower than in the US at
17.4 % (2011; The World Top Income Database, 2013).
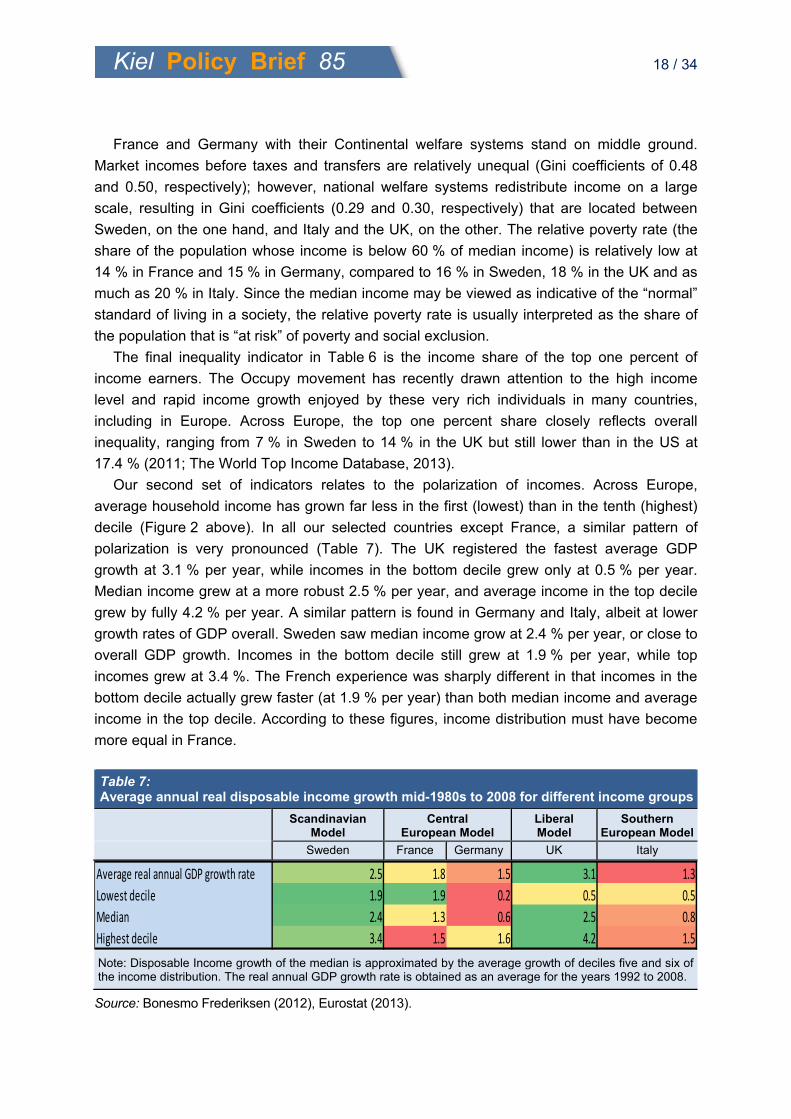
Our second set of indicators relates to the polarization of incomes. Across Europe,
average household income has grown far less in the first (lowest) than in the tenth (highest)
decile (Figure 2 above). In all our selected countries except France, a similar pattern of
polarization is very pronounced (Table 7). The UK registered the fastest average GDP
growth at 3.1 % per year, while incomes in the bottom decile grew only at 0.5 % per year.
Median income grew at a more robust 2.5 % per year, and average income in the top decile
grew by fully 4.2 % per year. A similar pattern is found in Germany and Italy, albeit at lower
growth rates of GDP overall. Sweden saw median income grow at 2.4 % per year, or close to
overall GDP growth. Incomes in the bottom decile still grew at 1.9 % per year, while top
incomes grew at 3.4 %. The French experience was sharply different in that incomes in the
bottom decile actually grew faster (at 1.9 % per year) than both median income and average
income in the top decile. According to these figures, income distribution must have become
more equal in France.
Table 7: Average annual real disposable income growth mid-1980s to 2008 for different income groups
Scandinavian
Model Central
European Model Liberal Model
Southern European Model
Sweden France Germany UK Italy
Note: Disposable Income growth of the median is approximated by the average growth of deciles five and six of the income distribution. The real annual GDP growth rate is obtained as an average for the years 1992 to 2008.
Source: Bonesmo Frederiksen (2012), Eurostat (2013).
Average real annual GDP growth rate 2.5 1.8 1.5 3.1 1.3
Lowest decile 1.9 1.9 0.2 0.5 0.5
Median 2.4 1.3 0.6 2.5 0.8
Highest decile 3.4 1.5 1.6 4.2 1.5
Kiel Policy Brief 85 19 / 34
To the extent that the different experiences of Sweden and France are due to differences
in their welfare systems, a comparison between the two countries demonstrates the value
judgements that underlie the design of welfare systems and economic policies more gener-
ally. Given that average income in the bottom decile grew at the same rate in Sweden and
France, is it preferable to have faster GDP growth, even if the rich become relatively richer -
which presumably makes them better off without making the bottom decile worse off in
strictly material terms (as in Sweden)? Or is it preferable to have less GDP growth (maybe as
a consequence of more redistribution through the welfare system), combined with more so-
cial cohesion due to lower income growth among the rich? In any case, Sweden was obvi-
ously able to combine relatively rapid GDP growth with a large welfare system. This obser-
vation suggests that it may be the design of the welfare state rather than the existence of
public welfare policies themselves that determines the impact on economic growth.
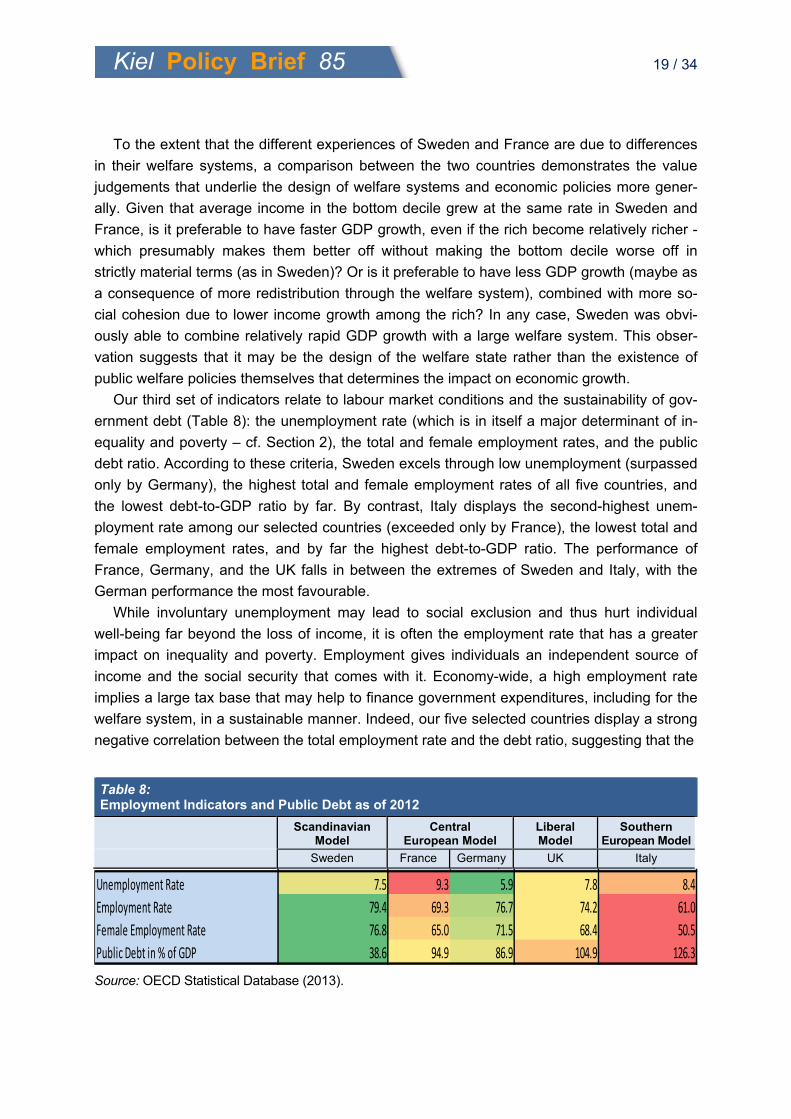
Our third set of indicators relate to labour market conditions and the sustainability of gov-
ernment debt (Table 8): the unemployment rate (which is in itself a major determinant of in-
equality and poverty – cf. Section 2), the total and female employment rates, and the public
debt ratio. According to these criteria, Sweden excels through low unemployment (surpassed
only by Germany), the highest total and female employment rates of all five countries, and
the lowest debt-to-GDP ratio by far. By contrast, Italy displays the second-highest unem-
ployment rate among our selected countries (exceeded only by France), the lowest total and
female employment rates, and by far the highest debt-to-GDP ratio. The performance of
France, Germany, and the UK falls in between the extremes of Sweden and Italy, with the
German performance the most favourable.
While involuntary unemployment may lead to social exclusion and thus hurt individual
well-being far beyond the loss of income, it is often the employment rate that has a greater
impact on inequality and poverty. Employment gives individuals an independent source of
income and the social security that comes with it. Economy-wide, a high employment rate
implies a large tax base that may help to finance government expenditures, including for the
welfare system, in a sustainable manner. Indeed, our five selected countries display a strong
negative correlation between the total employment rate and the debt ratio, suggesting that the
Table 8: Employment Indicators and Public Debt as of 2012
Scandinavian
Model Central
European Model Liberal Model
Southern European Model
Sweden France Germany UK Italy
Source: OECD Statistical Database (2013).
y y
Unemployment Rate 7.5 9.3 5.9 7.8 8.4
Employment Rate 79.4 69.3 76.7 74.2 61.0
Female Employment Rate 76.8 65.0 71.5 68.4 50.5
Public Debt in % of GDP 38.6 94.9 86.9 104.9 126.3
Kiel Policy Brief 85 20 / 34
link between high employment and sound public finances may be important – notwithstand-
ing the fact that actual debt levels reflect many different factors, including shocks to govern-
ment revenue and expenditures.
Female employment is lower than male (and hence, total) employment in all five
countries, though by different margins. The high female employment rate in Sweden at 77 %
reflects the Nordic model’s quest to integrate as many citizens as possible in the labour
market by investing in their productive capacities. By contrast, female employment is very
low in Italy at 51 %, in line with the Southern model’s traditional focus on supporting the
male-breadwinner family structure. Furthermore, low labour force participation by women
may be a consequence of segmented labour markets that protect the interests of insiders
over outsiders (including women).
Overall, the limited evidence that we can present in this section suggests that the Nordic
welfare system model, with its emphasis on empowering individuals to seek employment,
rather than replacing income lost during spells of unemployment, is compatible with robust
economic growth and fiscal sustainability (complying with similar results by Sapir 2006).
Polarization between the rich and the poor has apparently increased, but remained within
reasonable limits. These lessons drawn from the Swedish experience are supported by other
Scandinavian countries. One important element in the Nordic model is support for families
that focusses on enabling both men and women to participate in the labour market, rather
than on providing income support for stay-at-home parents.
The Southern model exemplified by Italy appears to reached a dead end. Its fiscal sus-
tainability is now in question, GDP growth has been slow, and unemployment is rather high.
It seems plausible that the low employment rate, especially for women, reflects enforced
inactivity rather than individual preferences, given labour market structures that protect
insiders (often men) over outsiders (often women).
The UK with its emphasis on letting markets work and correcting outcomes only to the
minimum extent necessary has seen relatively high GDP growth combined with growing
polarization between the rich and the poor. Its public debt has recently increased sharply,
though mostly as a result of government measures to counter the impact of the financial cri-
sis. As long as polarization is compatible with the values and preferences of the UK elec-
torate, there may be no immediate pressure for major changes in the UK approach to the
welfare system
The performance of the two Continental European countries has been markedly different.
France, which undertook hardly any fundamental reforms to its welfare system during the last
two decades, has seen high unemployment and growing social exclusion in some immigrant
communities, but no increase (likely, even a decline) in income polarization between rich and
poor, and only modest economic growth. Public debates in France at this time suggest that
high and growing unemployment along with the need to contain the fiscal deficit and maintain
public confidence in the government debt may lead to a crunch that may clear the way to
major labour market and welfare reforms.
Kiel Policy Brief 85 21 / 34
By contrast, Germany’s labour market performance is now quite favourable in terms of the
unemployment rate and labour force participation, due to its major labour markets reforms in
the early 2000s and the resultant decline in real wages. However, GDP has grown only
slowly and incomes have become more polarized between the rich and the poor. With the
fiscal deficit under control and growing labour shortages at prevailing wages for some skill
groups, there may now be an opportunity to promote more rapid wage growth, including for
low-skilled workers, along with more social investment from public budgets.
5 Welfare Systems and Underlying Norms and Values
As we have shown in Sections 3 and 4 above, European countries vary widely in terms of
inequality in disposable income, the extent of redistribution, the degree of social exclusion,
the strategies employed (decommodification, stratification, social investment), and the mix of
instruments. Some of these differences (such as those between Sweden and the UK) may
reflect different underlying norms and values regarding economic freedom, equality among
citizens, and redistribution by the government. Other differences may persist because even a
failing welfare system (such as Italy) may be difficult to reform because reforms would be
resisted by special interests.
In this section, we explore available evidence on relevant norms and values in European
societies and relate it to the extent of redistribution and other features of national welfare
systems.
Since European countries are parliamentary democracies, we posit that differences in
voter preferences for redistribution across countries should be reflected by differences in the
extent of redistribution through national welfare systems (measured similar to Sections 2
and 3 by the relative difference in Gini coefficients before and after taxes and transfers).
Information on norms and values comes from surveys (Section 5.1) and from economic
experiments (Section 5.2).
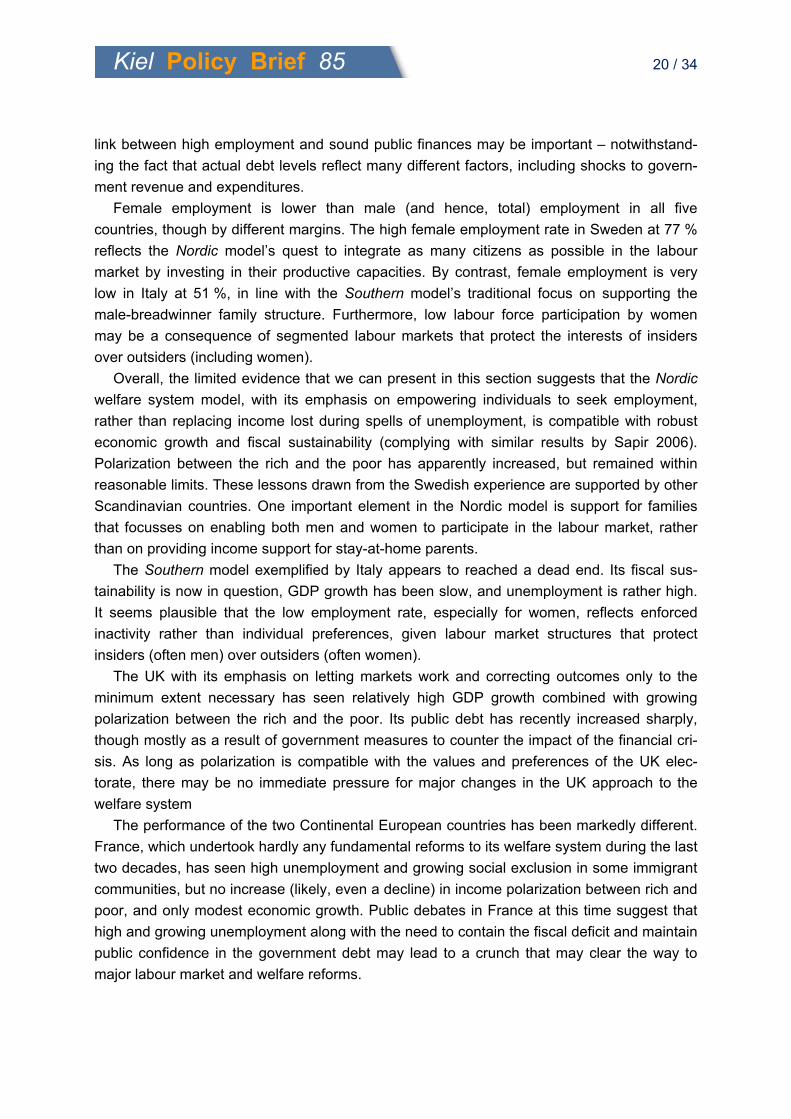
5.1 Survey Data on values regarding inequality and redistribution
Both the European Values Study Survey (EVS) which is part of the World Values survey and
the Euro Barometer include several related questions on attitudes towards income equality
and the government’s possible responsibility for redistributing income. Figure 5 summarizes
responses in our five selected countries to two questions that refer to redistribution without
suggesting any particular underlying motivation:
Euro Barometer for 2009: “The government should ensure that the wealth of the country is
redistributed in a fair way to all citizens” - The graph indicates the share of those who
“totally agree” or “tend to agree”.
Kiel Policy Brief 85 22 / 34
EVS for 2000/2001: In order to be considered just, what should a society provide?:
Eliminating big inequalities in income between citizens.’ – Possible answers range from 1
(very important) to 5 (not important).
Between 70 % and 90 % of respondents “agree totally” or “tend to agree” that the gov-
ernment is responsible for a fair distribution of “the wealth of the country”. Similarly, in all five
countries, respondents consider it rather important to eliminate income inequality (values
between 3 and 2 on a scale from 1-very important to 5). Thus there appears to be a strong
consensus that the government should redistribute income to ensure that inequality does not
go beyond an acceptable level. While differences between our five countries are small, it is
remarkable that support for redistribution is lowest in Sweden (which redistributes the most in
relative terms) and in the UK (which redistributes the least).
Figure 5: Inequality aversion and redistribution through the welfare system – survey results
0
10
20
30
40
50
60
70
80
90
100
30 32 34 36 38 40 42 44 46 48Level of Redistribution
The government should ensure that the wealth of the country is redistributed in a fair way to all citizens (totally agree/tend to agree) in %
1
1,5
2
2,5
3
3,5
4
4,5
5
30 32 34 36 38 40 42 44 46 48Level of Redistribution
Is it important to eliminate income inequalities? (1‐very important, 5‐not important)
Kiel Policy Brief 85 23 / 34
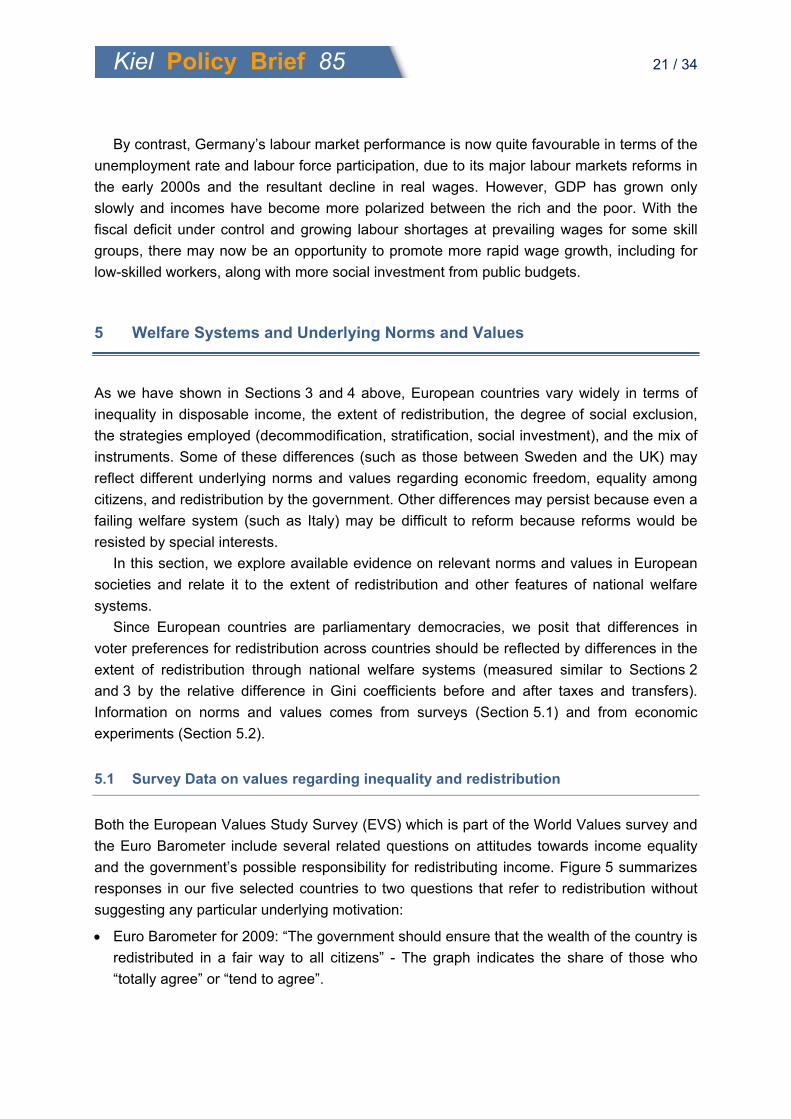
Figure 6 summarizes responses to two questions that ask respondents to consider the
disincentives and the loss of freedom that may result from redistribution:
EBRD Transition Report 2011 : How would you place your views on this scale: 1 means
that you agree completely with the statement on the left “Incomes should be made more
equal”; 10 means that you agree with the statement on the right “We need larger income
differences as incentives for individual effort”;
European Values Survey for 2008: “A: I find that both freedom and equality are important.
But if I were to choose one or the other, I would consider personal freedom more important,
that is, everyone can live in freedom and develop without hindrance B: Certainly both free-
dom and equality are important. But if I were to choose one or the other, I would consider
equality more important, that is, that nobody is underprivileged and that social class differ-
ences are not so strong” – The graph gives the share of those who prefer freedom.
Figure 6: Income redistribution, incentives, and loss of freedom – survey results
1,00
2,00
3,00
4,00
5,00
6,00
7,00
8,00
9,00
10,00
30 32 34 36 38 40 42 44 46 48Level of Redistribution
1 - We need larger Income differences for Individual effort;10 - Incomes should be made more equal
0
10
20
30
40
50
60
70
80
90
100
30 32 34 36 38 40 42 44 46 48Level of Redistribution
If I were to choose, I would consider personal freedom moreimportant than equality (in % that agree)
Kiel Policy Brief 85 24 / 34
Average responses to the first questions in our five countries range from 4 (Germany) to 6
(Italy), suggesting that by and large respondents are content with current levels of redistribu-
tion. Responses to the second question indicate that around 60 % of respondents emphasize
freedom over equality in Sweden, Germany, and the UK, vs. about 40 % in France and Italy.
Thus, broadly speaking, both values are held in similar esteem. At the same time, again,
support for redistribution is lowest in countries with the least as well as the most redistributive
welfare system (similar to Figure 5).
5.2 Experimental Data on values regarding inequality and redistribution
Surveys (as in Section 5.1 above) are a useful instrument to obtain information on individual
preferences on a wide range of subjects at limited cost. However, the quality of responses in
surveys depends on many factors that investigators find difficult to control, such as the framing
of questions and how they are understood in a particular cultural context, the translation of the
questionnaire, interviewers’ ability to establish a rapport with respondents, respondents’ will-
ingness to spend time answering the questionnaire, etc.
During the last couple of decades, economic experiments, especially “games” played in a
laboratory context, have become popular as an alternative methodology to investigate indi-
vidual preferences and behaviour under controlled conditions with incentivized real monetary
decisions. In the context of attitudes towards equality and redistribution, controlled experi-
ments allow investigators to observe whether those who stand to benefit in monetary terms
view redistribution differently from those who stand to lose.
In this section we use information on two types of experiments that have been conducted
in many different countries: the ‘Dictator Game’ and the ‘Ultimatum Game’. Both are typically
played in controlled computer laboratory environments, for real money, and with a compara-
ble student population. While these games may not cover all possible aspects of preferences
for redistribution, they have been used widely to test the behavioural economic theory of in-
equality aversion (Fehr and Schmidt 1999) and have been found to predict real-life behaviour
in a meaningful way.
In the Dictator Game, a participant has to split a given amount of money (usually around
$10) between himself and another anonymous participant that has to accept any offer. We
use the amounts sent as an indication of the first participant’s willingness to redistribute his
wealth in a situation where he is richer than the second participant. The data was taken from
27 dictator game studies3 conducted between 1999 and 2012. These studies vary in their
experimental setup, so the data is not completely comparable4.
3 A list of the used experimental studies is available on request 4 We take the average of several studies if possible but for France, only one Dictator game study that reports sending amounts was available.
Kiel Policy Brief 85 25 / 34
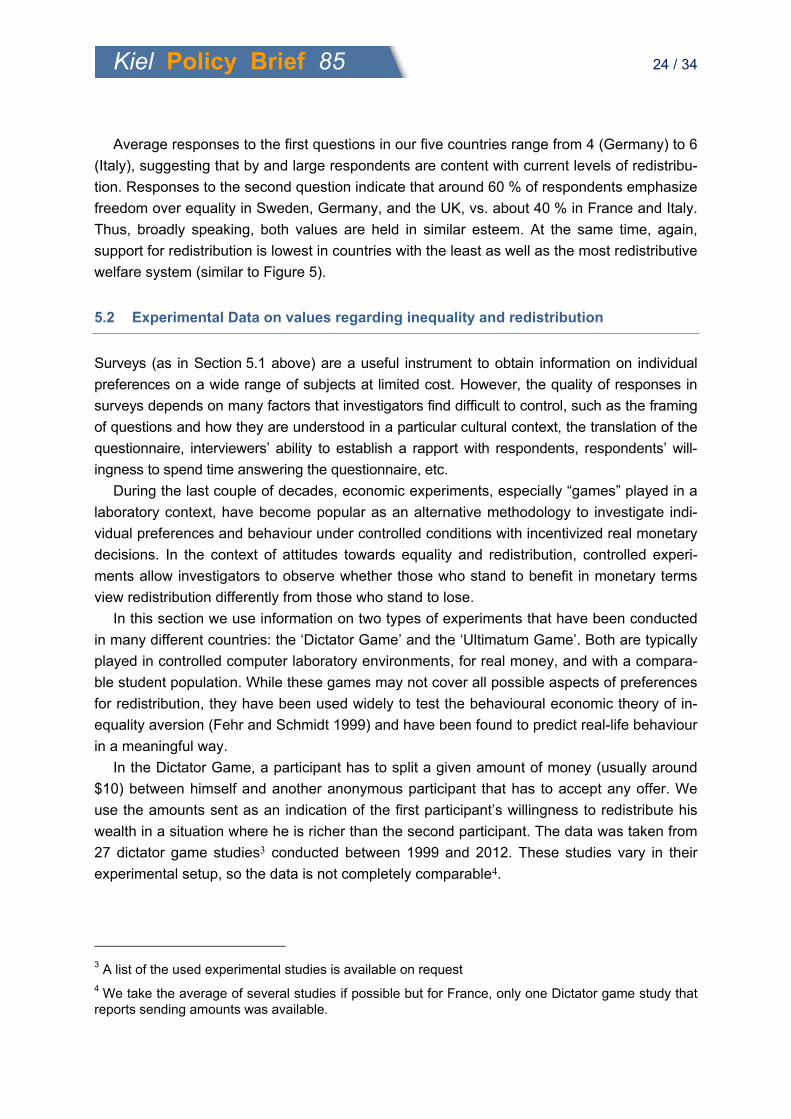
In Figure 7 we report the average amounts sent in percent of the original sum to be split.
A value of 0 % represents no money was sent at all, while 50 % means the sum was split
equally. With the exception of France (where 40 % was sent on average), the amounts sent
range from 10 % (UK) to 24 % (Germany).
The Ultimatum Game is a variant of the Dictator Game. Again the first participant splits up
a given amount of money between himself and another anonymous participant. This time the
second participant chooses to accept or reject the offer. If she accepts, the sum is split as
proposed by the first participant. If she rejects, both participants receive nothing. The rejec-
tion rate (i.e. the average amount of rejected offers) gives us a measure of what those who
start out without wealth consider adequate redistribution; it is equal to the profit that the second
Figure 7: Dictator and Ultimatum game – experimental results
0
5
10
15
20
25
30
35
40
45
50
30 32 34 36 38 40 42 44 46 48Level of Redistribution
Diktator Game sending amounts in % of total endowment
0
5
10
15
20
25
30
35
40
45
50
30 32 34 36 38 40 42 44 46 48Level of Redistribution
Average Ultimatum Game rejection rate in %
Kiel Policy Brief 85 26 / 34
participant gives up on average by punishing the first participant for sending too little. The
data was taken from a meta study by Engel (2011). Italy was not included in this meta study
so we use average rejection rates from three ultimatum game studies conducted in Italy5.In
the lower panel of Figure 7 we report the average rejection rate of offers. A rejection rate of
0 % means that all offers are accepted while a rejection rate of 50 % means that only a fair
split is accepted. Interestingly, “second” participants in the UK and Italy demanded larger
payments (at 24 % and 34 %) than “first” participants were willing to send voluntarily in
Dictator games (top panel; 10 % and 13 %, respectively). By contrast, “second” participants
in France and Germany were willing to accept less than “first” participants were willing to
send voluntarily in Dictator games. This comparison makes it clear that attitudes toward re-
distribution, whether reported in surveys or observed in experimental situations, need to be
interpreted with a view to whether the individual in question stands to benefit or lose from
redistribution.
To summarize, relating the size of national welfare states (measured by the extent of re-
distribution) to national attitudes towards income inequality and redistribution, we find
remarkably robust results over a range of indicators drawn from surveys as well as experi-
ments: Individuals in the UK and Sweden (i.e. the least and the most redistributive country in
our small sample) are usually the least inequality-averse. Individuals in France, Italy, and
Germany, with their intermediate volumes of redistribution, tend to be somewhat more in-
equality-averse. Different interpretations could accrue: Individuals in Sweden may sense a
certain fatigue with the extensive redistribution policies in their country and may wish to con-
tain it – or they may feel the equality realised in their country so evident and sufficient that
they may not regard (further) redistribution an issue. We have not been able to resolve this
puzzle – except to note that these differences across countries are small. Overall, we find
broad public support for redistribution in all five countries under study.
6 Challenges and Adjustment Requirements
6.1 Welfare system reactions on the financial and debt crisis
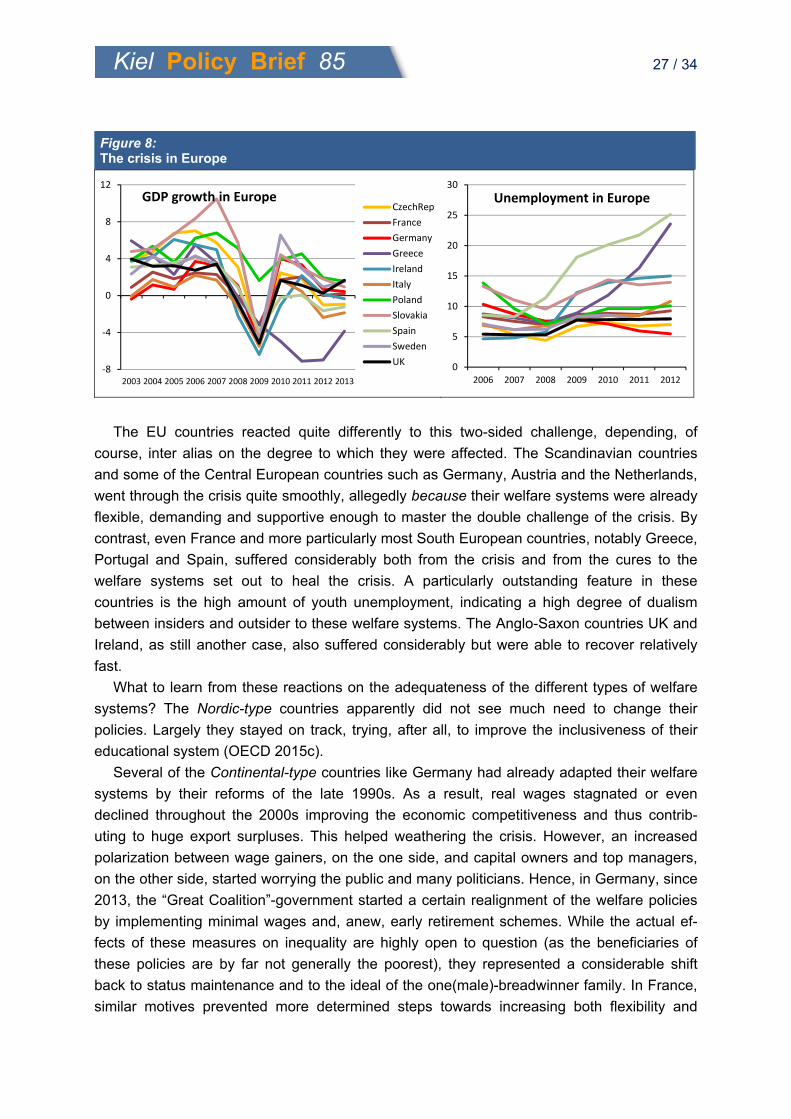
The 2008 financial crisis and its further mutation to the European debt crisis revealed the
sensitivity to contagion of economies in a globalised world and provided a major test case for
the appropriateness of welfare systems. The crisis considerably affected EU countries,
dramatically increasing unemployment in many of them and thereby challenging the social
welfare systems from two sides (Figure 8). On the one hand, the need for more support and
benefits from the welfare system increased, on the other hand, obligations to reduce
sovereign debts resulted in demands to cut back strongly on welfare expenditures.
5 A list of the used experimental studies is available on request
Kiel Policy Brief 85 27 / 34
Figure 8: The crisis in Europe
The EU countries reacted quite differently to this two-sided challenge, depending, of
course, inter alias on the degree to which they were affected. The Scandinavian countries
and some of the Central European countries such as Germany, Austria and the Netherlands,
went through the crisis quite smoothly, allegedly because their welfare systems were already
flexible, demanding and supportive enough to master the double challenge of the crisis. By
contrast, even France and more particularly most South European countries, notably Greece,
Portugal and Spain, suffered considerably both from the crisis and from the cures to the
welfare systems set out to heal the crisis. A particularly outstanding feature in these
countries is the high amount of youth unemployment, indicating a high degree of dualism
between insiders and outsider to these welfare systems. The Anglo-Saxon countries UK and
Ireland, as still another case, also suffered considerably but were able to recover relatively
fast.
What to learn from these reactions on the adequateness of the different types of welfare
systems? The Nordic-type countries apparently did not see much need to change their
policies. Largely they stayed on track, trying, after all, to improve the inclusiveness of their
educational system (OECD 2015c).
Several of the Continental-type countries like Germany had already adapted their welfare
systems by their reforms of the late 1990s. As a result, real wages stagnated or even
declined throughout the 2000s improving the economic competitiveness and thus contrib-
uting to huge export surpluses. This helped weathering the crisis. However, an increased
polarization between wage gainers, on the one side, and capital owners and top managers,
on the other side, started worrying the public and many politicians. Hence, in Germany, since
2013, the “Great Coalition”-government started a certain realignment of the welfare policies
by implementing minimal wages and, anew, early retirement schemes. While the actual ef-
fects of these measures on inequality are highly open to question (as the beneficiaries of
these policies are by far not generally the poorest), they represented a considerable shift
back to status maintenance and to the ideal of the one(male)-breadwinner family. In France,
similar motives prevented more determined steps towards increasing both flexibility and
‐8
‐4
0
4
8
12
2003 2004 2005 2006 2007 2008 2009 2010 2011 2012 2013
GDP growth in Europe CzechRep
France
Germany
Greece
Ireland
Italy
Poland
Slovakia
Spain
Sweden
UK 0
5
10
15
20
25
30
2006 2007 2008 2009 2010 2011 2012
Unemployment in Europe
Kiel Policy Brief 85 28 / 34
active support in the welfare system. This was demonstrated, e.g., by the considerable
resistance put forward in the public against rising retirement ages from 60 years to (still low)
62 years in 2010, which has subsequently been somewhat blurred again by the new socialist
government in 2013.
Many of the Southern-type countries remained reluctant as to real reforms. Being forced
to diminish sovereign debt, governments reduced or abolished already low unemployment
benefits, social assistance benefits, retirement benefits and pensions, state aid for health
care schemes, and funds for education, but they hardly fought determinedly enough against
fraud and corruption in their welfare systems, against cleavages between regulated and pe-
ripheral markets, tax exiles and free-riding. In Italy, however, in December 2014 the govern-
ment of Matteo Renzi adopted a “Jobs Act” foreseeing a more flexible employment protection
combined with more active labour market policies and measures to improve female labour
market participation (OECD 2015a). This means taking steps in similar directions as the Nor-
dic countries did long ago and the Continental countries did more recently.
The Anglophone-type countries largely maintained their low-scale safety net, though tak-
ing some action in extending education and active labour market policies, particularly for
young non-regular work force (OECD 2015b). The quick recovery of their economies was,
however, mainly organised by expansive monetary and fiscal policies. It seems that in fact in
these countries monetary policies are utilised to account for the lack of built-in social security
in the welfare system, since high unemployment rates are far less tolerated by the electorate
than in other countries.
6.2 Challenges ahead for European welfare systems
As shown in the above Sections, European countries vary considerably with regard to the
strategies and instruments implemented in their welfare systems and they also vary with
regard to the success of these strategies and instruments in containing inequality while at the
same time safeguarding economic efficiency. This is to be seen at the background of citizens
revealing a high preference for a sufficient degree of equality in all countries under study.
The above Section 6.1, however, pointed out that even in times of crisis – or should one say,
especially in times of crisis – governments seem to meet considerable difficulties while trying
to shape their welfare systems according to some sort of best practise.
Even worse, governments and the public frequently indulged in sham debates and sham
actions instead of developing effective ways of assisting the needy. Thus, for instance, in
Germany, minimum wages were propagated as a means of reducing current poverty as well
as future old-age poverty, disregarding the fact that the strongest poverty risks come from
underemployment, not from low hourly wages. This is not to say that minimum wages are
altogether meaningless: Whenever governments pay benefits to top-up below-subsistence
wages, a certain minimum wage may be required to prevent employers from setting wages
below the actual marginal productivity (e.g. for chambermaids, care assistants), or to avoid
subsidizing services without effective demand at market prices (e.g. cold call advertising
Kiel Policy Brief 85 29 / 34
centres). Yet, for reducing poverty in the work force, it is more effective to increase
employment opportunities, particularly regarding young people and females, and for reducing
old-age poverty, it is more effective to introduce minimum pension schemes.
Or, as another example for sham actions, retirement ages were reduced in some
countries to allow for the hardship of workers having laboured intensely for forty years or
more, disregarding the fact that to date only a minority of old employees still looks back at a
lifetime of hard-work labour and thus only a minority of them is as physically wrecked as this
was frequent some 50 years or more ago. It would thus be much more effective to
considerably improve pensions means-tested for such persons that are truly disabled, while
overall generating more flexible arrangements for gradual transitions from work to retirement.
Real challenges lie ahead to the welfare state systems and they deserve considerate
debates on how to solve them, and effective instead of sham solutions:
Inequality: Globalisation is usually suspected of at the same time raising inequality and
eroding the fundaments of welfare state systems (by a race to the bottom in social standards,
due to a credible exiting threat of mobile production factors). However, more recent studies
revealed both theoretically and empirically (Molana, Montagna 2006, Görg, Molana,
Montagna 2009, Chen et al. 2014 and the literature mentioned there) that free-trade integra-
tion and welfare policy improvements may be mutually reinforcing one another. In a world of
increasing returns to scale in production and of monopolistic competition, the actual produc-
tion may always tend to be too low as compared to consumer utility, and thus inefficient. In
such situation, welfare expenditures may step in to close the gap in a virtuous circle, raising
consumption and production, improving efficiency, and thereby even lowering tax rates for
mobile capital. These ideas provide a stark argument for drawing on welfare policies to
encounter the increase of inequality observed in recent decades. In line with the successful
Nordic model, welfare policies should particularly focus on better education for more social
mobility and on active labour market policy with more support for life-long learning and for
occupational changes. Special attention should be paid to the increasing gap between regu-
lar and non-regular work, requiring more inclusive welfare policies.
Demography: Ageing societies in Europe tend to deteriorate the ratio of the inactive to the
active population, and this problem is likely to continuously rise in the next decades to come.
Worries concern old-age poverty, on the one hand, and a high burden of social security con-
tributions to the young generation, on the other. Many measures taken so far are not effec-
tive in curing the underlying problem: Neither minimum wages (assumed to imply higher
pension contributions) nor motherhood premiums in pensions, let alone early retirement
schemes are apt to ban old-age poverty. Even supplementing public pay-as-you-go pension
provisions with private asset-backed pension insurances does not really help; since even
then actual payments to retirees have to be taken from what is actually produced by the
active population. The best way to deal with an ageing population is thus flexibly extending
retirement ages in line with extended life expectancies, activating families to offer parents
attractive conditions for both working and raising children, and welcoming and integrating
immigrants more open-mindedly to expand the active labour force.
Kiel Policy Brief 85 30 / 34
Family modernization and gender equality: Improving female labour market participation
and opening-up new chances and opportunities to women is a challenge in itself, and it also
helps to some degree managing demographic problems. So far, kindergarten-solutions and
various allowances for parents have been provided. Policies, however, need to become more
consistent; supporting measures are often highly fragmented on various small issues. The
policy objectives are sometimes contradictory, e.g., with some aiming at activating families
and others at fostering the traditional “mother-at-home” model, and the overall effect is often
unclear.
Healthcare systems: Healthcare tends to get ever more expensive both due to technologi-
cal progress and to the ageing of the population. Moreover, in most countries it is organised
in a private-public mixture that is in danger to bring about the worse of both organisation
forms: On the one hand, some (usually poor) people do not receive the treatments they
need, and on the other hand, other (often but not always the wealthy) people get treatments
that are unnecessary or even detrimental to them. Required would be a system offering the
right incentives both to patients and to the healthcare industry to economise as much as
possible, while also providing as much medical help as required, without making this contin-
gent on the patients’ ability to pay. Such optimal system is still to be developed.
Debt caps: In several countries, new debt caps to public budgets have been established
by law or are discussed to be introduced; subsequent to excessively high debts in the past,
these caps now often require zero new indebtedness for public budgets and thus put welfare
systems under considerable strain. Such measures arguably are justified in view of the bur-
den debts may impose on future generations. However, zero debt caps also severely impede
the scope for issuing new loans and bonds even to fund investment that is likely to increase
future growth. Debt caps thus disregard the benefits that may accrue to future generations
from well-positioned investments, be it infrastructure or social investments, for instance,
thinking of education.
7 Conclusions
Looking for innovative ways to limit inequality in societies, this paper examines the
experiences of different types of European welfare systems. These welfare systems are
challenged to limit inequality in disposable household income and living standards, contain
polarization between the rich and the poor at the margins of the income distribution, support
GDP growth, and remain fiscally sustainable. In Europe, different of these systems,
exemplified in this paper by the countries of Sweden, Germany, France, the UK and Italy, are
doing differently well.
The Central European countries France and Germany, for instance, do not perform
particularly well in these respects, though for different reasons. GDP growth has been
lacklustre in both countries. In France, polarization between the rich and the poor was
avoided, but high unemployment led to social exclusion and unrest. With both unemployment
Kiel Policy Brief 85 31 / 34
and its fiscal cost apparently set to rise further, reforms to increase flexibility in labour and
product markets to permit faster GDP growth may become inevitable in the near future. The
alternative would be for France to descend into a Southern-European-style situation like that
of Italy. In Italy, the sustainability of public finances is now in question, the employment rate
and hence the tax base are low, labour markets are segmented to protect insiders over
outsiders, and reforms face serious hurdles because of special interests and limited fiscal
space.
In Germany, labour market indicators (unemployment as well as total and female
employment) are favourable, reflecting labour market reforms during the early 2000s that
increased flexibility and pushed many unemployed to accept low-paid work. Partly as a
result, polarization between the rich and the poor during the last two decades was profound.
The example of Nordic-type Sweden, however, suggests that a focus on social investment,
including on extended child-care to facilitate more female employment, may provide a way
forward that limits polarization and lays the foundation for sustained GDP growth by utilizing
all available human resources.
Looking at the European experience, we find little evidence of the trade-off that was
traditionally thought to exist between efficiency (measured, say, by GDP growth) and equality
(measured by the extent of redistribution). Of the countries that we considered in some
detail, GDP growth in Sweden during the last two decades was almost as high as in the UK
although Sweden redistributes income on a much larger scale. Our analysis suggests that
the Nordic welfare state model, with its emphasis on social investment, activation, and
human capital formation, has rendered the traditional notion of an inevitable trade-off
between efficiency and equality irrelevant. In effect, these welfare systems allow societies to
enjoy the efficiency gains due to fully functional markets and the creative destruction inherent
in capitalism (Schumpeter).
We have also sought to relate the size of national welfare states (measured by the extent
of redistribution) to national attitudes towards income equality and redistribution. It is
remarkable that on a range of indicators drawn from surveys as well as experiments,
individuals in the UK and Sweden (i.e. the least and the most redistributive country in our
small sample) are usually the least inequality-averse. Individuals in France, Italy, and
Germany, with their intermediate volumes of redistribution, tend to be somewhat more
inequality-averse. We have not been able to resolve this puzzle – except to note that these
differences across countries are remarkably robust to the choice of indicators, but still small
overall when compared to the broad public support for redistribution in all five countries.
Kiel Policy Brief 85 32 / 34
References
Addison, J.T. (2009). In the Beginning, There Was Social Policy: Developments in Social Policy in the European Union from 1972 through 2008. Professional Reports 01_09, The Rimini Centre for Economic Analysis.
Addison, J.T., and W.S. Siebert (1997). The course of European-level labour market regulation. In: J.T. Addison and W.S. Siebert (eds.), Labour markets in Europe: issues of harmonization and regulation. London: Dryden Press: 9–61.
Andreß, H.-J., T. Heien (2001). Four Worlds of Welfare State Attitude? A Comparison of Germany, Norway and the United States. European Sociological Review 17(4): 337–356.
Bonesmo Fredriksen, K. (2012). Income Inequality in the European Union, OECD Economics Department Working Papers 952.
Chen, Y., H. Görg, D. Görlich, H. Molana, C. Montagna and Y. Temouri (2014). Globalisation and the Future of the Welfare State. Kiel Policy Brief 76. Kiel Institute for the World Economy.
Clegg, D. (2013). Central European Welfare States. In: Greve, B. (ed.), The Routledge International Handbook of the Welfare State. London: Routledge: 161–170.
Dadush, U., and K. Dervis (2013). The Inequality Challenge. Current History 112: 13–20.
Eichhorst, W., S. Devisscher, T. Leoni, P. Marx, U. Mühlberger, B. Schulte, B. Vandeweghe (2010). Analysis of the Social Agendas. Based on a study conducted for the European Parliament. IZA Research Report 24.
Esping-Andersen, G. (1990). The three worlds of capitalism. Princeton University Press.
Fehr, E., and K.M. Schmidt (1999). Theory of Fairness, Competition, and Cooperation. The Quarterly Journal of Economics 114: 817–868.
Ferrera, M. (1996). The Southern Model of Welfare in Social Europe. Journal of European Social Policy 6(1): 17–37.
Ferrera, M. (2005). The Boundaries of Welfare: European Integration and the New Spatial Politics of Social Protection. Oxford: Oxford University Press.
Flora, P., and A.J. Heidenheimer (eds.) (1981). The Development of Welfare States in Europe and America. New Brunswick: Transaction.
Görg, H., H. Molana and C. Montagna (2009), Foreign direct investment, tax competition and social expenditure. International Review of Economics and Finance 18: 31–37.
Goos, M., A. Manning and A. Salomons (2009). The Polarization of the European Labor Market. American Economic Review Papers and Proceedings 99(2): 58–63.
Hemerijck, A. (2013). Changing Welfare States. Oxford University Press.
Heien, T., and D. Hofäcker (1999). How do welfare regimes influence attitudes? A comparison of five European countries and the United States 1985–1996. WME (Wohlfahrtsstaatliche Maßnahmen und Einstellungen der Bürger) Working Paper 9. Universität Bielefeld.
Hofäcker, D., S. Buchholz, K. Kolb, H.-P. Blossfeld (2011). The Flexibilization of European Labour Markets and the Development of Social Inequalities: Comparing Evidence from Nine Globalized Countries. In: H.-P. Blossfeld, S. Buchholz, D. Hofäcker, K. Kolb (eds.), Globalized Labour Markets and Social Inequality in Europe. Basingstoke: Palgrave Macmillan.
Iversen, T., and A. Wren (1998). Equality, Employment and Budgetary Restraint: The Trilemma of the Service Economy, World Politics 50: 507–546.
Joumard, I., M. Pisu and D. Bloch (2012). Tackling income inequality: The role of taxes and transfers, OECD Journal: Economic Studies 2012(1): 37–70.
Kiel Policy Brief 85 33 / 34
Kammer, A., J. Niehues and A. Peichl (2012). Welfare regimes and welfare state outcomes in Europe. Journal of European Social Policy 22(5): 455–471.
Kangas, O, and J. Kvist (2013). Nordic welfare states. In: Greve, B. (ed.), The Routledge Handbook of the Welfare State. London: Routledge: 148–160.
Molana, H., and C. Montagna (2006). Aggregate scale economies, market integration, and optimal welfare state policy. Journal of International Economics 69: 321–340.
Morel, N., B. Palier and J. Palme (2012). Towards a Social Investment Welfare State? Ideas, Policies, Challenges. Bristol: Policy.
O’Connor, J.S. (2005). Policy coordination, social indicators and the social-policy agenda in the European Union. Journal of European Social Policy 15(4): 345–361.
Obinger, H., and U. Wagschal (1998). Drei Welten des Wohlfahrtsstaates? Das Stratifizierungs-konzept in der clusteranalytischen Überprüfung. In: S. Lessenich, I. Ostner (eds). Welten des Wohlfahrtskapitalismus. Der Sozialstaat in vergleichender Perspektive. Frankfurt: Campus.
OECD (2012a). Economic Survey Sweden 2012. Paris: OECD.
OECD (2012b). Income inequality and growth: The role of taxes and transfers, OECD Economics Department Policy Notes, No. 9.
OECD (2013). Economic Survey France 2013. Paris: OECD.
OECD (2014). Economic Survey Germany 2014. Paris: OECD.
OECD (2015a). Economic Survey Italy 2015. Paris: OECD.
OECD (2015b). Economic Survey UK 2015. Paris: OECD.
OECD (2015c). Going for Growth 2015. Paris: OECD.
Palier, B. (ed.) (2010). A Long Goodbye to Bismarck? The Politcs of Welfare Reforms in Continental Europe. Amsterdam: Amsterdam University Press.
Sapir, A. (2006). Globalization and the Reform of the European Social Models. Journal of Common Market Studies 44(2): 369–390.
Scharpf, F. (1999). Governing in Europe: Effective and Legitimate? Oxford: Oxford University Press.
Stuchlík, A., and C. Kellermann (2009). Europe on the Way to a Social Union? The EU Social Agenda in the Context of European Welfarism. Friedrich-Ebert-Stiftung, International Policy Analysis.
Titmuss, R. (1958). Essays on the Welfare State. London: Allen and Unwin.
Kiel Policy Brief 85 34 / 34
Imprint
Publisher: Kiel Institute for the World Economy
Kiellinie 66
D–24105 Kiel
Phone +49 (431) 8814–1
Fax +49 (431) 8814–500
Editorial team: Margitta Führmann
Helga Huss
Prof. Dr. Henning Klodt (responsible for content, pursuant to § 6 MDStV)
Dieter Stribny
The Kiel Institute for the World Economy is a foundation under public law of the State of
Schleswig-Holstein, having legal capacity.
Value Added Tax Identification Number: DE 251899169
Authorised Representative: Prof. Dennis Snower, Ph.D. (President)
Responsible Supervisory Authority: Ministry of Social Affairs, Health, Science and
Equality of Land Schleswig-Holstein
© 2015 The Kiel Institute for the World Economy. All rights reserved.
http://www.ifw-kiel.de/wirtschaftspolitik/politikberatung/kiel-policy-brief