Embed Size (px)
Citation preview

T
HE JO
UR
NA
L O
F P
OR
TFO
LIO
MA
NA
GEM
EN
T
F
ALL 2017 V
OLU
ME 44, N
UM
BER
1
VOLUME 44, NUMBER 1 FALL 2017www.iijpm.com
The Voices of Influence | iijournals.com
Should You Tilt Your Equity Portfolio to Smaller Countries?GREGG S. FISHER, RONNIE SHAH, AND SHERIDAN TITMAN

THE JOURNAL OF PORTFOLIO MANAGEMENT FALL 2017
GREGG S. FISHER
is the head of Quantitative Research & Portfolio Strategy at Gerstein Fisher in New York, NY, and an adjunct professor of finance at the NYU Tandon School of [email protected]
RONNIE SHAH
is the head of U.S. Quantitative Strategy Research at Deutsche Bank in New York, NY, and an adjunct professor of finance at the University of Texas at Austin in Austin, [email protected]
SHERIDAN TITMAN
is the Walter W. McAllister Centennial Chair in Financial Services at the University of Texas at Austin in Austin, [email protected]
Should You Tilt Your Equity Portfolio to Smaller Countries?GREGG S. FISHER, RONNIE SHAH, AND SHERIDAN TITMAN
U.S. investors continue to shift investments into foreign markets. Indeed, over the past 10 years, U.S. equity mutual funds have
experienced $834 billion in net outf lows, compared to $643 billion of net inf lows into international funds.1 These f lows have increased the share of equity mutual fund assets that invest in international markets from 23% to 27%, and the average asset allocation fund currently invests 30% of all equity assets internationally.2 The proliferation of long-only equity strategies that invests in multiple countries necessitates a country allocation policy that takes into account the trade-offs of investing in different financial markets.
Traditional portfolio theories, such as the capital asset pricing model (CAPM), suggest that the value-weighted combi-nation of the country portfolios provides an eff icient allocation. However, a variety of frictions associated with international investing can lead to substantial deviations from value weighting. Indeed, a number of authors, starting with Keppler and Traub [1993], have argued that returns in smaller countries are higher than returns in larger countries, so tilting toward smaller-country stocks may increase returns as well as pro-vide diversification benefits. Other authors have observed a momentum effect in country indices, suggesting that one might not want to hold country weights constant.
In this article, we reexamine what we refer to as the small-country effect, or the ten-dency for stocks in smaller financial markets to outperform stocks in larger f inancial markets. To what extent is this driven by the inclusion of Japan, the largest foreign market, which also had terrible returns in the 1990s? To what extent is it driven by the fact that the average market capitaliza-tion of stocks in smaller countries tends to be smaller? Perhaps the small-country effect is simply a manifestation of the small-firm effect. Finally, we consider the relationship between the country momentum effect and the small-country effect.
We also consider a potential explana-tion for the small-country effect. Intuitively, if investors are risk averse and subject to home bias, the expected rates of stock returns should be higher in smaller countries because investors in these countries, who have fewer diversification opportunities, require higher rates of return. Small-country stocks may also attract fewer foreign investors because the small countries receive less attention from sell-side analysts and they tend to be less regulated and hence provide lower investor protection. The smaller markets are also potentially more vulnerable to the risks asso-ciated with the fickle nature of global port-folio f lows. Each of these effects is likely to be less important in developed markets that are more open to foreign investors, and the larger
JPM-Fisher.indd 127 04/10/17 2:17 pm

SHOULD YOU TILT YOUR EQUITY PORTFOLIO TO SMALLER COUNTRIES? FALL 2017
stocks in the smaller markets with access to international investors are likely to be less affected. Hence, the small-country effect should be strongest for the smaller stocks in the emerging markets, and increased globalization of f inancial markets should weaken the country size premium over time.
To address these issues, we analyze individual stock returns and measure the extent to which the size of the market in which the firm is domiciled inf luences returns after controlling for firm size. We find that there is a small-country effect and that it is not a manifestation of the small-firm effect. These results are inf luenced by the presence of Japan, a large country with poor returns, but the results are still significant in a sample that does not include Japan. We also find that our results are not driven by other country-level factors such as momentum or the average book/market in the country.
Our findings provide mixed support for our con-jecture that the small-country effect is generated by home bias and market frictions that reduce the access of small-country stocks to international investors. We find that the small-country effect is less pronounced in the more recent period, which is consistent with the idea that impediments to international investing have been reduced over time. We also f ind that the small-country effect is stronger in emerging markets, which is consistent with international investors having limited access to these markets, as well as the fact that investors in these markets tend to be less able to invest internationally.
Our most puzzling result, however, is that the small-country effect is as strong for large-capitalization stocks as it is for small-capitalization and mid-capitalization stocks. However, at least part of this observation can be attributed to differences in analyst following, which may be a proxy for international investors’ interest in these stocks. Among large stocks, we find that stocks from smaller markets tend to have significantly lower analyst coverage when compared to stocks from larger markets. We do not find this relationship for small-cap and midcap stocks, as the coverage of these stocks is fairly minimal in the various markets we study.
In addition to the earlier cited papers that directly focus on the small-country effect, the issues raised in this article relate to the more general international investment literature. Keppler and Encinosa [2011] analyze 18 equity markets that are components of the MSCI World Index and show that a capitalization-weighted portfolio that invests
in the six smallest markets has a 12.79% annualized com-pound return, outperforming the capitalization-weighted portfolio that invests in all 18 markets by 5.02% over the period January 1970 to December 2009. Asness, Liew, and Stevens [1997] show that country-level size, momentum, and value (aggregate book/market) explain differences in country returns. Desrosiers, L’Her, and Plante [2004] analyze the performance of global investment strategies based on country indices from the 18 largest stock markets and find that country momentum explains differences in country returns, but aggregate book/market does not. Li and Pritamani [2015] find country size and momentum effects for various emerging and frontier markets. Angelidis and Tessaromatis [2016] explore how to best construct a multi country global portfolio using value, momentum, low volatility, and size country-level variables.
Our article contributes to this literature in a number of ways, in addition to providing an explana-tion for the country size effect. First, larger countries tend to have larger firms; our regression methodology allows us to test whether the firm size effect drives the country size effect, whereas the majority of the previous literature in this area reports portfolio return differ-ences for combinations of country indices. Second, we show that our results are not driven by Japan, which is the largest country but happens to have one of the poorest returns in our sample. Third, we find evidence of a significant country size effect in both developed and emerging markets and show that this relationship has weakened over time. Last, we control for other country-level quantitative factors such as momentum and book/market, and our results generally suggest that the country size premium is independent of these other sources of expected return.
Our article is also related to research on the ben-efits of international diversification. Asness, Israelov, and Liew [2011] suggest that investors benefit from inter-national diversif ication in the long run as economic growth drives variation in country returns. Braymen and Johnson [2015] show that a trade-adjusted weighting scheme can be used to improve risk-adjusted performance relative to a GDP-weighted portfolio. Goetzmann, Li, and Rouwenhorst [2005], Eun and Lee [2010], and Christoffersen et al. [2011] suggest that emerging markets may be less integrated than developed markets and thus provide greater diversification benefits when compared to portfolios that consist only of devel-oped market equities. Our article, in contrast, suggests
JPM-Fisher.indd 128 04/10/17 2:17 pm

THE JOURNAL OF PORTFOLIO MANAGEMENT FALL 2017
that forming more diverse portfolios by underweighting large countries and overweighting small countries not only improves diversif ication but also can increase expected returns.
The rest of the article is organized as follows. The first section explains the data sources used in this study and presents descriptive statistics of value-weighted port-folios of country indices. The second section provides country-level analysis on the country size premium. The third section discusses whether home bias explains the country size effect. The fourth section reviews evidence on analyst coverage and country size. The final section concludes.
DATA SOURCES AND SUMMARY STATISTICS
Our research examines stocks from markets that MSCI classif ies either as developed or emerging.3 Although the definitions are dynamic, we use the ini-tial country classification at the beginning of the sample period, January 1990, to ensure no forward-looking bias. Our analysis also excludes various emerging market countries. We exclude Argentinian stocks because of the transition from a f loating-rate currency (prior to 1992) to a fixed-rate currency (until 2001) and back to a f loating-rate currency. We exclude Chinese stocks, because government restrictions prevented foreigners from purchasing these stocks until recently, and Canadian stocks, because a high proportion of these stocks are also traded on U.S. exchanges. We also exclude stocks from Russia, the Czech Republic, Egypt, Qatar, United Arab Emirates, and Colombia, which lack sufficient data; and we exclude American Depositary Receipts (ADRs), global depository receipts (GDRs), and stocks that are headquartered in a different country from that of the stock exchange they are listed on.
Our final sample consists of 37 different interna-tional markets. For developed markets, our sample starts in January 1990. For emerging markets, our sample starts in January 1996 because of lack of stock return and for-eign exchange data in certain countries. Both samples end in December 2015. Stock returns, stock exchange country codes, country incorporation codes, and cur-rency codes for international stocks are taken from the Compustat Global Security Daily f ile. Informa-tion on foreign exchange rates comes from Bloomberg. For developed market countries, we obtain aggregate book/market from Ken French’s website.4 We obtain
the number of sell-side analysts reporting next-year earnings per share (EPS) estimates from Thomson Reuters I/B/E/S Database.
For many of our tests that follow, we sort stocks into group by firm size. Specifically, we use an aggregate market-capitalization breakpoint methodology, which is also applied by index providers such as MSCI and by other asset managers. Specifically, at the beginning of each year, we assign a capitalization score (Fk) based on the sum of those stocks’ market capitalization with the same or lower market capitalization divided by the total market capitalization of the eligible universe (either developed or emerging market stocks) multiplied by 100. A stock’s score captures the percentage of aggregate market capitalization of stocks that have lower or equal market-capitalization values. For example, a stock with a market capitalization of $2 billion would have a score of 75 if 75% of the total capitalization of the stock market consists of stocks with market capitalizations of less than $2 billion.
100 where1∑∑
= ×∑
∀ ≥where=FCapa
Capan j,, F≥kFF j
k
j
j i=
N
i
k jF FF ≥ (1)
Take, for example, three stocks—A, B, and C—that have capitalizations of $200 million, $300 million, and $500 million, respectively. The capitalization score for stock A is equal to 200/(200 + 300 + 500) × 100 = 20, and the score for stock B is equal to (200 + 300)/(200 + 300 + 500) × 100 = 50. The score of 50 for stock B indicates that 50% of the aggregate market capi-talization (including stock B) has the same or a lower market capitalization, while 50% of the market has a higher market capitalization.
Using each stock’s capitalization score, which is cal-culated annually at the end of December, we put stocks into three groups: large (Fk ≥ 30), mid (30 > Fk ≥ 15), and small (15 > Fk ≥ 1). We exclude the bottom 1% of stocks, which consist of microcap stocks that are likely to be illiquid and hard to trade. Although this is similar to the methodology that MSCI uses, we depart in one key way—instead of dividing stocks into groups by country or region breakpoints, we define the breakpoints across the entire universe of developed or emerging market stocks. Thus, even though Great Britain has larger firms, on average, its midcap stocks are similar in size to midcap stocks from other countries. In this way, our
JPM-Fisher.indd 129 04/10/17 2:17 pm

SHOULD YOU TILT YOUR EQUITY PORTFOLIO TO SMALLER COUNTRIES? FALL 2017
breakpoints are homogenous across the respective devel-oped and emerging universes.
Exhibit 1 displays index weights for multi-country portfolios that are weighted by end-of-year market capitalization. Each chart reports (1) the largest country’s weight, (2) the sum of the next four largest countries’ weights, and (3) the sum of the remaining
countries’ weights. The top chart shows weight distributions for developed markets; the bottom chart illustrates results for emerging markets. The fol-lowing 19 countries were classif ied as developed: Australia, Austria, Belgium, Denmark, Finland, France, Germany, Great Britain, Hong Kong, Ireland, Italy, Japan, Netherlands, New Zealand, Norway, Singapore,
E X H I B I T 1Country Weights for Developed and Emerging Market Multicountry Indices
Notes: For each chart, we report the largest country, next four largest countries, and remaining countries’ aggregate portfolio weight based on a capitalization-weighted index using end-of-year country aggregate market capitalizations. The developed markets sample begins in 1990; the emerging markets sample begins in 1996. Both samples end in 2015.
JPM-Fisher.indd 130 04/10/17 2:17 pm

THE JOURNAL OF PORTFOLIO MANAGEMENT FALL 2017
Spain, Sweden, and Switzerland; 18 markets were classi-fied as emerging: Brazil, Chile, Greece, Hungary, India, Indonesia, Israel, Malaysia, Mexico, Peru, Philippines, Poland, Portugal, South Africa, South Korea, Taiwan, Thailand, and Turkey.
Investing in foreign markets provides exposures to different economic (GDP growth, inf lation, unemploy-ment, and industrial production) trends, which can pro-vide diversification benefits to a portfolio that currently invests only in domestic assets. Exhibit 1 illustrates one of the major challenges associated with using a capi-talization-weighted passive index to gain international exposure; in most cases, only a few countries make up most of the index. For developed countries displayed in Panel A, Japan is the largest country, representing 67.2% of the developed sample at the end of 1989. Although Japan is still the largest country at the end of the period, its weight had dropped to 18.4% of developed markets at the end of 2015. The trend is for the larger countries to represent less of the portfolio over time. Despite this decline, the five largest countries (black plus shaded line regions) still represent 63% of the developed markets at the end of the sample period.
Panel B displays results for emerging markets and also shows a decline, with 68% of the index initially being represented by the following f ive markets (ranked descending by aggregate market capitaliza-tion): Thailand, Malaysia, South Africa, Taiwan, and South Korea at the end of 1995. The top five coun-tries—India, South Korea, Taiwan, Thailand, and South Africa—still represent 65% of the index at the end of 2015. Exhibit 1 suggests more generally that while cap-italization-weighted passive international indices invest in multiple countries, the actual economic exposure is concentrated in only a few large countries because those countries are much larger in terms of market size when compared to the other, smaller countries.
Exhibit A1 in the appendix provides country codes for developed and emerging market countries ranked on aggregate market capitalization used in this study. The country rankings in our article are different from rankings based simply on total country market capital-ization because of the exclusion of stocks that are incor-porated but trade on a different exchange (such as an ADR or GDR). These restrictions particularly reduce the aggregate market capitalization of countries such as Brazil that have historically had large corporations such as Petrobras and Vale that trade on larger international
stock exchanges. Despite these exclusions, our value-weight country index returns generally have very high correlations (>95%) with reported MSCI index returns.
Do large countries that make up more of a pas-sive index have lower average returns when compared to smaller countries? Exhibit 2 illustrates the growth of wealth by investing in a value-weighted portfolio consisting of stocks for the same groupings of countries (largest country, next four largest countries, and rest of the market) as Exhibit 1. Panel A reports results for developed markets and shows that a $1,000 investment in the largest country made on January 1, 1990, grows to only $1,015 by December 31, 2015. In contrast, investing in the next four largest countries (which often includes Great Britain, France, and Germany) yields $5,108, and investing in the remaining 14 countries generates $9,227 at the end of the sample period. Our results are consis-tent with previous studies.
Panel B of Exhibit 2 presents results for emerging markets and finds that $1,000 invested in January 1, 1996, declines to $92 for an investment in the largest country grows to $3,037 for the next four largest countries, and $4,961 for the remaining 13 countries. The extremely poor returns associated with an investment in the largest country for the emerging market sample requires some explanation. First, the starting point for the sample is just before the Asian financial crisis (1997), which adversely affected many of the larger countries in emerging markets, including Indonesia, Malaysia, Russia, South Korea, Taiwan, and Thailand.5 For example, Thailand which was the largest market in December 1995, declined 36% in 1996. As a result of that decline, Malaysia became the largest emerging market country in December 1996 and subsequently experienced a drop of 68% in 1997. In contrast, an investment in the 13 smallest markets increased 12% in 1996 and 2% in 1997.
DO SMALL-COUNTRY INDICES HAVE HIGHER AVERAGE RETURNS THAN LARGE-COUNTRY INDICES?
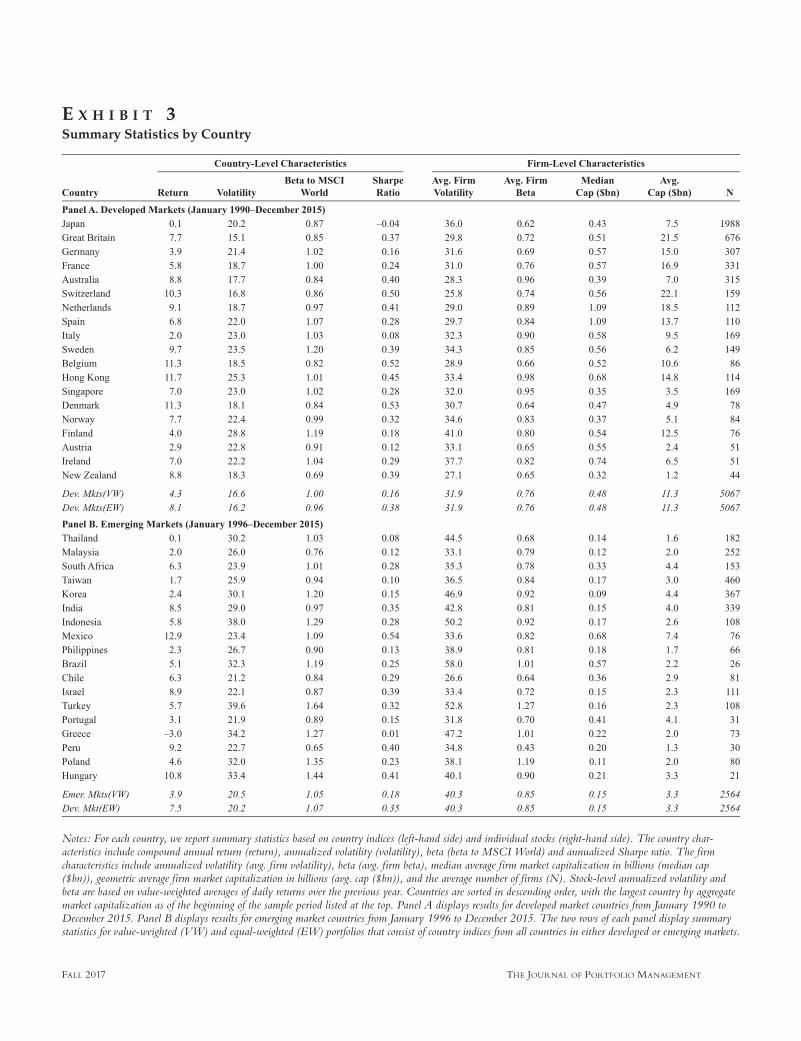
Exhibit 3 reports performance summary statistics for different countries in developed markets (Panel A) and emerging markets (Panel B). The left-hand side of the exhibit presents summary statistics on the country level, while the right-hand side shows results on the firm level. The countries are ranked by aggregate market cap-italization as of the start of the sample period. The five
JPM-Fisher.indd 131 04/10/17 2:17 pm

SHOULD YOU TILT YOUR EQUITY PORTFOLIO TO SMALLER COUNTRIES? FALL 2017
largest developed market countries have average annual returns of 5.2% per year, compared to 7.8% for the other 14 markets. The 14 smaller markets have an average annual volatility of 21.7%, which is slightly higher than the 18.6% for the largest five markets. The higher vola-tility for smaller countries is likely due to having fewer
firms listed on their markets, which reduces diversifica-tion. Despite the slightly higher volatility, the smallest markets have high risk-adjusted returns (average Sharpe ratio of 0.34), which is 50% higher than the performance for the largest five markets (average Sharpe ratio of 0.23). Smaller markets tend to have slightly higher betas of 0.97
E X H I B I T 2Growth in Wealth of $1,000 Invested in Different-Sized Financial Markets
Notes: For each chart, we report the growth in wealth associated with investing in a value-weighted portfolio consisting of the largest country, next four largest countries, and remaining countries using end-of-year country aggregate market capitalizations, rebalanced on January 1 of each year. The developed markets sample begins in January 1990; the emerging markets sample begins in January 1996. Both samples end in December 2015.
JPM-Fisher.indd 132 04/10/17 2:17 pm
THE JOURNAL OF PORTFOLIO MANAGEMENT FALL 2017
E X H I B I T 3Summary Statistics by Country
Notes: For each country, we report summary statistics based on country indices (left-hand side) and individual stocks (right-hand side). The country char-acteristics include compound annual return (return), annualized volatility (volatility), beta (beta to MSCI World) and annualized Sharpe ratio. The firm characteristics include annualized volatility (avg. firm volatility), beta (avg. firm beta), median average firm market capitalization in billions (median cap ($bn)), geometric average firm market capitalization in billions (avg. cap ($bn)), and the average number of firms (N). Stock-level annualized volatility and beta are based on value-weighted averages of daily returns over the previous year. Countries are sorted in descending order, with the largest country by aggregate market capitalization as of the beginning of the sample period listed at the top. Panel A displays results for developed market countries from January 1990 to December 2015. Panel B displays results for emerging market countries from January 1996 to December 2015. The two rows of each panel display summary statistics for value-weighted (VW) and equal-weighted (EW) portfolios that consist of country indices from all countries in either developed or emerging markets.
JPM-Fisher.indd 133 04/10/17 2:17 pm

SHOULD YOU TILT YOUR EQUITY PORTFOLIO TO SMALLER COUNTRIES? FALL 2017
(measured against the MSCI World Index), compared to an average of 0.92 for the five largest markets.6
The five largest developed markets have slightly lower average stock volatility (31.3%) than the smaller 14 markets (32.1%). We also find slightly higher stock-level betas for stocks from smaller markets (0.80 com-pared to 0.75 for the five largest markets). Larger markets tend to have larger f irms ($13.6 billion geometric-weighted average market capitalization) when com-pared to the 14 smaller markets (9.4 billion) and a much greater average number of firms ($732 average number of firms each year for the five largest markets compared to 104 firms for the remaining, smaller markets).7 There are, however, some exceptions, such as Finland, which is the fourth smallest developed country but has an average market capitalization of $12.5 billion due to Nokia, an information technology firm with a nearly $40 billion market capitalization as of the end of December 2015.
Panel B reports results for the emerging market sample and shows a similar picture as Panel A. The five largest markets have average annual returns of 2.4% per year, with volatility of 27.2% and a Sharpe ratio of 0.15. The smaller 13 markets have average annual returns of 6.2% per year, with 29.0% in volatility and an average Sharpe ratio of 0.29. We also find that in comparison to smaller emerging markets, larger emerging markets have slightly lower index betas, higher firm volatilities, higher stock-level betas, higher average firm size, and many more firms.
The last two rows of each panel present summary statistics for combinations of developed and emerging markets country indices. The second-to-last row reports value-weighted results that weight countries by market capitalization, just like a passive index. The last row reports equal-weighted results that weight countries equally (the country indices themselves, however, are value-weighted). As we show, the return associated with an equal-weighted portfolio of country indices (8.1%) is nearly twice as big as that of the value-weighted portfolio (4.3%), which has a much greater weight for larger countries. Interestingly, the volatility of the equal-weighted developed market portfolio (16.2%) is actually slightly lower than for the value-weighted portfolio (16.6%), because the benefits of diversifying across countries outweighs the slightly higher volatility and beta associated with smaller countries. The result of reducing the weight of large countries and reallocating weight to smaller countries results in a 140% increase
in risk-adjusted returns as measured by the Sharpe ratio. For emerging markets in Panel B, the equal-weight port-folio has average returns of 7.5% and volatility of 20.2% per year, resulting in a Sharpe ratio of 0.35. In contrast, the value-weighted portfolio yields returns of 3.9%, volatility of 20.5%, and a Sharpe ratio of only 0.18.
We start our analysis by examining Fama–MacBeth regressions of country index returns on different country-level factors. Exhibit 4 forms country indices by capital-ization-weighting stocks from a particular country. By examining country indices rather than individual stocks, the methodology in this section is more in line with past literature that originally identified the country effect. We perform this exercise including all stocks (“All Cap”) and also excluding the largest stocks (“Mid/Small”). Exhibit 4 is organized as follows. We first run univar-iate regressions of four different factors—natural log of country size, natural log of average firm size within a country, natural log of aggregate country book/market, and past 12-month country momentum. We then regress country index returns on all four factors and repeat this exercise for country indices formed from only mid- and small-capitalization firms.8
The univariate regressions show that country size Ln (Ctry) and average firm size Ln (Avg. Firm Size) are negatively related to average stock returns, while book/market Ln (Ctry B/M) and momentum Ctry MOM are positively related to average stock returns. Our variable of interest, country size, has a t-statistic that is close to or greater than 2 in each of the univariate regressions (reported as the first regression in each set of five regres-sions). Although average firm size is only significant for emerging markets, country momentum is only signifi-cant for developed markets, and country aggregate book/market is not significant for the developed market sample.
The last two regressions consider all four factors together in a multivariate setting. As we show, for all countries (“ALL”) and developed markets (“DM”), we find coefficients for country size of −0.14 to −0.16 with t-statistics ranging from 1.91 to 2.58, respectively. There is not much difference between using all stocks when forming country indices or using only mid- and small-cap stocks. In contrast, the coefficients for the average firm size and book/market are insignificant for the ALL and DM samples. For the ALL sample, the coefficient on momentum is significant, but only for the ALL country sample, which uses only mid-/small-cap stocks when forming country indices. In emerging markets, we find
JPM-Fisher.indd 134 04/10/17 2:17 pm

THE JOURNAL OF PORTFOLIO MANAGEMENT FALL 2017
that adding average firm size and country momentum causes country size to be an insignificant predictor of average returns. We find some evidence of average firm size predicting negative future returns after controlling for country momentum and country size, but only when large stocks are included; this variable also becomes much weaker when we only use mid/small-cap stocks when forming country indices. Multicollinearity is a bigger issue in emerging markets, because small coun-tries also tend to have had positive momentum and tend to have smaller average firm size.
DO STOCKS IN SMALL COUNTRIES HAVE HIGHER RETURNS THAN STOCKS IN LARGE COUNTRIES?
In this section we change focus slightly and examine the returns of individual stocks rather than those of
indices. The advantage of examining individual stocks is that we can explicitly separate the effect of country size and f irm size. In addition, we can examine the interaction between the small-country effect and firm size. Recall that we conjectured that because home bias affects small stocks more than large stocks, the small-country effect will be stronger for smaller cap stocks.
Exhibit 5 reports value-weighted monthly returns for stocks sorted on firm size (large, mid, and small) and country size (largest country, next four largest coun-tries, and remaining countries). As we show in Panel A, the largest country has very poor performance, ranging from 0.09%−0.25% for developed markets. In contrast, average performance for the next four largest countries and remaining countries is 0.70% and 0.90%, respec-tively. Panel B presents results for emerging markets and finds that average return for the next four largest coun-tries is 0.76%, while the average return for remaining
E X H I B I T 4Fama–MacBeth Regressions of Monthly Country Index Returns on Country Size, Aggregate Country Book/Market, and Past One-Year Momentum for Developed and Emerging Market Stocks
Notes: This exhibit reports the results of a set of Fama–MacBeth regressions of monthly country returns on country size, country average firm size, aggre-gate country book/market, and country-level momentum. EM/DM refers to whether the regressions use only emerging market stocks (EM) or developed market stocks (DM). Time period ref lects the starting and ending year for each regression. N is the average number of firms or countries in the sample each year. Ln (Ctry) is the natural log of the aggregate market capitalization of a country measured as of the end of December of the previous year. Ln (Firm) is the natural log of the geometric average firm size for stocks from a specific country measured as of the end of December of the previous year. Ln (B/MCctry) is the natural log of the ratio of aggregate book equity divided by aggregate market capitalization for stocks from a specific country measured as of the end of December of the previous year. Ctry MOM is the past one-year country value-weighted return. For the sake of brevity, the intercept is not reported. T-statistics are reported in parentheses to the right of each estimate and are based on Newey–West corrected standard errors with a lag of 12 months.
JPM-Fisher.indd 135 04/10/17 2:17 pm

SHOULD YOU TILT YOUR EQUITY PORTFOLIO TO SMALLER COUNTRIES? FALL 2017
countries is 0.92%. The returns for investing in the largest country in emerging markets is abysmal—ranging from −0.76% for small-cap stocks to −0.62% for large-cap stocks—compared to an average return of 0.57% for the next four largest countries and 0.69% for the remaining countries. Our results presented in Exhibit 5 suggest that the country size premium is largely inde-pendent of firm size.
A major difference between the analysis in this section relative to the analyses presented in Exhibit 4 is that by using index returns rather than individual stock returns, we are effectively weighting each country equally. Our main analysis is presented in Exhibit 6, which reports results from regressions of stock returns on the natural log of firm size, country size, and a dummy for emerging markets. Our methodology involves using individual stock returns, which enables us to control for firm size when examining whether country size explains stock returns. The first set of four regressions shows
that within all size groupings, the log of country size is a negative and significant predictor of future stock returns. We see a slightly stronger country size effect among large and midcap stocks; and contrary to the early U.S. evidence, we do not find evidence of a small-firm effect. Emerging markets (EM) also have under-performed developed markets during our sample period, leading to a negative relation between the EM Dummy and average stock returns.
The second set of regressions examines all stock markets but excludes Japan, which is the biggest market in our sample. Dropping Japan reduces the sample by roughly 25% across all size groups. While the Ln (Ctry) coefficient drops in each regression, we still find that country size is a significant negative predictor of future stock returns. For the nonlarge size groupings, we also find a significant positive coefficient on firm size. The third and fourth sets of regressions divide stocks by developed and emerging markets. As we show, the
E X H I B I T 5Value-Weighted Monthly Returns for Different-Sized Financial Markets by Firm Size Group
Notes: At the beginning of each year, stocks are sorted into three groups according to market capitalization: large (top 70% of aggregate capitalization), mid (70% to 85%), and small (85% to 99%). Within these three groups based on size, stocks are further divided into three groups: (1) largest country, (2) next four largest countries, and (3) remaining countries using end-of-year country aggregate market capitalizations, rebalanced on January 1 of each year. We form value-weighted portfolios comprising stocks in these various groups. The rankings of countries are dynamic and change each year. Panel A dis-plays developed market results starting in January 1990; Panel B reports emerging market results starting in January 1996. Both sample periods end in December 2015.
JPM-Fisher.indd 136 04/10/17 2:17 pm

THE JOURNAL OF PORTFOLIO MANAGEMENT FALL 2017
natural log of country size is negatively related to average stock returns in both tests, with slightly stronger results in emerging markets. The last two sets of regressions split the sample by time period. Note that in the ear-lier time period prior to 2003, there are far fewer small stocks compared to the sample after 2002. For the earlier sample period, regression coefficients are roughly two to three times as large as in the later sample period. Also, the t-statistics for the coefficient on Ln (Ctry) are not significantly different from zero for the regressions using the later time period between 2003 and 2015.
These results address a number of issues raised in the introduction. First, we show that the country size
effect is largely independent of the firm size effect and is a significant negative predictor of future returns among groups of firms with different sizes. Second, we find that our country size results persist even if we exclude the largest market, Japan. Third, this is not an emerging markets effect; we observe a country size effect in both emerging and developed countries.
Recall that our main explanation involved an interaction between home bias and market size. Our results thus far are mixed on whether this interpretation explains the country size effect. For example, the lack of capital market access for firms in small markets would suggest these stocks are riskier—consistent with the
E X H I B I T 6Fama–MacBeth Regressions of Monthly Stock Returns on Firm Size and Country Size for All, Developed, All Ex-Japan, and Emerging Markets
Notes: This exhibit reports the results of a set of Fama–MacBeth regressions of monthly stock returns on firm and country size. EM/DM refers to whether the regressions use only emerging market stocks (EM), developed market stocks (DM), both (ALL), or all stocks excluding Japan (All [ex-JP]). Time period ref lects the starting and ending years for each regression. N is the average number of firms in the sample each year. Ln (Firm) is the natural log of the market capitalization measured as of the end of December of the previous year. Ln (Ctry) is the natural log of the aggregate market capitalization of a country measured as of the end of December of the previous year. The intercept is not reported for the sake of brevity. T-statistics are reported in parentheses to the right of each estimate and are based on Newey–West corrected standard errors with a lag of 12 months.
JPM-Fisher.indd 137 04/10/17 2:17 pm

SHOULD YOU TILT YOUR EQUITY PORTFOLIO TO SMALLER COUNTRIES? FALL 2017
hypothesis that there is weak evidence that smaller coun-tries have higher volatilities and betas to the world index. Second, small stocks (relative to large stocks) should be more sensitive to the country size effect. We find that the country size effect exists among different-sized stock groups and in certain circumstances is stronger among large stocks, which is inconsistent with this explana-tion. Last, we should expect that over time, globalization forces and foreign f lows into smaller markets should improve capital market access for firms in small markets. As we show, our results supporting this premise are in fact stronger in the earlier part of the sample period.
DO SMALL COUNTRIES ATTRACT LESS ANALYST COVERAGE?
In this section, we directly examine whether smaller countries are more subject to home bias by looking at analyst coverage. Our conjecture is that there is a fixed cost associated with covering the stocks in a particular country, and because of those costs, investors and analysts may choose to ignore the smaller countries. If this is the case, then when we control for firm size and industry we should observe less coverage of stocks in smaller countries.
Exhibit 7 reports annual panel regressions of the natural log of one plus the number of analysts covering a stock on firm and country size. We calculate our mea-sure once a year on January 1, using the number of ana-lysts that report EPS estimates in December of the prior
year. We control for year and industry-fixed effects and the natural log of firm size, Ln (Firm). We also cluster errors by firm and time period.
The first four panel regressions in Exhibit 7 report results for developed markets across different-sized firms (all cap, large, mid, and small cap); the second set of regressions reports results for emerging markets. The all-cap and small-cap results are similar, because close to 80% of firms in the all-cap developed market sample are small-cap firms. With the exception of large firms in developed markets, our regression results show that bigger firms are significantly more likely to have more analysts following those stocks and that much of the explanatory power in these regressions comes from firm size. Our main variable of interest is the natural log of country size, Ln (Ctry).
As we show, all- and small-cap developed market stocks have a significant negative relationship between country size and analyst following. This result is incon-sistent with our conjecture that analyst coverage should be less in smaller countries; however, it should be noted that this result is driven by small-cap stocks that have very little analyst coverage. We do find a significant pos-itive relationship between country size and analyst fol-lowing among developed market large-cap stocks, which is consistent with our conjecture that smaller-country stocks receive less attention for international investors. As we expect, the positive relationship between large-cap coverage and country size is especially strong in the emerging markets.
E X H I B I T 7Panel Regression Explaining Number of Analysts Covering a Stock
Notes: This exhibit reports results from panel regressions of the natural log of the number of analysts plus one covering a stock as of the end of December of the previous year. Ln (Firm) is the natural log of the market capitalization measured as of the end of December of the previous year. Ln (Ctry) is the natural log of the aggregate market capitalization of a country measured as of the end of December of the previous year. For the sake of brevity, the intercept is not reported. Each regression includes industry (based on GICS sector definitions) and year fixed effects, which are also not reported. T-statistics are reported in parentheses based on robust standard errors that are clustered by firm and year. N is the average number of firms per year.
JPM-Fisher.indd 138 04/10/17 2:17 pm

THE JOURNAL OF PORTFOLIO MANAGEMENT FALL 2017
CONCLUSION
This article takes a closer look at the country size premium—that is, the tendency of stocks from smaller markets to have higher returns than stocks in the largest markets. Our measure of country size is the sum of all stocks’ market capitalization within a particular country. We find that the country size effect (1) is largely inde-pendent of the firm size effect, (2) exists when excluding the largest country ( Japan), and (3) potentially subsumes other country-level quantitative factors such as value and momentum.
Our working hypothesis is that the small-country effect was due to home bias that depressed small-country stock prices more than large-country stock
prices because of the small countries’ more limited investor base. We presented evidence that is consistent with this conjecture—in particular, the small-country effect seems to be declining as access to international markets improves, and the effect is stronger in emerging markets than in developed markets. We are somewhat surprised, however, that the small-country effect is as strong for large-cap stocks as it is for small-cap stocks. Our analysis of analyst coverage suggests a potential explanation for this phenomenon. We f ind that for large stocks, analyst coverage is in fact somewhat less in smaller countries, suggesting that at least histori-cally, home bias affected even larger stocks in small countries.
A P P E N D I X
E X H I B I T A 1Country FIC Codes Sorted According to Market Size by Year
(continued)
JPM-Fisher.indd 139 04/10/17 2:17 pm

SHOULD YOU TILT YOUR EQUITY PORTFOLIO TO SMALLER COUNTRIES? FALL 2017
ENDNOTES
The views expressed here are those of the authors and not necessarily those of any affiliated institution. We thank Chris Meeske, Andrew Tanzer, Ashvin Viswanathan, Tianyu Wang, and other members of the Gerstein Fisher Investment Strategy & Research Group for their research assistance. This research has benefited from discussions with Rawi E. Abdelal from the Harvard Business School. Sheridan Titman is an academic advisor and consultant to Gerstein Fisher.
1Source: 2015 Investment Company Institute Factbook.2Source: Morningstar. This was calculated using total
net assets from U.S. and international equity mutual funds from December 2005 to December 2016. Asset allocation data are based on the weighted average of U.S. and non-U.S. equity share of assets for mutual funds categorized by Morn-ingstar as Asset Allocation/Target Date.
3MSCI classifies an equity market by its stage of finan-cial development into three groups: developed, emerging, and frontier. During our sample period, three countries were reclassified by MSCI. Greece was upgraded from emerging to developed in May 2001 and then downgraded back to emerging in November 2013. Israel was upgraded from emerging to developed in May 2010. Portugal was upgraded to developed in November 1997.
4For more information, see Ken French’s website: mba.tuck.dartmouth.edu/pages/faculty/ken.french/data_library.html.
5For more information on the 1997 Asian f inan-cial crisis, please see https://en.wikipedia.org/wiki/1997_Asian_financial_crisis.
6For country-level summary statistics, we report com-pound annual returns, volatilities, and betas with respect to
E X H I B I T A 1 (continued)Country FIC Codes Sorted According to Market Size by Year
Notes: At the beginning of each year, we report the country FIC code for the largest (big) to smallest (small) markets based on aggregate market capitalization as of December of the previous year. Panel A presents results for developed markets from 1990–2015. Panel B presents results for emerging markets from 1996–2015.aFIC codes for developed markets are as follows: JPN ( Japan), GBR (Great Britain), DEU (Germany), FRA (France), AUS (Australia), CHE (Switzerland), NLD (Netherlands), ESP (Spain), ITA (Italy), SWE (Sweden), BEL (Belgium), HKG (Hong Kong), SGP (Singapore), DNK (Denmark), NOR (Norway), FIN (Finland), AUT (Austria), IRL (Ireland), and NZL (New Zealand). bFIC codes for emerging markets are as follows: THA (Thailand), MYS (Malaysia), ZAF (South Africa), KOR (South Korea), IND (India), IDN (Indonesia), MEX (Mexico), PHL (Philippines), BRA (Brazil), CHL (Chile), ISR (Israel), TUR (Turkey), PRT (Portugal), GRC (Greece), PER (Peru), POL (Poland), and HUN (Hungary).
JPM-Fisher.indd 140 04/10/17 2:17 pm

THE JOURNAL OF PORTFOLIO MANAGEMENT FALL 2017
the MSCI World Index using value-weighted country index monthly returns. The Sharpe ratio is the average monthly return less the monthly risk-free rate (U.S. one-month trea-sury rate) divided by the standard deviation of the difference between the monthly country return less the risk-free rate multiplied by the square root of 12.
7For stock-level summary statistics, we report time-series averages of volatilities and betas with respect to the MSCI World Index based on daily returns over the prior year.
8We repeated our univariate regressions using only mid- and small-cap stocks to form value-weighted country indices and found similar (unreported) results to those using all stocks to form country indices.
REFERENCES
Angelidis, T., and N. Tessaromatis. “Global Style Portfolios Based on Country Indices.” Working paper, MPRA, 2016.
Asness, C.S., R. Israelov, and J.M. Liew. “International Diversification Works (Eventually).” Financial Analysts Journal, Vol. 67, No. 3 (2011), pp. 24-38.
Asness, C.S., J.M. Liew, and R.L. Stevens. “Parallels between the Cross-Sectional Predictability of Stock and Country Returns.” The Journal of Portfolio Management, Vol. 23, No. 3 (1997), pp. 79-87.
Braymen, C., and R.R. Johnson. “International Diversifi-cation: The Weighting Is the Hardest Part.” The Journal of Portfolio Management, Vol. 42, No. 1 (2015), pp. 53-62.
Christoffersen, P., V. Errunza, K. Jacobs, and H. Langlois. “Is the Potential for International Diversification Disappearing?” Working paper, Rotman School of Management, University of Toronto, 2011.
Desrosiers, S., J.F. L’Her, and J.F. Plante. “Style Management in Equity Country Allocation.” Financial Analysts Journal, Vol. 60, No. 6 (2004), pp. 40-54.
Eun, C.S., and J. Lee. “Mean–Variance Convergence around the World.” Journal of Banking & Finance, Vol. 34, No. 4 (2010), pp. 856-870.
Goetzmann, W.N., L. Li, and K. Geert Rouwenhorst. “Long-Term Global Market Correlations.” The Journal of Business, Vol. 78, No. 1 (2005), pp. 1-38.
Keppler, M., and P. Encinosa. “The Small-Country Effect Revisited.” The Journal of Investing, Vol. 20, No. 4 (2011), pp. 99-103.
Keppler, M., and H.D. Traub. “The Small-Country Effect: Small Markets Beat Large Markets.” The Journal of Investing, Vol. 2, No. 3 (1993), pp. 17-24.
Li, T., and M. Pritamani. “Country Size and Country Momentum Effects in Emerging and Frontier Markets.” The Journal of Investing, Vol. 24, No. 1 (2015), pp. 102-108.
To order reprints of this article, please contact David Rowe at [email protected] or 212-224-3045.
JPM-Fisher.indd 141 04/10/17 2:17 pm