Embed Size (px)
Citation preview

NEMO–IKK recruitment to supramolecular structures • Tarantino et al.
TH
E J
OU
RN
AL
OF
CE
LL
BIO
LO
GY
S1
JCBSupplemental material
Tarantino et al., http://www.jcb.org/cgi/content/full/jcb.201307172/DC1
Figure S1. GFP-NEMO concentrates in punctate structures in response to IL-1 stimulation. NEMO-deficient cells stably expressing GFP only or GFP-NEMO were established. (A) Immunoblotting for NEMO was performed to compare the levels of GFP-NEMO in the GFP-NEMO–expressing cell line with the en-dogenous levels of NEMO in U2OS and HeLa cells. IL-1R1 was probed as a control. (B) NEMO-deficient cells stably expressing GFP (top) or GFP-NEMO (bottom) were either left untreated or were treated with IL-1 for 15 min, and indirect immunofluorescence was used to detect the p65/RelA subunit of NF-B, together with the natural fluorescence of GFP. Note the appearance of numerous GFP-NEMO–positive spots, together with the nuclear translocation of p65, in IL-1–treated GFP-NEMO–expressing cells. The insets in the images show magnified areas (indicated by the boxed regions). Bars, 5 µm.

JCB S2
Figure S2. NEMO-containing structures induced by IL-1 and TNF display small displacements, and NEMO is highly dynamic in these structures. (A) GFP-NEMO–expressing cells were stimulated with IL-1 and TNF, and the GFP-NEMO signal was recorded by TIRF real-time video microscopy. Video tracking of individual GFP-NEMO–positive particles was performed as described in the Materials and methods. Representative displacements (shown in different col-ors) observed in cells treated with IL-1, TNF, or with IL-1 plus nocodazole (Ncdz), cytochalasin D (CytoD), or latrunculin B (LatB) are presented. Data shown are representative of six experimental repeats for both IL-1 and TNF stimulations (77 and 26 spots analyzed, respectively). MSD analysis was performed to extract values, which were calculated from a large number (N) of events in each set of conditions, as described in the Materials and methods. (B) FRAP experiments were performed on IL-1– and TNF-induced GFP-NEMO–containing structures, as detailed in the Materials and methods. Representative fitted curves are presented. Half recovery times and amounts of GFP-NEMO in the mobile fractions were calculated from 19 and 48 fitted curves for TNF- and IL-1–stimulated cells, respectively. Half recovery time values were found to differ significantly between IL-1– and TNF-induced structures (P < 0.01).

NEMO–IKK recruitment to supramolecular structures • Tarantino et al. S3
Figure S3. NEMO-containing structures induced by IL-1 and TNF are anchored at the plasma membrane. (A) GFP-NEMO–expressing cells were detached from culture dishes with EDTA, left untreated, or stimulated with IL-1 (12 min) or TNF (10 min) in suspension, and were then either fixed directly (for IL-1 treatment) or treated with saponin and then fixed (for TNF treatment). The plasma membrane (red) and nuclei (blue) were stained with the lipophilic tracers DiD and DAPI, respectively. (B) U20S cells left untreated or stimulated with IL-1 or TNF for the times indicated were subjected to hypotonic shock (as de-scribed in the Materials and methods) to isolate lateral and basal membrane patches. After fixation, NEMO (red) and actin (blue) were detected by indirect immunofluorescence. Actin detection was used to locate membrane remnants. Bars, 10 µm.
Figure S4. K63-linked ubiquitination is required for NF-B activation by IL-1, but not by TNF. U2OS-shUb-UbWT and U2OS-shUb-UbK63R cells were incu-bated with or without 1 µg/ml Dox for 3 d and then stimulated with IL-1 (left) or TNF (right), as indicated. Cell lysates were prepared and analyzed for the presence of phosphorylated IKK/ (p-IKK), IB, NEMO, or HA-tagged ubiquitin (HA) by immunoblotting. Arrows indicate the position of (mono)ubiquitinated NEMO species.

JCB S4
Figure S5. Control experiments to check the specificity of anti-NEMO, anti-IRAK1, and anti-linear ubiquitin chain antibodies. U2OS cells left untreated or stimulated with IL-1 (15 min) were analyzed for the detection of NEMO (A) or IRAK1 (B) by immunofluorescence, using antibodies purchased from Santa Cruz Biotechnology, Inc. (SC) or BD Transduction Laboratories (TL). (C) NEMO/ human fibroblasts transiently transfected with NEMO-expressing vector were left untreated or stimulated with IL-1 for 15 min and subjected to immunofluorescence assays for the detection of NEMO and IB proteins. The speci-ficity of the anti-NEMO antibody used was confirmed because NEMO was detected only in the efficiently transfected cells (indicated with asterisks). The IL-1–induced degradation of IB occurred only in NEMO-reconstituted cells. (D) The immunodetection of NEMO and IRAK1 was performed in HEK-293 cells lacking IRAK1 (I1A cell line) transiently transfected with an IRAK1-expressing vector and left untreated or stimulated with IL-1 for 15 min. The IRAK1 signal was detected only in the efficiently transfected cells, demonstrating the specificity of the antibody used. NEMO and IRAK1 were redistributed in foci only in IL-1–treated IRAK1-reconstituted cells. (E) Control and HOIL1-deficient human fibroblasts left untreated or stimulated with IL-1 (15 min) were used in immunofluorescence experiments with anti-linear polyubiquitin chain antibody. The much smaller number of IL-1–induced foci in HOIL1-deficient fibroblasts confirmed the specificity of this antibody. For the experiments presented in A, B, and E, the cells were treated with saponin before fixation. Bars, 10 µm.

NEMO–IKK recruitment to supramolecular structures • Tarantino et al. S5
Video 1. Unstimulated human GFP-NEMO–expressing fibroblasts filmed with an UltraView spinning-disk confocal microscope with a 63× oil 1.4 NA objective lens. Single 3D stacks were acquired every 10 s for 18 min. Fiji software was used to obtain a maximal intensity projection of the 3D stacks. The time is indicated in the lower-right corner. Bar, 5 µm.
Video 2. Human GFP-NEMO–expressing fibroblasts stimulated with IL-1 (15 ng/ml). Immediately after the addition of the cytokine, the cells were filmed as in Video 1. Single 3D stacks were acquired every 10 s for 14 min and processed as in Video 1. The time after the addition of IL-1 is indicated in the lower-right corner. This movie starts 45 s after the addition of IL-1. Bar, 5 µm.
Video 3. Human GFP-NEMO-expressing fibroblasts stimulated with TNF (15 ng/ml). Immediately after the addition of the cytokine, the cells were filmed as in Video 1. Images were acquired every 10 s for 16 min and processed as in Video 1. The time after the addition of TNF is indicated in the lower-right corner. This movie starts 60 s after the addition of TNF. Bar, 5 µm.
Video 4. TIRF microscopy of human GFP-NEMO–expressing fibroblasts stimulated with IL-1 (15 ng/ml). GFP-NEMO molecules were detected by TIRF real-time video microscopy (at a rate of 2 images/s) with a CellM system (Olympus) equipped with a 100× oil 1.45 NA objective lens. The top panel shows the real-time acquisition and the bottom panel shows the corresponding tracked GFP-NEMO–containing particles (single tracks are shown in random colors) as described in the Materials and methods. The time after the beginning of the video recording is indicated in the lower-right corner. Bar, 5 µm.
Video 5. TIRF microscopy of human GFP-NEMO–expressing fibroblasts stimulated with TNF (15 ng/ml). GFP-NEMO molecules were detected by TIRF real-time video microscopy (as in Video 4). The top panel shows the real-time acquisition and the bot-tom panel shows the corresponding tracked GFP-NEMO–containing particles (single tracks are shown in random colors) as described in the Materials and methods. The time after the beginning of the video recording is indicated in the lower-right corner. Bar, 5 µm.
JCB S6
Video 6. FRAP experiment performed on human GFP-NEMO–expressing fibroblasts stimulated with IL-1 (15 ng/ml). The GFP-NEMO signal was detected in real time (at a rate of 1 image/s) with a spinning-disk confocal microscope (UltraView) with a 63× oil 1.4 NA objective lens. The FRAP experiment was performed as follows: a small area of the cell already containing GFP-NEMO–positive structures (indicated by a yellow box) was photobleached, and the recovery of the GFP signal was monitored. The time indicated in the upper-right corner refers to the time before and after photobleaching. Bar, 5 µm.
Video 7. FRAP experiment performed on human GFP-NEMO–expressing fibroblasts stimulated with TNF (15 ng/ml). The GFP-NEMO signal was detected in real time (at a rate of 1 image/s) with a spinning-disk confocal microscope (UltraView) equipped with a 63× oil 1.4 NA objective lens. The FRAP experiment was performed as for Video 6. The time indicated in the upper-right corner refers to the time before and after photobleaching. Bar, 5 µm.
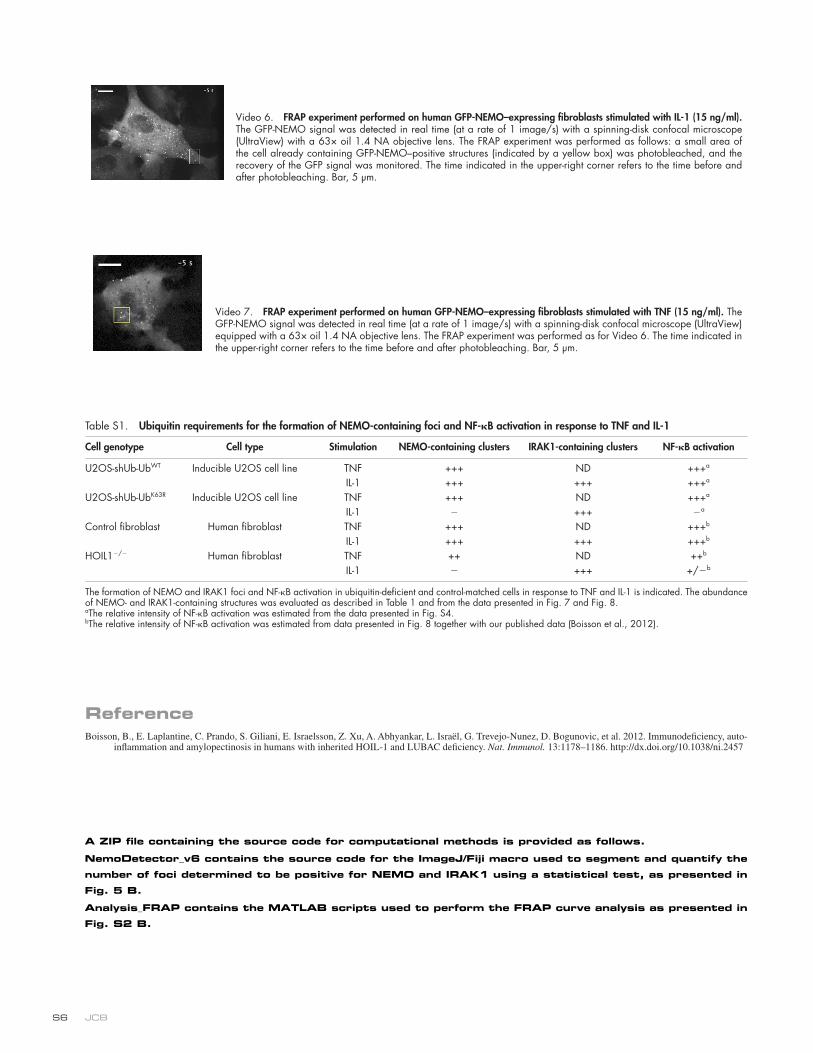
Table S1. Ubiquitin requirements for the formation of NEMO-containing foci and NF-B activation in response to TNF and IL-1
Cell genotype Cell type Stimulation NEMO-containing clusters IRAK1-containing clusters NF-B activation
U2OS-shUb-UbWT Inducible U2OS cell line TNF +++ ND +++a
IL-1 +++ +++ +++a
U2OS-shUb-UbK63R Inducible U2OS cell line TNF +++ ND +++a
IL-1 +++ a
Control fibroblast Human fibroblast TNF +++ ND +++b
IL-1 +++ +++ +++b
HOIL1/ Human fibroblast TNF ++ ND ++b
IL-1 +++ +/b
The formation of NEMO and IRAK1 foci and NF-B activation in ubiquitin-deficient and control-matched cells in response to TNF and IL-1 is indicated. The abundance of NEMO- and IRAK1-containing structures was evaluated as described in Table 1 and from the data presented in Fig. 7 and Fig. 8.aThe relative intensity of NF-B activation was estimated from the data presented in Fig. S4.bThe relative intensity of NF-B activation was estimated from data presented in Fig. 8 together with our published data (Boisson et al., 2012).
ReferenceBoisson, B., E. Laplantine, C. Prando, S. Giliani, E. Israelsson, Z. Xu, A. Abhyankar, L. Israël, G. Trevejo-Nunez, D. Bogunovic, et al. 2012. Immunodeficiency, auto-
inflammation and amylopectinosis in humans with inherited HOIL-1 and LUBAC deficiency. Nat. Immunol. 13:1178–1186. http://dx.doi.org/10.1038/ni.2457
A ZIP file containing the source code for computational methods is provided as follows.
NemoDetector_v6 contains the source code for the ImageJ/Fiji macro used to segment and quantify the
number of foci determined to be positive for NEMO and IRAK1 using a statistical test, as presented in
Fig. 5 B.
Analysis_FRAP contains the MATLAB scripts used to perform the FRAP curve analysis as presented in
Fig. S2 B.