Embed Size (px)
Citation preview

65
The Japanese Repo Market: Theory and Evidence
Naohiko Baba and Yasunari Inamura
Naohiko Baba: Financial Markets Department, Bank of Japan (E-mail: [email protected])Yasunari Inamura: Financial Markets Department (currently, Bank Examination and Surveillance
Department), Bank of Japan (E-mail: [email protected])
We thank Professor Makoto Saito (Hitotsubashi University) and two anonymous referees for theirvaluable comments and suggestions. We also benefited a great deal from discussions with the repoand bond dealers who participated in the research workshop on the repo and Japanese governmentbonds, which was held by the Financial Markets Department of the Bank of Japan. Any remainingerrors are entirely our own.
MONETARY AND ECONOMIC STUDIES/OCTOBER 2003
Repurchase agreement (repo) transactions are widely used as a risk-freemeans of borrowing or lending funds and securities. Repo transactions canbe categorized into (1) general collateral (GC) repos that borrow or lendfunds, and (2) special collateral (SC) repos that borrow or lend specificsecurities. GC repo rates are priced at a level close to the risk-free interestrate, while SC repo rates are often priced far below the GC repo rates.This paper aims to examine the pricing mechanism of the Japanese repomarket from both theoretical and empirical perspectives.
First, Duffie (1996) and Krishnamurthy (2001) show that (1) equilib-rium in the repo market requires no-arbitrage profits from combining repo and cash bond transactions, (2) the equilibrium level of repo spreadsbetween GC and SC repo rates is determined at the point where the supply and demand curves of the underlying bond issues intersect in therepo market, and (3) expected returns from future matched book tradingare reflected in the cash prices of SC bond issues.
Second, the paper empirically examines the above theoretical impli-cations using the data of repo rates and government bond prices in Japan. Our empirical results show that, regarding the on-the-run and the cheapest-to-deliver (CTD) issues, the above no-arbitrage condition is significantly satisfied.
Keywords: Repo; Government bond; No-arbitrage condition; Repospread; On-the-run issues; Cheapest to deliver (CTD); Short sales
JEL Classification: G11, G12
MONETARY AND ECONOMIC STUDIES/MARCH 2004
DO NOT REPRINT OR REPRODUCE WITHOUT PERMISSION.

I. Introduction
A repo transaction is a contract that exchanges securities with high creditworthiness,typically government bonds, for funds for a fixed period of time. The securities function as collateral for raising funds, and the funds function as collateral for borrow-ing securities. Thus, market participants recognize repo transactions as a risk-free means of raising or investing funds against securities as collateral.1 Of these repo transactions, those for raising funds are called general collateral (GC) repos, while thosefor borrowing securities are called special collateral (SC) repos. GC repo transactionsgenerate the linkage between the repo market and money markets including the interbank market, while SC repo transactions generate the linkage between the repomarket and securities markets, typically the government bond market.
Regarding the linkage between the repo market and the interbank market,Griffiths and Winters (1997) found that in the United States, GC repo rates movedalmost parallel with the uncollateralized federal funds (FF) rate. On the linkagebetween the repo market and the bond market, Jordan and Jordan (1997) empiricallyexamined Duffie’s (1996) theoretical insight that bond prices should reflect expectedprofits from future matched book trading, which takes advantage of repo spreadsdefined as the differences between GC and SC repo rates. In Japan, Shigemi et al.(2001) described the pricing of Japanese government bonds (JGBs) in the cash,futures, and repo markets after the stressful events that took place between 1998 and 1999.2 This paper aims to examine the pricing mechanism of the Japanese repomarket from both theoretical and empirical perspectives.
First, the paper theoretically reviews the pricing mechanism of the repo rates,focusing on the linkage between the repo market and the JGB market, following the above-mentioned studies. Theoretically, GC repo rates should be priced at a level close to the risk-free interest rate. Depending on the underlying bond issues,however, SC repo rates are often priced far below the GC repo rates, even though theissuers are the same or equally rated in terms of credit standing. A number of marketparticipants recognize that repo spreads, defined as the differences between GC andSC repo rates, are closely related to the supply and demand balance of the underlyingbond issues in the repo market.
Duffie (1996) and Krishnamurthy (2001) derived a mechanism by which reporates can be priced differently depending on the underlying bond issues. The mechanism is summarized as follows: (1) equilibrium in the repo market requires no-arbitrage profits from trading that combines repo and cash bond transactions (no-arbitrage condition); (2) the equilibrium level of the repo spreads is determined
66 MONETARY AND ECONOMIC STUDIES/MARCH 2004
1. Legally, repo transactions in Japan differ from those in the United States and Europe. In Japan, they take the form of borrowing or lending of securities against funds as collateral, whereas in the United States and Europe, securities are sold or bought with an agreement to buy or sell back the same securities at a later date. Furthermore,in Japan, cross-border repo transactions have been inactive due partly to the withholding tax levied on the interestearned on repo transactions by nonresidents. Cross-border transactions, however, were expected to become moreactive following the introduction of a new U.S.-type repo system in April 2001. Also, the withholding tax on nonresidents was abolished in April 2002. See Appendix 1 for the scale of the Japanese repo market.
2. Shigemi et al. (2001) explained the mechanism by which a sudden change in the supply and demand balance of JGBs triggered by stressful events such as the Y2K problem brought about a deterioration in the arbitrage relationships between the cash, futures, and repo markets.

at the point where the supply and demand curves of the underlying bonds intersect inthe repo market; and (3) expected returns from future matched book trading arereflected in the cash prices of SC bond issues.
Second, the paper empirically examines the above theoretical implications using the data of Japanese repo rates and the JGB prices. Our main finding is summarized as follows: when we regard the most recently issued (on-the-run) 10-year JGBs and thecheapest-to-delivery (CTD) issues as SC bond issues, the no-arbitrage condition is significantly satisfied between the repo spreads and the corresponding cash premiums,which are defined as the differences between the market prices of SC and GC bond issues.
The rest of the paper is organized as follows. Section II presents an overview of theJapanese repo market, as well as the general framework of repo transactions. Section IIIreviews the mechanism by which repo rates can be priced differently depending on theunderlying bond issues, based on Duffie (1996) and Krishnamurthy (2001). SectionIV conducts a simple empirical analysis of the theoretical implications reviewed in Section III using the data of on-the-run 10-year JGBs and CTD issues. Section Vconcludes by referring to the limitations of the analysis in the paper.
II. Overview of Repo Transactions3
A. Two Aspects: Borrowing/Lending of Funds and SecuritiesAs shown in Figure 1, a repo transaction starts when agent A exchanges his or herfunds for a bond held by agent B at market price on the contract date. At the end of
67
The Japanese Repo Market: Theory and Evidence
3. Repo Trading Research (2001) provides a concise review of repo transactions in Japan.
Figure 1 General Framework of Repo Transactions
Agent ABorrowing Lending
Lending
Contract date
Aspect of borrowing/lending a bond
Aspect of borrowing/lending funds
End of the contractperiod
BorrowingAgent B
Borrowing LendingAgent A
Lending BorrowingAgent B
Bond Funds
Bond FundsReporate

the contract period, agent A receives back the funds with interest, while the bond isreturned to agent B. The interest rate thus paid on the funds is called the repo rate,which is defined as the “interest rate on the funds minus a securities lending fee.”
Figure 1 reveals two aspects of repo transactions. The first is the borrowing of fundsagainst bonds as collateral. Suppose that agent A is an investor with surplus funds andagent B a bond dealer who needs to finance his or her bond portfolio. In this setup, theinvestor can lend funds in exchange for bonds with high creditworthiness as collateral.The bond dealer, on the other hand, can reduce funding costs by using his or her bondholdings as collateral, thereby curtailing the credit risk premium required by the investor.
The second is the borrowing of bonds against funds (cash) collateral. Suppose thatagent A is a bond dealer who wants to build a short position and agent B an investorwith an extensive bond portfolio. In this setup, the bond dealer can cover his or hershort position through a repo transaction by borrowing the necessary bonds againstcash collateral. The investor, on the other hand, can effectively reduce funding costsby lending the dealer the bonds in demand.
The former transactions for lending and borrowing funds are called GC repos,while the latter for lending and borrowing bonds are called SC repos. In GC repos,the underlying securities are not specified, while in SC repos, they are specified whenthe parties enter into a contract.
B. Risk-Free Characteristic of Repo TransactionsAs stated above, in repo transactions, both bonds and funds function as collateralthat ensures safety in the event of the default of either counterparty. In addition,“marking to market,” also called “margin calls,” is practiced to protect against bondprice fluctuations during the contract period. If the lender of the bonds (borrower offunds) defaults while the bond price falls during the contract period, the borrower ofthe bonds (the lender of funds) cannot recover the full amount of his or her funds by selling the bonds put up as collateral. To avoid the loss, the system of margin calls enables traders to ask for additional provision of collateral when a shortfalloccurs during the contract period, based on the calculation of the margins, that is,the shortage/excess of the value of the collateral. This kind of risk managementmethod ensures a high degree of safety for repo transactions.4
C. Use of Repo Transactions1. SC repos and short salesBond dealers can efficiently build short positions using repo transactions.5 The mosttypical way is to sell short a bond in the cash market while simultaneously borrowing thesame bond through an SC repo for delivery of the bond. As illustrated in Figure 2 [1],the funds raised by selling short a bond can be used to cover the funds required for settling the SC repo transaction. In this way, short positions can be built withoutholding any initial capital or the specific bonds.6
68 MONETARY AND ECONOMIC STUDIES/MARCH 2004
4. See Repo Trading Research (2001) for details on various risk management methods for repo transactions.5. In fact, Keane (1996) argues that many special repo transactions stem from the need to cover short sales.6. For simplicity, we ignore the costs entailing the haircut for managing the risk of price fluctuations, the administrative
costs, and the costs arising from differences in settlement timing.

At the end of the contract period, the bond dealer needs to buy the bond in the cashmarket to return it to the investor. The dealer can use the funds P1(1 + R ) (R = reporate) paid by the investor to buy back the bond in the cash market (Figure 2 [2]).
Why do bond dealers want to build short positions using repo transactions? The dealer’s profit/loss from bond trading can be expressed as P1 (selling price) − P2
(buying price). At the same time, the dealer invests funds P1 at the repo rate R andreceives P1R . Thus, the return for the dealer is expressed as P1 − P2 + P1R . Note thatthe return is always positive when the bond price falls (P1 > P2) during the contractperiod as long as R takes a positive value.
In this way, when bond prices are expected to fall, speculative dealers have anincentive to build short positions. Risk-averse bond dealers also benefit from holdingsimilar short positions, as they can hedge against losses from a possible fall in theprices of their bonds.2. Matched book tradingInvestors with rich bond portfolios can generate profits without being exposed torisks by taking advantage of various levels of repo rates. For example, the investorscan lend (borrow) bonds (funds) at a low repo rate (a high securities lending fee), andlend (borrow) the funds (bonds) at a higher repo rate, yielding profits equivalent tothe spread between the two repo rates. This kind of transaction is called “matchedbook” trading. While it is widely used in the United States as a means of reducing thefunding costs of portfolios, it is still in limited use in Japan.
69
The Japanese Repo Market: Theory and Evidence
Figure 2 SC Repos and Short Sales
[1] Contract Date
[2] End of the Contract Period
Bond dealer Investor
Funds P1
Lending a bond
Funds raised by selling the bond
Selling the borrowedbond at P1
Cash market
Bond dealer Investor
Funds P1(1 + R )
Returning the bond
Funds for buying the bond
Buying the bond at P2
Cash market

D. Repo Rates in JapanSC repo rates are mostly independent of, and lower than, GC repo rates. Figure 3shows overnight GC and SC repo rates of the on-the-run issues of 10-year JGBs andthe CTD issues.7 Evidently, there is a large difference between repo rates. SC reporates often take negative values depending on the underlying bond issues. Here, wewill give an intuitive explanation for this phenomenon despite the fact that the bondissues put up as collateral are of the same quality in terms of credit risk. A detailedexamination will be made in Section III.
As stated earlier, the repo rate is defined as the interest rate minus a securitieslending fee. All funds are equal in quality by definition. Thus, theoretically, the interest rate should equal the average rate for uncollateralized lending such as theTokyo Interbank Offered Rate (TIBOR), regardless of whether it is a GC or SC reporate. With regard to lending fees, since most issues can be used for GC repos, it isnatural to think that fees are on the same level.
Suppose, however, that a certain issue cannot be substituted for others, resulting inhaving a unique supply/demand structure. If demand for this issue exceeds supply inthe repo market, the market mechanism would work to raise the lending fee of this issueby (� lending fee) above that of other general issues. As a result, the repo rate for thisissue would fall by (� lending fee) by definition, which leads to the following relation-ship: interest rate – (lending fee + � lending fee) = original repo rate – � lending fee.When (� lending fee) exceeds the original repo rate, the repo rate turns negative.
Similar to the GC repo rate, the SC repo rate is defined as the interest rate minusa securities lending fee for a specific issue. Thus, the repo spread is equivalent to “the
70 MONETARY AND ECONOMIC STUDIES/MARCH 2004
7. Settlement of overnight transactions is made two days after the contract date; this type of transaction is alsoknown as a spot/next (S/N) transaction.
Figure 3 Repo Rates in 2001
–0.6
–0.4
–0.2
0.0
0.2
0.4
0.6
GC repo rateSC repo rate (on-the-run issues)SC repo rate (CTD issues)
Jan.
4
Jan.
18
Feb
. 1
Feb
. 15
Mar
. 1
Mar
. 15
Mar
. 29
Apr
. 12
Apr
. 26
May
10
May
24
June
7
June
21
July
5
July
19
Aug
. 2
Aug
. 16
Aug
. 30
Sep
. 13
Sep
. 27
Oct
. 11
Oct
. 25
Nov
. 8
Nov
. 22
Dec
. 6
Dec
. 20
Percent
Source: Bank of Japan.

lending fee for a specific issue minus that for general issues,” which is equal to theabove-mentioned (� lending fee). When the repo spread is positive, the lending feefor this specific issue becomes higher than that for general issues, reflecting a tightsupply and demand condition for that issue.
On the other hand, Figure 4 shows the spreads between the overnight GC repo andmajor uncollateralized lending rates. Although GC repos have a risk-free characteristic,
71
The Japanese Repo Market: Theory and Evidence
[1] Spread between the GC Repo Rate and the Uncollateralized Call Rate
[2] Spread between the GC Repo Rate and the Euro-Yen Rate
Figure 4 Spreads between the GC Repo Rate and the Uncollateralized Rate
0.5
0.4
0.3
0.2
0.1
0.0
–0.1
–0.2
–0.3
Percent
July98
July99
Jan.1998
Jan.99
July2000
Jan.2000
July01
Jan.01
Source: Bank of Japan.
–0.3
–0.2
–0.1
0.0
0.1
0.2
0.3
0.4
0.5
July98
July99
Jan.1998
Jan.99
July2000
Jan.2000
July01
Jan.01
Percent

they are almost always higher than the uncollateralized call rate, also often staying above the euro-yen rate. This fact stands out when compared with the relationshipbetween the GC repo and the FF rates in the United States. In the United States, theGC repo rate moves almost in parallel, a few basis points below the uncollateralized FF rate. For example, from January 1998 to August 2001, the spread between the GC repo and the uncollateralized call rate (FF rate for the United States) averaged 0.05 percent in Japan, compared with –0.07 percent in the United States.8
III. Theoretical Review
A. General Repo RateAs shown in Figure 5, a general repo transaction can be thought of as the combinedposition of (1) a short sale of a bond at price P on the contract date and (2) a forwardcontract that receives P × (1 + GC repo rate R ) at the end of the contract period.9
In equilibrium, the expected return from the above transaction, E [F − P (1 + R )],should be zero, where E denotes the expectation operator. This leads to the followingequation:
F = P (1 + R ). (1)
That is, the GC repo rate should be equivalent to the risk-free interest rate.10
B. Special Repo Rate1. No-arbitrage conditionNow let us review how SC repo rates are priced following Duffie (1996) andKrishnamurthy (2001). The preceding discussion shows that the GC repo rate shouldbe equal to the risk-free interest rate. On the other hand, as shown in Section II, the
72 MONETARY AND ECONOMIC STUDIES/MARCH 2004
8. At present, no consensus has been reached on why risk-free repo rates are higher than uncollateralized rates. We attempt to find an answer to this question in Appendix 2, focusing on the period after January 2001, whenreal-time gross settlement (RTGS) was introduced.
9. Strictly speaking, since repo transactions entail marking to market, they differ from forward transactions. Also,we disregard interest rate uncertainty for simplicity.
10. Equation (1) means that the period rate of return, computed from futures and cash prices, is equal to the GC reporate. Market participants actually conduct arbitrage trading, which combines (1) the futures and cash sales/purchasesof the CTD issues and (2) repo transactions. Repo Trading Research (2001) provides a simple example of this arbi-trage trading. The rate of period return is also called the “implied repo rate.” In a normal situation, the implied reporates should be equal to the repo rates on the CTD issues as a result of arbitrage trading. In reality, however, this isnot always the case because of inherent delivery risk when the CTD issue changes. See Shigemi et al. (2001) for details.
Figure 5 Forward and GC Repo Transactions
Contract date
Contracted price P
Cash price P
End of the contract period
Contracted price P × (1 + GC repo rate R )
Forward price F

special bond issues have their own SC repo rates, which are lower than GC repo rates.For equilibrium to be reached in the presence of the repo spreads, the profit expectedfrom arbitrage trading using repo spreads needs to be zero. As explained earlier, an arbitrage position can be built without holding any initial capital or bond issues bycombining a repo contract with an outright cash bond transaction. Thus, examiningthe zero-profit condition from these transactions (no-arbitrage condition) will providea clue to the level of equilibrium repo spreads.
For simplicity, we consider a two-period model without any costs incurred by (1) uncertainty over inventory arising from mismatching in the timing of buying andselling and (2) asymmetric information. We assume that settlement of transactions inbonds and funds takes place once a day. There are two bond issues, S and G, priced at PS and PG on date 1. The former is used as collateral for an SC repo and the latter for a GC repo. The respective repo rates are RS and RG. There are a large number ofrisk-neutral bond dealers in the market, who know for certain that the bond prices,PS > PG on date 1, will converge to Pcon on date 2.
To build an arbitrage position, a bond dealer will sell short the issue S and use theraised funds to borrow the same issue in the SC repo market. Simultaneously, thedealer will buy issue G to hedge against interest rate risk using the funds raisedthrough a GC repo transaction. As a result, profit/loss � can be expressed as
� = −[Pcon − PS] + [Pcon − PG] − PGRG + PSRS . (2)= PS − PG − PGRG + PSRS
The first and second terms of the right-hand side of equation (2) represent the capitalgains on issues S and G. Equilibrium requires the profit from this arbitrage trading tobe zero. Thus, the following no-arbitrage condition should hold:
PS 1 + RG— = ———. (3) PG 1 + RS
Equation (4) below is a logarithmic version of equation (3). The left-hand side ofequation (4) represents the cash premium, which measures the extent to which S isevaluated higher than G, and the right-hand side represents the repo spread:
PS − PG——— = RG − RS. (4) PG
Equation (4) shows that the profit from the repo spread is fully offset by the higher market price of issue S that was purchased to build the arbitrage position. It also impliesthat, in equilibrium, repo rates adjust themselves to eliminate any profits expected from the arbitrage position taking advantage of the difference in bond prices. The above argument suggests that the parity encompassing the repo and bond marketsshould hold, just like the parity linking the foreign exchange rate and interest rate differential between any two countries. Also, in equilibrium, the following condition(5) is always satisfied:
73
The Japanese Repo Market: Theory and Evidence

RS ≤ RG. (5)
To prove condition (5), all we have to do is to prove that RS > RG contradicts the notionof equilibrium. If RS > RG holds, issue S borrowed through a repo transaction can beused in a GC repo transaction. This transaction enables a dealer to make arbitrageprofits indefinitely without holding any initial capital, and thus equilibrium is neverreached. Therefore, in equilibrium, condition (5) needs to be satisfied.11
2. Deriving supply and demand curvesThe above explanation enables us to understand that a repo spread and the no-arbitragecondition can coexist in the form of the parity between repo spread and cash premium.This no-arbitrage condition, however, alone cannot determine the equilibrium level ofthe repo spread and the cash premium. The equilibrium should be achieved at a levelwhere demand and supply for the issue in the repo market meet. Let us take a look atFigure 6 to examine this point.
First, the supply curve is written as upward sloping. The rationale behind this is as follows. Let us assume a case where an investor with SC issues trades in the repomarket. We assume for simplicity that the investor is a price taker. The investor canraise funds at a lower SC repo rate of RS and at the same time invest them at a higherGC repo rate of RG. Then, the investor’s rate of return per issue will be equal to therepo spread, or the investor can lower portfolio-financing costs by the repo spread.Also, assuming that these transactions are cost-free, the investor with SC issues will
74 MONETARY AND ECONOMIC STUDIES/MARCH 2004
Figure 6 Determination of Repo Spread
A
B
Demand curve Supply curve
Equilibrium level ofrepo spread
0
Repo spreads = RG − RS
Quantity of an SC issue
11. Let us confirm that when condition (5) is satisfied in equilibrium, a positive arbitrage profit is not necessarilyensured. When trying to make a profit from the spread RG − RS, an issue borrowed through a GC repo cannot be put up as collateral in an SC repo. Thus, there is a need to purchase an SC issue in the cash market. In thiscase, even if a GC issue was sold short to hedge against interest rate risk, no-arbitrage condition (4) ensures a zero profit. If the position were unhedged, the transactions would no longer be arbitrage trading, but speculativetrading, which does not guarantee a positive profit.

have an incentive to supply the entire portion of the SC issues to the repo market. In this case, the supply curve will level out at a certain point in the repo spread.12
In reality, however, transaction costs are incurred. In this case, not all SC issueswill be supplied to the repo market. To elaborate on this point, let us examine a casewhere transaction costs are incurred and marginal cost increases with transaction volume. These transaction costs may include such costs as back-office operations anddelivery costs. Under these circumstances, as long as the repo spread, that is, marginalprofit, is larger than marginal cost, investors will supply SC issues to the SC repomarket and will continue to do so until marginal cost rises to the level of the repospread. Therefore, the supply curve should be upward sloping.
Next, let us turn to the shape of the demand curve. Bond dealers are the majoragents borrowing collateral issues in the SC repo market. As shown in equation (4),in equilibrium the repo spread is fully offset by the cash premium. This means that,regardless of the size of the repo spread, bond dealers’ net profits should be zero.Therefore, optimal behavior for dealers alone will not create a downward-slopingdemand curve. As explained in Section II, the main reason for bond dealers to raisespecific issues through SC repos is to cover their short positions in the cash market.In other words, behind dealers’ demand for repos lie the investors who would like tobuy the issues from dealers in the cash market. Since the no-arbitrage conditionholds, these investors are paying an additional cost, equal to the repo spread, toacquire these specific issues.13
Why do investors place greater value on specific issues than on others? For example, life insurance companies tend to prefer issues with high current yields andcoupons. Also, in the JGB futures market, fictitious issues with 10 years to maturityand a coupon rate of 6 percent are traded. The settlement price on the due date is determined by the futures price multiplied by the conversion factor (CF). Theseller of the futures naturally prefers to deliver the CTD issues that will produce thesmallest net basis when the above settlement price is subtracted from the contractprice. Thus, there is an incentive for sellers of futures to hold the CTD issues inadvance. Furthermore, investors generally like to trade issues with high market liquidity. Bank for International Settlements (1999a) defines a liquid market as “a market where participants can rapidly execute large-scale transactions with a smallimpact on prices.” Factors causing differences in liquidity may include whether theissue is on the run, and whether the issue is being reopened, consolidating with others. In the JGB market, trading is heavily concentrated on the on-the-run issuesand marketability soon becomes extremely thin as they are incorporated in investors’portfolios as “buy-and-hold” issues.
Now, let us assume that the benefit from holding a certain issue diminishes as thesize of the holding increases: the larger the benefit stemming from an issue, thegreater the decline in benefit from the addition of the same issue (diminishing
75
The Japanese Repo Market: Theory and Evidence
12. To be precise, the supply curve will be flat at a certain level of the repo spread, ending at the upper limit of supplyof the SC issue.
13. The repo spread may reflect the convenience yield, which represents the convenience of holding actual com-modities rather than futures positions in the same commodities. For example, if a commodity falls in short supply temporarily, it will be of great convenience to actually have the commodity in question. If the commodityis a raw material, there is great convenience in being able to continue production. See Hull (2000) for details.

marginal utility). If this is the case, a decrease in the repo spread means a decline inmarginal cost relative to marginal utility, which will prompt investors to increase purchases. Similarly, since an increase in the repo spread means a rise in marginalcost, investors will reduce purchases to a level in line with marginal utility. As aresult, the demand curve should be downward sloping.14
Under the supply and demand structure given above, the equilibrium point for anSC issue is given at point A in Figure 6, while that for a GC issue is at point B.3. No-arbitrage condition in a multi-period settingWe have so far limited our attention to a two-period horizon. In reality, however,market participants operate over a multi-period horizon. Following Krishnamurthy(2001), we extend the no-arbitrage condition to a multi-period setting. As stated earlier, there is a close relationship between cash bond prices and SC repo rates. Also,investors with SC issues can raise funds at a low interest rate through SC repos, whileat the same time they invest them in GC repos, earning returns equal to the repospreads. Naturally, an investor who expects a certain issue to become special is likelyto try to make profits by using such an issue in repo transactions. If a large numberof market participants form similar expectations regarding the same issue, the presentvalue of the expected repo spread will be reflected in the cash market price. Let uslook at this point in more detail.
The assumptions are basically analogous to the two-period setting. Two issuesexist. The two sets of cash prices and repo rates on date t are (1) PS,t and RS,t and (2)PG,t and RG,t , respectively. We assume PS,t > PG,t . Market participants know that theprices of both issues will converge at Pcon on date T.
Under this setting, a risk-neutral bond dealer builds an arbitrage position over the multi-period horizon. To be more specific, on date t, the dealer sells short thehigher-priced issue and covers the position through an SC repo, while raising fundsthrough a GC repo to buy a lower-priced issue to hedge against interest rate risk.Return �t on date t + 1 can be expressed as
�t +1 = (PG,t +1 − PG,t ) − (PS,t +1 − PS,t) − PG,t RG,t + PS,tRS,t. (6)
Equilibrium would not be reached if this position continued to yield profits/losses. Therefore, under the condition that information on date t is shared by allmarket participants, equilibrium must be reached at the point where the expectedreturn is zero, which is Et[�t +1] = 0. Hence,
Et[(PG,t +1 − PG,t ) − (PS,t +1 − PS,t)] = PS,tRS,t − PG,t RG,t . (7)
By assumption, market participants know that the prices of the two issues will converge on date T. Thus, equation (7) yields the following relationship (8) betweenpresent bond prices and repo rates by summing up from date 0 to T − 1:
T −1
PS,0 − PG,0 = �E0[PG,t RG,t − PS,tRS,t]. (8) t =0
76 MONETARY AND ECONOMIC STUDIES/MARCH 2004
14. Duffie (1996) derives a downward-sloping demand curve by assuming the presence of risk-averse investors.

In equation (8), PS,0 > PG,0 and RS,t < RG,t hold. Thus, we reached the same conclusionas the two-period model that the repo spread is priced at a level that fully offsets theprice differential between the underlying issues in the cash bond market. In addition,we can find another interesting insight from this equation. Equation (8) can berewritten as follows:
T −1
PS,0 − PG,0 = PG,0RG,0 − PS,0RS,0 + �E0[PG,t RG,t − PS,tRS,t]. (9) t =1
The left-hand side of equation (9) represents cash premium on date 0. The first termon the right-hand side represents the repo spread on date 0, which is valued in termsof return itself, not the rate of return. The second term denotes the sum of futurerepo spreads expected on date 0. Put differently, the expected repo spreads arereflected in the present cash premium. In the two-period model, issues were assumedto be special for just one period. However, when a certain issue is expected to remainspecial until some time in the future, a repo spread ensures that the no-arbitrage condition is satisfied over the multi-period horizon. That is, a cash premium couldemerge when market participants expect an issue will be special because of the highlikelihood that it will become the next CTD, for example.
The above discussion implies that the repo spread could provide a clue to future cashpremium. If the term structure of the repo spread is estimated, the implied repo spreadcould be worked out backward by analogy with the pure expectations hypothesis. Thisline of logic suggests the possibility that the future cash premium of an SC issue maybe estimated in advance from the implied repo spread. In reality, however, trading volume of term transactions in the Japanese repo market is so thin that the future cash premium thus computed might not be reliable.15 Furthermore, if we assume thepresence of risk-averse market participants, the term structure of the repo spread wouldinclude a premium arising from uncertainty. In this case, the implied repo spread would lead to an overvaluation in future cash premium.16
4. Repo market under stress Analysis so far has focused on a normal situation where the market is free from stress.By stress, we mean a situation where one or the other preconditions for the modeldescribing a normal situation is not satisfied or where an unexpected event causesmarket participants to overreact in response to the event. Various mechanisms cancause stress, which makes it difficult to generalize. To illustrate the repo market understress, we review a stressful event that occurred in Japan at the year-end of 1999, triggered by a rumor about repo transactions carried over to the following year. This episode will help us understand the limitations of the model describing a normal situation, once a stress occurs.
77
The Japanese Repo Market: Theory and Evidence
15. Shigemi et al. (2001) point out that compared with the U.S. market, term transactions, e.g., three-monthrepos, are not actively traded in the Japanese market. As a result, some market participants noted that in the formation of repo rates for long-term contracts, the cutoff rate for the Bank of Japan’s repo operations acts as abenchmark for term instruments. See Bank for International Settlements (1999b) for the role of the repo marketin monetary policy.
16. For example, Buraschi and Menini (2002) use the U.S. data to examine the term structure of repo spreads, rejecting the expectations hypothesis.

Shigemi et al. (2001) note that a rumor that “some public funds would not beengaged in repo transactions (lending bonds) over the year-end because of concernsover the Y2K problem” circulated in the repo and JGB markets around August 1999.This rumor fueled speculation that other government-related institutions would also withdraw from repo transactions over the same period. Bond dealers had builtshort positions on the assumption that large institutional investors such as publicfunds and life insurance companies would continue to lend bonds through repotransactions. Unsettled by the rumor, they rushed to close their positions, which triggered a precipitous fall in SC repo rates, thus rapidly expanding repo spreads.
According to Duffie (1996) and Krishnamurthy (2001), repo spreads are deter-mined by the supply and demand balance of the SC issues in the repo market. In theabove case, the rumor would cause the supply curve to shift leftward (Figure 6).Applying this logic, the following interpretation is possible. The speculation that thesupply of the SC issues would be limited over the year-end created expectationsamong bond dealers that cash bond prices would shoot up. Thus, they immediatelyclosed positions, triggering expansion in the repo spread.
Here, it should be noted that the expansion in the repo spread was possibly muchgreater than that predicted by Duffie (1996) and Krishnamurthy (2001). Shigemi et al. (2001) summarize the mechanism of the surge in the repo spread as follows: (1) the rapid expansion in basis prompted bond dealers, who had conducted arbitrage trading that combines cash and futures positions (short-basis trading), to cut losses by buying back cash bonds and selling futures; the resultant furtherexpansion in basis caused a chain reaction by which implied repo rates fell further (a surge in lending fees), leading to a sharp rise in cash prices; and (2) some repodealers, who had built short positions through repo transactions by lending cashbonds on a long-term basis, rapidly reversed the positions under loss-cut rules aslosses expanded due to the sharp fall in repo rates.
IV. Empirical Analysis
As explained in Section III, no-arbitrage condition (4) should hold when the repomarket is in equilibrium. In other words, when a repo spread exists, the price of the SC issue should be higher than other GC issues by the repo spread. When thisrelationship is extended to a multi-period setting, the bond price should reflect therepo spread expected to arise in the future. In this section, we try to empiricallyexamine whether such a theoretical relationship holds in the Japanese repo market,basically following the methodology of Jordan and Jordan (1997).17
A. DataIn carrying out a precise analysis, we need to collect the data for the two followingbond issues: GC and SC issues with the same coupon rate and remaining maturity.
78 MONETARY AND ECONOMIC STUDIES/MARCH 2004
17. Jordan and Jordan (1997) found a significant relationship shown by equation (4) between the repo and Treasurysecurities markets in the United States.

In reality, however, we cannot find such a pair of issues, and thus need to estimatetheir theoretical prices. In this paper, we first estimated theoretical cash prices byemploying the cubic spline function, and then proceeded to obtain cash premiumsby comparing them with actual cash prices.18,19 To be more specific, we derived a discount factor from the price data of GC issues to compute the theoretical prices ofSC issues.20 The prices thus obtained effectively mean “the theoretical prices of thebond issues if they had not become special.” The difference between this theoreticalprice PG and the actual market price PS can be regarded as the cash premium. In thisway, we computed the cash premiums of the on-the-run and CTD issues from thediscount factors estimated from the data of 10-year JGBs, excluding the followingissues: on-the-run, CTD, JGB issues with issue dates close to the CTD issues, andothers that market participants reported were special.21 On-the-run and CTD issuesare those after the Bank of Japan started collecting data on repo rates.22
Table 1 shows (1) the average cash premiums on the on-the-run and the CTD issuesand (2) the cash premiums on the corresponding GC issues. With a few exceptions,23
we found that cash premiums on SC issues are larger than others.
79
The Japanese Repo Market: Theory and Evidence
18. In this paper, we employed the cubic spline function devised by McCulloch (1975). This function is widely used,since a simple linear regression can be employed for estimations. Given that the discount factor is estimated fromdifferent sets of price data of bonds with different remaining maturity, we used generalized least squares (GLS) onthe assumption that the standard deviation of the error term of each issue is in proportion to the duration.
19. For JGB price data, we used the closing price as of 3:00 p.m. released by Japan Bond Trading Co. Ltd.20. A discount factor can be understood as the price of a discount bond paying ¥1 at time-point t as a function of t .21. The issues we excluded from our sample are the 196th, 199th, 202nd, 203rd, 205th, 209th, 210th, 221st, 225th,
226th, 227th, 228th, 229th (including the reopened issue), 230th, 231st, 232nd, 233rd, and 234th issues.22. The Bank of Japan started collecting data on repo rates on December 18, 2000. We excluded the 225th issued on
November 11, 2000 because repo spread data for the whole period during which the issue was the on-the-runissue are not available. Similarly, regarding the CTD issue, we used the data for issues for which repo spreads forthe whole period are available.
23. The cash premium on the 229th issue was positive before it was reopened, but turned negative after it wasreopened. According to the model in Section III, both cash premium and repo spread should fall when supply
Table 1 Estimated Cash Premiums (Average)
[1] On-the-Run Issues
226th 227th 228th 229th 230th 229th* 231st 232nd 233rd 234th
Cash 0.33 0.20 0.11 0.18 0.02 –0.14 –0.05 0.03 0.09 0.19premium (0.01) (0.01) (0.00) (0.00) (0.00) (0.00) (0.00) (0.00) (0.00) (0.02)
[2] CTD Issues
202nd 203rd 205th
Cash 0.24 0.12 0.17premium (0.00) (–0.01) (–0.01)
Notes: 1. Cash premium is defined as the difference between the market price of an SC issue and thetheoretical price as expressed per ¥100 of par value.
2. The charts in parentheses are the average cash premiums on the interest-bearing 10-yearJGB GC issues during the same sample period, excluding the on-the-run, CTD, and otherissues that market participants reported were special.
3. The 229th issue is a reopened one. 4. The sample period for the on-the-run issues is from the auction date to the last business
date before the issuance of the next JGB issue. For the CTD issues, it is from the date whenthe issue became the CTD issue to the last business date before it lost the status.

Regarding the expected sum of repo spreads, we calculated equation (10) belowusing GC and SC repo rates reported by participants in the Bank of Japan’s marketoperations using the methodology of Jordan and Jordan (1997):
T RSit ≡ �(PG,tRG,t − PS,tRS,t) . (10) �=t i
In this equation, i denotes the index for each issue, t the date of observation, and T the last day when the issue holds the status of the on-the-run or the CTD issue. RG and RS denote the GC and SC repo rates, respectively. This equation assumes thatmarket participants expect the issues to cease to be special on the day they lose statusas the on-the-run or the CTD issues.
B. Relationship between Repo Spread and Cash PremiumFigure 7 depicts a cross-sectional relationship between (1) cash premiums24 and (2) theexpected repo spreads. There appears to be a positive correlation between them.
To statically examine this observation, we conduct a regression analysis usingequation (11) below:
�Pi ,t = �iDummyi + �RSi,t , (11)
80 MONETARY AND ECONOMIC STUDIES/MARCH 2004
Figure 7 Relationship between Repo Spread and Cash Premium
0.6
0.5
0.4
0.3
0.2
0.1
0.0
–0.1
–0.2
Cash premium
On-the-run issuesCTD issues
Repo spread
0.00 0.01 0.02 0.03 0.04
Note: Cash premium is expressed per ¥100 of par value, while the repo spread isexpressed as a percentage point.
increases due to reopening. The estimation result is consistent with the model in this regard. But, as shown inequation (5), in equilibrium, both cash premium and repo spread must be positive. Regarding this point, we haddifficulty conducting a reliable analysis due to the limited data on reopened issues.
24. For the on-the-run issues, cash premiums were computed as of the issue date. For the CTD issues, they werecomputed as of their first trading day.
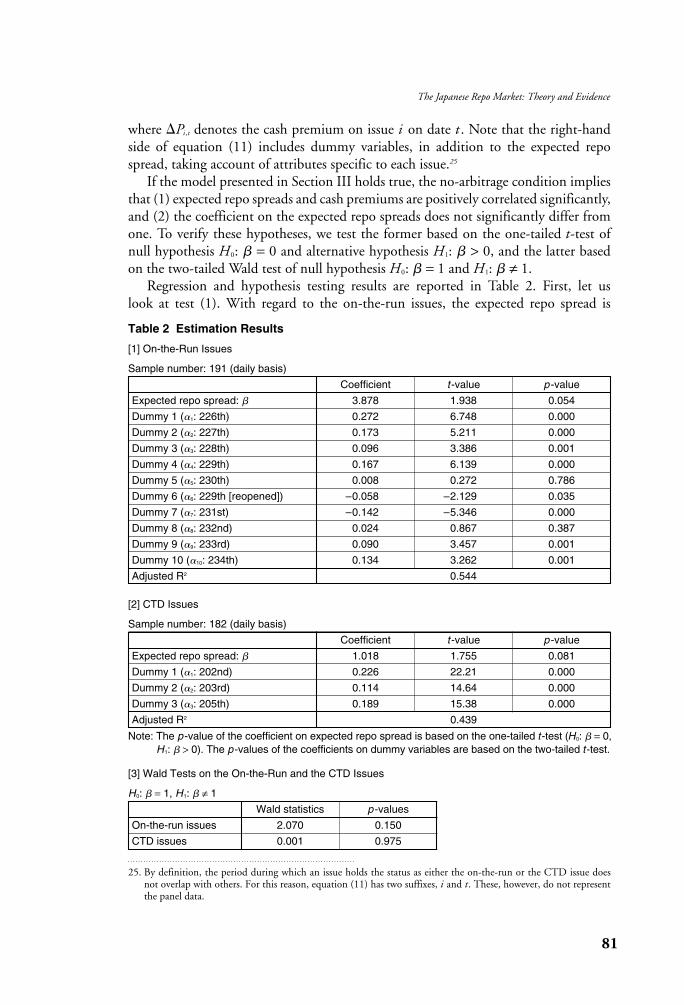
where �Pi ,t denotes the cash premium on issue i on date t . Note that the right-handside of equation (11) includes dummy variables, in addition to the expected repospread, taking account of attributes specific to each issue.25
If the model presented in Section III holds true, the no-arbitrage condition impliesthat (1) expected repo spreads and cash premiums are positively correlated significantly,and (2) the coefficient on the expected repo spreads does not significantly differ fromone. To verify these hypotheses, we test the former based on the one-tailed t-test of null hypothesis H0: � = 0 and alternative hypothesis H1: � > 0, and the latter based on the two-tailed Wald test of null hypothesis H0: � = 1 and H1: � ≠ 1.
Regression and hypothesis testing results are reported in Table 2. First, let us look at test (1). With regard to the on-the-run issues, the expected repo spread is
81
The Japanese Repo Market: Theory and Evidence
Table 2 Estimation Results
[1] On-the-Run Issues
Sample number: 191 (daily basis)
Coefficient t -value p -value
Expected repo spread: � 3.878 1.938 0.054
Dummy 1 (�1: 226th) 0.272 6.748 0.000
Dummy 2 (�2: 227th) 0.173 5.211 0.000
Dummy 3 (�3: 228th) 0.096 3.386 0.001
Dummy 4 (�4: 229th) 0.167 6.139 0.000
Dummy 5 (�5: 230th) 0.008 0.272 0.786
Dummy 6 (�6: 229th [reopened]) –0.058 –2.129 0.035
Dummy 7 (�7: 231st) –0.142 –5.346 0.000
Dummy 8 (�8: 232nd) 0.024 0.867 0.387
Dummy 9 (�9: 233rd) 0.090 3.457 0.001
Dummy 10 (�10: 234th) 0.134 3.262 0.001
Adjusted R2 0.544
25. By definition, the period during which an issue holds the status as either the on-the-run or the CTD issue doesnot overlap with others. For this reason, equation (11) has two suffixes, i and t. These, however, do not representthe panel data.
[2] CTD Issues
Sample number: 182 (daily basis)
Coefficient t -value p -value
Expected repo spread: � 1.018 1.755 0.081
Dummy 1 (�1: 202nd) 0.226 22.21 0.000
Dummy 2 (�2: 203rd) 0.114 14.64 0.000
Dummy 3 (�3: 205th) 0.189 15.38 0.000
Adjusted R2 0.439
[3] Wald Tests on the On-the-Run and the CTD Issues
H0: � = 1, H1: � ≠ 1
Wald statistics p -values
On-the-run issues 2.070 0.150
CTD issues 0.001 0.975
Note: The p -value of the coefficient on expected repo spread is based on the one-tailed t -test (H0: � = 0,H1: � > 0). The p -values of the coefficients on dummy variables are based on the two-tailed t -test.

statistically significant at the 5 percent level, adopting the alternative hypothesis of test (1) above. At the same time, most dummy variables are significant at the 5 percentlevel, suggesting that individual attributes influence the level of cash premiums.
Similarly for the CTD issues, the expected repo spread is significant at the 10 percentlevel, adopting the alternative hypothesis of test (1). Also, all of the dummy variablesare significant at the 5 percent level.
As for test (2), if the null hypothesis H0: � = 1 holds true, the Wald statisticsshould follow the �2 distribution with freedom of degree one. The Wald statisticscomputed from the estimated coefficients of the on-the-run and CTD issues cannotsignificantly reject the null hypothesis. These results suggest that the no-arbitragecondition presented in Section III holds true statistically.
Here, note that the estimated �s on the expected repo spread greatly differ betweenthe on-the-run and the CTD issues. There are two possible reasons for this. First, weassumed that the on-the-run issues are special for about one month, that is, until thenext issue is issued. Thus, if the issue is special for more than one month, the estimated� might become overvalued to bridge the gap. Second, there seem to be large differences in the degree of uncertainty over the length of time during which the on-the-run and CTD issues are special. The multi-period models of Duffie (1996) and Krishnamurthy (2001) are based on the assumption that risk-neutral market participants have perfect foresight. If uncertainty is present while market participantsare risk averse, however, a premium arising from uncertainty might be added to the cash premium. For the CTD issues, it is relatively easy to obtain information onthe overall positions of futures contracts or implied repo rates, both of which can beused to forecast the length of time that the CTD issues are special. For the on-the-runissues, however, it is difficult to obtain robust implied repo rates due to (1) the unpre-dictability of supply and demand conditions because of the absence of a when-issued(WI) market26 in Japan, and (2) thin market volume in futures compared with the CTD issues. Consequently, uncertainty about the length of time during which the on-the-run issue is special might be reflected in the cash premium.
V. Concluding Remarks
This paper has examined the Japanese repo market, which was launched as recently asApril 1996. Despite its short history, the market now constitutes a main pillar of theJapanese money market, at least in terms of scale. After reviewing the theoreticalmechanism by which repo rates are priced, we conducted a simple empirical analysis.Not many studies on overseas repo markets are available, let alone on the Japanesemarket. We thus hope that the paper will be of some help in activating discussions onthe Japanese repo market among market participants, academics, and central bankers.
82 MONETARY AND ECONOMIC STUDIES/MARCH 2004
26. WI trading begins with the announcement of auction details, which include auction date, coupon rate, size of theissue, maturity date, interest payment date, bond code number, and whether the issue will be reopened or not. It ends on the auction or issue date. Settlement and delivery both take place on the issue date. Thus, we canregard it as a type of forward market.

Finally, we would like to add some words of caution. First, the paper disregardsthe effects of uncertainty. Second, it is based on the assumption of the Walrasian lawof market clearing.
Regarding uncertainty, in real-life markets it is very difficult to determine whenany specific issue becomes special and how long it maintains such status. In theUnited States, it is relatively easy to identify which issue becomes special since therepo spread tends to follow a predictable pattern. In Japan, in contrast, due partly tothe fact that the JGB holdings are concentrated at a handful of institutions, someissues become special unexpectedly.27 Furthermore, regarding the on-the-run JGBissues, the absence of a WI market implies that dealers must participate in auctionswithout much prior information on future demand conditions. This uncertainty maygive rise to inventory costs, which might add a risk premium to the repo spread.
As for the market-clearing assumption, we should note that actual repo transactionsare not conducted via open markets like stock exchanges, but on an over-the-counterbasis, normally over the telephone between bond dealers, securities firms, banks, and life insurance companies. In other words, market participants need to search tolocate appropriate counterparties. Furthermore, since transactions are negotiablebetween the parties concerned, the balance of bargaining power may influence termsand conditions.
83
The Japanese Repo Market: Theory and Evidence
27. In U.S. markets, there is a close relationship between the auction cycle and repo spreads. For details, see Keane (1996).

APPENDIX 1: SCALE OF THE JAPANESE REPO MARKET In Japan, there has been a financing method utilizing securities called a gensakitransaction. In gensaki transactions, as is the case with repo transactions, funds andsecurities are exchanged for a fixed period of time. However, market participantsdemanded further refinements of the gensaki transactions for the following reasons: (1) the gensaki transactions lacked an appropriate means of risk management againstprice fluctuations and default of counterparties during the contract period; and (2) the settlement of government bond transactions was shifting to the rolling methodin 1996.28,29 Under these circumstances, the repo market was launched in April 1996 toprovide investors with a market for investing surplus funds, and bond dealers such assecurities firms with a market for financing their portfolios, which includes a means ofcovering short positions. Initially, as of the end of December 1996, the outstandingbalance of the repo market stood at ¥8 trillion, which accounted for just 6 percent of the money market total (Appendix Figure 1). By the end of September 2001, however, the outstanding balance increased to ¥42 trillion, accounting for about 22 percent.30
Appendix Figure 2 shows the scale of the repo markets in the United States, theUnited Kingdom, and Japan in terms of the outstanding balance itself as well as itspercentage share to total government bonds outstanding. In the United States, whoserepo market has a long history with a vast number of participants, the outstanding
84 MONETARY AND ECONOMIC STUDIES/MARCH 2004
Percent Percent
Appendix Figure 1 Percentage Shares of the Short-Term Money Markets
CP8
CP12
TBs/FBs30
TBs/FBs41
Repo6 Repo
22
End ofDec. 1996
¥130 trillion
End ofSep. 2001
¥190 trillion
Call31
Call6
CD25
CD19
Sources: For CP: Bank of Japan. For repo: Japan Securities Dealers Association.For other categories: Bank of Japan, Financial and EconomicStatistics Monthly.
28. Under the rolling method, transactions are settled after a certain period of time from the contract date. Comparedwith the previous method, under which settlements were made on the 5th and 10th of each month, the rollingmethod is expected to reduce settlement risk by lowering the number of unsettled outstanding contracts.
29. For an outline and brief history of JGB borrowing/lending transactions, including the gensaki transactions, seeRepo Trading Research (2001).
30. The outstanding balance of the repo market is calculated as the average of the amounts lent and borrowed in repo transactions.

balance of the market stood at about ¥184 trillion (about US$1,500 billion), whichis more than four times the size of the Japanese market.31 The repo market in theUnited Kingdom, which was launched at roughly the same time as that in Japan, has an outstanding balance of about ¥22 trillion (about £116 billion at ¥190/£1),about half the size of the Japanese market.32 Whereas in both the United States and the United Kingdom, the outstanding balance of the repo market is about ¥900 billion per ¥1 trillion of government bonds, in Japan it is just ¥110 billion.This comparison may indicate that the Japanese repo market still has much room for further expansion.
85
The Japanese Repo Market: Theory and Evidence
31. In the United States, repo transactions started in 1918 when the Federal Reserve launched operations utilizingdiscounts on bankers’ acceptances (BAs). The primary market for BA discounts was in London at that time. Given the high costs, however, efforts were being made to establish a market in the United States. Against thisbackground, the Federal Reserve bought BA discounts with resale agreements, thereby providing funds at theofficial discount rate. These operations were the beginning of repo transactions. See Stigum (1989) for details.
32. In the United Kingdom, the volume of repo transactions utilizing U.S. Treasury bonds and German governmentbonds has increased since the launch of the Big Bang initiatives in 1986. Repo transactions utilizing U.K. govern-ment bonds, however, have been virtually limited to operations by the Bank of England. The U.K. repo markethas been opened to all market participants since January 1996. See Repo Trading Research (2001) for details.
[2] Percentage Share to Total GovernmentBonds Outstanding
Appendix Figure 2 Comparison of the Size of the Repo Markets
0
20
40
60
80
100
120
140
160
180
200
¥ trillions ¥ trillions
0.0
0.1
0.2
0.3
0.4
0.5
0.6
0.7
0.8
0.9
1.0
UnitedStates
UnitedKingdom
JapanUnitedStates
UnitedKingdom
Japan
184
4522
0.950.89
0.11
Note: The data for the United States and Japan are as of the end of March 2001. Thedata for the United Kingdom are as of the end of May 2001.
Sources: For the United States: Repo data: Board of Governors of the Federal Reserve System, Federal
Reserve Bulletin.Bond data: Board of Governors of the Federal Reserve System, Flow of
Funds Accounts.For the United Kingdom:
Repo data: Bank of England, Monetary and Financial Statistics.Bond data: Debt Management Office.
For Japan: Repo data: Japan Securities Dealers Association. Bond data: Bank of Japan, Flow of Funds Accounts.
[1] Outstanding Balances

APPENDIX 2: EXPLAINING THE GAP BETWEEN THE GS REPORATE AND UNCOLLATERALIZED INTEREST RATESAFTER THE INTRODUCTION OF RTGS
According to the simplest form of the no-arbitrage argument, when the GC repo anduncollateralized interest rates differ, profits can be made by raising funds at the lower of the two rates and investing them at the higher rate. In equilibrium, however,there would not be any arbitrage opportunities, and thus the rates should eventuallyconverge. Furthermore, as the GC repo rate is a collateralized rate, it should theo-retically be lower than any uncollateralized interest rates, which should include credit risk premiums.
As seen in Section II, however, the GC repo rate is generally higher than the uncollateralized interest rate. How can we explain this phenomenon? First, it hasbeen pointed out that since the introduction of RTGS33 in January 2001, settlementand collateral management costs for GC repo transactions have increased.34 Thesecosts can be regarded as invariable, at least in the short run. Figure 4 in Section II,however, shows that spreads between the GC repo and uncollateralized interest rates fluctuate over time. Thus, transaction costs alone do not seem to provide a satisfactory explanation for the movement of the spread.
Second, some have pointed out that the yield gap emerges because the length of time between contract date and settlement date differs between the GC repo and uncollateralized transactions. The settlement of repo transactions is usually conducted two days after the contract date, while uncollateralized call transactionsare settled on the contract date.35 This practice suggests that investment in the GC repo market against funding in the uncollateralized call market could generatethe yield gap because of uncertainty over the availability of funds two days later. To examine this hypothesis, in Appendix Figure 3 we plotted the difference between(1) the spread between the GC repo rate and the uncollateralized overnight (O/N)call rate, and (2) the spread between the uncollateralized tomorrow/next (T/N) callrate and the uncollateralized O/N call rate, multiplied by two.36 Here, the settlementdate of the uncollateralized T/N call rate is the contract date plus one day. The figureshows that after the introduction of RTGS, the former is constantly above the latter.It suggests that the GC repo rate is higher than the uncollateralized call rate, even ifthe difference in the settlement timing is taken into account.
The above is an attempt to interpret the yield gap between the GC repo and theuncollateralized call rate in terms of the differences in transaction practices. Giventhat current monetary policy keeps the uncollateralized call rate at a record low, however, it might be natural that the two rates should not converge. Therefore, let us now consider why the GC repo and the uncollateralized rates other than the
86 MONETARY AND ECONOMIC STUDIES/MARCH 2004
33. RTGS means the Bank of Japan’s real-time gross settlement system for current account deposits and JGBs.34. Compared with the previous designated-time net settlement, RTGS substantially reduces systemic risk. On the
other hand, it increases workloads and collateral management costs, since it involves real-time settlement and management of outstanding balances, in addition to an increase in the amount of funds and JGBs required for settlement.
35. For details, see Bank of Japan (2002).36. All are overnight rates.

call rates, such as the euro-yen rate, do not converge. We attempt to examine themechanism with special attention to the demand structure for funds in each market.
In the Japanese GC repo market, the main lenders are trust, city, long-term credit, and foreign banks, while main borrowers are securities firms. In the euro-yenmarket, on the other hand, both main lenders and borrowers are city, long-termcredit, and foreign banks. These banks can borrow funds in the call market, wherethe call rate is held down by monetary policy, and lend them in both the repo and euro-yen markets. Put differently, city, long-term credit, and foreign banks function as main fund-lenders in both markets, interacting with different agents in need of funds in each market. Thus, these banks can build arbitrage positionsusing the repo, euro, and call markets, each of which has a distinctive fund demand structure.
Next, let us take a look at the fund demand structure in each market. The mainborrowers in the euro-yen market, that is, city, long-term credit, and foreign banks,have access to various markets other than the euro-yen market. In contrast, the mainborrowers in the repo market, securities firms, do not have any other major means toraise funds other than the repo market. Thus, it is extremely difficult for securitiesfirms to search for more competitive funding means even if unfavorable rates areoffered in the repo market. Their negotiating power vis-à-vis lenders is likely to beweak, which implies that the interest-rate elasticity of demand is low. Moreover, sincethe introduction of RTGS, the incentive to reduce settlement volume has led to anincrease in direct deals, resulting in a tendency among market participants to conduct
87
The Japanese Repo Market: Theory and Evidence
Appendix Figure 3 Still-High Level of the GC Repo Rate after Adjustment for theTime Differences in Settlement
–0.03
–0.02
–0.01
0.00
0.01
0.02
0.03
After the introduction of RTGS
Jan.2000
Apr.2000
July2000
Oct.2000
Jan.01
Apr.01
July01
Percent
Note: The data are calculated as the 180-day moving average of the following formula: (GC repo rate − uncollateralized O/N call rate) − (uncollateralized T/N call rate − uncollateralized O/N call rate) × 2.
Source: Bank of Japan.

repo transactions with a limited number of known counterparties.37 The increase indirect deals has put securities firms in a more difficult position in finding competitivelenders, possibly weakening their power to negotiate further.
Given the above structure, let us now describe the optimal behavior for city, long-term credit, and foreign banks. What we employ here is a simple microeconomictool. Let Ri denote the interest rate, Qi quantity, MRi marginal return (i = 1 for therepo market and i = 2 for the euro-yen market), and MC marginal cost.38 We assumethat city, long-term credit, and foreign banks are risk neutral and try to maximizeprofits in each period. Their optimal strategy, as expressed in Appendix Figure 4,would be to offer the rate that satisfies the following condition:
MC = MR1 = MR 2.
If we let 1 and 2 (1 < 2) denote the interest-rate elasticity of demand for funds ineach market, then the marginal return can be expressed as follows:
1 1 MR1 = R1(1 − —) and MR 2 = R 2(1 − —). 1 2
Now, we obtain the following optimal condition:
1 1 R1(1 − —) = R 2(1 − —). 1 2
Thus, we find that 1 > 2 → R1 < R 2. This means that optimal behavior leads to thecondition that the greater the interest-rate elasticity of demand for funds, the lowerthe rate that will be offered.
The above discussion provides a useful viewpoint on the question “Why don’t ratesconverge despite active arbitrage trading between the two markets?” The argument thatinterest rates converge as a result of active arbitrage trading stems from the assumptionof perfect competition, which does not envisage lenders with market power. If suchlenders exist, lending more funds to the repo market beyond a certain point in the name of arbitrage trading turns out to be sub-optimal in that it only leads to a declinein profits for them.
88 MONETARY AND ECONOMIC STUDIES/MARCH 2004
37. See Bank of Japan (2002).38. Lenders (city, long-term credit, and foreign banks) are the same in both markets, and thus marginal cost is set at
a level equivalent to the call rate.

89
The Japanese Repo Market: Theory and Evidence
Appendix Figure 4 Interest Rate Discrimination Strategy for a Lender of Funds
Ri
R2D1
R1
D2
MR2 MR1
MC (call rate)
Q2Q1
0
Euro-yen market Repo market

Bank for International Settlements, “Market Liquidity: Further Findings and Selected PolicyImplications,” 1999a.
———, “Implications of Repo Markets for Central Banks,” 1999b.Bank of Japan, Financial Markets Department, “RTGS-ka go no Kin’yu Shijo no Kino ni Kansuru
Rebyu (A Review of the Financial Market Functioning after the Introduction of the RTGSSystem),” Market Review, 2002-J-1, Market Policies Group, Money and Capital MarketsDivision, February, 2002 (in Japanese).
Buraschi, Andrea, and Davide Menini, “Liquidity Risk and Special Repos: How Well Do Forward RepoSpreads Price Future Specialness?” Journal of Financial Economics, 64 (2), 2002, pp. 243–284.
Duffie, Darrell, “Special Repo Rates,” Journal of Finance, 51 (2), 1996, pp. 493–526.Griffiths, Mark, and Drew Winters, “The Effect of Federal Reserve Accounting Rules on the
Equilibrium Level of Overnight Repo Rates,” Journal of Business Finance and Accounting, 24(6), 1997, pp. 815–832.
Hull, John, Options, Futures, and Other Derivatives, 4th edition, Prentice Hall, 2000.Jordan, Bradford, and Susan Jordan, “Special Repo Rates: An Empirical Analysis,” Journal of Finance,
52 (5), 1997, pp. 2051–2072.Keane, Frank, “Repo Rate Patterns for New Treasury Notes,” Current Issues in Economics and Finance,
2 (10), Federal Reserve Bank of New York, 1996.Krishnamurthy, Arvind, “The Bond/Old-Bond Special,” mimeo, Northwestern University, 2001.McCulloch, Huston, “The Tax Adjusted Yield Curve,” Journal of Finance, 30 (3), 1975, pp. 811–830.Repo Trading Research, Saishin Repo Torihiki no Subete (An Introduction to Practical Finance: The
Latest Book on Repo Transactions), Nihonjitsugyo Shuppansha, Tokyo, 2001 (in Japanese). Shigemi, Yosuke, Sotaro Kato, Yutaka Soejima, and Tokiko Shimizu, “Market Participants’ Behavior
and Pricing Mechanisms in the JGB Markets: Analysis of Market Developments from the Endof 1998 to 1999,” Financial Markets Department Working Paper 01-E-1, Bank of Japan, 2001.
Stigum, Marcia, The Repo and Reverse Markets, New York: Irwin, 1989.
90 MONETARY AND ECONOMIC STUDIES/MARCH 2004
References