Embed Size (px)
Citation preview

The irr PackageJune 16, 2007
Version 0.70
Date 2007-06-15
Title Various Coefficients of Interrater Reliability and Agreement
Author Matthias Gamer <[email protected]>, Jim Lemon <[email protected]>, Ian Fellows<[email protected]>
Depends R (>= 1.8.0)
Description Coefficients of Interrater Reliability and Agreement for quantitative, ordinal and nominaldata: ICC, Finn-Coefficient, Robinson’A, Kendall’s W, Cohen’s Kappa, ...
Maintainer Matthias Gamer <[email protected]>
License GNU General Public License version 2 or newer
URL http://www.r-project.org
R topics documented:N.cohen.kappa . . . . . . . . . . . . . . . . . . . . . . . . . . . . . . . . . . . . . . . 2agree . . . . . . . . . . . . . . . . . . . . . . . . . . . . . . . . . . . . . . . . . . . . . 3anxiety . . . . . . . . . . . . . . . . . . . . . . . . . . . . . . . . . . . . . . . . . . . . 4bhapkar . . . . . . . . . . . . . . . . . . . . . . . . . . . . . . . . . . . . . . . . . . . 4diagnoses . . . . . . . . . . . . . . . . . . . . . . . . . . . . . . . . . . . . . . . . . . 6finn . . . . . . . . . . . . . . . . . . . . . . . . . . . . . . . . . . . . . . . . . . . . . 7icc . . . . . . . . . . . . . . . . . . . . . . . . . . . . . . . . . . . . . . . . . . . . . . 8iota . . . . . . . . . . . . . . . . . . . . . . . . . . . . . . . . . . . . . . . . . . . . . 10kappa2 . . . . . . . . . . . . . . . . . . . . . . . . . . . . . . . . . . . . . . . . . . . . 12kappam.fleiss . . . . . . . . . . . . . . . . . . . . . . . . . . . . . . . . . . . . . . . . 13kappam.light . . . . . . . . . . . . . . . . . . . . . . . . . . . . . . . . . . . . . . . . 15kendall . . . . . . . . . . . . . . . . . . . . . . . . . . . . . . . . . . . . . . . . . . . . 16kripp.alpha . . . . . . . . . . . . . . . . . . . . . . . . . . . . . . . . . . . . . . . . . 17maxwell . . . . . . . . . . . . . . . . . . . . . . . . . . . . . . . . . . . . . . . . . . . 19meancor . . . . . . . . . . . . . . . . . . . . . . . . . . . . . . . . . . . . . . . . . . . 20meanrho . . . . . . . . . . . . . . . . . . . . . . . . . . . . . . . . . . . . . . . . . . . 21
1
2 N.cohen.kappa
print.icclist . . . . . . . . . . . . . . . . . . . . . . . . . . . . . . . . . . . . . . . . . 22print.irrlist . . . . . . . . . . . . . . . . . . . . . . . . . . . . . . . . . . . . . . . . . . 23rater.bias . . . . . . . . . . . . . . . . . . . . . . . . . . . . . . . . . . . . . . . . . . . 24robinson . . . . . . . . . . . . . . . . . . . . . . . . . . . . . . . . . . . . . . . . . . . 25stuart.maxwell.mh . . . . . . . . . . . . . . . . . . . . . . . . . . . . . . . . . . . . . . 26video . . . . . . . . . . . . . . . . . . . . . . . . . . . . . . . . . . . . . . . . . . . . 27vision . . . . . . . . . . . . . . . . . . . . . . . . . . . . . . . . . . . . . . . . . . . . 28
Index 29
N.cohen.kappa Sample Size Calculation for Cohen’s Kappa Statistic
Description
This function is a sample size estimator for the Cohen’s Kappa statistic for a binary outcome. Notethat any value of "hypokappa" in the interval [0,1] is acceptable (i.e. Kappa=0 is a valid nullhypothesis).
Usage
N.cohen.kappa(rate1, rate2, kappa, hypokappa, power=.8, alpha=.05, twosided=FALSE)
Arguments
rate1 The probability that the first rater will record a positive diagnosis
rate2 The probability that the second rater will record a positive diagnosis
kappa The true Cohen’s Kappa statistic
hypokappa The value of kappa under the null hypothesis
alpha Type I error of test
power The desired power to detect the difference between kappa and hypokappa
twosided TRUE if test is two-sided
Value
returns required sample size
Author(s)
Ian Fellows 〈[email protected]〉
References
Cantor, A. B. (1996) Sample-size calculation for Cohen’s kappa. Psychological Methods, 1, 150-153.
agree 3
See Also
kappa2
Examples
# Testing H0: kappa = 0.7 vs. HA: kappa > 0.7 given that# kappa = 0.85 and both raters classify 50N.cohen.kappa(0.5, 0.5, 0.7, 0.85)
agree Simple and extended percentage agreement
Description
Computes simple and extended percentage agreement among raters.
Usage
agree(ratings, tolerance=0)
Arguments
ratings n*m matrix or dataframe, n subjects m raters.
tolerance number of successive rating categories that should be regarded as rater agree-ment (see details).
Details
Missing data are omitted in a listwise way.Using extended percentage agreement (tolerance!=0) is only possible for numerical values. If tol-erance equals 1, for example, raters differing by one scale degree are interpreted as agreeing.
Value
A list with class ’"irrlist"’ containing the following components:
$method a character string describing the method applied for the computation of interraterreliability.
$subjects the number of subjects examined.
$raters the number of raters.
$irr.name a character string specifying the name of the coefficient.
$value coefficient of interrater reliability.
Author(s)
Matthias Gamer
4 anxiety
See Also
kappa2, kappam.fleiss, kappam.light
Examples
data(video)agree(video) # Simple percentage agreementagree(video, 1) # Extended percentage agreement
anxiety Anxiety ratings by different raters
Description
The data frame contains the anxiety ratings of 20 subjects, rated by 3 raters. Values are rangingfrom 1 (not anxious at all) to 6 (extremely anxious).
Usage
data(anxiety)
Format
A data frame with 20 observations on the following 3 variables.
rater1 ratings of the first rater
rater2 ratings of the second rater
rater3 ratings of the third rater
Source
artificial data
Examples
data(anxiety)apply(anxiety,2,table)
bhapkar 5
bhapkar Bhapkar coefficient of concordance between raters
Description
Calculates the Bhapkar coefficient of concordance for two raters.
Usage
bhapkar(ratings)
Arguments
ratings n*2 matrix or dataframe, n subjects 2 raters.
Details
Missing data are omitted in a listwise way. The Bhapkar (1966) test is a more powerful alternativeto the Stuart-Maxwell test. Both tests are asymptotically equivalent and will produce comparablechi-squared values when applied a large sample of rated objects.
Value
A list with class "irrlist" containing the following components:
$method a character string describing the method.
$subjects the number of data objects.
$raters the number of raters.
$irr.name the name of the coefficient (Chisq).
$value the value of the coefficient.
$stat.name the name and df of the test statistic.
$statistic the value of the test statistic.
$p.value the probability of the test statistic.
Author(s)
Matthias Gamer
References
Bhapkar, V.P. (1966). A note on the equivalence of two test criteria for hypotheses in categoricaldata. Journal of the American Statistical Association, 61, 228-235.
See Also
mcnemar.test, stuart.maxwell.mh, rater.bias
6 diagnoses
Examples
data(vision)bhapkar(vision) # Original example used from Bhapkar (1966)
diagnoses Psychiatric diagnoses provided by different raters
Description
Psychiatric diagnoses of n=30 patients provided by different sets of m=6 raters. Data were used byFleiss (1971) to illustrate the computation of Kappa for m raters.
Usage
data(diagnoses)
Format
A data frame with 30 observations (psychiatric diagnoses with levels 1. Depression, 2. PersonalityDisorder, 3. Schizophrenia, 4. Neurosis, 5. Other) on 6 variables representing different raters.
rater1 a factor including the diagnoses of rater 1 (levels see above)
rater2 a factor including the diagnoses of rater 2 (levels see above)
rater3 a factor including the diagnoses of rater 3 (levels see above)
rater4 a factor including the diagnoses of rater 4 (levels see above)
rater5 a factor including the diagnoses of rater 5 (levels see above)
rater6 a factor including the diagnoses of rater 6 (levels see above)
Source
Fleiss, J.L. (1971). Measuring nominal scale agreement among many raters. Psychological Bulletin,76, 378-382.
References
Fleiss, J.L. (1971). Measuring nominal scale agreement among many raters. Psychological Bulletin,76, 378-382.
Examples
data(diagnoses)table(diagnoses[,1])

finn 7
finn Finn coefficient for oneway and twoway models
Description
Computes the Finn coefficient as an index of the interrater reliability of quantitative data. Addition-ally, F-test and confidence interval are computed.
Usage
finn(ratings, s.levels, model = c("oneway", "twoway"))
Arguments
ratings n*m matrix or dataframe, n subjects m raters.
s.levels the number of different rating categories.
model a character string specifying if a ’"oneway"’ model (default) with row effectsrandom, or a ’"twoway"’ model with column and row effects random should beapplied. You can specify just the initial letter.
Details
Missing data are omitted in a listwise way.The Finn coefficient is especially useful, when variance between raters is low (i.e. agreement ishigh).For the computation it could be specified if only the subjects are considered as random effects(’"oneway"’ model) or if subjects and raters are randomly chosen from a bigger pool of persons(’"twoway"’ model).
Value
A list with class ’"irrlist"’ containing the following components:
$method a character string describing the method applied for the computation of interraterreliability.
$subjects the number of subjects examined.
$raters the number of raters.
$irr.name a character string specifying the name of the coefficient.
$value coefficient of interrater reliability.
$stat.name a character string specifying the name and the df of the corresponding F-statistic.
$statistic the value of the test statistic.
$p.value the p-value for the test.
Author(s)
Matthias Gamer

8 icc
References
Finn, R.H. (1970). A note on estimating the reliability of categorical data. Educational and Psycho-logical Measurement, 30, 71-76.
See Also
icc, meancor, robinson
Examples
data(video)finn(video, 6, model="twoway")
icc Intraclass correlation coefficient (ICC) for oneway and twoway mod-els
Description
Computes single score or average score ICCs as an index of interrater reliability of quantitativedata. Additionally, F-test and confidence interval are computed.
Usage
icc(ratings, model = c("oneway", "twoway"),type = c("consistency", "agreement"),unit = c("single", "average"), r0 = 0, conf.level = 0.95)
Arguments
ratings n*m matrix or dataframe, n subjects m raters.
model a character string specifying if a ’"oneway"’ model (default) with row effectsrandom, or a ’"twoway"’ model with column and row effects random should beapplied. You can specify just the initial letter.
type a character string specifying if ’"consistency"’ (default) or ’"agreement"’ be-tween raters should be estimated. If a ’"oneway"’ model is used, only ’"consis-tency"’ could be computed. You can specify just the initial letter.
unit a character string specifying the unit of analysis: Must be one of ’"single"’(default) or ’"average"’. You can specify just the initial letter.
r0 specification of the null hypothesis r = r0.
conf.level confidence level of the interval.

icc 9
Details
Missing data are omitted in a listwise way.When considering which form of ICC is appropriate for an actual set of data, one has take severaldecisions (Shrout & Fleiss, 1979):
1. Should only the subjects be considered as random effects (’"oneway"’ model) or are subjectsand raters randomly chosen from a bigger pool of persons (’"twoway"’ model).
2. If differences in judges’ mean ratings are of interest, interrater ’"agreement"’ instead of ’"con-sistency"’ should be computed.
3. If the unit of analysis is a mean of several ratings, unit should be changed to ’"average"’. Inmost cases, however, single values (unit=’"single"’) are regarded.
Value
A list with class ’"icclist"’ containing the following components:
$subjects the number of subjects examined.
$raters the number of raters.
$model a character string describing the selected model for the analysis.
$type a character string describing the selected type of interrater reliability.
$unit a character string describing the unit of analysis.
$icc.name a character string specifying the name of ICC according to McGraw & Wong(1996).
$value the intraclass correlation coefficient.
$r0 the specified null hypothesis.
$Fvalue the value of the F-statistic.
$df1 the numerator degrees of freedom.
$df2 the denominator degrees of freedom.
$p.value the p-value for a two-sided test.
$conf.level the confidence level for the interval.
$lbound the lower bound of the confidence interval.
$ubound the upper bound of the confidence interval.
Author(s)
Matthias Gamer
References
Bartko, J.J. (1966). The intraclass correlation coefficient as a measure of reliability. PsychologicalReports, 19, 3-11.

10 iota
McGraw, K.O., & Wong, S.P. (1996), Forming inferences about some intraclass correlation co-efficients. Psychological Methods, 1, 30-46.
Shrout, P.E., & Fleiss, J.L. (1979), Intraclass correlation: uses in assessing rater reliability. Psy-chological Bulletin, 86, 420-428.
See Also
finn, meancor, robinson
Examples
data(anxiety)icc(anxiety, model="twoway", type="agreement")
r1 <- round(rnorm(20, 10, 4))r2 <- round(r1 + 10 + rnorm(20, 0, 2))r3 <- round(r1 + 20 + rnorm(20, 0, 2))icc(cbind(r1, r2, r3), "twoway") # High consistencyicc(cbind(r1, r2, r3), "twoway", "agreement") # Low agreement
iota iota coefficient for the interrater agreement of multivariate observa-tions
Description
Computes iota as an index of interrater agreement of quantitative or nominal multivariate observa-tions.
Usage
iota(ratings, scaledata = c("quantitative","nominal"),standardize = FALSE)
Arguments
ratings list of n*m matrices or dataframes with one list element for each variable, nsubjects m raters.
scaledata a character string specifying if the data is ’"quantitative"’ (default) or ’"nomi-nal"’. If the data is organized in factors, ’"nominal"’ is chosen automatically.You can specify just the initial letter.
standardize a logical indicating whether quantitative data should be z-standardized withineach variable before the computation of iota.

iota 11
Details
Each list element must contain observations for each rater and subject without missing values.In case of one categorical variable (only one list element), iota reduces to the Fleiss exact kappacoefficient, which was proposed by Conger (1980).
Value
A list with class ’"irrlist"’ containing the following components:
$method a character string describing the method applied for the computation of interraterreliability.
$subjects the number of subjects examined.$raters the number of raters.$irr.name a character string specifying the name of the coefficient.$value value of iota.$detail a character string specifying if the values were z-standardized before the com-
putation of iota.
Author(s)
Matthias Gamer
References
Conger, A.J. (1980). Integration and generalisation of Kappas for multiple raters. PsychologicalBulletin, 88, 322-328.
Janson, H., & Olsson, U. (2001). A measure of agreement for interval or nominal multivariateobservations. Educational and Psychological Measurement, 61, 277-289.
See Also
icc, kappam.fleiss
Examples
data(diagnoses)iota(list(diagnoses)) # produces the same result as...kappam.fleiss(diagnoses, exact=TRUE)
# Example from Janson & Olsson (2001), Table 1photo <- list()photo[[1]] <- cbind(c( 71, 73, 86, 59, 71), # weight ratings
c( 74, 80,101, 62, 83),c( 76, 80, 93, 66, 77))
photo[[2]] <- cbind(c(166,160,187,161,172), # height ratingc(171,170,174,163,182),c(171,165,185,162,181))
iota(photo)iota(photo, standardize=TRUE) # iota over standardized values
12 kappa2
kappa2 Cohen’s Kappa and weighted Kappa for two raters
Description
Calculates Cohen’s Kappa and weighted Kappa as an index of interrater agreement between 2 raterson categorical (or ordinal) data. Own weights for the various degrees of disagreement could bespecified.
Usage
kappa2(ratings, weight = c("unweighted", "equal", "squared"))
Arguments
ratings n*2 matrix or dataframe, n subjects 2 raters.
weight either a character string specifying one predifined set of weights or a numericvector with own weights (see details).
Details
Missing data are omitted in a listwise way.During computation, the diagnoses are converted to factors. Therefore, the categories are orderedaccordingly.Beneath ’"unweighted"’ (default), predifined sets of weights are ’"equal"’ (all levels disagreementbetween raters are weighted equally) and ’"squared"’ (disagreements are weighted according totheir squared distance from perfect agreement). The weighted Kappa coefficient with ’"squared"’weights equals the product moment correlation under certain conditions. Own weights could bespecified by supplying the function with a numeric vector of weights, starting from perfect agree-ment to worst disagreement. The length of this vector must equal the number of rating categories.
Value
A list with class ’"irrlist"’ containing the following components:
$method a character string describing the method and the weights applied for the compu-tation of weighted Kappa.
$subjects the number of subjects examined.
$raters the number of raters (=2).
$irr.name a character string specifying the name of the coefficient.
$value value of Kappa.
$stat.name a character string specifying the name of the corresponding test statistic.
$statistic the value of the test statistic.
$p.value the p-value for the test.
kappam.fleiss 13
Author(s)
Matthias Gamer
References
Cohen, J. (1960). A coefficient of agreement for nominal scales. Educational and PsychologicalMeasurement, 20, 37-46.
Cohen, J. (1968). Weighted kappa: Nominal scale agreement with provision for scaled disagree-ment or partial credit. Psychological Bulletin, 70, 213-220.
Fleiss, J.L., Cohen, J., & Everitt, B.S. (1969). Large sample standard errors of kappa and weightedkappa. Psychological Bulletin, 72, 323-327.
See Also
cor, kappa2, kappam.light
Examples
data(anxiety)kappa2(anxiety[,1:2], "squared") # predefined set of squared weightskappa2(anxiety[,1:2], (0:5)^2) # same result with own set of squared weights
# own weights increasing gradually with larger distance from perfect agreementkappa2(anxiety[,1:2], c(0,1,2,4,7,11))
data(diagnoses)# Unweighted Kappa for categorical data without a logical orderkappa2(diagnoses[,2:3])
kappam.fleiss Fleiss’ Kappa for m raters
Description
Computes Fleiss’ Kappa as an index of interrater agreement between m raters on categorical data.Additionally, category-wise Kappas could be computed.
Usage
kappam.fleiss(ratings, exact = FALSE, detail = FALSE)
Arguments
ratings n*m matrix or dataframe, n subjects m raters.exact a logical indicating whether the exact Kappa (Conger, 1980) or the Kappa de-
scribed by Fleiss (1971) should be computed.detail a logical indicating whether category-wise Kappas should be computed
14 kappam.fleiss
Details
Missing data are omitted in a listwise way.The coefficient described by Fleiss (1971) does not reduce to Cohen’s Kappa (unweighted) for m=2raters. Therefore, the exact Kappa coefficient, which is slightly higher in most cases, was proposedby Conger (1980).The null hypothesis Kappa=0 could only be tested using Fleiss’ formulation of Kappa.
Value
A list with class ’"irrlist"’ containing the following components:
$method a character string describing the method applied for the computation of interraterreliability.
$subjects the number of subjects examined.$raters the number of raters.$irr.name a character string specifying the name of the coefficient.$value value of Kappa.$stat.name a character string specifying the name of the corresponding test statistic.$statistic the value of the test statistic.$p.value the p-value for the test.$detail a table with category-wise kappas and the corresponding test statistics.
Author(s)
Matthias Gamer
References
Conger, A.J. (1980). Integration and generalisation of Kappas for multiple raters. PsychologicalBulletin, 88, 322-328.
Fleiss, J.L. (1971). Measuring nominal scale agreement among many raters. Psychological Bul-letin, 76, 378-382.
Fleiss, J.L., Levin, B., & Paik, M.C. (2003). Statistical Methods for Rates and Proportions, 3rdEdition. New York: John Wiley & Sons.
See Also
kappa2, kappam.light
Examples
data(diagnoses)kappam.fleiss(diagnoses) # Fleiss' Kappakappam.fleiss(diagnoses, exact=TRUE) # Exact Kappakappam.fleiss(diagnoses, detail=TRUE) # Fleiss' and category-wise Kappa
kappam.fleiss(diagnoses[,1:4]) # Fleiss' Kappa of raters 1 to 4

kappam.light 15
kappam.light Light’s Kappa for m raters
Description
Computes Light’s Kappa as an index of interrater agreement between m raters on categorical data.
Usage
kappam.light(ratings)
Arguments
ratings n*m matrix or dataframe, n subjects m raters.
Details
Missing data are omitted in a listwise way.Light’s Kappa equals the average of all possible combinations of bivariate Kappas between raters.
Value
A list with class ’"irrlist"’ containing the following components:
$method a character string describing the method applied for the computation of interraterreliability.
$subjects the number of subjects examined.
$raters the number of raters.
$irr.name a character string specifying the name of the coefficient.
$value value of Kappa.
$stat.name a character string specifying the name of the corresponding test statistic.
$statistic the value of the test statistic.
$p.value the p-value for the test.
Author(s)
Matthias Gamer
References
Conger, A.J. (1980). Integration and generalisation of Kappas for multiple raters. PsychologicalBulletin, 88, 322-328.
Light, R.J. (1971). Measures of response agreement for qualitative data: Some generalizationsand alternatives. Psychological Bulletin, 76, 365-377.
16 kendall
See Also
kappa2, kappam.fleiss
Examples
data(diagnoses)kappam.light(diagnoses) # Light's Kappa
kendall Kendall’s coefficient of concordance W
Description
Computes Kendall’s coefficient of concordance as an index of interrater reliability of ordinal data.The coefficient could be corrected for ties within raters.
Usage
kendall(ratings, correct = FALSE)
Arguments
ratings n*m matrix or dataframe, n subjects m raters.correct a logical indicating whether the coefficient should be corrected for ties within
raters.
Details
Missing data are omitted in a listwise way.Kendall’s W should be corrected for ties if raters did not use a true ranking order for the subjects.A test for the significance of Kendall’s W is only valid for large samples.
Value
A list with class ’"irrlist"’ containing the following components:
$method a character string describing the method applied for the computation of interraterreliability.
$subjects the number of subjects examined.$raters the number of raters.$irr.name a character string specifying the name of the coefficient.$value coefficient of interrater reliability.$stat.name a character string specifying the name and the df of the corresponding chi-
squared test.$statistic the value of the test statistic.$p.value the p-value for the test.$error the character string of a warning message if ties were found within raters.

kripp.alpha 17
Author(s)
Matthias Gamer
References
Kendall, M.G. (1948). Rank correlation methods. London: Griffin.
See Also
cor, meanrho
Examples
data(anxiety)kendall(anxiety, TRUE)
kripp.alpha Krippendorff’s alpha reliability coefficient
Description
Calculates the alpha coefficient of reliability proposed by Krippendorff (1980).
Usage
kripp.alpha(x, method = c("nominal", "ordinal", "interval", "ratio"))
Arguments
x n*m matrix or dataframe, n objects m raters.
method data level of ratings, you can specify just the initial letter.
Details
Value
A list with class ’"irrlist"’ containing the following components:
$method a character string describing the method.
$subjects the number of data objects.
$raters the number of raters.
$irr.name a character string specifying the name of the coefficient.
$value value of alpha.
$stat.name here "nil" as there is no test statistic.
18 kripp.alpha
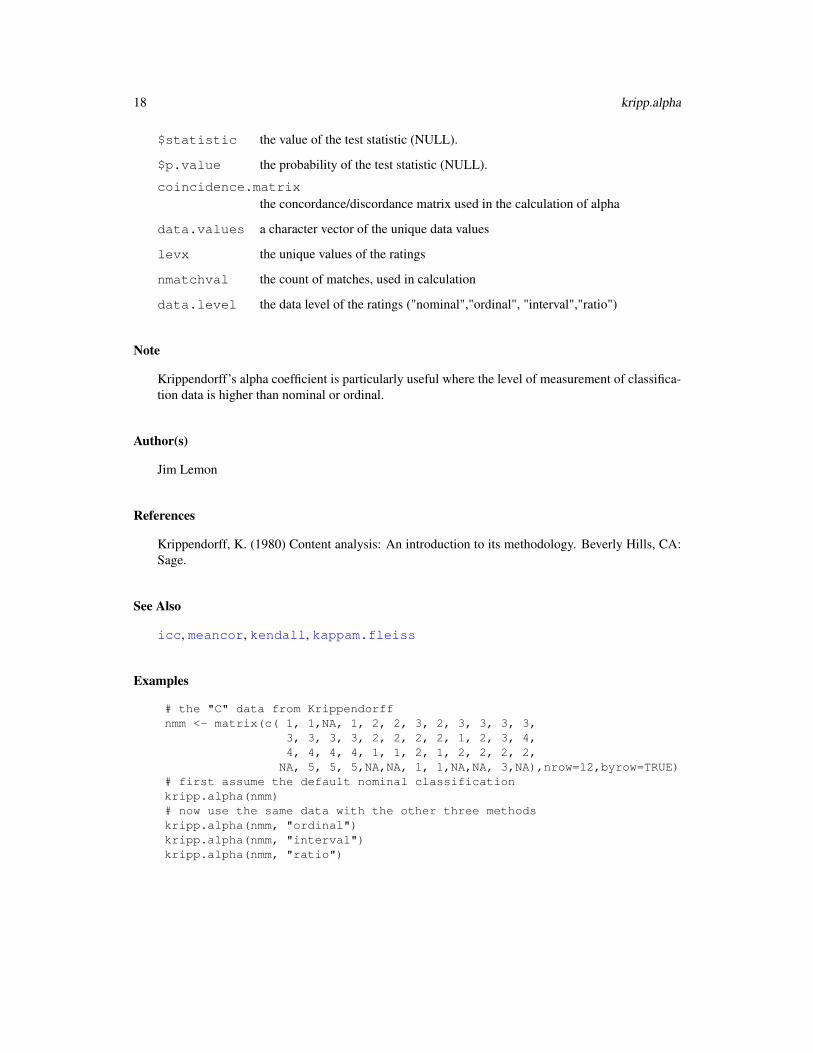
$statistic the value of the test statistic (NULL).
$p.value the probability of the test statistic (NULL).
coincidence.matrixthe concordance/discordance matrix used in the calculation of alpha
data.values a character vector of the unique data values
levx the unique values of the ratings
nmatchval the count of matches, used in calculation
data.level the data level of the ratings ("nominal","ordinal", "interval","ratio")
Note
Krippendorff’s alpha coefficient is particularly useful where the level of measurement of classifica-tion data is higher than nominal or ordinal.
Author(s)
Jim Lemon
References
Krippendorff, K. (1980) Content analysis: An introduction to its methodology. Beverly Hills, CA:Sage.
See Also
icc, meancor, kendall, kappam.fleiss
Examples
# the "C" data from Krippendorffnmm <- matrix(c( 1, 1,NA, 1, 2, 2, 3, 2, 3, 3, 3, 3,
3, 3, 3, 3, 2, 2, 2, 2, 1, 2, 3, 4,4, 4, 4, 4, 1, 1, 2, 1, 2, 2, 2, 2,NA, 5, 5, 5,NA,NA, 1, 1,NA,NA, 3,NA),nrow=12,byrow=TRUE)
# first assume the default nominal classificationkripp.alpha(nmm)# now use the same data with the other three methodskripp.alpha(nmm, "ordinal")kripp.alpha(nmm, "interval")kripp.alpha(nmm, "ratio")
maxwell 19
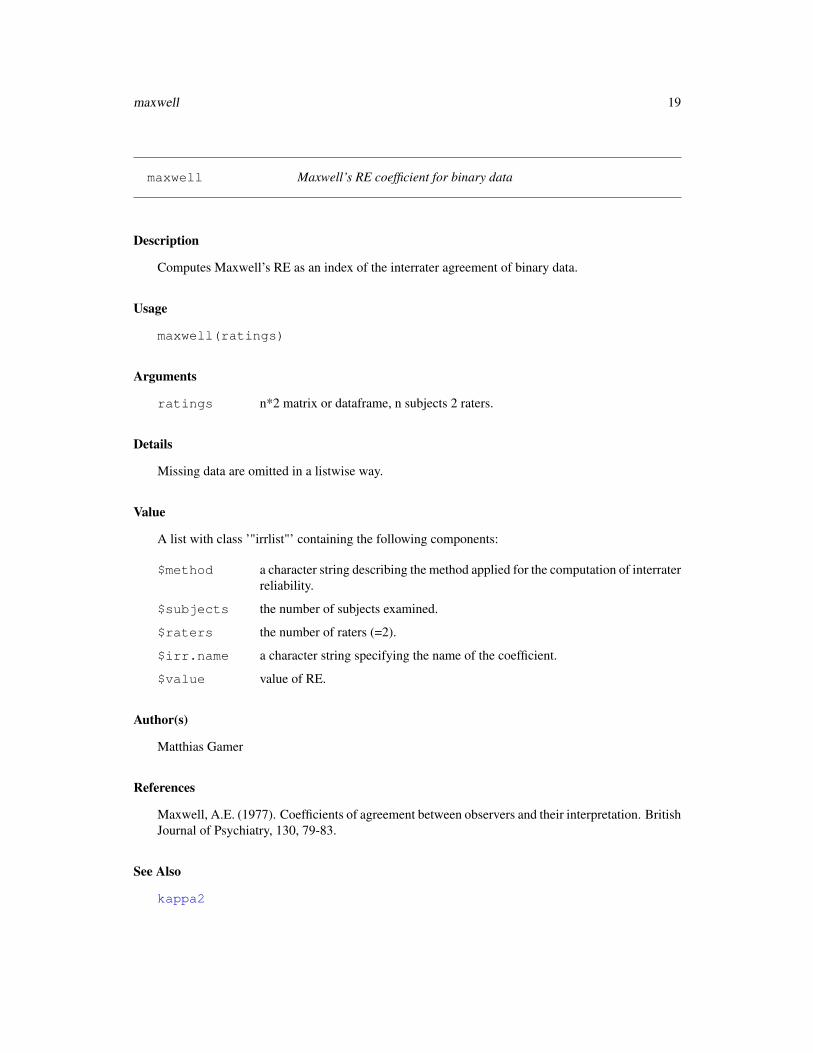
maxwell Maxwell’s RE coefficient for binary data
Description
Computes Maxwell’s RE as an index of the interrater agreement of binary data.
Usage
maxwell(ratings)
Arguments
ratings n*2 matrix or dataframe, n subjects 2 raters.
Details
Missing data are omitted in a listwise way.
Value
A list with class ’"irrlist"’ containing the following components:
$method a character string describing the method applied for the computation of interraterreliability.
$subjects the number of subjects examined.
$raters the number of raters (=2).
$irr.name a character string specifying the name of the coefficient.
$value value of RE.
Author(s)
Matthias Gamer
References
Maxwell, A.E. (1977). Coefficients of agreement between observers and their interpretation. BritishJournal of Psychiatry, 130, 79-83.
See Also
kappa2

20 meancor
Examples
data(anxiety)# Median-split to generate binary datar1 <- ifelse(anxiety$rater1<median(anxiety$rater1),0,1)r2 <- ifelse(anxiety$rater2<median(anxiety$rater2),0,1)maxwell(cbind(r1,r2))
meancor Mean of bivariate correlations between raters
Description
Computes the mean of bivariate Pearson’s product moment correlations between raters as an indexof the interrater reliability of quantitative data.
Usage
meancor(ratings, fisher = TRUE)
Arguments
ratings n*m matrix or dataframe, n subjects m raters.
fisher a logical indicating whether the correlation coefficients should be Fisher z-standardized before averaging.
Details
Missing data are omitted in a listwise way.The mean of bivariate correlations should not be used as an index of interrater reliability when thevariance of ratings differs between raters.The null hypothesis r=0 could only be tested when Fisher z-standardized values are used for theaveraging.When computing Fisher z-standardized values, perfect correlations are omitted before averagingbecause z equals +/-Inf in that case.
Value
A list with class ’"irrlist"’ containing the following components:
$method a character string describing the method applied for the computation of interraterreliability.
$subjects the number of subjects examined.
$raters the number of raters.
$irr.name a character string specifying the name of the coefficient.
$value coefficient of interrater reliability.
$stat.name a character string specifying the name of the corresponding test statistic.

meanrho 21
$statistic the value of the test statistic.
$p.value the p-value for the test.
$error a character string specifying whether correlations were dropped before the com-putation of the Fisher z-standardized average.
Author(s)
Matthias Gamer
See Also
cor
Examples
data(anxiety)meancor(anxiety)
meanrho Mean of bivariate rank correlations between raters
Description
Computes the mean of bivariate Spearman’s rho rank correlations between raters as an index of theinterrater reliability of ordinal data.
Usage
meanrho(ratings, fisher = TRUE)
Arguments
ratings n*m matrix or dataframe, n subjects m raters.
fisher a logical indicating whether the correlation coefficients should be Fisher z-standardized before averaging.
Details
Missing data are omitted in a listwise way.The mean of bivariate rank correlations should not be used as an index of interrater reliability whenties within raters occur.The null hypothesis r=0 could only be tested when Fisher z-standardized values are used for theaveraging.When computing Fisher z-standardized values, perfect correlations are omitted before averagingbecause z equals +/-Inf in that case.
22 print.icclist
Value
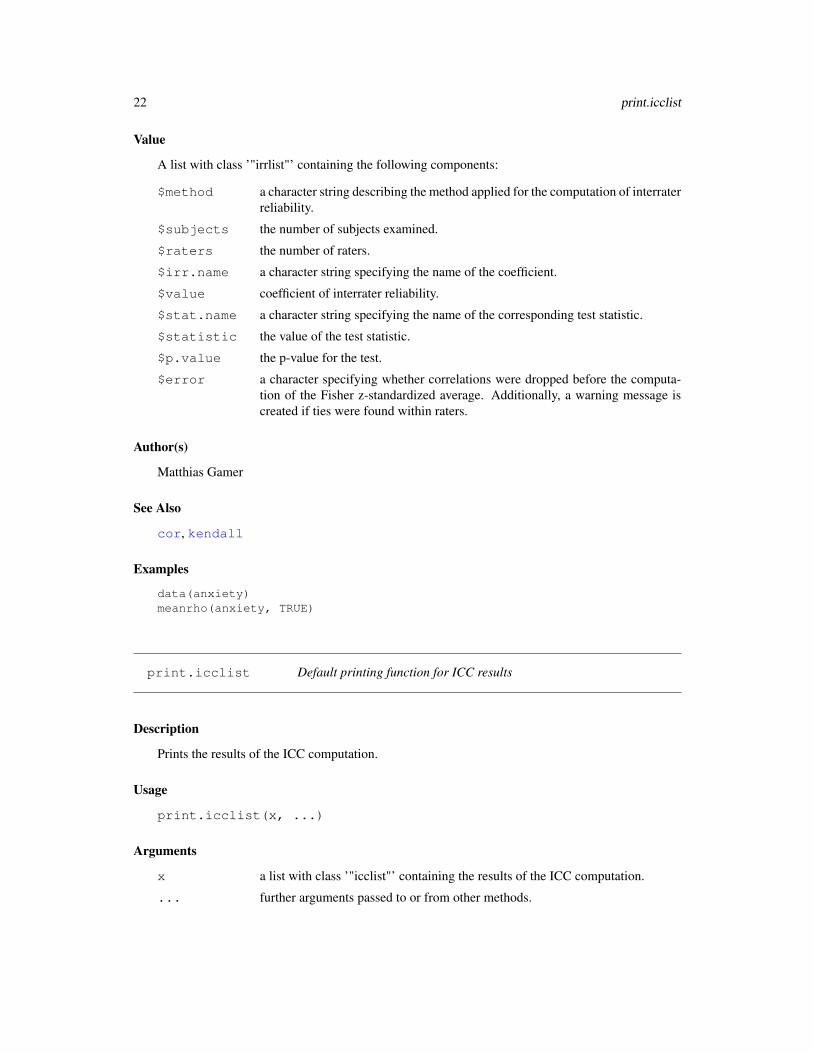
A list with class ’"irrlist"’ containing the following components:
$method a character string describing the method applied for the computation of interraterreliability.
$subjects the number of subjects examined.
$raters the number of raters.
$irr.name a character string specifying the name of the coefficient.
$value coefficient of interrater reliability.
$stat.name a character string specifying the name of the corresponding test statistic.
$statistic the value of the test statistic.
$p.value the p-value for the test.
$error a character specifying whether correlations were dropped before the computa-tion of the Fisher z-standardized average. Additionally, a warning message iscreated if ties were found within raters.
Author(s)
Matthias Gamer
See Also
cor, kendall
Examples
data(anxiety)meanrho(anxiety, TRUE)
print.icclist Default printing function for ICC results
Description
Prints the results of the ICC computation.
Usage
print.icclist(x, ...)
Arguments
x a list with class ’"icclist"’ containing the results of the ICC computation.
... further arguments passed to or from other methods.
print.irrlist 23
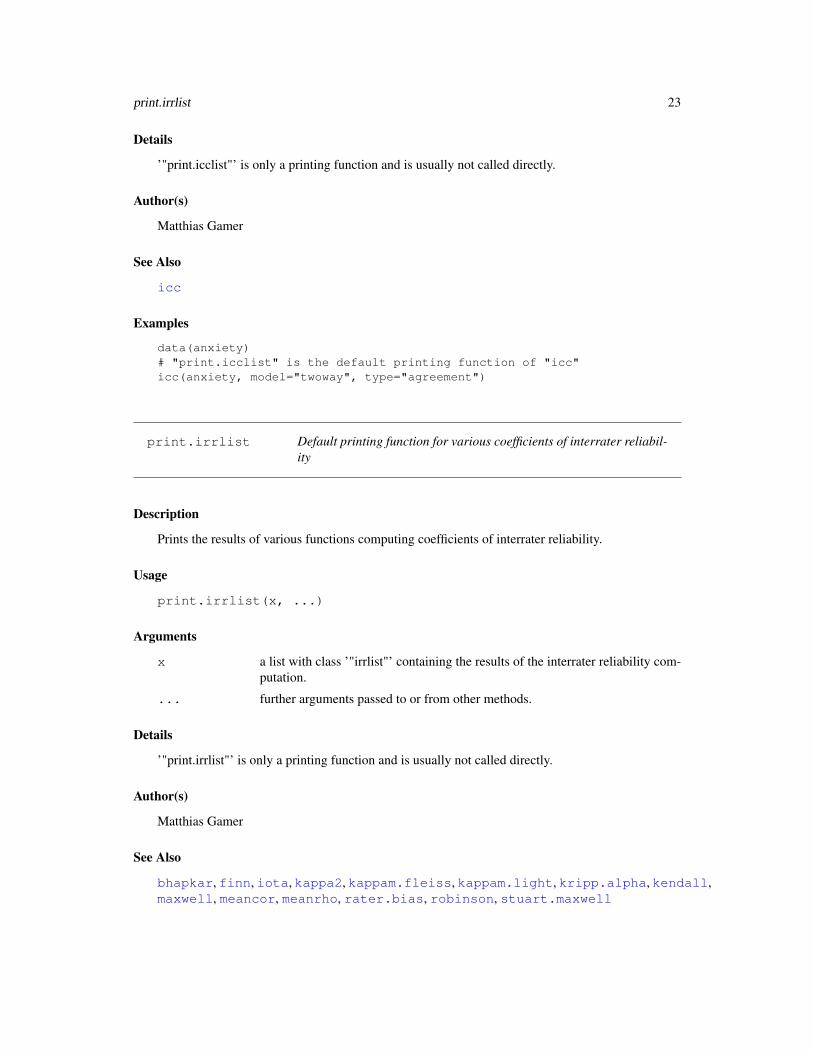
Details
’"print.icclist"’ is only a printing function and is usually not called directly.
Author(s)
Matthias Gamer
See Also
icc
Examples
data(anxiety)# "print.icclist" is the default printing function of "icc"icc(anxiety, model="twoway", type="agreement")
print.irrlist Default printing function for various coefficients of interrater reliabil-ity
Description
Prints the results of various functions computing coefficients of interrater reliability.
Usage
print.irrlist(x, ...)
Arguments
x a list with class ’"irrlist"’ containing the results of the interrater reliability com-putation.
... further arguments passed to or from other methods.
Details
’"print.irrlist"’ is only a printing function and is usually not called directly.
Author(s)
Matthias Gamer
See Also
bhapkar, finn, iota, kappa2, kappam.fleiss, kappam.light, kripp.alpha, kendall,maxwell, meancor, meanrho, rater.bias, robinson, stuart.maxwell
24 rater.bias
Examples
data(anxiety)# "print.irrlist" is the default printing method of various functions, e.g.finn(anxiety, 6)meancor(anxiety)
rater.bias Coefficient of rater bias
Description
Calculates a coefficient of systematic bias between two raters.
Usage
rater.bias(x)
Arguments
x c x c classification matrix or 2 x n or n x 2 matrix of classification scores into ccategories.
Details
rater.bias calculates a reliability coefficient for two raters classifying n objects into any num-ber of categories. It will accept either a c x c classification matrix of counts of objects falling into ccategories or a 2 x n or n x 2 matrix of classification scores.The function returns the absolute value of the triangular off-diagnonal sum ratio of the cxc classi-fication table and the corresponding test statistic. A systematic bias between raters can be assumedwhen the ratio substantially deviates from 0.5 while yielding a significant Chi-squared statistic.
Value
method Name of the method
subjects Number of subjects
raters Number of raters (2)
irr.name Name of the coefficient: ratio of triangular off-diagnonal sums
value Value of the coefficient
stat.name Name of the test statistic
statistic Value of the test statistic
p.value the probability of the df 1 Chi-square variable
Author(s)
Jim Lemon
robinson 25
References
Bishop Y.M.M., Fienberg S.E., & Holland P.W. (1978) Discrete multivariate analysis: theory andpractice. Cambridge, Massachusetts: MIT Press.
See Also
mcnemar.test
Examples
# fake a 2xn matrix of three way classification scoresratings <- matrix(sample(1:3,60,TRUE), nrow=2)rater.bias(ratings)
# Example from Bishop, Fienberg & Holland (1978), Table 8.2-1data(vision)rater.bias(vision)
robinson Robinson’s A
Description
Computes Robinson’s A as an index of the interrater reliability of quantitative data.
Usage
robinson(ratings)
Arguments
ratings n*m matrix or dataframe, n subjects m raters.
Details
Missing data are omitted in a listwise way.
Value
A list with class ’"irrlist"’ containing the following components:
$method a character string describing the method applied for the computation of interraterreliability.
$subjects the number of subjects examined.
$raters the number of raters.
$irr.name a character string specifying the name of the coefficient.
$value coefficient of interrater reliability.

26 stuart.maxwell.mh
Author(s)
Matthias Gamer
References
Robinson, W.S. (1957). The statistical measurement of agreement. American Sociological Review,22, 17-25.
See Also
finn, icc, meancor
Examples
data(anxiety)robinson(anxiety)
stuart.maxwell.mh Stuart-Maxwell coefficient of concordance for two raters
Description
Calculates the Stuart-Maxwell coefficient of concordance for two raters.
Usage
stuart.maxwell.mh(x)
Arguments
x c x c classification matrix or matrix of classification scores into c categories.
Details
stuart.maxwell.mh calculates a reliability coefficient for two raters classifying n objects intoany number of categories. It will accept either a c x c classification matrix of counts of objectsfalling into c categories or a c x n or n x c matrix of classification scores.
Value
A list with class "irrlist" containing the following components:
$method a character string describing the method.
$subjects the number of data objects.
$raters the number of raters.
$irr.name the name of the coefficient (Chisq).
$value the value of the coefficient.
video 27
$stat.name the name and df of the test statistic.$statistic the value of the test statistic.$p.value the probability of the test statistic.
Author(s)
Jim Lemon
References
Stuart A.A. (1955) A test for homogeneity of the marginal distributions in a two-way classification.Biometrika, 42, 412-416.
Maxwell A.E. (1970) Comparing the classification of subjects by two independent judges. BritishJournal of Psychiatry, 116, 651-655.
See Also
bhapkar, rater.bias
Examples
# fake a 2xn matrix of three way classification scoresratings<-matrix(sample(1:3,60,TRUE), nrow=2)stuart.maxwell.mh(ratings)
# Example used from Stuart (1955)data(vision)stuart.maxwell.mh(vision)
video Different raters judging the credibility of videotaped testimonies
Description
The data frame contains the credibility ratings of 20 subjects, rated by 4 raters. Judgements coulyvary from 1 (not credible) to 6 (highly credible). Variance between and within raters is low.
Usage
data(video)
Format
A data frame with 20 observations on the following 4 variables.
rater1 ratings of rater 1rater2 ratings of rater 2rater3 ratings of rater 3rater4 ratings of rater 4
28 vision
Source
artificial data
Examples
data(video)apply(video,2,table)
vision Eye-testing case records
Description
Case records of the eye-testing of N=7477 female employees in Royal Ordnance factories between1943 and 1946. Data were primarily used by Stuart (1953) to illustrate the the estimation andcomparison of strengths of association in contingency tables.
Usage
data(anxiety)
Format
A data frame with 7477 observations (eye testing results with levels 1st grade, 2nd grade, 3rd grade,4th Grade) on the following 2 variables.
r.eye unaided distance vision performance of the right eye
l.eye unaided distance vision performance of the left eye
Source
Stuart, A. (1953). The Estimation and Comparison of Strengths of Association in ContingencyTables. Biometrika, 40, 105-110.
References
Stuart, A. (1953). The Estimation and Comparison of Strengths of Association in ContingencyTables. Biometrika, 40, 105-110.
Examples
data(vision)table(vision$r.eye, vision$l.eye)

Index
∗Topic datasetsanxiety, 3diagnoses, 5video, 27vision, 28
∗Topic miscbhapkar, 4kripp.alpha, 17N.cohen.kappa, 1rater.bias, 24stuart.maxwell.mh, 26
∗Topic printprint.icclist, 22print.irrlist, 23
∗Topic univaragree, 2finn, 6icc, 7iota, 9kappa2, 11kappam.fleiss, 13kappam.light, 14kendall, 15maxwell, 18meancor, 19meanrho, 21robinson, 25
agree, 2anxiety, 3
bhapkar, 4, 23, 27
cor, 12, 16, 20, 22
diagnoses, 5
finn, 6, 9, 23, 26
icc, 7, 7, 10, 18, 22, 26iota, 9, 23
kappa2, 2, 3, 11, 12, 14, 15, 19, 23kappam.fleiss, 3, 10, 13, 15, 18, 23kappam.light, 3, 12, 14, 14, 23kendall, 15, 18, 22, 23kripp.alpha, 17, 23
maxwell, 18, 23mcnemar.test, 5, 25meancor, 7, 9, 18, 19, 23, 26meanrho, 16, 21, 23
N.cohen.kappa, 1
print.icclist, 22print.irrlist, 23
rater.bias, 5, 23, 24, 27robinson, 7, 9, 23, 25
stuart.maxwell, 23stuart.maxwell.mh, 5, 26
video, 27vision, 28
29


![TheRelationshipbetweenSideofOnsetandCerebralRegional ...2.4.ReHoCalculations. ReHo maps were generated using RESTPlusV1.2,withtheprocedurespublishedpreviously [29]. Kendall’s coefficient](https://img.pdfslide.us/doc/110x75/60c5627e811fd00c785dc493/therelationshipbetweensideofonsetandcerebralregional-24rehocalculations-reho.jpg)


![Welcome! [archive.apnic.net]archive.apnic.net › meetings › 18 › docs › tuts › tut-pres-irr.pdf– Knowledgeable about BGP routing – Familiar with basic APNIC database operations](https://img.pdfslide.us/doc/110x75/60d37ce18250a05b8c18f773/welcome-a-meetings-a-18-a-docs-a-tuts-a-tut-pres-irrpdf-a-knowledgeable.jpg)