Embed Size (px)
Citation preview

The Irish potato famine pathogen Phytophthora infestans originated in central Mexico rather than the Andes
Goss, E. M., Tabima, J. F., Cooke, D. E. L., Restrepo, S., Fry, W. E., Forbes, G. A., ... & Grünwald, N. J. (2014). The Irish potato famine pathogen Phytophthora infestans originated in central Mexico rather than the Andes. Proceedings of the National Academy of Sciences, 111(24). doi:10.1073/pnas.1401884111
10.1073/pnas.1401884111
National Academy of Sciences
Version of Record
http://cdss.library.oregonstate.edu/sa-termsofuse

The Irish potato famine pathogen Phytophthorainfestans originated in central Mexico rather thanthe AndesErica M. Gossa, Javier F. Tabimab, David E. L. Cookec, Silvia Restrepod, William E. Frye, Gregory A. Forbesf,Valerie J. Fielandb, Martha Cardenasd, and Niklaus J. Grünwaldg,h,1
aDepartment of Plant Pathology and Emerging Pathogens Institute, University of Florida, Gainesville, FL 32611; bDepartment of Botany and Plant Pathology,Oregon State University, Corvallis, OR 97331; cThe James Hutton Institute, Invergowrie, Dundee DD2 5DA, Scotland; dDepartment of Biological Sciences,University of the Andes, 110321 Bogota, Colombia; eDepartment of Plant Pathology and Plant-Microbe Biology, Cornell University, Ithaca, NY 14853; fCIPChina Center for Asia and the Pacific, International Potato Center, Beijing 100081, China; gHorticultural Crops Research Laboratory, US Department ofAgriculture Agricultural Research Service, Corvallis, OR 97330; and hDepartment of Botany and Plant Pathology and Center for Genome Biology andBiocomputing, Oregon State University, Corvallis, OR 97331
Edited by Detlef Weigel, Max Planck Institute for Developmental Biology, Tübingen, Germany, and approved May 6, 2014 (received for reviewJanuary 30, 2014)
Phytophthora infestans is a destructive plant pathogen best knownfor causing the disease that triggered the Irish potato famine andremains the most costly potato pathogen to manage worldwide.Identification of P. infestan’s elusive center of origin is critical tounderstanding the mechanisms of repeated global emergence ofthis pathogen. There are two competing theories, placing the originin either South America or in central Mexico, both of which arecenters of diversity of Solanum host plants. To test these competinghypotheses, we conducted detailed phylogeographic and approxi-mate Bayesian computation analyses, which are suitable approachesto unraveling complex demographic histories. Our analyses usedmicrosatellite markers and sequences of four nuclear genes sampledfrom populations in the Andes, Mexico, and elsewhere. To infer theancestral state, we included the closest known relatives Phytoph-thora phaseoli, Phytophthora mirabilis, and Phytophthora ipo-moeae, as well as the interspecific hybrid Phytophthora andina. Wedid not find support for an Andean origin of P. infestans; rather, thesequence data suggest a Mexican origin. Our findings support thehypothesis that populations found in the Andes are descendantsof the Mexican populations and reconcile previous findings of an-cestral variation in the Andes. Although centers of origin are welldocumented as centers of evolution and diversity for numerous cropplants, the number of plant pathogens with a known geographicorigin are limited. This work has important implications for our un-derstanding of the coevolution of hosts and pathogens, as well asthe harnessing of plant disease resistance to manage late blight.
biological invasion | coalescent analysis | oomycete | population genetics |stramenopile
The potato pathogen Phytophthora infestans, the causal agentof potato late blight, is the plant pathogen that has most
greatly impacted humanity to date. This pathogen is best knownfor its causal involvement in the Irish potato famine after in-troduction of the HERB-1 strain to Ireland from the Americasin the 19th century (1). To this day, potato late blight remainsa major threat to food security and carries a global cost con-servatively estimated at more than $6 billion per year (2). Inthe 1980s, a single asexual lineage named US-1, possibly derivedfrom the same metapopulation as HERB-1 (1), dominated glob-al populations, whereas a genetically diverse and sexual popula-tion of P. infestans in central Mexico led to formulation of the hy-pothesis identifying Mexico as this pathogen’s center of origin (3,4). A competing hypothesis argues that the center of origin of thepotato, the South American Andes, is the center of origin ofP. infestans (5). This hypothesis recently gained prominence afteran analysis demonstrated ancestral variation in Andean lineagesof P. infestans (5). Other evidence supporting this hypothesisincludes infection of native Solanum hosts and an Andean
distribution for Phytophthora andina, a phylogenetic relative of P.infestans (6).Evidence supporting a Mexican center of origin is substantial,
but inconclusive (4). Two close relatives of P. infestans, Phy-tophthora ipomoeae and Phytophthora mirabilis, are endemic tocentral Mexico (7, 8). P. ipomoeae and P. mirabilis cause diseaseon two endemic plant host groups, Ipomoea spp. and Mirabilisjalapa, respectively. Populations of P. infestans in the TolucaValley, southwest of Mexico City, are genetically diverse, are inHardy–Weinberg equilibrium, and contain mating types A1 andA2 in the expected 1:1 ratio for sexual populations (9, 10). Be-fore a migration event from Mexico to Europe in the 1970s (11,12), only A1 mating types of P. infestans were found worldwideoutside of central Mexico, limiting other populations to asexualreproduction (13). Tuber-bearing native Solanum species occurthroughout the Toluca Valley (14). Of the R genes that havebeen used to confer resistance to strains of P. infestans in potato,the majority described to date originated from Solanum demis-sum or Solanum edinense in the Toluca Valley, with some dis-covered in South America (15).
Significance
The potato late blight pathogen was introduced to Europe inthe 1840s and caused the devastating loss of a staple crop,resulting in the Irish potato famine and subsequent diaspora.Research on this disease has engendered much debate, whichin recent years has focused on whether the geographic originof the pathogen is South America or central Mexico. Differentlines of evidence support each hypothesis. We sequenced fournuclear genes in representative samples from Mexico and theSouth American Andes. An Andean origin of P. infestans doesnot receive support from detailed analyses of Andean andMexican populations. This is one of a few examples of a path-ogen with a known origin that is secondary to its currentmajor host.
Author contributions: E.M.G., D.E.L.C., S.R., G.A.F., and N.J.G. designed research; E.M.G.,J.F.T., D.E.L.C., S.R., W.E.F., G.A.F., V.J.F., M.C., and N.J.G. performed research; D.E.L.C., S.R.,W.E.F., G.A.F., and N.J.G. contributed new reagents/analytic tools; E.M.G., J.F.T., D.E.L.C.,V.J.F., M.C., and N.J.G. analyzed data; and E.M.G., J.F.T., D.E.L.C., S.R., W.E.F., G.A.F., M.C.,and N.J.G. wrote the paper.
The authors declare no conflict of interest.
This article is a PNAS Direct Submission.
Data deposition: The sequences reported in this paper have been deposited in the GenBankdatabase (accession nos. KF979339–KF980878).1To whom correspondence should be addressed. E-mail: [email protected].
This article contains supporting information online at www.pnas.org/lookup/suppl/doi:10.1073/pnas.1401884111/-/DCSupplemental.
www.pnas.org/cgi/doi/10.1073/pnas.1401884111 PNAS | June 17, 2014 | vol. 111 | no. 24 | 8791–8796
AGRICU
LTURA
LSC
IENCE
S

Support for the alternate hypothesis that P. infestans origi-nated in the Andes is based on a coalescent analysis conductedby Gómez-Alpizar et al. (5). This analysis used the nuclear RASlocus and the mitochondrial P3 and P4 regions to infer rootedgene genealogies that showed ancestral lineages rooted in theAndes. Furthermore, the Mexico sample harbored less nucleo-tide diversity than the Andean population. P. andina was iden-tified as the ancestral lineage for the mitochondrial genealogy;however, P. mirabilis and P. ipomoeae were not included in thatstudy. P. andina has since been shown to be a hybrid species derivedfrom P. infestans and a Phytophthora sp. unknown to science (16).Surprisingly, populations of P. infestans and P. andina are clonal inSouth America and are not in Hardy–Weinberg equilibrium (6, 17–19). Thus, the question of whether P. infestans originated in theAndes or central Mexico remained unresolved.Powerful approaches for determining the demographic and
evolutionary history of organisms are now available (20). Manyof these approaches rely on the power of coalescent theory forinferring the genealogical history of a species based on a repre-sentative population sample (21–23). Bayesian phylogeographyuses geographic information in light of phylogenetic uncertaintyto provide model-based inference of geographic locations ofancestral strains (24). The isolation with migration (IM) modeland associated software uses likelihood-based inference to inferdivergence time between evolutionary lineages (25). ApproximateBayesian computation (ABC) makes use of coalescent simulationsand likelihood-free inference to contrast complex demographicscenarios. Each of these methods has proven useful in recon-structing the demography of pests and pathogens (24, 26–29).The objective of the present study was to reconcile the two
competing hypotheses on the origin of P. infestans using Bayesianphylogenetics and ABC. We sampled key populations of P. infestansfrom central Mexico and the Andes and expanded on the anal-ysis of Gómez-Alpizar et al. (5) by sequencing additional nuclearloci to assess support for the center of origin across multiple loci.To determine ancestral state, we added sequences from the sistertaxa P. andina, P. mirabilis, P. ipomoeae, and Phytophthora phaseoli,all of which belong to Phytophthora clade 1c (30, 31). Finally, weaimed to reconcile the biology of P. infestans in Mexico with thefindings of Gómez-Alpizar et al. (5) of ancestral variation inthe Andes.
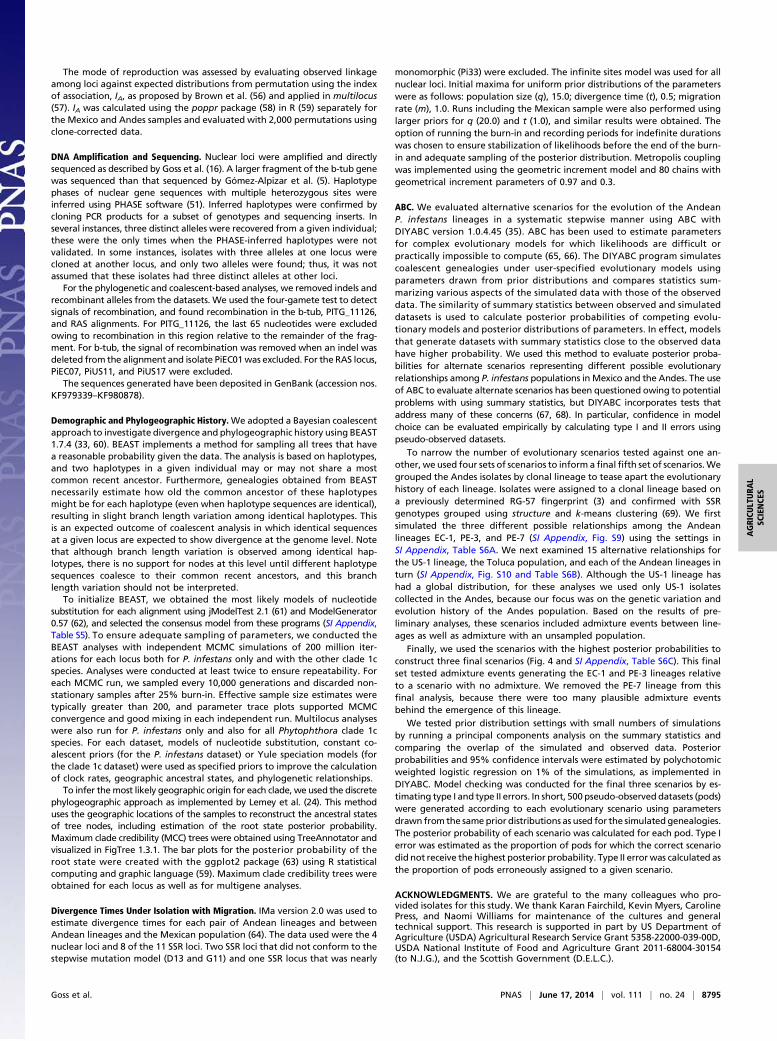
ResultsPopulation Structure and Mode of Reproduction. Our sample ofP. infestans included 40 isolates from Colombia, Ecuador, andPeru and 48 isolates from Toluca Valley and Tlaxcala State incentral Mexico (SI Appendix, Table S1). We found 30 multilocussimple sequence repeat (SSR) genotypes in the Andes sampleand 43 in the Mexico sample. The Mexico sample had slightlyhigher mean allelic richness per locus compared with the Andessample (6.7 vs. 5.2) after correction for sample size by rarefac-tion. The mean number of private alleles per locus for the Mexicosample was more than twice that for the Andes sample (2.1 vs.0.8). In the Mexico sample, clonality was detected in isolatessampled from single patches of the indigenous host S. demissum.The index of association, IA, calculated for clone-corrected datafor the Mexico isolates accepted the hypothesis of sexual re-production (P = 0.25). In contrast, the hypothesis of no linkageamong markers was rejected for the Andes sample (P < 0.001),supporting a clonal mode of reproduction.We inferred population structure based on SSR genotypes
separately for the Mexico and Andes samples of P. infestans,based on a priori knowledge of their sexual and clonal repro-duction, respectively, using structure (32). The Mexico sampleconsisted of admixed subpopulations with at least K = 4 under-lying groups (Fig. 1A and SI Appendix, Figs. S1 and S2), whereasthe Andes sample consisted of two distinct clusters with verylittle admixture (Fig. 1B and SI Appendix, Figs. S1 and S2).
Phylogeographic Root of P. infestans.We used Bayesian multilocusphylogeographic analysis to infer the geographic location of the
root (“root state”) of P. infestans and the Phytophthora clade 1cspecies using BEAST (24, 33). For this analysis, we includeda representative global sample including isolates from the now-diverse populations in Europe (SI Appendix, Table S1). Com-parison of different molecular clocks for each sequenced nuclearlocus showed that three of four loci fit a strict clock, in which thestandard deviation of the uncorrelated lognormal relaxed mo-lecular clock indicated no variation in rates among branches. Incontrast, the RAS locus (intron Ras and Ras fragments) showedhigh variation in rates among branches and required a relaxedlognormal molecular clock (SI Appendix, Table S2). The PITG_11126locus had the highest rate of evolution, whereas β-tubulin (b-tub)had the lowest substitution rate.Root state reconstruction produced the highest posterior prob-
abilities for Mexico as the root state of both the P. infestans andclade 1c datasets (Fig. 2). For each locus independently, posteriorprobabilities of a Mexico root were >0.8 for clade 1c (SI Appendix,Fig. S3). In nearly all of the P. infestans clades, there was aninferred ancestral connection to Mexico (SI Appendix, Figs. S4–S8). All of the species in Clade 1c were monophyletic with highsupport, except for the hybrid species P. andina as previouslydemonstrated (16, 34).
Evolution of P. infestans in the Andes. We found that three out offour loci had either greater nucleotide diversity or Watterson’stheta for the Andes sample compared with the Mexico sample(SI Appendix, Table S3). To better understand the evolution ofthe Andes lineages and the relationship between P. infestans inMexico and the Andes, we estimated pairwise times since di-vergence using combined SSR genotypes and nuclear sequencedata using the IMa program (25). Divergence times were esti-mated between each of the clonal lineages in the Andes sample(US-1, EC-1, PE-3, and PE-7) and one another and the Mexicosample (Fig. 3). EC-1, PE-3, and PE-7 produced recent pairwisedivergence times. EC-1 showed the most recent divergence fromUS-1 and the Mexico population. The time since divergence ofPE-3 and US-1 was less than that of PE-3 and Mexico. The timesince divergence between PE-7 and Mexico was greater than forEC-1 or PE-3 from Mexico. The marginal posterior probabilitydistribution for the divergence time between PE-7 and US-1 wasflat, indicating uncertainty in the history of PE-7.We further explored scenarios for the evolution of the Andes
lineages by testing a series of alternative models using ABC asimplemented in the DIYABC program (35). We first examined
0 1 2
50
100
150
200
Index of association
Cou
nt
50
100
150
Cou
nt
0-0.2-0.4 0.2 0.4Index of association
B
A
PiM
X29
P
iMX
65
PiM
X21
P
iMX
22
PiM
X02
P
iMX
15
PiM
X23
P
iMX
04
PiM
X20
P
iMX
03
PiM
X12
Pi
MX4
1 P
iMX
61
PiM
X62
P
iMX
27
PiM
X40
PiM
X14
P
iMX
16
PiM
X10
Pi
MX4
2 P
iMX
06
PiM
X26
P
iMX
18
PiM
X30
P
iMX
19
PiM
X11
PiM
X24
P
iMX
25
PiM
X28
P
iMX
01
PiM
X64
P
iMX
67
PiM
X63
P
iMX
66
PiM
X13
P
iMX
17
PiM
X72
P
iMX
71
PiM
X05
P
iMX
07
PiM
X50
PiM
X48
PiM
X49
PiM
X43
PiM
X44
PiM
X45
PiM
X46
PiM
X47
ObservedIA = 0.08P = 0.25
ObservedIA = 2.63P < 0.001
EC1 PE7 PE3 US1US8
PiP
E01
P
iCO
01
PiC
O02
P
iCO
03
PiC
O04
P
iEC
03
PiP
E11
PiP
E12
P
iPE
14
PiP
E05
P
iPE
09
PiE
C01
P
iPE
04
PiP
E02
P
iPE
08
PiP
E13
P
iPE
07
PiP
E26
P
iEC
02
PiP
E10
P
iPE
03
PiP
E06
P
iCO
05
PiP
E21
P
iEC
06
PiE
C04
P
iPE
20
PiE
C11
PiE
C12
P
iEC
07
PiE
C08
P
iEC
10
PiE
C13
P
iEC
14
PiP
E27
P
iEC
05
PiP
E22
P
iPE
23
PiP
E25
P
iPE
24
Andes
Mexico
Fig. 1. Population structure of Mexico and Andes samples of P. infestansinferred using structure (32). (A) The Mexico sample shows admixed indi-viduals assigned to K = 4 clusters. Isolates collected from patches ofS. demissum are in bold type. Based on the index of association, IA, there isno evidence of linkage disequilibrium among loci (P = 0.25), consistent witha sexually recombining population. (B) The Andes sample clusters into K = 2distinct clades with little or no admixture. The hypothesis of no linkageamong markers is rejected (P < 0.001), indicating a clonal population.
8792 | www.pnas.org/cgi/doi/10.1073/pnas.1401884111 Goss et al.

the relationships among the lineages EC-1, PE-3, and PE-7.Model comparison indicated that the PE-3 and PE-7 lineageshave more recent shared ancestry compared with the morewidespread EC-1 lineage (SI Appendix, Fig. S9). We next testedthe relationships of each of these lineages to the Toluca pop-ulation in Mexico and the US-1 lineage in the Andes (SI Ap-pendix, Fig. S10). Here we used only isolates from the TolucaValley, because we know that this population is panmictic (4).Preliminary analyses showed support for the PE-3 and PE-7lineages being both closely related and distantly related to theother lineages.To better understand this pattern, we included scenarios
containing all possible pairwise admixture events among pop-ulations as well as an admixture with an unsampled population(36) (SI Appendix, Fig. S10). There was relatively strong supportfor PE-3 as an admixed lineage. The scenario in which PE-3 isderived from an admixture event between US-1 and an unsam-pled population had a posterior probability of 0.67 (Fig. 4A andSI Appendix, Table S4). All other scenarios had posterior prob-abilities <0.14, most <0.01. The equivalent scenario for PE-7also had the highest posterior probability of the tested modelsat 0.37, but there was also support for PE-7 emerging froman admixture event between the Toluca population and theunsampled population (Fig. 4 B and C and SI Appendix, Table S4).The relationship of EC-1 to US-1 and the Toluca population wasuncertain as well, with nearly equal support for two scenarios (Fig.4 D and E and SI Appendix, Table S4). In one scenario, the EC-1lineage recently diverged from the Toluca population (P = 0.25),and in the other, EC-1 was an admixture of the Toluca populationand an unsampled population (P = 0.31). Our Andes samples werehighly clonal; thus, we interpret these results as indicating that thePE-3, PE-7, and perhaps EC-1 lineages formed after a sexual eventbetween two distinct lineages or populations.We used the most highly supported scenarios to test more
complex scenarios including all four Andean lineages andToluca. Testing all possible admixture events proved to be toocomplex with support split among scenarios with various com-binations of admixture events. Furthermore, the PE-7 resultsfrom both IMa and DIYABC analyses suggest that this lineagehas a complex ancestry. Therefore, the final scenarios testedadmixture in the evolution of EC-1 and PE-3, and excluded PE-7(Fig. 5). We found that scenario B, in which EC-1 split from theToluca population and PE-3 originated from an admixture event,had the highest posterior probability of 0.74 (Fig. 4). Notably,there was minimal support for scenario C, with simple ancestraldivergence of PE-3 (Fig. 5).
We estimated type I and type II errors for scenario B andfound that 65% of the datasets simulated under scenario Bproduced the highest posterior probability for scenario B (type Ierror, 0.352). Pseudo-observed datasets generated under scenariosA and C were wrongly assigned to scenario B at frequencies of0.210 and 0.096, respectively (type II error). Posterior distributionsfor parameters were wide, indicating limited confidence in theparameter estimates.
DiscussionWe found multilocus support for a Mexican origin of P. infestans.Bayesian phylogeographic analysis rooted both P. infestans andPhytophthora clade 1c in Mexico for each of four nuclear loci. Ourresults are consistent with the population biology of P. infestans incentral Mexico and, taken together, point to Mexico as the originof this pathogen. These results are supported by the previouslynoted pathogen and host characteristics. Specifically, Tolucapopulations are sexual, whereas South American populationsof P. infestans are clonal (6, 9, 10, 17–19). Both mating types ofP. infestans are known to have been present since at least the1960s in central Mexico (37, 38).The genealogical connections between continents that we
observed in our phylogeographic analysis are consistent with themovement of P. infestans among widespread potato growingregions. Migration estimates using microsatellite variation alsosupport our sequence analysis by showing migration fromMexicoto the Andes, but not from the Andes to Mexico (SI Appendix).The commercial potato seed trade can explain much of thecurrent global population structure of P. infestans; however, theearly movements of P. infestans have not been fully reconstructed(1), and examination of the processes underlying the emergenceof new, highly successful strains is ongoing (3, 39). The diversepopulation in central Mexico may be the ultimate source for theappearance of new strains worldwide (3, 40), although seed po-tatoes from Europe are behind recent migrations of virulent strains(41, 42). Detailed genetic reconstruction of global migrations ofP. infestans may be feasible using population genomic data.We explored the evolution of the Andean lineages and the
relationship between P. infestans in Mexico and the Andes bytesting a series of alternative models using the ABC technique.Our intention was to determine the timing of divergence of theAndean lineages and their relationship to the Toluca populationin Mexico. Surprisingly, we found evidence for diversification ofthe Andes population as a result of admixture or hybridization.Because of our limited power to discriminate between models,we view this analysis as hypothesis-generating. Nevertheless,even moderate support for hybridization generating novel
B
CCO EC ES HU MX NL PE SA SW UK US VT
CO EC ES HU MX NL PE PO SA SWUK US VT
P. infestans
Roo
t sta
te p
oste
rior p
roba
biliy
0.00
0.05
0.10
0.15
0.20
0.0
0.1
0.2
0.3
0.4
0.5
Roo
t sta
te p
oste
rior p
roba
biliy
MX
EC
MX
MX
MX
MX
P. ipomoeae
P. mirabilis
P. andina
P. infestansP. andina
LocationMexicoEcuador
1.0
0.9
0.8
1.0
1.0
1.0
1.0
MX
A Clade 1c
Fig. 2. Root state probabilities by country inferred using BEAST (33). (A)Summarized maximum clade credibility phylogeny of Phytophthora clade 1cspecies. Colors of branches indicate the most probable geographic origin ofeach lineage. Posterior probabilities of major branches supporting the treetopology are shown below each branch. Root state posterior probabili-ties indicate that Mexico is the most probable origin of clade 1c (B) andP. infestans (C ).
0
50
0
50
0
50 0
50
Scaled time since divergence
Est
imat
ed m
argi
nal p
oste
rior p
roba
bilit
y
Mexico
US-1
PE-7
PE-3
PE-3 PE-7EC-1 US-1
2.002.002.00 0 0.2
Fig. 3. Estimated marginal posterior probabilities of relative divergencetimes in pairwise comparisons among Andes clonal lineages (EC-1, PE-3, PE-7,and US-1) and the Mexico population estimated using IMa (64). Smallermeans and modes of the scaled time since divergence indicate more recentdivergence of lineages. Lineages EC-1, PE-3, and PE-7 show more recent di-vergence from one another than from US-1 and Mexico.
Goss et al. PNAS | June 17, 2014 | vol. 111 | no. 24 | 8793
AGRICU
LTURA
LSC
IENCE
S

lineages of P. infestans is compelling, given that a new pathogenof Solanum hosts, P. andina, has been generated via hybridiza-tion (16), and that infrequent hybridization among lineages ofP. infestans is suspected to be responsible for novel genotypeselsewhere (43).Considering the diversity of Solanum hosts in the Andes, there
is great potential for clonal diversification of P. infestans asavailable niches are colonized and rare events contribute togeneration or recombination of variation. There is no evidenceof genetic variation among P. infestans isolates from potatoes inPeru as recently as the mid-1980s (44). If there were diversity inP. infestans or clade 1c in the Andes, it must have been limited toother unsampled hosts. Based on our analyses, we hypothesizethat the Andean diversity in P. infestans has been driven by globalmigration together with hybridization among populations estab-lished via independent migration events.Given our results, why did Gómez-Alpizar et al. (5) infer an
Andean origin? First, their mitochondrial coalescent gene treeincluded the Andean endemic P. andina, but not the Mexican sisterspecies, and thus species selection rooted the tree in the Andes. Atthe time that the work was conducted, P. andina was not recog-nized as a hybrid species with two haplotypes derived from twodistinct parental species (16). When we removed P. andina fromtheir dataset, the location of the root was ambiguous (SI Appendix);therefore, the mitochondrial loci used in the analysis were notphylogeographically informative. The root of the P. infestans mi-tochondrial genome was recently dated to 460 y ago (95% highest-probability density, 300–643), around the time of the Spanishconquest of the Americas (1). Thus, the two major mitochondrialhaplotypes may be the product of movement of the pathogenby humans, resulting in the formation of a new population ofP. infestans and the evolution of diverged mtDNA haplotypesbefore global expansion of the pathogen some 200 y later.Second, the coalescent root of the single nuclear locus used by
Gómez-Alpizar et al. is dependent on migration rate (SI Appendix),which was estimated using the same locus. The RAS gene inP. infestans has two diverged haplotypes in the first intron. Thiscreates two diverged clades of haplotypes, one of which is not foundin the Mexican sample. This might have biased the migration rateestimates for this gene and affected the outcome of the coalescentanalysis. Our analysis of this locus required a relaxed molecularclock and took an exceptionally long time to converge. Finally,
explicit treatment of geography in our BEAST analysis did notrequire us to make assumptions about population structure, butrather incorporated the divergent origins of our isolates intothe analysis.Resolving the origin of P. infestans is important to our un-
derstanding of the emergence and reemergence of damagingpathogens. P. infestans is one of a limited number of agriculturalplant pathogens with a well-characterized center of origin (45).An expectation of long-term coevolution between a crop and itshost-specific pathogen can mislead one into thinking that thepathogen originates from the crop’s center of origin; however,there are other well-documented and suspected instances ofhost-jumping by crop pathogens (45–47). P. infestans appears tobe an example of a pathogen originating from wild relatives ina secondary center of host diversity. Identification of the centerof origin also advances our understanding of pathogen evolutionoutside of this region, that is, how the pathogen has changedafter introduction to new environments.Global populations of P. infestans have undergone rapid
changes owing to both migration and evolution after migration(39, 48). Knowledge of pathogen diversity and evolution bothwithin and outside of the center of origin is critical to cropbreeding efforts (49). The long-term success of efforts to breedlate blight-resistant potatoes will require breeders to accountfor geographic and evolutionary sources of novel variation inP. infestans and its hosts.
Materials and MethodsSampling Individuals. A sampling of the known global diversity in P. infestanswas obtained from several collaborators (SI Appendix, Table S1). We focusedon assembling two large samples from Mexico (n = 48) and the SouthAmerican Andes (n = 40) representing the known diversity from each ofthese regions, and included a more moderate global sample of P. infestansfor context (SI Appendix, Table S1).
SSR Typing. Isolates were genotyped using 11 SSR markers as describedpreviously (39, 50). Given that the individuals varied in ploidy, analysis wasrestricted to approaches that can accommodate nondiploid genetics (51).
Population Structure (SSR). Allelic richness was calculated using the ADZEprogram (52). Population composition was inferred using structure 2.3 (32)by testing the number of population clusters (K ) between 1 and 20 usingthe admixture model for the Mexico and Andes samples (53) and the no-admixture model for the Andes sample. The no-admixture model may bemore appropriate for the Andean population (i.e., Ecuador, Colombia, andPeru) given a priori knowledge of its clonality (17). Analysis was performedseparately for the two different populations. A total of 10 independentruns each of 1,000,000 iterations with a burn-in period of 20,000 Markovchain Monte Carlo (MCMC) iterations were conducted. The results fromstructure were postprocessed using Structure Harvester (54). The ΔKmethod was used to evaluate the rate of change in the log probability ofdata between successive K values, to infer the number of clusters (55).
Toluca US-1EC-1
DP = 0.25
Toluca US-1 PE-7
BP = 0.37
US-1 Toluca PE-7
CP = 0.29
Toluca US-1 PE-3
AP = 0.67
US-1 Toluca EC-1
EP = 0.31 Time
Fig. 4. Scenarios for the evolution of P. infestans in the Andes tested usingABC in DIYABC (35). Shown are the scenarios with the highest posteriorprobabilities out of 15 scenarios testing the relationships of PE-3, PE-7, andEC-1 lineages, in turn, to the US-1 lineage and Toluca Valley population (SIAppendix, Fig. S10). Present-day populations are at the base of the treeschematic. Ancestral relationships among these populations are representedby lines intersecting in the past, with the vertex of the schematic repre-senting the most recent common ancestor of all samples. Horizontal linesindicate admixture events between the ancestral populations connected bythe horizontal line. Potential changes in population size over time are in-dicated by changes in line thickness, but line thickness is not proportional topopulation size. The dashed line represents an unsampled population thathas contributed to the genetic variation observed in sampled populations.(A) For PE-3, the most probable scenario includes an admixture of US-1 andan unsampled population, leading to the PE-3 lineage. (B and C) For PE-7,support is split between two scenarios containing an admixture event withan unsampled population. (D and E) For EC-1, the scenarios with the greatestsupport showed a simple divergence from the Toluca population or an ad-mixture between Toluca and an unsampled population. Posterior probabil-ities for all tested scenarios and their 95% confidence intervals are given in SIAppendix, Table S4.
CBATime
Toluca EC-1 US-1 PE-3Toluca EC-1 US-1 PE-3 Toluca EC-1 US-1 PE-3
P = 0.02 [0.016, 0.028]
P = 0.74[0.686, 0.791]
P = 0.24[0.187, 0.292]
Fig. 5. Final three scenarios used to examine the relationships between theToluca Valley population and EC-1, PE-3, and US-1 lineages in the Andes byABC. Tree schematics are drawn as in Fig. 4. The three scenarios are simpledivergence of populations such that PE-3 is an ancestral lineage (A); emer-gence of the PE-3 lineage after an admixture of US-1 and an unsampledpopulation (B); and scenario B plus emergence of the EC-1 by an admixturebetween the Toluca population and an unsampled population (C). ScenarioB was the most likely of the three, with a posterior probability of 0.74. The95% confidence intervals for the posterior probabilities are in brackets.
8794 | www.pnas.org/cgi/doi/10.1073/pnas.1401884111 Goss et al.
The mode of reproduction was assessed by evaluating observed linkageamong loci against expected distributions from permutation using the indexof association, IA, as proposed by Brown et al. (56) and applied in multilocus(57). IA was calculated using the poppr package (58) in R (59) separately forthe Mexico and Andes samples and evaluated with 2,000 permutations usingclone-corrected data.
DNA Amplification and Sequencing. Nuclear loci were amplified and directlysequenced as described by Goss et al. (16). A larger fragment of the b-tub genewas sequenced than that sequenced by Gómez-Alpizar et al. (5). Haplotypephases of nuclear gene sequences with multiple heterozygous sites wereinferred using PHASE software (51). Inferred haplotypes were confirmed bycloning PCR products for a subset of genotypes and sequencing inserts. Inseveral instances, three distinct alleles were recovered from a given individual;these were the only times when the PHASE-inferred haplotypes were notvalidated. In some instances, isolates with three alleles at one locus werecloned at another locus, and only two alleles were found; thus, it was notassumed that these isolates had three distinct alleles at other loci.
For the phylogenetic and coalescent-based analyses, we removed indels andrecombinant alleles from the datasets. We used the four-gamete test to detectsignals of recombination, and found recombination in the b-tub, PITG_11126,and RAS alignments. For PITG_11126, the last 65 nucleotides were excludedowing to recombination in this region relative to the remainder of the frag-ment. For b-tub, the signal of recombination was removed when an indel wasdeleted from the alignment and isolate PiEC01was excluded. For the RAS locus,PiEC07, PiUS11, and PiUS17 were excluded.
The sequences generated have been deposited in GenBank (accession nos.KF979339–KF980878).
Demographic and Phylogeographic History.We adopted a Bayesian coalescentapproach to investigate divergence and phylogeographic history using BEAST1.7.4 (33, 60). BEAST implements a method for sampling all trees that havea reasonable probability given the data. The analysis is based on haplotypes,and two haplotypes in a given individual may or may not share a mostcommon recent ancestor. Furthermore, genealogies obtained from BEASTnecessarily estimate how old the common ancestor of these haplotypesmight be for each haplotype (even when haplotype sequences are identical),resulting in slight branch length variation among identical haplotypes. Thisis an expected outcome of coalescent analysis in which identical sequencesat a given locus are expected to show divergence at the genome level. Notethat although branch length variation is observed among identical hap-lotypes, there is no support for nodes at this level until different haplotypesequences coalesce to their common recent ancestors, and this branchlength variation should not be interpreted.
To initialize BEAST, we obtained the most likely models of nucleotidesubstitution for each alignment using jModelTest 2.1 (61) and ModelGenerator0.57 (62), and selected the consensus model from these programs (SI Appendix,Table S5). To ensure adequate sampling of parameters, we conducted theBEAST analyses with independent MCMC simulations of 200 million iter-ations for each locus both for P. infestans only and with the other clade 1cspecies. Analyses were conducted at least twice to ensure repeatability. Foreach MCMC run, we sampled every 10,000 generations and discarded non-stationary samples after 25% burn-in. Effective sample size estimates weretypically greater than 200, and parameter trace plots supported MCMCconvergence and good mixing in each independent run. Multilocus analyseswere also run for P. infestans only and also for all Phytophthora clade 1cspecies. For each dataset, models of nucleotide substitution, constant co-alescent priors (for the P. infestans dataset) or Yule speciation models (forthe clade 1c dataset) were used as specified priors to improve the calculationof clock rates, geographic ancestral states, and phylogenetic relationships.
To infer themost likely geographic origin for each clade, we used the discretephylogeographic approach as implemented by Lemey et al. (24). This methoduses the geographic locations of the samples to reconstruct the ancestral statesof tree nodes, including estimation of the root state posterior probability.Maximum clade credibility (MCC) trees were obtained using TreeAnnotator andvisualized in FigTree 1.3.1. The bar plots for the posterior probability of theroot state were created with the ggplot2 package (63) using R statisticalcomputing and graphic language (59). Maximum clade credibility trees wereobtained for each locus as well as for multigene analyses.
Divergence Times Under Isolation with Migration. IMa version 2.0 was used toestimate divergence times for each pair of Andean lineages and betweenAndean lineages and the Mexican population (64). The data used were the 4nuclear loci and 8 of the 11 SSR loci. Two SSR loci that did not conform to thestepwise mutation model (D13 and G11) and one SSR locus that was nearly
monomorphic (Pi33) were excluded. The infinite sites model was used for allnuclear loci. Initial maxima for uniform prior distributions of the parameterswere as follows: population size (q), 15.0; divergence time (t), 0.5; migrationrate (m), 1.0. Runs including the Mexican sample were also performed usinglarger priors for q (20.0) and t (1.0), and similar results were obtained. Theoption of running the burn-in and recording periods for indefinite durationswas chosen to ensure stabilization of likelihoods before the end of the burn-in and adequate sampling of the posterior distribution. Metropolis couplingwas implemented using the geometric increment model and 80 chains withgeometrical increment parameters of 0.97 and 0.3.
ABC. We evaluated alternative scenarios for the evolution of the AndeanP. infestans lineages in a systematic stepwise manner using ABC withDIYABC version 1.0.4.45 (35). ABC has been used to estimate parametersfor complex evolutionary models for which likelihoods are difficult orpractically impossible to compute (65, 66). The DIYABC program simulatescoalescent genealogies under user-specified evolutionary models usingparameters drawn from prior distributions and compares statistics sum-marizing various aspects of the simulated data with those of the observeddata. The similarity of summary statistics between observed and simulateddatasets is used to calculate posterior probabilities of competing evolu-tionary models and posterior distributions of parameters. In effect, modelsthat generate datasets with summary statistics close to the observed datahave higher probability. We used this method to evaluate posterior proba-bilities for alternate scenarios representing different possible evolutionaryrelationships among P. infestans populations in Mexico and the Andes. The useof ABC to evaluate alternate scenarios has been questioned owing to potentialproblems with using summary statistics, but DIYABC incorporates tests thataddress many of these concerns (67, 68). In particular, confidence in modelchoice can be evaluated empirically by calculating type I and II errors usingpseudo-observed datasets.
To narrow the number of evolutionary scenarios tested against one an-other, we used four sets of scenarios to inform a final fifth set of scenarios.Wegrouped the Andes isolates by clonal lineage to tease apart the evolutionaryhistory of each lineage. Isolates were assigned to a clonal lineage based ona previously determined RG-57 fingerprint (3) and confirmed with SSRgenotypes grouped using structure and k-means clustering (69). We firstsimulated the three different possible relationships among the Andeanlineages EC-1, PE-3, and PE-7 (SI Appendix, Fig. S9) using the settings inSI Appendix, Table S6A. We next examined 15 alternative relationships forthe US-1 lineage, the Toluca population, and each of the Andean lineages inturn (SI Appendix, Fig. S10 and Table S6B). Although the US-1 lineage hashad a global distribution, for these analyses we used only US-1 isolatescollected in the Andes, because our focus was on the genetic variation andevolution history of the Andes population. Based on the results of pre-liminary analyses, these scenarios included admixture events between line-ages as well as admixture with an unsampled population.
Finally, we used the scenarios with the highest posterior probabilities toconstruct three final scenarios (Fig. 4 and SI Appendix, Table S6C). This finalset tested admixture events generating the EC-1 and PE-3 lineages relativeto a scenario with no admixture. We removed the PE-7 lineage from thisfinal analysis, because there were too many plausible admixture eventsbehind the emergence of this lineage.
We tested prior distribution settings with small numbers of simulationsby running a principal components analysis on the summary statistics andcomparing the overlap of the simulated and observed data. Posteriorprobabilities and 95% confidence intervals were estimated by polychotomicweighted logistic regression on 1% of the simulations, as implemented inDIYABC. Model checking was conducted for the final three scenarios by es-timating type I and type II errors. In short, 500 pseudo-observed datasets (pods)were generated according to each evolutionary scenario using parametersdrawn from the sameprior distributions as used for the simulated genealogies.The posterior probability of each scenario was calculated for each pod. Type Ierror was estimated as the proportion of pods for which the correct scenariodid not receive the highest posterior probability. Type II errorwas calculated asthe proportion of pods erroneously assigned to a given scenario.
ACKNOWLEDGMENTS. We are grateful to the many colleagues who pro-vided isolates for this study. We thank Karan Fairchild, Kevin Myers, CarolinePress, and Naomi Williams for maintenance of the cultures and generaltechnical support. This research is supported in part by US Department ofAgriculture (USDA) Agricultural Research Service Grant 5358-22000-039-00D,USDA National Institute of Food and Agriculture Grant 2011-68004-30154(to N.J.G.), and the Scottish Government (D.E.L.C.).
Goss et al. PNAS | June 17, 2014 | vol. 111 | no. 24 | 8795
AGRICU
LTURA
LSC
IENCE
S

1. Yoshida K, et al. (2013) The rise and fall of the Phytophthora infestans lineage thattriggered the Irish potato famine. eLife 2:e00731.
2. Haverkort AJ, et al. (2008) Societal costs of late blight in potato and prospects ofdurable resistance through cisgenic modification. Potato Res 51:1871–4528.
3. Goodwin SB, Cohen BA, Fry WE (1994) Panglobal distribution of a single clonal line-age of the Irish potato famine fungus. Proc Natl Acad Sci USA 91(24):11591–11595.
4. Grünwald NJ, Flier WG (2005) The biology of Phytophthora infestans at its center oforigin. Annu Rev Phytopathol 43:171–190.
5. Gómez-Alpizar L, Carbone I, Ristaino JB (2007) An Andean origin of Phytophthorainfestans inferred from mitochondrial and nuclear gene genealogies. Proc Natl AcadSci USA 104(9):3306–3311.
6. Oliva RF, et al. (2010) Phytophthora andina sp nov., a newly identified heterothallicpathogen of solanaceous hosts in the Andean highlands. Plant Pathol 59(4):613–625.
7. Flier WG, et al. (2002) Phytophthora ipomoeae, a new homothallic species causinglate blight on Ipomoeae longipedunculata in the Toluca Valley of central Mexico.Mycol Res 106(7):848–856.
8. Goodwin SB, Legard DE, Smart CD, Levy M, Fry WE (1999) Gene flow analysis ofmolecular markers confirms that Phytophthora mirabilis and P. infestans are separatespecies. Mycologia 91(5):796–810.
9. Grünwald NJ, et al. (2001) Population structure of Phytophthora infestans in theToluca Valley region of Central Mexico. Phytopathology 91(9):882–890.
10. Flier WG, et al. (2003) The population structure of Phytophthora infestans from theToluca Valley in central Mexico suggests genetic differentiation between populationsfrom cultivated potato and wild Solanum species. Phytopathology 93(4):382–390.
11. Fry WE, et al. (1993) Historical and recent migrations of Phytophthora infestans:Chronology, pathways, and implications. Plant Dis 77(7):653–661.
12. Niederhauser JS (1991) Phytophthora infestans: The Mexican connection. Phytophthora,eds Lucas JA, Shattock RC, Shaw DS, Cooke LR (Cambridge Univ Press, Cambridge, UK), pp25–45.
13. Fry WE, et al. (1992) Population genetics and intercontinental migrations of Phy-tophthora infestans. Annu Rev Phytopathol 30:107–130.
14. Hijmans RJ, Spooner DM (2001) Geographic distribution of wild potato species. Am JBot 88(11):2101–2112.
15. Vleeshouwers VGAA, et al. (2011) Understanding and exploiting late blight resistancein the age of effectors. Annu Rev Phytopathol 49(1):507–531.
16. Goss EM, et al. (2011) The plant pathogen Phytophthora andina emerged via hy-bridization of an unknown Phytophthora species and the Irish potato famine path-ogen, P. infestans. PLoS ONE 6(9):e24543.
17. Adler NE, et al. (2004) Genetic diversity of Phytophthora infestans sensu lato inEcuador provides new insight into the origin of this important plant pathogen.Phytopathology 94(2):154–162.
18. Chacon MG, et al. (2006) Genetic structure of the population of Phytophthora in-festans attacking Solanum ochranthum in the highlands of Ecuador. Eur J PlantPathol 115(2):235–245.
19. Forbes GA, et al. (1997) Population genetic structure of Phytophthora infestans inEcuador. Phytopathology 87(4):375–380.
20. Grünwald NJ, Goss EM (2011) Evolution and population genetics of exotic and re-emerging pathogens: Novel tools and approaches. Annu Rev Phytopathol 49:249–267.
21. Tavare S (1984) Lines-of-descent and genealogical processes, and their applications inpopulation-genetics models. Adv Appl Prob 16(1):471–491.
22. Kingman JFC (1982) The coalescent. Stochastic Process Appl 13:235–248.23. Wakeley J (2009) Coalescent Theory: An Introduction (Roberts & Company, Greenwood
Village, CO).24. Lemey P, Rambaut A, Drummond AJ, Suchard MA (2009) Bayesian phylogeography
finds its roots. PLOS Comput Biol 5(9):e1000520.25. Hey J, Nielsen R (2004) Multilocus methods for estimating population sizes, migration
rates and divergence time, with applications to the divergence of Drosophila pseu-doobscura and D. persimilis. Genetics 167(2):747–760.
26. Miller N, et al. (2005) Multiple transatlantic introductions of the western corn root-worm. Science 310(5750):992.
27. Stukenbrock EH, Banke S, Javan-Nikkhah M, McDonald BA (2007) Origin and do-mestication of the fungal wheat pathogen Mycosphaerella graminicola via sympatricspeciation. Mol Biol Evol 24(2):398–411.
28. Lombaert E, et al. (2010) Bridgehead effect in the worldwide invasion of the bio-control harlequin ladybird. PLoS ONE 5(3):e9743.
29. Dutech C, et al. (2012) The chestnut blight fungus world tour: Successive introduction eventsfrom diverse origins in an invasive plant fungal pathogen. Mol Ecol 21(16):3931–3946.
30. Cooke DEL, Drenth A, Duncan JM, Wagels G, Brasier CM (2000) A molecular phy-logeny of Phytophthora and related oomycetes. Fungal Genet Biol 30(1):17–32.
31. Blair JE, Coffey MD, Park S-Y, Geiser DM, Kang S (2008) A multi-locus phylogeny forPhytophthora utilizing markers derived from complete genome sequences. FungalGenet Biol 45(3):266–277.
32. Pritchard JK, Stephens M, Donnelly P (2000) Inference of population structure usingmultilocus genotype data. Genetics 155(2):945–959.
33. Drummond AJ, Suchard MA, Xie D, Rambaut A (2012) Bayesian phylogenetics withBEAUti and the BEAST 1.7. Mol Biol Evol 29(8):1969–1973.
34. Blair JE, Coffey MD, Martin FN (2012) Species tree estimation for the late blightpathogen, Phytophthora infestans, and close relatives. PLoS ONE 7(5):e37003.
35. Cornuet JM, Ravigné V, Estoup A (2010) Inference on population history and modelchecking using DNA sequence and microsatellite data with the software DIYABC(v1.0). BMC Bioinformatics 11:401.
36. Guillemaud T, Beaumont MA, Ciosi M, Cornuet J-M, Estoup A (2010) Inferring in-troduction routes of invasive species using approximate Bayesian computation onmicrosatellite data. Heredity (Edinb) 104(1):88–99.
37. Gallegly ME, Galindo J (1958) Mating types and oospores of Phytophthora infestans innature in Mexico. Phytopathology 48:274–277.
38. Flier WG, Grünwald NJ, Fry WE, Turkensteen LJ (2001) Formation, production andviability of oospores of Phytophthora infestans isolates from potato and Solanumdemissum in the Toluca Valley, central Mexico. Mycol Res 105(8):998–1006.
39. Cooke DEL, et al. (2012) Genome analyses of an aggressive and invasive lineage of theIrish potato famine pathogen. PLoS Pathog 8(10):e1002940.
40. Spielman LJ, et al. (1991) A second world-wide migration and population displace-ment of Phytophthora infestans? Plant Pathol 40(3):422–430.
41. Li Y, et al. (2012) Population structure of Phytophthora infestans in China: Geographicclusters and presence of the EU genotype Blue_13. Plant Pathol 62:932–942.
42. Chowdappa P, et al. (2012) Emergence of 13_A2 blue lineage of Phytophthora in-festans was responsible for severe outbreaks of late blight on tomato in south-westIndia. J Phytopathol 161:49–58.
43. Goodwin SB, et al. (1998) Genetic change within populations of Phytophthora in-festans in the United States and Canada during 1994 to 1996: Role of migration andrecombination. Phytopathology 88(9):939–949.
44. Tooley PW, Therrien CD, Ritch DL (1989) Mating type, race composition, nuclear DNAcontent, and isozyme analysis of Peruvian isolates of Phytophthora infestans. Phy-topathology 79:478–481.
45. Stukenbrock EH, McDonald BA (2008) The origins of plant pathogens in agro-ecosystems.Annu Rev Phytopathol 46:75–100.
46. Zaffarano PL, McDonald BA, Linde CC (2008) Rapid speciation following recent hostshifts in the plant pathogenic fungus Rhynchosporium. Evolution 62(6):1418–1436.
47. Couch BC, et al. (2005) Origins of host-specific populations of the blast pathogenMagnaporthe oryzae in crop domestication with subsequent expansion of pandemicclones on rice and weeds of rice. Genetics 170(2):613–630.
48. Goodwin SB, Sujkowski LS, Fry WE (1995) Rapid evolution of pathogenicity withinclonal lineages of the potato late blight disease fungus. Phytopathology 85:669–676.
49. McDonald BA, Linde C (2002) Pathogen population genetics, evolutionary potential,and durable resistance. Annu Rev Phytopathol 40:349–379.
50. Lees AK, et al. (2006) Novel microsatellite markers for the analysis of Phytophthorainfestans populations. Plant Pathol 55:311–319.
51. Stephens M, Smith NJ, Donnelly P (2001) A new statistical method for haplotype re-construction from population data. Am J Hum Genet 68(4):978–989.
52. Szpiech ZA, Jakobsson M, Rosenberg NA (2008) ADZE: Allelic Diversity Analyzer,version 1.0. http://rosenberglab.bioinformatics.med.umich.edu/adze.html.
53. Falush D, Stephens M, Pritchard JK (2003) Inference of population structure usingmultilocus genotype data: Linked loci and correlated allele frequencies. Genetics164(4):1567–1587.
54. Earl DA, Vonholdt BM (2012) STRUCTURE HARVESTER: A website and program forvisualizing STRUCTURE output and implementing the Evanno method. Conserv GenetResour 4(2):359–361.
55. Evanno G, Regnaut S, Goudet J (2005) Detecting the number of clusters of individualsusing the software STRUCTURE: A simulation study. Mol Ecol 14(8):2611–2620.
56. Brown AHD, Feldman MW, Nevo E (1980) Multilocus structure of natural populationsof Hordeum spontaneum. Genetics 96(2):523–536.
57. Agapow P-M, Burt A (2001) Indices of multilocus linkage disequilibrium. Mol EcolNotes 1(1-2):101–102.
58. Kamvar ZN, Tabima JF, Grünwald NJ (2014) Poppr: An R package for genetic analysisof populations with clonal, partially clonal, and/or sexual reproduction. PeerJ 2:e281.
59. R Development Core Team (2013) R: A Language and Environment for StatisticalComputing (R Foundation for Statistical Computing, Vienna, Austria).
60. Drummond AJ, Rambaut A (2007) BEAST: Bayesian evolutionary analysis by samplingtrees. BMC Evol Biol 7:214.
61. Darriba D, Taboada GL, Doallo R, Posada D (2012) jModelTest 2: More models, newheuristics and parallel computing. Nat Methods 9(8):772.
62. Keane TM, Creevey CJ, Pentony MM, Naughton TJ, Mclnerney JO (2006) Assessmentof methods for amino acid matrix selection and their use on empirical data shows thatad hoc assumptions for choice of matrix are not justified. BMC Evol Biol 6:29.
63. WickhamH (2009) ggplot2: Elegant Graphics for Data Analysis (Springer, New York), p 212.64. Hey J (2010) Isolation with migration models for more than two populations.Mol Biol
Evol 27(4):905–920.65. Beaumont MA (2010) Approximate Bayesian computation in evolution and ecology.
Annu Rev Ecol Evol Syst 41(1):379–406.66. Csilléry K, Blum MGB, Gaggiotti OE, François O (2010) Approximate Bayesian Com-
putation (ABC) in practice. Trends Ecol Evol 25(7):410–418.67. Robert CP, Cornuet JM, Marin JM, Pillai NS (2011) Lack of confidence in approximate
Bayesian computation model choice. Proc Natl Acad Sci USA 108(37):15112–15117.68. Bertorelle G, Benazzo A, Mona S (2010) ABC as a flexible framework to estimate
demography over space and time: Some cons, many pros. Mol Ecol 19(13):2609–2625.69. Meirmans P, Van Tienderen P (2004) Genotype and Genodive: Two programs for the
analysis of genetic diversity of asexual organisms. Mol Ecol Notes 4:792–794.
8796 | www.pnas.org/cgi/doi/10.1073/pnas.1401884111 Goss et al.

! 1!
Supporting Information Supporting*Methods*............................................................................................................................*1!Supporting*Results*..............................................................................................................................*2!References*Cited*...................................................................................................................................*3!Supporting*Tables*................................................................................................................................*4!Supporting*Figures*............................................................................................................................*19!
Supporting Methods Genetree analysis. We revisited the coalescent analysis of Gómez-Alpizar et al. (1) using their data and ours to investigate the sensitivity of root inference to estimates of migration rates. Our concern was that there is little power to estimate migration rates with only a single locus, yet these rates were used to infer the rooting of structured coalescent trees in the program Genetree (2). Furthermore, Gómez-Alpizar et al. considered migration to and from South America, which confounds migration from Mexico and other global populations. P. infestans is transported transcontinentally and intercontinentally via infected seed tubers, and there is a vibrant commercial seed tuber trade from Northwest Europe with known pathways of migration from Europe to South America.
We revised the Genetree analysis of the P3 and P4 mtDNA regions using sequences from Gómez-Alpizar et al. (1) for isolates from Mexico and the Andes but removing the haplotypes representing the P. andina isolates (haplotype 1c). The topology and rooting of the coalescent tree for the P. infestans haplotypes remained the same. We inferred the maximum likelihood value of theta and a symmetric migration rate for the revised data set. We then used 1×10⁷ simulations to examine the inferred subpopulation of the most common recent ancestor (MRCA) of the sample while varying theta and symmetric migration rates using three sets of runs, each set using a different starting seed. For the RAS nuclear gene, we repeated the Gómez-Alpizar et al. (1) analysis while varying migration rates. We used their data set and value of theta. We conducted two runs of 1×10⁷ simulations for each set of migration rates. We varied migration rates from low and symmetric to the values used by Gómez-Alpizar et al. We also examined the coalescent history of the RAS locus using our sequences from Mexico and the Andes. The tree was rooted using ancestral states obtained from P. ipomoeae, P. mirabilis, and P. phaseoli. We used four runs of 1×10⁶ or 1×10⁷ simulations and three symmetric migration rates using two different values of theta (1.5 and 2.0) and four starting seeds.
Migration scenarios from SSR genotypes. The program Migrate version 3.3 was used to examine recent migration between the Andes and Mexico, using SSR genotypes. Three migration models were compared (3): bidirectional migration, migration from Mexico to the Andes only, and migration from the Andes to Mexico only. The runs used Brownian motion approximation for the stepwise mutation model, initial parameter values from FST, and mutation rates per locus estimated from the data. Bayesian inference across 10 replicates used slice sampling, uniform prior distributions from 0 to 1000 for both theta and M parameters, and four chains (temperatures: 1,000,000, 3.0, 1.5, 1.0) in which the cold chain was sampled at 10,000

! 2!
steps at 200 step increments after a burnin of 500,000 steps. Models were evaluated using Bezier approximation of log marginal maximum likelihoods.
Supporting Results
Dependence of Genetree results on migration rates. When we removed P. andina from the Gómez-Alpizar et al. mitochondrial data set and included only the Mexican and South American isolates, the root location was uncertain such that there was equal probability of rooting in Mexico or South America when migration rates were symmetric (Table S7A). Asymmetric migration rates increased the probability of the root in the population that was the source of migration to around 0.95, irrespective of which population was assigned the higher emigration rate.
For the RAS locus, the location of the coalescent root was dependent on migration rates as well (Table S7B). When we used the Gómez-Alpizar et al. data under low symmetric migration rates the rooting was uncertain, and asymmetric migration rates affected the inferred population of origin. The migration rates used by Gómez-Alpizar et al. produced a high probability for a South American root, which replicates their result. The opposite condition produced a similarly high probability for a non-South American root. Therefore, both mitochondrial and RAS analyses were highly dependent on choice of migration parameters.
We used our data set to examine the root location of RAS for Mexican and Andean isolates only. Using RAS sequences from P. andina, P. mirabilis, P. ipomoeae, and P. phaseoli, we were able to unambiguously assign ancestral states to each segregating site and these ancestral states were used to root the P. infestans RAS tree. The coalescent history of the gene was simulated on the rooted topology to infer the location of the root in Mexico or the Andes. Moderate and inconclusive probabilities for root location were observed under nearly all conditions examined, including three symmetric migration rates and two values of theta (Table S8).
Key to the Gómez-Alpizar et al. analysis was their finding of a higher migration rate from South America to non-South American populations (i.e. Mexico, USA, and Ireland) than vice-versa using the nuclear RAS locus. Given this result, we used our SSR data to test among models of migration between the Andes and Mexico using the program Migrate (3). Multiple loci are expected to provide more robust estimates of migration rates for the nuclear genome than can be obtained from a single locus. This analysis revealed a higher migration rate from Mexico to the Andes than from the Andes to Mexico (M = 11.7 vs. 0.3, respectively). Bayesian comparison of migration models strongly supported unidirectional migration from Mexico to the Andes (Bezier approximation of the log marginal likelihood = -11,055) compared to the opposite scenario of migration from the Andes to Mexico (-12,243) or bidirectional migration (-52,357). This result is consistent with the known directions of trade in commercial seed tubers. !

! 3!
References Cited 1. Gómez-Alpizar L, Carbone I, & Ristaino JB (2007) An Andean origin of Phytophthora
infestans inferred from mitochondrial and nuclear gene genealogies. Proc Natl Acad Sci U S A 104(9):3306-3311.
2. Griffiths RC & Tavaré S (1994) Ancestral inference in population genetics. Statistical science 9(3):307-319.
3. Beerli P & Palczewski M (2010) Unified framework to evaluate panmixia and migration direction among multiple sampling locations. Genetics 185(1):313-U463.
4. Nei M (1987) Molecular Evolutionary Genetics (Columbia University Press, New York) p 512
5. Watterson GA (1975) On the number of segregating sites in genetic models without recombination. Theoretical Population Biology 7:256-276.
6. Tajima F (1989) Statistical method for testing the neutral mutation hypothesis by DNA polymorphism. Genetics 123(3):585-595.
7. Fu Y-X & Li W-H (1993) Statistical tests of neutrality of mutations. Genetics 133(3):693-709.

! 4!
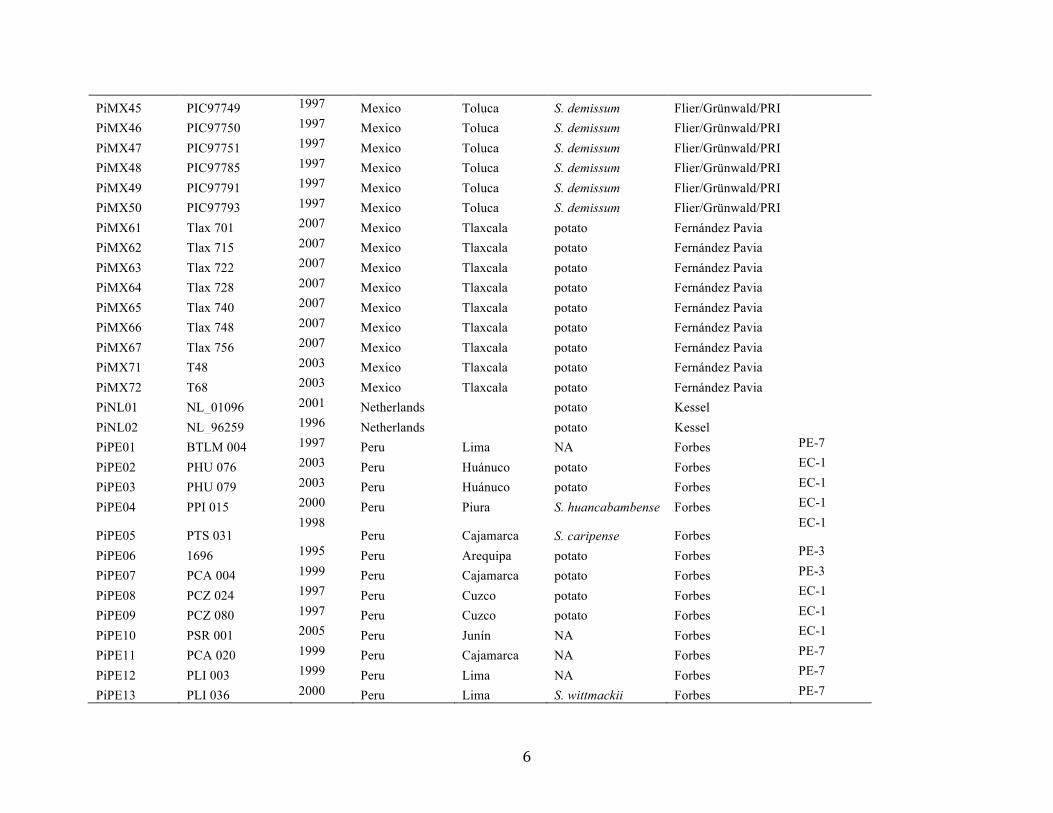
Supporting Tables Table S1. Isolates used in the study.
ID Original name Year sampled Country State Host Source1
Lineage
P. infestans
PiCO01 1011 Colombia Cundinamarca S. tuberosum Restrepo EC-1 PiCO02 1063 Colombia Cundinamarca S. tuberosum Restrepo EC-1 PiCO03 1064 Colombia Cundinamarca S. tuberosum Restrepo EC-1
PiCO04 1068 Colombia Cundinamarca S. tuberosum Restrepo EC-1
PiCO05 4084 Colombia Cundinamarca Physalis peruviana Restrepo US-8
PiEC01 EC_3843 2004 Ecuador potato Forbes EC-1
PiEC02 EC_3527 2002 Ecuador S. andreanum Forbes EC-1
PiEC03 EC_3626 2003 Ecuador potato Forbes EC-1
PiEC06 EC_3841 2004 Ecuador S. habrochaites Forbes US-1
PiEC07 EC_3921 2006 Ecuador S. jugandifolium Forbes US-1
PiEC08 EC_3774 2004 Ecuador S. ochanthum Forbes US-1
PiEC10 EC_3378 2001 Ecuador S. lycopersicum Forbes US-1
PiEC11 EC_3381 2001 Ecuador S. lycopersicum Forbes US-1
PiEC12 EC_3150 1997 Ecuador S. muricatum Forbes US-1
PiEC13 EC_3520 2002 Ecuador S. muricatum Forbes US-1
PiEC14 EC_3809 2004 Ecuador S. caripense Forbes US-1
PiES01 2005_10 2005 Estonia potato Fry
PiES02 2005_17 2005 Estonia potato Fry
PiES03 2005_19 2004 Estonia potato Fry
PiES04 2004_4 2004 Estonia potato Fry
PiES05 2004_16 2004 Estonia potato Fry
PiHU02 Josze_S32 Hungary potato Bakonyi
PiMX01 MX010006 Mexico potato Fry
PiMX02 MX010046 Mexico potato Fry

! 5!
PiMX03 MX980211 1998 Mexico potato Fry
PiMX04 MX980230 1998 Mexico potato Fry
PiMX05 MX980317 1998 Mexico potato Fry
PiMX06 MX980352 1998 Mexico potato Fry
PiMX07 MX980400 1998 Mexico potato Fry
PiMX10 PIC97008 1997 Mexico Toluca potato Flier/Grünwald/PRI
PiMX11 PIC97066 1997 Mexico Toluca potato Flier/Grünwald/PRI
PiMX12 PIC97106 1997 Mexico Toluca potato Flier/Grünwald/PRI
PiMX13 PIC97111 1997 Mexico Toluca potato Flier/Grünwald/PRI
PiMX14 PIC97130 1997 Mexico Toluca potato Flier/Grünwald/PRI
PiMX15 PIC97136 1997 Mexico Toluca potato Flier/Grünwald/PRI
PiMX16 PIC97146 1997 Mexico Toluca potato Flier/Grünwald/PRI
PiMX17 PIC97149 1997 Mexico Toluca potato Flier/Grünwald/PRI
PiMX18 PIC97153 1997 Mexico Toluca potato Flier/Grünwald/PRI
PiMX19 PIC97159 1997 Mexico Toluca potato Flier/Grünwald/PRI
PiMX20 PIC97187 1997 Mexico Toluca potato Flier/Grünwald/PRI
PiMX21 PIC97310 1997 Mexico Toluca potato Flier/Grünwald/PRI
PiMX22 PIC97318 1997 Mexico Toluca potato Flier/Grünwald/PRI
PiMX23 PIC97335 1997 Mexico Toluca potato Flier/Grünwald/PRI
PiMX24 PIC97340 1997 Mexico Toluca potato Flier/Grünwald/PRI
PiMX25 PIC97389 1997 Mexico Toluca potato Flier/Grünwald/PRI
PiMX26 PIC97392 1997 Mexico Toluca potato Flier/Grünwald/PRI
PiMX27 PIC97423 1997 Mexico Toluca potato Flier/Grünwald/PRI
PiMX28 PIC97432 1997 Mexico Toluca potato Flier/Grünwald/PRI
PiMX29 PIC97438 1997 Mexico Toluca potato Flier/Grünwald/PRI
PiMX30 PIC97442 1997 Mexico Toluca potato Flier/Grünwald/PRI
PiMX40 PIC97716 1997 Mexico Toluca S. demissum Flier/Grünwald/PRI
PiMX41 PIC97724 1997 Mexico Toluca S. demissum Flier/Grünwald/PRI
PiMX42 PIC97727 1997 Mexico Toluca S. demissum Flier/Grünwald/PRI
PiMX43 PIC97744 1997 Mexico Toluca S. demissum Flier/Grünwald/PRI
PiMX44 PIC97748 1997 Mexico Toluca S. demissum Flier/Grünwald/PRI
! 6!
PiMX45 PIC97749 1997 Mexico Toluca S. demissum Flier/Grünwald/PRI
PiMX46 PIC97750 1997 Mexico Toluca S. demissum Flier/Grünwald/PRI
PiMX47 PIC97751 1997 Mexico Toluca S. demissum Flier/Grünwald/PRI
PiMX48 PIC97785 1997 Mexico Toluca S. demissum Flier/Grünwald/PRI
PiMX49 PIC97791 1997 Mexico Toluca S. demissum Flier/Grünwald/PRI
PiMX50 PIC97793 1997 Mexico Toluca S. demissum Flier/Grünwald/PRI
PiMX61 Tlax 701 2007 Mexico Tlaxcala potato Fernández Pavia
PiMX62 Tlax 715 2007 Mexico Tlaxcala potato Fernández Pavia
PiMX63 Tlax 722 2007 Mexico Tlaxcala potato Fernández Pavia
PiMX64 Tlax 728 2007 Mexico Tlaxcala potato Fernández Pavia
PiMX65 Tlax 740 2007 Mexico Tlaxcala potato Fernández Pavia
PiMX66 Tlax 748 2007 Mexico Tlaxcala potato Fernández Pavia
PiMX67 Tlax 756 2007 Mexico Tlaxcala potato Fernández Pavia
PiMX71 T48 2003 Mexico Tlaxcala potato Fernández Pavia
PiMX72 T68 2003 Mexico Tlaxcala potato Fernández Pavia
PiNL01 NL_01096 2001 Netherlands potato Kessel
PiNL02 NL_96259 1996 Netherlands potato Kessel
PiPE01 BTLM 004 1997 Peru Lima NA Forbes PE-7
PiPE02 PHU 076 2003 Peru Huánuco potato Forbes EC-1
PiPE03 PHU 079 2003 Peru Huánuco potato Forbes EC-1
PiPE04 PPI 015 2000 Peru Piura S. huancabambense Forbes EC-1
PiPE05 PTS 031 1998
Peru Cajamarca S. caripense Forbes EC-1
PiPE06 1696 1995 Peru Arequipa potato Forbes PE-3
PiPE07 PCA 004 1999 Peru Cajamarca potato Forbes PE-3
PiPE08 PCZ 024 1997 Peru Cuzco potato Forbes EC-1
PiPE09 PCZ 080 1997 Peru Cuzco potato Forbes EC-1
PiPE10 PSR 001 2005 Peru Junín NA Forbes EC-1
PiPE11 PCA 020 1999 Peru Cajamarca NA Forbes PE-7
PiPE12 PLI 003 1999 Peru Lima NA Forbes PE-7
PiPE13 PLI 036 2000 Peru Lima S. wittmackii Forbes PE-7

! 7!
PiPE14 POX 100 2003 Peru Pasco potato Forbes PE-7
PiPE20 PCA 025 1999 Peru Cajamarca NA Forbes US-1
PiPE21 PPI 009 2000 Peru Piura S. caripense Forbes US-1
PiPE22 PPI 013 2000 Peru Piura S. caripense Forbes US-1
PiPE23 PPI 014 2000 Peru Piura S. caripense Forbes US-1
PiPE24 PPI 023 2000 Peru Piura S. caripense Forbes US-1
PiPE25 PPI 028 2000 Peru Piura S. caripense Forbes US-1
PiPE26 PPU 048 1997 Peru Puno potato Forbes PE-3
PiPE27 PPU 097 1997 Peru Puno potato Forbes US-1
PiPE28 PCA 006 1999 Peru Cajamarca potato Forbes PE-3
PiPE29 PCA 010 1999 Peru Cajamarca potato Forbes PE-3
PiPO01 MP_618 2005 Poland potato Lebecka
PiPO02 MP_622 2005 Poland potato Lebecka
PiSA01 SA960008 1996 South Africa potato Fry US-1
PiSW01 SE_03058 2003 Sweden potato Andersson
PiSW02 SE_03087 2003 Sweden potato Andersson
PiUK01 2006_3984C 2006 UK potato Cooke EU_1_A1
PiUK02 2006_4012F 2006 UK potato Cooke EU_3_A2
PiUK03 2006_3928A 2006 UK potato Cooke EU_13_A2
PiUK04 2006_4132B 2006 UK potato Cooke EU_13_A2
PiUK05 2006_3888A 2006 UK potato Cooke EU_2_A1
PiUK06 2007_5866B 2007 UK potato Cooke EU_5_A1
PiUK07 2006_4388D 2006 UK potato Cooke EU_17_A2
PiUK08 2006_4100A 2006 UK potato Cooke EU_6_A1
PiUK09 2006_4440C 2006 UK potato Cooke EU_10_A2
PiUK10 2006_4232E 2006 UK potato Cooke EU_8_A1
PiUS08 US040009 2004 USA potato Fry US-8
PiUS11 US050007 2005 USA tomato Fry US-11
PiUS12 US940494 1994 USA tomato Fry US-12
PiUS17 US970001 1997 USA tomato Fry US-17
PiVT01 Vn02-076 2002 Vietnam tomato Le US-1

! 8!
PiVT02 Vn02-106 2002 Vietnam tomato Le US-1
PiVT03 Vn03-416 2003 Vietnam potato Le US-1
PiVT04 Vn03-590 2003 Vietnam potato Le US-1
P. mirabilis
PmMX01 CBS 136.86 Mexico NA CBS
PmMX02 CBS 678.85 Mexico NA CBS
PmMX03 DF 409 Mexico NA Fernández Pavia
PmMX04 G 11-3 1998 Mexico NA Flier/Grünwald/PRI
PmMX05 00M 410 2000 Mexico NA Fernández Pavia
PmMX06 P 3001 Mexico NA Flier/Grünwald/PRI
PmMX07 P 3006 Mexico NA Flier/Grünwald/PRI
PmMX08 P mirabilis DF 07 2007 Mexico NA Fernández Pavia
PmMX09 P. mirabilis Mich 2003 Mexico NA Fernández Pavia
PmMX10 WF014/PIC99114 1999 Mexico NA Flier/Grünwald/PRI
PmMX11 WF035/PIC99135 1999 Mexico NA Flier/Grünwald/PRI
P. ipomoeae
PoMX01 00Ip5 2000 Mexico NA Fernández Pavia
PoMX02 Ipom1-2 1999 Mexico NA Flier/Grünwald/PRI
PoMX03 Ipom2-1 1999 Mexico NA Flier/Grünwald/PRI
PoMX04 Ipom2-4 1999 Mexico NA Flier/Grünwald/PRI
PoMX05 Ipom3-3 1999 Mexico NA Flier/Grünwald/PRI
PoMX06 Ipom6 1999 Mexico NA Flier/Grünwald/PRI
PoMX07 P. ipomoeae 1999 Mexico NA Fernández Pavia
P. andina
PaEC01 EC_3189 1998 Ecuador Anarrichomenum Forbes
PaEC02 EC_3399 2001 Ecuador Anarrichomenum Cooke
PaEC03 EC_3818 2004 Ecuador Anarrichomenum Cooke
PaEC04 EC_3821 2004 Ecuador Anarrichomenum Forbes
PaEC05 EC_3780 2004 Ecuador S. hispidum Forbes
PaEC06 EC_3655 2003 Ecuador S. hispidum Forbes

! 9!
PaEC07 EC_3163 1998 Ecuador Anarrichomenum Forbes
PaEC08 EC_3510 2002 Ecuador S. betaceum Forbes
PaEC09 EC_3540 2002 Ecuador Anarrichomenum Forbes
PaEC10 EC_3561 2002 Ecuador S. quitoense Forbes
PaEC11 EC_3563 2002 Ecuador S. quitoense Forbes
PaEC12 EC_3678 2003 Ecuador Anarrichomenum Forbes
PaEC13 EC_3836 2004 Ecuador S. betaceum Forbes
PaEC14 EC_3860 2005 Ecuador Torva Forbes
PaEC15 EC_3864 2005 Ecuador Torva Forbes
PaEC16 EC_3865 2005 Ecuador S. jugandifolium Forbes
PaEC17 EC_3936 2006 Ecuador S. ochanthum Forbes
PaPE01 POX 102 2003 Peru S. betaceum Forbes
PaPE02 POX 103 2003 Peru S. betaceum Forbes
P. phaseoli
PpUS01 CBS 556.88 CBS
PpUS02 P10150 USA Delaware Coffey 1 Isolates were contributed by the authors and the following colleagues: Sampled by W. G. Flier and N. J. Grünwald and curated by Geert Kessel, Plant Research International (PRI), Netherlands; Geert Kessel, Plant Research International (PRI), Netherlands; Silvia Fernández Pavia, Universidad Michoacana de San Nicolás de Hidalgo, Mexico; Michael Coffey, University of California Riverside, USA; Vihn Hong Le and Arne Hermansen, Norwegian Institute for Agricultural and Environmental Research, Norway; Björn Andersson, Swedish University of Agricultural Sciences, Sweden; Renata Lebecka Młochow Research Centre, Poland; Jozsef Bakonyi, Academy of Agricultural Sciences, Hungary.

10
Table S2. Molecular clock and mutation rates obtained in this study for each locus for (A) Clade 1c and (B) P. infestans datasets. See Table S3 for indices of nucleotide variation at each locus.
A. Clade 1c Locus Clock Clock Rate UCLD stdev β-tubulin Strict 0.824 0.04 RAS Log Normal 1.839 2.2 Trp1 Strict 1.73 0.03 PITG_11126 Strict 4.09 0.02 B. P. infestans Locus Clock Clock Rate UCLD stdev β-tubulin Strict 0.54 0.02 RAS Log Normal 2.25 1.94 Trp1 Strict 1.73 0.012 PITG_11126 Strict 3.03 0.01

! 11!
Table S3. Nucleotide variation by locus, species, and sampling location. Statistics given are number of individuals (Nind), number of sequences (Nseq), length of alignment excluding gaps (L), segregating sites (S), number of heterozygous sites (Het), number of haplotypes (Hap), average pairwise nucleotide diversity (π), Watterson’s theta (θw), Tajima’s D, and Fu and Li’s D* and F* (4-7). Locus Species/Popn Nind Nseq L S Het Hap π θW Tajima’s
D Fu & Li’s D*
Fu & Li’s F*
PITG_11126 P. infestans 119 242 764 13 13# 10 0.00286 2.144 0.04 0.79 0.61 Europe 22 46 764 7 7# 5 0.00294 1.593 1.10 1.25 1.41 Mexico 48 96 764 9 9# 6 0.00154 1.752 -0.82 -0.17 -0.47 S. America 40 82 764 11 11# 8 0.00394 2.210 0.97 0.79 1.01 United States 4 8 779 2 2 2 0.00138 0.771 1.45 1.11 1.30 Africa/Asia 5 10 779 3 3 2 0.00214 1.060 2.06* 1.15 1.53 P. andina 19 38 748 16 16# 3 0.01040 3.808 3.39*** 1.58** 2.56** P. ipomoeae 7 14 787 2 1 3 0.00052 0.629 -0.96 -0.45 -0.66 P. mirabilis 11 22 778 11 11 3 0.00593 4.610 1.83 1.44* 1.80** P. phaseoli 2 4 779 0 0 1 0 0 NA NA NA β-tubulin P. infestans 118 238 1590 9 9# 8 0.00138 1.488 1.06 -0.43 0.13 Europe 22 44 1590 6 6# 3 0.00061 1.379 -0.79 1.18 0.67 Mexico 48 96 1590 7 7# 3 0.00185 1.363 2.75** 1.20 2.03** S. America 39 80 1590 9 9# 7 0.00113 1.817 -0.03 -0.84 -0.67 United States 4 8 1590 5 5# 3 0.00124 1.928 0.08 0.75 0.65 Africa/Asia 5 10 1590 0 0 1 0 0 NA NA NA P. andina 19 38 1590 23 23 2 0.00743 5.474 3.92*** 1.70** 2.89** P. ipomoeae 7 14 1590 2 2 2 0.00018 0.629 -1.48 -1.83 -1.97 P. mirabilis 11 22 1590 16 15# 6 0.00469 4.389 2.54** 1.54** 2.14** P. phaseoli 2 4 1590 0 0 1 0 0 NA NA NA Trp1 P. infestans 117 234 813 9 7 9 0.00183 1.492 -0.004 0.42 0.32 Europe 22 44 813 4 3 4 0.00185 0.920 1.48 -0.06 0.47 Mexico 48 96 813 6 4 5 0.00144 1.168 -0.20 1.12 0.81 S. America 38 76 813 6 6 6 0.00211 1.224 0.95 0.22 0.54 United States 4 8 813 4 4 4 0.00180 1.543 -0.22 -0.18 -0.21 Africa/Asia 5 10 813 3 3 2 0.00205 1.060 2.06* 1.15 1.53 P. andina 19 38 813 10 10 3 0.00293 2.380 3.48*** 1.40* 2.42** P. ipomoeae 7 14 812 0 0 1 0 0 NA NA NA P. mirabilis 11 22 813 1 1 2 0.00011 0.274 -1.16 -1.57 -1.68 P. phaseoli 2 4 813 0 0 1 0 0 NA NA NA RAS P. infestans 117 234 762 15 15# 13 0.00364 2.487 0.290 0.311 0.364 Europe 21 42 766 10 10 6 0.00569 2.324 2.585* 1.40 2.096** Mexico 47 94 766 11 11# 8 0.00164 2.150 -1.09 -2.51* -2.39* S. America 40 80 762 10 10 5 0.00377 2.019 1.12 1.38 1.53 United States 4 8 766 11 11 4 0.00643 4.242 0.808 1.52** 1.50 Africa/Asia 5 10 766 1 1 2 0.00205 1.060 2.06* 1.15 1.53 P. andina 17 34 765 23 23# 4 0.01433 5.625 3.28*** 1.39 2.37** P. ipomoeae 7 14 768 3 0 2 0.00103 0.943 -0.49 1.07 0.76 P. mirabilis 10 20 766 6 6# 3 0.00091 1.973 -2.13* -3.08** -3.25** P. phaseoli 1 2 764 0 0 1 0 0 NA NA NA

! 12!
#Also heterozygous for one or more indel. * P < 0.05 ** P < 0.02 *** P < 0.001

! 13!
Table S4. Results from testing relationships among Toluca population, US1 and Andean lineages as illustrated in Figure S10. Andean lineage Scenario Admixed population Probability 95% CI PE3 1 - 0.0040 [0.0028,0.0052] 2 - 0.0071 [0.0058,0.0084] 3 - 0.0066 [0.0055,0.0077] 4 PE3 0.0014 [0.0010,0.0017] 5 Toluca 0.0062 [0.0051,0.0073] 6 US1 0.0009 [0.0008,0.0011] 7 PE3 0.6709 [0.6478,0.6939] 8 PE3 0.1094 [0.0994,0.1194] 9 US1 0.0023 [0.0011,0.0034] 10 US1 0.0052 [0.0034,0.0070] 11 Toluca 0.0020 [0.0009,0.0032] 12 Toluca 0.1302 [0.1093,0.1511] 13 PE3 0.0474 [0.0410,0.0537] 14 US1 0.0011 [0.0004,0.0017] 15 Toluca 0.0053 [0.0034,0.0073] PE7 1 - 0.0089 [0.0055,0.0124] 2 - 0.0327 [0.0265,0.0389] 3 - 0.0141 [0.0107,0.0176] 4 PE7 0.0038 [0.0025,0.0051] 5 Toluca 0.0093 [0.0073,0.0112] 6 US1 0.0191 [0.0148,0.0234] 7 PE7 0.3656 [0.3393,0.3919] 8 PE7 0.2893 [0.2656,0.3131] 9 US1 0.0016 [0.0003,0.0030] 10 US1 0.0248 [0.0145,0.0350] 11 Toluca 0.0121 [0.0032,0.0211] 12 Toluca 0.0880 [0.0673,0.1087] 13 PE7 0.1242 [0.1069,0.1416] 14 US1 0.0012 [0.0003,0.0022] 15 Toluca 0.0050 [0.0021,0.0079] EC1 1 - 0.2524 [0.2335,0.2713] 2 - 0.0293 [0.0260,0.0326] 3 - 0.0575 [0.0519,0.0631] 4 EC1 0.0908 [0.0830,0.0987] 5 Toluca 0.0843 [0.0773,0.0913] 6 US1 0.0216 [0.0192,0.0239] 7 EC1 0.0320 [0.0276,0.0364] 8 EC1 0.3060 [0.2811,0.3309] 9 US1 0.0071 [0.0053,0.0088] 10 US1 0.0234 [0.0188,0.0280] 11 Toluca 0.0177 [0.0144,0.0210] 12 Toluca 0.0140 [0.0116,0.0163] 13 EC1 0.0088 [0.0069,0.0106] 14 US1 0.0517 [0.0420,0.0614] 15 Toluca 0.0035 [0.0026,0.0043]

! 14!
Table S5. Nucleotide substitution model for each locus as inferred from jModelTest and ModelGenerator. The appropriate most similar model available in BEAST was used for each analysis.
A. Clade 1c
Locus jModelTest ModelGenerator Model Used β-tubulin HKY HKY HKY RAS JC JC JC Trp1 K80 HKY HKY PITG_11126 HKY HKY HKY B. P. infestans Locus jModelTest ModelGenerator Model Used β-tubulin HKY HKY HKY RAS F81 JC JC Trp1 HKY HKY HKY PITG_11126 HKY HKY HKY

! 15!
Table S6. Settings used for DIYABC analyses. All runs used the same summary statistics: within population statistics were number of segregating sites, mean of pairwise differences, variance of pairwise differences, and number of private segregating sites; between population statistics were number of segregating sites, mean of pairwise differences, and FST. Posterior probabilities of scenarios were calculated using the closest 1% of simulated datasets using logistic regression. A. Prior distributions for scenarios in Figure S9. Parameter Shape Min.–Max. Increment Population size EC-1 Uniform 1–200000 1 PE-3 Uniform 1–200000 1 PE-7 Uniform 1–200000 1 Ancestor of two lineages Uniform 1–500000 1 Ancestor of three lineages Uniform 1–1000000 1 Time since divergence1 t1: two lineages Uniform 1–300000 1 t2: all three lineages Uniform 1–500000 1 Nucleotide sequence evolution2 Mean mutation rate Uniform 1.00×10⁻¹⁰ –
1.00×10⁻⁸
Gamma distribution Uniform 1.00×10⁻¹¹ – 1.00×10⁻⁷
2.00
1 An additional condition was put on the prior distributions such that t2>t1. 2 The Kimura 2-parameter nucleotide substitution model was used with invariant sites=90 and gamma rate variation parameter α=0.050. B. Prior distributions for scenarios in Figure S10. Parameter Shape Min.–Max. Increment Population size Toluca Uniform 1–1000000 1 EC-1 Uniform 1–300000 1 PE-3 Uniform 1–200000 1 PE-7 Uniform 1–200000 1 US-1 Uniform 1–500000 1 Unsampled population Uniform 1–2000000 1 Ancestor of two lineages Uniform 1–2000000 1 Time since divergence3 t1: two populations (scenarios 1-3) Uniform 1–200000 1 t2: two or three populations Uniform 1–500000 1 t3: sampled & unsampled populations
(scenarios 7-15) Uniform 1–10000000 1
Admixture events Proportion from parent population Uniform 0.001–0.999 0.001 ta1: timing since admixture event
(scenarios 4-12) Uniform 1–300000 1
ta2: timing since admixture event (scenarios 13-15)
Uniform 1–1000000 1

! 16!
Nucleotide sequence evolution4 Mean mutation rate Uniform 1.00×10⁻¹⁰ –
1.00×10⁻⁸
Gamma distribution Uniform 1.00×10⁻¹¹ – 1.00×10⁻⁷
2.00
3 Additional conditions were put on the prior distributions to force the timing of events into the tree structure shown in Figure S9, including placing admixture events before or after population splits and ordering of the population splits such that t2>t1, t2>ta1, t3>ta1, ta2>t2, and t3>ta2. 4 The Kimura 2-parameter nucleotide substitution model was used with invariant sites=90 and gamma rate variation parameter α=0.050. C. Prior distributions for scenarios in Figure 5. Parameter Shape Min.–Max. Increment Population size Toluca Uniform 1–1000000 1 EC-1 Uniform 1–400000 1 PE-3 Uniform 1–200000 1 US-1 Uniform 1–400000 1 Unsampled population Uniform 1–1000000 1 Ancestor to Toluca & EC-1 Uniform 10–1000000 1 Ancestor to Toluca & US-1 Uniform 10–1000000 1 Time since divergence5 t1: Toluca–EC-1 Uniform 1–200000 1 t2: Toluca–US-1 Uniform 1–600000 1 t3: All populations Uniform 1–1000000 1 Admixture events Proportion from parent population Uniform 0.001–0.999 0.001 Timing since admixture event Uniform 1–200000 1 Nucleotide sequence evolution6 Mean mutation rate Uniform 1.00×10⁻¹⁰ –
1.00×10⁻⁸
Gamma distribution Uniform 1.00×10⁻¹¹ – 1.00×10⁻⁷
2.00
5 Additional conditions were put on the prior distributions to force the timing of events into the tree structure shown in Figure 5, including placing admixture events before or after population splits and ordering of the population splits such that t3>t1, t3>t2. 6 The Kimura 2-parameter nucleotide substitution model was used with invariant sites=90 and gamma rate variation parameter α=0.050.

! 17!
Table S7. Inferred root subpopulation using three starting seeds for (A) the mitochondrial P3 and P4 regions using only isolates from Mexico and the Andes, and (B) the nuclear RAS locus, using the data from Gómez-Alpizar et al. (1). A. P3 and P4 Seed 1 Seed 2 Seed 3 Theta Migration Root
location Prob. Root
location Prob.
Root location
Prob.
1.8 0.3, 0.3 Mexico 0.505 Mexico 0.500 Andes 0.501 1.0, 1.0 Andes 0.501 Andes 0.505 Mexico 0.508 5.0, 5.0 Mexico 0.559 Mexico 0.556 Mexico 0.510 10.0, 10.0 Mexico 0.587 Mexico 0.577 Andes 0.669 2.0 1.0, 1.0 Andes 0.504 Andes 0.501 Mexico 0.503 5.0, 5.0 Andes 0.513 Andes 0.531 Andes 0.562 10.0, 10.0 Andes 0.689 Mexico 0.727 Andes 0.549 B. RAS Seed 1 Seed 2 Seed 3 Theta Migration Root
location Prob. Root
location Prob.
Root location
Prob.
2.0 0.5, 0.5 SA 0.515 NSA 0.537 SA 0.535 5.0, 5.0 SA 0.514 SA 0.582 SA 0.847 10.0, 10.0 NSA 0.889 NSA 0.875 SA 0.686 5.0, 10.0 SA 0.916 SA 0.949 SA 0.985 10.0, 5.0 NSA 0.679 NSA 0.902 SA 0.935 4.3, 14.6 * SA 0.965 SA 0.992 SA 0.970 14.6, 4.3 NSA 0.939 NSA 0.996 NSA 0.979 * Migration rates used by Gómez-Alpizar et al. (1)

! 18!
Table S8. Root population inferred using RAS sequences from Mexico and Andean samples from this study. Migration rates were symmetric for all runs. Seed 1 Seed 2 Seed 3 Seed 4 Simulations 1×10⁶ 1×10⁶ 1×10⁷ 1×10⁷ θ M Root Prob. Root Prob. Root Prob. Root Prob. 1.5 0.5 Mexico 0.541 Mexico 0.584 Andes 0.510 Mexico 0.521 5.0 Mexico 0.638 Mexico 0.703 Mexico 0.564 Mexico 0.583 10.0 Andes 0.723 Mexico 0.975 Mexico 0.612 Andes 0.794 2.0 0.5 Andes 0.676 Andes 0.638 Mexico 0.513 Mexico 0.514 5.0 Mexico 0.883 Andes 0.614 Mexico 0.590 Andes 0.794 10.0 Mexico 0.714 Andes 0.688 Mexico 0.663 Mexico 0.939

! 19!
Supporting Figures Figure S1. Structure plots for K from 2 to 10 for the Andes (with and without admixture) and Mexico samples of P. infestans. Figure S2. Delta K values obtained from Structure Harvester for (A) Mexico and (B) Andes (with admixture) samples of P. infestans. Note the highest delta K value corresponds to K=4 for Mexico and K=2 for the Andes. Figure S3. Root state posterior probabilities for each location for (A) Clade 1c and (B) P. infestans. Independent analysis of each locus produced high probabilities for the root of both Clade 1c and P. infestans in Mexico (green bar). Figure S4. Maximum clade credibility genealogy for the β-tubulin locus. Colors of branches indicate the most probable geographic origin of each lineage. Figure S5. Maximum clade credibility genealogy for the PITG_11126 locus. Colors of branches indicate the most probable geographic origin of each lineage. Figure S6. Maximum clade credibility genealogy for the RAS locus. Colors of branches indicate the most probable geographic origin of each lineage. Figure S7. Maximum clade credibility genealogy for the Trp1 locus. Colors of branches indicate the most probable geographic origin of each lineage. Figure S8. Maximum clade credibility phylogeny of Phytophthora Clade 1c from all four loci. Colors of branches indicate the most probable geographic origin of each lineage and taxon colors represent species (purple: P. phaseoli; blue: P. ipomoeae; green: P. mirabilis; red: P. andina; black: P. infestans). Figure S9. Scenarios used to test evolutionary relationships among Andes lineages EC-1, PE-3, and PE-7 using DIYABC. Present day populations are at the base of the tree schematic. Ancestral relationships among these populations are represented by lines intersecting in the past, with the vertex of the schematic representing the most recent common ancestor of all samples. Horizontal lines indicate admixture events between the ancestral populations connected by the horizontal line. Change in line thickness indicates a potential change in population size, such that all branches in scenarios D, E, and F had independently estimated population sizes. The scenarios in which PE-3 and PE-7 diverged more recently from each other than from EC-1 produced high posterior probabilities. Figure S10. Scenarios used to test evolutionary relationships of EC-1, PE-3, and PE-7 lineages to US-1 in the Andes and to the Toluca, Mexico population. The 15 scenarios were compared against each other, using three independent sets of scenarios with EC-1, PE-3, and PE-7, in turn, substituted for population ‘X’. Present day populations are at the base of the tree schematic. Ancestral relationships among these populations are represented by lines intersecting in the past, with the vertex of the schematic representing the most recent common ancestor of all samples.

! 20!
Horizontal lines indicate admixture events between the ancestral populations connected by the horizontal line. Potential changes in population size over time are indicated by changes in line thickness, but line thickness is not proportional to population size. The dashed line represents an unsampled population that has contributed to the genetic variation observed in sampled populations.

A. Andes (No admixture model) C. Mexico (Admixture model)B. Andes (Admixture model)

A. Mexico
B. Andes

RAS/iRASTrp1B-tubulin PITG_11126
0.0
0.2
0.4
0.6
0.8
CO EC ES HU MX NL PE PO SA SW UK USA VT CO EC ES HU MX NL PE PO SA SW UK USA VT CO EC ES HU MX NL PE PO SA SW UK USA VT CO EC ES HU MX NL PE PO SA SW UK USA VT
Pos
terio
r Pro
babi
lity
of R
oot S
tate
0.0
0.2
0.4
0.6
0.8
CO EC ES HU MX NL PE PO SA SW UK USA VT CO EC ES HU MX NL PE PO SA SW UK USA VT CO EC ES HU MX NL PE PO SA SW UK USA VT CO EC ES HU MX NL PE PO SA SW UK USA VT
Location (Country)
A) Clade 1c
B) P. infestans
Pos
terio
r Pro
babi
lity
of R
oot S
tate
RAS/iRASTrp1B-tubulin PITG_11126
Figure S3. Root state posterior probability values for each location after 300 millions MCMC generations by locus for (A) Clade 1c species and (B) P. infestans. The posterior probability for a Mexico root (greenbar) is higher than for any of the other countries for each locus independently and both datasets.

location.states
Colombia
Ecuador
Estonia
Hungary
Mexico
Netherlands
Peru
Poland
South Africa
Sweden
United Kingdom
United States
Vietnam
0.04 substitutions per site
PiVT03a
PiMX4
5a
PmMX09a
PiUK02a
PaEC14a
PaEC
15a
PiES0
2b
PiMX04b
PiES0
4a
PiUK06a
PiCO02a
PaEC09a
PiEC03a
PiPE06a
PiMX2
9a
PiMX07a
PiMX18b
PiUK03b
PiMX65a
PiHU02a
PiMX05b
PoMX03b
PiMX06a
PiUS11a
PiPE08b
PiMX14a
PmMX12b
PpUS01b
PiMX50a
PaEC01a
PiPE02b
PaEC08b
PiEC02a
PiMX72a
PiMX46a
PiUK07a
PiMX17a
PiUK04b
PiEC06a
PaEC12b
PiCO01a
PiPO
01b
PaEC06a
PiES0
4b
PiPE1
1b
PmMX10b
PiUK02b
PmMX03a
PiMX15b
PiMX41a
PiNL02b
b12
EPi
P
PiMX18a
PiES0
3a
PaEC04b
PiES0
5b
PaEC08a
PiPE1
2b
PiCO01c
PiMX30b
PaEC07a
PiPE22b
PiMX0
5a
PiMX45b
PiPE0
6b
PiCO05c
PiSW
01b
PiPE1
2a
PiPE2
5a
PiMX66a
PiSA01a
PiPE2
9a
PaEC17b
PiUK04a
PiMX16a
PaEC02aPiPO02a
PaEC10b
PaEC10a
PoMX04a
PiEC10b
b90K
UiP
PiMX23b
PiMX67a
PiMX42b
PmMX01b
PiVT04bPiVT03b
PiUK08a
PiEC1
1a
PiSW
02a
PaEC03b
PiUK03a
PpUS02b
PoMX06b
PiPE1
4a
PiPO02b
PiMX14b
PiMX41b
PiMX21b
PiMX28a
PiPE2
8a
PiMX49a
PiCO03a
PiPE05b
PaEC07b
PaEC17a
PiPE2
4b
PiMX4
3a
PaEC09b
PmMX05b
PiUK10b
PiEC07b
PiUK09a
PiEC07a
PiMX1
2a
PmMX03b
PiMX11a
PiEC08b
PiMX29b
PiMX07b
PiES0
5a
PiMX20a
PiPE1
4b
PaEC16b
PiMX13a
PiMX71b
PiVT02a
PiMX12b
PiUK05b
PiMX4
3b
PiEC11b
PiUK01a
PiMX63a
PaEC05a
PaEC14b
PiEC1
2a
PpUS02a
PiMX26b
PiUK10a
PpUS01a
PoMX01a
b80K
UiP
PiMX26a
PaEC12a
PiMX06b
PmMX04b
PaEC11b
PiEC10a
PiMX13b
PmMX11a
PoMX08bPiM
X17b
PiMX1
5a
PiMX27b
PaEC13b
PoMX05a
PiPE07b
PiPE2
4a
PiEC03b
PmMX11b
PiMX6
4a
PiMX10b
PmMX05a
PiVT01a
PiMX4
7b
PiEC13a
PiUK05a
PiUS17a
PmMX04a
PiPO01a
PiMX64b
PiPE0
2a
PaEC
03a
PiMX16bPiMX50b
PaEC01b
PiPE13a
PiNL01b
PiPE1
0b
PiMX25b
PiPE
20b
PiMX22b
PaEC11a
PiMX40b
PiMX01a
PiEC14a
PmMX12a
PiES0
1a
PiMX4
4a PiUS11b
PiMX11b
PaEC02b
PiMX1
0a
PiMX22aPiMX20b
PiUS08b
PiMX27a
PiMX24a
PiMX72b
PaPE02b
PiPE08a
PiPE0
4a
PiMX46b
PiSA01b
PiPE2
7a
PiSW
01a
PoMX05b
PiMX30a
PiM
X61a
PmMX10a
PiEC14b
PiPE0
1a
PoMX02b
PiMX62b
PiMX4
4b
PoMX03a
PiMX02b
PiPE2
3a
PoMX01b
PiNL01a
PiPE0
5a
PiMX71a
PiCO05b
PiMX0
4a
PiMX42a
PiPE04b
PiPE2
6b
PiVT02b
PiPE2
6aPiP
E27b
PaEC15b
PiUK06b
PiES0
2a
a20
XMi
P
PaEC05b
PiMX62a
PiUK
01b
PiCO04a
PaEC13a
PiMX4
0a
PiMX48b
PiMX28b
PaEC16a
PmMX09b
PoMX06a
a01E
PiP
PiUS08a
PiPE1
3b
PiMX65b
PiUS17b
PmMX02a
PiMX63b
PiPE0
9a
PiPE0
1bPiEC12b
PiMX49b
PiMX2
3a
PiCO05a
PaEC06bPiMX03b
PiMX48a
PiPE
29b
PiMX2
5a
PiES01b
PiPE
28b
PiMX01b
PiPE2
0a
PiCO03b
PiMX47a
PiPE2
5b
PmMX02b
PoMX08a
PiUK07b
PiEC0
6b
PiM
X67b
PiSW
02b
PiPE0
7a
a12
EPi
P
PiUS12a
PmMX06b
PiEC13b
PiMX21a
PiCO02b
PiEC02b
PaPE01b
PoMX02a
PiMX66b
PiES0
3b
PiVT01b
PiPE2
2a
PmMX06a
PiPE09b
PiMX19a
PoMX04b
PiMX61b
PiCO01b
PaEC04a
PiVT04a
PaPE
01a
PiPE2
3b
PiEC08a
PmMX01a
PiMX24b
PaPE
02a
PiMX19b
PiNL02a
a11E
PiP
PiMX0
3a
PiHU02b
PiUS12b
PiCO04b
MX
EC
MX
MX
MX
MX
US
Figure S4. Maximum clade credibility genealogy for the β-tubulin locus. Colors of branches indicate the most probable geographic origin of each lineage.

PiUK05a
PiEC
06b
PmMX07a
PaPE02a
PmMX04b
PiMX17b
PaEC11a
PiPE08a
PiEC
14b
PaEC06b
PiMX49b
PaEC11b
PiMX17a
PiUK08c
PiMX12a
PiUK08a
PmMX01b
PiMX24b
PaEC10b
PiMX21
a
PiMX64b
PiUK05b
PiPE14aPi
EC13
b
PiPE09b
PiUK10a
PiUK02b
PiEC
10a
PiUK07a
PiMX43b
PoMX05
a
PiHU02a
PiPE03b
PiPE14b
PiEC08b
PpUS01a
PiUK10b
PiES04b
PiPE
25b
PoMX04a
PiPE13b
PiMX23a
PaEC10a
PaPE01b
PiMX25a
PiM
X46b
PaEC12a
PiM
X22a
PiMX01
a
PiPE02a
PiVT
02b
PaEC13b
PiVT
03b
PmMX06b
PiM
X30b
PiMX25b
PiPE03a
PiMX42b
PiMX07b
PiPE06a
PiVT04a
PmMX04a
a60
CEaP
PiPE
01a
PmMX05a
PmMX05b
PmMX02b
PiEC02a
PmMX09a
PiMX05b
a11EPiP
PiPE10a
PiMX72
a
PoMX 08a
PiMX06a
PiM
X18a
PiCO02b
PiUK08b
PiSA
01a
PiPE07a PaEC07b
PpUS01b
PiMX26b
PiPO
01a
PiM
X01b
PiES01b
PmMX10b
PiPE09a
PiEC
13a
PiUS17a
PaEC09aPiCO04a
PiM
X48a
PiES
04a
PoMX01b
PiMX41
a
PiPE
13a
PiMX41b
PiPE
12a
PaEC17a
b81X
MiP
PiPE26b
PiPE
27b
PiUK06c
PiUS17b
PiSW02a
PiES
05a
PiMX62
a
PoMX02b
PiCO04b
PiPE11b
PaEC13a
PmMX10a
PiMX16b
PiPE05aPaEC12b
PiVT
03a
PiM
X29a
PiES02a
PiMX26a
b41X
MiP
PiM
X50b
PiEC07b
PiCO02aPiEC12a
PoMX03a
PiEC01b
PiM
X28b
PiPE04b
PiPE12b
PiMX40b
PiMX27a
PiMX49a
PaEC01a
PiM
X44b
PoMX04
b
PiPE
23b
PoMX06a
PaEC15a
PmMX11a
PiUK01bPiSW01b
PiMX13a
PiEC01a
PaEC14b
PiVT01a
PaEC04a
PiUK03b
PiMX46a
PiPE28a
PiES01a
PmMX01aPmMX03a
PiUK04b
PiMX10b
PpUS02b
PiPE29a
PiMX24a
PoMX02a
PoMX03b
PiPE23a
PiM
X15b
PiC
O05
a
PaEC04b
PiM
X40a
PiSW02b
PiMX07a
PiMX42
a
PaEC01b
PmMX02a
PiPE
22a
PiMX47b
PiEC03b
PiPE06b
PiM
X66a
PiSW01a
PiUS08a
PiMX71b
PaEC16b
PaEC
07a
PmMX12b
PiMX62b
PiPE
25a
PiUS12a
PiM
X02a
PiEC
11b
PiM
X64a
PiMX66
b
PiMX14a
PiUK02a
PiPE02b
PaEC02a
PiEC14a
PiMX21b
PiMX30a
PiCO03a
PiCO03b
PaEC16a
PaEC08b
PiMX61b
a61XMiP
PiMX0
5a
PiPE04a
PiPE14c
PiEC
10b
PaEC15b
PiUS12b
PiUS11a
PiEC
12b
PiUS08b
PmMX12a
PaEC03b
PiPE24a
PiM
X44a
PiPE
20b
PaEC09b
PiMX50
a
PiMX45a
PiUK09a
PiPE27a
PiUK01a
PiPE
21b
PiMX19a
PaEC02b
PmMX09b
PiMX65b
PaEC05b
PiUK03a
PiPE20a
PiPE05b
PiM
X03a
PiUK06a
PiPE07bPaEC17b
PiVT02a
PaEC05a
PaPE
01a
PiMX04
a
PiMX61a
PaEC08a
PiMX06b
PoMX05b
PiPO02b
PiMX20b
b91XMiP
PiMX29b
PiNL01a
PiEC02b
PiES02b
PiVT
01b PiM
X11a
PiMX22b
PiMX03b
PiPE29b
PiUK06b PoMX06
b
PiHU02b
PiES
03a
PiMX67b
PmMX07b
PiVT
04b
PiCO01a
PiMX11b
PiNL01b
PiEC02c
PoMX01a
PoMX08 b
a30CEaP
PiM
X04b
PiM
X65a
PiEC11a
PiM
X12b
PiPO
02a
PiMX47
a
PiCO01b
PiMX43a
PmMX11b
PiCO05b
PiPE
22b
PiSA
01b
PiEC07a
PiPE01b
PiEC03a
PiPE21a
PpUS02a
PiPE08b
PiUK09b
PiUK07b
PiMX48b
PiMX71a
PiM
X63b
PiM
X63a
PiMX02b
PiMX28aPi
PE24
b
PiUS11b
PiES03b
PiM
X67a
PiMX72b
PmMX06a
PiMX15a
PiMX23b
PiMX13b
PiPE26a
PiNL02b
PiPE28b
PaEC14a
PiEC
06a
PiMX27b
PiNL02a
PiEC08a
PaPE02b
PiM
X45b
PiPE10b
PiM
X10a
PiES05b
PiUK04a
PiPO01b
PmMX03b
PiM
X20a
location.states
Colombia
Ecuador
Estonia
Hungary
Mexico
Netherlands
Peru
Poland
South Africa
Sweden
United Kingdom
United States
Vietnam
MX
MX
US
MX
MX
2.0E-4 substitutions per site
EC
Figure S5. Maximum clade credibility genealogy for the PITG_11126 locus. Colors of branches indicate the most probable geographic origin of each lineage.

2.0E-4 substitutions per site
PiMX6
6a
PiMX4
2b
PiMX2
4b
PiMX4
4a
PiSA0
1b
PmMX01b
PaEC08a
PiMX72b
PiEC02a
PiMX2
5a
PiES0
5b
PmMX06b
PiMX18b
PaEC10a
PaEC07b
PiVT03b
PaEC04a
PiCO0
3a
PiMX07b
PiMX49b
PoMX05b
P10KUib
PiMX6
1b
a10E
PiP
PiMX03b
PiPE04a
PaEC05a
PiMX6
3a
PiPE21a
PiMX3
0b
PiCO0
2b
PiPE21b
PiNL02b
PmMX05a
PiPE0
9a
PiMX27b
PiMX40a
PiMX21a
PiES0
5a
PiEC10b
PaEC08b
PmMX03b
b20S
EiP
PiMX4
2a
PoMX02a
PmMX09a
PaPE02b
PaEC06b
PiES0
2a
PiMX67a
PiCO04a
PaEC15a
PiM
X24a
PiPE26b
PiMX48b
PiPE26a
PiVT04a
PiEC03a
PiPE03b
PaEC01b
PiMX4
4b
PaEC13a
PiPO01a
PiUS08b
PiMX06b
PiEC01b
PiPO02a
PiES04b
PiMX7
2a
PiPE2
5a
PiCO03b
PaEC09b
PoMX04bPiPO01b
PiUK09a
PoMX01b
PiMX29a
PiMX1
2b
PiEC03b
PiSW01a
PiPE04b
PiMX16ab60KUiP
PoMX03a
PiMX17a
PiEC14b
PiES03b
PiMX03a
PiUK
01a
PiPE01b
PiPE09b
PmMX04a
PiMX0
4b
PiPE0
5a
PaEC10b
PiMX46b
PiMX19b
PaEC13b
PaEC06a
PiES0
1b
PiPE20b
PiMX19a
PiMX25b
PiM
X02a
PoMX05a
PiMX2
6a
PiPE07b
PiMX61a
PaEC15b
PiMX18a
PiEC06b
PiMX27a
PiCO01b
PiPE1
4a
PiPE22b
a11EPiP
PiMX11b
PiVT01b
PoMX06a
PiPE12b
PiMX14a
PiVT03a
PiEC13b
PiEC12a
PiUS08a
PiSA0
1a
PaEC04b
PiMX1
7b
PiM
X15a
PoMX07b
PiMX5
0a
PpUS01b
PmMX11a
PiUK1
0a
PiMX4
3a
PiVT01a PiPE1
2a
PiPE2
4a
PiES0
4a PiSW01b
PiMX20b
PiMX05a
PiUK06a
PiPE14b
PiMX64aPiUK07a
PaEC01a
PmMX09b
PiMX6
6b
PiVT04b
PiMX62b
PaEC02b
PiM
X41a
PaEC14a
PiVT02b
PaEC09a
PiPE02b
PiEC08a
PiEC11a
PiUK05a
PmMX08aPiPO02b
PiMX65b
PoMX04a
PaEC11b
PiMX49a
PiUK
02b
PiMX48a
PiMX4
5a
PiPE0
3a
PmMX11b
PiEC13a
PmMX10a
PiM
X28a
PmMX03a
PmMX07a
PiUK
04b
PaEC02a
PiEC02b
PiCO
05b
PiPE08a
PiPE2
2a
PiMX62aPoMX07a
PiEC06a
PiPE05b
PiMX67b
PiMX0
6a
PiEC08b
PmMX05b
PaEC11a
PiPE08b
PiMX4
1b
PiEC11b
PiMX16b
PiPE25b
PiMX71a
PmMX07b
PaEC07a
PaEC05b
PiMX1
4b
PiMX6
4b
PaEC12b
PmMX04b
PmMX01a
PiEC10a
PiVT02a
PiMX13a
PiMX46a
PiMX28b
PiPE2
7a
PaPE02a
PiMX47b
PiCO0
5a
PiMX11a
PiNL02a
PiPE0
2a
PiUS12a
PiMX4
5b
PiUK02a
PiPE1
3a
PiMX15b
PiMX21b
PiPE29b
PiNL01a
PmMX08b
PaEC03a
PiPE06b
PiPE11b
PiES0
3a
PiCO0
1a
PiMX47a
PiMX26b
PaPE01b
PiUK10b
PiMX2
2b
PiMX02b
PiMX22a
PiUK0
4a
PiMX01a
PiPE28b
PoMX02b
PiPE23b
PiEC14a
PiES01a
PiMX40b
PiPE10b
PiCO0
4b
PiPE28a
PiPE06a
PiPE27bPiPE24b
PiMX13b
PmMX10b
b90KUiP
PiMX4
3bPpUS01a
PiPE13b
PiMX01bPiMX63b
PiUK
05b
PaEC12a
PaEC14b
PiMX50b
PaEC03b
PiPE29a
PoMX03b
PiEC01a
PiUK07b
PiMX30a
PiCO02a
PiPE10a
PiMX29b
PiMX12a
PoMX06b
PaPE01a
PiNL01b
PiMX65a
PoMX01a
PiMX7
1b
PiMX20a
PiMX0
4a
PiPE07a
PmMX06a
PiSW02a
PiMX07a
PiPE2
0a
PiPE2
3a
PiSW02b
PiEC12b
PiUS12b
PiMX0
5b
MX US
EC
MX
MX
location.states
Colombia
Ecuador
Estonia
Hungary
Mexico
Netherlands
Peru
Poland
South Africa
Sweden
United Kingdom
United States
Vietnam
MX
Figure S6. Maximum clade credibility genealogy for the RAS locus. Colors of branches indicate the most probable geographic origin of each lineage.

PiCO
03a
PiEC10b
PiPE13a
PiEC07b
PiMX15a
PiMX41b
PiMX07b
PiPE
06a
PiMX48a
PiM
X62b
PiMX42b
PiPE02a
PoMX05b
PiUK04a
PiM
X18a
PiMX19b
PmMX12b
PiSA01b
PiMX03b
PiEC11b
PiPE24b
PiPE
21aPa
PE02
a
PiEC14a
PoMX04a
PiPE12b
PmMX03a
PiPE22b
PaEC17b
PiCO05b
PoMX06b
PaEC13a
PiPE12aPiPE24a
PpUS01b
PiMX05b
PiMX25b
PiEC07a
PiCO02b
PiPE
10a
PiMX44b
PmMX02b
PiSW02b
PaEC16
a
PiMX12a
PiMX50b
PiMX61b
PmMX06a
PiMX62a
PiM
X67b
PiMX02a
PiMX14a
PmMX02a
PmMX01a
PiM
X43a
PiM
X26b
PmMX07a
PiVT0
3a
PiPE09a
PpUS02a
PiMX11a
PiES
05b
PiU
K06a
PiPO02b
PmMX08b
PaEC04a
PiVT04b
PiPE29a
PiMX64b
PoMX06a
PpUS01a
PiVT03b
PaEC15b
PiPE
26a
PiPE25b
PiMX63a
PaEC08a
PiEC02b
PiMX10a
PaEC13b
PiCO04b
PaEC10b
PiMX45b
PmMX10a
PoMX03b
PiPE
22a
PiU
K03b
PiES04a
PiMX01b
PiU
S11a
PaEC05b
PiU
K01a
PiMX15b
PaEC01b
PiMX30a
PaEC
14a
PiMX25a
PiES
03a
PiVT04a
PiMX46a
PoMX05a
PaEC03b
PaEC
07a
PmMX04a
PiUK08a
PiMX06a
PiMX17b
PiMX46b
PiPE05a
PiEC01b
PiMX29b
a71SUiP
PiCO
05a
PiH
U02
a
PiMX03a
PiCO
03b
PiMX14b Pi
UK0
9a
PaEC08b
PiEC06b
PiEC08b
PiPE29b
PiNL02b
PiMX06b
PiEC
01a
PiMX29a
PaEC02b
a32X
MiP
PiM
X22b
PiPE03b
PiPE
01a
PmMX05a
PaEC11b
PoMX02b
PiUK10b
PiPE
05b
PiHU02
b
PiEC13a
PiMX20a
PiEC03b
PiPE13b
PiMX49a
a30KUiP
PoMX01a
PiPE26
b
PiPO01b
PoMX08a
PiMX44a
PiES
03b
PiU
K10a
PaEC04b
PiMX47b
PmMX09b
PiMX48b
PiM
X63b
PmMX11a
PiPE10b
PiMX50a
PaEC17a
PiMX64a
PiES02a
PiEC13b
PmMX12a
PiES
01b
PiMX45a
PaEC05a
PiM
X30b
PmMX03b
PiNL01b
PiMX23b
PiPE21b PiM
X49b
PpUS02b
PiPE
04a
PiMX28b
PiEC12a
PiCO
04a
PiPO
01a
PiUS12b
PaEC01
a
PiPE
23a
PiUS08b
PiUK08b
PiVT01b
PiMX17a
PiMX21b
PiMX07a
PaEC
02a
PiCO
02a
PaEC09b
PiEC
06a
PiPE27a
PiUK05b
PiMX02b
PiEC
03a
PiM
X72b
PiCO
01a
PaEC03
a
PoMX03a
PiEC
02a
PiMX61a
PiMX40a
PiMX65b
PiMX43b
PmMX01b
PaEC
10a
PiPE07a
PiPE20b
PiPO02a
PmMX04b
PiPE28aPiPE23b
PiPE09
b
PmMX11b
PaEC06
a
PiMX27b
PiCO
01b
PaEC14b
PaPE01b
PiMX22a
PiMX20b
PiMX16b
PiMX28a
a50X
MiP
PiMX66a
PaEC06b
PiMX71a
PiMX21a
PiMX04b
PiM
X13b
PiVT02b
PiMX47a
PiMX66b
PiVT0
2a
PmMX07b
PiPE
11a
PiMX24a
PiES05a
PiUK04b
PiPE07b
PiMX16a
PmMX06b
PiU
S12a
PiPE04b
PiSW01a
PiMX27a
PiUK09b
PiUS17b
PiEC11a
PiVT0
1a
PiM
X13a
PiMX26a
PiUK07b
PiPE25a
PiMX42a
PiPE20a
PaEC07b
PiMX19a
PiPE
01b
PiUK01b
PiEC14b
PaEC11a
PiEC08a
PaEC
12a
PiES
02b
PaEC15a
PiU
K07a
PaPE02b
PiMX04a
PiMX41a
PiUK05a
PiPE11b
PiM
X18b
PoMX04b
PiUK06b
PiSW02a
PiPE02b
PiEC10a
PaEC
09a
PiM
X10b
PaEC16b
PoMX01b
PiMX40b
PiU
K02a
PiMX24b
PiNL02a
PiM
X12b
PaEC12b
PiMX65a
PiMX67a
PmMX10b
a80S
UiP
PiNL01a
PmMX05b
PiEC12b
PiMX72a
PiPE06b
PiES
04b
PiUS11b
PiPE27b
PiPE28b
PiES
01a
PiMX01a
PiMX11b
PaPE
01a
PiSA01a
PiUK
02b
PmMX09a
PiM
X71b
PoMX02a
PiPE
03a
PiSW01b
MX
US
MX
MX
MX
MX
location.states
Colombia
Ecuador
Estonia
Hungary
Mexico
Netherlands
Peru
Poland
South Africa
Sweden
United Kingdom
United States
Vietnam
4.0E-5 substitutions per site
Figure S7. Maximum clade credibility genealogy for the Trp1 locus. Colors of branches indicate the most probable geographic origin of each lineage.

3.0E-4
PiUK08a
PiMX49b
PpUS02a
PiMX28
a
PiPE14c
PmMX07b
PiES0
2bPiM
X63b
PiM
X40a
PiUS08b
PiPE22a
PiVT02a
PaPE01b
PaEC16b
PaEC
16a
PiMX2
5a
PiSW
01b
PiMX45b
PiCO0
5c
PiPE13a
PiPE26a
PaPE01a
PiM
X49a
PiCO0
1c PiES04b
PiEC03b
PpUS01a
PiPE06a
PoMX01b
PiUS1
1b
PaEC
13a
PiMX12a
PiVT03b
PiEC02a
PmMX05b
PmMX01a
PiMX72
b
PiES03b
PiMX29b
PaEC
15a
PmMX02b
PiUK04a
PiMX27a
PiMX24a
PiSA0
1a
PaEC03b
PiUK06b
PiPE24a
PiPE25b
PaEC17b
PoMX02a
PiPE29a
PaEC04b
PiPO02a
PiCO03a
PmMX06a
PiMX0
6a
PiMX28b
PiMX7
1a
PaEC02b
PiEC11b
PmMX12b
PiEC10b
PiMX13b
PiMX27b
PiEC0
3a
PiMX07b
PiPE1
2b
PiMX11a
PoMX05a
PiMX6
2a
PiPE27b
PiMX42b
PiMX26b
PiUS1
1a
PiM
X62b
PiCO0
5a
PiUS1
7a
PiUK10a
PaPE02a
PoMX07a
PiMX61a
PmMX04a
PiES04a
PpUS01b
PiMX01
b
PiMX22b
40OCiP
a
PiMX50a
PiPE11a
PaEC
12a
PmMX02a
PmMX09a
PiUS12b
PaEC08b
PmMX01b
PiMX15a
PiUK01a
PmMX04b
PaEC04a
PmMX03aPmMX11a
PiMX0
2a
PoMX04b
PiMX42a
PiUS17b
PiPO
01b
PiMX2
4b
PaEC11a
PiNL0
2a
PiCO01a
PoMX06a
PiPE24b
PiUK03b
PiCO
02a
PiPE0
3a
PiEC13aPoMX04a
PiMX19b
PpUS02b
PaEC
05a
PiMX06bPiMX02b
PiEC02b
PiPE28a
PiSW
02b
PiPE0
2a
PiMX20a
PiUK
01b
PiMX04b
PiMX2
5b
PiPE22b
PiMX48b
PiPE21a
PiCO02b
PiMX48a
PiSA01b
PiMX46a
PaEC11b
PiMX47b
PmMX03b
PiCO04b
PiPE26b
PiMX41a
PiMX23a
PiMX67a
PiPE23a
b30X
MiP
PiUK07a
PiCO03b
PiMX40b
PiM
X61bPiM
X72a
PiMX15b
PiVT02b
PiPE20b
PiES0
1b
PiVT03a
PiEC14a
PiMX21a
PiPE28b
PaEC13b
PiMX05b
PiMX41b
PiUK09a
PaEC17a
PiMX17b
PiMX6
6b
PiM
X65a
PiMX07a
PiPE20a
PiMX04a
PiPE1
4b
PiMX1
4b
PiMX26
a
PiMX45a
PiPE1
1b
PoMX03bPiVT04a
PiPE0
8a
PiUK08b
PaEC
14a
PiEC13b
PiMX05a
PiMX18b
PiPE04b
PiPE05b
PiMX44a
PaEC15b
PiUS12a
PiMX1
8aPiPE14a
PaEC
08a
PmMX09b
b20OPiP
PiMX3
0a
PiMX44b
PiMX46b
PiNL01a
PiNL02b
PaEC10b
PaEC01b
PiES05b
PiMX13aPiVT01b
PiEC07a
PiES05a
PiMX10a
PiPO01a
PiES01a
PiMX16
a
PiUK
08c
PiUK03a
PiMX1
7a
PiVT01a
PaEC07b
PiPE10b
PiEC14b
PiEC0
8a
PiMX6
6a
b34
XMi
P
PiPE0
5a
PmMX07a
PiM
X65b
PaEC03a
PmMX10b
PiMX64a
PiES03a
PiMX03aPiUK06c
PiPE29b
PiPE08b
PiEC06b
PiPE0
1b
PiCO01b
PoMX02bPiEC06a
PoMX03a
PiPE21b
PiEC08b
PiMX19a
PiVT04b
PiMX10
b
PiPE1
3b
PiMX3
0b
PiEC07b
PaEC01a
PiMX29a
PiUK06a
PiEC01aPiMX22a
PiMX16b
PiHU02b
PaPE02b
PiUS0
8a
PmMX10a
PiES02a
PiPE27a
PiUK0
2a
b60E
PiP
PaEC
09a
PiPE01a
PiMX6
3a
PiPE10a
b90KUiP
PoMX07b
b40K
UiP
PiEC01
b
PaEC
06a
PaEC10a
PiMX23
b
PiUK02b
PiPE0
9a
PiMX20
b
PiPE09b
PaEC02a
PiPE07b
PoMX01a
PmMX05a
PiMX71
b
PiMX67b
PaEC14b
PiPE02b
PiUK10b
PoMX06bPoMX08b
PiPE12a
PiNL01b
PiMX64b
PiMX01a
a74X
MiP
PiSW02a
PiUK05a
PiPE04a
PiMX11b
PiMX12b
PiMX50b
PiPE07a
PaEC09b
PiPE03b
PiEC02c
PoMX05b
PiUK07b
PiMX14a
PiEC1
2a
PmMX12a
PiEC10a
PmMX06b
PiPE23b
PiM
X43a
PoMX08a
PiUK
05b
PaEC05b
PaEC
07a
PiMX2
1b
PiPE25a
PiCO05b
PaEC12b
PiEC11a
PiHU02a
PaEC06b
PmMX11b
PiEC12b
PiSW01a
MX
EC
MX MX
MX
MX
MX
MX
location.states
Colombia
Ecuador
Estonia
Hungary
Mexico
Netherlands
Peru
Poland
South Africa
Sweden
United Kingdom
United States
Vietnam

EC1 PE3PE7 PE3 EC1PE7 EC1 PE7PE3
EC1 PE3PE7 PE3 EC1PE7 EC1 PE7PE3
0.9 [0.7, 1.1] 21.9 [19.7, 24.0] 0.9 [0.7, 1.2]
1.4 [1.1, 1.7] 73.5 [71.1, 75.8] 1.4 [1.1, 1.7]
A. B. C.
D. E. F.

Toluca US1X X US1Toluca Toluca XUS1
Toluca X US1US1 Toluca XToluca US1 X
X TolucaUS1Toluca US1 XToluca US1X
X US1 TolucaToluca X US1Toluca US1 X
X US1 TolucaUS1 X TolucaX Toluca US1
1. 2. 3.
4. 5. 6.
7. 8. 9.
10. 11. 12.
13. 14. 15.


![A Phytophthora infestans Cystatin-Like Protein Targets a · A Phytophthora infestans Cystatin-Like Protein Targets a Novel Tomato Papain-Like Apoplastic Protease1[W][OA] Miaoying](https://img.pdfslide.us/doc/110x75/5e0144a4c3c9354e4912bcaa/a-phytophthora-infestans-cystatin-like-protein-targets-a-a-phytophthora-infestans.jpg)