Embed Size (px)
Citation preview

THE IQMULUS URBAN SHOWCASE: AUTOMATIC TREE CLASSIFICATION ANDIDENTIFICA TION IN HUGE MOBILE MAPPING POINT CLOUDS
J. Bohma, M. Bredifb, T. Gierlingerc, M. Kramerc, R. Lindenberghd∗, K. Liua, F. Michelc, B. Sirmacekd
aDept. of Civil, Environmental & Geomatic Engineering, University College London, United KingdombUniversite Paris-Est, IGN, SRIG, MATIS, 73 avenue de Paris, 94160 Saint Mande, France
cFraunhofer Institute for Computer Graphics Research IGD, Darmstadt, GermanydDept. of Geoscience and Remote Sensing, Delft University of Technology, The Netherlands
(kun.liu,j.boehm)@ucl.ac.uk, [email protected],(Thomas.Gierlinger,Michel.Kraemer,frank.michel)@igd.fraunhofer.de,
(B.Sirmacek, R.C.Lindenbergh)@tudelft.nl
Commission III, WG III/2
KEY WORDS: Mobile mapping, big data, classification, trees, cloud computing, web-based visualization
ABSTRACT:
Current 3D data capturing as implemented on for example airborne or mobile laser scanning systems is able to efficiently sample thesurface of a city by billions of unselective points during one working day. What is still difficult is to extract and visualize meaningfulinformation hidden in these point clouds with the same efficiency. This is where the FP7 IQmulus project enters the scene. IQmulusis an interactive facility for processing and visualizing big spatial data. In this study the potential of IQmulus is demonstrated on alaser mobile mapping point cloud of 1 billion points sampling∼ 10 km of street environment in Toulouse, France. After the data isuploaded to the IQmulus Hadoop Distributed File System, a workflow is defined by the user consisting of retiling the data followed bya PCA driven local dimensionality analysis, which runs efficiently on the IQmulus cloud facility using a Spark implementation. Pointsscattering in 3 directions are clustered in the tree class, and are separated next into individual trees. Five hours of processing at the12 node computing cluster results in the automatic identification of 4000+ urban trees. Visualization of the results in the IQmulus fatclient helps users to appreciate the results, and developers to identify remaining flaws in the processing workflow.
1. INTRODUCTION
Urban management has many geospatial and geometric aspects.Every street contains different street furniture like lamp posts andstreet signs, while many streets are flanked by trees that occur in avariety of sizes and shapes. Collecting information on the state ofstreet furniture and street trees can be very time consuming andtherefore costly. In recent years however it has been demonstratedthat mobile mapping systems equipped with cameras and laserscanners are able to densely sample the geometry of the streetsurroundings. Indeed, resulting point or pixel densities are in theorder of millimetre to centimetre. This high sampling densitycauses a new problem: how to efficiently and accurately extractinformation at centimetre level from dense point clouds coveringtens of kilometres of urban street surroundings?
The IQmulus project is a FP7 project with the aim of creatinga high-volume fusion and analysis platform for geospatial pointclouds, coverages and volumetric data sets. In this work we willreport on how the IQmulus platform can be used to efficientlyprocess a mobile mapping point cloud of 83 GB sampling∼10km of streets in the city of Toulouse. It will be demonstrated howthe point cloud data is stored, processed and visualized. The goalof the processing is to extract and visualize the location of allindividual trees as sampled by the point cloud.
To obtain this goal the following steps are followed. The input*.ply data from the mobile mapping system is tiled and stored asa collection in a Hadoop Distributed File System (HDFS). Next,a workflow is defined in a workflow editor that creates a pro-cessing chain of several consecutive algorithms with appropriate
∗Corresponding author
parameters. Key algorithms are developed that can profit opti-mally from the available cloud infrastructure, for example usingparallel Spark implementations. The computational performanceof the algorithms is automatically evaluated using a scalabilitytesting framework. The results of the processing chain, includingquality parameters and intermediate outcomes are stored again onthe HDFS to make them available to the visualization processing.To be able to efficiently visualize the point cloud in a stream-ing fashion the data is processed into a suitable structure. Thisstructure is used to interactively access the point cloud to providea view-dependent level of detail to a WebGL based point cloudrenderer running in a standard web-browser.
Several alternative workflows are still being compared in termsof computational performance and quality, but one main work-flow processes the point cloud data as follows: so-called dimen-sionality features are determined for each point that expresses itsamount of linearity, planarity or scattering. In either a simplerule based or a more sophisticated random forest classification,basically points with high scattering are collected in a tree class.Next, tree points may separated into individual trees by analysinglocal point density variations. The final result is again a pointcloud, but with an extra label for each point indicating whetherit belongs to a tree, and if so, to what tree. At the current stateof affairs, the point cloud of∼ 10 km, consisting of 1500 mil-lion points is processed in 5 hours using 12 nodes at the IQmulusinfrastructure.
2. METHODS
In this chapter background on IQmulus methodology is given,demonstrated on an urban showcase. First the IQmulus infras-
The International Archives of the Photogrammetry, Remote Sensing and Spatial Information Sciences, Volume XLI-B3, 2016 XXIII ISPRS Congress, 12–19 July 2016, Prague, Czech Republic
This contribution has been peer-reviewed. doi:10.5194/isprsarchives-XLI-B3-301-2016
301

Figure 1. IQmulus architecture
tructureis discussed, next, different algorithms and their efficientimplementations to extract information from points clouds, fol-lowed by a explanation of the visualization methodology.
2.1 The IQmulus infrastructure
IQmulus is a research project funded by the European Commis-sion running from November 2012 to October 2016. Within thisproject we have developed a software architecture for the pro-cessing of very large geospatial data. Figure 1 shows the maincomponents of the IQmulus architecture.
The users (typically GIS experts) use the web-based user inter-face to upload data to the distributed file system (HDFS). Theydefine a workflow using a Domain-Specific Language (DSL). Theworkflow for the use case presented in this paper is described be-low. When the users press the Execute button the workflow istransferred to the JobManager, a component managing the infras-tructure and the execution of workflows. The JobManager selectsthe compute nodes in the Cloud on which the workflow should beexecuted. It then spawns the processing services on these com-pute nodes and oversees their execution. The JobManager canmanage complex workflows in which processing services dependon the results from others. It employs a sophisticated rule-basedscheduling algorithm to control the execution, (Kramer and Sen-ner, 2015).
The processing services load the data previously imported by theusers from the distributed file system, process it, and then save theresults back to the HDFS. Finally the users can view the resultsin the web-based visualisation client or a desktop client. Thefollowing sections focus on the processing services used in thisuse case.
2.2 Dimensionality features
The first step in the pipeline is to perform a local dimensionalityanalysis of the point cloud which performs a scale-adaptive Prin-cipal Component Analysis (PCA) on the point cloud in order toextract the most relevant radius of analysis for each point. Fromthe PCA, a number of dimensionality features may be derivedsuch as linearity, planarity, scattering, omnivariance, anisotropy,eigenentropy and change of curvature, (Demantke et al., 2011).
This step is embarrassingly parallel, as the new features of eachinput point may be computed independently. However, the dataaccess pattern of these computations is overlapping, as the com-putation of each point needs to read the positions of its K nearestneighbors for some content-adaptive value K.
The alternatives for distributing these computations are to either(i) introduce an approximation by processing the input lidar tilesindependently, thus possibly introducing edge effects, or (ii) en-suring that while independently processing each tile, its neigh-boring tiles are also accessible on the same machine. For sim-plicity, or if tile adjacencies are not available, tiles may be pro-cessed independently as the scale-adaptive property of (Deman-tke et al., 2011) has the nice tendency of reducing the optimizedscale of analysis so that it is fully contained in the current tile,thus minimizing the edge effects. Alternatively, if tile adjacen-cies are known, or if the dataset is re-partitioned into tiles (e.g.grid tiling), then it is easy to list the few number of tiles that maybe read while computing the dimensionality features of a giventile.
The proposed method when the dataset is sorted in sequentialacquisition order (either because it has not been shuffled by apreprocess or because per-point acquisition timestamps are avail-able) is to simply process each tile with a read access to theimmediately preceding and succeeding tiles. This has the com-bined advantage of (i) not requiring any retiling or shuffling asraw datasets are actually acquired and stored in time-sequentialchunks rather than spatial partitions and (ii) that the processing isthen almost insensitive to georeferencing issues, as georeferenc-ing typically drifts in a way such that relative positioning errorsare negligible within the short timespan of a few consecutive tiles.This last property is actually very important as the PCA is verysensitive to slight misalignments of lidar point clouds due for in-stance to repeated scans of the same street.
2.3 Tree classification
Point classification (single core) Given the dimensionality fea-tures linearity, planarity and scatter, points sampling trees are al-ready computed, a point-based classification is then embarrass-ingly parallel. Based on a manually selected training set withtree and non-tree classes, a random-forest based prediction is
The International Archives of the Photogrammetry, Remote Sensing and Spatial Information Sciences, Volume XLI-B3, 2016 XXIII ISPRS Congress, 12–19 July 2016, Prague, Czech Republic
This contribution has been peer-reviewed. doi:10.5194/isprsarchives-XLI-B3-301-2016
302
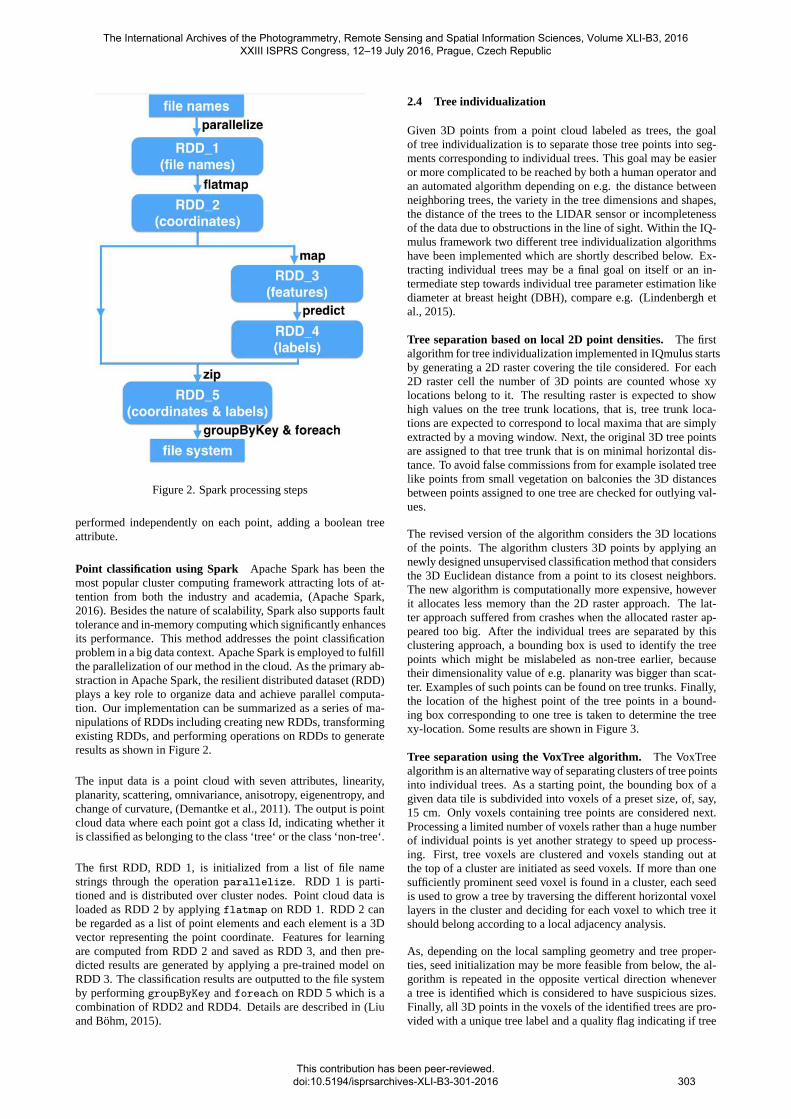
Figure 2. Spark processing steps
performedindependently on each point, adding a boolean treeattribute.
Point classification using Spark Apache Spark has been themost popular cluster computing framework attracting lots of at-tention from both the industry and academia, (Apache Spark,2016). Besides the nature of scalability, Spark also supports faulttolerance and in-memory computing which significantly enhancesits performance. This method addresses the point classificationproblem in a big data context. Apache Spark is employed to fulfillthe parallelization of our method in the cloud. As the primary ab-straction in Apache Spark, the resilient distributed dataset (RDD)plays a key role to organize data and achieve parallel computa-tion. Our implementation can be summarized as a series of ma-nipulations of RDDs including creating new RDDs, transformingexisting RDDs, and performing operations on RDDs to generateresults as shown in Figure 2.
The input data is a point cloud with seven attributes, linearity,planarity, scattering, omnivariance, anisotropy, eigenentropy, andchange of curvature, (Demantke et al., 2011). The output is pointcloud data where each point got a class Id, indicating whether itis classified as belonging to the class ‘tree‘ or the class ‘non-tree‘.
The first RDD, RDD 1, is initialized from a list of file namestrings through the operationparallelize. RDD 1 is parti-tioned and is distributed over cluster nodes. Point cloud data isloaded as RDD 2 by applyingflatmap on RDD 1. RDD 2 canbe regarded as a list of point elements and each element is a 3Dvector representing the point coordinate. Features for learningare computed from RDD 2 and saved as RDD 3, and then pre-dicted results are generated by applying a pre-trained model onRDD 3. The classification results are outputted to the file systemby performinggroupByKey andforeach on RDD 5 which is acombination of RDD2 and RDD4. Details are described in (Liuand Bohm, 2015).
2.4 Tree individualization
Given 3D points from a point cloud labeled as trees, the goalof tree individualization is to separate those tree points into seg-ments corresponding to individual trees. This goal may be easieror more complicated to be reached by both a human operator andan automated algorithm depending on e.g. the distance betweenneighboring trees, the variety in the tree dimensions and shapes,the distance of the trees to the LIDAR sensor or incompletenessof the data due to obstructions in the line of sight. Within the IQ-mulus framework two different tree individualization algorithmshave been implemented which are shortly described below. Ex-tracting individual trees may be a final goal on itself or an in-termediate step towards individual tree parameter estimation likediameter at breast height (DBH), compare e.g. (Lindenbergh etal., 2015).
Tree separation based on local 2D point densities.The firstalgorithm for tree individualization implemented in IQmulus startsby generating a 2D raster covering the tile considered. For each2D raster cell the number of 3D points are counted whose xylocations belong to it. The resulting raster is expected to showhigh values on the tree trunk locations, that is, tree trunk loca-tions are expected to correspond to local maxima that are simplyextracted by a moving window. Next, the original 3D tree pointsare assigned to that tree trunk that is on minimal horizontal dis-tance. To avoid false commissions from for example isolated treelike points from small vegetation on balconies the 3D distancesbetween points assigned to one tree are checked for outlying val-ues.
The revised version of the algorithm considers the 3D locationsof the points. The algorithm clusters 3D points by applying annewly designed unsupervised classification method that considersthe 3D Euclidean distance from a point to its closest neighbors.The new algorithm is computationally more expensive, howeverit allocates less memory than the 2D raster approach. The lat-ter approach suffered from crashes when the allocated raster ap-peared too big. After the individual trees are separated by thisclustering approach, a bounding box is used to identify the treepoints which might be mislabeled as non-tree earlier, becausetheir dimensionality value of e.g. planarity was bigger than scat-ter. Examples of such points can be found on tree trunks. Finally,the location of the highest point of the tree points in a bound-ing box corresponding to one tree is taken to determine the treexy-location. Some results are shown in Figure 3.
Tree separation using the VoxTree algorithm. The VoxTreealgorithm is an alternative way of separating clusters of tree pointsinto individual trees. As a starting point, the bounding box of agiven data tile is subdivided into voxels of a preset size, of, say,15 cm. Only voxels containing tree points are considered next.Processing a limited number of voxels rather than a huge numberof individual points is yet another strategy to speed up process-ing. First, tree voxels are clustered and voxels standing out atthe top of a cluster are initiated as seed voxels. If more than onesufficiently prominent seed voxel is found in a cluster, each seedis used to grow a tree by traversing the different horizontal voxellayers in the cluster and deciding for each voxel to which tree itshould belong according to a local adjacency analysis.
As, depending on the local sampling geometry and tree proper-ties, seed initialization may be more feasible from below, the al-gorithm is repeated in the opposite vertical direction whenevera tree is identified which is considered to have suspicious sizes.Finally, all 3D points in the voxels of the identified trees are pro-vided with a unique tree label and a quality flag indicating if tree
The International Archives of the Photogrammetry, Remote Sensing and Spatial Information Sciences, Volume XLI-B3, 2016 XXIII ISPRS Congress, 12–19 July 2016, Prague, Czech Republic
This contribution has been peer-reviewed. doi:10.5194/isprsarchives-XLI-B3-301-2016
303
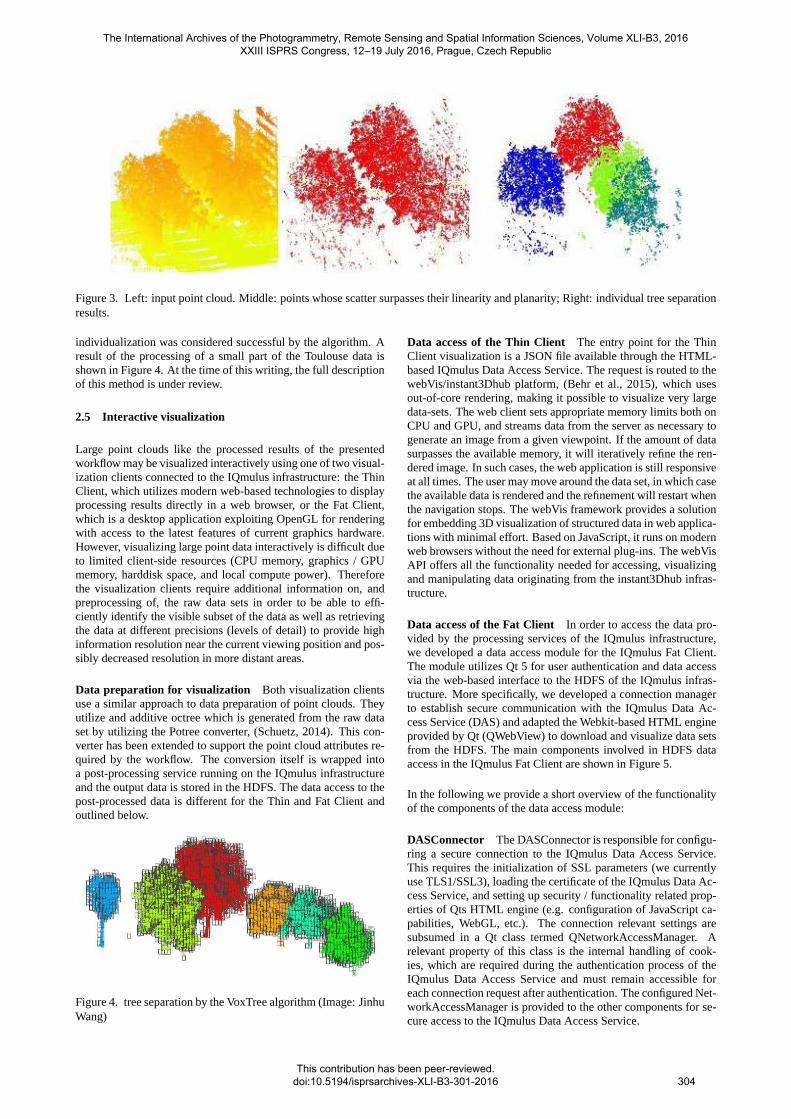
Figure 3. Left: input point cloud. Middle: points whose scatter surpasses theirlinearity and planarity; Right: individual tree separationresults.
individualization was considered successful by the algorithm. Aresult of the processing of a small part of the Toulouse data isshown in Figure 4. At the time of this writing, the full descriptionof this method is under review.
2.5 Interactive visualization
Large point clouds like the processed results of the presentedworkflow may be visualized interactively using one of two visual-ization clients connected to the IQmulus infrastructure: the ThinClient, which utilizes modern web-based technologies to displayprocessing results directly in a web browser, or the Fat Client,which is a desktop application exploiting OpenGL for renderingwith access to the latest features of current graphics hardware.However, visualizing large point data interactively is difficult dueto limited client-side resources (CPU memory, graphics / GPUmemory, harddisk space, and local compute power). Thereforethe visualization clients require additional information on, andpreprocessing of, the raw data sets in order to be able to effi-ciently identify the visible subset of the data as well as retrievingthe data at different precisions (levels of detail) to provide highinformation resolution near the current viewing position and pos-sibly decreased resolution in more distant areas.
Data preparation for visualization Both visualization clientsuse a similar approach to data preparation of point clouds. Theyutilize and additive octree which is generated from the raw dataset by utilizing the Potree converter, (Schuetz, 2014). This con-verter has been extended to support the point cloud attributes re-quired by the workflow. The conversion itself is wrapped intoa post-processing service running on the IQmulus infrastructureand the output data is stored in the HDFS. The data access to thepost-processed data is different for the Thin and Fat Client andoutlined below.
Figure 4. tree separation by the VoxTree algorithm (Image: JinhuWang)
Data access of the Thin Client The entry point for the ThinClient visualization is a JSON file available through the HTML-based IQmulus Data Access Service. The request is routed to thewebVis/instant3Dhub platform, (Behr et al., 2015), which usesout-of-core rendering, making it possible to visualize very largedata-sets. The web client sets appropriate memory limits both onCPU and GPU, and streams data from the server as necessary togenerate an image from a given viewpoint. If the amount of datasurpasses the available memory, it will iteratively refine the ren-dered image. In such cases, the web application is still responsiveat all times. The user may move around the data set, in which casethe available data is rendered and the refinement will restart whenthe navigation stops. The webVis framework provides a solutionfor embedding 3D visualization of structured data in web applica-tions with minimal effort. Based on JavaScript, it runs on modernweb browsers without the need for external plug-ins. The webVisAPI offers all the functionality needed for accessing, visualizingand manipulating data originating from the instant3Dhub infras-tructure.
Data access of the Fat Client In order to access the data pro-vided by the processing services of the IQmulus infrastructure,we developed a data access module for the IQmulus Fat Client.The module utilizes Qt 5 for user authentication and data accessvia the web-based interface to the HDFS of the IQmulus infras-tructure. More specifically, we developed a connection managerto establish secure communication with the IQmulus Data Ac-cess Service (DAS) and adapted the Webkit-based HTML engineprovided by Qt (QWebView) to download and visualize data setsfrom the HDFS. The main components involved in HDFS dataaccess in the IQmulus Fat Client are shown in Figure 5.
In the following we provide a short overview of the functionalityof the components of the data access module:
DASConnector The DASConnector is responsible for configu-ring a secure connection to the IQmulus Data Access Service.This requires the initialization of SSL parameters (we currentlyuse TLS1/SSL3), loading the certificate of the IQmulus Data Ac-cess Service, and setting up security / functionality related prop-erties of Qts HTML engine (e.g. configuration of JavaScript ca-pabilities, WebGL, etc.). The connection relevant settings aresubsumed in a Qt class termed QNetworkAccessManager. Arelevant property of this class is the internal handling of cook-ies, which are required during the authentication process of theIQmulus Data Access Service and must remain accessible foreach connection request after authentication. The configured Net-workAccessManager is provided to the other components for se-cure access to the IQmulus Data Access Service.
The International Archives of the Photogrammetry, Remote Sensing and Spatial Information Sciences, Volume XLI-B3, 2016 XXIII ISPRS Congress, 12–19 July 2016, Prague, Czech Republic
This contribution has been peer-reviewed. doi:10.5194/isprsarchives-XLI-B3-301-2016
304
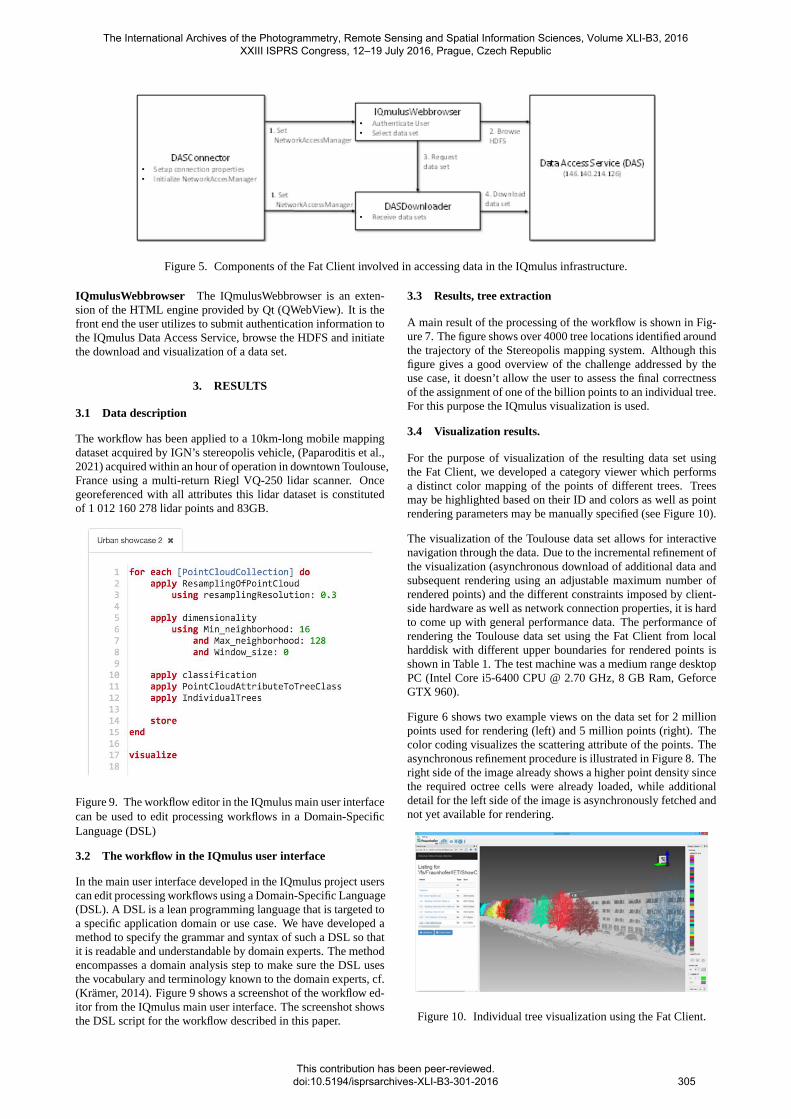
Figure 5. Components of the Fat Client involved in accessing data in the IQmulusinfrastructure.
IQmulusWebbrowser The IQmulusWebbrowser is an exten-sion of the HTML engine provided by Qt (QWebView). It is thefront end the user utilizes to submit authentication information tothe IQmulus Data Access Service, browse the HDFS and initiatethe download and visualization of a data set.
3. RESULTS
3.1 Data description
The workflow has been applied to a 10km-long mobile mappingdataset acquired by IGN’s stereopolis vehicle, (Paparoditis et al.,2021) acquired within an hour of operation in downtown Toulouse,France using a multi-return Riegl VQ-250 lidar scanner. Oncegeoreferenced with all attributes this lidar dataset is constitutedof 1 012 160 278 lidar points and 83GB.
Figure 9. The workflow editor in the IQmulus main user interfacecanbe used to edit processing workflows in a Domain-SpecificLanguage (DSL)
3.2 The workflow in the IQmulus user interface
In the main user interface developed in the IQmulus project userscan edit processing workflows using a Domain-Specific Language(DSL). A DSL is a lean programming language that is targeted toa specific application domain or use case. We have developed amethod to specify the grammar and syntax of such a DSL so thatit is readable and understandable by domain experts. The methodencompasses a domain analysis step to make sure the DSL usesthe vocabulary and terminology known to the domain experts, cf.(Kramer, 2014). Figure 9 shows a screenshot of the workflow ed-itor from the IQmulus main user interface. The screenshot showsthe DSL script for the workflow described in this paper.
3.3 Results, tree extraction
A main result of the processing of the workflow is shown in Fig-ure 7. The figure shows over 4000 tree locations identified aroundthe trajectory of the Stereopolis mapping system. Although thisfigure gives a good overview of the challenge addressed by theuse case, it doesn’t allow the user to assess the final correctnessof the assignment of one of the billion points to an individual tree.For this purpose the IQmulus visualization is used.
3.4 Visualization results.
For the purpose of visualization of the resulting data set usingthe Fat Client, we developed a category viewer which performsa distinct color mapping of the points of different trees. Treesmay be highlighted based on their ID and colors as well as pointrendering parameters may be manually specified (see Figure 10).
The visualization of the Toulouse data set allows for interactivenavigation through the data. Due to the incremental refinement ofthe visualization (asynchronous download of additional data andsubsequent rendering using an adjustable maximum number ofrendered points) and the different constraints imposed by client-side hardware as well as network connection properties, it is hardto come up with general performance data. The performance ofrendering the Toulouse data set using the Fat Client from localharddisk with different upper boundaries for rendered points isshown in Table 1. The test machine was a medium range desktopPC (Intel Core i5-6400 CPU @ 2.70 GHz, 8 GB Ram, GeforceGTX 960).
Figure 6 shows two example views on the data set for 2 millionpoints used for rendering (left) and 5 million points (right). Thecolor coding visualizes the scattering attribute of the points. Theasynchronous refinement procedure is illustrated in Figure 8. Theright side of the image already shows a higher point density sincethe required octree cells were already loaded, while additionaldetail for the left side of the image is asynchronously fetched andnot yet available for rendering.
Figure 10. Individual tree visualization using the Fat Client.
The International Archives of the Photogrammetry, Remote Sensing and Spatial Information Sciences, Volume XLI-B3, 2016 XXIII ISPRS Congress, 12–19 July 2016, Prague, Czech Republic
This contribution has been peer-reviewed. doi:10.5194/isprsarchives-XLI-B3-301-2016
305
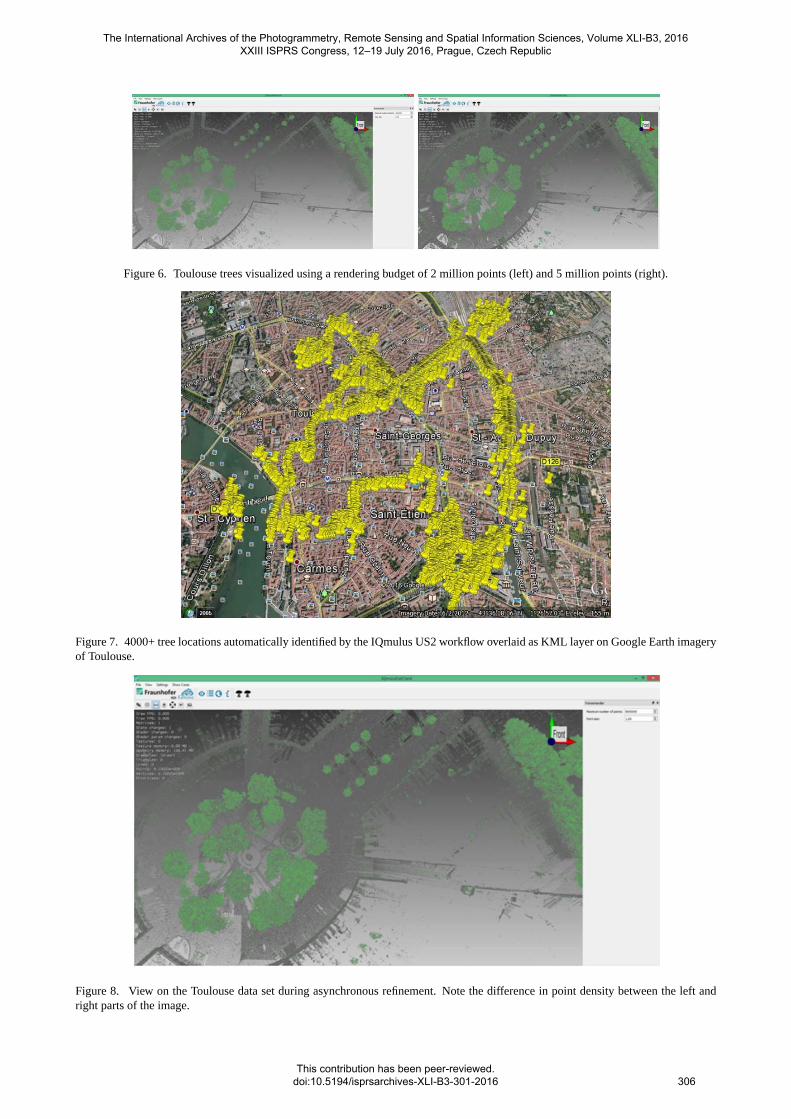
Figure 6. Toulouse trees visualized using a rendering budget of 2 million points(left) and 5 million points (right).
Figure 7. 4000+ tree locations automatically identified by the IQmulus US2 workflow overlaid as KML layer on Google Earth imageryof Toulouse.
Figure 8. View on the Toulouse data set during asynchronous refinement. Note the difference in point density between the left andright parts of the image.
The International Archives of the Photogrammetry, Remote Sensing and Spatial Information Sciences, Volume XLI-B3, 2016 XXIII ISPRS Congress, 12–19 July 2016, Prague, Czech Republic
This contribution has been peer-reviewed. doi:10.5194/isprsarchives-XLI-B3-301-2016
306

Max. rendered points Rendering time2 million 3 sec.6 million 8 sec.10 million 15 sec.
Table 1. Time for completing the rendering of one view usingdifferent budgets of points. As can be seen, the time for com-pleting the rendering for a single view is in the order of seconds.Please note that the user is free to navigate during this time sincethe refinement process is asynchronous.
3.5 Next steps
At the current state of affairs, the full use case is implementedand running in the IQmulus infrastructure. A next step is to actu-ally exploit the IQmulus visualization possibilities to analyze thegeometric quality of the results in an interactive way. Simultane-ously the computational performance of the workflow as a wholefor different settings is under study using the implemented auto-mated scalability testing framework. To verify the portability ofthe platform, the use case will also be evaluated on different mo-bile mapping data sets obtained by different systems in differentroad environments.
4. CONCLUSIONS
In this paper we have presented results from the FP7 IQmulusproject. The general infrastructure for storing, processing and vi-sualizing big spatial data has been described and demonstratedon the so-called urban showcase. This showcase considers theefficient processing of a huge lidar mobile mapping data set con-sisting of 1 billion points sampling 10 km of urban streets inToulouse. IQmulus is able to efficiently extract and visualize allpoints sampling the 4000+ individual trees sampled by the pointcloud. More information on and results from the IQmulus projectcan be found on the IQmulus website, http://www.iqmulus.eu.
ACKNOWLEDGMENTS
This paper reports on results of the FP7 project IQmulus,A highvolume fusion and analysis platform for geospatial point clouds,coverages and volumetric data set enabled by the FP7 grant withnumber FP7-ICT-2011-318787.
REFERENCES
Behr, J., Mouton, C., Parfouru, S., Champeau, J., Jeulin, C.,Thoner, M., Stein, C., Schmitt, M., Limper, M., de Sousa, M. andFranke, T.A. (2015). webVis/instant3DHub: visual computing asa service infrastructure to deliver adaptive, secure and scalableuser centric data visualisation. In Proceedings of the 20th Inter-national Conference on 3D Web Technology, ACM, pp. 39–47.
Demantke, J., Mallet, C., David, N. and Vallet, B., (2011). Di-mensionality based scale selection in 3D lidar point clouds. TheInternational Archives of the Photogrammetry, Remote Sensingand Spatial Information Sciences, 38(Part 5), p.W12.
Kramer, M., (2014). Controlling the processing of smart city datain the cloud with domain-specific languages. In Proceedings ofthe 2014 IEEE/ACM 7th International Conference on Utility andCloud Computing (pp. 824–829).
Kramer, M. and Senner, I., (2015). A modular software architec-ture for processing of big geospatial data in the cloud. Computers& Graphics, 49, pp.69–81.
Lindenbergh, R.C., Berthold, D., Sirmacek, B., Herrero-Huerta,M., Wang, J. and Ebersbach, D., (2015). Automated large scaleparameter extraction of road-side trees sampled by a laser mobilemapping system. The International Archives of Photogrammetry,Remote Sensing and Spatial Information Sciences, 40(3), p.589.
Liu, K. and Bohm, J., (2015). Classification of Big Point CloudData Using Cloud Computing. The International Archives ofPhotogrammetry, Remote Sensing and Spatial Information Sci-ences, 40(3), p.553.
Paparoditis, N., Papelard, J.P., Cannelle, B., Devaux, A., Soheil-ian, B., David, N. and Houzay, E., (2012). Stereopolis II: Amulti-purpose and multi-sensor 3D mobile mapping system forstreet visualisation and 3D metrology. Revue francaise de pho-togrammetrie et de teledetection, 200(1), pp.69–79.
Schutz, (2014), Potree. http://potree.org, accessed 2016-04-13
Apache Spark, (2016). A fast and general engine for large-scaledata processing. http://spark.apache.org/, accessed 2016-04-15
The International Archives of the Photogrammetry, Remote Sensing and Spatial Information Sciences, Volume XLI-B3, 2016 XXIII ISPRS Congress, 12–19 July 2016, Prague, Czech Republic
This contribution has been peer-reviewed. doi:10.5194/isprsarchives-XLI-B3-301-2016
307