Embed Size (px)
Citation preview

THE INVESTMENT CASEFOR VALUE-ADDED REAL ESTATE IN ITALYCOMMERCIAL-TO-RESIDENTIAL CONVERSION STRATEGIES
BNP Paribas REIMJuly 2018
2
THE INVESTMENT CASE FORVALUE-ADDED REAL ESTATE IN ITALY
COMMERCIAL-TO-RESIDENTIAL CONVERSION STRATEGIES
It is easily overlooked that Italy is one of the largest and most affluent countries in Europe. The regional differences in Italy are substantial with a clear north – south
divide, where the richest areas in the North regions are on a par with the wealthiest of other countries in the North of Europe. Currently, in economic terms, Italy is possibly in the best shape ever since the GFC. Economic growth is expected to be solid over the next few years, most notably in the North of the country.
The residential market seems to have bottomed and transactions are back on an upward trend for some time now. There is a notable mismatch between rising pent-up demand and scarce new, high-quality supply. Residential prices are 20% off their previous peak on average. Forecasts for house price growth in the medium term are positive, especially for the most dynamic cities in the country.
The gap between residential and commercial – mostly offices but not exclusively - prices is quite large in Italy. This, along with positive and improving fundamentals for the residential sector and likely price growth, make a compelling case for refurbishing obsolete commercial buildings and converting them to high-standard residential. This type of product is particularly attractive to prospective owner occupiers and investors.
Our city ranking methodology, which is based on different factors including demography, wealth, liquidity and the relative attractiveness and competitiveness of the city itself, provides us with a number of preferred markets that constitute the core of this strategy. While Milan and Rome are obvious choices as a result of their relative size, wealth and liquidity, other smaller but relatively strong markets in the North of the country offer significantly high potential returns.
MAURIZIO GRILLI - HEAD OF INVESTMENT MANAGEMENT ANALYSIS AND STRATEGY
3
HOW THE INVESTMENT CASE FOR VALUE-ADDED REAL ESTATE IN ITALY.
1- Source: Mastercard 2- Source: Eurostat.
SIZE• It is easily overlooked that Italy is one of the largest and most affluent countries in Europe. Italy is the fourth largest economy in Europe after Germany, UK and France and is some 45% larger by GDP than the next country, Spain. Italy also has the 4th largest population in Europe with 61 million residents.
• Italy is the world’s sixth largest manufacturing country, characterised by a large number of dynamic small and medium-sized enterprises, usually clustered in several industrial districts. Italy is also the world’s 8th largest exporter. Finally, Italy is the fifth most visited country in the world, with more than 50 million international arrivals. Milan and Rome are constantly within the top 5 visited cities in Europe1.
• While public debt is high at more than 130% of GDP, it has recently stabilised. On the other hand, household debt at 113% of GDP is quite low in European terms and significanly lower than in the UK (171%), France (147%) and Sweden (193%)2. Moreover, Italy ranks as one of the highest economies in terms of net wealth per capita and per household (Exhibit 1). Finally, while Italian banks still need to improve their profitability, non-performing loans are declining significantly.
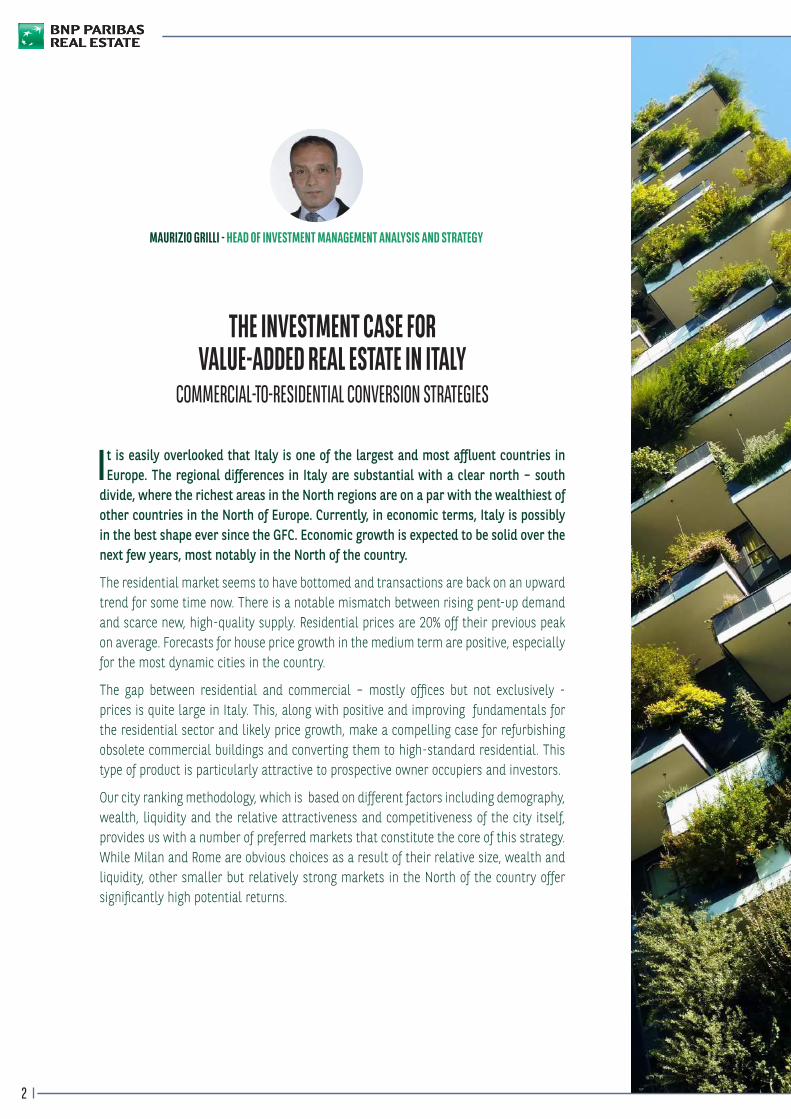
WHYITALY
EXHIBIT 1: ITALY : KEY METRICS REBASED ON 2017 GDP
Source: Citi, MEF, Banca d’Italia
300
250
200
150
100
50
0
GDP Public debt Private financial wealth Private wealth held in cash, deposits or bonds

4
EXHIBIT 2: GDP PER CAPITA AT NUTS 3 LEVEL
Source: BNP Paribas Real Estate, Oxford Economics
€ / capita
> 33,000 25,000 - 30,000 20,000 - 25,000 10,000 - 20,000 < 10,000
• The regional dimension is very important to understand. Whilst national GDP per capita is roughly in line with the EU average, the north has wealth per capita that rivals the most affluent regions of Europe, as it is shown in Exhibit 2 (Milan, Bologna, Bergamo and Monza are some examples of very affluent cities). What is clear is that to label Italy by any single feature is flawed as the country is rich in economic diversity.
ECONOMIC OUTLOOK• Currently, in economic terms, Italy is possibly in the best shape ever since the GFC. While one of the drivers of the Italian economic recovery has been the acceleration in global growth, the broad-based nature of the recent upsurge in economic activity provides some assurance that growth is sustainable over the medium-term. The most welcome news has been the strengthening of investment, which fell significantly during and after the GFC. This has translated into a significant drop in the unemployment rate and considerable job creation.
• There are other reasons that hint at an improving economic sentiment. Primarily, it is the improved financial profile of Italian companies as profits and margins are increasing whilst bankruptcies are at their pre-crisis level. There has been also a notable increase in lending, albeit this was mainly about residential and consumer lending. For 2018 as whole, real GDP is expected to increase by around 1.3%, according to Consensus Economics.
• Over the foreseeable future, we expect the North East of Italy to record the highest growth, followed by the North West area, which should perform better in industry, while the Southern regions are expected to lag behind, penalised by more sluggish developments both in industry and services (Exhibit 3).

5
HOW THE INVESTMENT CASE FOR VALUE-ADDED REAL ESTATE IN ITALY.HOW THE INVESTMENT CASE FOR VALUED-ADDED REAL ESTATE IN ITALY.
POLITICAL OUTLOOK• The recent credit spread widening reflects an increase in worries about the political outlook rather than deterioration in fundamentals. In 2017, the country had a current account surplus of 2.8% of GDP, and since 2014 the public sector deficit has been below 3% of GDP. Most importantly, European Union data show that since 1995 the country has been running a primary fiscal surplus for 22 years. Most (65%) of public debt is domestically owned.
• The source of these worries is mostly related to some uncertainty about how the new coalition-government will handle issues such as public finances. However, it is worth remembering that the new government has not expressed any will to abandon the euro. Moreover, it is also good to keep in mind the fact that around 60% of Italians are in favour of the euro3.
• Uncertainty over Italy is a credit risk, not a redenomination risk, so the risk of further spread widening is more limited than in 2011. Overall, while it is not possible to make perfect predictions on how the government will act on public policy over the next few months, there is a significant chance that the ruling so-called “populist” parties will soften their approach towards Europe, once they come to terms with the management of Italian public debt.
3- Source: European Union’s Eurobarometer.
Source: Oxford Economics
Mila
no
Regg
io Em
ilia
Pado
va
Vicen
za
Tries
te
Vero
na
Bolza
no-B
ozen
Bolog
na
Bres
cia
Roma
Firen
ze
Mon
za
Nova
ra
Trent
o
Mod
ena
Paler
mo
Torin
o
Berg
amo
Vene
zia
Piace
nza
Cagli
ari
Bari
Cata
nia
Tara
nto
Napo
li
Sirac
usa
Mes
sina
0,6
0,4
0,2
0,0
-0,2
-0,4
-0,6
-0,8
EXHIBIT 3: GAP WITH AVERAGE GDP GROWTH – NEXT 5 YEARS
6
WHYRESIDENTIAL REAL ESTATE
• Contrary to common perception, the Italian property market is quite transparent. Indeed, it ranks within the top 20 most transparent markets in the world, according to JLL4. However, as many transactions take place off-market, investors that have a local presence of skilled and experienced staff have a strong advantage.
• It is estimated that the Italian commercial property market accounts for 12% of the European market and its investible property market accounts for some €700 bn, a figure lower only to economies such as the UK, Germany and France5. International investors generally focus on Milan and Rome. However, these figures exclude the very large residential market, which is generally dominated by domestic owner-occupiers and investors.
• The home-ownership rate in Italy is 73%, one of the highest in Europe6. Demand for residential is driven by on-going urbanisation, changing social patterns, such as the progressive reduction of the average household size and pent-up demand for high-standard accommodation. On the supply side, until recently the construction sector has experienced only limited benefit from the recovery in the real estate sector. According to Istat data for 2017, investments in residential construction were 30% lower than in 2008 in real terms7. The prolonged period of crisis experienced by the country since 2008 has led to remarkable increase in firms exiting the construction sector, therefore providing a further obstacle to the creation of new supply.
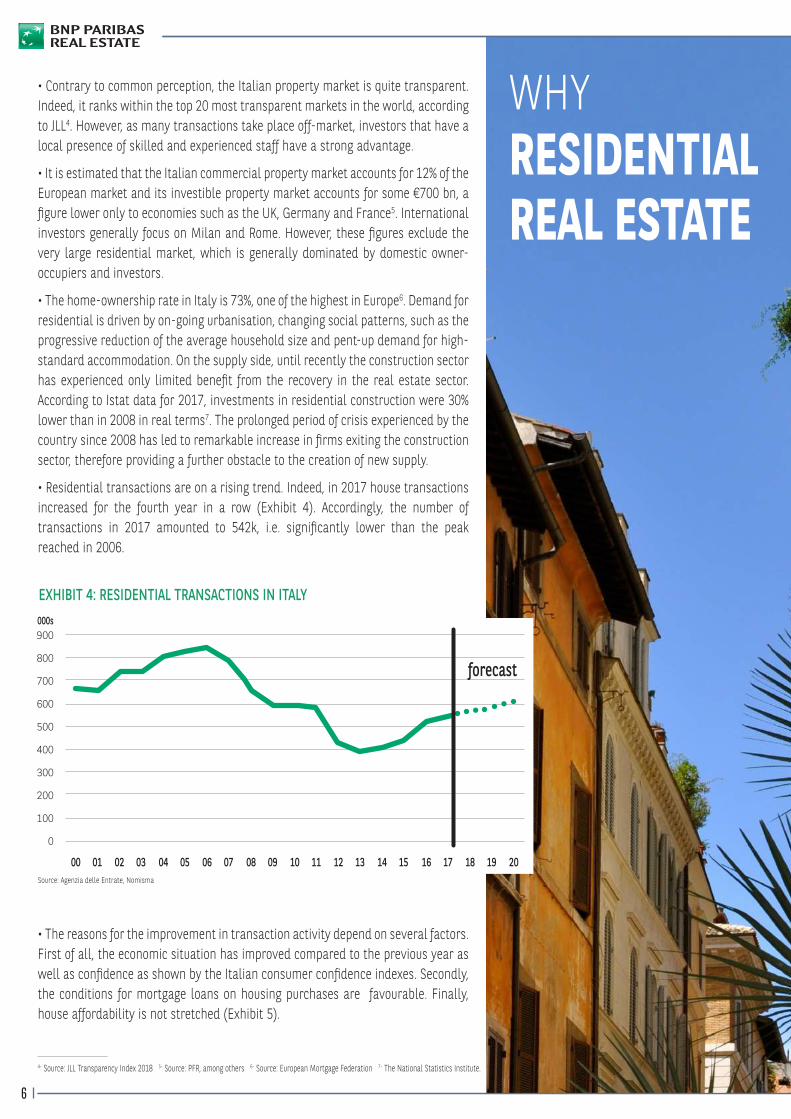
• Residential transactions are on a rising trend. Indeed, in 2017 house transactions increased for the fourth year in a row (Exhibit 4). Accordingly, the number of transactions in 2017 amounted to 542k, i.e. significantly lower than the peak reached in 2006.
4- Source: JLL Transparency Index 2018 5- Source: PFR, among others 6- Source: European Mortgage Federation 7- The National Statistics Institute.
EXHIBIT 4: RESIDENTIAL TRANSACTIONS IN ITALY
Source: Agenzia delle Entrate, Nomisma
900
800
700
600
500
400
300
200
100
0
00 04 08 12 1602 06 10 14 1801 05 09 13 1703 07 11 15 19 20
000s
forecast
• The reasons for the improvement in transaction activity depend on several factors. First of all, the economic situation has improved compared to the previous year as well as confidence as shown by the Italian consumer confidence indexes. Secondly, the conditions for mortgage loans on housing purchases are favourable. Finally, house affordability is not stretched (Exhibit 5).
7
HOW THE INVESTMENT CASE FOR VALUE-ADDED REAL ESTATE IN ITALY.
WHYRESIDENTIAL REAL ESTATE
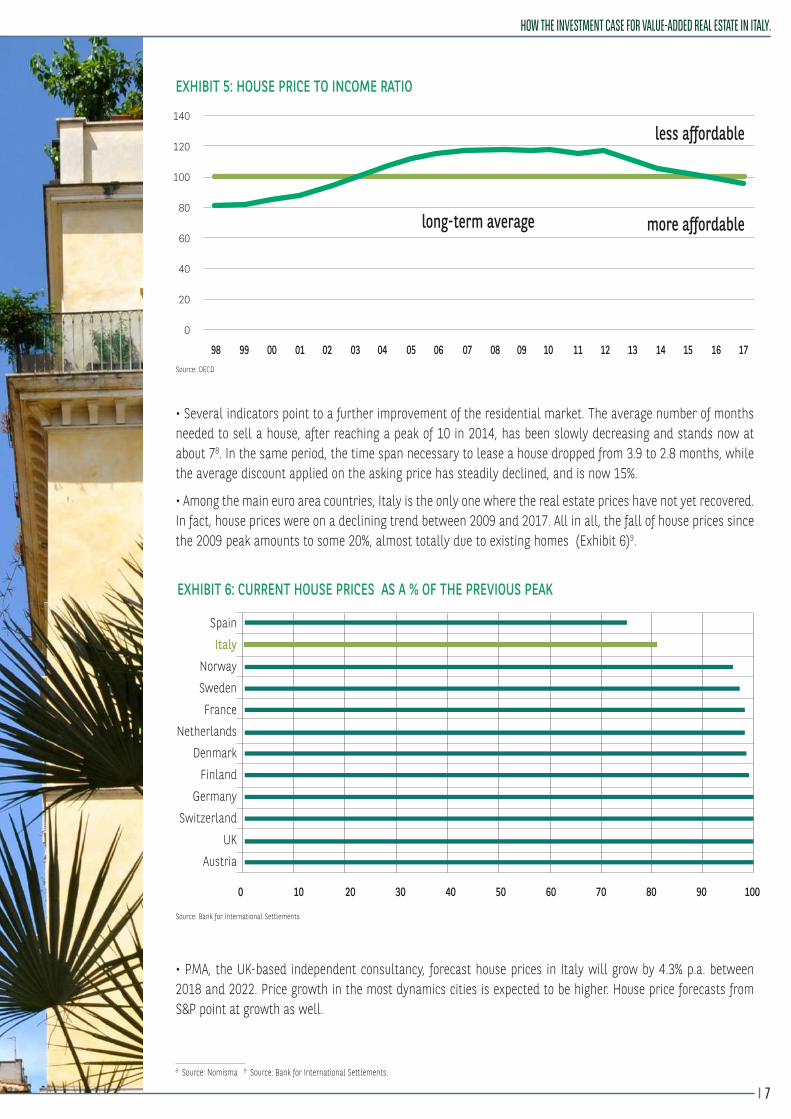
• Several indicators point to a further improvement of the residential market. The average number of months needed to sell a house, after reaching a peak of 10 in 2014, has been slowly decreasing and stands now at about 78. In the same period, the time span necessary to lease a house dropped from 3.9 to 2.8 months, while the average discount applied on the asking price has steadily declined, and is now 15%.
• Among the main euro area countries, Italy is the only one where the real estate prices have not yet recovered. In fact, house prices were on a declining trend between 2009 and 2017. All in all, the fall of house prices since the 2009 peak amounts to some 20%, almost totally due to existing homes (Exhibit 6)9.
8- Source: Nomisma 9- Source: Bank for International Settlements.
EXHIBIT 5: HOUSE PRICE TO INCOME RATIO
Source: OECD
Source: Bank for International Settlements
140
120
100
80
60
40
20
0
009998 04 08 12 1602 06 10 1401 05 09 13 1703 07 11 15
less affordable
more affordablelong-term average
EXHIBIT 6: CURRENT HOUSE PRICES AS A % OF THE PREVIOUS PEAK
Spain
Italy
Norway
Sweden
France
Netherlands
Denmark
Finland
Germany
Switzerland
UK
Austria
0 10 20 30 40 50 60 70 80 90 100
• PMA, the UK-based independent consultancy, forecast house prices in Italy will grow by 4.3% p.a. between 2018 and 2022. Price growth in the most dynamics cities is expected to be higher. House price forecasts from S&P point at growth as well.

8
• In a nutshell, value-added investing is about increasing the profitability of an investment adopting an active approach to asset management and/or portfolio construction. Such strategies are designed for investors willing to take on some risk above that associated with holding core assets. To their basic definition, value-added returns are driven by a mix of regular income distributions or/and a positive valuation effect.
• Value-added strategies can take several forms. In this particular case, we will focus on a strategy aimed at extracting value from an asset by reconverting it to other use. Specifically, this strategy makes sense if the price differential between the two uses is so wide that, after allowing for some capex, it leaves the investor with a significant capital value increase. Other important conditions to fulfill are product availability and strong demand for the new use.
• Based on market evidence and on our research, the delta between residential and commercial (mostly offices but not exclusively) prices is quite large in Italy, which justifies a strategy of conversion from one to another use. Moreover, fundamentals for the residential market are positive and improving, with strong demand highlighted by increasing transactions and very low supply of new residential product. Plenty of suitable commercial product also exists in central and semi-central locations where demand for good-quality residential is quite resilient.
• Table 1 shows the price differential for some potentially attractive Italian cities. It is noteworthy that, while the case for Milan and Rome is quite clear (size, wealth, liquidity), smaller cities offer substantially high potential returns, as they have a lower status as commercial markets but, at the same time, are strong residential locations.
• Finally, house prices are at a significant discount compared to previous peak and most forecasters expect some price revaluation over the medium term. This provides a further motive to implement a strategy where obsolete offices are refurbished to high standard and are sold to perspective owner occupiers and investors.
WHY VALUE-ADDED RESIDENTIAL CONVERSIONS
10- The zones chosen are attractive for both office and residential use.
TABLE 1: EXAMPLES OF PRICE DIFFERENTIAL RESIDENTIAL-OFFICES
Source: Scenari Immobilari, BNP Paribas REIM Research
Market Zone10 Differential between
average residential and office prices
Bergamo Vittorio Emanuele 60%
Bologna Galvani 59%
Brescia Corso Mameli 57%
Milano Brera 23%
Monza Centro Storico 76%
Roma Prati 19%

9
HOW THE INVESTMENT CASE FOR VALUE-ADDED REAL ESTATE IN ITALY.
Source: The Business of Cities
• As a real estate investor, we are particularly interested in understanding which markets we should concentrate on, in order to make viable our strategy. We have therefore developed a formal, in-house, methodology aimed at ranking markets and facilitate the task of choosing where we should invest. Tighter investment criteria maximise expected returns and mitigate risk. Selected cities should score well on most, if not all, of the following features:
- Sufficiently large size
- High level of income per capita
- High level of bank deposits per capita (indicator of wealth)
- Low commuting distance from Milan (the main business hub in Italy)
- High residential transactions (indicator of liquidity)
- High level of attractiveness, competitiveness and well-being
• Milan is commonly compared with other urban economies at a city level (population: 1.3 million), but its true scale and dynamism essentially rest on its broader territory, the so-called Great Milan, with a population of approximately 8 million, an inclusive powerhouse comparable to Greater London or the Ile De France region. Great Milan is highly diversified, complementing the inner city’s strengths in finance, consulting, media, and fashion with major clusters in agricultural, technology, aerospace, technology, life sciences and clean energy. The territory also includes a world-class university system and some international airports (Exhibit 7). As a result, the closer a city is to Milan, the better is positioned to benefit from the synergies created in the Great Milan area.
WHICH MARKETS
EXHIBIT 7: DEFINITIONS OF THE MILAN REGION
MILAN
Turin
Genoa Bologna
Parma
Piacenza
VeronaVenice
Core City of Milan
Grande Milano metropolitan area Poltechnico di Milano Urban Region Definition The "Northern Italy Powerhouse"
OECD Functional Urban Area DefinitionMetropolitan City of Milan

10
• Aside from purely quantitative considerations such as demography, wealth and liquidity we believe it is important to rank cities according to their potential which we have defined in terms of attractiveness, competitiveness and well-being. Successful cities should be able to attract and develop capital, technology and talent. Moreover, these cities should also perform well on issues such as quality of life and sustainability. The indicator of attractiveness we use in our ranking is based on a robust methodology which includes more than 600 indicators for factors such as environment, governance, education, infrastructures, transports, labour market, tourism, among others. The results enable us to understand which cities are likely to outperform in the future11.
• Our analysis includes around 50 potentially investable Italian cities, according to the criterion of a minimum population size, which we took at 100k people. Next, we apply our scoring methodology by assigning specific weights to each variable12. The Annex shows how we rank these cities. Table 2 highlights our preferred markets. Some other cities also show interesting features but are not shown in this table.
11- Source: Italy2Invest, Nomisma12- Please consult the author for inquiries about the ranking methodology.
TABLE 2 : PREFERRED INVESTMENT MARKETS
Bergamo
Bologna
Brescia
Firenze
Genova
Milano
Modena
Monza
Padova
Parma
Roma
Torino
Verona

11
HOW THE INVESTMENT CASE FOR VALUE-ADDED REAL ESTATE IN ITALY.
• The following table shows the scoring for all the cities included in the analysis. The scoring varies from 10 (the most attractive) to 1 (the least attractive)
ANNEX
Population Income pro capita deposits pro capitacommuting distance from
Milantransactions
Attractiveness, competitiveness and well-being
ANCONA 1 5 6 5 2 6
BARI 9 4 4 3 8 4
BERGAMO 3 10 10 9 4 10
BOLOGNA 9 10 9 9 9 10
BOLZANO 1 8 10 5 1 8
BRESCIA 7 8 9 10 7 10
CAGLIARI 5 8 6 1 5 5
CATANIA 8 1 3 1 7 2
FERRARA 4 5 4 7 4 5
FIRENZE 9 9 7 7 9 10
FOGGIA 4 1 2 3 3 1
FORLì 2 4 5 6 1 3
GENOVA 9 6 5 8 10 7
LATINA 3 2 2 2 2 2
LIVORNO 5 5 3 4 6 5
MESSINA 8 3 1 2 6 1
MILANO 10 10 10 10 10 10
MODENA 6 9 8 8 6 9
MONZA 3 10 8 10 5 8
NAPOLI 10 3 3 3 10 4
NOVARA 1 8 5 10 3 5
PADOVA 7 10 7 6 8 8
PALERMO 10 2 1 1 9 3
PARMA 7 9 7 8 7 7
PERUGIA 5 4 4 4 5 4
PESCARA 2 4 5 4 2 3
PIACENZA 1 7 6 10 4 7
PRATO 6 2 3 6 5 6
RAVENNA 5 4 4 6 7 4
REGGIO CALABRIA 6 1 1 2 1 1
REGGIO EMILIA 6 6 7 8 6 7
RIMINI 4 1 6 6 4 4
ROMA 10 9 9 5 10 8
SALERNO 4 5 4 3 3 3
SASSARI 4 3 2 1 1 2
SIRACUSA 3 1 1 1 4 1
TARANTO 7 2 1 2 7 1
TERNI 1 3 2 4 1 2
TORINO 10 7 7 9 10 9
TRENTO 2 7 8 6 2 9
TRIESTE 7 6 8 4 8 9
VENEZIA 8 6 9 5 9 6
VERONA 8 7 10 8 8 6
VICENZA 2 7 10 7 3 7