Embed Size (px)
Citation preview
A LONGITUDINAL EXAMINATION OF THE INTERRELATIONSHIP OF MULTIPLE HEALTH
BEHAVIOURS
by
Wayne Kelsey deRuiter
A thesis submitted in conformity with the requirements
for the degree of Doctor of Philosophy
Exercise Sciences
University of Toronto
© Copyright by Wayne deRuiter 2014
ii
A LONGITUDINAL EXAMINATION OF THE INTERRELATIONSHIP OF MULTIPLE HEALTH
BEHAVIOURS
Wayne Kelsey deRuiter
Doctor of Philosophy
Exercise Sciences
University of Toronto
2014
Abstract
Background: Evaluating the interrelationship of health behaviours could assist in the
development of effective public health interventions. Furthermore, the ability to identify
cognitive mediating mechanisms that may influence multiple behavioural change requires
further evaluation.
Purpose: The objectives of this nationally representative multi-wave longitudinal
analysis were: (1) to evaluate co-variation among health behaviours; specifically alcohol
consumption, leisure-time physical activity, and smoking, and (2) to examine whether
mastery acts as a mediating cognitive mechanism that facilitates multiple health
behaviour change.
Methods: Secondary data analysis was conducted on the first seven cycles of the
Canadian National Population Health Survey. Data collection began in 1994/1995 and
has continued biennially to 2006/2007. This longitudinal sample consisted of 15,167
Canadians 12 years of age or older. Alcohol consumption, leisure-time physical activity,
iii
and smoking were assessed as continuous variables. Parallel process growth curve
models were used to analyze co-variation between health behaviours as well as to
evaluate the potential mediating effects of perceived mastery.
Results: An increase in leisure-time physical activity was associated with a greater
reduction in tobacco use, while a flatter positive trajectory in alcohol consumption was
associated with a steeper decline in tobacco use. Co-variation between alcohol
consumption and leisure-time physical activity did not reach statistical significance. For
the most part, mastery was unsuccessful in mediating the interrelationship of multiple
behavioural changes.
Conclusions: Health behaviours are not independent, but rather interrelated. Although
one could argue that the estimated magnitude of such behavioural changes were quite
small, modest and attainable behavioural changes at the population level can have
considerable effects on the morbidity, mortality, and health care costs. In order to
optimize limited prevention resources, these results suggest that population level
intervention efforts targeting multiple modifiable behavioural risk factors may not need to
occur simultaneously.
iv
Acknowledgments
I would like to acknowledge the contributions of numerous individuals for their tireless
efforts and support throughout the course of my graduate studies. First, I would like to
express thanks to my supervisor, Dr. Guy Faulkner, and committee members, Drs. John
Cairney and Scott Leatherdale, for their teaching and guidance during my dissertation. I
would also like to thank these gentlemen for their assistance in helping me achieve my
immediate and future goals. A sincere thank you to my family, particularly my mom and
dad, for their love, support, and the sacrifices they have made over the last several years.
Finally, I would like to dedicate this dissertation to my son, Aaron. I hope that this
document serves as an inspiration and reminder that with motivation, hard work, and
perseverance, anything is possible.

v
Table of Contents
List of Tables ......................................................................................................................................... ix
List of Figures ........................................................................................................................................ xi
List of Appendices ................................................................................................................................ xii
List of Abbreviations ........................................................................................................................... xiii
Glossary of Terms ................................................................................................................................ xiv
Chapter 1 ................................................................................................................................................. 1
Introduction ............................................................................................................................................. 1
1.1 Theme ............................................................................................................................................ 1
1.2 Objectives ...................................................................................................................................... 3
1.3 Culmination of Work ..................................................................................................................... 3
Chapter 2 ................................................................................................................................................. 5
Literature Review .................................................................................................................................... 5
2.1 Importance of Multiple Health Behaviour Research ..................................................................... 5
2.2 Prevalence of Multiple Health Behaviours/Risk Factors ............................................................... 9
2.3 Clustering of Health Behaviours .................................................................................................. 11
2.4 Behavioural Changes Over Time ................................................................................................. 12
2.5 Correlates of Health Behaviours .................................................................................................. 13
2.6 Theory Based Multiple Behavioural Change Research ............................................................... 17
2.7 Systematic Review ....................................................................................................................... 19
2.7.1 Systematic Review of Cross-Sectional Studies .................................................................... 21
2.7.2 Systematic Review of Longitudinal Studies ......................................................................... 31
2.7.3 Alcohol Consumption and Leisure-Time Physical Activity Energy Expenditure ................ 46
2.7.4 Leisure-Time Physical Activity Energy Expenditure and Smoking ..................................... 47
2.7.5 Alcohol Consumption and Smoking .................................................................................... 53
2.8 Limitations of Existing Multiple Health Behavioural Change Research ..................................... 56
2.9 Summary ...................................................................................................................................... 59
Chapter 3 ............................................................................................................................................... 61
Methodology ......................................................................................................................................... 61
3.1 Introduction .................................................................................................................................. 61
3.2 Study Design ................................................................................................................................ 63
3.3 Modules of the National Population Health Survey .................................................................... 66
3.4 Dependent Variables .................................................................................................................... 69
3.4.1 Alcohol Consumption........................................................................................................... 70

vi
3.4.2 Leisure-Time Physical Activity Energy Expenditure ........................................................... 73
3.4.3 Smoking ............................................................................................................................... 75
3.5 Independent Variables ................................................................................................................. 78
3.6 Mediating Variable ...................................................................................................................... 79
3.7 Longitudinal Statistical Analysis Techniques .............................................................................. 80
3.8 Statistical Analysis of the Current Study ..................................................................................... 84
Chapter 4 ............................................................................................................................................. 100
Results ................................................................................................................................................. 100
4.1 Inclusion and Exclusion Criteria ................................................................................................ 100
4.2 Attrition ...................................................................................................................................... 100
4.3 Sample Characteristics ............................................................................................................... 103
4.4 Prevalence of Single and Multiple Health Behaviours .............................................................. 106
4.5 Unconditional Growth Curve Models of Health Behaviours ..................................................... 110
4.5.1 Alcohol Consumption......................................................................................................... 112
4.5.2 Leisure-Time Physical Activity Energy Expenditure ......................................................... 117
4.5.3 Smoking ............................................................................................................................. 121
4.6 Parallel Process Latent Growth Curve Models .......................................................................... 125
4.6.1 Alcohol Consumption and Leisure-Time Physical Activity Energy Expenditure .............. 125
4.6.2 Leisure-Time Physical Activity Energy Expenditure and Smoking ................................... 129
4.6.3 Alcohol Consumption and Smoking .................................................................................. 132
4.7 Demographic Covariates ............................................................................................................ 135
4.7.1 Gender ................................................................................................................................ 135
4.7.2 Chronological Age ............................................................................................................. 139
4.7.3 Marital Status: .................................................................................................................... 141
4.7.4 Education ............................................................................................................................ 149
4.7.5 Income Adequacy ............................................................................................................... 149
4.7.6 Body Mass Index ................................................................................................................ 150
4.8 Unconditional Growth Curve Model of Mastery ....................................................................... 151
4.9 Mediating Effects of Mastery .................................................................................................... 156
4.9.1 Alcohol Consumption and Leisure-Time Physical Activity Energy Expenditure .............. 156
4.9.2 Leisure-Time Physical Activity Energy Expenditure and Alcohol Consumption .............. 160
vii
4.9.3 Leisure-Time Physical Activity Energy Expenditure and Smoking ................................... 162
4.9.4 Smoking and Leisure-Time Physical Activity Energy Expenditure ................................... 164
4.9.5 Alcohol Consumption and Smoking .................................................................................. 166
4.9.6 Smoking and Alcohol Consumption .................................................................................. 168
Chapter 5 ............................................................................................................................................. 170
Discussion ........................................................................................................................................... 170
5.1 Overview .................................................................................................................................... 170
5.2 Attrition ...................................................................................................................................... 170
5.3 Sample Characteristics ............................................................................................................... 175
5.4 Prevalence of Multiple Health Behaviours ................................................................................ 176
5.5 Single Health Behaviour Change ............................................................................................... 180
5.6 Multiple Health Behaviours ....................................................................................................... 184
5.6.1 Alcohol Consumption and Leisure-Time Physical Activity Energy Expenditure .............. 184
5.6.2 Leisure-Time Physical Activity Energy Expenditure and Smoking ................................... 186
5.6.3 Alcohol Consumption and Smoking .................................................................................. 190
5.6.4 Summary of Multiple Health Behaviours ........................................................................... 193
5.6.5 Implications of Findings ..................................................................................................... 194
5.7 Demographic Covariates ............................................................................................................ 197
5.7.1 Gender ................................................................................................................................ 198
5.7.2 Chronological Age ............................................................................................................. 198
5.7.3 Marital Status ..................................................................................................................... 199
5.7.4 Education ............................................................................................................................ 200
5.7.5 Income Adequacy ............................................................................................................... 201
5.7.6 Body Mass Index ................................................................................................................ 202
5.7.7 Summary of Demographic Covariates ............................................................................... 202
5.8 Mediating Effects of Mastery .................................................................................................... 203
5.9 Strengths .................................................................................................................................... 207
5.10 Limitations ................................................................................................................................. 210
5.11 Future Research.......................................................................................................................... 215
Chapter 6 ............................................................................................................................................. 220
Conclusion .......................................................................................................................................... 220

viii
6.1 Summary .................................................................................................................................... 220
References ........................................................................................................................................... 223
ix
List of Tables
Table 1: Pairwise Clustering of Health Behaviours..................................................................................12
Table 2: Cross-Sectional Multiple Health Behavioural Change Studies ................................................24
Table 3: Critique of Cross-Sectional Studies Retrieved for a Systematic Review .................................30
Table 4: Longitudinal Multiple Health Behavioural Change Studies .....................................................33
Table 5: Critique of Longitudinal Studies Retrieved for a Systematic Review ......................................45
Table 6: Characteristics of the NPHS by Province ...................................................................................65
Table 7: Modules of the National Population Health Survey ..................................................................68
Table 8: Summary of Questions and Categories in the Alcohol Consumption Module at Baseline .....72
Table 9: Summary of Questions and Categories in the Physical Activities Module at Baseline ..........74
Table 10: Summary of Questions and Categories in the Smoking Module at Baseline .........................76
Table 11: Items for Measuring Mastery ....................................................................................................80
Table 12: Baseline Characteristics that Predict Participation at the Seventh Cycle .............................102
Table 13: Weighted Demographic, Cognitive-Behavioural, and Behavioural Characteristics ...........104
Table 14: Weighted Sample Size and Prevalence of Unhealthy Behaviours ........................................107
Table 15: Weighted Prevalence of Single and Multiple Health Behaviours.........................................109
Table 16: Weighted Measures of Normality ...........................................................................................111
Table 17: Correlation Coefficients for Alcohol Consumption ...............................................................112
Table 18: Fit Indices for Unconditional and Parallel Process Models ..................................................113
Table 19: Correlation Coefficients for Leisure-Time Physical Activity ...............................................117
Table 20: Correlation Coefficients for Smoking ....................................................................................121
Table 21: Correlation Coefficients Between Alcohol Consumption and Leisure-Time Physical
Activity .......................................................................................................................................................126
Table 22: Correlation Coefficients Between Leisure-Time Physical Activity and Smoking ..............129
Table 23: Correlation Coefficients Between Alcohol Consumption and Smoking ..............................132
Table 24: Fit Indices for Parallel Process Models Adjusted for Time-Invariant Covariates ...............136
Table 25: Unstandardized Parameter Estimates and Correlations for Parallel Process Models Adjusted
for Gender ...................................................................................................................................................138
Table 26: Unstandardized Parameter Estimates and Correlations for Parallel Process Models Adjusted
for Chronological Age ...............................................................................................................................140
Table 27: Fit Indices for Parallel Process Models Adjusted for Time-Varying Covariates ................141
Table 28: Unstandardized Parameter Estimates for the Alcohol Consumption and Physical Activity
Parallel Process Model Adjusted for Time-Varying Covariates .............................................................143
Table 29: Unstandardized Parameter Estimates for the Physical Activity and Smoking Parallel
Process Model Adjusted for Time-Varying Covariates ..........................................................................144

x
Table 30: Unstandardized Parameter Estimates for the Alcohol Consumption and Smoking Parallel
Process Model Adjusted for Time-Varying Covariates ..........................................................................145
Table 31: Covariances Between Latent Variables Adjusted for Time-Varying Covariates ................147
Table 32: Correlations Between Latent Variables Adjusted for Time-Varying Covariates ................148
Table 33: Correlation Coefficients for Mastery ......................................................................................151
Table 34: Fit Indices for Mediation Parallel Process Models ................................................................157

xi
List of Figures
Figure 1: Linear Unconditional Growth Curve Model: Physical Activity .......................................... 90
Figure 2: Parallel Process Growth Curve Model: Leisure-Time Physical Activity and Smoking ...... 94
Figure 3: Mediation Growth Curve Model: Smoking, Mastery, and Physical Activity ...................... 98
Figure 4: Observed and Estimated Trajectories of Alcohol Consumption......................................... 114
Figure 5: Linear Growth Curve Model of Alcohol Consumption ...................................................... 116
Figure 6: Observed and Estimated Trajectories of Leisure-Time Physical Activity Energy
Expenditure ......................................................................................................................................... 118
Figure 7: Linear Growth Curve Model of Leisure-Time Physical Activity Energy Expenditure ...... 120
Figure 8: Observed and Estimated Trajectories of Smoking ............................................................. 122
Figure 9: Linear Growth Curve Model of Smoking ........................................................................... 124
Figure 10: Parallel Process Model of Alcohol Consumption and Leisure-Time Physical Activity
Energy Expenditure............................................................................................................................. 128
Figure 11: Parallel Process Model of Leisure-Time Physical Activity Energy Expenditure and
Smoking .............................................................................................................................................. 131
Figure 12: Parallel Process Model of Alcohol Consumption and Smoking ....................................... 134
Figure 13: Observed and Estimated Trajectories of Mastery ............................................................. 153
Figure 14: Linear Growth Curve Model of Mastery .......................................................................... 155
Figure 15: Mediation of Mastery in the Alcohol Consumption and Leisure-Time Physical Activity
Energy Expenditure Model ................................................................................................................. 159
Figure 16: Mediation of Mastery in the Leisure-Time Physical Activity Energy Expenditure and
Alcohol Consumption Model .............................................................................................................. 161
Figure 17: Mediation of Mastery in the Leisure-Time Physical Activity Energy Expenditure and
Smoking Model ................................................................................................................................... 163
Figure 18: Mediation of Mastery in the Smoking and Leisure-Time Physical Activity Energy
Expenditure Model .............................................................................................................................. 165
Figure 19: Mediation of Mastery in the Alcohol Consumption and Smoking Model ........................ 167
Figure 20: Mediation of Mastery in the Smoking and Alcohol Consumption Model ........................ 169

xii
List of Appendices
Appendix 1: Covariances and Correlations Between Latent Variables .................................................256

xiii
List of Abbreviations
BMI Body Mass Index
CFI Comparative Fit Index
CI Confidence Interval
cov Covariance
HMO Health Maintenance Organization
KCALS Kilocalories
Kcal/kg/day Kilocalories/Kilograms/Day
Kg Kilograms
M Metres
MESH Medical Subject Heading
NPHS National Population Health Survey
PSAE Participation in Sports, Athletics or Exercising
r Correlation
rANOVA Repeated-Measures Analysis of Variance
RDC Research Data Centres
rMANOVA Multivariate Repeated-Measures Analysis of Variance
RMSEA Root Mean Square Error Approximation
SRMR Standardized Root Mean Squared Residual
SSHRC Social Sciences and Humanities Research Council
X2 Chi-Square Goodness-of-Fit Statistic
xiv
Glossary of Terms
Clustering:
Refers to a grouping of two or more health behaviours that is “more prevalent
than can be expected on the basis of the prevalence of separate risk factors” (Schuit, van
Loon, Tijhuis, & Ocke, 2002, pg. 219).
Co-variation:
Refers to “taking effective action on one behaviour increases the odds of taking
effective action on a second behaviour” (J. O. Prochaska, 2008, pg. 282).
Gateway Behaviour:
Refers to “a behaviour that, when intervened upon, has a positive influence on
other behaviour changes” (Nigg, Allegrante, & Ory, 2002, pg.676).
Health Behaviour:
Refers to “actions in which individuals engage that influence health. The impact
can be negative, as with tobacco and other drug use and risky sexual behaviours, or
positive, as with physical activity, fruit and vegetable consumption, and the wearing of
helmets or seatbelts” (J. J. Prochaska, Spring, & Nigg, 2008, pg. 183).
Intentions:
Refers to “indications of how hard people are willing to try, of how much of an
effort they are planning to exert, in order to perform the behaviour” (Ajzen, 1991, pg.
181).
Leisure:
Refers to “unobligated or discretionary time – the free time that remains after the
demands of work, maintenance, and family and social obligations have been met”
(Wankel & Sefton, 1992, pg. 155).
Mastery:
Refers to “the extent to which one regards one’s life-chances as being under one’s
own control in contrast to being fatalistically ruled” (Pearlin & Schooler, 1978, pg. 5).
Physical Activity:
Refers to “any bodily movement produced by skeletal muscles that results in
energy expenditure” (Caspersen, Powell, & Christenson, 1985, pg. 126).
xv
Recall Decay:
Refers to “a decline in the ability to recall an event as the event recedes in time”
(R. A. Johnson, Gerstein, & Rasinski, 1998, pg.356).
Self-Efficacy:
Refers to “beliefs in one’s capabilities to organize and execute the courses of
action required to produce given attainments” (Bandura, 1997, pg. 3).
Teachable Moment:
Refers to “naturally occurring life transitions or health events thought to motivate
individuals to spontaneously adopt risk-reducing health behaviours” (McBride, Emmons,
& Lipkus, 2003, pg. 156).

1
Chapter 1
Introduction
1.1 Theme:
A health behaviour refers to “actions in which individuals engage that influence health.
The impact can be negative, as with tobacco and other drug use and risky sexual
behaviours, or positive, as with physical activity, fruit and vegetable consumption, and
the wearing of helmets or seatbelts” (J. J. Prochaska, Spring, et al., 2008, pg. 183). Since
approximately 60 to 64% of chronic disease deaths are attributed to an inability of
individuals to participate in multiple healthy behaviours (Knoops, et al., 2004) positive
behavioural changes could have a significant impact on the overall health of the general
population (Haveman-Nies, et al., 2002; Knoops, et al., 2004; Meng, Maskarinec, Lee, &
Kolonel, 1999) and a substantial impact on productivity, worker’s compensation, and
health care expenditures (Edington, 2001; Schuit, et al., 2002). Health care costs
associated with physical inactivity is estimated at over $2 billion (Katzmarzyk, Gledhill,
& Shephard, 2000), whereas costs attributable to smoking and alcohol consumption could
reach $17 billion and $14.6 billion, respectively (Rehm, et al., 2007). As these health
care expenditures continue to escalate, the primary prevention of unhealthy behaviours is
imperative. Approximately 50 to 80% of individuals within the general population
participate in multiple unhealthy behaviours (Berrigan, Dodd, Troiano, Krebs-Smith, &
Barbash, 2003; Coups, Gaba, & Orleans, 2004; Fine, Philogene, Gramling, Coups, &
Sinha, 2004) with physical inactivity, smoking, and excessive alcohol consumption being
among the most prevalent (Coups, et al., 2004; Fine, et al., 2004; Klein-Geltink, Choi, &
Fry, 2006). This co-occurrence of multiple unhealthy lifestyle behaviours provides
justification for the development of effective and cost-efficient multiple behavioural
change interventions (Bock, Marcus, Rossi, & Redding, 1998; Campbell, et al., 2000).
As the majority of behavioural studies have typically examined single behavioural
change, the need for research strategies that focus on as well as implement multiple
health behaviour change has arrived (Aarnio, Winter, Kujala, & Kaprio, 2002; Costakis,
Dunnagan, & Haynes, 1999; Coups, et al., 2004; Nigg & Long, 2012; S. Solomon &
Kington, 2002). Multiple health behaviour research attempts to identify, target, and

2
change as many health behaviours as possible in order to have the most significant impact
on the health and well-being of the general population (J. J. Prochaska, Spring, et al.,
2008). Although difficult to implement, health professionals have acknowledged that the
benefits associated with multiple health behaviour change outweigh the current
challenges (J. J. Prochaska, Nigg, Spring, Velicer, & Prochaska, 2010). Such advantages
include a substantially greater impact on the occurrence and severity of morbidity and
mortality (Nigg, et al., 2002; J. J. Prochaska, et al., 2010), the ability to evaluate the
interrelationship between health behaviours (Nigg, et al., 1999; Tucker & Reicks, 2002),
and the unique opportunity for the development of a choice-based approach in changing
health behaviours (de Vries, Kremers, Smeets, & Reubsaet, 2008), while conserving time
and resources and potentially minimizing health care expenditures (J. J. Prochaska, et al.,
2010; Pronk, Peek, & Goldstein, 2004). Furthermore, health professionals regard
multiple health behaviour interventions as being more relevant to real-world
circumstances (J. J. Prochaska, et al., 2010). For these reasons, the development of
effective interventions which stimulate the adoption and maintenance of multiple healthy
behavioural lifestyles has become the primary focus of public health interventions
(Haveman-Nies, et al., 2002).
Although multiple health behaviour research may represent a promising avenue in the
prevention of chronic diseases (L. Gordon, Graves, Hawkes, & Eakin, 2007), several
unanswered questions remain and need to be addressed by future research. As unhealthy
behaviours demonstrate a tendency to cluster (Poortinga, 2007b; Raitakari, et al., 1995;
Schuit, et al., 2002), evaluating co-variation of health behaviours could assist in the
development of effective and cost-efficient public health interventions as programs could
focus their time and resources on changing one or two health behaviours as opposed to
improving three or four behaviours (Nigg, et al., 2002; J. O. Prochaska, 2008; Tucker &
Reicks, 2002). Co-variation refers to “taking effective action on one behaviour increases
the odds of taking effective action on a second behaviour” (J. O. Prochaska, 2008, pg.
282). While the interrelationship of health behaviours has been examined for several
decades, by the turn of the century, little was known pertaining to the co-variation of
health behaviours (Ory, Jordan, & Bazzarre, 2002). However, in recent years, the
necessity for more effective public health strategies has led to a greater interest in

3
multiple behavioural research. In an attempt to examine the current literature pertaining
to the co-variation of multiple health behaviours, subsequent sections of Chapter 2 outline
and discuss the findings of a systematic review. Furthermore, while literature has been
able to identify cognitive mechanisms that influence single behavioural change (Bock, et
al., 1998; DiClemente, Prochaska, & Gibertini, 1985; Love, Davoli, & Thurman, 1996;
O'Hea, et al., 2004), the role that cognitive mechanisms may have on multiple
behavioural change is limited and requires further evaluation (Bock, et al., 1998; Nigg, et
al., 2002).
While interventions typically serve as a focal point for the majority of multiple
behavioural change research, observational studies could provide valuable insight into the
interrelationship of multiple health behaviour change within natural environments.
However, previous observational literature has incorporated several methodological
limitations that may have compromised the findings of these studies. Such limitations
have included cross-sectional study designs, small and unrepresentative samples of the
general population, the use of dichotomous or categorical outcome variables, as well as
the inability to assess cognitive mechanisms which may promote the adoption and
maintenance of multiple health behaviours. Thus, the current study will attempt to
address the aforementioned concerns of previous literature by using a large, nationally
representative database to assess the longitudinal trajectories of multiple behavioural
changes and potential cognitive mechanisms over several time intervals.
1.2 Objectives:
1) The primary objective is to evaluate co-variation among health behaviours;
specifically alcohol consumption, physical activity, and smoking across multiple
time intervals in a nationally representative sample.
2) The secondary objective is to examine whether mastery acts as a mediating
cognitive mechanism that facilitates changes between multiple health behaviours.
1.3 Culmination of Work:
I initially acquired an interest in the multiple behavioural change discipline when
examining the potential role that physical activity may play as a tobacco harm reduction
4
strategy. This literature review discussed how physical activity successfully fulfilled
several of the criteria that characterize tobacco harm reduction strategies (W. deRuiter &
Faulkner, 2006). Consequently, it was hypothesized that physical activity could reduce
tobacco use and possibly assist individuals in achieving cessation (W. deRuiter &
Faulkner, 2006). To investigate this theory, a cross-sectional study was undertaken in
which physically active smokers were compared to their inactive counterparts within a
nationally representative sample of Canadians (W. K. deRuiter, Faulkner, Cairney, &
Veldhuizen, 2008). It appeared that physically active smokers represented a unique
group of the smoking population as such individuals consumed fewer cigarettes per day
and reported a greater likelihood of attempting cessation (W. K. deRuiter, et al., 2008).
Although this empirical study provided evidence of an interrelationship between physical
activity and smoking, the findings were cross-sectional and offered only a snapshot of the
relationship between these two behaviours. Utilizing a longitudinal study design would
be a more suitable method for evaluating multiple behavioural trajectories and thus
seemed to be the next logical step in advancing my PhD studies. Therefore, this
dissertation not only addresses the limitations that have been reported within previous
empirical research, but it also represents a culmination of the work that I have
accomplished during my PhD candidacy within the Department of Exercise Sciences at
the University of Toronto.

5
Chapter 2
Literature Review
2.1 Importance of Multiple Health Behaviour Research:
To a considerable extent, health is a product of lifestyle behaviours. Generally,
individuals who practice a greater number of healthy behaviours can expect a reduction in
premature morbidity and mortality, a higher active life expectancy as well as an
enhancement in quality of life (Ferrucci, et al., 1999; Knoops, et al., 2004). Unlike
gender, aging, or genetics, lifestyle behaviours including excessive alcohol consumption,
physical inactivity, smoking, and unhealthy dietary intake are modifiable. The adoption
and maintenance of healthy behaviours could have a substantial effect on prolonging the
onset of chronic diseases (L. Gordon, et al., 2007). Thus even the slightest improvements
within these health behaviours could be substantially beneficial and significantly reduce
the odds of developing chronic and/or debilitating diseases (Atkins & Clancy, 2004;
Kvaavik, Batty, Ursin, Huxley, & Gale, 2010). Although these modifiable health
behaviours continue to be the primary focus of public health programs (Haveman-Nies, et
al., 2002), the majority of research has chosen to concentrate on single behavioural
change as opposed to the modification of multiple health behaviours (Berg, et al., 2012;
Costakis, et al., 1999; Coups, et al., 2004; Nigg, et al., 2002; Nigg & Long, 2012;
Strecher, Wang, Derry, Wildenhaus, & Johnson, 2002). Contrary to single behavioural
changes, modifying multiple behaviours requires the development of strategies and
programs which promote the adoption and maintenance of two or more health behaviours
either simultaneously or sequentially among high-risk individuals as well as the general
population (J. J. Prochaska, Spring, et al., 2008).
As the presence of multiple risk factors accumulate, a synergistic effect among health
behaviours is often observed resulting in an increase in susceptibility to mortality among
men and women (Meng, Maskarinec, Lee, & Kolonel, 1999). This increased risk of
mortality that is associated with the presence of multiple unhealthy behaviours is
equivalent to the accumulation of 12 additional years to an individual’s current age
(Kvaavik, et al., 2010). Public health programs could be more cost-efficient as well as
effective in reducing morbidity and mortality if they focus on changing multiple

6
behaviours as opposed to a single health behaviour (Chang, Hahn, Teutsch, &
Hutwagner, 2001; Clark, Nigg, Greene, Riebe, & Saunders, 2002; Meng, et al., 1999; J. J.
Prochaska & Prochaska, 2011). After all, if changing a single health behaviour can
substantially reduce the risk of mortality among individuals, then modifying multiple
health behaviours could have a substantially greater impact on the occurrence and
severity of morbidity and mortality (Chang, et al., 2001; Haveman-Nies, et al., 2002;
Knoops, et al., 2004; Kvaavik, et al., 2010; Meng, et al., 1999; Puska, et al., 1985).
The lack of an association between health behaviours would provide little justification for
targeting multiple health behaviours. Consequently, health professionals would aim to
change lifestyle behaviours independently which would require more resources to
produce favourable results (M. F. Johnson, Nichols, Sallis, Calfas, & Hovell, 1998).
However, since health behaviours often demonstrate co-occurrence, the identification of
co-variation or gateway behaviours could have significant implications on the
development of effective and cost-efficient health promotion programs (Emmons, Shadel,
Linnan, Marcus, & Abrams, 1999; M. F. Johnson, et al., 1998; Nigg, et al., 1999; J. J.
Prochaska & Prochaska, 2011; Tucker & Reicks, 2002). According to Nigg et al. (2002,
pg. 676), a gateway behaviour refers to “a behaviour that, when intervened upon, has a
positive influence on other behaviour changes”. Gateway behaviours provide health
professionals with an opportunity to allocate their time and resources towards one
lifestyle behaviour which could potentially modify additional health behaviours while
minimizing health care expenditures (Blakely, Dunnagan, Haynes, Moore, & Pelican,
2004; Nigg, et al., 1999; Pronk, Peek, et al., 2004). Thus, gateway behaviours could
provide health professionals with an opportunity to indirectly facilitate the adoption and
maintenance of additional health behaviours (Costakis, et al., 1999). Physical activity is
one of the more commonly evaluated gateway behaviours. Evidence suggests that
physical activity could act as a potential gateway behaviour for enhancing dietary intake
(Blakely, et al., 2004; Reedy, Haines, & Campbell, 2005; Tucker & Reicks, 2002),
reducing/quitting smoking (Costakis, et al., 1999; W. K. deRuiter, et al., 2008; Gauthier,
Snelling, & King, 2012; T. K. King, Marcus, Pinto, Emmons, & Abrams, 1996), and
moderating alcohol consumption (Rosal, Ockene, Hurley, & Reiff, 2000). Positive
changes in smoking behaviour may also have the capacity to act as a potential gateway

7
behaviour for reducing alcohol consumption (Miller, Hedrick, & Taylor, 1983) and vice
versa (Breslau, Peterson, Schultz, Andreski, & Chilcoat, 1996).
Since multiple behavioural change programs assist individuals in modifying several
lifestyle risk factors, these interventions allow the unique opportunity for individuals to
choose which behaviours to intervene upon as well as the chance to prioritize the
sequence in which these healthy behaviours are adopted (de Vries, Kremers, et al., 2008).
Abstinence from smoking and excessive alcohol consumption are challenging for the
majority of individuals. As opposed to modifying a “challenging” behaviour at the onset
of behavioural change, smokers or alcoholics may opt to concentrate on other lifestyle
risk factors that they perceive as being easier to adopt and maintain (Garrett, et al., 2004).
For example, high risk drinkers prefer to change smoking, physical activity levels or
dietary habits before changing their alcohol consumption (Rosal, et al., 2000). Smokers
also demonstrate similar behavioural choices as they report a greater motivation to
change their physical activity and/or dietary habits compared to selecting smoking
cessation as their highest priority (Campbell, et al., 2000). Focusing one’s attention on
attenuating other unhealthy behaviours before attempting smoking cessation could
produce more success and greater benefits compared to efforts that attempt to initially
change smoking habits (Sherwood, Hennrikus, Jeffery, Lando, & Murray, 2000). Health
professionals who emphasize changing a single behaviour may fail to recognize an
individual’s motivational readiness to adopt different behaviours; focusing on smoking
would miss the fact that smokers are also ready to change diet and/or physical activity
(Campbell, et al., 2000). Asking an individual what he/she is interested in changing
(choice-based system) is an effective method in identifying and prioritizing health
behaviours as it may provide the individual with a sense of motivation, empowerment
and self-efficacy to become more successful in adopting and maintaining additional and
more challenging behaviours (Ampt, et al., 2009; Berg, et al., 2012; Campbell, et al.,
2000; Strecher, et al., 2002). Thus, changing a benign behaviour could act as a potential
gateway behaviour for changing more difficult behaviours (Berg, et al., 2012; Rosal, et
al., 2000; Strecher, et al., 2002). However, this harm reduction approach may lead to the
emergence of a possible drawback as individuals who possess a high motivation to
change a relatively benign behaviour may experience benefits of lesser magnitude

8
compared to individuals who decide to change a more critical or life-threatening
behaviour (Campbell, et al., 2000). Hence, a choice-based system may provide
individuals with the preference of either achieving greater health benefits or enhancing
their confidence in adopting further healthy behaviours (Kukafka, Khan, Kaufman, &
Mark, 2009). One example of a choice-based approach, safer smoking tips, has been
described by Cunningham et al. (2006, 2007). Smokers who were provided knowledge
of safer smoking guidelines prior to discussing perceived choices believed that public
health organizations provided greater options for their smoking behaviour (Cunningham,
Selby, & Faulkner, 2007). Furthermore, information on safer smoking guidelines did not
appear to undermine behavioural changes as individuals demonstrated a reduction in
tobacco use (Cunningham, Faulkner, Selby, & Cordingley, 2006).
As multiple health behaviour change research assists individuals in identifying, targeting,
and changing as many health behaviours as possible (J. J. Prochaska, Spring, et al., 2008),
there is some concern that attempting to change health behaviours simultaneously may
obstruct or overwhelm behavioural change (Berg, et al., 2012). To some extent, this
concern is warranted. In a natural environment, pregnant women who used multiple
substances were significantly less likely to quit consuming alcoholic and caffeinated
beverages, but not cigarette smoking (Pirie, Lando, Curry, McBride, & Grothaus, 2000).
However, in comparing the effectiveness of single and multiple health behavioural
change interventions, Prochaska et al. (2006) concluded that after the adjustment of
demographic as well as smoking characteristics, smoking abstinence rates were similar
between both interventions. Although multiple health interventions appear to be as
effective at promoting smoking cessation as interventions which attempt to modify a
single behaviour, evidence to support the development of multiple behavioural change
interventions was apparent as this type of intervention was able to facilitate favourable
changes in additional behaviours (diet and/or sun exposure) (J. J. Prochaska, Velicer,
Prochaska, Delucchi, & Hall, 2006).
Adopting and maintaining multiple health behaviours would not only be a daunting and
challenging task for an individual (Berg, et al., 2012; Nigg & Long, 2012; Strecher, et al.,
2002), but may require the integration of health care organizations as well as the service
of multiple health professionals with various expertise (J. J. Prochaska, et al., 2010).

9
However, behavioural change professionals agree that the benefits of multiple behaviour
change interventions often outweigh the associated challenges (J. J. Prochaska, et al.,
2010). The North Karelia Project, Project PREVENT, and Mediterranean Lifestyle
Project are examples of interventions that have been successful in changing multiple
health behaviours (Emmons, McBride, Puleo, Pollak, Clipp, et al., 2005; Puska, et al.,
1985; Toobert, et al., 2007; Toobert, Strycker, Glasgow, Barrera Jr, & Angell, 2005).
2.2 Prevalence of Multiple Health Behaviours/Risk Factors:
While the benefits of participating in healthy lifestyles are widely known, the majority of
the general population continues to demonstrate an inability to adhere to such
recommendations (Berrigan, et al., 2003; Coups, et al., 2004; Keller, Maddock,
Hannover, Thyrian, & Basler, 2008). The most prevalent independent health risk factor
within the United States appears to be physical inactivity as the majority of individuals,
58 to 69%, do not participate in regular levels of physical activity (Coups, et al., 2004;
Fine, et al., 2004; Pronk, Anderson, et al., 2004). Following closely behind physical
inactivity, overweight/obesity is an another risk factor that is prevalent among the
majority of Americans (Coups, et al., 2004; Fine, et al., 2004; Pronk, Anderson, et al.,
2004). This is not surprising considering the strong relationship between physical
inactivity and being overweight/obesity (Fine, et al., 2004). For the purpose of this
analysis, obesity was considered a risk factor rather than a behaviour as it is a product of
physical inactivity and/or unhealthy dietary habits. Unhealthy dietary habits, a lack of
fruit and vegetables and/or high dietary fat consumption, are also common among
Americans as 35 to 66% of individuals possess low quality diets (Berrigan, et al., 2003;
Pronk, Anderson, et al., 2004). Although they can be more harmful, these behaviours are
less prevalent as 20 to 32% of individuals are smokers and 8 to 26% of the general
population drink excessively (Berrigan, et al., 2003; Coups, et al., 2004; Fine, et al.,
2004).
While research has attempted to identify the occurrence of multiple unhealthy
behaviours, the prevalence of unhealthy behavioural combinations can vary substantially
between populations as well as the types of risk factors evaluated. Literature reports only
a small proportion, 3 to 15%, of the general population possess no unhealthy behaviours
10
(Berrigan, et al., 2003; Coups, et al., 2004; de Vries, Kremers, et al., 2008; Fine, et al.,
2004; Pronk, Anderson, et al., 2004; Schuit, et al., 2002). Unfortunately, engaging in
multiple unhealthy behaviours is exceptionally prevalent among the United States general
population as 50 to 80% of individuals exhibit several lifestyle risk factors including
physical inactivity, being overweight, unhealthy dietary intake, smoking, and/or
excessive alcohol consumption (Berrigan, et al., 2003; Coups, et al., 2004; Fine, et al.,
2004). Berrigan et al. (2003) reported that over 40% of the United States population
partakes in either smoking or excessive alcohol consumption as well as one or more other
risk factors pertaining to dietary intake and/or physical inactivity. The most prevalent
pairwise combination of unhealthy behaviours among the general population appears to
be physical inactivity and being overweight/obese (26.4%) (Fine, et al., 2004). Physical
inactivity, being overweight/obese, and smoking is the most common combination of
three risk factors (5.5%) (Fine, et al., 2004).
Canadians appear to state more conservative estimates as 15 to 21% report possessing no
unhealthy behaviours, while 39 to 58% of individuals possess multiple risk factors
(Klein-Geltink, et al., 2006; Makrides, Sawatzky, Petrie, & Veinot, 2010). Similar to the
prevalence rates within the United States, physical inactivity is the most prevalent risk
factor (53.5%) among Canadians, followed by overweight/obesity (44.8%), smoking
(21.5%), and excessive alcohol consumption (6.0%) (Klein-Geltink, et al., 2006).
However, according to Makrides et al. (2010), the most prevalent risk factors among
Canadians were being overweight (70%), a physically inactive lifestyle (49%), and
smoking (20%). The most common pairwise combination of risk factors among
Canadians is physical inactivity and being overweight/obese (19.0%), while physical
inactivity, being overweight/obesity, and smoking is the most prevalent combination of
three unhealthy behaviours (Klein-Geltink, et al., 2006).
Even though Canada and the United States demonstrate similar risk factor trends, the
observed variations in prevalence rates could be attributed to the utilization of different
criteria employed to define each unhealthy behaviour. Unlike their United States
counterparts (Berrigan, et al., 2003; Coups, et al., 2004; Fine, et al., 2004), Klein-Geltink
et al. (2006) did not consider the occurrence of binge drinking when defining their criteria
for excessive alcohol consumption. Furthermore, Klein-Geltink et al. (2006) also
11
categorized occasional smokers as non-smokers and used a conservative criteria, <1.5
kilocalories/kilograms/day (kcal/kg/day), in classifying individuals as being physically
inactive. Regardless of which criteria are employed to define unhealthy behaviours, it is
apparent that a substantial proportion of the general population need to adopt healthier
lifestyles.
2.3 Clustering of Health Behaviours:
The occurrence of multiple unhealthy behaviours is not random as specific lifestyle
behaviours have shown a tendency to cluster among one another (Driskell, Dyment,
Mauriello, Castle, & Sherman, 2008; Poortinga, 2007b; Schuit, et al., 2002). Clustering
is a concept that refers to a grouping of two or more health behaviours that is “more
prevalent than can be expected on the basis of the prevalence of separate risk factors”
(Schuit, et al., 2002, pg. 219). In regards to the clustering of pairwise combinations of
health behaviours, smoking and excessive alcohol consumption demonstrated the
strongest association of clustering as smokers reported a 2.4 times increase in the odds of
excessive alcohol consumption compared to non-smokers (Schuit, et al., 2002). Others
have also reported a strong association between both smoking and excessive consumption
of alcohol (Chou, 2008; Poortinga, 2007b) suggesting that the strongest clustering occurs
between the most difficult behaviours to change. As outlined in Table 1, several other
clusters of modifiable lifestyle risk factors have been identified in young/middle aged
adult populations including excessive alcohol consumption and unhealthy dietary intake,
smoking and deficient dietary habits, and unhealthy dietary habits and physical inactivity
(Poortinga, 2007b; Schuit, et al., 2002). Contrasting results have been observed for other
combinations of health behaviours such as smoking and physical inactivity. Some have
demonstrated significant pairwise clustering between smoking and physical inactivity
(Schuit, et al., 2002), whereas others have observed significant inverse clustering between
these two behaviours (Poortinga, 2007b). As a greater understanding of behavioural
clustering is acquired, public health professionals will be able to use this knowledge to
design and implement effective preventive health promotion programs (Schuit, et al.,
2002).

12
Table 1: Pairwise Clustering of Health Behaviours
Schuit et al. (2002) Poortinga et al. (2007) Chou et al. (2008)
Men and Women Men Women Men Women
Smoking &
Excessive Drinking 2.38‡ 1.90*** 2.88*** 1.25*** 10.04***
Smoking & Physical
Inactivity 1.39‡ 0.85** 0.81** 0.22*** 0.77***
Smoking &
Unhealthy Diet 1.65‡ 2.31*** 2.75*** 0.35*** 0.53
Physical Inactivity &
Unhealthy Diet 1.57‡ 1.19** 1.46*** 0.03*** 0.12***
Physical Inactivity &
Excessive Drinking 1.04 0.77*** 0.84* 0.42 0.66
Unhealthy Diet &
Excessive Drinking 1.51‡ 1.48*** 1.63*** 0.53 0.27
‡ Prevalence odds ratio was significant, but the level of significance is not known.
* Prevalence odds ratio was significant at p<0.05; ** Significant at p<0.01; ***Significant at p<0.001.
2.4 Behavioural Changes Over Time:
Due to the strong association between health behaviours and various health indicators,
health care professionals and policy makers have begun to recognize the importance that
behavioural change may have on population health (Orleans, Gruman, Ulmer, Emont, &
Hollendonner, 1999). Smoking and alcohol consumption are perceived as being more
difficult to change. Consequently these behaviours demonstrate relatively high to
moderate stability as they require continuous self-restraint and abstinence compared to
other health enhancing behaviours such as physical activity or dietary intake which
exhibit greater levels of instability (Boniface, Cottee, Neal, & Skinner, 2001; de Vries,
van 't Riet, et al., 2008; Mulder, Ranchor, Sanderman, Bouma, & van den Heuvel, 1998;
Paavola, Vartiainen, & Haukkala, 2004; Prattala, Karisto, & Berg, 1994).
In the past, empirical research has demonstrated substantial behavioural changes, either
positive or negative, in physical activity (Audrain-McGovern, Rodriguez, & Moss, 2003;
Jacobs, et al., 1991; I. M. Lee, Paffenbarger, & Hsieh, 1992; Terry-McElrath & O'Malley,
2011), tobacco use (P. I. Frank, Morris, Frank, Hazell, & Hirsch, 2004; Li, et al., 2009;
Terry-McElrath & O'Malley, 2011), and alcohol consumption (Costanzo, et al., 2007; Li,
et al., 2009; Terry-McElrath & O'Malley, 2011; Vlasoff, et al., 2008). However, in
regards to multiple behavioural changes, research is limited. One study of particular
13
interest was conducted over a 4 year period by Mulder et al. (1998). It was observed that
only a small proportion of men, 10%, were able to change multiple health behaviours
(Mulder, et al., 1998). Of these men who reported multiple behavioural changes, 40%
had adopted two or more healthy behaviours, 40% made one healthy as well as one
unhealthy behavioural change, and the remaining 20% had taken up two or more
unhealthy risk factors (Mulder, et al., 1998). In most cases, the adoption of multiple
health behaviours was associated with at least one healthy behavioural change. However,
in nearly half of these individuals, any benefits obtained through a positive behavioural
change could be potentially offset by a negative behavioural change. It is not uncommon
for a positive behavioural change to subsequently result in the adoption of a negative
behaviour. Smoking cessation is often accompanied with weight gain (Chinn, et al.,
2005), while improvements in physical activity levels are associated with an increase in
dietary fat consumption (Dutton, Napolitano, Whiteley, & Marcus, 2008). These findings
reveal that, without the assistance of an intervention, only a small proportion of
individuals are able or willing to change multiple behaviours. While interventions have
reported greater success in adopting multiple health behaviours (Emmons, McBride,
Puleo, Pollak, Clipp, et al., 2005; Vandelanotte, Reeves, Brug, & De Bourdeaudhuij,
2008), the results of observational studies should not be overlooked as they may be more
applicable to real-world circumstances.
2.5 Correlates of Health Behaviours:
Understanding the correlates of unhealthy behaviours can assist public health
professionals in identifying high risk groups of individuals who are more likely to possess
multiple unhealthy lifestyles (Berrigan, et al., 2003; Poortinga, 2007b; Schuit, et al.,
2002). Once identified, such individuals could be targeted by public health programs.
Individuals who are male, young or middle aged, divorced, separated, or widowed, with
lower levels of education, and lower incomes demonstrate a tendency to possess multiple
unhealthy behaviours (Berrigan, et al., 2003; Fine, et al., 2004; Laaksonen, Prattala, &
Lahelma, 2003; Li, et al., 2009; Prattala, et al., 1994; Rosal, et al., 2001). This suggests
that disadvantaged individuals may benefit most from adopting and maintaining healthy
behaviours. Of these demographic characteristics, age and education appear to be less
14
important in regards to behavioural change as these qualities have demonstrated a
marginal effect on the stability of health behaviours over a 4 year period (Mulder, et al.,
1998). Consequently, Mulder et al. (1998) suggested that additional characteristics may
have a more significant influence on behavioural change. Findings presented by
Boniface et al. (2001) demonstrated that the adoption or maintenance of healthy
behaviours was associated with full-time employment, higher education as well as higher
social class. Disadvantaged individuals may need to be targeted by health professionals
as they appear to experience difficulty in achieving healthy behavioural changes.
Although the identification of demographic characteristics is essential in improving
public health, these characteristics are typically unchangeable. Understanding the
cognitive mechanisms which assist individuals in adopting and maintaining multiple
behavioural change is necessary (J. J. Prochaska & Sallis, 2004) as they are often
modifiable (Pederson, Koval, McGrady, & Tyas, 1998) and essential mechanisms in the
behavioural change process (DiClemente, et al., 1985; Love, et al., 1996). One such
cognitive mechanism is mastery. As a cognitive mechanism, mastery has gained
considerable attention. Similar to self-efficacy, mastery is a concept that is related to
personal control (Pearlin & Schooler, 1978). Mastery refers to “the extent to which one
regards one’s life-chances as being under one’s own control in contrast to being
fatalistically ruled” (Pearlin & Schooler, 1978, pg. 5). Mastery levels, which are often a
result of one’s previous successes and failures, can dictate the number and type of
potentially stressful events an individual can manage, the magnitude of effort exerted by
the individual to resolve such stressful events, and the amount of resiliency that is
demonstrated during difficult situations (Turner & Roszell, 1994). During one's lifetime,
the trajectory of perceived control resembles an inverted "U" as adolescence and early
adulthood represent a period in which individuals experience an increase in perceived
control (Mirowsky & Ross, 2007). As middle age is reached, one's perception of control
begins to steadily decline (Mirowsky, 1995; Mirowsky & Ross, 2007) with elderly
individuals reporting the lowest levels control (Mirowsky, 1995).
In previous literature, mastery has demonstrated a significant association with smoking
status and smoking relapse as it appears to play a role in reducing the urge to smoke
(O'Connell, Gerkovich, & Cook, 1995; Pederson, et al., 1998). Mastery has also

15
exhibited a similar association with alcohol dependence suggesting that alcoholics
believe that their drinking habits are under their control (Prescott, Neale, Corey, &
Kendler, 1997). These findings suggest that mastery is associated with smoking and
alcohol consumption and thus could be an essential mechanism in behavioural change.
However, other studies have shown conflicting results and have been unable to establish
an association between mastery and smoking as well as alcohol consumption (Allison,
Adlaf, Ialomiteanu, & Rehm, 1999; Sneed, Morisky, Rotheram-Borus, Ebin, & Malotte,
2001). These contrasting findings could possibly be explained by differences in study
design, study sample, and variations in the measurement of mastery. A cross-sectional
study design has been a popular choice among many researchers (Allison, et al., 1999;
Pederson, et al., 1998; Prescott, et al., 1997), followed by a retrospective (O'Connell, et
al., 1995) or longitudinal design (Sneed, et al., 2001). The recruitment of a small sample
(n = 57) (O'Connell, et al., 1995), and various study samples, adolescents (Pederson, et
al., 1998; Sneed, et al., 2001), young adults (Allison, et al., 1999; Prescott, et al., 1997),
and middle aged adults (O'Connell, et al., 1995), could also be responsible for any
discrepancies in the findings. Finally, various measures of mastery were employed
between studies. This could be the most likely explanation as to why the findings of
these studies are conflicting. A global mastery scale developed by Pearlin and Schooler
(1978) was utilized by Sneed et al. (2001), Allison et al. (1999), and Pederson et al.
(1998). Prescott et al. (1997) employed the Powerlessness Scale (Maddi, Kobasa, &
Hoover, 1979), whereas Apter’s Reversal Theory (Apter, 1989) was employed by
O’Connell et al. (1995). The use of various mastery scales may have produced
inconsistent findings and thus making it difficult to compare results.
The effect of mastery on behavioural changes extends beyond smoking and alcohol
consumption as it appears to be essential in the participation of physical activity.
Although active exercisers and non-exercisers reported similar levels of mastery during
an exercise intervention, higher levels of mastery were observed among exercisers during
the follow-up period (Sorensen, 1997). These findings suggest that improvements in
mastery are related to recent participation of a behaviour (Sorensen, 1997). Others have
confirmed such findings (Sorensen, Anderssen, Hjerman, Holme, & Ursin, 1997).
Furthermore, a reciprocal association was also observed as mastery was a significant

16
predictor of exercise compliance (Sorensen, et al., 1997). Unlike the aforementioned
interventions, in an observational study, Cairney et al. (2005) reported a positive
relationship between mastery and leisure-time physical activity among a sample of
elderly Canadians. Although this relationship had reached statistical significance, the
strength of the correlation (r) was weak (r = 0.16) (Cairney, Faught, Hay, Wade, &
Corna, 2005). Prior to the research conducted by Cairney et al. (2005), Allison et al.
(1999) had examined the effects of mastery as well as other social determinants on health
behaviours among young adults. Allison et al. (1999) found no association between
mastery and physical inactivity. Allison et al. (1999) suggested that these non-significant
associations could be the result of using determinants that were not behaviour specific,
but rather global determinants (e.g., overall mastery). Dergenace et al. (2005) also did
not observe a significant association between mastery and physical activity in a sample of
elderly Mexican Americans and European Americans. When employing cross-sectional
study designs, previous studies were either unable to observe whether a sense of mastery
was associated with physical activity (Allison, et al., 1999; Dergance, Mouton,
Lichtenstein, & Hazuda, 2005) or identified a weak relationship between mastery and
physical activity (Cairney, et al., 2005). Perhaps longitudinal studies would be more
appropriate for assessing whether mastery is associated with changes in health behaviours
(Cairney, Faulkner, Veldhuizen, & Wade, 2009). However, it is also conceivable that
interventions are necessary before an association between mastery and physical activity
can be observed.
Although mastery could be associated with the presence of specific health behaviours, the
association between mastery and behavioural change has had little examination.
Furthermore, to my knowledge, the potential mediating effects of mastery on changes in
multiple behaviours is also non-existent and thus deserves further evaluation. If mastery
is found to be associated with multiple behavioural change, then strategies for increasing
mastery would become an integral component of behavioural change interventions
(Pederson, et al., 1998).

17
2.6 Theory Based Multiple Behavioural Change Research:
Although it is unlikely that a single theory can fully explain the process of change for
every health behaviour encountered, it is expected that one theory could be more
appropriate in describing this process than others (Langlois & Hallam, 2010). Due to its
comprehensive approach, previous empirical research has typically utilized the Trans-
Theoretical Model to assess multiple behavioural change (Herrick, Stone, & Mettler,
1997). This model has been used to describe how individuals change detrimental
lifestyle behaviours by adopting and maintaining healthy behaviours (Rosen, 2000).
Briefly, individuals must progress through a series of stages which represent their
motivational readiness for behavioural change. Upon completing each of the five stages
of change, individuals will have successfully adopted and maintained a healthy behaviour
(DiClemente, et al., 1985; Doherty, Steptoe, Rink, Kendrick, & Hilton, 1998). The five
stages of change include the precontemplation, contemplation, preparation, action, and
maintenance stages. The first three stages of change represent periods of time in which
individuals intend to change their behaviour. Individuals who do not intend to change a
particular behaviour within the next 6 months are in the precontemplation stage. In the
contemplation stage, individuals plan to change their behaviour within the next 6 months.
The preparation stage represents a period in which the individual contemplates changing
their behaviour within the next 30 days. In the action stage, the individual has taken
action and adopted the new health behaviour for less than 6 months, whereas individuals
participating in the new behaviour for a minimum of 6 months are classified as being in
the maintenance stage (J. O. Prochaska, et al., 1994). The Trans-Theoretical Model also
includes three additional components; processes of change, decisional balance, and self-
efficacy. The processes of change describe activities individuals may use to progress
through the stages of change (J. O. Prochaska, et al., 1994). Decisional balance involves
the individual’s perception of the benefits as well as barriers of undertaking a behavioural
change (J. O. Prochaska, et al., 1994). Individuals perceive higher barriers and fewer
benefits during the earlier stages of behavioural change, whereas perceived benefits tend
to outweigh the barriers in the later stages of change (J. O. Prochaska, et al., 1994). The
crossover point in which the perceived benefits outweigh the perceived barriers appears
to occur before individuals begin to participate in the health behaviour, usually between
18
the contemplation and action stages (J. O. Prochaska, et al., 1994). Self-efficacy refers to
“beliefs in one’s capabilities to organize and execute the courses of action required to
produce given attainments” (Bandura, 1997, pg. 3). Self-efficacy is not only essential in
the initiation of behaviour change, but the maintenance of such a change as well
(DiClemente, et al., 1985; Love, et al., 1996; Meland, Maeland, & Laerum, 1999; Tucker
& Reicks, 2002). The Trans-Theoretical Model encourages interventions to be stage-
specific in the messages and resources they utilize in assisting individuals to adopt and
maintain healthy behaviours (Feinstein & Feinstein, 2001).
Although the Trans-Theoretical Model is commonly employed for evaluating health
behaviour change (Weinstein, Rothman, & Sutton, 1998), it is not without its limitations.
Classification of the stages of change can often be difficult and relies on an accurate self-
reported description of an individual’s motivational readiness to change a particular
health behaviour (Weinstein, et al., 1998). Furthermore, progression through the stages
of change is not necessarily associated with significant improvements in a health
behaviour (Callaghan, Taykor, & Cunningham, 2007). Finally, it is important to
remember that behaviour change is challenging and although an individual could be
motivated and have good intentions to change a particular health behaviour, it is possible
that their intentions may not correspond to the adoption of a favourable behaviour
(Callaghan, et al., 2007).
The Theory of Planned Behaviour, an extension of the Theory of Reasoned Action, is
useful when an individual perceives little to no control over factors, events, information,
skills, or opportunities (Ajzen, 1985, 1991). According to the Theory of Planned
Behaviour, an individual’s intentions are a primary determinant as to whether or not they
engage in a particular behaviour (Ajzen, 1991). Intentions are “indications of how hard
people are willing to try, of how much of an effort they are planning to exert, in order to
perform the behaviour” (Ajzen, 1991, pg. 181). Similar to the Theory of Reasoned
Action, intentions are influenced by their attitudes and subjective norms; an individual’s
evaluation of participating in a behaviour and their perception of the social pressure they
may experience from significant others for performing a behaviour, respectively (Ajzen,
1985, 1991). Building on the Theory of Reasoned Action, the Theory of Planned
Behaviour incorporates perceived behavioural control which can influence the

19
performance of a behaviour either directly or indirectly through intentions (Ajzen, 1991).
Perceived behavioural control refers to an individual’s perception of the degree of
difficulty in performing a behaviour (Ajzen, 1991). When individuals perceive complete
control over opportunities, factors, and resources as well as fewer challenges with
performing a behaviour, the Theory of Planned Behaviour acts similar to the Theory of
Reasoned Action (Ajzen, 1985, 1991). More positive attitudes and subjective norms as
well as greater perceived behavioural control often lead to stronger intentions which
result in a greater likelihood of performing a chosen behaviour (Ajzen, 1991). As with
other theories, the Theory of Planned Behaviour has a number of limitations; intentions
may change over time or new information may become available that interrupts an
individual’s intentions (Ajzen, 1985). Evidence of previous empirical studies have
demonstrated that intentions and perceived behavioural control are related to soft drink
consumption and television viewing (de Bruijn & van den Putte, 2009). Others have
shown that positive attitudes, subjective norms, and perceptions of behavioural control
are associated with stronger intentions to engage in physical activity and a healthy diet
(Andrykowski, Beacham, Schmidt, & Harper, 2006). To some extent, the Theory of
Planned Behaviour may provide essential information to guide the secondary objective of
this study; whether mastery acts as a mediating mechanism that facilitates co-variation.
If perceived control, as measured by mastery, mediates the co-variation of health
behaviours, the Theory of Planned Behaviour may provide insight into how mastery
assists and interacts with additional mechanisms in accomplishing multiple behavioural
changes.
2.7 Systematic Review:
To this point, the current literature review has focused upon the importance of multiple
health behaviour change research, the prevalence and clustering of multiple health
behaviours, the occurrence of behavioural change over time, as well as correlates of
health behaviours. This literature has shown that multiple health behaviour change can
significantly reduce the occurrence of mortality, may assist in the identification of
potential gateway behaviours, and allow individuals an opportunity to select which
behaviours they are interested in changing. In addition, health professionals should focus

20
their attention and resources on changing physical inactivity, smoking, and excessive
alcohol consumption as these unhealthy lifestyle behaviours are among the most
prevalent within the general population. Furthermore, although multiple behavioural
change is achieved by only a small proportion of individuals, the majority of such
individuals are able to attain at least one positive behavioural change.
Overall, multiple health behaviour change may represent the future of chronic disease
prevention (L. Gordon, et al., 2007), however there are several questions pertaining to
this field of research that need to be answered. As previously mentioned, health
professionals are aware of the “why” and “what” of multiple health behaviour change,
however a primary concern regarding this discipline of research is the interrelationship
between health behaviours and how changes in one behaviour may influence subsequent
behavioural changes (Bock, et al., 1998; Clark, et al., 2005; Costakis, et al., 1999; Nigg,
et al., 2002; Unger, 1996). The purpose of this systematic review was to examine the
current scientific evidence of multiple health behaviour change with the specific focus of
examining co-variation; whether changes in one health behaviour are significantly
associated with changes in additional health behaviours. It's expected that this systematic
review will not only provide valuable insight in the understanding of co-variation, but
identify limitations that have been encountered by previous empirical research. The
resolution of these limitations will thereby contribute to the uniqueness and novelty of
this dissertation.
In an effort to address the purpose of this systematic review, relevant medical subject
headings (MESH) and non-MESH terms were entered into Pubmed and Ovid medline
databases. These terms included motor activity, physical fitness, leisure activities, sports,
exercise, exercise therapy, physical exertion, physical activity, alcohol, alcoholism,
alcohol drinking, alcoholics, alcoholic intoxication, smoking, smoking cessation, tobacco,
tobacco use cessation, tobacco use disorder, cigarette, health behavior, attitude to health,
risk factors, health promotion, multiple health behavior, multiple health behavior change,
multiple risk factor, multiple lifestyle behavior, and gateway behavior. These terms were
used independently and in BOOLEAN combination. Furthermore, the database search
was complemented by a manual review of reference lists from the retrieved database
articles. In an attempt to provide greater focus to each literature search, human and

21
English limits were utilized. This systematic review also employed a publication date
range of thirty years; 1982 to July 2012. This range was chosen due to the fact that
multiple health behaviour change is a relatively new discipline of research and the most
influential studies would be encompassed within this thirty year period. Excluded from
this review were studies that had analysed data that was collected, either at baseline
and/or follow-up, from an experimental or quasi-experimental study. The justification for
excluding these studies was twofold. First, experimental and quasi-experimental study
designs involve the exposure or deprivation of some condition to a specific group(s) and,
in the case of experimental designs, may include the process of randomly assigning study
participants to various treatment and/or control groups. As this dissertation intends to
employ observational data to evaluate co-variation between health behaviours, comparing
the findings of experimental/quasi-experimental studies with those of observational
studies could be challenging as well as inappropriate. Second, the recruitment of
individuals with no intention of adopting a healthy behaviour has been a challenge for
previous interventions (Emmons, Marcus, Linnan, Rossi, & Abrams, 1994; Stotts,
Schmitz, & Grabowski, 2003). Thus, the findings could be subjected to bias as only
individuals who are interested in behavioural change represent the recruited sample. It is
likely that population-based observational studies recruit individuals with no intention of
attempting behavioural changes. Consequently, the findings of observational studies
would be difficult to compare with those of experimental research.
2.7.1 Systematic Review of Cross-Sectional Studies:
Nine observational cross-sectional studies were retrieved. Table 2 summarizes the
recruited sample, behavioural measurements, reported findings, and the study limitations
for each of the nine observational cross-sectional studies. Each cross-sectional study was
critiqued based on sufficient sample size, generalizability to the general population, the
analysis of potential cognitive-behavioural mediating mechanisms, and whether health
behaviours were adequately measured. This critique of cross-sectional studies is
presented in Table 3.
In order to fulfill the appropriate sample size criterion, researchers could not
acknowledge that sample size was a possible limitation for the findings that they
22
observed. Each of the nine cross-sectional studies identified through the systematic
review had recruited an adequate sample size.
Only two of the nine cross-sectional studies had recruited a sample of individuals that
were representative of the general population (De Leon, et al., 2007; Lippke, Nigg, &
Maddock, 2012). However, in the case of Lippke et al. (2012), two of three studies had
recruited a representative sample of the general population, while their third study had
included a sample of people with diabetes. Others had enrolled specific subgroups of the
general population including individuals with at least one chronic disease (Boudreaux,
Francis, Carmack Taylor, Scarinci, & Brantley, 2003; Boyle, O'Connor, Pronk, & Tan,
1998; Finnegan & Suler, 1985), university students (Keller, et al., 2008), smokers (T. K.
King, et al., 1996) and pregnant women (Pirie, et al., 2000).
As discussed in preceding as well as forthcoming sections, cognitive behavioural
mechanisms including mastery, motivational readiness and self-efficacy can influence
behavioural change. Thus, the effects of cognitive mediating mechanisms on the co-
variation of multiple health behaviours should be examined (Muehrer, 2000; J. J.
Prochaska & Prochaska, 2011). Not one of the cross-sectional studies evaluated in this
systematic review had examined the potential mediating effects of cognitive mechanisms
in the co-variation of health behaviours.
The evaluation of health behaviour variables was also assessed for each cross-sectional
study. For the purposes of this systematic review, cross-sectional studies had met the
criterion for adequate measurements of health behaviours if they had adopted one of two
measures: 1) the utilization of continuous variables to assess each health behaviour or 2)
the use of an established theory pertaining to health behaviour change. As discussed in
more detail in subsequent sections, continuous variables are not restricted by specific
criteria or cut-off points and thus could be more appropriate for examining behavioural
change. The second component of this criterion relies on the use of an established health
behaviour change theory that specifically evaluates how changes in one behaviour
influences or produces changes in an additional behaviour. The Trans-Theoretical Model
could be an example as it is a common and appropriate model to assess multiple
behavioural change (Herrick, et al., 1997). Studies could establish evidence of co-
variation between behaviours by examining the association between the stages of change

23
or self-efficacy levels. The majority of cross-sectional studies, six of nine, had fulfilled
this criterion (Boudreaux, et al., 2003; Boyle, et al., 1998; Garrett, et al., 2004; Keller, et
al., 2008; T. K. King, et al., 1996; Lippke, et al., 2012) by integrating the Trans-
Theoretical Model. In addition to the Trans-Theoretical Model, Lippke et al. (2012)
found evidence of a transfer effect in which the knowledge and confidence acquired in
changing one behaviour was used to influence and assist in the adoption and maintenance
of additional health behaviours. Not one of the nine cross-sectional studies had employed
continuous behavioural variables. It is important that each of the retrieved articles for
this systematic review fulfill the abovementioned guidelines. If these criteria were not
satisfied, the internal and external validity could be susceptible to bias. Furthermore,
non-compliance with such guidelines may direct future research and contribute to the
knowledge pertaining to multiple behavioural change research.
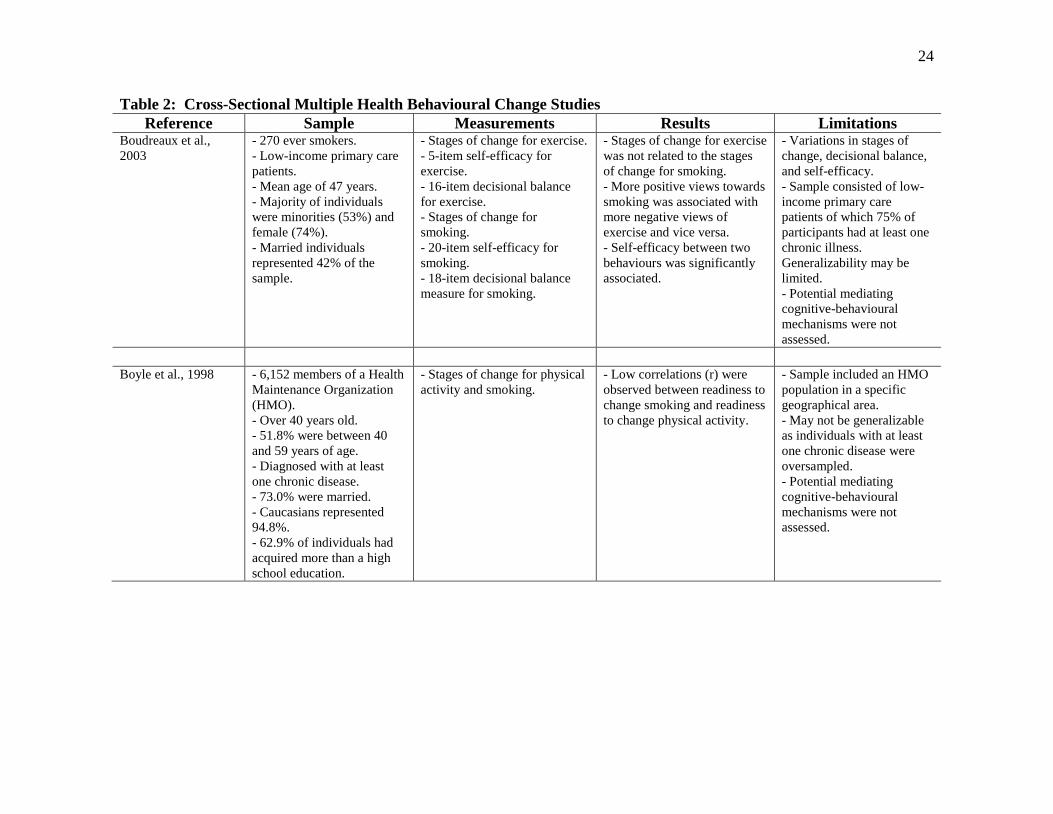
24
Table 2: Cross-Sectional Multiple Health Behavioural Change Studies
Reference Sample Measurements Results Limitations Boudreaux et al.,
2003
- 270 ever smokers.
- Low-income primary care
patients.
- Mean age of 47 years.
- Majority of individuals
were minorities (53%) and
female (74%).
- Married individuals
represented 42% of the
sample.
- Stages of change for exercise.
- 5-item self-efficacy for
exercise.
- 16-item decisional balance
for exercise.
- Stages of change for
smoking.
- 20-item self-efficacy for
smoking.
- 18-item decisional balance
measure for smoking.
- Stages of change for exercise
was not related to the stages
of change for smoking.
- More positive views towards
smoking was associated with
more negative views of
exercise and vice versa.
- Self-efficacy between two
behaviours was significantly
associated.
- Variations in stages of
change, decisional balance,
and self-efficacy.
- Sample consisted of low-
income primary care
patients of which 75% of
participants had at least one
chronic illness.
Generalizability may be
limited.
- Potential mediating
cognitive-behavioural
mechanisms were not
assessed.
Boyle et al., 1998 - 6,152 members of a Health
Maintenance Organization
(HMO).
- Over 40 years old.
- 51.8% were between 40
and 59 years of age.
- Diagnosed with at least
one chronic disease.
- 73.0% were married.
- Caucasians represented
94.8%.
- 62.9% of individuals had
acquired more than a high
school education.
- Stages of change for physical
activity and smoking.
- Low correlations (r) were
observed between readiness to
change smoking and readiness
to change physical activity.
- Sample included an HMO
population in a specific
geographical area.
- May not be generalizable
as individuals with at least
one chronic disease were
oversampled.
- Potential mediating
cognitive-behavioural
mechanisms were not
assessed.
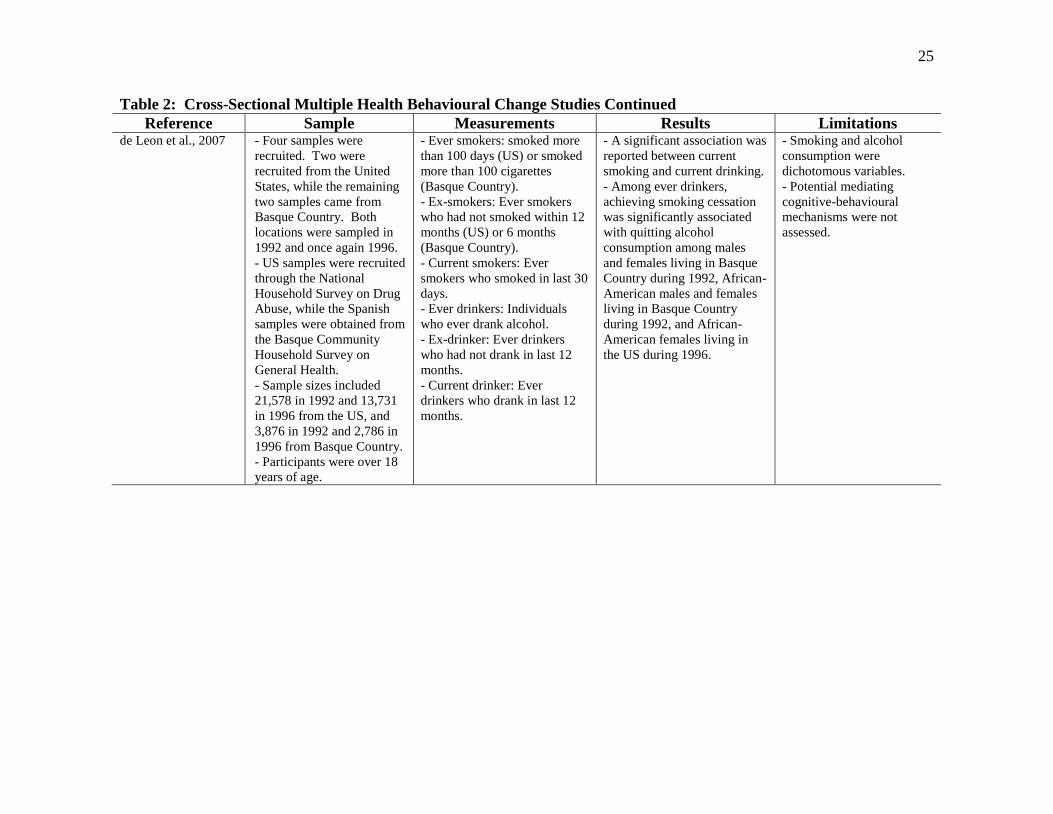
25
Table 2: Cross-Sectional Multiple Health Behavioural Change Studies Continued
Reference Sample Measurements Results Limitations de Leon et al., 2007 - Four samples were
recruited. Two were
recruited from the United
States, while the remaining
two samples came from
Basque Country. Both
locations were sampled in
1992 and once again 1996.
- US samples were recruited
through the National
Household Survey on Drug
Abuse, while the Spanish
samples were obtained from
the Basque Community
Household Survey on
General Health.
- Sample sizes included
21,578 in 1992 and 13,731
in 1996 from the US, and
3,876 in 1992 and 2,786 in
1996 from Basque Country.
- Participants were over 18
years of age.
- Ever smokers: smoked more
than 100 days (US) or smoked
more than 100 cigarettes
(Basque Country).
- Ex-smokers: Ever smokers
who had not smoked within 12
months (US) or 6 months
(Basque Country).
- Current smokers: Ever
smokers who smoked in last 30
days.
- Ever drinkers: Individuals
who ever drank alcohol.
- Ex-drinker: Ever drinkers
who had not drank in last 12
months.
- Current drinker: Ever
drinkers who drank in last 12
months.
- A significant association was
reported between current
smoking and current drinking.
- Among ever drinkers,
achieving smoking cessation
was significantly associated
with quitting alcohol
consumption among males
and females living in Basque
Country during 1992, African-
American males and females
living in Basque Country
during 1992, and African-
American females living in
the US during 1996.
- Smoking and alcohol
consumption were
dichotomous variables.
- Potential mediating
cognitive-behavioural
mechanisms were not
assessed.
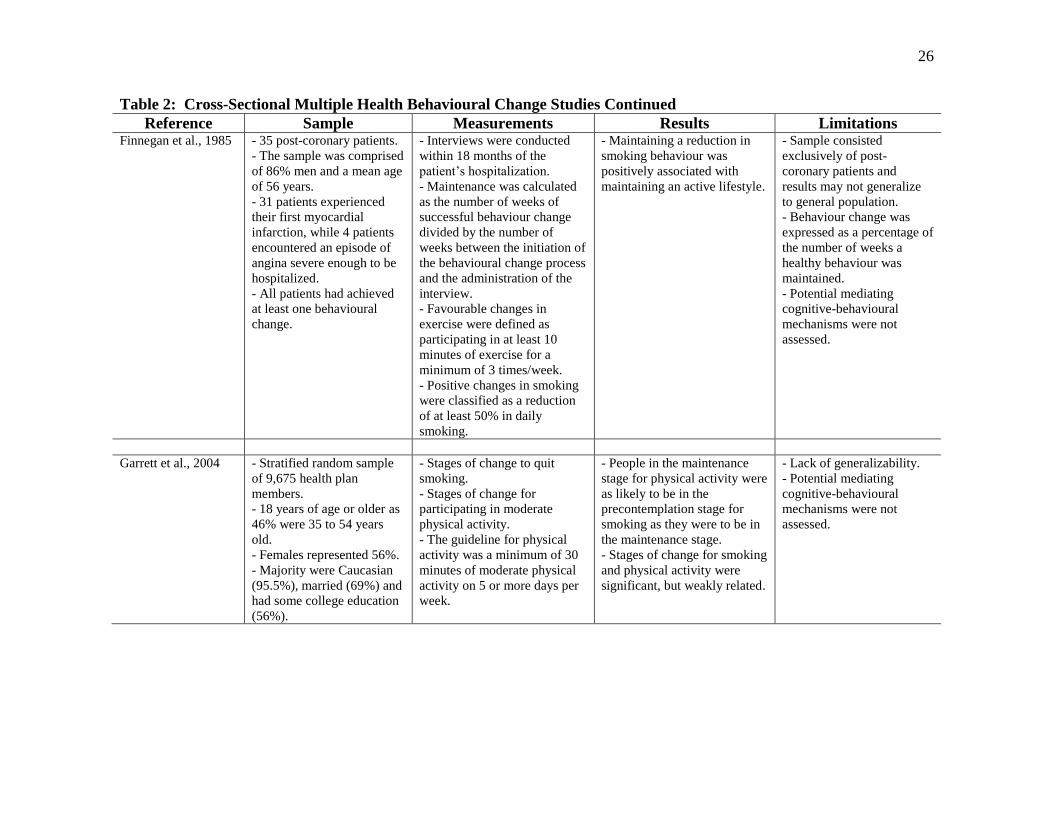
26
Table 2: Cross-Sectional Multiple Health Behavioural Change Studies Continued
Reference Sample Measurements Results Limitations Finnegan et al., 1985 - 35 post-coronary patients.
- The sample was comprised
of 86% men and a mean age
of 56 years.
- 31 patients experienced
their first myocardial
infarction, while 4 patients
encountered an episode of
angina severe enough to be
hospitalized.
- All patients had achieved
at least one behavioural
change.
- Interviews were conducted
within 18 months of the
patient’s hospitalization.
- Maintenance was calculated
as the number of weeks of
successful behaviour change
divided by the number of
weeks between the initiation of
the behavioural change process
and the administration of the
interview.
- Favourable changes in
exercise were defined as
participating in at least 10
minutes of exercise for a
minimum of 3 times/week.
- Positive changes in smoking
were classified as a reduction
of at least 50% in daily
smoking.
- Maintaining a reduction in
smoking behaviour was
positively associated with
maintaining an active lifestyle.
- Sample consisted
exclusively of post-
coronary patients and
results may not generalize
to general population.
- Behaviour change was
expressed as a percentage of
the number of weeks a
healthy behaviour was
maintained.
- Potential mediating
cognitive-behavioural
mechanisms were not
assessed.
Garrett et al., 2004 - Stratified random sample
of 9,675 health plan
members.
- 18 years of age or older as
46% were 35 to 54 years
old.
- Females represented 56%.
- Majority were Caucasian
(95.5%), married (69%) and
had some college education
(56%).
- Stages of change to quit
smoking.
- Stages of change for
participating in moderate
physical activity.
- The guideline for physical
activity was a minimum of 30
minutes of moderate physical
activity on 5 or more days per
week.
- People in the maintenance
stage for physical activity were
as likely to be in the
precontemplation stage for
smoking as they were to be in
the maintenance stage.
- Stages of change for smoking
and physical activity were
significant, but weakly related.
- Lack of generalizability.
- Potential mediating
cognitive-behavioural
mechanisms were not
assessed.

27
Table 2: Cross-Sectional Multiple Health Behavioural Change Studies Continued
Reference Sample Measurements Results Limitations Keller et al., 2008 - A convenience sample of
1262 university students.
- Students were recruited
from various departments
including Law (25%),
Education (32%), and
Medicine (43%).
- Females represented 59%
of the sample.
- Mean age of the sample
was 21 years old.
- Stages of change for vigorous
exercise, smoking cessation,
and binge drinking.
- Vigorous exercise –
exercising for a minimum of
three times per week for at
least 20 minutes.
- Smoking – ever smoked
cigarettes and number of
cigarettes smoked per day.
- Binge drinking – four and
five alcoholic drinks for
females and males,
respectively.
- Significant correlations
included exercise and smoking
(r = -0.09), and binge drinking
and smoking (r = 0.35).
- Correlation between exercise
and binge drinking (r = 0.05)
was not significant.
- Sample consisted of
university students which
limits generalizability.
- Validity of staging
algorithms. May have
produced stage
misclassification.
- Use of vigorous exercise
underestimates additional
intensities of exercise.
- Potential mediating
cognitive-behavioural
mechanisms were not
assessed.
King et al., 1996 - 332 male and female
smokers employed at two
workplaces.
- Males comprised 62% of
the sample.
- Average age was 40 years
old.
- Caucasians made up
93.4% of the sample.
- Stages of change for exercise
and smoking.
- Regular exercise was defined
as three times or more per
week for 15 min or longer.
- 5-item self-efficacy for
exercise.
- 6-item decisional balance
measure for exercise.
- Smoking abstinence self-
efficacy scale.
- 11-item decisional balance
scale for smoking.
- Negative consequences of
smoking was associated with
positive benefits of physical
activity.
- Benefits of smoking was
associated with the cons of
physical activity.
- Self-efficacy for refraining
from smoking was associated
with self-efficacy for
exercising.
- Smokers preparing to quit
smoking demonstrated less
confidence to exercise than
smokers taking action to
change their smoking habits.
- Stages of change between
health behaviours were not
associated.
- Only smokers were
enrolled limiting
generalizability.
- Different criteria to define
the action stage for quitting
smoking (cutting down on
cigarettes or participating in
a cessation program).
- Potential mediating
cognitive-behavioural
mechanisms were not
assessed.

28
Table 2: Cross-Sectional Multiple Health Behavioural Change Studies Continued
Reference Sample Measurements Results Limitations Lippke et al., 2012 Study 1:
- Sample of 3,519 Hawaiian
participants.
- 60% were women
- 18 to 91 years of age.
- Average age of 46 years.
- 33% of participants had a
high school degree or less.
Study 2:
- 965 German speaking
participants.
- 66% were women.
- Age range was 15 to 81
with an average age of 39
years.
- 64% of the sample had
post-secondary education.
Study 3:
- 310 diabetics.
- 59% women.
- Ages ranged from 18 to 75
years.
- Average age was 44 years.
- 75% of sample had post-
secondary education.
- Stages of change for physical
activity, non-smoking, healthy
drinking, and reduced alcohol
consumption.
Study 1:
- Significant correlation
between physical activity and
non-smoking (r = 0.08).
Study 2:
- Correlation between physical
activity and healthy drinking
(r = 0.16) was significant.
- Non-significant correlations
were found between physical
activity and non-smoking (r
=0.01) and healthy drinking
and non-smoking (r = -0.01)
Study 3:
- The correlation between
physical activity and non-
smoking (r = 0.21) was
significant.
- Non-significant correlations
were observed between
physical activity and reduced
alcohol consumption (r =
0.06) as well as reduced
alcohol consumption and non-
smoking (r = 0.07).
- Overall, there was evidence
of a potential transfer effect
among health behaviours of
the same discipline.
- Potential mediating
cognitive-behavioural
mechanisms were not
assessed.
- In study 3, the sample
consisted of diabetics
limiting generalizability.

29
Table 2: Cross-Sectional Multiple Health Behavioural Change Studies Continued
Reference Sample Measurements Results Limitations Pirie et al., 2000 - 7,489 pregnant women
from an HMO in two major
cities.
- Over 18 years old with an
average age of 29.6 years.
- 49% were college
graduates.
- Predominantly Caucasian.
- Majority were married or
cohabiting (94%).
- 62% had full time
employment.
- Alcohol consumption - # of
drinks consumed currently and
before pregnancy.
- Alcohol quitters – consumed
alcohol prior to pregnancy, but
no consumption while
pregnant.
- Cigarette smoking assessed
cigarette smoking in the past
seven days (i.e. # of cigarettes
per day and # cigarettes per
day before pregnancy).
- Cigarette quitters were
individuals who made the
transition from previously
smoking prior to pregnancy to
non-smoking in the past week
during pregnancy.
- No association was observed
between alcohol and cigarette
smoking.
- Questions pertaining to
alcohol use were imprecise
(i.e. questions related to
patterns of drinking or binge
drinking would be
preferred).
- Results are not
generalizable to the general
population as pregnant
women were evaluated.
- Smoking behaviour and
alcohol use were
dichotomized.
- Potential mediating
cognitive-behavioural
mechanisms were not
assessed.

30
Table 3: Critique of Cross-Sectional Studies Retrieved for a Systematic Review
Reference Sample Size Generalizability Cognitive-Behavioural
Mediating Mechanisms
Adequate
Measurement of
Health Behaviours
Boudreaux et al., 2003
Boyle et al., 1998
de Leon et al., 2007
Finnegan et al., 1985
Garrett et al., 2004
Keller et al., 2008
King et al., 1996
Lippke et al., 2012*
Pirie et al., 2000 Article fulfills criterion; Article fails to fulfill criterion.
*Studies 1 and 2 fulfilled the criterion for generalizability. Study 3 did not satisfy the criterion for generalizability.

31
2.7.2 Systematic Review of Longitudinal Studies:
Fifteen observational longitudinal studies were retrieved for this systematic review. The
recruited sample, behavioural measurements, reported findings, and the study limitations
for each of these longitudinal studies are summarized in Table 4. Similar to the cross-
sectional studies, these fifteen longitudinal studies were critiqued based upon sample
size, generalizability, the analysis of potential mediating cognitive mechanisms, and the
assessment of health behaviours. Furthermore, longitudinal studies were evaluated based
upon the number of assessment intervals that were incorporated. The critique of
longitudinal studies is summarized in Table 5.
Thirteen of the 15 longitudinal studies identified through this systematic review had
demonstrated adequate sample sizes. Of the two studies that were unable to satisfy this
criterion, Murray et al. (2002) acknowledged that sample size could have been a potential
limitation of their analysis, while Perkins et al. (1993) had employed only a small sample
of recent ex-smokers (n = 24) which may have compromised the findings of their study.
Three longitudinal studies had recruited samples that were representative of the general
population (Laaksonen, Luoto, Helakorpi, & Uutela, 2002; Murray, Cribbie, Istvan, &
Barnes, 2002; Shaw, Krause, Liang, & McGeever, 2011). The remaining studies had
enrolled exclusively males (T. Gordon & Doyle, 1986), women (McDermott, Dobson, &
Russell, 2004; Saules, et al., 2004), adolescences (Audrain-McGovern, et al., 2003;
Terry-McElrath & O'Malley, 2011), college freshman (Dierker, et al., 2006; Jessor,
Costa, Krueger, & Turbin, 2006), young adults (Breslau, et al., 1996), male twins
(Carmelli, Swan, & Robinette, 1993), Japanese males (Nagaya, Yoshida, Takahashi, &
Kawai, 2007), middle aged women (Perkins, et al., 1993) or daily smokers (Kahler, et al.,
2009).
Each of the 15 longitudinal studies overlooked the assessment of self-efficacy, mastery,
or additional cognitive mediating mechanisms within the interrelationship of health
behaviours. In regards to the assessment of health behaviours, each of the longitudinal
studies neglected to employ the Trans-Theoretical Model or any other established
behavioural change theory to assess health behaviours. While studies could also fulfill
this criterion by integrating continuous health behaviour variables, Murray et al. (2002)

32
and Dierker et al. (2006) were the only studies to incorporate this methodology and
consequently fulfill the criterion for adequate measurement of health behaviours.
Finally, only seven studies had examined the interrelationship of health behaviours across
more than two time periods (Audrain-McGovern, et al., 2003; Dierker, et al., 2006;
Jessor, et al., 2006; Nagaya, et al., 2007; Saules, et al., 2004; Shaw, et al., 2011; Terry-
McElrath & O'Malley, 2011). As the remaining eight studies only assessed health
behaviours across one follow-up period, it is possible that changes among health
behaviours may have occurred during the interim period particularly if the time interval
between baseline and follow-up was of long duration (Emmons, Shadel, et al., 1999).
Furthermore, the use of multiple cycles of data collection often improve the precision of
parameter estimates (Rimm & Stampfer, 2004; D. Rogosa, Brandt, & Zimowski, 1982).

33
Table 4: Longitudinal Multiple Health Behavioural Change Studies
Reference Sample Measurements Results Limitations Audrain-McGovern
et al., 2003
- 978 high school
adolescents attending five
public high schools in
northern Virginia.
- Females represented 52%
of the sample.
- Racial distribution of the
sample included 63%
Caucasian, 12% Hispanic,
11% Asian, 8% African
American, and 6% other.
- 4 waves of data were collected
over a 4 year period; spring of the
9th
grade, fall and spring of the
10th
grade, and spring of the 11th
grade.
- Smoking behaviour was
represented by an ordered-
categorical variable which
included five responses.
- Physical activity was measured
by a continuous variable which
was derived from frequency,
duration, and intensity of physical
activity.
- Baseline physical activity
was not significantly
associated with the rate of
change in smoking.
- Changes in physical
activity demonstrated a 1.44
reduction in the odds of
smoking progression.
- A significant negative
association was observed
between initial smoking
status and changes in
physical activity.
- Initial physical activity
levels were positively
associated with initial
tobacco use.
- Lack of generalizability
for older individuals.
- Smoking behaviour was
categorical.
- Potential mediating
cognitive-behavioural
mechanisms were not
assessed.
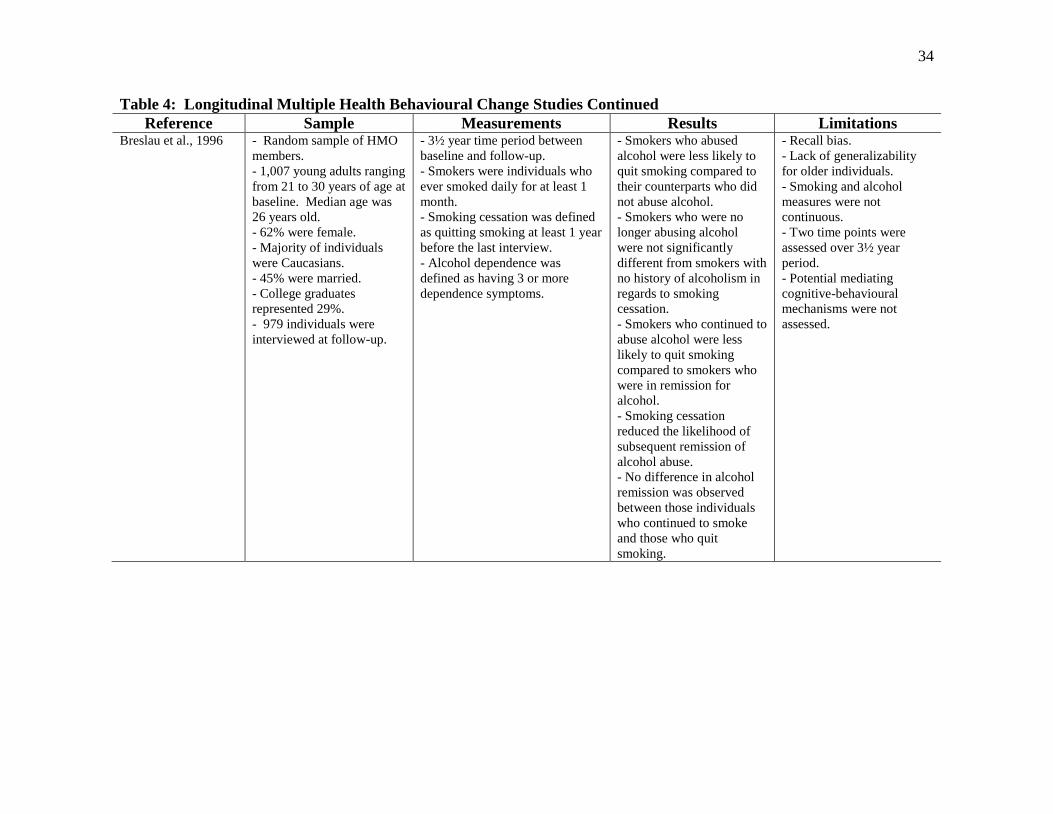
34
Table 4: Longitudinal Multiple Health Behavioural Change Studies Continued
Reference Sample Measurements Results Limitations Breslau et al., 1996 - Random sample of HMO
members.
- 1,007 young adults ranging
from 21 to 30 years of age at
baseline. Median age was
26 years old.
- 62% were female.
- Majority of individuals
were Caucasians.
- 45% were married.
- College graduates
represented 29%.
- 979 individuals were
interviewed at follow-up.
- 3½ year time period between
baseline and follow-up.
- Smokers were individuals who
ever smoked daily for at least 1
month.
- Smoking cessation was defined
as quitting smoking at least 1 year
before the last interview.
- Alcohol dependence was
defined as having 3 or more
dependence symptoms.
- Smokers who abused
alcohol were less likely to
quit smoking compared to
their counterparts who did
not abuse alcohol.
- Smokers who were no
longer abusing alcohol
were not significantly
different from smokers with
no history of alcoholism in
regards to smoking
cessation.
- Smokers who continued to
abuse alcohol were less
likely to quit smoking
compared to smokers who
were in remission for
alcohol.
- Smoking cessation
reduced the likelihood of
subsequent remission of
alcohol abuse.
- No difference in alcohol
remission was observed
between those individuals
who continued to smoke
and those who quit
smoking.
- Recall bias.
- Lack of generalizability
for older individuals.
- Smoking and alcohol
measures were not
continuous.
- Two time points were
assessed over 3½ year
period.
- Potential mediating
cognitive-behavioural
mechanisms were not
assessed.
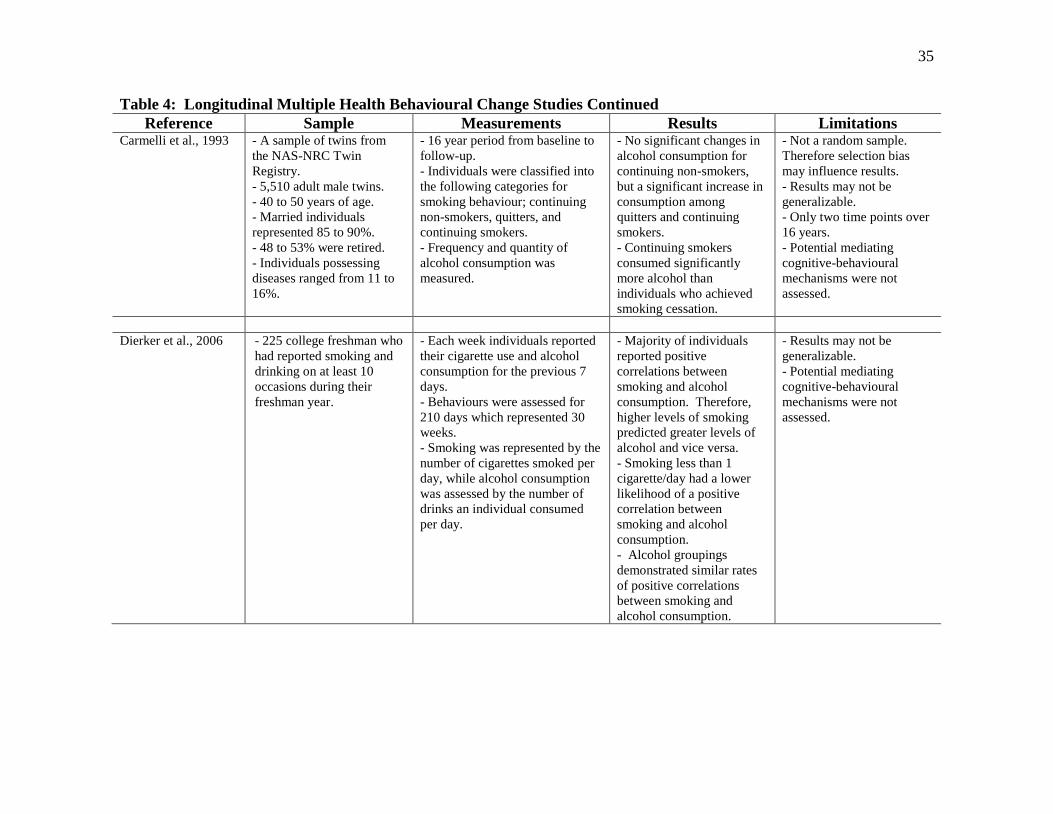
35
Table 4: Longitudinal Multiple Health Behavioural Change Studies Continued
Reference Sample Measurements Results Limitations Carmelli et al., 1993 - A sample of twins from
the NAS-NRC Twin
Registry.
- 5,510 adult male twins.
- 40 to 50 years of age.
- Married individuals
represented 85 to 90%.
- 48 to 53% were retired.
- Individuals possessing
diseases ranged from 11 to
16%.
- 16 year period from baseline to
follow-up.
- Individuals were classified into
the following categories for
smoking behaviour; continuing
non-smokers, quitters, and
continuing smokers.
- Frequency and quantity of
alcohol consumption was
measured.
- No significant changes in
alcohol consumption for
continuing non-smokers,
but a significant increase in
consumption among
quitters and continuing
smokers.
- Continuing smokers
consumed significantly
more alcohol than
individuals who achieved
smoking cessation.
- Not a random sample.
Therefore selection bias
may influence results.
- Results may not be
generalizable.
- Only two time points over
16 years.
- Potential mediating
cognitive-behavioural
mechanisms were not
assessed.
Dierker et al., 2006 - 225 college freshman who
had reported smoking and
drinking on at least 10
occasions during their
freshman year.
- Each week individuals reported
their cigarette use and alcohol
consumption for the previous 7
days.
- Behaviours were assessed for
210 days which represented 30
weeks.
- Smoking was represented by the
number of cigarettes smoked per
day, while alcohol consumption
was assessed by the number of
drinks an individual consumed
per day.
- Majority of individuals
reported positive
correlations between
smoking and alcohol
consumption. Therefore,
higher levels of smoking
predicted greater levels of
alcohol and vice versa.
- Smoking less than 1
cigarette/day had a lower
likelihood of a positive
correlation between
smoking and alcohol
consumption.
- Alcohol groupings
demonstrated similar rates
of positive correlations
between smoking and
alcohol consumption.
- Results may not be
generalizable.
- Potential mediating
cognitive-behavioural
mechanisms were not
assessed.

36
Table 4: Longitudinal Multiple Health Behavioural Change Studies Continued
Reference Sample Measurements Results Limitations Gordon et al., 1986 - 1768 male civil service
employees from New York
State.
- Males were 38 to 55 years
of age.
- Two measurement periods 18
years apart.
- Alcohol consumption was
determined during a 30 day
month.
- Alcohol consumption was
represented by a continuous and
categorical variable.
- Non-significant
correlation indicated that
changes in alcohol
consumption were not
associated with changes in
smoking behaviour.
- Only two time points over
a 18 year period.
- Sample consisted
exclusively of males and
results may not generalize
to females.
- Alcohol consumption
appeared to be a categorical
variable.
- Potential mediating
cognitive-behavioural
mechanisms were not
assessed.
Jessor et al., 2006 - Sample included 858
college freshman who had
ever consumed alcohol
during one of the three
assessment periods.
- At baseline, participants
were predominantly male
(56%) and White (87%).
- Three assessment periods over a
2 year span; fall 2002, spring
2003, and spring 2004.
- Heavy episodic drinking was
defined as the number of times an
individual drank 5 or more drinks
on any occasion. Responses were
indicated on a 7-point scale.
- Smoking was measured as the
number of cigarettes smoked on
an average day. Responses were
presented on a 9-point scale.
- Changes in smoking
behaviour were not
associated with changes in
heavy episodic drinking of
alcohol.
- Not a random sample.
Therefore selection bias
may influence results.
- Sample consisted of
college freshman and
results may not generalize
to the general population.
- Alcohol consumption and
smoking were categorical
variables.
- Potential mediating
cognitive-behavioural
mechanisms were not
assessed.

37
Table 4: Longitudinal Multiple Health Behavioural Change Studies Continued
Reference Sample Measurements Results Limitations Kahler et al., 2009 - 3,614 smokers from the
International Tobacco
Control Four Country (ITC-
4) survey.
- Smokers were recruited
from Australia, Canada, the
UK, and the US.
- Smokers were 18 years of
age or older.
- Females represented
46.8% of the sample.
- Average age was 41.9
years.
- Nearly 96% of the sample
were daily smokers.
- Waves 4 and 6 were analyzed
from the ITC-4.
- Alcohol use was measured by
drinking frequency, number of
drinks consumed, and frequency
of heavy drinking over the past
12 months.
- Drinking and heavy drinking
frequency were categorized.
- Weekly alcohol consumption
was derived from the product of
drinking frequency and number
of drinks consumed.
- Weekly alcohol consumption
was categorized.
- Categories were created to
represent changes in alcohol
consumption (drinking increased,
unchanged, or decreased).
- Smoking outcomes included
attempting cessation and
achieving a sustained cessation
attempt.
- Smoking status at the final
assessment was classified into
categories; no cessation attempts,
made a cessation attempt but
continued to smoke at wave 6,
and quit smoking for a minimum
of 6 months at wave 6.
- Consuming heavy
amounts of alcohol more
than once a week was
associated with lower odds
of attempting cessation as
well as achieving smoking
cessation for a minimum of
6 months at wave 6.
- Smoking status was not
associated with drinking
status at the final follow-up.
- Smoking cessation did not
predict changes in alcohol
consumption.
- Only two time points over
2 year period.
- Sample consisted
exclusively of daily
smokers and results may not
be generalizable.
- Alcohol consumption and
smoking variables appeared
to be categorical variables.
- Potential mediating
cognitive-behavioural
mechanisms were not
assessed.
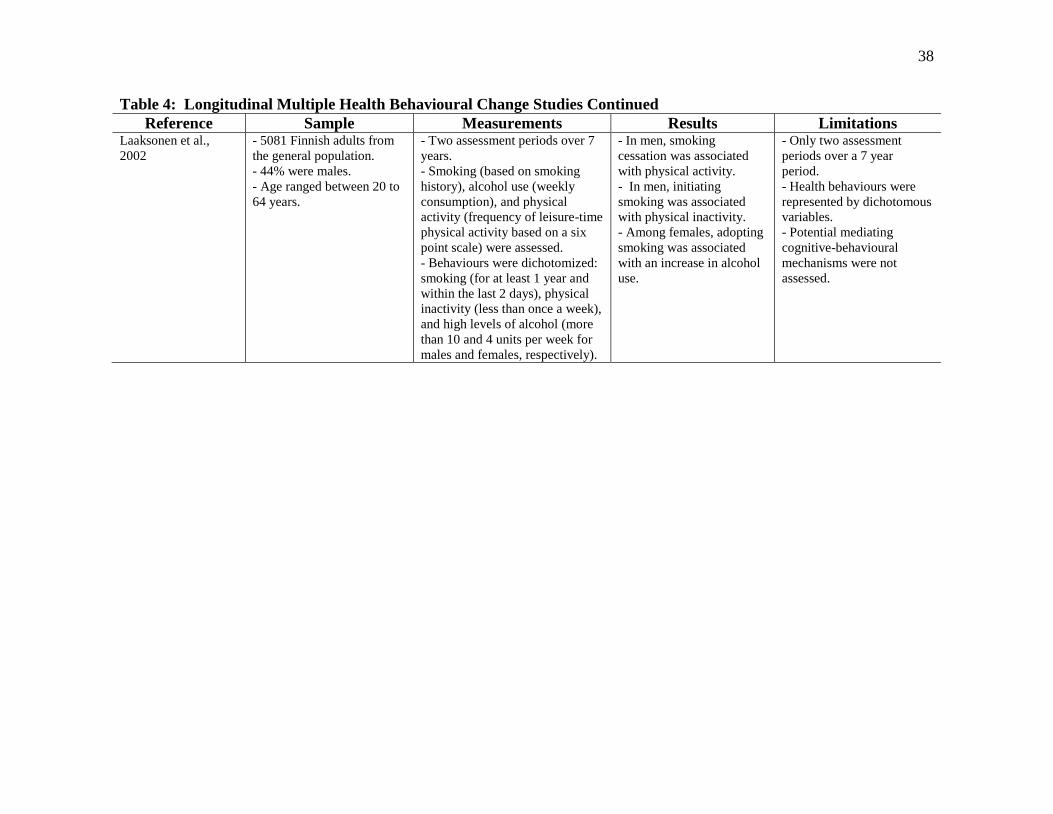
38
Table 4: Longitudinal Multiple Health Behavioural Change Studies Continued
Reference Sample Measurements Results Limitations Laaksonen et al.,
2002
- 5081 Finnish adults from
the general population.
- 44% were males.
- Age ranged between 20 to
64 years.
- Two assessment periods over 7
years.
- Smoking (based on smoking
history), alcohol use (weekly
consumption), and physical
activity (frequency of leisure-time
physical activity based on a six
point scale) were assessed.
- Behaviours were dichotomized:
smoking (for at least 1 year and
within the last 2 days), physical
inactivity (less than once a week),
and high levels of alcohol (more
than 10 and 4 units per week for
males and females, respectively).
- In men, smoking
cessation was associated
with physical activity.
- In men, initiating
smoking was associated
with physical inactivity.
- Among females, adopting
smoking was associated
with an increase in alcohol
use.
- Only two assessment
periods over a 7 year
period.
- Health behaviours were
represented by dichotomous
variables.
- Potential mediating
cognitive-behavioural
mechanisms were not
assessed.

39
Table 4: Longitudinal Multiple Health Behavioural Change Studies Continued
Reference Sample Measurements Results Limitations McDermott et al.,
2004
- A sample of women from
the Australian Longitudinal
Study on Women’s Health.
- Three cohorts of Australian
women were examined; 18-
23 years of age, 45-50 years
of age, and 70-75 years of
age.
- Sample consisted of 9,151
women.
- Adopters of smoking
represented 3% of the
sample, whereas 6% and 4%
of women were quitters and
re-starters, respectively.
- Women were assessed in 1996
and 2000.
- Adoption of smoking included
individuals who had never
smoked in 1996 but started
smoking by 2000.
- Quitters were individuals who
were smoking in 1996, but
achieved smoking cessation by
2000.
- Re-starters were individuals
who were ex-smokers in 1996
and re-started smoking in 2000.
-Various categories were
employed to classify binge
drinking; no change, reduction,
and increase.
- Those women whose
binge drinking increased
reported the greatest
likelihood of adopting
smoking.
- An increase in binge
drinking was also
associated with a reduction
in the likelihood of
smoking cessation.
- Sample consisted
exclusively of women and
results may not generalize.
- Health behaviours were
represented by binary
variables.
- Only two assessment
periods over a 4 year
period.
- Potential mediating
cognitive-behavioural
mechanisms were not
assessed.

40
Table 4: Longitudinal Multiple Health Behavioural Change Studies Continued
Reference Sample Measurements Results Limitations Murray et al., 2002 - 344 adults from the general
population participating in
the Winnipeg Health and
Drinking Survey.
- Individuals reported
smoking and drinking at one
of the two waves.
- Mean age of males and
females was 38.9 and 37.9
years, respectively.
- Unemployment among
males and females was
10.1% and 8.4%,
respectively.
- The majority of individuals
reported family incomes of
at least $35,000.
- 66.3% of males were
married, while 59.6% of
females were married.
- Women had 12.4 years of
education, whereas men had
12.6 years.
- Two measurement periods 2
years apart.
- Smoking behaviour was
measured as the number of
cigarettes smoked per day.
- Drinking behaviour was
assessed as number of drinks per
day and number of times an
individual was drunk.
- Changes in alcohol
consumption were not
significantly related to
changes in smoking and
thus independent of one
another.
- Only two assessment
periods over a 2 year
period.
- Only individuals who
smoked and drank were
included in the analysis.
- A larger sample size may
have provided more
confidence in the results.
- Potential mediating
cognitive-behavioural
mechanisms were not
assessed.
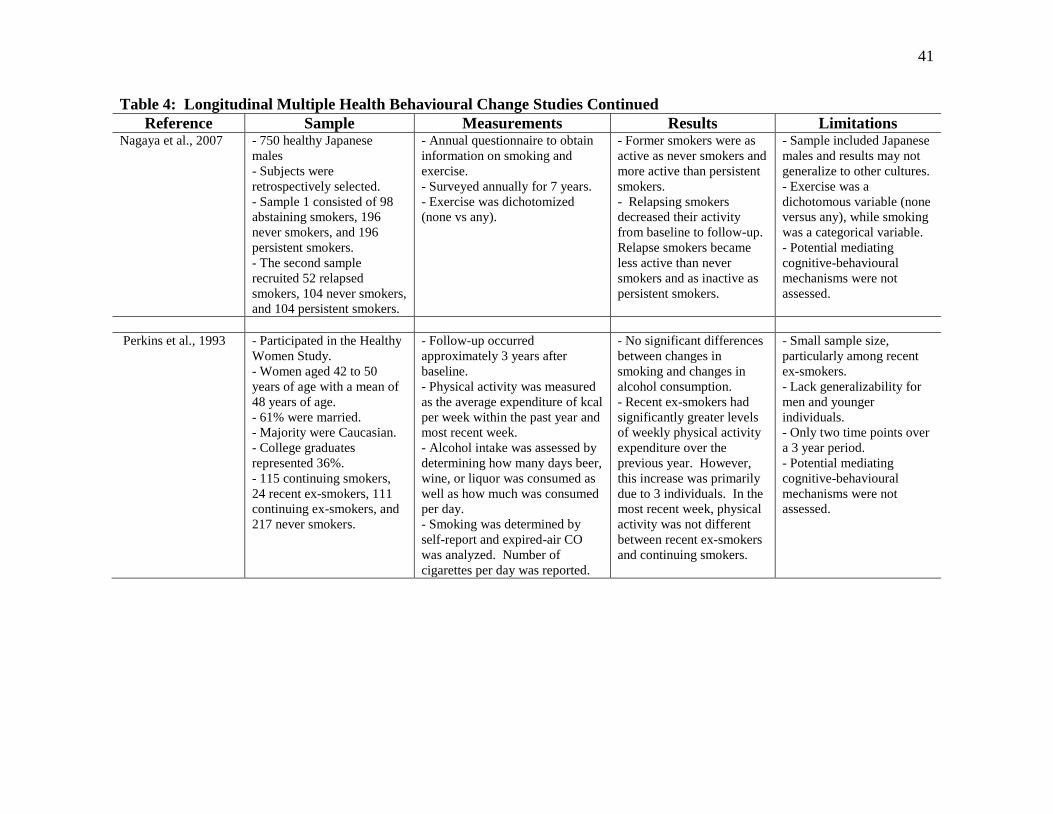
41
Table 4: Longitudinal Multiple Health Behavioural Change Studies Continued
Reference Sample Measurements Results Limitations Nagaya et al., 2007 - 750 healthy Japanese
males
- Subjects were
retrospectively selected.
- Sample 1 consisted of 98
abstaining smokers, 196
never smokers, and 196
persistent smokers.
- The second sample
recruited 52 relapsed
smokers, 104 never smokers,
and 104 persistent smokers.
- Annual questionnaire to obtain
information on smoking and
exercise.
- Surveyed annually for 7 years.
- Exercise was dichotomized
(none vs any).
- Former smokers were as
active as never smokers and
more active than persistent
smokers.
- Relapsing smokers
decreased their activity
from baseline to follow-up.
Relapse smokers became
less active than never
smokers and as inactive as
persistent smokers.
- Sample included Japanese
males and results may not
generalize to other cultures.
- Exercise was a
dichotomous variable (none
versus any), while smoking
was a categorical variable.
- Potential mediating
cognitive-behavioural
mechanisms were not
assessed.
Perkins et al., 1993 - Participated in the Healthy
Women Study.
- Women aged 42 to 50
years of age with a mean of
48 years of age.
- 61% were married.
- Majority were Caucasian.
- College graduates
represented 36%.
- 115 continuing smokers,
24 recent ex-smokers, 111
continuing ex-smokers, and
217 never smokers.
- Follow-up occurred
approximately 3 years after
baseline.
- Physical activity was measured
as the average expenditure of kcal
per week within the past year and
most recent week.
- Alcohol intake was assessed by
determining how many days beer,
wine, or liquor was consumed as
well as how much was consumed
per day.
- Smoking was determined by
self-report and expired-air CO
was analyzed. Number of
cigarettes per day was reported.
- No significant differences
between changes in
smoking and changes in
alcohol consumption.
- Recent ex-smokers had
significantly greater levels
of weekly physical activity
expenditure over the
previous year. However,
this increase was primarily
due to 3 individuals. In the
most recent week, physical
activity was not different
between recent ex-smokers
and continuing smokers.
- Small sample size,
particularly among recent
ex-smokers.
- Lack generalizability for
men and younger
individuals.
- Only two time points over
a 3 year period.
- Potential mediating
cognitive-behavioural
mechanisms were not
assessed.

42
Table 4: Longitudinal Multiple Health Behavioural Change Studies Continued
Reference Sample Measurements Results Limitations Saules et al., 2004 - Sample included 490
female precollege freshman
at the University of
Michigan.
- Never smokers represented
374 individuals in the
sample, while 52 and 64
women were categorized as
early-onset smokers and
late-onset smokers,
respectively.
- Surveyed on three occasions;
1991, nine months later in 1992,
and 1995.
- Binge drinking referred to
consecutively consuming at least
5 alcoholic beverages.
- Never smokers were females
who smoked less than twice in
one’s lifetime at all three time
points.
- Early-onset smokers were
women who smoked in both 1991
and 1995.
- Those classified as late-onset
smokers were individuals who
were never smokers in 1991 and
became a smoker in 1995.
-Binge drinking was highest
among those females who
were early-onset smokers.
- Late-onset smokers
demonstrated the greatest
increase in binge drinking
between 1992 and 1995.
By 1995, the rate of binge
drinking among late-onset
smokers resembled that of
early-onset smokers.
- Both early-onset and late-
onset smokers reported a
greater frequency of binge
drinking than never
smokers.
- Categorical responses
were collected for smoking
and binge drinking.
- Results may not be
generalizable as sample
consisted exclusively of
women.
- Potential mediating
cognitive-behavioural
mechanisms were not
assessed.

43
Table 4: Longitudinal Multiple Health Behavioural Change Studies Continued
Reference Sample Measurements Results Limitations Shaw et al., 2011 - The Americans’ Changing
Lives Survey was used for
data analysis.
- The sample included 3,617
adults.
- This analysis recruited
adults aged 24 and older at
baseline.
- 47% of the sample was
male and the average age
was 47 years.
- Whites represented 79% of
the sample.
- Individuals had an average
of 12 years of education.
- At baseline, abstainers of
alcohol represented 41% of
the sample, while 50% and
9% of the sample were
moderate and heavy
drinkers, respectively.
- There were 4 assessment
periods; 1986, 1989, 1994, and
2001-2002.
- Alcohol consumption was the
outcome variable.
- Individuals were categorized on
the basis of monthly alcohol
consumption.
- Heavy drinking was defined as a
minimum of 60 and 30 drinks per
month for males and females,
respectively.
- Moderate drinkers were
individuals who drank alcohol,
but did not fulfill the guidelines
for heavy drinking.
- Alcohol abstinence was defined
as not consuming alcohol for a
particular assessment period.
- Smoking status was
dichotomized as current smokers
and non-smokers.
- Leisure-time physical activity
was represented by a 4-point
scale.
- Non-smoking was
significantly associated
with a greater likelihood of
abstinence from alcohol.
- An inactive lifestyle was
associated with a higher
probability of alcohol
abstinence.
- Categorical and
dichotomized responses
were collected for alcohol
consumption and smoking,
respectively.
- Potential mediating
cognitive-behavioural
mechanisms were not
assessed.

44
Table 4: Longitudinal Multiple Health Behavioural Change Studies Continued
Reference Sample Measurements Results Limitations Terry-McElrath et al.,
2011
- Data from the Monitoring
the Future Study (MTF)
which consists of high
school seniors.
- 11,741 seniors were
included in the analysis.
- 48% of the sample was
male, while Whites
represented 72% of high
school seniors.
- Class cohorts of high school
seniors were initially assessed
from 1986 to 2001.
- Individuals participated in a
total of 5 measurement periods
occurring at the following ages;
18, 19/20, 21/22, 23/24, and
25/26.
- Frequency of both alcohol
consumption and smoking were
measured on a 7-point scale.
- Participation in sports, athletics,
or exercising (PSAE) was
assessed on a 5-point scale.
- Both average alcohol
consumption and cigarette
use increased until 21/22
years of age and then
decreased.
- PSAE demonstrated a
decreasing trajectory
throughout the course of the
study.
- Negative correlations
were reported between the
intercept and slope for
PSAE, alcohol
consumption, and smoking.
- At 18 years of age, higher
PSAE was correlated with
higher alcohol
consumption.
- At age 18, higher PSAE
was associated with lower
tobacco use.
- From 18 to 22 years of
age, changes in PSAE and
changes in alcohol were
unrelated. However, from
the age of 21/22 to 25/26, a
positive correlation was
reported.
- An increase in PSAE was
associated with a decrease
in tobacco use.
- Results may not be
generalizable as the sample
consisted of high school
seniors.
- Health behaviour variables
were categorical.
- Potential mediating
cognitive-behavioural
mechanisms were not
assessed.

45
Table 5: Critique of Longitudinal Studies Retrieved for a Systematic Review
Reference Sample Size Generalizability Cognitive-Behavioural
Mediating Mechanisms
Adequate
Measurement of
Health Behaviours
Multiple
Assessment
Intervals
Audrain-McGovern et al., 2003
Breslau et al., 1996
Carmelli et al., 1993
Dierker et al., 2006
Gordon et al., 1986
Jessor et al., 2006
Kahler et al., 2009
Laaksonen et al., 2002
McDermott et al., 2004
Murray et al., 2002
Nagaya et al., 2007
Perkins et al., 1993
Saules et al., 2004
Shaw et al., 2011
Terry-McElrath et al., 2011 Article fulfills criterion; Article fails to fulfill criterion.
46
Although experimental and quasi-experimental studies were excluded from this
systematic review, they constitute the majority of research pertaining to multiple health
behavioural change. Therefore their contribution to this discipline of research should be
acknowledged. However, the focus of this systematic review and statistical analysis
pertains to observational data. Consequently, reference to experimental and quasi-
experimental findings throughout subsequent sections of this dissertation will be kept to a
minimum. In the following sub-sections, co-variation between health behaviours is
discussed. This discussion is predominantly based upon the findings of previous
empirical studies that were retrieved for the systematic review.
2.7.3 Alcohol Consumption and Leisure-Time Physical Activity Energy
Expenditure:
Evidence pertaining to the interrelationship between alcohol consumption and physical
activity is sparse. This is unfortunate as excessive consumption is often associated with
inactivity (Rosal, et al., 2000; Terry-McElrath & O'Malley, 2011). The association
between alcohol consumption and physical activity has typically been evaluated by
longitudinal study designs. The only exception, a cross-sectional study, found no
significant association in motivational readiness between these two behaviours (Keller, et
al., 2008).
To this point, the findings of longitudinal studies have been inconsistent. Although
Laaksonen et al. (2002) was unable to observe concurrent behavioural changes between
alcohol consumption and physical activity, evidence of co-variation has been reported by
others (Shaw, et al., 2011; Terry-McElrath & O'Malley, 2011). Over an 8 year period,
alcohol consumption and participation in sports, athletics or exercising (PSAE) were
assessed as categorical variables; alcohol consumption (1 = no occasions, 2 = one to two,
3 = three to five, 4 = six to nine, 5 = ten to nineteen, 6 = twenty to thirty-nine, 7 = forty or
more occasions) and PSAE (1 = never, 2 = a few times a year, 3 = once or twice a month,
4 = at least once a week, 5 = almost every day) (Terry-McElrath & O'Malley, 2011).
From the ages of 18 to 21/22, changes in alcohol consumption were not significantly
related to changes in PSAE (Terry-McElrath & O'Malley, 2011). However, from the
ages of 21/22 to 25/26, a positive correlation was reported between behavioural changes

47
such that decreases in alcohol consumption were associated with decreases in PSAE
(Terry-McElrath & O'Malley, 2011). These findings suggest that co-variation between
alcohol consumption and leisure-time physical activity could be influenced by age.
Co-variation may not only be influenced by age, but by quantity of alcohol consumption.
In a sample of 3,617 adults, alcohol abstinence was significantly associated with an
inactive lifestyle (Shaw, et al., 2011). However, heavy drinking demonstrated no
relationship with leisure-time physical activity (Shaw, et al., 2011).
If the effectiveness of rehabilitation programs is enhanced through the incorporation of
physical activity programs, health professionals could initially concentrate their time and
resources on changing physical activity levels before attempting to achieve abstinence
from alcohol. Short-term physical activity interventions that are used in conjunction with
alcohol treatment programs can enhance physical activity participation and fitness levels
among alcoholics, reduce urges associated with alcohol use, and improve rates of alcohol
abstinence (Gary & Guthrie, 1972; Sinyor, Brown, Rostant, & Seraganian, 1982; Ussher,
Sampuran, Doshi, West, & Drummond, 2004). As individuals with alcoholism
demonstrate an interest in participating in physical activity, alcohol treatment programs
may provide a teachable moment; “naturally occurring life transitions or health events
thought to motivate individuals to spontaneously adopt risk-reducing health behaviours”
(McBride, et al., 2003, pg. 156).
2.7.4 Leisure-Time Physical Activity Energy Expenditure and Smoking:
Smokers who engage in multiple unhealthy behaviours often report heavier smoking,
higher levels of nicotine dependence, as well as lower levels of self-efficacy for
refraining from smoking (Butterfield, et al., 2004; Sherwood, et al., 2000). In fact, for
every additional lifestyle risk factor that a smoker exhibits, the likelihood of nicotine
dependence increases by 23% (Butterfield, et al., 2004). Since the engagement of
additional healthy behaviours is associated with smoking fewer cigarettes per day, lower
nicotine dependence, as well as higher levels of motivational readiness to quit smoking,
health professionals may have more success in changing smoking behaviour through the
adoption and maintenance of other health behaviours such as physical activity
(Butterfield, et al., 2004).
48
One of the more commonly evaluated pairwise combinations of unhealthy behaviours
involves physical inactivity and smoking. It is no surprise that these two risk factors co-
exist as smokers are typically more sedentary (Rosal, et al., 2001) and less physically
active compared to their non-smoking counterparts (Conway & Cronan, 1992; Perkins, et
al., 1993). However, in recent years, evidence has suggested that not all smokers share
this commonality as a modest to moderate proportion of smokers, 16 to 30%, participate
in regular physical activity (W. K. deRuiter, et al., 2008; T. K. King, et al., 1996; Ward,
et al., 2003). Furthermore, changes in physical fitness have been observed among
smokers suggesting that smoking does not hinder or obstruct individuals from becoming
more physically active (Cooper, Resor, Stoever, & Dubbert, 2007). The fact that smokers
demonstrate the capability to participate in physical activity and that smoking does not
limit an individual’s ability to improve their physical fitness suggests that health
professionals could include physical activity in the implementation of multiple
behavioural change interventions (Cooper, et al., 2007). The recognition that smokers
may express an interest in participating in regular physical activity before attempting to
change their smoking behaviour may provide further support for the inclusion of physical
activity as an adjunct in smoking cessation programs (Garrett, et al., 2004).
The association between physical activity and smoking cessation is complex as well as
controversial. Some have suggested that behavioural changes between physical activity
and smoking cessation are associated with each other (Finnegan & Suler, 1985; Keller, et
al., 2008; T. K. King, et al., 1996; Laaksonen, et al., 2002; Terry-McElrath & O'Malley,
2011), while others have demonstrated that these two lifestyle behaviours are
independent behaviours (Boudreaux, et al., 2003). Furthermore, while Audrain-
McGovern et al. (2003) have suggested that physical activity inhibits smoking
progression, others have suggested that smoking cessation could act as a potential
gateway behaviour towards a physically active lifestyle (Nagaya, et al., 2007; Perkins, et
al., 1993).
As behavioural changes in exercise and smoking share several similar cognitive
mechanisms (T. K. King, et al., 1996), the adoption of a physically active lifestyle could
prove to be an innovative and effective method for initiating healthy changes in smoking
cessation (Costakis, et al., 1999). Evidence of this relationship is presented by King et al.

49
(1996) who evaluated aspects of the Trans-Theoretical Model. Although motivational
readiness between smoking and exercise was not significantly associated, King et al.
(1996) reported that smokers who perceived the benefits of smoking also perceived the
negative consequences of physical activity. Conversely, those smokers who perceived
the negative consequences of smoking also perceived the benefits of exercise. In regards
to decisional balance across the stages of change for both exercise and smoking, King et
al. (1996) observed few significant associations. King et al. (1996) found that smokers
intending to adopt exercise within the next 6 months perceived the negative consequences
of smoking to be significantly more important compared to their counterparts who had no
intention of becoming physically active. No other significant associations for decisional
balance were observed across the behavioural stages of change. As expected, progression
through the stages of change for exercise and smoking resulted in significantly higher
levels of self-efficacy, respectively. Similar to decisional balance, a significant
correlation was observed for self-efficacy levels across lifestyle behaviours indicating
that high levels of self-efficacy for refraining from smoking was associated with high
levels of self-efficacy for participating in exercise (T. K. King, et al., 1996). Upon
further examination of this cross behavioural relationship for self-efficacy, it was
observed that smokers participating in exercise demonstrated higher levels of self-
efficacy in their ability to refrain from smoking compared to those smokers who were
preparing to exercise. Likewise, smokers who were taking action to refrain from
smoking reported higher levels of self-efficacy to exercise than those smokers who were
preparing to refrain from smoking (T. K. King, et al., 1996). Thus, smokers who were
taking action for one health behaviour demonstrated higher levels of self-efficacy for the
other behaviour. As decisional balance and self-efficacy demonstrated significant
associations across exercise and smoking, King et al. (1996) concluded that the cognitive
mechanisms between changes in exercise and changes in smoking were similar and thus
one behaviour could potentially act as a gateway behaviour for the other.
In an attempt to replicate the findings reported by King et al. (1996), Boudreaux et al.
(2003) examined the association between exercise and smoking among a sample of
individuals attending primary care clinics. Although different samples were employed,
the results were quite similar. Both studies observed that motivational readiness to

50
change smoking behaviour was not significantly related with readiness to change exercise
behaviour. Furthermore, similarities were reported for decisional balance as those
individuals with positive views of smoking typically had negative views of exercise
(Boudreaux, et al., 2003). Conversely, those individuals with negative views of smoking
were more likely to have positive views of exercise (Boudreaux, et al., 2003). In contrast
to King et al. (1996), smokers who had a negative view of smoking also had a negative
view of exercise (Boudreaux, et al., 2003). However, this difference could be attributed
to the recruitment of a sample that possessed at least one chronic illness. Therefore, this
sample may not have possessed the capability to participate in exercise and consequently
may have led to negative opinions towards a physically active lifestyle (Boudreaux, et al.,
2003). Similar results between studies were also demonstrated for self-efficacy such that
individuals with greater confidence in quitting smoking also demonstrated greater
confidence in maintaining regular exercise (Boudreaux, et al., 2003). However, these
correlations were weak. Although Boudreaux et al. (2003) and King et al. (1996)
reported nearly similar results, unlike King et al. (1996), Boudreaux et al. (2003)
concluded that smoking and exercise appear to be independent of each other as the
cognitive behavioural mechanisms were not associated or weakly related across
behavioural relationships. The fact that cognitive behavioural mechanisms across health
behaviours were not significantly associated may not necessarily denote that health
behaviours are independent of one another. Several possible explanations may provide
justification for the observed non-significant associations between cognitive mechanisms.
First, individuals may demonstrate a tendency to cluster differently within the stages of
change across several health behaviours. As such, individuals may require 6 months of
planning to change smoking, but other health behaviours such as physical activity or
dietary habits may require substantially less time before intentions to change occur
(Garrett, et al., 2004). Secondly, individuals may progress through the stages of change
in one of two ways; in a linear fashion advancing from one stage to the next or in a
cyclical manner in which the individual progresses and regresses several times until
behavioural change is achieved (Plotnikoff, Hotz, Birkett, & Courneya, 2001; J. O.
Prochaska, DiClemente, & Norcross, 1992). Behavioural change is often considered a
dynamic process and it is not uncommon for individuals to regress one or more stages

51
before successful behavioural change is accomplished (Hyman, Pavlik, Taylor, Goodrick,
& Moye, 2007; Nigg, et al., 2002). Thirdly, some individuals could progress quickly
through the stages of change, whereas others may opt to proceed at a much slower pace
(Herrick, et al., 1997). Finally, individuals may choose to change multiple behaviours in
a sequential rather than simultaneous manner as a simultaneous approach could be
overwhelming (Berg, et al., 2012). If a sequential approach is chosen, one would not
expect motivational readiness across health behaviours to be significantly associated.
One fundamental limitation shared in studies reported by King et al. (1996), Boudreaux
et al. (2003), was the utilization of a cross-sectional study design. Cross-sectional study
designs only provide a “snapshot” of the interrelationship of health behaviours at one
point of time. Therefore, this type of study design possesses an inability to establish
temporal sequences as well as develop behavioural trajectories. Longitudinal studies
would be more suitable in determining and understanding co-variation of health
behaviours as they possess the capability to track the course of health behaviours over
multiple time intervals.
A significant association between physical activity and smoking was observed within a
sample of 5,081 Finnish adult men and women (Laaksonen, et al., 2002). Over a 7 year
time period, Laaksonen et al. (2002) observed that Finnish men achieving smoking
cessation were more likely to increase physical activity levels compared to their
counterparts who continued to participate in tobacco use. Therefore, positive changes in
one health behaviour were associated with beneficial changes in the other behaviour.
Further, Finnish men who initiated smoking also increased their levels of physical
inactivity suggesting that a negative alteration in one behaviour was related to a negative
modification in the other health behaviour. No association between physical activity and
smoking reached statistical significance among Finnish women.
Terry-McElrath et al. (2011) examined co-variation between PSAE and tobacco use in a
sample of high school seniors over an 8 year period. From the ages of 18 to 21/22,
increases in PSAE were significantly correlated with a declining trend in tobacco use.
An identical association was also observed from 21/22 to 25/26 years of age (Terry-
McElrath & O'Malley, 2011). Consequently, co-variation between physical activity and
tobacco use appears to exist among a sample of high school seniors.
52
In a sample of 750 Japanese men, Nagaya et al. (2007) evaluated the interrelationship of
smoking cessation and smoking relapse on exercise behaviour. Both former smokers and
smokers who had relapsed were matched with continuing and never smokers. Although
former smokers increased their exercise participation from baseline to the final follow-up,
this increase was not significant (Nagaya, et al., 2007). However, the reported increase in
exercise participation among former smokers was significantly greater than the observed
decrease in exercise participation experienced among current smokers (Nagaya, et al.,
2007). Never and former smokers reported similar levels of exercise (Nagaya, et al.,
2007). Relapsed smokers demonstrated a significant reduction in exercise levels between
baseline and the final follow-up (Nagaya, et al., 2007). This significant reduction in
exercise participation among relapsed smokers was significantly greater than that
experienced by never and persistent smokers at the final follow-up (Nagaya, et al., 2007).
These results suggest that health behaviours are interrelated such that smoking cessation
can result in the enhancement of increased exercise participation (Nagaya, et al., 2007).
Unfortunately, Nagaya et al. (2007) also demonstrated that the reverse was true as an
unhealthy behavioural change can lead to the adoption and maintenance of an additional
unhealthy behaviour (Nagaya, et al., 2007).
Using a longitudinal study design, Perkins et al. (1993) also concluded that smoking
cessation may lead to additional favourable behavioural changes including the
participation in physical activity. This conclusion was reached due to the fact that those
smokers who recently achieved smoking cessation demonstrated significantly greater
levels of energy expenditure during leisure-time physical activity compared to individuals
who continued to smoke. However, upon further examination, Perkins et al. (1993)
observed that this significant increase in energy expenditure was primarily a result of
three individuals increasing their energy expenditure by a minimum of 4,000 kcals/week.
The remaining smokers who achieved cessation only increased their energy expenditure
by 233 kcals/week. After excluding these three individuals from the analysis, physical
activity expenditure did not significantly differ between recent quitters and continuing
smokers (Perkins, et al., 1993). These results were most likely influenced by a small
sample of recent ex-smokers (n = 24).

53
While some researchers have elected to examine the association between physical
activity and smoking cessation, others have chosen to evaluate physical activity as a
potential harm reduction strategy for the progression of smoking. In one particular study
it was concluded that the direct effect of changes in physical activity was associated with
a 1.44 decrease in the likelihood of adolescences progressing to a higher intensity of
smoking behaviour (Audrain-McGovern, et al., 2003). The findings presented by
Audrain-McGovern et al. (2003) suggest that longitudinally, physical activity may not
only be interrelated with smoking cessation but the prevention of progressing to a greater
intensity of smoking.
To summarize, cross-sectional studies have provided conflicting evidence of whether an
association exists between physical activity and smoking cessation (Boudreaux, et al.,
2003; T. K. King, et al., 1996). However, longitudinal studies including Laaksonen et al.
(2002), Audrain-McGovern et al. (2003), Nagaya et al. (2007), and Terry-McElrath et al.
(2011) have suggested that a significant interrelationship exists such that changes in one
behaviour influence changes in the other health behaviour. However, considering these
longitudinal studies have incorporated several limitations including a lack of repeated
assessments across time, the use of dichotomous or categorical dependent variables, and
the exclusion of cognitive behavioural mechanisms within the statistical analysis,
additional studies will be necessary to provide a better understanding of this potential
interrelationship between physical activity and smoking.
2.7.5 Alcohol Consumption and Smoking:
Although the prevalence of individuals who participate in excessive alcohol consumption
and smoking is less than 1% (Klein-Geltink, et al., 2006), these two behaviours
demonstrate a tendency to co-exist (Schuit, et al., 2002) as well as a significant positive
dose-response relationship (Torabi, Bailey, & Majd-Jabbari, 1993). It has been suggested
that alcohol treatment programs which incorporate a smoking cessation component could
have significant implications on the health of individuals who abuse alcohol (Ellingstad,
Sobell, Sobell, Cleland, & Agrawal, 1999). Smokers with concurrent alcoholism are
typically more responsive and may experience greater health benefits if interventions

54
provide simultaneous treatment for smoking cessation and alcohol abuse (Ellingstad, et
al., 1999).
Similar to physical activity and smoking cessation, literature pertaining to the
interrelationship between alcohol consumption and smoking is inconsistent. Several
studies have shown no association between changes in alcohol consumption and smoking
(T. Gordon & Doyle, 1986; Jessor, et al., 2006; Kahler, et al., 2009; Lippke, et al., 2012;
Murray, et al., 2002; Perkins, et al., 1993; Pirie, et al., 2000), while others have provided
evidence demonstrating that co-variation exists between these two behaviours (Breslau,
et al., 1996; Carmelli, et al., 1993; Dierker, et al., 2006; Keller, et al., 2008; Laaksonen, et
al., 2002; McDermott, et al., 2004; Saules, et al., 2004; Shaw, et al., 2011).
One example in which co-variation between alcohol consumption and smoking was
established occurred in a sample of female pre-college freshman (Saules, et al., 2004). At
baseline, Saules et al. (2004) found that individuals who initiated smoking at an earlier
age demonstrated more frequent episodes of binge drinking compared to non-smokers
and females who initiated smoking at an older age. However, throughout the course of
the study, women who commenced smoking at a later age exhibited a rise in the
frequency of binge drinking that was eventually similar to the rates of binge drinking as
their counterparts who initiated smoking at an earlier age (Saules, et al., 2004). By the
completion of the study, binge drinking rates among both early and late initiators of
smoking were significantly higher compared to never smokers (Saules, et al., 2004).
These findings suggest that initiating smoking is associated with an escalation in the
frequency of binge drinking (Saules, et al., 2004).
Another example of co-variation between alcohol consumption and smoking was
reported by McDermott et al. (2004). In this particular study, women who increased their
binge drinking over a four year period reported the highest likelihood of adopting
smoking (McDermott, et al., 2004). Unfavourable changes in alcohol consumption also
demonstrated the ability to inhibit efforts in quitting smoking. In fact, women who
increased their frequency of binge drinking reported the lowest odds in achieving
smoking cessation (McDermott, et al., 2004). Once again, these findings provide
evidence of a significant relationship between changes in alcohol consumption and
changes in smoking behaviour.

55
Perhaps as important as the establishment of co-variation is the temporal sequence in
which behavioural changes are administered. Breslau et al. (1996) examined the
interrelationship of alcohol consumption and smoking within a sample of 1,007 young
adults who were members of a Health Maintenance Organization (HMO). Compared to
smokers with no history of alcoholism, smokers whose alcoholism was in remission had a
similar likelihood of achieving smoking cessation, whereas smokers with alcoholism in
the last year were 60% less likely to achieve smoking cessation (Breslau, et al., 1996).
Smokers in remission for alcoholism were 3.62 times more likely to achieve smoking
cessation compared to smokers who continued to drink alcohol excessively (Breslau, et
al., 1996). Although treating alcoholism prior to smoking increased the likelihood of
achieving smoking cessation, the reverse relationship was not observed by Breslau et al.
(1996). The initial treatment of smoking reduced the odds of subsequent remission of
alcoholism as similar rates of alcoholism remission was observed between alcoholics
who continued to smoke and alcoholics who achieved smoking cessation (Breslau, et al.,
1996). However, caution should be taken when interpreting the results presented by
Breslau et al. (1996) as recall bias was a potential limitation of the study. Furthermore,
smokers were categorized as those individuals who ever smoked daily for at least one
month. Using this criterion to define smokers, individuals may have been smoking for
only a short duration. If this is the case, achieving smoking cessation may have been
easier compared to recruiting a sample with a longer history of smoking. These results
suggest that treating alcoholism prior to treating smoking may enhance the success of
public health interventions in changing these two behaviours (Breslau, et al., 1996). As
individuals typically commence smoking prior to initiating alcoholism, individuals may
experience more difficulty in achieving smoking cessation as they have maintained this
unhealthy behaviour for a longer duration (Bobo, Gilchrist, Schilling, Noach, & Schinke,
1987).
An additional possibility in the interrelationship between alcohol consumption and
smoking is that a positive behavioural change may yield a change that is deemed
unfavourable. Carmelli et al. (1993) provide such an example. Among War World II
Veteran Twins, smoking cessation was associated with a moderate increase in alcohol

56
consumption. It was suggested that the cues associated with initiating smoking may
trigger an increase in the consumption of alcoholic beverages (Carmelli, et al., 1993).
The association between behavioural changes in alcohol consumption and smoking is
complex. Some evidence suggests that changes in one behaviour may lead to changes in
the other behaviour, whereas others have shown no association between the two
behaviours. Likewise, the sequence in which behavioural changes should be
administered is also uncertain. Further research is required in order to determine the true
association between these two health behaviours. If smoking cessation produces
beneficial results in alcohol consumption, then substance abuse programs may provide an
opportunity to treat both behaviours simultaneously and thus enhance the effectiveness of
public health programs (J. J. Prochaska, Delucchi, & Hall, 2004).
2.8 Limitations of Existing Multiple Health Behavioural Change Research:
After a critical review of the aforementioned observational studies, a number of
limitations were identified that may have compromised the results of current literature.
Again, these limitations are summarized in Tables 2 through 5. Study design is perhaps
the most critical limitation of multiple health behavioural change research. The use of a
cross-sectional study design is an important limitation as these studies are incapable of
accounting for variations in behavioural change as well as establishing the temporal
associations among behaviours. For example, it has been suggested that a non-significant
or weak association between cognitive mechanisms that facilitate behavioural change
denotes that health behaviours are independent of one another (Boudreaux, et al., 2003).
If the stages of change between health behaviours are strongly associated, then
individuals would be in similar stages of change across health behaviours (Garrett, et al.,
2004). This would indicate that individuals utilize a simultaneous approach for changing
multiple health behaviours. However, individuals may decide to change multiple health
behaviours in a sequential manner. Therefore, one would not expect motivational
readiness between health behaviours to be associated (W. C. Taylor, et al., 2004).
Furthermore, as individuals progress through the stages of change, it is not uncommon
for individuals to regress one or more stages on several occasions before successful
behavioural change is achieved (Nigg, et al., 1999; O'Hea, et al., 2004; Plotnikoff, et al.,
57
2001). Cross-sectional studies would not have the capability to track such movements
through the stages of change. Longitudinal studies would be more appropriate in
examining trajectories of multiple health behaviours across time (Pronk, Peek, et al.,
2004). Unfortunately, longitudinal studies that have evaluated the co-variation of
multiple health behaviours have typically employed only one follow-up period (Breslau,
et al., 1996; Carmelli, et al., 1993; T. Gordon & Doyle, 1986; Kahler, et al., 2009;
Laaksonen, et al., 2002; McDermott, et al., 2004; Murray, et al., 2002; Perkins, et al.,
1993). Longitudinal study designs that incorporate only two measurement periods are
typically inadequate in examining individual trajectories as they provide only limited
amounts of information. Although it is conceivable to model linear trajectories with two
observations (D. Rogosa, et al., 1982; D. R. Rogosa & Willett, 1985; Satia, et al., 2004),
others have suggested that more than two measurements are required to adequately fit a
linear model (MacCallum, Kim, Malarkey, & Kiecolt-Glaser, 1997; Streiner, 2008).
Consequently, such study designs may not be able to accurately depict the trajectory of
health behaviours as precisely as using multiple time intervals. If the modelling of
nonlinear growth trajectories is required, more than two measurements on the same
individual will be necessary (Francis, Fletcher, Stuebing, Davidson, & Thompson, 1991).
In any case, the accumulation of health behaviour information through multiple cycles of
data collection enhances the precision of parameter estimates (Rimm & Stampfer, 2004;
D. Rogosa, et al., 1982).
Other limitations that have been identified within previous literature include small sample
sizes, lack of generalizability, the use of dichotomous or categorical variables, and an
inability to assess potential cognitive mediating mechanisms. Small sample sizes or
small sample subgroups have been reported in previous studies (Murray, et al., 2002;
Perkins, et al., 1993). Studies that recruit small sample sizes or subgroups may have
difficulty in observing true associations between outcome variables.
The generalizability of findings is another important limitation that needs to be addressed
in future studies. Studies that recruit exclusively males (Carmelli, et al., 1993; T. Gordon
& Doyle, 1986; Nagaya, et al., 2007), females (McDermott, et al., 2004; Perkins, et al.,
1993; Saules, et al., 2004), adolescences (Audrain-McGovern, et al., 2003; Terry-
McElrath & O'Malley, 2011), college freshman (Dierker, et al., 2006; Jessor, et al.,

58
2006), certain age groups (Breslau, et al., 1996), individuals diagnosed with chronic
conditions (Boudreaux, et al., 2003; Boyle, et al., 1998; Finnegan & Suler, 1985),
university students (Keller, et al., 2008), pregnant women (Pirie, et al., 2000), smokers
(Kahler, et al., 2009), or only healthy individuals from specific cultures (Nagaya, et al.,
2007) may have difficulty generalizing results back to the general population. Only two
cross-sectional (De Leon, et al., 2007; Garrett, et al., 2004) and three longitudinal studies
(Laaksonen, et al., 2002; Murray, et al., 2002; Shaw, et al., 2011) have employed a
sample that was representative back to the general population.
An additional limitation of multiple health behavioural change research is the utilization
of dichotomous or categorical independent and/or dependent variables among both cross-
sectional (De Leon, et al., 2007; Pirie, et al., 2000) and longitudinal studies (Audrain-
McGovern, et al., 2003; Breslau, et al., 1996; Carmelli, et al., 1993; T. Gordon & Doyle,
1986; Jessor, et al., 2006; Kahler, et al., 2009; Laaksonen, et al., 2002; McDermott, et al.,
2004; Nagaya, et al., 2007; Perkins, et al., 1993; Saules, et al., 2004; Shaw, et al., 2011;
Terry-McElrath & O'Malley, 2011). As previously mentioned, the use of dichotomous or
categorical variables indicates whether individuals meet the recommended guidelines for
a particular behaviour based upon a specific cut-off point. If any changes are made for a
particular behaviour, these changes would go unnoticed unless individuals were to
surpass the designated cut-off point. For this reason, the use of continuous health
behaviours could be more appropriate as such variables are not restricted by specific
criteria or cut-off points. These variables are more sensitive to behavioural changes
compared to their dichotomous or categorical counterparts.
Finally, previous research, both cross-sectional (Boudreaux, et al., 2003; Boyle, et al.,
1998; De Leon, et al., 2007; Finnegan & Suler, 1985; Garrett, et al., 2004; Keller, et al.,
2008; T. K. King, et al., 1996; Lippke, et al., 2012; Pirie, et al., 2000) and longitudinal
studies (Audrain-McGovern, et al., 2003; Breslau, et al., 1996; Carmelli, et al., 1993;
Dierker, et al., 2006; T. Gordon & Doyle, 1986; Jessor, et al., 2006; Kahler, et al., 2009;
Laaksonen, et al., 2002; McDermott, et al., 2004; Murray, et al., 2002; Nagaya, et al.,
2007; Perkins, et al., 1993; Saules, et al., 2004; Shaw, et al., 2011; Terry-McElrath &
O'Malley, 2011), have neglected to assess mediating cognitive-behavioural mechanisms
in the evaluation of multiple behavioural change. Identifying cognitive mechanisms
59
which promote the adoption and maintenance of multiple behavioural change is essential
(J. J. Prochaska & Sallis, 2004). It is these mechanisms that can be targeted by public
health programs to facilitate behavioural changes. Therefore, these mechanisms should
be included when examining co-variation between behaviours.
While this systematic review presents substantial evidence of co-variation between health
behaviours, it is important to acknowledge the limitations associated with this systematic
review. Publication bias could be a concern as this review exclusively retrieved articles
that were peer-reviewed and excluded qualitative study designs, dissertations, conference
abstracts, and gray literature. Furthermore, restricting the search to English language
publications and the use of one electronic database may have also contributed to
publication bias. Systematic reviews will often assess two important concepts; the
quality of measures utilized and the ability to control for confounding variables. The use
of invalid and unreliable measures may bias the findings of the study, whereas failing to
consider confounding variables may produce a spurious relationship. These two concepts
were not examined in this critique of articles. Lastly, this systematic review focused
specifically on co-variation within adults. Studies that sampled children were excluded
from this systematic review.
2.9 Summary:
Although multiple health behaviour research appears to represent an opportunity to
facilitate in the prevention of chronic diseases (L. Gordon, et al., 2007), there are several
questions that need to be addressed (Bock, et al., 1998; Clark, et al., 2005; Nigg, et al.,
2002). Identifying the interrelationship of health behaviours could assist in the
development of effective and cost-efficient public health interventions as programs could
focus their resources on changing one health behaviour and indirectly facilitate the
adoption and maintenance of additional health behaviours (Blakely, et al., 2004;
Costakis, et al., 1999; Nigg, et al., 1999; Tucker & Reicks, 2002). Furthermore, changing
multiple health behaviours could have a substantially greater impact on the overall well-
being of individuals compared to modifying a single health behaviour (Klein-Geltink, et
al., 2006; Nigg, et al., 2002). In the past, it was suggested that additional research was
necessary to acquire a greater understanding of co-variation of health behaviours (Ory, et

60
al., 2002). Although recent years has seen more empirical research dedicated towards the
co-variation of multiple health behaviours, the existence of co-variation remains open for
debate; particularly between alcohol consumption and smoking.
Previous literature has attempted to examine the interrelationship of multiple health
behavioural change. Unfortunately, these studies have incorporated several
methodological limitations including cross-sectional study designs, small sample sizes,
an inability to generalize results back to the general population, the use of dichotomous
or categorical outcome variables, and the incapability to assess the potential mediating
effects of cognitive mechanisms that may promote the adoption and maintenance of
multiple behavioural change. Furthermore, longitudinal studies have typically
incorporated two assessment periods, baseline and follow-up, as opposed to several
assessment intervals.
The current study will address these limitations by conducting a longitudinal multi-wave
study design within a nationally representative population-based database. In an attempt
to identify the slightest changes within health behaviours, the current study will assess
continuous dependent variables as an alternative to dichotomous or categorical variables
that have been reported in previous literature. Furthermore, the statistical analysis of the
current study will assess the effects of a potential mediating cognitive mechanism;
mastery. By addressing the concerns of previous literature, the current study will
advance the understanding of the interrelationship of multiple health behaviours.
Therefore, the primary objective of this longitudinal study is to evaluate the
interrelationship of health behaviours within nationally representative sample. The
secondary objective of this analysis is to examine whether the potential mediating effects
of mastery facilitates changes between multiple health behaviours.

61
Chapter 3
Methodology
3.1 Introduction:
To address the weaknesses identified in the existing literature, a dataset that assesses
lifestyle behaviours over multiple time intervals within a nationally representative sample
is required. Conducted by Statistics Canada, the National Population Health Survey
(NPHS) is a longitudinal survey utilized to collect detailed information pertaining to
socio-demographic characteristics, health status, utilization of health services,
determinants of health, and chronic conditions of the Canadian population across several
time periods (Statistics Canada, 2008). Since its initiation in 1994/1995, the longitudinal
NPHS has been employed to address a wide assortment of research questions including
the identification of risk factors associated with back pain (Kopec, Sayre, & Esdaile,
2004), the relationship between major depression and chronic diseases (Patten, et al.,
2008), the examination of health status and use of health care services of immigrants
(Newbold, 2005), the investigation of factors that predict the initiation and continued
adherence of mammography screening among older women (Bancej, Maxwell, Onysko,
& Eliasziw, 2005), the effects that a reduction in cigarette taxation may have on smoking
initiation among young adults (Zhang, Cohen, Ferrence, & Rehm, 2006) and the
examination of various health behaviour trajectories across gender and educational
achievement (Kwan, Cairney, Faulkner, & Pullenayegum, 2012).
One of the many objectives of the NPHS was to assist in the evaluation of individual
trajectories of health determinants across time (Statistics Canada, 2008). With its
longitudinal study design, large nationally representative sample of Canadians, and its
assessment of health behaviours over multiple time intervals, the NPHS dataset appears
to be an appropriate choice for addressing this research question.
Before discussing the study design and sampling frame of the NPHS, it is important to
acknowledge the fundamental concepts of the longitudinal NPHS dataset. The NPHS is a
panel study; a series of cross-sectional studies that collect self-reported information on
the same individuals at multiple time intervals (Kelsey, Whittemore, Evans, &
Thompson, 1996; Last, 2001). Unlike cross-sectional studies, in which measurements are

62
made at a single time point, panel studies allow researchers the opportunity to examine
the trajectory of variables across time. Thus, researchers can investigate how changes in
one variable influence changes in additional variables (Kelsey, et al., 1996).
One of the more difficult challenges of any longitudinal study is attrition (Lilienfeld &
Stolley, 1994; Statistics Canada, 2008). Throughout the follow-up process, it is not
unusual for individuals to drop out, move to another location, or die before data
collection is completed. As the proportion of individuals who are unwilling or unable to
participate in follow-up surveys increases, the challenges associated with missing data
become a concern (Lilienfeld & Stolley, 1994). For example, multivariate statistics
require complete data on all cases (Figueredo, McKnight, McKnight, & Sidani, 2000;
Streiner, 2008). If any case possesses missing data, that case as well as any responses
provided by that case is eliminated from the multivariate analysis (Figueredo, et al., 2000;
Streiner, 2002). As a result, a substantial proportion of a sample could be excluded from
any multivariate analysis if missing data is prevalent (Figueredo, et al., 2000).
Furthermore, the exclusion of individuals assumes that information is missing completely
at random, which is often not the case (S. C. Duncan & Duncan, 1994). Thus, attrition
may create a bias such that individuals who continue to participate in the study are no
longer representative of the population from which the sample was chosen (Streiner,
2008). Although the use of weights may assist in maintaining a representative sample,
missing data can result in the exclusion of specific cases from any multivariate analysis
and still create the possibility of an unrepresentative sample (Figueredo, et al., 2000).
Attrition may also generate concerns regarding statistical power which is reduced when
missing data occurs (Streiner, 2008).
Since attrition is expected to have a substantial influence on the findings of longitudinal
studies, Statistics Canada had undertaken several strategies to minimize this concern.
Firstly, the number of potential participants assigned to each interviewer, which was
based upon prior interviewing experience, was limited in an attempt to avoid
overburdening interviewers and provide sufficient follow-up of participants (Statistics
Canada, 2008). In addition, interviewers were also trained in strategies for reducing the
number of non-contacts. These strategies included making phone calls and visiting
residences at various times of the day (Statistics Canada, 2008). Multiple call backs were

63
made among respondents that were difficult to contact (Statistics Canada, 2008). In an
attempt to increase individual participation, interviews would take place at the
convenience of the respondent. Among individuals who refused to participate, a letter
was sent from the Regional Office to the respondent outlining the importance of
participating in the NPHS (Statistics Canada, 2008). Senior interviewers or project
supervisors would also attempt to persuade respondents to participate in the survey
(Statistics Canada, 2008). Periodically, respondents were unable to be traced. In this
case, interviewers utilized the last known address and telephone number of the
respondent as well as the name and contact information of others who may know the
location of the respondent (Statistics Canada, 2008). Cases that did not respond to being
interviewed were followed up in subsequent cycles in the hope that they may participate
in future cycles (Statistics Canada, 2008).
3.2 Study Design:
A detailed description of the longitudinal NPHS study design is presented elsewhere
(Statistics Canada, 2008). Briefly, data collection for the first cycle began in 1994/1995
and has continued biennially for subsequent cycles. When completed, the NPHS will
have conducted ten cycles of data collection. Recently, the NPHS has completed nine
cycles. However, at the time of this analysis, only seven cycles of data collection were
available. It is these seven cycles that will be the focus for the current statistical analysis
(Statistics Canada, 2008). It's difficult to determine how the inclusion of cycles 8 and 9
may have influenced the findings of this study. Certainly, greater rates of attrition would
be influential on the covariances and correlations. However, the extent to which these
covariances and correlations would be altered is unforeseeable.
The NPHS target population included Canadians residing in households throughout ten
provinces. Excluded from the sampling frame were individuals residing on Indian
Reserves and Crown Lands, institutions, or isolated areas in Ontario and Quebec, as well
as full-time members of the Canadian Forces Bases. Information pertaining to the
residents of the Canadian territories was also not included in this dataset. Initially, the
NPHS had targeted 19,600 households with a minimum of 1,200 households within each

64
province (Statistics Canada, 2008). At baseline, 17,276 Canadians were interviewed
ranging in age between 0 and 102 years of age (Statistics Canada, 2008).
The NPHS utilized a stratified multi-stage study design which closely resembled that of
the Labour Force Survey (Statistics Canada, 2008). In the first stage, with the exception
of Quebec, provinces were divided into three types of regions: major urban centres, urban
towns, and rural areas. In Quebec, four types of regions were formed: Montreal Census
Metropolitan Area, regional capitals, small urban agglomerations, and a rural sector.
Each area was stratified based upon geographic and/or socio-economic characteristics.
The first stage of the study design was completed once clusters from each stratum were
selected using a Probability Proportional to Size sample (Statistics Canada, 2008).
During the second stage of sample selection, households were chosen from an established
dwelling list that was developed for each specified cluster. From each chosen household,
one individual was randomly selected as the longitudinal respondent (Statistics Canada,
2008).
Randomly selecting one individual from each household may have resulted in a tendency
within the survey to under-represent individuals residing in larger households, parents
and children, whereas individuals living in smaller dwellings, single people and the
elderly, would typically be over-represented (Statistics Canada, 2008). In an attempt to
increase the representation of parents and children, the NPHS had incorporated a
rejective method whereby screened households in which all members were of 25 years of
age or more were eligible to be rejected, dropped from the survey, and replaced by
another household (Statistics Canada, 2008).
For the first seven cycles, at least 95% of respondent interviews were conducted over the
telephone (Statistics Canada, 2008). Telephone interviews were complemented by using
computer-assisted interviewing. Face-to-face interviews were conducted under specific
circumstances; the respondent did not own a telephone, if the respondent resided in an
institution, if respondent had requested a face-to-face interview, or if the interviewer had
visited the respondent’s household while attempting to locate them (Statistics Canada,
2008). Proxy interviews were permitted among respondents 12 years of age or more who
were suffering from illness and/or injuries (Statistics Canada, 2008). In the case of
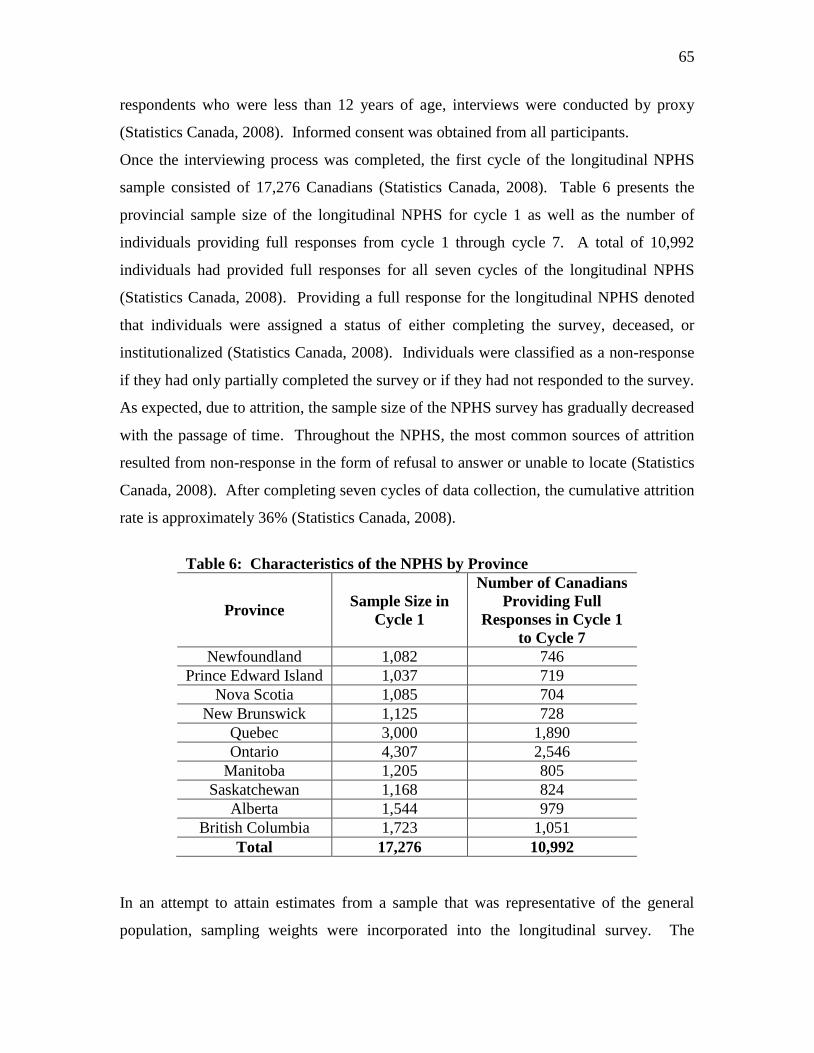
65
respondents who were less than 12 years of age, interviews were conducted by proxy
(Statistics Canada, 2008). Informed consent was obtained from all participants.
Once the interviewing process was completed, the first cycle of the longitudinal NPHS
sample consisted of 17,276 Canadians (Statistics Canada, 2008). Table 6 presents the
provincial sample size of the longitudinal NPHS for cycle 1 as well as the number of
individuals providing full responses from cycle 1 through cycle 7. A total of 10,992
individuals had provided full responses for all seven cycles of the longitudinal NPHS
(Statistics Canada, 2008). Providing a full response for the longitudinal NPHS denoted
that individuals were assigned a status of either completing the survey, deceased, or
institutionalized (Statistics Canada, 2008). Individuals were classified as a non-response
if they had only partially completed the survey or if they had not responded to the survey.
As expected, due to attrition, the sample size of the NPHS survey has gradually decreased
with the passage of time. Throughout the NPHS, the most common sources of attrition
resulted from non-response in the form of refusal to answer or unable to locate (Statistics
Canada, 2008). After completing seven cycles of data collection, the cumulative attrition
rate is approximately 36% (Statistics Canada, 2008).
Table 6: Characteristics of the NPHS by Province
Province Sample Size in
Cycle 1
Number of Canadians
Providing Full
Responses in Cycle 1
to Cycle 7
Newfoundland 1,082 746
Prince Edward Island 1,037 719
Nova Scotia 1,085 704
New Brunswick 1,125 728
Quebec 3,000 1,890
Ontario 4,307 2,546
Manitoba 1,205 805
Saskatchewan 1,168 824
Alberta 1,544 979
British Columbia 1,723 1,051
Total 17,276 10,992
In an attempt to attain estimates from a sample that was representative of the general
population, sampling weights were incorporated into the longitudinal survey. The

66
longitudinal square weights are based upon several variables including province of
residence, age, and gender. With the completion of each NPHS cycle, the longitudinal
weights have been re-calculated to reflect the characteristics of the Canadian sample at
1994/1995 (Statistics Canada, 2008).
The longitudinal NPHS microdata is stored at Research Data Centres (RDC) within
Canadian universities throughout the country. The RDC program is managed by
Statistics Canada and the Social Sciences and Humanities Research Council (SSHRC)
(Statistics Canada, 2008). In order to gain access to the NPHS, researchers must submit a
research proposal to SSHRC outlining the title of the project, rationale and objectives of
the study, proposed data analysis and software requirements, data requirements, and the
expected project start and completion dates (Statistics Canada, 2008). Once access to the
RDC is granted, Statistics Canada performs an Enhanced Reliability Check on all
members of the research project (Statistics Canada, 2008). Furthermore, researchers are
required to complete security clearance forms and participate in an orientation session at
the RDC (Statistics Canada, 2008). For any statistical analysis that takes place in the
RDC, researchers must abide by specific policies put forth by Statistics Canada regarding
confidentiality and the release of research output (Statistics Canada, 2008). These
policies include the following: 1) detailed microdata may not leave the RDC, 2) research
results must be examined by a RDC analyst before it can leave the RDC facility, and 3)
all research output leaving the RDC facility must be subjected to a disclosure analysis
(Statistics Canada, 2008). A disclosure request form provides the RDC analyst with a
description of the variables utilized as well as any new variables created by the
researcher. The disclosure request also identifies databases and statistical software used
during the analysis. It is these policies that ensure the confidentiality of information
provided by the respondents who participated in the NPHS.
3.3 Modules of the National Population Health Survey:
The longitudinal NPHS consists of several modules of information. These modules,
which are presented in Table 7, include health determinants, health status, medication and
health care utilization, preventative health, self-care, social support, stress, and violence
and personal safety (Statistics Canada, 2008). Alcohol consumption, physical activities,

67
and smoking were three modules of particular interest for this statistical analysis. The
alcohol consumption module consisted of questions pertaining to the frequency and
intensity of consumption as well as the reasoning for reducing one's intake of alcohol.
Questions in the physical activities module pertain to the frequency, intensity, and
duration of various modes of leisure-time physical activity. Respondent’s energy
expenditure was also assessed in the longitudinal NPHS (Statistics Canada, 2008). The
smoking module of the NPHS included questions regarding the reasoning for respondents
initiating and quitting smoking, current smoking status, motivational readiness to quit
smoking, age that respondents initiated smoking, age in which smokers achieved
cessation, the number of cigarettes smoked per day, the number of years that the
respondent smoked, and the motive for smokers increasing or reducing their smoking
behaviour (Statistics Canada, 2008).

68
Table 7: Modules of the National Population Health Survey
Alcohol Dependence Alcohol Consumption Administration of
Survey
Attitudes Toward
Parents Chronic Conditions
Medication Use Demographic and
Household Variables Dental Visits Education Emergency Services
Eye Examination Family Medical
History Food Insecurity Flu Shots Geographic Identifiers
General Health Health Care Utilization Health Information Health Status HIV
Height and Weight Injuries Income Insurance Labour Force
Labour Status Mental Health Nutrition Physical Activities Physical Check-Up
Preventive Health Restriction of
Activities Repetitive Strain Road Safety Rationality
Self-Care Socio-Demographics Sexual Health Sleep Smoking
Sample Identifiers Social Support Stress Health Services Tanning and UV
Exposure
Two-Week Disability Violence and Personal
Safety Sample Weights

69
3.4 Dependent Variables:
The health determinants that were evaluated in the current statistical analysis included
alcohol consumption, leisure-time physical activity energy expenditure, and smoking
behaviour. These three risk behaviours are among the most prevalent within the general
population (Coups, et al., 2004; Fine, et al., 2004; Klein-Geltink, et al., 2006) and thus
were chosen for this statistical analysis. Each of these three health determinants were
derived by self-report and appear as continuous variables in the NPHS (Statistics Canada,
2008). For the purposes of this statistical analysis, these health behaviours were
represented as continuous variables. Whether to conceptualize health behaviours as a
dichotomous or continuous measurement is an issue that remains unanswered in multiple
behaviour research (Nigg, et al., 2002). The use of continuous measures for health
behaviours are typically more sensitive and provide more statistical power than
dichotomous variables (Finney, Moyer, & Swearingen, 2003; J. J. Prochaska, Velicer,
Nigg, & Prochaska, 2008). Thus, the probability of making a type II error is reduced
through the use of continuous measures (Streiner, 2002). Furthermore, continuous
measures place a greater emphasis on behavioural change as change is easier to recognize
with continuous measures as opposed to dichotomous measures that require individuals
to fulfill a specific criterion in order to reach a specific behavioural goal (J. J. Prochaska,
Velicer, et al., 2008). In the past, alcohol consumption studies, particularly those
evaluating physical health or drinking-related problems, have employed continuous
outcomes including quantity of alcohol consumed (Finney, et al., 2003). Canadian
surveillance agencies typically monitor leisure-time physical activity as a continuous
measurement as well (Katzmarzyk & Tremblay, 2007). Duration, frequency, intensity,
and mode are often utilized to create a continuous estimate of the average daily leisure-
time physical activity energy expenditure (Katzmarzyk & Tremblay, 2007). Although
continuous estimates may have difficulty in describing prevalence rates of leisure-time
physical activity, continuous measures provide greater insight into the average level of
physical activity within a population and a greater ability in tracking behavioural changes
compared to using a dichotomous estimate (Katzmarzyk & Tremblay, 2007). The
number of cigarettes smoked on a daily basis is an essential consideration in the
monitoring of tobacco use (Mills, Stephens, & Wilkins, 1994). Assessing reductions in

70
tobacco use is worthwhile as it is associated with one’s intentions to quit (Cunningham &
Selby, 2010; Leatherdale & Shields, 2009) as well as the probability of achieving
smoking cessation (Hughes & Carpenter, 2006; Hymowitz, et al., 1997; McDermott,
Dobson, & Owen, 2008).
3.4.1 Alcohol Consumption:
Alcohol consumption was assessed by the respondent’s average daily intake. As
presented in Table 8, baseline responses for average daily alcohol consumption ranged
from 0 to 14 drinks (Statistics Canada, 2008). Average daily alcohol consumption
reached a maximum of 20 drinks during cycle 4. As a derived variable, average daily
alcohol consumption was calculated by summing the total number of drinks consumed on
all days during the week prior to being interviewed and dividing that value by seven
(Statistics Canada, 2008). This variable was calculated for those respondents who had at
least one drink within the previous 12 months (Statistics Canada, 2008). Answering this
question as “not applicable” were respondents residing in institutions, children, or
individuals who had not consumed an alcoholic beverage in the previous 12 months
(Statistics Canada, 2008). For this analysis, individuals who had not consumed an
alcoholic beverage in the previous 12 months received a daily alcohol consumption value
of 0. Individuals whose response to daily alcohol consumption was “not applicable” or
“not stated” were considered to have missing data. Moore et al. (2005) had employed a
nearly similar continuous measure for alcohol consumption.
One dilemma with assessing alcohol consumption as a continuous variable is the fact that
an increasing trend may not necessarily be indicative of an unhealthy behaviour. In fact,
individuals may choose to increase their consumption of alcoholic beverages as a
preventive measure against cardiovascular disease (Ronksley, Brien, Turner, Mukamal,
& Ghali, 2011). Perhaps a more appropriate indicator of alcohol consumption would be
the frequency in which one engages in binge drinking. Since binge drinking is
recognized as an unhealthy behaviour, the use of binge drinking as an outcome would
remove any ambiguity associated with measuring and interpreting the behavioural
trajectory of alcohol consumption. Unfortunately, in six of the seven cycles, binge
drinking was assessed as a categorical variable in which responses included the

71
following: never, less than once a month, once a month, two to three times a month, once
a week, or more than once a week. The use of continuous variables is considered a novel
or unique approach in representing health behaviours as it has only been adopted by a
small minority of studies (Dierker, et al., 2006; Murray, et al., 2002). Therefore this
study elected to exclude the use of a categorical binge drinking measure in favour of the
continuous alcohol consumption indicator.
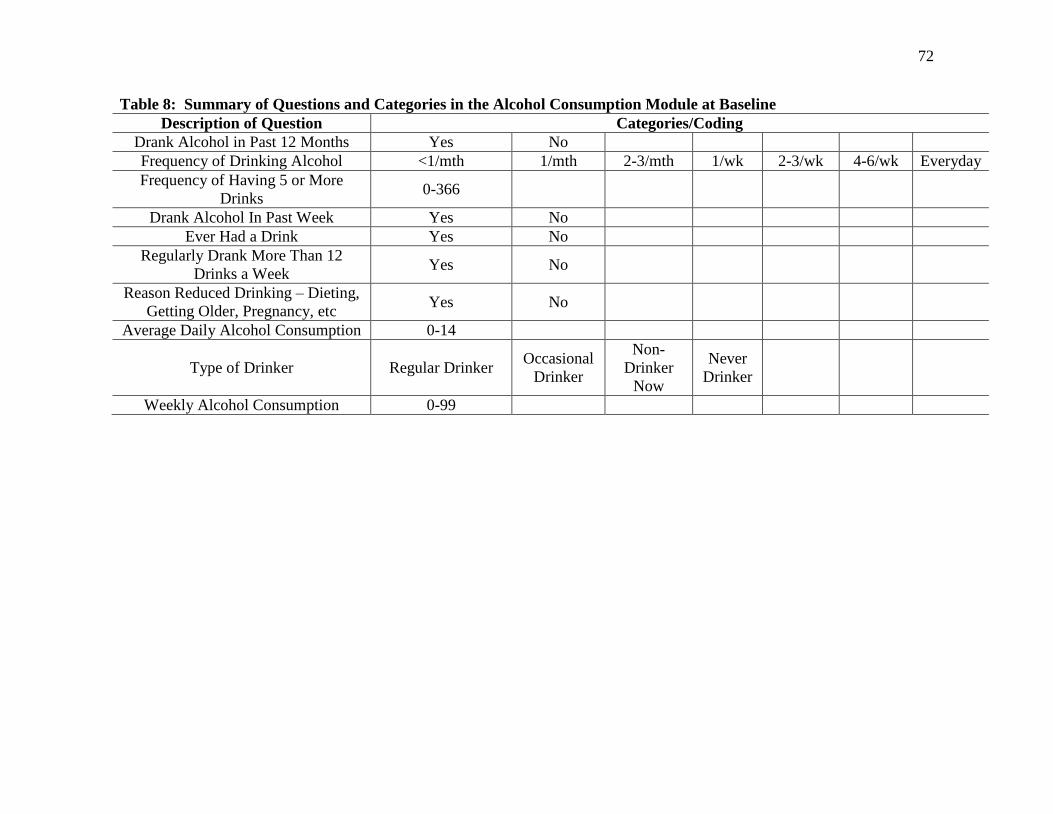
72
Table 8: Summary of Questions and Categories in the Alcohol Consumption Module at Baseline
Description of Question Categories/Coding
Drank Alcohol in Past 12 Months Yes No
Frequency of Drinking Alcohol <1/mth 1/mth 2-3/mth 1/wk 2-3/wk 4-6/wk Everyday
Frequency of Having 5 or More
Drinks 0-366
Drank Alcohol In Past Week Yes No
Ever Had a Drink Yes No
Regularly Drank More Than 12
Drinks a Week Yes No
Reason Reduced Drinking – Dieting,
Getting Older, Pregnancy, etc Yes No
Average Daily Alcohol Consumption 0-14
Type of Drinker Regular Drinker Occasional
Drinker
Non-
Drinker
Now
Never
Drinker
Weekly Alcohol Consumption 0-99

73
3.4.2 Leisure-Time Physical Activity Energy Expenditure:
Physical activity refers to “any bodily movement produced by skeletal muscles that
results in energy expenditure” (Caspersen, et al., 1985, pg. 126). Physical activity may
include occupational, sports, conditioning, as well as household activities (Caspersen, et
al., 1985). Leisure is one form of physical activity. Leisure denotes “unobligated or
discretionary time – the free time that remains after the demands of work, maintenance,
and family and social obligations have been met” (Wankel & Sefton, 1992, pg. 155). For
the purposes of this analysis, leisure-time physical activity levels were assessed by
average daily leisure-time energy expenditure within the past three months. As observed
in Table 9, energy expenditure ranged from 0 to 35.2 kcal/kg/day at baseline and reached
a maximum of 72.2 kcal/kg/day during cycle 6 (Statistics Canada, 2008). Energy
expenditure for each mode of leisure-time physical activity was derived by estimating the
average duration in hours of activity, the frequency of engagement over the previous 12
months, as well as the metabolic equivalent value characterized as kilocalories (kcals)
utilized per kilogram (kg) per hour (Statistics Canada, 2008). One metabolic equivalent
represents the amount of energy an adult expends while in a sitting position. The product
of these three measurements was divided by 365 to obtain the daily energy expenditure
for each mode of leisure-time activity (Statistics Canada, 2008). Energy expenditure for
each mode of leisure-time activity was summed to obtain overall daily energy
expenditure (Statistics Canada, 2008). With respect to criterion validity, total energy
expenditure has demonstrated modest agreement with estimated VO2max (r = 0.36) (Craig,
Russell, & Cameron, 2002). For this analysis, individuals whose energy expenditure
could not be calculated due to responses of “not applicable” or “not stated” were
considered to have missing data.

74
Table 9: Summary of Questions and Categories in the Physical Activities Module at Baseline
Description of Question Categories/Coding
Activity in Last 3 Months – Walking, Swimming, Ice Hockey,
etc Yes No
Number of Times Participated – Walking, Swimming, Ice
Hockey, etc 1-600
Time Spent – Walking, Swimming, Ice Hockey, etc 1 to 15 min 16 to 30 min 31 to 60 min More Than
One Hour
Level of Physical Activity for Usual Day Usually Sit and
Don’t Walk Much
Stand or Walk
Quite A Lot
Usually Lift
or Carry
Light Loads
Do Heavy
Work or
Carry Very
Heavy Loads
Daily Energy Expenditure 0 0.1-35.2
Participation in Daily Physical Activity Lasting >15 Min. Daily Not Daily
Monthly Frequency of Physical Activity Lasting >15 Min. 0 1-251
Frequency of All Physical Activity Lasting >15 Min. Regular Occasional Infrequent
Participant in Leisure Physical Activity Participant Non-
Participant
Physical Activity Index Active Moderate Inactive

75
3.4.3 Smoking:
The number of cigarettes smoked per day was used to indicate smoking behaviour among
Canadians who were identified as either current daily or occasional smokers (Statistics
Canada, 2008). Among current smokers, the number of cigarettes smoked per day was
assessed at every cycle of the NPHS. However, it was not until the third cycle of data
collection that Statistics Canada began to assess tobacco use among occasional smokers.
Responses for current daily smokers at baseline ranged from 1 to 99 (see Table 10), while
responses for occasional smokers at the third cycle ranged from 1 to 55 (Statistics
Canada, 2008). The number of cigarettes smoked per day was assessed for each smoker
unless one of the following responses was provided; “not applicable”, “don’t know”, or
“not stated”. Data was considered missing if any one of the aforementioned responses
was provided by current daily or occasional smokers.
It was also necessary for this analysis to include those respondents who were non-
smokers as these individuals may initiate smoking or achieve cessation in subsequent
cycles. Therefore, those individuals who identified their smoking status as “not at all”
and responded “not applicable” for the number of cigarettes smoked each day were
assigned a value of 0 for the number of cigarettes smoked per day.
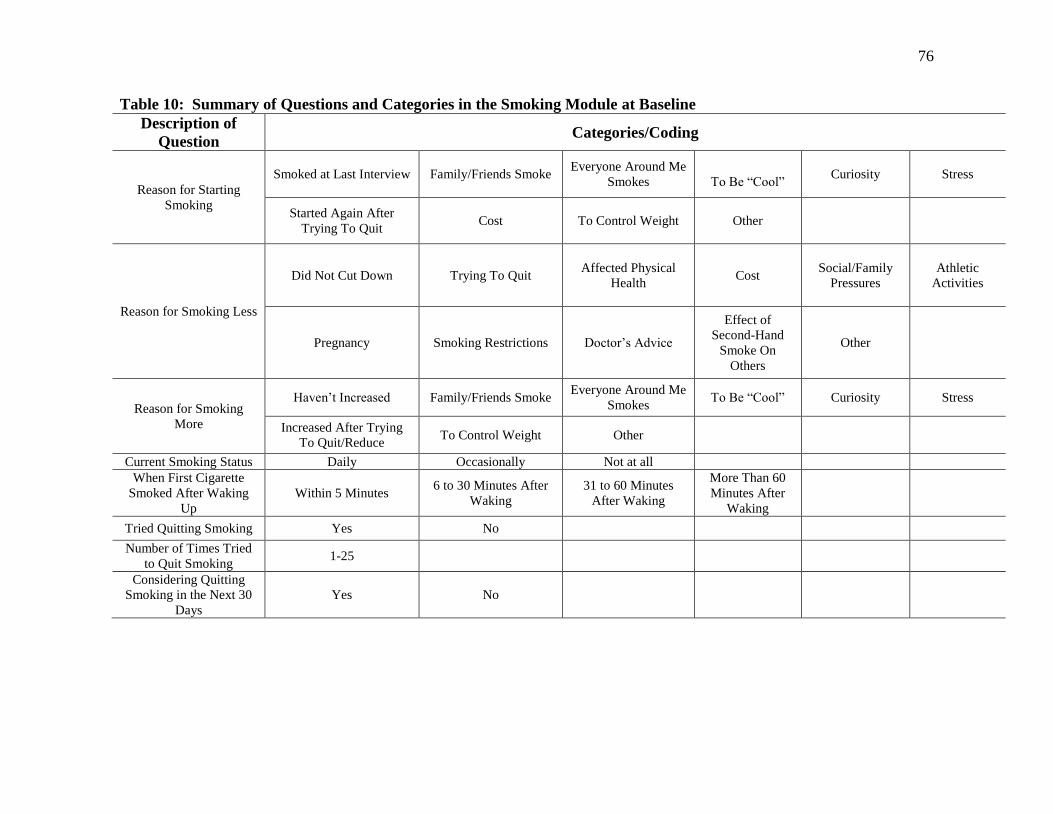
76
Table 10: Summary of Questions and Categories in the Smoking Module at Baseline
Description of
Question Categories/Coding
Reason for Starting
Smoking
Smoked at Last Interview Family/Friends Smoke Everyone Around Me
Smokes
To Be “Cool” Curiosity Stress
Started Again After
Trying To Quit Cost To Control Weight Other
Reason for Smoking Less
Did Not Cut Down Trying To Quit Affected Physical
Health Cost
Social/Family
Pressures
Athletic
Activities
Pregnancy Smoking Restrictions Doctor’s Advice
Effect of
Second-Hand
Smoke On
Others
Other
Reason for Smoking
More
Haven’t Increased Family/Friends Smoke Everyone Around Me
Smokes To Be “Cool” Curiosity Stress
Increased After Trying
To Quit/Reduce To Control Weight Other
Current Smoking Status Daily Occasionally Not at all
When First Cigarette
Smoked After Waking
Up
Within 5 Minutes 6 to 30 Minutes After
Waking
31 to 60 Minutes
After Waking
More Than 60
Minutes After
Waking
Tried Quitting Smoking Yes No
Number of Times Tried
to Quit Smoking 1-25
Considering Quitting
Smoking in the Next 30
Days
Yes No

77
Table 10: Summary of Questions and Categories in the Smoking Module at Baseline Continued
Description of
Question Categories/Coding
Considering Quitting
Smoking in the Next 6
Months
Yes No
Smoking Restrictions in
Work Place Restricted Completely
Allowed in Designated
Areas
Restricted Only in
Certain Places
Not Restricted at
all
Age Started Smoking
Daily 5-81
Number of Cigarettes
Smoked Each Day 1-99
Number of Years That
Respondent Smoked 0-77
Ever Smoked Daily Yes No
Age Stopped Smoking
Daily – Former Daily
Smoker
10-90
Reason for Quitting
Smoking
Never Smoked Didn’t Smoke at Last
Interview
Affected Physical
Health Cost
Social/Family
Pressures
Athletic
Activities
Pregnancy Smoking Restrictions Doctor’s Advice
Effect of
Second-Hand
Smoke on Others
Other
Type of Smoker Daily Smoker Occasional Smoker
(Former Daily Smoker)
Always an
Occasional Smoker
Former Daily
Smoker
Former
Occasional
Smoker
Never Smoked

78
These three variables, average daily alcohol consumption, daily leisure-time physical
activity energy expenditure, and number of cigarettes smoked per day, were used to
represent health behaviours for this analysis as they share similar units of measurement;
daily basis. Similar units of measurement between multiple health behaviours are
essential for interpretation purposes (Nigg, et al., 2002).
3.5 Independent Variables:
As mentioned in the preceding section, continuous variables were used to represent
alcohol consumption, leisure-time physical activity energy expenditure, and smoking. In
addition to these lifestyle variables, independent variables included demographic
characteristics as well as body mass index (BMI). In previous literature, such
characteristics have been shown to be associated with the possession of multiple health
behaviours (Fine, et al., 2004; Laaksonen, et al., 2003; Li, et al., 2009; Rosal, et al., 2001)
and therefore should be accounted for in each of the growth curve models. Demographic
variables included gender (male and female), age of respondent ( in years), marital status
(married/common-law, single, and formerly married), education (less than secondary
school graduation, secondary school graduation, some post-secondary schooling, and
post-secondary graduation), and income adequacy (lowest income, lower middle income,
upper middle income, and highest income) (Statistics Canada, 2008). Formerly married
referred to individuals who were widowed, separated, or divorced. Education was based
upon the highest level of education attained by the respondent (Statistics Canada, 2008).
Income adequacy was classified according to the total household income and adjusted for
the number of individuals residing in the household (Statistics Canada, 2008). Others
have used comparable criteria in assessing marital status (W. K. deRuiter, et al., 2008;
Kopec, et al., 2004), education (W. K. deRuiter, et al., 2008; Newbold, 2005; Zhang, et
al., 2006), and income adequacy (W. K. deRuiter, et al., 2008; Kopec, et al., 2004;
Newbold, 2005). Body mass index, which was assessed for all respondents excluding
pregnant women, was calculated as weight in kilograms divided by squared height in
meters (Statistics Canada, 2008).
The inclusion of the aforementioned independent variables in the current analysis was
essential as they are often associated with the clustering of unhealthy behaviours

79
(Berrigan, et al., 2003; Fine, et al., 2004; Laaksonen, et al., 2003; Prattala, et al., 1994;
Rosal, et al., 2001). Furthermore, these aforementioned independent variables are
associated with alcohol consumption (Eng, Kawachi, Fitzmaurice, & Rimm, 2005;
Moore, et al., 2005), excessive alcohol consumption (Karlamangla, Zhou, Reuben,
Greendale, & Moore, 2006), leisure-time physical activity (Craig, Russell, Cameron, &
Bauman, 2004; Eng, et al., 2005; Steffen, et al., 2006), and smoking behaviour (Eng, et
al., 2005; Hyland, et al., 2004; Hymowitz, et al., 1997; C. W. Lee & Kahende, 2007).
3.6 Mediating Variable:
Mastery, a derived variable in the longitudinal NPHS, was based upon the work of
Pearlin and Schooler (1978). A respondent’s mastery score was assessed by 7-items
(Pearlin & Schooler, 1978). Each of these 7-items, which are identified in Table 11, were
measured on a 5-point scale. Possible responses included “strongly agree”, “agree”,
“neither agree nor disagree”, “disagree”, or “strongly disagree” (Pearlin & Schooler,
1978). Scores for the final two items needed to be reversed before a mastery score could
be calculated. Mastery scores, which were obtained through the summation of these 7-
items, ranged from 0 to 28 with higher scores denoting an enhanced sense of mastery
(Statistics Canada, 2008). Unfortunately, the mastery scale was not conducted within
cycles 2 and 3 of the longitudinal NPHS and thus mastery scores were not calculated for
these two cycles. Considering that this analysis utilized latent growth curve modelling,
these missing mastery scores were not a concern as growth curve analysis is an
appropriate statistical procedure for dealing with missing data (Streiner, 2002, 2008).
Furthermore, according to Streiner (2008), only three data points are necessary to fit a
regression line. Although others have suggested a minimum of four to five repeated
measures to model linear change (MacCallum, et al., 1997), fulfilling the criteria put
forth by Streiner (2008) and MacCallum et al. (1997) was not problematic as 70 and 60%
of individuals had provided a minimum of three and four mastery scores, respectively.

80
Table 11: Items for Measuring Mastery
Number Items
1 I Have Little Control Over The Things That Happen To Me.
2 There is Really No Way I Can Solve Some of The Problems I Have.
3 There is Little I Can Do To Change Many of The Important Things
In My Life.
4 I Often Feel Helpless in Dealing With The Problems of Life.
5 Sometimes I Feel That I’m Being Pushed Around in Life.
6 What Happens To Me In The Future Mostly Depends On Me.
7 I Can Do Just About Anything I Really Set My Mind To Do.
3.7 Longitudinal Statistical Analysis Techniques:
Various statistical techniques have been employed to analyze longitudinal datasets. The
difference score is perhaps the most instinctive method for measuring change between
two time periods (Francis, et al., 1991; D. Rogosa, et al., 1982). The difference score
subtracts an individual’s follow-up score from their baseline score (Francis, et al., 1991;
D. Rogosa, et al., 1982). Although, the difference score method is appropriate when two
measurement periods are available, it only provides limited information pertaining to
change and demonstrates an inability to model nonlinear growth (D. Rogosa, et al.,
1982). More traditional statistical analysis of change for longitudinal data analysis
includes repeated-measures analysis of variance (rANOVA) and multivariate repeated-
measures analysis of variance (rMANOVA). However, these two methods have several
limitations. Both techniques are susceptible to missing data as individuals with
incomplete data are omitted from any statistical analysis (Gueorguieva & Krystal, 2004;
Schafer & Olsen, 1998). As previously mentioned, the omission of individuals can result
in a sample that is unrepresentative from the broader population. Furthermore, both
rANOVA and rMANOVA require datasets to have similar measurement periods for each
individual (Francis, et al., 1991; Gueorguieva & Krystal, 2004; Kristjansson, Kircher, &
Webb, 2007). In addition, these statistical methods involve differences in group mean
scores at each time period as opposed to individual scores (T. E. Duncan & Duncan,
2004; Stull, 2008). Group mean scores can conceal individual observations as well as
individual change (Stull, 2008).
Other analytical techniques have been utilized for longitudinal data analysis. Two of
these techniques, multivariable logistic regression modelling (Kopec, et al., 2004; Zhang,

81
et al., 2006) and generalized linear modelling (Bancej, et al., 2005) have been employed
to analyze data from the NPHS. However, comparable to repeated-measures analysis of
variance, these modeling techniques are also susceptible to missing data. Furthermore,
these statistical techniques violate an important assumption of ordinary least squares. By
nature, panel surveys collect repeated observations on the same individual across time.
Ordinary least squares assumes that the error terms between observations is uncorrelated
for each individual. However, in panel surveys, the opposite is demonstrated as the error
term between observations are highly correlated for each individual. Although the
parameter estimate is not affected by highly correlated error, the standard errors for such
parameters are.
Latent growth curve models, also known as random coefficient regression models, mixed
general linear models, or multilevel linear models, are a popular choice for evaluating
change in continuous variables as such models offer several advantages compared to
more traditional methods of analyzing longitudinal data (Collins, 2006; Francis, et al.,
1991). Latent growth curve models not only possess the capability to generate growth
parameters for each individual, but also provide growth parameter means, variances, and
covariances (cov) for the entire group which permit researchers to examine inter-
individual differences in trajectories across time (Curran, Harford, & Muthen, 1996; T. E.
Duncan & Duncan, 2004; Stull, 2008; Willett & Sayer, 1996). Latent growth curve
modelling is also known for its flexibility in modeling linear as well as nonlinear
trajectories (Curran, et al., 1996; Llabre, Spitzer, Siegel, Saab, & Schneiderman, 2004;
Stull, 2008; Willett & Sayer, 1996). In addition, latent growth curve modelling can
incorporate numerous and unequally spaced assessment intervals (Francis, et al., 1991;
Willett & Sayer, 1996). Incorporating numerous waves of data can increase the precision
of parameter estimates and allows the opportunity to test more complex models (Francis,
et al., 1991). Furthermore, latent growth curve modelling allows the estimation of
parameters that are free of measurement error (Stull, 2008). Thus, parameter estimates
are no longer reduced or susceptible to bias as a result of measurement error (Cheung &
Lau, 2008; Llabre, et al., 2004). The ability to estimate parameters that are free from
measurement error is an advantage over multi-level models (Stull, 2008). Growth curve
models also possess the ability to evaluate the interrelationship of multiple latent
82
variables (MacCallum & Austin, 2000; Stull, 2008). This is one advantage that is not
present in rANOVA, multi-level modelling, or mixed models (Stull, 2008). Finally,
unlike multivariate analysis, growth curve modelling is an effective method for dealing
with dropouts or missing data (Streiner, 2002, 2008). Growth curve modelling uses
likelihood estimators to fit a trajectory. This trajectory is based upon all available
observations (S. C. Duncan & Duncan, 1994; Francis, et al., 1991). Consequently, the
exclusion of cases with missing data is less likely to occur and thus statistical power can
be maintained.
Growth curve models fit growth trajectories by modelling the means of multiple
observations on the same outcome across time (Collins, 2006; B. O. Muthen & Curran,
1997). Latent growth curve models depict growth as a two level model (B. O. Muthen &
Curran, 1997). In the level 1 model, outcomes are determined by individual-specific
growth parameters as well as time (Willett & Sayer, 1994, 1996). The individual linear
growth trajectory is expressed as:
Yti = ßoi + ßti xti + eti
The outcome, represented by Y, is calculated for an individual i at time t (Collins, 2006;
Llabre, et al., 2004; Willett & Sayer, 1994). The data of the repeated observations are
used to estimate two unobserved latent variables for each individual growth curve; the
intercept and slope (Curran, et al., 1996; Curran, Stice, & Chassin, 1997; Mitchell,
Kaufman, Beals, & Pathways of Choice and Healthy Ways Project Team, 2005; B. O.
Muthen & Curran, 1997; Stull, 2008). The intercept, the initial status, and the slope, also
known as the rate of change, are represented by ßoi and ßti, respectively (Collins, 2006;
Llabre, et al., 2004; MacCallum, et al., 1997; Stoolmiller, 1994). The intercept, a
constant, depicts the starting point of the trajectory at the first time period (Curran, et al.,
1996; Stull, 2008; Willett & Sayer, 1996). In other words, the intercept illustrates the
point at which the growth curve trajectory coincides with the vertical axis at the first
measurement period (Stoolmiller, 1994). The slope represents change and illustrates the
shape of the trajectory across each time period (Curran, et al., 1996; S. C. Duncan &
Duncan, 1994; Willett & Sayer, 1994, 1996). The slope is defined as the “amount of
vertical increase per unit of horizontal run of the growth curve” (S. C. Duncan & Duncan,
1994, pg. 320). These two parameters are of primary interest in latent growth curve

83
modelling as they characterize an individual’s trajectory (Llabre, et al., 2004;
Raudenbush, 2001) and are typically referred to as random effects as they can vary freely
among individuals for any given trajectory (Collins, 2006; MacCallum, et al., 1997). The
individual growth trajectory is also represented by xti and eti. The component xti denotes a
measure of time, whether it be years, months, etc., for individual i at time t (Collins,
2006; MacCallum, et al., 1997; Stoolmiller, 1994). Finally, assumed to have values that
are normally distributed with a mean of zero and a constant variance, eti is the deviation
or difference between an individual’s actual score (Yti) and their trajectory at a specific
time (the repeated measures variable that is not explained by the latent variables) (Llabre,
et al., 2004; Park & Schutz, 2005; Raudenbush, 2001). In other words, the error term
represents the level 1 or within-person “noise” that influences the true growth parameter
estimates (Willett & Sayer, 1996). This random error incorporates both measurement
error and time specific error (Llabre, et al., 2004; Willett & Sayer, 1994). In latent
growth curve modelling, the estimated latent variables are free from such random error.
Growth curve models also possess a level 2 equation. The level 2 equation, which
evaluates the variability between individual trajectories (Kristjansson, et al., 2007;
Raudenbush, 2001; Willett & Sayer, 1994), is expressed as:
ßoi = yoo + uoi
ßti = y10 + u1i
In the level 2 equations, ßoi and ßti act as dependent variables (Llabre, et al., 2004). The
grand mean of all the intercepts and slopes correspond to yoo and y10, respectively
(Collins, 2006; Llabre, et al., 2004; Willett & Sayer, 1994). These grand means, which
represent the average trajectories, are referred to as fixed parameters (Llabre, et al., 2004;
MacCallum, et al., 1997). The overall means, variances, and covariances of the intercept
and slope are calculated from all the repeated observations. The inter-individual
variability, deviation from the grand mean, of the intercept and slope are expressed as uoi
and u1i, respectively (Collins, 2006; Llabre, et al., 2004; MacCallum, et al., 1997; Stull,
2008). Although not observed in the aforementioned equations, the covariance is an
additional important aspect of growth curve models. The covariance examines the
relationship or association between the intercept and slope (S. C. Duncan & Duncan,
1994; Stull, 2008).

84
A significant variance could be attributed to inter-individual heterogeneity in the
intercept and/or slope of a latent growth curve model (Willett & Sayer, 1994, 1996). For
example, it is not uncommon for individuals within a sample to report different starting
points. Furthermore, it is unlikely that change within a specific domain occurs at an
equal rate among individuals. When significant variance is observed in the latent
variables, time-invariant and time-varying covariates can be incorporated into a growth
curve model to account for such variability (Llabre, et al., 2004; MacCallum, et al., 1997;
Stull, 2008; Willett & Sayer, 1994). To account for variability in the latent variables,
covariates are incorporated into the following level 2 equations (Bollen & Curran, 2006;
MacCallum, et al., 1997; Preacher, Wichman, MacCallum, & Briggs, 2008; Willett &
Sayer, 1994):
ßoi = yoo + y01hi + uoi
ßti = y10 + y11hi + u1i
In these level 2 equations, yoo and y10 represent the mean intercept and slope, respectively,
when income, for example is equal to zero. Both y01 and y11 indicate the effect of income
on each latent parameter (MacCallum, et al., 1997; Preacher, et al., 2008).
As mentioned in the aforementioned paragraphs, latent growth curve models are more
advantageous over traditional statistical methods. Latent growth curve modelling is an
appropriate choice for evaluating the interrelationship of change between multiple
outcomes as well as modelling the potential effects of mediating variables across multiple
time periods (MacCallum, et al., 1997; Willett & Sayer, 1994). Researchers may want to
consider the use of latent growth curve models in evaluating change among health
behaviours (Curran, et al., 1996).
3.8 Statistical Analysis of the Current Study:
For the purpose of this analysis, Canadians less than 12 years of age at cycle 1 were
excluded. Justification for the exclusion of such individuals was based upon the fact that
questions pertaining to alcohol consumption, leisure-time physical activity energy
expenditure, and smoking were not asked among Canadians under the age of 12 years. It
is expected that excluding these younger Canadians would not influence the findings of
this analysis as individuals do not typically begin to participate in unhealthy behaviours

85
including smoking (Everett, et al., 1999; Hammond, 2005; Harrell, Bangdiwala, Deng,
Webb, & Bradley, 1998) and alcohol consumption (Faden, 2006; Swahn, Bossarte, &
Sullivent, 2008) until after the age of 12. Additional criteria for exclusion was based
upon the number of valid responses that individuals provided for each health behaviour.
A response was deemed valid if the individual provided an answer that did not include
one of the following: “not applicable”, “don’t know”, “refusal”, or “not stated”.
Excluded from this analysis were individuals who were unable to offer a valid response
for any of the three health behaviours at any of the seven assessment periods. As these
individuals provide no information in the development of the growth curve model, these
individuals would automatically be excluded from the analysis. On the other hand,
individuals providing at least one valid response for any one of the three dependent
variables during any of the first seven cycles were included in this analysis.
Consequently, individuals may only contribute one data point for each growth curve
model.
Univariate analyses were performed on each dependent and independent variable. As
previously mentioned, dependent variables included alcohol consumption, leisure-time
physical activity, and smoking, while independent variables consisted of gender (male
and female), chronological age (in years), marital status (married/common-law, single,
formerly married), education (less than secondary school, secondary school graduation,
some post-secondary schooling, and post-secondary graduation), income adequacy
(lowest income, lower middle income, middle income, upper middle income, highest
income, and missing income), BMI, and the number of chronic conditions diagnosed by a
health professional. At each of the seven assessment periods, the mean, median, and
standard deviation was calculated for continuous variables. Continuous variables
included each dependent variable, chronological age, BMI, mastery, and the number of
chronic conditions diagnosed by a health professional. In addition to these descriptive
statistics, the assumption of normality among the three continuous dependent variables
was tested by examining their respective skewness and kurtosis. The assessment of
skewness and kurtosis are essential in determining whether variables violate the
assumption of non-normality (Olsson, Foss, Troye, & Howell, 2000). The assumption of
normality for each dependent variable was further evaluated by the findings of a

86
Kolmogorov-Smirnov test. In the case of categorical independent variables, frequency
distributions were calculated at each cycle of the NPHS.
A logistic regression model with odds ratios (ORs) and corresponding 99% confidence
intervals (CIs) was employed to examine predictors of attrition. The outcome variable of
this model, attrition at the final follow-up period, was comprised of two categories: i)
non-participation [reference category], and ii) participation. Those individuals in the
participation category provided valid responses for the variables of interest at the final
follow-up period. These variables of interest included all three health behaviours as well
as gender, chronological age of respondent, marital status, education, income adequacy,
BMI, mastery, and the number of chronic conditions diagnosed by a health professional.
The non-participation category included individuals who provided partial responses or
were non-responsive for the aforementioned variables. The attrition model was adjusted
for various baseline variables including gender (male [reference category], female),
chronological age of respondent (in years), marital status (single [reference category],
married or common-law, formerly married), education (less than secondary school
[reference category], secondary school graduation, some post-secondary school, post-
secondary graduation), income adequacy (lowest income [reference category], lower
middle income, upper middle income, and highest income), BMI, mastery, physical
activity (kcal/kg/day), smoking behaviour (number of cigarettes smoked daily), alcohol
consumption (number of alcoholic drinks/day), as well as the number of chronic
conditions diagnosed by a health professional.
To assess the proportion of individuals reporting unhealthy behaviours across the seven
assessment periods, alcohol consumption, leisure-time physical activity energy
expenditure, and smoking were transformed from continuous to binary variables based
upon specific health recommendations. Although continuous variables are more sensitive
to behavioural changes, health guidelines are currently represented as binary variables.
Therefore, to assess what percentage of Canadians report unhealthy behaviours, binary
variables were employed for this part of the analysis. Gender-specific criteria were
utilized to define excessive alcohol consumption. Males and females who drank a
minimum of 15 and 10 alcoholic drinks per week, respectively were identified as
consuming unhealthy quantities of alcohol. These cut-offs have been employed by

87
Bondy et al. (1999) and Wilkins (2002). For leisure-time physical activity energy
expenditure, individuals expending a minimum of 3.0 kcal/kg/day of energy during
leisure-time activities met the recommended guidelines for physical activity (Haskell,
Montoye, & Orenstein, 1985; Katzmarzyk & Tremblay, 2007). Consequently, those
individuals who were unable to fulfill this criterion were considered physically inactive.
Expending 3.0 kcal/kg/day of energy is equivalent to an hour of daily walking (T. A.
Barnett, Gauvin, Craig, & Katzmarzyk, 2008). A similar cut-off has been used by others
to define an active lifestyle (Da Costa, Lowensteyn, & Dritsa, 2003; W. K. deRuiter, et
al., 2008; Gauthier, et al., 2012; Stephens, Craig, & Ferris, 1986) . Finally, individuals
who currently smoked, either daily or occasionally failed to meet the health guidelines for
smoking behaviour. Using the aforementioned health recommendations, these three
health behaviours were used independently as well as in conjunction to assess the
percentage of Canadians who participated in the following unhealthy behaviours: 1)
excessive alcohol consumption, 2) leisure-time physical inactivity, 3) smoking, 4)
excessive alcohol consumption and leisure-time physical inactivity, 5) leisure-time
physical inactivity and smoking, 6) excessive alcohol consumption and smoking, as well
as 7) excessive alcohol consumption, leisure-time physical inactivity, and smoking. The
percentage of Canadians who met the recommended guidelines for all three health
behaviours was also calculated.
The primary objective of this study was to evaluate the interrelationship of multiple
health behaviours. Parallel process models appeared to be an appropriate statistical
method for this analysis as the growth factors of multiple health behaviours could be
evaluated simultaneously. In total, three parallel process models were evaluated as only
one health behaviour was simultaneously modelled onto another health behaviour. These
three models were: 1) alcohol consumption and leisure-time physical activity, 2) leisure-
time physical activity and smoking, and 3) alcohol consumption and smoking.
The development of each parallel process model involved a three step approach that is
recommended by MacCallum et al. (1997) and employed by others (Curran, et al., 1996;
Curran, et al., 1997; Stoolmiller, 1994). In the initial step, the existence of change as well
as the longitudinal growth trajectory for each health behaviour was evaluated in a linear
unconditional model. An unconditional model represents a model that does not include
88
covariates. Three linear unconditional models were developed by utilizing all seven
repeated measures for alcohol consumption, leisure-time physical activity energy
expenditure, and smoking. In each linear unconditional model, the repeated measures
signified the dependent variables, while the latent intercept and slope represented the
independent variables. A latent variable represents a variable that cannot be directly
observed (Park & Schutz, 2005). As mentioned previously, the intercept indicates the
initial status or starting point of a health behaviour, while the slope represents the rate of
change across time for that particular lifestyle behaviour. In each of the three linear
unconditional models, the factor loadings of the intercept were fixed at 1.0. Fixing the
factor loadings of the intercept at 1.0 established the starting point of each trajectory at
the first time period and allowed the intercept to stay constant and equally influence all
seven repeated measures (Wu, West, & Taylor, 2009). The factor loadings associated
with the slope indicate the time structure of the repeated measures (Willett & Sayer,
1994; Wu, et al., 2009). In a linear unconditional model, factor loadings of the slope
were fixed at 0, 1.0, 2.0, 3.0, 4.0, 5.0, and 6.0 to correspond with all seven repeated
measures. Fixing the first observation at 0 defines the intercept as the initial assessment
period (T. E. Duncan & Duncan, 2004; Stull, 2008). The covariance and correlation
between the intercept and slope were also evaluated for each of the three linear
unconditional health behaviour models (S. C. Duncan & Duncan, 1994; Park & Schutz,
2005). Maximum likelihood estimation was employed for each growth curve model (L.
K. Muthen & Muthen, 1998-2011). Unlike traditional statistical methods, the use of
maximum likelihood estimation incorporates all available data and thus individuals are
not excluded from the analysis for incomplete data (S. C. Duncan & Duncan, 1994;
Francis, et al., 1991).
An example of a linear unconditional model is illustrated in Figure 1. In Figure 1, the
solid lined boxes represent the repeated measurements of the dependent variable leisure-
time physical activity energy expenditure for each of the seven cycles of the NPHS. The
two ovals in Figure 1 represent the latent variables; the intercept and slope. The single
headed arrows indicate a causal relationship between the latent variables and the repeated
measures of leisure-time physical activity. The numbers assigned to each single headed
arrow indicate the designated factor loadings for the intercept and slope. Both the

89
covariance and correlation between the latent variables are represented by the double-
headed arrow which indicates a non-directional relationship between the intercept and
slope.

90
Figure 1: Linear Unconditional Growth Curve Model: Physical Activity
Physical
Activity 1
Physical
Activity 2
Physical
Activity 3
Physical
Activity 4
Physical
Activity 5
Physical
Activity 6
Physical
Activity 7
Physical Activity
Intercept
Physical Activity
Slope
1
1
1
1 1
1 1
0 1
2 3 4 5 6

91
Model fit, which assesses how well a particular model fits the sample data (Schermelleh-
Engel, Moosbrugger, & Muller, 2003), is typically assessed by examining the chi-square
goodness-of-fit statistic (X2) as well as additional fit indices (Hu & Bentler, 1999; Wu, et
al., 2009). A non-significant chi-square test statistic indicates that a model fits the data
well (Bollen & Curran, 2006; Park & Schutz, 2005; Schermelleh-Engel, et al., 2003).
However, the chi-square test statistic is often susceptible to bias, demonstrating a
significant discrepancy between the hypothesized model and the distribution of the
sample data when variables violate the assumption of multivariate normality or when
large sample sizes are analyzed (Bollen & Curran, 2006; Park & Schutz, 2005;
Schermelleh-Engel, et al., 2003; Stull, 2008; Wu, et al., 2009). This bias is attributed to
an increase in statistical power which subsequently enhances the ability to identify the
slightest discrepancy in the mean or covariance structure (Bollen & Curran, 2006). Due
to the substantial sample size of the current analysis, a significant chi-square test statistic
was expected. Therefore, the chi-square goodness-of-fit statistic was supplemented with
additional fit indices. The utilization of multiple fit indices should be a common practice
for examining model fit (Hu & Bentler, 1999; Schermelleh-Engel, et al., 2003). The
standardized root mean squared residual (SRMR) when used in combination with the root
mean square error of approximation (RMSEA) results “in acceptable Type II error rates
for simple and complex misspecified models” (Hu & Bentler, 1999, pg. 27). For this
approach, well fitting models report SRMR and RMSEA values of less than 0.05 and
0.06, respectively (Hu & Bentler, 1999). MacCallum and Austin (2000) have also
recommended the incorporation of RMSEA in assessing model fit. Another approach in
assessing model fit would be the inclusion of the comparative fit index (CFI) in
conjunction with the SRMR at cut-offs of 0.96 and 0.09, respectively (Hu & Bentler,
1999). The use of the CFI and SRMR indices produces “the least sum of Type I and
Type II error rates” (Hu & Bentler, 1999, pg. 27). Thus, in addition to the chi-square test
statistic, three fit indices, CFI, SRMR, and RMSEA, were used to evaluate model fit in
this analysis.
If the presence of change for any health behaviour was established in the form of a
significant linear slope (p<0.01), a quadratic unconditional model was tested to determine
if the longitudinal trajectory was nonlinear. A quadratic unconditional model is similar to

92
a linear unconditional model with the exception of an additional latent variable, a
quadratic slope, which depicts the curvilinear trajectory (L. K. Muthen & Muthen, 1998-
2011; Park & Schutz, 2005; Stull, 2008; Willett & Sayer, 1994). Compared to the linear
factor loadings, factor loadings for a quadratic slope are squared (L. K. Muthen &
Muthen, 1998-2011); 0, 1, 4, 9, 16, 25, and 36. A chi-square difference test was
employed to determine whether the inclusion of a quadratic growth factor would improve
the fit of the model (Llabre, et al., 2004; Willett & Sayer, 1994).
Once the shape or trajectory of each health behaviour was established, the second step in
the development of a parallel process model involved the simultaneous evaluation of
multiple health behaviours. By modelling health behaviours simultaneously, the
covariances between the four latent variables could be evaluated. It is these covariances
that denote whether health behaviours were interrelated. In total, six covariances were
examined in each parallel process model. Figure 2 illustrates a parallel process model for
leisure-time physical activity energy expenditure and smoking. The slope-slope
covariance was the primary focus of each parallel process model as this covariance
revealed whether changes in one health behaviour was associated with changes in the
other health behaviour. In Figure 2, the slope-slope covariance is indicated by the
number 1. In addition to the slope-slope covariance, each parallel process model also
incorporated five additional covariances. Outlined in Figure 2, these additional
covariances included the following: 2) the intercept of leisure-time physical activity
energy expenditure and the intercept of smoking, 3) the intercept of smoking and the
slope of smoking, 4) the intercept of leisure-time physical activity energy expenditure
and the slope of smoking, 5) the intercept of leisure-time physical activity energy
expenditure and the slope of leisure-time physical activity energy expenditure, and 6) the
intercept of smoking and the slope of leisure-time physical activity energy expenditure.
Although covariance estimates indicate the direction and significance of the association
between an independent and dependent variable, the strength of this relationship is
difficult to interpret (H. Frank & Althoen, 1994; Kitchens, 1998). In an attempt to
determine the strength of each covariance, correlations were also calculated. Thus, to
correspond with each covariance, six correlations were included in each parallel process

93
model. Similar to the unconditional models, model fit was evaluated by the following fit
indices; chi-square goodness-of-fit statistic, CFI, SRMR and RMSEA.

94
Smoking 1
Smoking 2
Smoking 3
Smoking 4
Smoking 5
Smoking 6
Smoking 7
Physical Activity 1
Physical Activity 2
Physical Activity 3
Physical Activity 4
Physical Activity 5
Physical Activity 6
Physical Activity 7
Smoking
Intercept
Smoking
Slope
Physical Activity
Intercept
Physical Activity
Slope
1
2
3
4
5
6
Figure 2: Parallel Process Growth Curve Model: Leisure-Time Physical Activity and Smoking
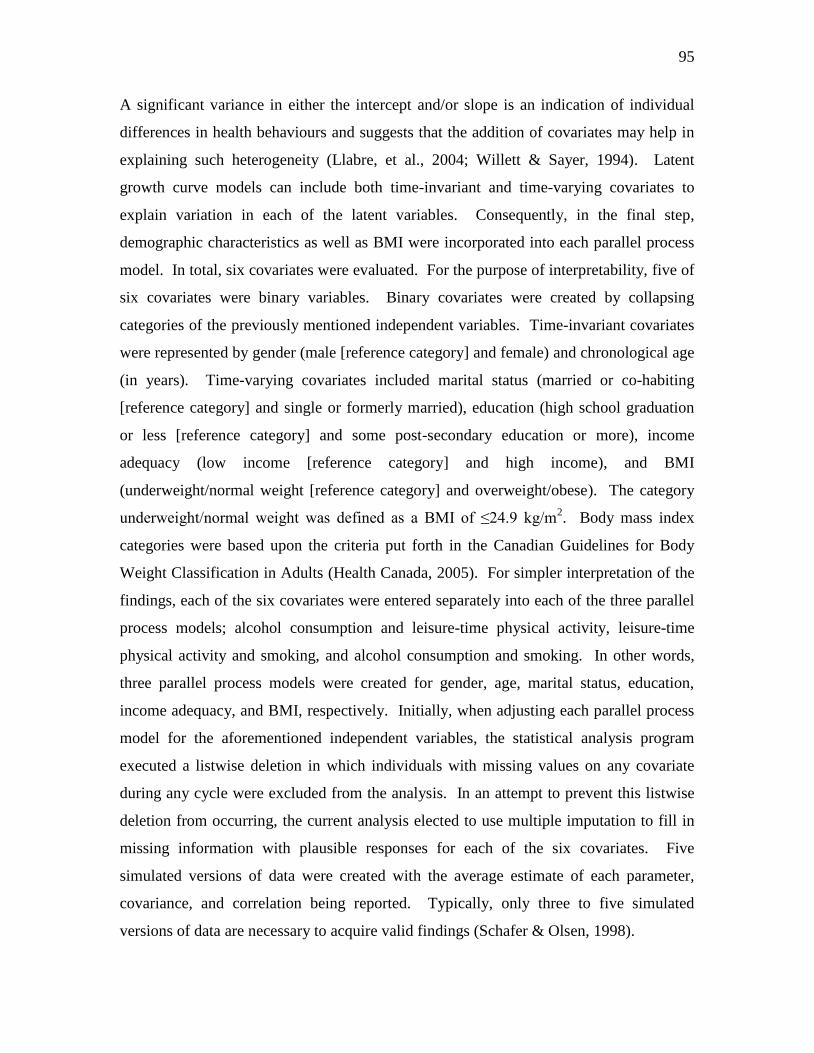
95
A significant variance in either the intercept and/or slope is an indication of individual
differences in health behaviours and suggests that the addition of covariates may help in
explaining such heterogeneity (Llabre, et al., 2004; Willett & Sayer, 1994). Latent
growth curve models can include both time-invariant and time-varying covariates to
explain variation in each of the latent variables. Consequently, in the final step,
demographic characteristics as well as BMI were incorporated into each parallel process
model. In total, six covariates were evaluated. For the purpose of interpretability, five of
six covariates were binary variables. Binary covariates were created by collapsing
categories of the previously mentioned independent variables. Time-invariant covariates
were represented by gender (male [reference category] and female) and chronological age
(in years). Time-varying covariates included marital status (married or co-habiting
[reference category] and single or formerly married), education (high school graduation
or less [reference category] and some post-secondary education or more), income
adequacy (low income [reference category] and high income), and BMI
(underweight/normal weight [reference category] and overweight/obese). The category
underweight/normal weight was defined as a BMI of ≤24.9 kg/m2. Body mass index
categories were based upon the criteria put forth in the Canadian Guidelines for Body
Weight Classification in Adults (Health Canada, 2005). For simpler interpretation of the
findings, each of the six covariates were entered separately into each of the three parallel
process models; alcohol consumption and leisure-time physical activity, leisure-time
physical activity and smoking, and alcohol consumption and smoking. In other words,
three parallel process models were created for gender, age, marital status, education,
income adequacy, and BMI, respectively. Initially, when adjusting each parallel process
model for the aforementioned independent variables, the statistical analysis program
executed a listwise deletion in which individuals with missing values on any covariate
during any cycle were excluded from the analysis. In an attempt to prevent this listwise
deletion from occurring, the current analysis elected to use multiple imputation to fill in
missing information with plausible responses for each of the six covariates. Five
simulated versions of data were created with the average estimate of each parameter,
covariance, and correlation being reported. Typically, only three to five simulated
versions of data are necessary to acquire valid findings (Schafer & Olsen, 1998).

96
The secondary objective of the current study was to examine whether mastery acts as a
mediating cognitive mechanism that facilitates successful changes within multiple health
behaviours. In a causal association, an independent variable can influence a dependent
variable either through a direct pathway or an indirect pathway which involves the
inclusion of a mediating variable (MacKinnon, Fairchild, & Fritz, 2007). A variable acts
as a mediator if it partially or completely accounts for a causal association between an
independent and dependent variable (Baron & Kenny, 1986; MacKinnon, et al., 2007).
The mediation of a variable is determined by evaluating whether the latent slope of the
independent variable significantly influences the latent slope of the mediating variable
and consequently significantly affects the growth of the dependent variable (MacKinnon,
2008; MacKinnon, et al., 2007). Parallel process models can be utilized to test for the
potential mediating effects of variables such as mastery (Cheong, Mackinnon, & Khoo,
2003; MacKinnon, 2008). Figure 3 depicts a parallel process growth curve mediation
model in which mastery mediates the interrelationship of the independent variable
represented by smoking and the dependent variable denoted by leisure-time physical
activity energy expenditure. To simplify Figure 3, the repeated measures of smoking,
mastery, and leisure-time physical activity energy expenditure were not shown. In Figure
3, the indirect effect (αß) was the product of the coefficients between the slopes of the
independent and mediating variables (α) and the slopes of the mediating and dependent
variables (ß) (MacKinnon, et al., 2007; Rucker, Preacher, Tormala, & Petty, 2011). This
approach to testing mediation is recommended (Cheung & Lau, 2008). A significant
indirect effect is an indication that mastery mediates the interrelationship between health
behaviours (Cheung & Lau, 2008). The direct effect, represented by ť, is the relationship
between the slopes of independent and dependent variables after accounting for the slope
of the mediating variable (Rucker, et al., 2011).
The assessment of a mediating variable is very similar to the evaluation of the
interrelationship of health behaviours. Initially, the trajectory of each health behaviour as
well as mastery was modelled independently across time (Cheong, et al., 2003;
MacKinnon, 2008). After which, each longitudinal health behaviour was modelled
simultaneously with mastery (Cheong, et al., 2003; MacKinnon, 2008). Once again,
model fit was assessed by the chi-square goodness-of-fit statistic, CFI, SRMR and

97
RMSEA. The direct and indirect effects were calculated for each parallel process
mediation model. In total, six mediation models were evaluated: 1) alcohol consumption
and physical activity, 2) physical activity and alcohol consumption, 3) physical activity
and smoking, 4) smoking and physical activity, 5) alcohol consumption and smoking, and
6) smoking and alcohol consumption.

98
Figure 3: Mediation Growth Curve Model: Smoking, Mastery, and Physical Activity
Smoking
Intercept
Physical Activity
Intercept
Physical Activity
Slope
Mastery
Intercept
Mastery
Slope
Smoking
Slope
α
ß
ť

99
Univariate analyses, the prevalence rates of single and multiple behaviours, and the
logistic regression modelling were conducted using Statistical Package for the Social
Sciences (SPSS Software, 2009). Latent growth curve models were developed with
MPLUS version 5.2 (L. K. Muthen & Muthen, 2010). Longitudinal sampling weights
developed by Statistics Canada were utilized for this statistical analysis. Omitting such
weights can result in selection bias (Asparouhov, 2005) as estimates would not be
reflective of the Canadian general population at 1994/1995 (Statistics Canada, 2008).
Bias-corrected 99% confidence intervals were requested for each latent growth curve
model as such intervals “take non-normality of the parameter estimate distribution into
account” (L. K. Muthen & Muthen, 1998-2011, pg. 613). Furthermore, when testing
mediation, bias-corrected confidence intervals should be calculated and reported as the
indirect effect is typically not normally distributed (Cheung & Lau, 2008). Due to the
substantial sample size of the NPHS, the level of significance for this research study was
established at 0.01. This study received ethics approval from the SSHRC of Canada as
well as the University of Toronto.

100
Chapter 4
Results
4.1 Inclusion and Exclusion Criteria:
Initially, 17,276 Canadians were recruited to participate in the longitudinal NPHS.
However, for the purpose of this study, 2,022 Canadians were excluded from the analysis
as they represented individuals who were under the age of 12 at cycle 1. An additional
87 Canadians were excluded as they were unable or unwilling to provide at least one
valid response for any one of the three health behaviours of interest. The remaining
individuals within the NPHS database were 12 years of age or older at baseline and
provided at least one valid response for either alcohol consumption, leisure-time physical
activity energy expenditure, or smoking behaviour. Consequently, it was these 15,167
Canadians that were the focus of this longitudinal analysis.
4.2 Attrition:
In an attempt to differentiate between individuals who had completed the NPHS at cycle
7 and those who declined or were incapable of fully completing the longitudinal survey,
demographic, cognitive-behavioural, behavioural and physical health characteristics were
evaluated in a logistic regression. Odds ratios and corresponding 99% confidence
intervals are reported in Table 12 for each characteristic of interest. The likelihood that
individuals participated in the seventh cycle of the NPHS was increased among
Canadians who were younger, married or formerly married, better educated, with a
higher income adequacy, and a greater BMI score at the first cycle. Those individuals
with higher levels of self perceived mastery at baseline were also more likely to complete
the NPHS at the seventh cycle. In regards to behavioural characteristics, leisure-time
physical activity energy expenditure was unrelated to participating in the NPHS at the
final follow-up. However, that was not the case for smoking and alcohol consumption as
these two behaviours demonstrated significant associations with the attrition variable.
Smoking was associated with participation such that with every additional cigarette
smoked per day, the likelihood of participation in the seventh cycle decreased by 1%.
Contrary to smoking, greater quantities of alcohol consumption was associated with an

101
increased probability of participating in the seventh cycle of the NPHS. Finally, the odds
of remaining in the NPHS at the seventh cycle were reduced by 7% for every additional
physical health condition that an individual reported. The implications of these attrition
results could be substantial. As attrition appears to influence specific individuals, the
generalizability of these findings in the later cycles is debatable. In addition, the
covariances and correlations discussed in the following paragraphs could be subjected to
bias as Canadians who were less likely to adopt smoking cessation or consume higher
quantities of alcohol demonstrated a greater likelihood of withdrawing from this analysis
during the seventh cycle.

102
Table 12: Baseline Characteristics that Predict Participation at the Seventh
Cycle (n = 12,349)
Odds Ratio 99% CI
Demographic Characteristics
Gender:
Male 1.00
Female 1.05 0.92 – 1.20
Chronological Age (Years) 0.97 * 0.96 – 0.97
Marital Status:
Single 1.00
Married or Common-Law 1.57 * 1.31 – 1.88
Formerly Married 1.71 * 1.35 – 2.17
Education:
Less than Secondary School 1.00
Secondary School Graduation 1.20 0.96 – 1.51
Some Post-Secondary School 1.46 * 1.21 – 1.76
Post-Secondary School Graduation 1.73 * 1.43 – 2.09
Income Adequacy:
Lowest Income 1.00
Lower Middle Income 1.49 * 1.21 – 1.85
Upper Middle Income 1.91 * 1.57 – 2.33
Highest Income 2.76 * 2.11 – 3.60
Body Mass Index (Kg/M2) 1.02 * 1.00 – 1.03
Cognitive-Behavioural Characteristics
Mastery 1.02 * 1.00 – 1.03
Behavioural Characteristics
Alcohol Consumption (Drinks/Day) 1.08 * 1.01 – 1.16
Leisure-Time Physical Activity
(Kg/Kcal/Day) 0.99 0.96 – 1.02
Smoking (Cigarettes/Day) 0.99 * 0.98 – 1.00
Physical Health Characteristics
Number of Chronic Conditions 0.93 * 0.88 – 0.98 * Significant at p ≤ 0.01.

103
4.3 Sample Characteristics:
Weighted demographic, cognitive-behavioural as well as behavioural characteristics for
this Canadian sample are illustrated in Table 13. In 1994/1995, a slight majority of this
sample was female. On average, the age of this sample increased from 41 years at the
first cycle to 51 years at the seventh cycle. The majority of Canadians, 58.9%, were
married at the first assessment period. Single individuals represented 29.0% while 12.2%
of the sample was comprised of formerly married individuals; those Canadians who were
widowed, separated or divorced. By 2006/2007, the proportion of married and formerly
married individuals had increased to 66.5 and 18.0%, respectively, whereas the
percentage of single individuals had decreased to 15.4%. Individuals appeared to have
attained higher levels of education over the 12 year period. Those who had acquired
some post-secondary schooling increased by 2.5%, while the percentage of individuals
who had graduated from post-secondary school increased from 28.7 to 44.7%. Income
adequacy seems to improve between 1994/1995 to 2006/2007 as the highest income
category increased from 15.1% in the first cycle to 25.6% in the seventh cycle. With the
exception of the missing category, the remaining income adequacy groupings decreased
substantially over the 12 year time period. Attrition could have been responsible for this
trend in income adequacy as the proportion of Canadians within the missing category
increased over time. Over 12 years, the average BMI score increased from 24.8±4.6
kg/m2 to 26.6±5.0 kg/m
2. Consequently, the proportion of Canadians who were
considered overweight or obese (≥25 kg/m2) increased from 44.0 to 60.3%. Mastery, a
cognitive-behavioural variable, reported mean scores ranging between 19.6±4.3 to
19.9±3.8. Daily alcohol consumption remained fairly stable during the first three cycles
before increasing slightly at the fourth cycle. By the seventh cycle, an additional rise in
the daily consumption of alcohol had occurred. Daily leisure-time physical activity
energy expenditure exhibited an overall increasing trend. Deviations from this increasing
trend were observed at cycle 4 and cycle 6. Among each of three health behaviours
evaluated, smoking behaviour, measured by the number of cigarettes smoked per day,
was the only behaviour to decrease during the longitudinal cycles. Smoking behaviour
decreased from a peak of 4.7±9.5 cigarettes per day at the first cycle to a low of 2.7±6.7
cigarettes per day by the seventh cycle.

104
Table 13: Weighted Demographic, Cognitive-Behavioural, and Behavioural Characteristics
Cycle 1 Cycle 2 Cycle 3 Cycle 4 Cycle 5 Cycle 6 Cycle 7
n = 15,167 n = 13,953 n = 12,900 n = 11,938 n = 10,976 n =10,112 n = 9,728
Gender (%):
Male 49.0 49.1 49.0 48.2 47.9 47.6 48.0
Female 51.0 50.9 51.0 51.8 52.1 52.4 52.0
Age (Mean±SD): 40.9±18.5 42.7±18.3 44.4±18.1 46.1±17.8 47.6±17.5 49.4±17.0 50.9±16.6
Age (Median): 39.0 40.0 42.0 44.0 46.0 48.0 49.0
Marital Status (%):
Married or Common-Law 58.9 58.9 59.8 61.1 62.9 65.1 66.5
Single 29.0 27.7 25.5 23.1 20.4 17.7 15.4
Formerly Married 12.2 13.4 14.8 15.7 16.7 17.2 18.0
Education (%):
Less Than Secondary School 33.4 29.3 25.0 20.8 18.5 17.6 16.6
Secondary School Grad. 14.8 14.9 15.0 14.6 14.1 13.4 13.1
Some Post-Secondary School 23.1 25.6 27.4 28.4 27.5 26.1 25.6
Post-Secondary School Grad. 28.7 30.1 32.7 36.2 39.9 42.9 44.7
Income Adequacy (%):
Lowest Income 17.0 13.0 10.0 7.5 5.9 4.4 3.1
Lower Middle Income 28.7 25.9 20.6 15.3 12.9 10.7 8.4
Upper Middle Income 34.2 33.0 29.6 26.8 23.5 20.7 18.3
Highest Income 15.1 12.9 18.6 20.7 22.6 24.0 25.6
Missing Income 5.0 15.2 21.1 29.7 35.2 40.1 44.6

105
Table 13: Weighted Demographic, Cognitive-Behavioural, and Behavioural Characteristics Continued
Cycle 1 Cycle 2 Cycle 3 Cycle 4 Cycle 5 Cycle 6 Cycle 7
n = 15,167 n = 13,953 n = 12,900 n = 11,938 n = 10,976 n =10,112 n = 9,728
Body Mass Index (Kg/M2)
(Mean±SD): 24.8±4.6 25.0±4.5 25.4±4.5 25.8±4.7 26.1±4.9 26.3±4.8 26.6±5.0
Body Mass Index (Kg/M2)
(Median): 24.2 24.5 24.9 25.2 25.6 25.7 25.9
Body mass index (%):
Under or Normal Weight 56.0 53.6 50.6 46.7 44.0 42.4 39.7
Overweight or Obese 44.0 46.4 49.4 53.3 56.0 57.6 60.3
Mastery (Mean±SD): 19.6±4.3 - - 19.9±3.8 19.6±3.9 19.7±4.0 19.8±4.0
Mastery (Median): 20.0 - - 21.0 20.0 20.0 21.0
Alcohol Consumption
(Drinks/Day) (Mean±SD): 0.4±0.9 0.4±0.9 0.4±0.9 0.5±0.9 0.5±1.0 0.5±1.0 0.6±1.1
Alcohol Consumption
(Drinks/Day) (Median): 0.0 0.0 0.0 0.0 0.0 0.0 0.0
Leisure-Time Physical Activity
(Kcal/Kg/Day) (Mean±SD): 1.8±2.1 1.8±2.2 1.9±2.1 1.7±1.8 2.0±1.9 1.9±1.9 2.1±2.0
Leisure-Time Physical Activity
(Kcal/Kg/Day) (Median): 1.1 1.2 1.3 1.2 1.5 1.4 1.6
Smoking (Cigarettes/Day)
(Mean±SD): 4.7±9.5 4.5±8.9 4.2±8.3 3.8±7.8 3.1±7.1 2.9±6.9 2.7±6.7
Smoking (Cigarettes/Day)
(Median): 0.0 0.0 0.0 0.0 0.0 0.0 0.0

106
4.4 Prevalence of Single and Multiple Health Behaviours:
Table 14 examines the prevalence of unhealthy behaviours at each cycle of data
collection. The calculated prevalence rates indicate the percentage of individuals who
participated in a particular unhealthy behaviour regardless of whether any additional
behaviours may or may not have been present. The proportion of Canadians who were
physically inactive, < 3.0 kcal/kg/day, significantly decreased from 80.4% in 1994/1995
to 73.5% in 2006/2007. Similar to leisure-time physical inactivity, smoking behaviour
also demonstrated a favourable trend between 1994/1995 and 2006/2007. During the
first four cycles of data collection, the percentage of daily and occasional smokers in this
Canadian sample decreased by only 2.5%. However, by the seventh cycle, smokers
represented only 21.3% of the current sample; a difference of 8.0% from the initial data
collection period. Excessive alcohol consumption was the only behaviour that did not
exhibit an encouraging trend throughout the full duration of the NPHS. The proportion
of individuals participating in excessive alcohol consumption, ≥ 15 and ≥ 10 drinks per
week for males and females, respectively, increased from 5.7 to 7.9% by the fifth cycle.
At the seventh assessment period, excessive alcohol consumption had increased to 9.4%
within the current sample.

107
Table 14: Weighted Sample Size and Prevalence of Unhealthy Behaviours
Cycle 1 Cycle 2 Cycle 3 Cycle 4 Cycle 5 Cycle 6 Cycle 7
n % n % n % n % n % N % n %
Excessive Alcohol
Consumption 834 5.7 796 5.8 779 6.2 678 7.0 704 7.9 593 7.2 711 9.4 *
Leisure-Time Physical
Inactivity 11,108 80.4 10,789 79.8 9,745 78.4 9,274 81.5 8,013 77.1 7,561 77.8 6,543 73.5 *
Smoking 4,301 29.3 3,993 29.0 3,525 27.7 3,169 26.8 2,547 23.6 2,193 21.9 2,009 21.3 * *Difference between cycle 1 and cycle 7 was significant at p ≤ 0.01.

108
The prevalence rates of single as well as multiple unhealthy behaviours at each data
collection cycle are illustrated in Table 15. In 1994/1995, 13.7% of the Canadian sample
had not participated in any unhealthy behaviour including excessive alcohol
consumption, physical inactivity, and daily or occasional smoking behaviour. Over the
remaining six cycles, the percentage of individuals possessing no unhealthy behaviours
increased. This rise in prevalence rates appeared to be most evident between cycles 4 and
5. By the seventh cycle, nearly 20% of Canadians practiced all three healthy lifestyle
behaviours; ≤ 14 and ≤ 9 alcoholic beverages per week for males and females,
respectively, leisure-time physical activity of ≥ 3.0 kcal/kg/day, as well as non-smoking.
Physical inactivity was the most prevalent independent unhealthy behaviour as the
majority of Canadians, 52.0 to 55.8%, were physically inactive. Physical inactivity
peaked at 55.8% during the sixth cycle before decreasing to 52.0% by the seventh cycle.
Canadians who were exclusively smokers, either daily or occasional, ranged from 4.1 to
5.0%, while a small minority, 0.6 to 2.2%, of this Canadian sample only participated in
excessive alcohol consumption.
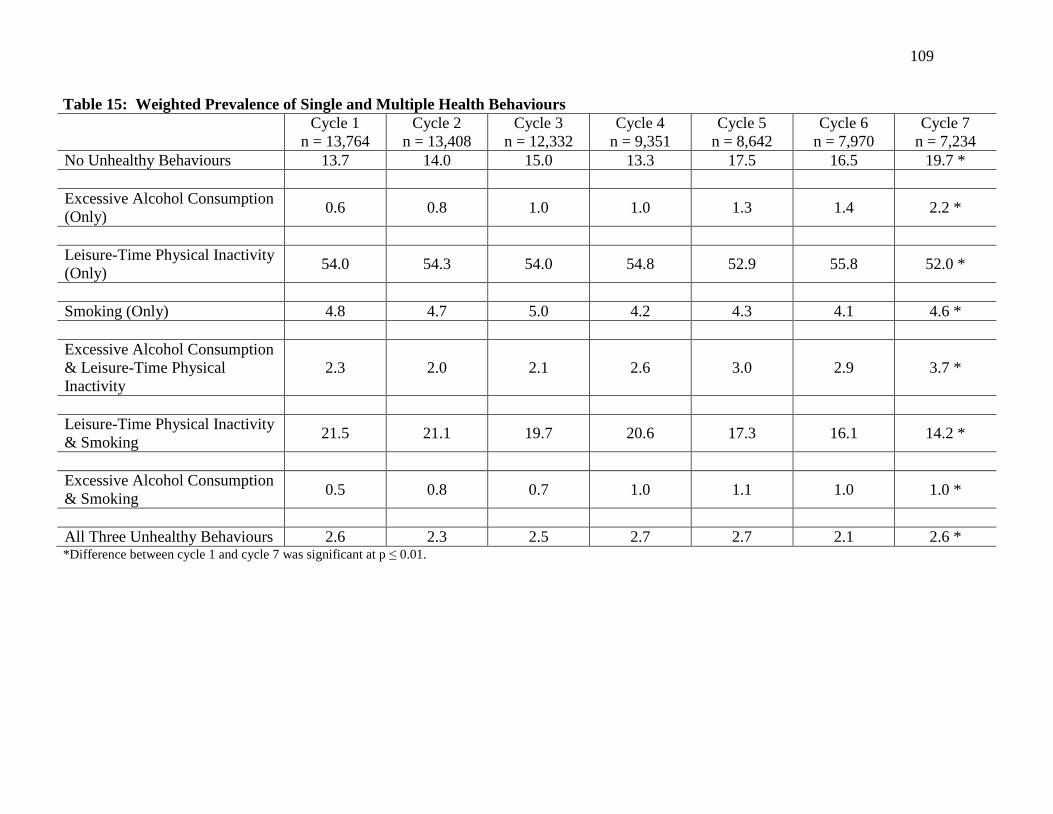
109
Table 15: Weighted Prevalence of Single and Multiple Health Behaviours
Cycle 1 Cycle 2 Cycle 3 Cycle 4 Cycle 5 Cycle 6 Cycle 7
n = 13,764 n = 13,408 n = 12,332 n = 9,351 n = 8,642 n = 7,970 n = 7,234
No Unhealthy Behaviours 13.7 14.0 15.0 13.3 17.5 16.5 19.7 *
Excessive Alcohol Consumption
(Only) 0.6 0.8 1.0 1.0 1.3 1.4 2.2 *
Leisure-Time Physical Inactivity
(Only) 54.0 54.3 54.0 54.8 52.9 55.8 52.0 *
Smoking (Only) 4.8 4.7 5.0 4.2 4.3 4.1 4.6 *
Excessive Alcohol Consumption
& Leisure-Time Physical
Inactivity
2.3 2.0 2.1 2.6 3.0 2.9 3.7 *
Leisure-Time Physical Inactivity
& Smoking 21.5 21.1 19.7 20.6 17.3 16.1 14.2 *
Excessive Alcohol Consumption
& Smoking 0.5 0.8 0.7 1.0 1.1 1.0 1.0 *
All Three Unhealthy Behaviours 2.6 2.3 2.5 2.7 2.7 2.1 2.6 * *Difference between cycle 1 and cycle 7 was significant at p ≤ 0.01.

110
The most common pairwise combination of unhealthy behaviours was physical inactivity
and smoking (Table 15). In 1994/1995, nearly one quarter of this Canadian sample were
physically inactive and smoking. With time, the proportion of physically inactive
smokers had decreased to 14.2% in 2006/2007. Additional pairwise combinations of
unhealthy behaviours were reported among a small minority of this Canadian sample.
Physically inactive consumers of excessive alcohol ranged from 2.0 to 3.7%, while
smokers who consumed high levels of alcoholic beverages represented 0.5 to 1.1% of this
Canadian sample. Finally, approximately 2.5% of Canadians practiced all three
unhealthy behaviours; excessive alcohol consumption, leisure-time physical inactivity,
and smoking. Although a significant difference was observed between cycles 1 and 7,
the prevalence rate of possessing all three unhealthy behaviours appeared to be fairly
consistent over each of the seven cycles of data collection.
4.5 Unconditional Growth Curve Models of Health Behaviours:
Unconditional growth curve models were developed to track the longitudinal trajectories
of alcohol consumption, leisure-time physical activity energy expenditure, and smoking.
Univariate analyses revealed that each of the three health behaviours demonstrated
substantial skewness and kurtosis (Table 16). A significant Kolmogorov-Smirnov test
statistic (p < 0.001) provided further evidence that the assumption of normality was
violated for all three health behaviours across all seven time periods. However,
maximum likelihood estimation can provide accurate estimates notwithstanding
violations of normality (Olsson, et al., 2000). In addition, the use of bootstrapping
procedures that calculate confidence intervals has been suggested for analyzing non-
normally distributed data (Bollen & Stine, 1990). To determine if contradictory findings
would be obtained through the use of normally distributed data, this study incorporated a
supplementary data analysis in which the observed repeated measures underwent a
logarithmic transformation. Re-analyzing the unconditional, parallel process, and
mediation models utilizing this logarithmically transformed data produced results that
were comparable to the original findings.
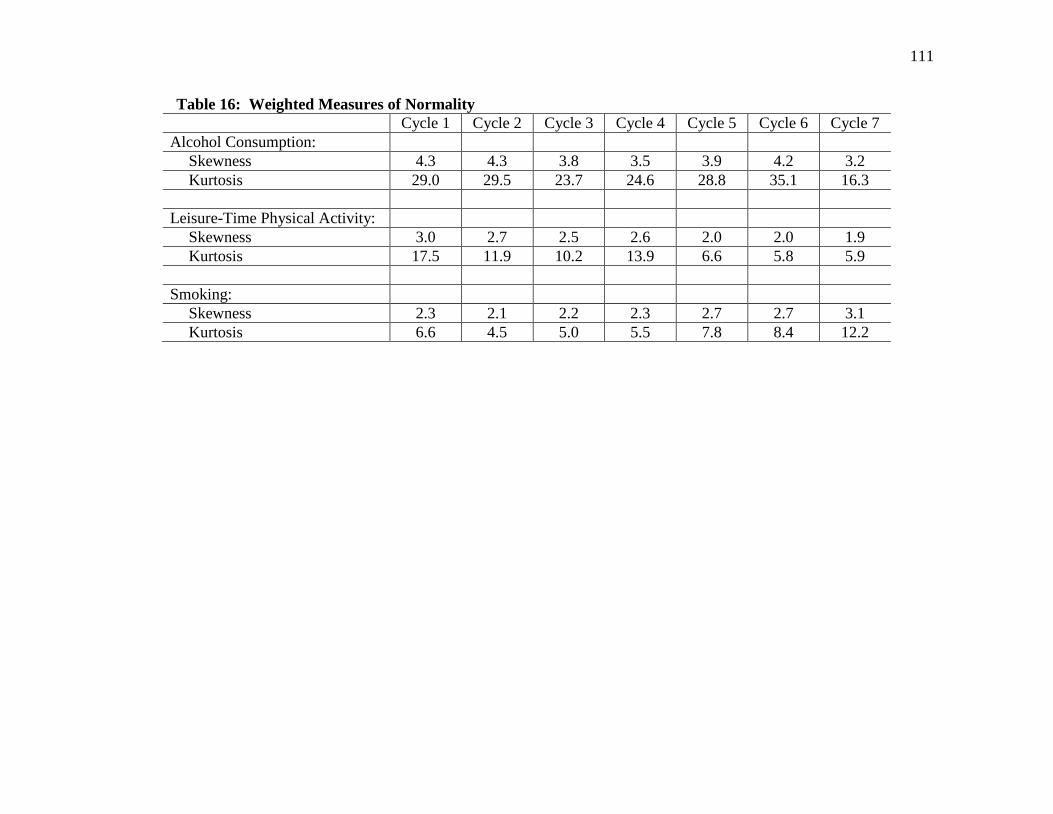
111
Table 16: Weighted Measures of Normality
Cycle 1 Cycle 2 Cycle 3 Cycle 4 Cycle 5 Cycle 6 Cycle 7
Alcohol Consumption:
Skewness 4.3 4.3 3.8 3.5 3.9 4.2 3.2
Kurtosis 29.0 29.5 23.7 24.6 28.8 35.1 16.3
Leisure-Time Physical Activity:
Skewness 3.0 2.7 2.5 2.6 2.0 2.0 1.9
Kurtosis 17.5 11.9 10.2 13.9 6.6 5.8 5.9
Smoking:
Skewness 2.3 2.1 2.2 2.3 2.7 2.7 3.1
Kurtosis 6.6 4.5 5.0 5.5 7.8 8.4 12.2

112
4.5.1 Alcohol Consumption:
Table 17 presents the correlation coefficients for alcohol consumption across the seven
cycles of data collection. Correlations between alcohol consumption measures were
positive and typically demonstrated a decreasing trend across the seven cycles of data
collection.
Table 17: Correlation Coefficients for Alcohol Consumption
Cycle 1:
Alcohol
Cycle 2:
Alcohol
Cycle 3:
Alcohol
Cycle 4:
Alcohol
Cycle 5:
Alcohol
Cycle 6:
Alcohol
Cycle 7:
Alcohol
Cycle 1: Alcohol 1.00
Cycle 2: Alcohol 0.55 1.00
Cycle 3: Alcohol 0.48 0.52 1.00
Cycle 4: Alcohol 0.39 0.44 0.49 1.00
Cycle 5: Alcohol 0.41 0.43 0.45 0.50 1.00
Cycle 6: Alcohol 0.42 0.43 0.43 0.49 0.56 1.00
Cycle 7: Alcohol 0.45 0.49 0.44 0.51 0.57 0.63 1.00
Initially, a linear model was estimated from the seven repeated measures of alcohol
consumption. In Table 18, a significant chi-square statistic (X2[23] = 601.47, p < 0.01)
indicated poor fit for the linear model of alcohol consumption. However, a significant
chi-square statistic was expected due to the substantial sample size employed for this
analysis. The remaining fit indices in Table 18 demonstrated good fit for the linear
model of alcohol consumption; CFI = 0.98, RMSEA = 0.04 (90% CI = 0.04 – 0.04), and
SRMR = 0.03.
113
Table 18: Fit Indices for Unconditional and Parallel Process Models
X2 (df) CFI RMSEA
90% CI for
RMSEA SRMR
Alcohol Consumption 601.47 (23) * 0.98 0.04 0.04 – 0.04 0.03
Physical Activity 738.12 (23) * 0.97 0.05 0.04 - 0.05 0.03
Smoking 2590.28 (23) * 0.97 0.09 0.08 – 0.09 0.03
Alcohol Consumption &
Physical Activity 1620.01 (91) * 0.97 0.03 0.03 – 0.04 0.03
Physical Activity &
Smoking 3459.53 (91) * 0.97 0.05 0.05 – 0.05 0.02
Alcohol Consumption &
Smoking 3655.01 (91) * 0.97 0.05 0.05 – 0.05 0.03
* Significant at p ≤ 0.01.
A quadratic model was also developed to determine whether alcohol consumption
demonstrated a non-linear trajectory. A significant chi-square difference test, X2(4) =
326.37, p < 0.001, confirmed that a quadratic model would provide superior fit in
depicting the trajectory of alcohol consumption over a linear model. However, for
reasons threefold, this analysis elected to employ a linear model to represent alcohol
consumption. First, as depicted in Figure 4, the observed trajectory of alcohol
consumption appears to increase in a linear fashion. Second, as indicated by the CFI,
RMSEA, and SRMR, the linear model demonstrated good fit for the observed alcohol
consumption data. Finally, compared to the linear analysis, the quadratic model includes
an additional growth factor. The inclusion of this second growth factor increases the
complexity of the model and consequently may produce findings that could become
difficult to interpret.

114
Figure 4: Observed and Estimated Trajectories of Alcohol Consumption

115
The estimated means, variances, covariance and correlation for alcohol consumption are
presented in Figure 5. In this sample of Canadians, the mean intercept of the linear
model was 0.38 drinks per day (99% CI = 0.36 – 0.39, p < 0.01). The significant (p <
0.01) positive mean slope for alcohol consumption suggests that this sample of Canadians
increased their alcohol consumption by 0.03 drinks per day (99% CI = 0.02 – 0.03) at
each cycle of data collection. A significant variance in both the intercept and slope for
alcohol consumption was indicative of substantial inter-individual variability that could
be accounted for by the addition of time-invariant and/or time-varying covariates. The
significant negative covariance (cov = -0.02, 99% CI = -0.03 – [-0.01], p < 0.01) between
the intercept and slope of alcohol consumption revealed that Canadians who initially
drank a greater number of alcohol beverages per day increased their consumption at a
slower or flatter rate compared to their counterparts who initially drank lower quantities
of alcohol. The estimated correlation between the latent variables of alcohol
consumption (r = -0.23) indicated a weak relationship between the intercept and slope.

116
Figure 5: Linear Growth Curve Model of Alcohol Consumption (n = 15,153)
Alcohol
Consumption
1
Alcohol
Consumption
2
Alcohol
Consumption
3
Alcohol
Consumption
4
Alcohol
Consumption
5
Alcohol
Consumption
6
Alcohol
Consumption
7
Alcohol Consumption
Intercept
Mean = 0.38 *
Variance = 0.45 *
1 1
1
1 1 1
1 0
1 2 3 4 5 6
cov = -0.02 * Alcohol Consumption
Slope
Mean = 0.03 *
Variance = 0.01 *
99% CI = -0.03 – (-0.01)
cov: Covariance; CI: Confidence Interval; r: Correlation.
99% Confidence intervals correspond to the covariance. Factor loadings were predetermined.
* Significant at p ≤ 0.01.
r = -0.23

117
4.5.2 Leisure-Time Physical Activity Energy Expenditure:
As presented in Table 19, correlations between the repeated measures for leisure-time
physical activity energy expenditure were positive and decreased in strength with the
passage of time.
Table 19: Correlation Coefficients for Leisure-Time Physical Activity
Cycle 1:
Physical
Activity
Cycle 2:
Physical
Activity
Cycle 3:
Physical
Activity
Cycle 4:
Physical
Activity
Cycle 5:
Physical
Activity
Cycle 6:
Physical
Activity
Cycle 7:
Physical
Activity
Cycle 1: Physical
Activity 1.00
Cycle 2: Physical
Activity 0.47 1.00
Cycle 3: Physical
Activity 0.44 0.48 1.00
Cycle 4: Physical
Activity 0.37 0.41 0.47 1.00
Cycle 5: Physical
Activity 0.35 0.39 0.43 0.49 1.00
Cycle 6: Physical
Activity 0.34 0.36 0.36 0.43 0.50 1.00
Cycle 7: Physical
Activity 0.31 0.35 0.38 0.41 0.45 0.52 1.00
As illustrated in Table 18, although a significant chi-square statistic was observed,
X2(23) = 738.12, p < 0.01, the linear model for leisure-time physical activity revealed
good fit; CFI = 0.97, RMSEA = 0.05 (90% CI = 0.04 – 0.05), and SRMR = 0.03. A
significant chi-square difference test, X2(4) = 205.29, p < 0.01, indicated that the addition
of a quadratic factor would improve the fit of the leisure-time physical activity model.
However, as with alcohol consumption, this analysis elected to utilize a linear model to
represent leisure-time physical activity energy expenditure. The observed and estimated
linear trajectories for leisure-time physical activity are represented in Figure 6.
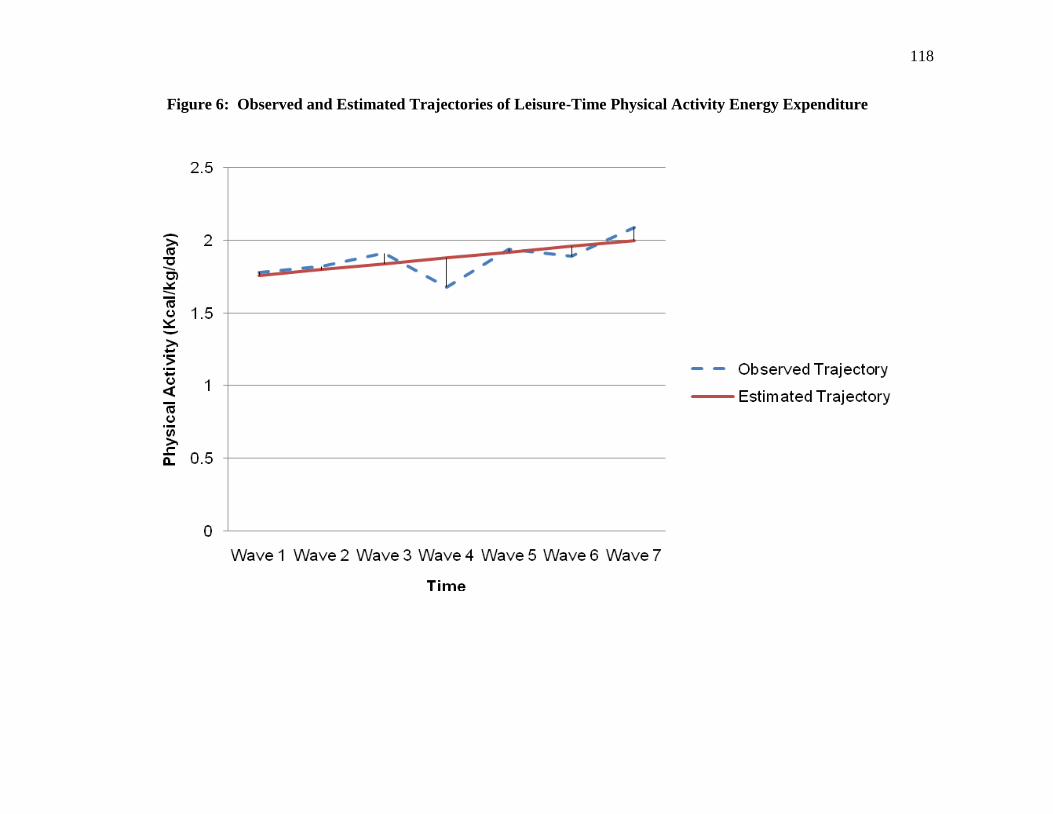
118
Figure 6: Observed and Estimated Trajectories of Leisure-Time Physical Activity Energy Expenditure

119
As depicted in Figure 7, the mean intercept of leisure-time physical activity energy
expenditure was 1.76 kcal/kg/day (99% CI = 1.71 – 1.80, p < 0.01). A significant
positive trend (p < 0.01) in leisure-time physical activity was observed as Canadians
increased their physical activity energy expenditure by 0.04 kcal/kg/day (99% CI = 0.03
– 0.05) biennially. Both the intercept and slope of physical activity demonstrated
significant variances indicating inter-individual variability. The significant negative
covariance (cov = -0.18, 99% CI = -0.22 – [-0.15], p < 0.01) between the intercept and
slope of leisure-time physical activity energy expenditure suggests that those Canadians
who initially reported high levels of leisure-time physical activity increased their energy
expenditure at a slower rate. Conversely, Canadians participating in lower levels of
leisure-time physical activity in 1994/1995, reported greater increases in physical activity
over the subsequent cycles. The relationship between latent variables demonstrated
moderate strength as indicated by the correlation (r = -0.51).

120
Figure 7: Linear Growth Curve Model of Leisure-Time Physical Activity Energy Expenditure (n = 15,056)
Physical
Activity
1
Physical
Activity
2
Physical
Activity
3
Physical
Activity
4
Physical
Activity
5
Physical
Activity
6
Physical
Activity
7
Physical Activity
Intercept
Mean = 1.76 *
Variance = 2.31 *
1 1
1
1 1 1
1 0
1 2 3 4 5 6
cov = -0.18 * Physical Activity
Slope
Mean = 0.04 *
Variance = 0.05 *
99% CI = -0.22 – (-0.15)
r = -0.51
cov: Covariance; CI: Confidence Interval; r: Correlation.
99% Confidence intervals correspond to the covariance. Factor loadings were predetermined.
* Significant at p ≤ 0.01.

121
4.5.3 Smoking:
Similar to alcohol consumption and leisure-time physical activity, correlations for
smoking were positive and decreased in strength over time (Table 20).
Table 20: Correlation Coefficients for Smoking
Cycle 1:
Smoking
Cycle 2:
Smoking
Cycle 3:
Smoking
Cycle 4:
Smoking
Cycle 5:
Smoking
Cycle 6:
Smoking
Cycle 7:
Smoking
Cycle 1: Smoking 1.00
Cycle 2: Smoking 0.86 1.00
Cycle 3: Smoking 0.79 0.83 1.00
Cycle 4: Smoking 0.72 0.76 0.81 1.00
Cycle 5: Smoking 0.66 0.70 0.74 0.82 1.00
Cycle 6: Smoking 0.63 0.66 0.69 0.76 0.83 1.00
Cycle 7: Smoking 0.62 0.65 0.67 0.74 0.80 0.86 1.00
As depicted in Table 18, the linear model for smoking demonstrated adequate to
mediocre fit; CFI = 0.97, RMSEA = 0.09 (90% CI = 0.08 – 0.09), and SRMR = 0.03.
Although a significant chi-square difference test, X2(4) = 1510.07, p < 0.01, suggested
the use of an additional growth factor, this analysis opted to utilize a linear model. Both
the observed and estimated trajectories of smoking appear in Figure 8.
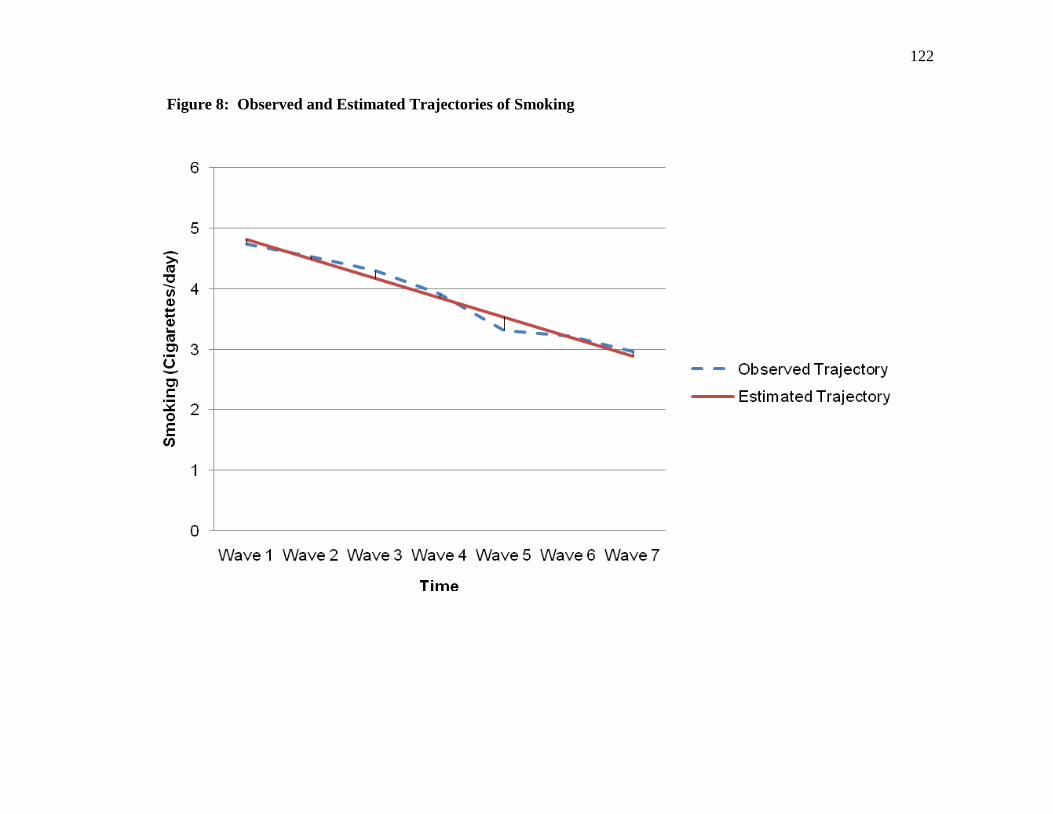
122
Figure 8: Observed and Estimated Trajectories of Smoking

123
In this sample of Canadians, the average number of cigarettes smoked per day in
1994/1995 was 4.81 (99% CI = 4.64 – 5.01, p < 0.01) (Figure 9). A significant negative
slope (p < 0.01) revealed that Canadians decreased their tobacco use by 0.32 cigarettes
per day (99% CI = -0.35 – [-0.29]) biennially. Both the intercept and slope for smoking
reported significant variances suggesting inter-individual variability. A significant
negative covariance (cov = -6.52, 99% CI = -7.34 – [-5.90], p < 0.01) implied that
Canadians who smoked a greater number of cigarettes per day in 1994/1995 reported a
greater or steeper decline in tobacco use in subsequent cycles compared to their
counterparts who smoked a lower quantity of cigarettes per day in 1994/1995. A strong
intercept-slope relationship (r = -0.67) was observed for smoking.

124
Figure 9: Linear Growth Curve Model of Smoking (n = 15,112)
Smoking 1
Smoking 2
Smoking 3
Smoking 4
Smoking 5
Smoking 6
Smoking 7
Smoking
Intercept
Mean = 4.81 *
Variance = 76.42 *
1 1
1
1 1 1
1 0
1 2 3 4 5 6
cov = -6.52 * Smoking
Slope
Mean = -0.32 *
Variance = 1.26 *
99% CI = -7.34 – (-5.90)
r = -0.67
cov: Covariance; CI: Confidence Interval; r: Correlation.
99% Confidence intervals correspond to the covariance. Factor loadings were predetermined.
* Significant at p ≤ 0.01.

125
4.6 Parallel Process Latent Growth Curve Models:
Once the trajectory of the three unconditional growth curve models was established,
cross-behavioural covariances and correlations were estimated by simultaneously
evaluating health behaviours using parallel process latent growth curve models. In total,
three parallel process latent growth curve models were developed: alcohol consumption
and leisure-time physical activity energy expenditure, leisure-time physical activity
energy expenditure and smoking, and alcohol consumption and smoking.
4.6.1 Alcohol Consumption and Leisure-Time Physical Activity Energy
Expenditure:
A parallel process latent growth curve model was developed by utilizing the linear
trajectories of alcohol consumption and leisure-time physical activity. As outlined in
Table 18, this model demonstrated good fit of the longitudinal data; CFI = 0.97, RMSEA
= 0.03 (90% CI = 0.03 – 0.04), and SRMR = 0.03. In Table 21, the correlation
coefficients between alcohol consumption and leisure-time physical activity energy
expenditure were positive and fairly consistent.

126
Table 21: Correlation Coefficients Between Alcohol Consumption and Leisure-Time
Physical Activity
Cycle 1:
Alcohol
Cycle 2:
Alcohol
Cycle 3:
Alcohol
Cycle 4:
Alcohol
Cycle 5:
Alcohol
Cycle 6:
Alcohol
Cycle 7:
Alcohol
Cycle 1:
Physical Activity 0.01 0.04 0.05 0.06 0.07 0.05 0.05
Cycle 2:
Physical Activity -0.02 x 10
-1 0.05 0.04 0.06 0.07 0.06 0.04
Cycle 3:
Physical Activity 0.01 0.02 0.06 0.09 0.10 0.05 0.05
Cycle 4:
Physical Activity 0.01 0.03 0.06 0.10 0.06 0.06 0.05
Cycle 5:
Physical Activity 0.01 0.03 0.05 0.06 0.09 0.07 0.05
Cycle 6:
Physical Activity 0.01 0.02 0.05 0.07 0.04 0.11 0.06
Cycle 7:
Physical Activity 0.03 0.02 0.05 0.06 0.05 0.06 0.06
Depicted in Figure 10, the covariances within the behavioural domains of alcohol
consumption and leisure-time physical activity energy expenditure were negative and
remained significantly different from zero (p < 0.01). Only two of the four cross-
behavioural covariances in Figure 10 were statistically significant. A significant
covariance was observed between the intercept of alcohol consumption and the intercept
of physical activity (cov = 0.05, 99% CI = 0.02 – 0.08, p < 0.01) suggesting that those
Canadians who reported higher levels of energy expenditure in 1994/1995 also consumed
higher quantities of alcohol. Conversely, Canadians participating in lower levels of
physical activity in 1994/1995 also consumed lower quantities of alcohol. The second
significant cross-behavioural covariance was observed between the intercept of physical
activity and the slope of alcohol consumption (cov = 0.02, 99% CI = 0.01 – 0.03, p <
0.01). Consequently, the higher the initial status of physical activity, the steeper the
positive trajectory of alcohol consumption became in subsequent cycles. On the other
hand, Canadians who initially reported lower levels of leisure-time physical activity
appeared to increase their consumption of alcohol at a slower rate over time. The other
intercept-slope covariance between alcohol consumption and leisure-time physical
activity was non-significant (cov = -0.03 x 10⁻¹
, 99% CI = -0.01 – 0.04 x 10⁻¹
, p > 0.01).
Of particular interest, the covariance between the slope of alcohol consumption and the

127
slope of physical activity did not reach statistical significance (cov = 0.01 x 10⁻¹
, 99% CI
= -0.01 x 10⁻¹
– 0.03 x 10⁻¹
, p > 0.01). Consequently, changes in physical activity, either
positive or negative, were not significantly associated with changes in alcohol
consumption. In conjunction with the covariances, correlations between latent variables
were also reported in Figure 10. In general, these correlations were relatively weak. The
only exception was observed for the intercept-slope correlation of leisure-time physical
activity energy expenditure (r = -0.51). Each of the four latent variables continued to
report significant variances suggesting inter-individual variability.

128
Figure 10: Parallel Process Model of Alcohol Consumption and Leisure-Time Physical Activity Energy Expenditure
(n = 15,162)
Alcohol Consumption
Intercept
Mean = 0.38 *
Variance = 0.45 *
Alcohol Consumption
Slope
Mean = 0.03 *
Variance = 0.01 *
Physical Activity
Intercept
Mean = 1.76 *
Variance = 2.30 *
Physical Activity
Slope
Mean = 0.04 *
Variance = 0.05 *
cov: Covariance; CI: Confidence Interval; r: Correlation.
99% Confidence intervals correspond to the covariance.
* Significant at p ≤ 0.01.
cov = -0.18 *
cov = -0.02 *
cov = 0.01 x 10⁻¹
cov = 0.05 * cov = -0.03 x 10⁻¹
cov = 0.02 *
99% CI = -0.03 – (-0.01)
99% CI = -0.22 – (-0.15)
99% CI = -0.01 x 10⁻¹
– 0.03 x 10⁻¹
99% CI = 0.02 – 0.08 99% CI = -0.01 – 0.04 x 10⁻¹
99% CI = 0.01 – 0.03
r = -0.23
r = 0.04
r = -0.51
r = -0.02 r = 0.11 r = 0.05

129
4.6.2 Leisure-Time Physical Activity Energy Expenditure and Smoking:
In Table 18, a parallel process latent growth curve model involving the linear trajectories
of both leisure-time physical activity energy expenditure and smoking demonstrated good
fit of the NPHS data; CFI = 0.97, RMSEA = 0.05 (90% CI = 0.05 – 0.05), and SRMR =
0.02. Correlations between physical activity and smoking for each data collection cycle
were negative and decreased in strength over time (Table 22).
Table 22: Correlation Coefficients Between Leisure-Time Physical Activity and
Smoking
Cycle 1:
Physical
Activity
Cycle 2:
Physical
Activity
Cycle 3:
Physical
Activity
Cycle 4:
Physical
Activity
Cycle 5:
Physical
Activity
Cycle 6:
Physical
Activity
Cycle 7:
Physical
Activity
Cycle 1: Smoking -0.08 -0.08 -0.08 -0.08 -0.08 -0.09 -0.07
Cycle 2: Smoking -0.06 -0.07 -0.07 -0.08 -0.08 -0.09 -0.06
Cycle 3: Smoking -0.05 -0.06 -0.06 -0.08 -0.07 -0.09 -0.07
Cycle 4: Smoking -0.02 -0.04 -0.03 -0.07 -0.06 -0.07 -0.06
Cycle 5: Smoking -0.02 -0.03 -0.03 -0.05 -0.07 -0.07 -0.06
Cycle 6: Smoking -0.04 x 10⁻¹
-0.01 -0.01 -0.03 -0.05 -0.07 -0.04
Cycle 7: Smoking -0.02 † -0.02 -0.04 -0.04 -0.05 -0.06 † Correlation was < 0.001.
Illustrated in Figure 11, the intercept-slope covariances for physical activity (cov = -0.18,
99% CI = -0.22 – [-0.14], p < 0.01) and smoking (cov = -6.52, 99% CI = -7.33 – [-5.82],
p < 0.01) continued to be negative and significantly different from zero. Three of the
four cross-behavioural covariances reached statistical significance. The significant
negative covariance between the intercepts of leisure-time physical activity and smoking
(cov = -1.51, 99% CI = -1.80 – [-1.21], p < 0.01) indicated that, in 1994/1995, Canadians
participating in higher levels of physical activity either smoked fewer cigarettes per day
or practiced abstinence from tobacco products. Alternatively, Canadians who
demonstrated lower levels of physical activity were found to smoke a greater quantity of
cigarettes. A significant positive covariance was observed between initial leisure-time
physical activity levels and the rate of change in smoking (cov = 0.27, 99% CI = 0.21 –
0.33, p < 0.01) suggesting that Canadians who participated in higher levels of physical
activity at baseline reported a flatter decline in the number of cigarettes smoked per day.
The covariance between the intercept of smoking and the slope of physical activity was

130
the only cross-behavioural covariance that did not reach statistical significance (cov =
0.01, 99% CI = -0.06 – 0.08, p > 0.01). Of greatest importance was the covariance
between the slopes of these two health behaviours. This relationship was negative and
statistically significant (cov = -0.03, 99% CI = -0.04 – [-0.02], p < 0.01). Therefore,
Canadians who made favourable changes in physical activity demonstrated a steeper
decline in their smoking behaviour. On the other hand, Canadians who demonstrated a
flatter positive trend in physical activity reported a flatter declining trajectory for daily
tobacco use. Alongside these covariances, the correlations outlined in Figure 11 provided
an indication of the strength of the relationship between latent variables. These cross-
behavioural correlations suggested only weak associations between behaviours. Thus,
changes in leisure-time physical activity energy expenditure appeared to be related, albeit
weakly (r = -0.11), to changes in smoking. The significant variance in the latent variables
of leisure-time physical activity and smoking demonstrated that the inclusion of
covariates could assist in explaining the interrelationship of these two health behaviours.

131
Figure 11: Parallel Process Model of Leisure-Time Physical Activity Energy Expenditure and Smoking
(n = 15,166)
Physical Activity
Intercept
Mean = 1.76 *
Variance = 2.31 *
Physical Activity
Slope
Mean = 0.04 *
Variance = 0.05 *
Smoking
Intercept
Mean = 4.81 *
Variance = 76.42 *
Smoking
Slope
Mean = -0.32 *
Variance = 1.26 *
cov: Covariance; CI: Confidence Interval; r: Correlation.
99% Confidence intervals correspond to the covariance.
* Significant at p ≤ 0.01.
cov = -6.52 *
cov = -0.18 *
cov = -0.03 * cov = -1.51 * cov = 0.27 * cov = 0.01
99% CI = -0.22 – (-0.14)
99% CI = -0.04 – (-0.02) 99% CI = -1.80 – (-1.21)
99% CI = -7.33 – (-5.82)
99% CI = 0.21 – 0.33 99% CI = -0.06 – 0.08
r = -0.51
r = 0.01 r = -0.11
r = -0.67
r = 0.16 r = -0.11
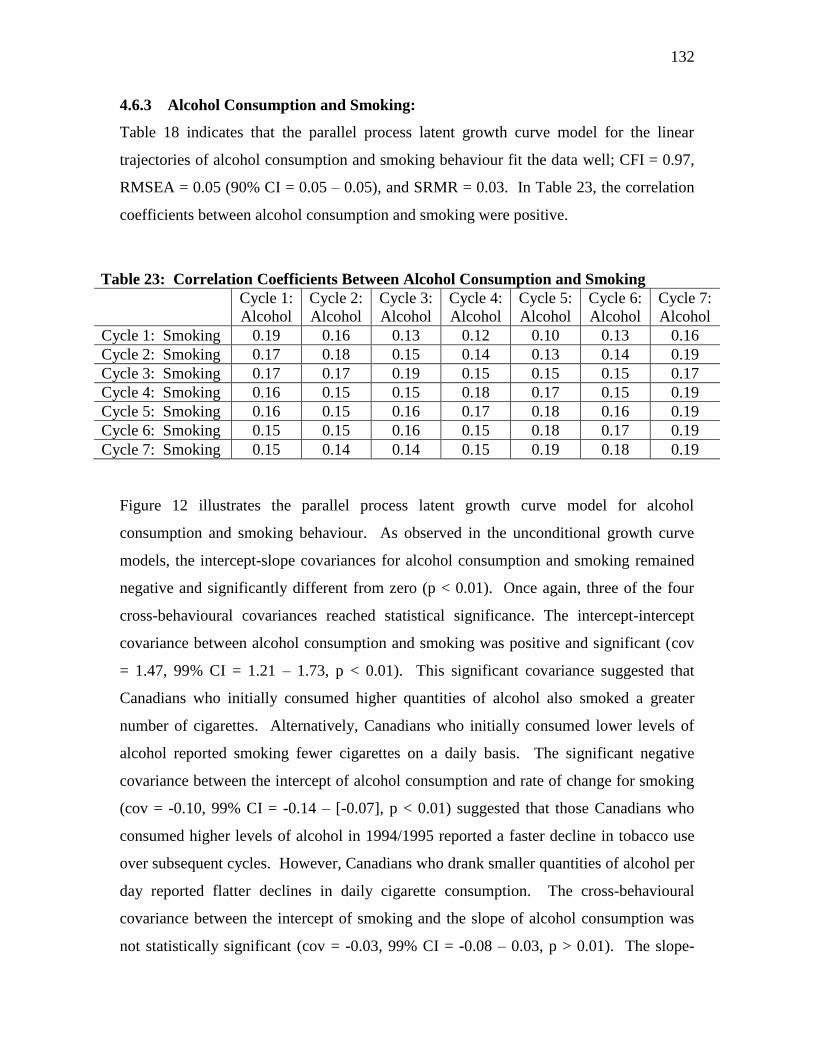
132
4.6.3 Alcohol Consumption and Smoking:
Table 18 indicates that the parallel process latent growth curve model for the linear
trajectories of alcohol consumption and smoking behaviour fit the data well; CFI = 0.97,
RMSEA = 0.05 (90% CI = 0.05 – 0.05), and SRMR = 0.03. In Table 23, the correlation
coefficients between alcohol consumption and smoking were positive.
Table 23: Correlation Coefficients Between Alcohol Consumption and Smoking
Cycle 1:
Alcohol
Cycle 2:
Alcohol
Cycle 3:
Alcohol
Cycle 4:
Alcohol
Cycle 5:
Alcohol
Cycle 6:
Alcohol
Cycle 7:
Alcohol
Cycle 1: Smoking 0.19 0.16 0.13 0.12 0.10 0.13 0.16
Cycle 2: Smoking 0.17 0.18 0.15 0.14 0.13 0.14 0.19
Cycle 3: Smoking 0.17 0.17 0.19 0.15 0.15 0.15 0.17
Cycle 4: Smoking 0.16 0.15 0.15 0.18 0.17 0.15 0.19
Cycle 5: Smoking 0.16 0.15 0.16 0.17 0.18 0.16 0.19
Cycle 6: Smoking 0.15 0.15 0.16 0.15 0.18 0.17 0.19
Cycle 7: Smoking 0.15 0.14 0.14 0.15 0.19 0.18 0.19
Figure 12 illustrates the parallel process latent growth curve model for alcohol
consumption and smoking behaviour. As observed in the unconditional growth curve
models, the intercept-slope covariances for alcohol consumption and smoking remained
negative and significantly different from zero (p < 0.01). Once again, three of the four
cross-behavioural covariances reached statistical significance. The intercept-intercept
covariance between alcohol consumption and smoking was positive and significant (cov
= 1.47, 99% CI = 1.21 – 1.73, p < 0.01). This significant covariance suggested that
Canadians who initially consumed higher quantities of alcohol also smoked a greater
number of cigarettes. Alternatively, Canadians who initially consumed lower levels of
alcohol reported smoking fewer cigarettes on a daily basis. The significant negative
covariance between the intercept of alcohol consumption and rate of change for smoking
(cov = -0.10, 99% CI = -0.14 – [-0.07], p < 0.01) suggested that those Canadians who
consumed higher levels of alcohol in 1994/1995 reported a faster decline in tobacco use
over subsequent cycles. However, Canadians who drank smaller quantities of alcohol per
day reported flatter declines in daily cigarette consumption. The cross-behavioural
covariance between the intercept of smoking and the slope of alcohol consumption was
not statistically significant (cov = -0.03, 99% CI = -0.08 – 0.03, p > 0.01). The slope-

133
slope covariance between alcohol consumption and smoking was significant (cov = 0.02,
99% CI = 0.01 – 0.03, p < 0.01). This suggested that Canadians who increased their
alcohol consumption also reported a slower or flatter decline in daily cigarette use.
Alternatively, as the positive trajectory in the consumption of alcohol became shallower,
the declining trend in smoking behaviour was steeper. Although changes in alcohol
consumption were significantly related to changes in smoking behaviour, it is important
to consider that this correlation was weak (r = 0.16). Significant variances in the latent
variables of alcohol consumption and smoking suggested inter-individual variability.

134
Figure 12: Parallel Process Model of Alcohol Consumption and Smoking (n = 15,166)
Alcohol Consumption
Intercept
Mean = 0.38 *
Variance = 0.45 *
Alcohol Consumption
Slope
Mean = 0.03 *
Variance = 0.01 *
Smoking
Intercept
Mean = 4.82 *
Variance = 76.44 *
Smoking
Slope
Mean = -0.32 *
Variance = 1.26 *
cov: Covariance; CI: Confidence Interval; r: Correlation.
99% Confidence intervals correspond to the covariance.
* Significant at p ≤ 0.01.
cov = -6.53 *
cov = -0.02 *
cov = 0.02 * cov = 1.47 * cov = -0.10 * cov = -0.03
99% CI = -0.03 – (-0.01)
99% CI = -7.25 – (-5.94)
99% CI = 0.01 – 0.03 99% CI = -0.08 – 0.03 99% CI = -0.14 – (-0.07) 99% CI = 1.21 – 1.73
r = -0.67
r = -0.14 r = 0.16
r = -0.23
r = -0.03 r = 0.25
135
4.7 Demographic Covariates:
In an attempt to determine how specific demographic characteristics may influence the
interrelationship of multiple health behaviours, both time-invariant and time-varying
covariates were individually incorporated into each parallel process latent growth curve
model. Time-invariant covariates included gender and age, while time-varying covariates
consisted of marital status, education, income adequacy, and BMI. The effect of each
covariate on the interrelationship of multiple health behaviours is discussed in subsequent
sections. Multiple imputation was employed to replace missing values with plausible
responses for each of the time-varying covariates.
4.7.1 Gender:
Fit indices in Table 24 suggest that the inclusion of gender within each of the three
parallel process growth curve models fit the data well; alcohol consumption and leisure-
time physical activity energy expenditure (CFI = 0.97, RMSEA = 0.03 [90% CI = 0.03 –
0.03], and SRMR = 0.03), leisure-time physical activity energy expenditure and smoking
(CFI = 0.97, RMSEA = 0.05 [90% CI = 0.05 – 0.05], and SRMR = 0.02), and alcohol
consumption and smoking (CFI = 0.97, RMSEA = 0.05 [90% CI = 0.05 – 0.05], and
SRMR = 0.03).
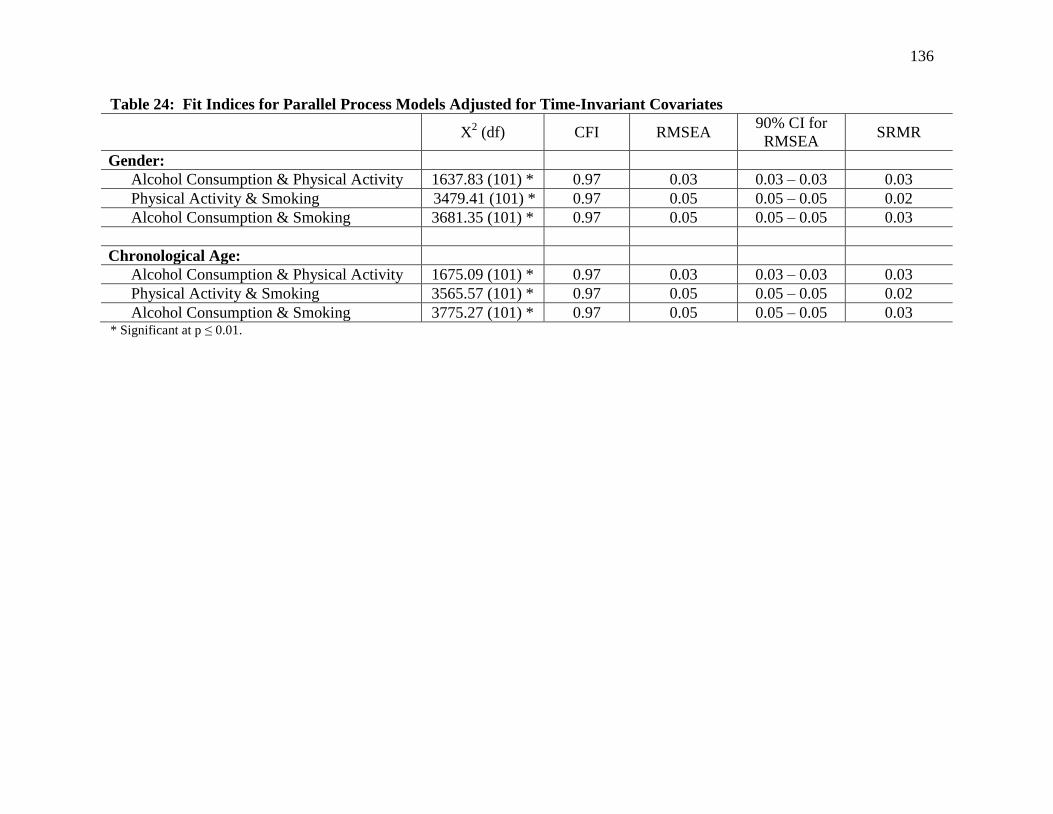
136
Table 24: Fit Indices for Parallel Process Models Adjusted for Time-Invariant Covariates
X
2 (df) CFI RMSEA
90% CI for
RMSEA SRMR
Gender:
Alcohol Consumption & Physical Activity 1637.83 (101) * 0.97 0.03 0.03 – 0.03 0.03
Physical Activity & Smoking 3479.41 (101) * 0.97 0.05 0.05 – 0.05 0.02
Alcohol Consumption & Smoking 3681.35 (101) * 0.97 0.05 0.05 – 0.05 0.03
Chronological Age:
Alcohol Consumption & Physical Activity 1675.09 (101) * 0.97 0.03 0.03 – 0.03 0.03
Physical Activity & Smoking 3565.57 (101) * 0.97 0.05 0.05 – 0.05 0.02
Alcohol Consumption & Smoking 3775.27 (101) * 0.97 0.05 0.05 – 0.05 0.03 * Significant at p ≤ 0.01.

137
Initially, Canadian females demonstrated behaviours that were relatively healthier
compared to their male counterparts (Table 25). In 1994/1995, women reported
significantly lower levels of alcohol consumption, leisure-time physical activity energy
expenditure, and tobacco use. However, over subsequent data collection cycles,
significant behavioural changes had begun to emerge. Table 25 revealed that women
demonstrated a slower increase in alcohol consumption, a steeper rise in leisure-time
physical activity, and a flatter decline in tobacco use. Table 25 also presents the gender
adjusted correlations between latent variables for each of the three parallel process
models. After accounting for gender, the strength of these correlations were consistent
with those of the unadjusted parallel process models.
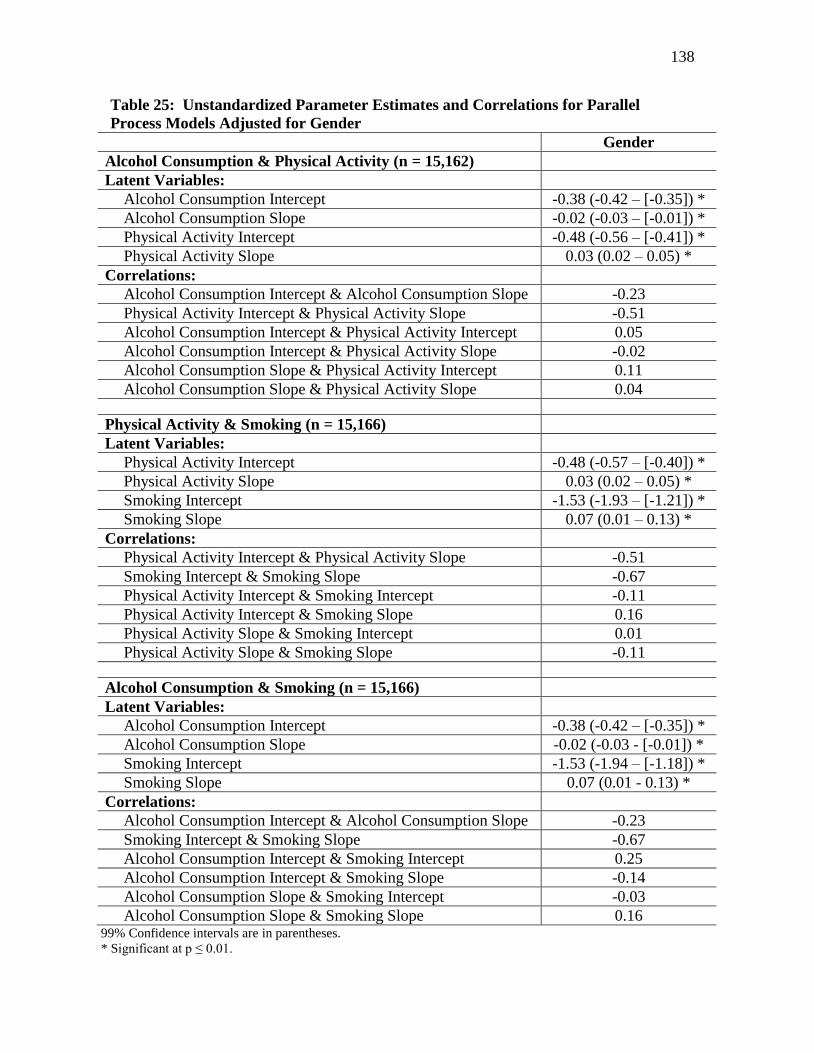
138
Table 25: Unstandardized Parameter Estimates and Correlations for Parallel
Process Models Adjusted for Gender
Gender
Alcohol Consumption & Physical Activity (n = 15,162)
Latent Variables:
Alcohol Consumption Intercept -0.38 (-0.42 – [-0.35]) *
Alcohol Consumption Slope -0.02 (-0.03 – [-0.01]) *
Physical Activity Intercept -0.48 (-0.56 – [-0.41]) *
Physical Activity Slope 0.03 (0.02 – 0.05) *
Correlations:
Alcohol Consumption Intercept & Alcohol Consumption Slope -0.23
Physical Activity Intercept & Physical Activity Slope -0.51
Alcohol Consumption Intercept & Physical Activity Intercept 0.05
Alcohol Consumption Intercept & Physical Activity Slope -0.02
Alcohol Consumption Slope & Physical Activity Intercept 0.11
Alcohol Consumption Slope & Physical Activity Slope 0.04
Physical Activity & Smoking (n = 15,166)
Latent Variables:
Physical Activity Intercept -0.48 (-0.57 – [-0.40]) *
Physical Activity Slope 0.03 (0.02 – 0.05) *
Smoking Intercept -1.53 (-1.93 – [-1.21]) *
Smoking Slope 0.07 (0.01 – 0.13) *
Correlations:
Physical Activity Intercept & Physical Activity Slope -0.51
Smoking Intercept & Smoking Slope -0.67
Physical Activity Intercept & Smoking Intercept -0.11
Physical Activity Intercept & Smoking Slope 0.16
Physical Activity Slope & Smoking Intercept 0.01
Physical Activity Slope & Smoking Slope -0.11
Alcohol Consumption & Smoking (n = 15,166)
Latent Variables:
Alcohol Consumption Intercept -0.38 (-0.42 – [-0.35]) *
Alcohol Consumption Slope -0.02 (-0.03 - [-0.01]) *
Smoking Intercept -1.53 (-1.94 – [-1.18]) *
Smoking Slope 0.07 (0.01 - 0.13) *
Correlations:
Alcohol Consumption Intercept & Alcohol Consumption Slope -0.23
Smoking Intercept & Smoking Slope -0.67
Alcohol Consumption Intercept & Smoking Intercept 0.25
Alcohol Consumption Intercept & Smoking Slope -0.14
Alcohol Consumption Slope & Smoking Intercept -0.03
Alcohol Consumption Slope & Smoking Slope 0.16 99% Confidence intervals are in parentheses.
* Significant at p ≤ 0.01.
139
4.7.2 Chronological Age:
As demonstrated in Table 24, the addition of chronological age in each parallel process
model fit the data well; alcohol consumption and leisure-time physical activity energy
expenditure (CFI = 0.97, RMSEA = 0.03 [90% CI = 0.03 – 0.03], and SRMR = 0.03),
leisure-time physical activity energy expenditure and smoking (CFI = 0.97, RMSEA =
0.05 [90% CI = 0.05 – 0.05], and SRMR = 0.02), and alcohol consumption and smoking
(CFI = 0.97, RMSEA = 0.05 [90% CI = 0.05 – 0.05], and SRMR = 0.03).
As a time-invariant covariate, chronological age appeared to have a significant influence
on the majority of latent variables. According to Table 26, older Canadians reported
significantly lower initial levels of leisure-time physical activity and cigarettes smoked
per day compared to their younger counterparts. Over time, healthier behavioural
changes began to transpire among older Canadians as they exhibited a slower increase in
alcohol consumption and a greater decline in tobacco use. A steeper rise in leisure-time
physical activity was also observed for older Canadians. However this association was
only identified in the leisure-time physical activity and smoking model. Unfortunately,
each of the behavioural changes, although significant, were relatively small in magnitude.
Also presented in Table 26 are the adjusted latent variable correlations. Adjusting for
chronological age seemed to have little influence on the strength of the correlations
between latent variables.

140
Table 26: Unstandardized Parameter Estimates and Correlations for Parallel Process Models
Adjusted for Chronological Age
Chronological Age
Alcohol Consumption & Physical Activity (n = 15,162)
Latent Variables:
Alcohol Consumption Intercept -0.01 x 10⁻¹
(-0.02 x 10⁻¹
– †)
Alcohol Consumption Slope -0.01 x 10⁻¹
(-0.01 x 10⁻¹
– [-0.01 x 10⁻¹
]) *
Physical Activity Intercept -0.02 (-0.03 – [-0.02]) *
Physical Activity Slope 0.01 x 10⁻¹
(† - 0.02 x 10⁻¹
)
Correlations:
Alcohol Consumption Intercept & Alcohol Consumption Slope -0.22
Physical Activity Intercept & Physical Activity Slope -0.50
Alcohol Consumption Intercept & Physical Activity Intercept 0.04
Alcohol Consumption Intercept & Physical Activity Slope -0.02
Alcohol Consumption Slope & Physical Activity Intercept 0.12
Alcohol Consumption Slope & Physical Activity Slope 0.04
Physical Activity & Smoking (n = 15,166)
Latent Variables:
Physical Activity Intercept -0.02 (-0.03 – [-0.02]) *
Physical Activity Slope 0.01 x 10⁻¹
(0.01 x 10⁻¹
- 0.02 x 10⁻¹
) *
Smoking Intercept -0.02 (-0.03 – [-0.02]) *
Smoking Slope -0.01 (-0.01 – [0.04 x 10⁻¹
]) *
Correlations:
Physical Activity Intercept & Physical Activity Slope -0.50
Smoking Intercept & Smoking Slope -0.66
Physical Activity Intercept & Smoking Intercept -0.11
Physical Activity Intercept & Smoking Slope 0.17
Physical Activity Slope & Smoking Intercept 0.01
Physical Activity Slope & Smoking Slope -0.11
Alcohol Consumption & Smoking (n = 15,166)
Latent Variables:
Alcohol Consumption Intercept -0.01 x 10⁻¹
(-0.02 x 10⁻¹
- †)
Alcohol Consumption Slope -0.01 x 10⁻¹
(-0.01 x 10⁻¹
– [-0.01 x 10⁻¹
]) *
Smoking Intercept -0.02 (-0.03 - [-0.02]) *
Smoking Slope -0.01 (-0.01 – [-0.04 x 10⁻¹
]) *
Correlations:
Alcohol Consumption Intercept & Alcohol Consumption Slope -0.22
Smoking Intercept & Smoking Slope -0.66
Alcohol Consumption Intercept & Smoking Intercept 0.25
Alcohol Consumption Intercept & Smoking Slope -0.13
Alcohol Consumption Slope & Smoking Intercept -0.03
Alcohol Consumption Slope & Smoking Slope 0.16 99% Confidence intervals are in parentheses. † Confidence interval was < 0.001.
* Significant at p ≤ 0.01.

141
4.7.3 Marital Status:
As a time-varying covariate, the addition of marital status to each parallel process model
demonstrated good fit (Table 27). Although each model had reported an excessive X2
value, the respective values for the CFI, RMSEA, and SRMR were within an acceptable
range; alcohol consumption and leisure-time physical activity energy expenditure (CFI =
0.97, RMSEA = 0.02 [90% CI = 0.02 – 0.02], and SRMR = 0.03), leisure-time physical
activity energy expenditure and smoking (CFI = 0.97, RMSEA = 0.03 [90% CI = 0.03 –
0.03], and SRMR = 0.03), and alcohol consumption and smoking (CFI = 0.97, RMSEA =
0.03 [90% CI = 0.03 – 0.03], and SRMR = 0.03).
Table 27: Fit Indices for Parallel Process Models Adjusted for Time-Varying Covariates
X
2 (df) CFI RMSEA
90% CI for
RMSEA SRMR
Marital Status:
Alcohol Consumption & Physical Activity 1347.97 (175) * 0.97 0.02 0.02 – 0.02 0.03
Physical Activity & Smoking 2678.26 (175) * 0.97 0.03 0.03 – 0.03 0.03
Alcohol Consumption & Smoking 2948.57 (175) * 0.97 0.03 0.03 – 0.03 0.03
Education:
Alcohol Consumption & Physical Activity 396.28 (175) * 0.98 0.01 0.01 - 0.01 0.04
Physical Activity & Smoking 785.95 (175) * 0.97 0.02 0.01 – 0.02 0.05
Alcohol Consumption & Smoking 770.72 (175) * 0.97 0.02 0.01 – 0.02 0.04
Income Adequacy:
Alcohol Consumption & Physical Activity 1269.57 (175) * 0.97 0.02 0.02 – 0.02 0.05
Physical Activity & Smoking 2438.89 (175) * 0.97 0.03 0.03 – 0.03 0.04
Alcohol Consumption & Smoking 2632.98 (175) * 0.97 0.03 0.03 – 0.03 0.04
BMI:
Alcohol Consumption & Physical Activity 1088.35 (175) * 0.97 0.02 0.02 – 0.02 0.02
Physical Activity & Smoking 2190.19 (175) * 0.97 0.03 0.03 – 0.03 0.02
Alcohol Consumption & Smoking 2344.47 (175) * 0.97 0.03 0.03 – 0.03 0.02 * Significant at p ≤ 0.01.
As outlined in Tables 28 through 30, marital status appeared to be a significant predictor
of each health behaviour at nearly every cycle of the NPHS. Single and formerly married
Canadians demonstrated greater levels of both alcohol consumption and tobacco use

142
during six of the seven cycles of the NPHS. Furthermore, single and formerly married
Canadians also had a tendency to participate in significantly higher levels of leisure-time
physical activity compared to their married or co-habiting counterparts.

143
Table 28: Unstandardized Parameter Estimates for the Alcohol Consumption and Physical Activity Parallel Process Model
Adjusted for Time-Varying Covariates (n = 15,162)
Marital Status Education
Income
Adequacy BMI
Health Behaviours:
Cycle 1: Alcohol Consumption 0.01 (0.01) 0.18 (0.01) * 0.09 (0.01) * 0.09 (0.01) *
Cycle 2: Alcohol Consumption 0.04 (0.01) * 0.14 (0.01) * 0.05 (0.01) * 0.06 (0.01) *
Cycle 3: Alcohol Consumption 0.08 (0.01) * 0.14 (0.01) * 0.06 (0.01) * 0.04 (0.01) *
Cycle 4: Alcohol Consumption 0.12 (0.02) * 0.09 (0.01) * 0.02 (0.01) -0.02 (0.01)
Cycle 5: Alcohol Consumption 0.16 (0.02) * 0.10 (0.02) * 0.04 (0.02) * 0.02 x 10-1
(0.01)
Cycle 6: Alcohol Consumption 0.11 (0.02) * 0.07 (0.02) * 0.02 x 10-1
(0.02) -0.08 (0.01) *
Cycle 7: Alcohol Consumption 0.16 (0.02) * 0.11 (0.02) * 0.06 (0.02) * -0.01 (0.02)
Cycle 1: Physical Activity 0.57 (0.03) * -0.09 (0.03) * 0.02 (0.03) -0.23 (0.03) *
Cycle 2: Physical Activity 0.53 (0.03) * -0.02 (0.03) 0.10 (0.03) * -0.22 (0.03) *
Cycle 3: Physical Activity 0.45 (0.03) * 0.14 (0.03) * 0.22 (0.02) * -0.10 (0.03) *
Cycle 4: Physical Activity 0.07 (0.03) -0.09 (0.03) * -0.01 (0.02) -0.37 (0.02) *
Cycle 5: Physical Activity 0.22 (0.03) * 0.19 (0.03) * 0.28 (0.03) * -0.16 (0.03) *
Cycle 6: Physical Activity 0.08 (0.04) 0.15 (0.04) * 0.22 (0.03) * -0.27 (0.03) *
Cycle 7: Physical Activity 0.13 (0.04) * 0.36 (0.04) * 0.44 (0.04) * -0.06 (0.03) Standard errors are in parentheses.
* Significant at p ≤ 0.01.

144
Table 29: Unstandardized Parameter Estimates for the Physical Activity and Smoking Parallel Process Model Adjusted
for Time-Varying Covariates (n = 15,166)
Marital
Status Education
Income
Adequacy BMI
Health Behaviours:
Cycle 1: Physical Activity 0.57 (0.03) * -0.11 (0.03) * 0.02 (0.03) -0.22 (0.03) *
Cycle 2: Physical Activity 0.52 (0.03) * -0.05 (0.03) 0.11 (0.03) * -0.21 (0.03) *
Cycle 3: Physical Activity 0.45 (0.03) * 0.11 (0.03) * 0.22 (0.02) * -0.09 (0.03) *
Cycle 4: Physical Activity 0.07 (0.03) -0.11 (0.03) * -0.01 (0.02) -0.36 (0.02) *
Cycle 5: Physical Activity 0.22 (0.03) * 0.16 (0.03) * 0.28 (0.03) * -0.15 (0.03) *
Cycle 6: Physical Activity 0.09 (0.03) * 0.13 (0.03) * 0.21 (0.03) * -0.26 (0.03) *
Cycle 7: Physical Activity 0.14 (0.04) * 0.33 (0.04) * 0.43 (0.04) * -0.05 (0.03)
Cycle 1: Smoking -0.22 (0.11) 0.34 (0.12) * -0.13 (0.09) -0.16 (0.10)
Cycle 2: Smoking 0.28 (0.10) * 0.24 (0.11) -0.04 (0.07) -0.13 (0.09)
Cycle 3: Smoking 0.50 (0.09) * 0.17 (0.10) † (0.06) -0.18 (0.08)
Cycle 4: Smoking 0.70 (0.09) * -0.05 (0.10) -0.16 (0.06) * -0.31 (0.07) *
Cycle 5: Smoking 0.58 (0.09) * -0.40 (0.11) * -0.44 (0.07) * -0.64 (0.07) *
Cycle 6: Smoking 0.70 (0.10) * -0.30 (0.12) * -0.30 (0.08) * -0.51 (0.08) *
Cycle 7: Smoking 0.83 (0.11) * -0.39 (0.13) * -0.28 (0.09) * -0.39 (0.09) * Standard errors are in parentheses.
* Significant at p ≤ 0.01.
† Parameter estimate was < 0.001.

145
Table 30: Unstandardized Parameter Estimates for the Alcohol Consumption and Smoking Parallel Process Model
Adjusted for Time-Varying Covariates (n = 15,166)
Marital Status Education
Income
Adequacy BMI
Health Behaviours:
Cycle 1: Alcohol Consumption 0.04 x 10⁻¹
(0.01) 0.20 (0.01) * 0.09 (0.01) * 0.09 (0.01) *
Cycle 2: Alcohol Consumption 0.03 (0.01) * 0.16 (0.01) * 0.06 (0.01) * 0.06 (0.01) *
Cycle 3: Alcohol Consumption 0.07 (0.01) * 0.16 (0.01) * 0.08 (0.01) * 0.04 (0.01) *
Cycle 4: Alcohol Consumption 0.12 (0.02) * 0.12 (0.02) * 0.03 (0.01) * -0.02 (0.01)
Cycle 5: Alcohol Consumption 0.15 (0.02) * 0.12 (0.02) * 0.06 (0.02) * † (0.01)
Cycle 6: Alcohol Consumption 0.10 (0.02) * 0.10 (0.02) * 0.02 (0.02) -0.08 (0.02) *
Cycle 7: Alcohol Consumption 0.15 (0.02) * 0.14 (0.02) * 0.08 (0.02) * -0.01 (0.02)
Cycle 1: Smoking -0.22 (0.11) 0.41 (0.12) * -0.19 (0.08) -0.13 (0.10)
Cycle 2: Smoking 0.29 (0.10) * 0.31 (0.11) * -0.08 (0.07) -0.11 (0.09)
Cycle 3: Smoking 0.51 (0.09) * 0.24 (0.10) -0.04 (0.06) -0.18 (0.08)
Cycle 4: Smoking 0.72 (0.09) * 0.03 (0.10) -0.20 (0.06) * -0.31 (0.07) *
Cycle 5: Smoking 0.60 (0.09) * -0.31 (0.11) * -0.48 (0.07) * -0.64 (0.07) *
Cycle 6: Smoking 0.73 (0.10) * -0.20 (0.12) -0.33 (0.08) * -0.51 (0.08) *
Cycle 7: Smoking 0.87 (0.11) * -0.28 (0.13) -0.30 (0.09) * -0.40 (0.09) * Standard errors are in parentheses.
* Significant at p ≤ 0.01.
† Parameter estimate was < 0.001.

146
Table 31 presents the covariances between latent variables that were adjusted for the
previously described time-varying covariates: marital status, education, income
adequacy, and BMI. Those covariances that were significant in the unadjusted models
remained statistically significant after adjusting for marital status. As shown in Table 32,
accounting for marital status did not substantially attenuate the strength of the
correlations between latent variables as these findings were similar to the unadjusted
correlations. Therefore, it appears that marital status had little influence on the co-
variation between health behaviours.

147
Table 31: Covariances Between Latent Variables Adjusted for Time-Varying Covariates
Marital Status Education Income Adequacy BMI
Alcohol Consumption and Physical Activity
(n = 15,162):
Alcohol Intercept & Alcohol Slope -0.02 (0.03 x 10⁻¹
) * -0.02 (0.03 x 10⁻¹
) * -0.02 (0.03 x 10⁻¹
) * -0.02 (0.03 x 10⁻¹
) *
Physical Activity Intercept & Physical Activity Slope -0.16 (0.01) * -0.18 (0.01) * -0.18 (0.01) * -0.18 (0.01) *
Alcohol Intercept & Physical Activity Intercept 0.05 (0.01) * 0.05 (0.01) * 0.04 (0.01) * 0.05 (0.01) *
Alcohol Intercept & Physical Activity Slope -0.03 x 10⁻¹
(0.03 x 10⁻¹
) -0.04 x 10⁻¹
(0.03 x 10⁻¹
) -0.01 (0.03 x 10⁻¹
) -0.03 x 10⁻¹
(0.03 x 10⁻¹
)
Alcohol Slope & Physical Activity Intercept 0.02 (0.03 x 10⁻¹
) * 0.02 (0.03 x 10⁻¹
) * 0.02 (0.03 x 10⁻¹
) * 0.02 (0.03 x 10⁻¹
) *
Alcohol Slope & Physical Activity Slope 0.01 x 10⁻¹
(0.01 x 10⁻¹
) 0.01 x 10⁻¹
(0.01 x 10⁻¹
) 0.01 x 10⁻¹
(0.01 x 10⁻¹
) 0.01 x 10⁻¹
(0.01 x 10⁻¹
)
Physical Activity and Smoking
(n = 15,166):
Physical Activity Intercept & Physical Activity Slope -0.16 (0.01) * -0.18 (0.01) * -0.18 (0.01) * -0.18 (0.01) *
Smoking Intercept & Smoking Slope -6.56 (0.27) * -6.58 (0.27) * -6.54 (0.27) * -6.52 (0.27) *
Physical Activity Intercept & Smoking Intercept -1.56 (0.12) * -1.57 (0.13) * -1.51 (0.12) * -1.51 (0.12) *
Physical Activity Intercept & Smoking Slope 0.26 (0.02) * 0.28 (0.02) * 0.28 (0.02) * 0.27 (0.02) *
Physical Activity Slope & Smoking Intercept 0.02 (0.03) 0.04 (0.03) 0.03 (0.03) 0.01 (0.03)
Physical Activity Slope & Smoking Slope -0.03 (0.01) * -0.03 (0.01) * -0.03 (0.01) * -0.03 (0.01) *
Alcohol Consumption and Smoking
(n = 15,166):
Alcohol Intercept & Alcohol Slope -0.02 (0.03 x 10⁻¹
) * -0.02 (0.03 x 10⁻¹
) * -0.02 (0.03 x 10⁻¹
) * -0.02 (0.03 x 10⁻¹
) *
Smoking Intercept & Smoking Slope -6.57 (0.26) * -6.58 (0.27) * -6.54 (0.26) * -6.53 (0.26) *
Alcohol Intercept & Smoking Intercept 1.47 (0.09) * 1.52 (0.10) * 1.49 (0.09) * 1.46 (0.09) *
Alcohol Intercept & Smoking Slope -0.10 (0.01) * -0.10 (0.01) * -0.10 (0.01) * -0.10 (0.01) *
Alcohol Slope & Smoking Intercept -0.04 (0.02) -0.03 (0.02) -0.03 (0.02) -0.03 (0.02)
Alcohol Slope & Smoking Slope 0.02 (0.03 x 10⁻¹
) * 0.02 (0.03 x 10⁻¹
) * 0.02 (0.03 x 10⁻¹
) * 0.02 (0.03 x 10⁻¹
) *
Standard errors are in parentheses.
* Significant at p ≤ 0.01.
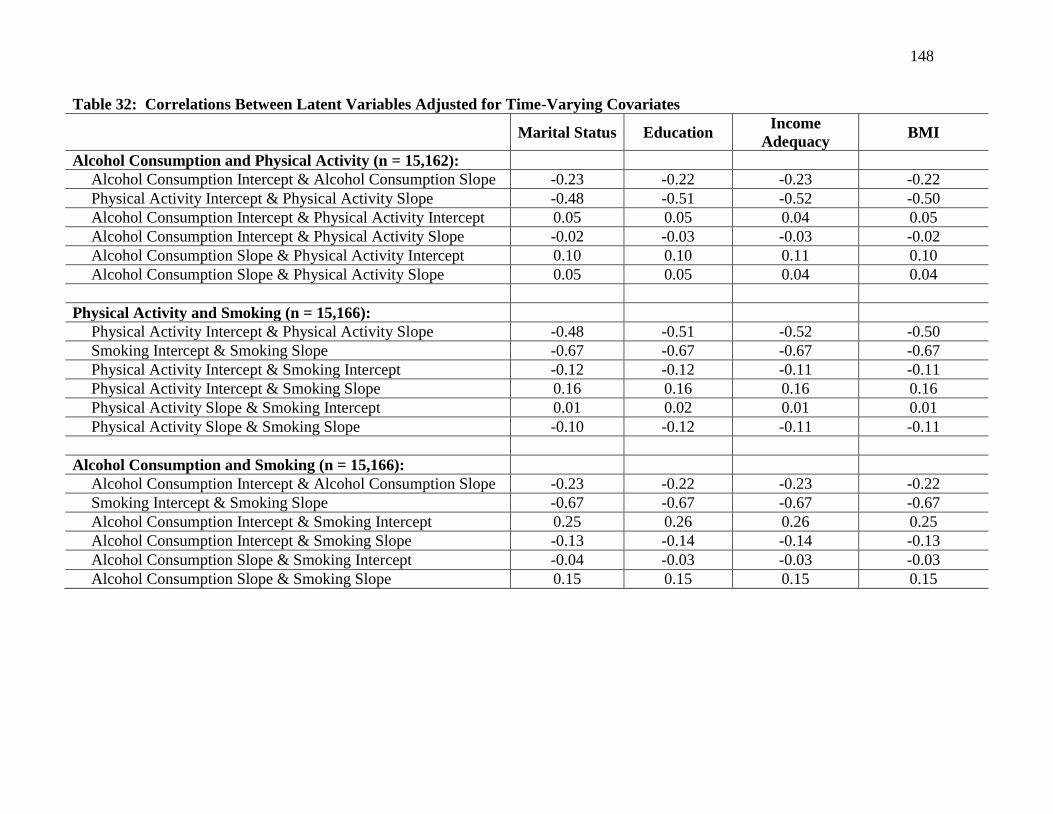
148
Table 32: Correlations Between Latent Variables Adjusted for Time-Varying Covariates
Marital Status Education
Income
Adequacy BMI
Alcohol Consumption and Physical Activity (n = 15,162):
Alcohol Consumption Intercept & Alcohol Consumption Slope -0.23 -0.22 -0.23 -0.22
Physical Activity Intercept & Physical Activity Slope -0.48 -0.51 -0.52 -0.50
Alcohol Consumption Intercept & Physical Activity Intercept 0.05 0.05 0.04 0.05
Alcohol Consumption Intercept & Physical Activity Slope -0.02 -0.03 -0.03 -0.02
Alcohol Consumption Slope & Physical Activity Intercept 0.10 0.10 0.11 0.10
Alcohol Consumption Slope & Physical Activity Slope 0.05 0.05 0.04 0.04
Physical Activity and Smoking (n = 15,166):
Physical Activity Intercept & Physical Activity Slope -0.48 -0.51 -0.52 -0.50
Smoking Intercept & Smoking Slope -0.67 -0.67 -0.67 -0.67
Physical Activity Intercept & Smoking Intercept -0.12 -0.12 -0.11 -0.11
Physical Activity Intercept & Smoking Slope 0.16 0.16 0.16 0.16
Physical Activity Slope & Smoking Intercept 0.01 0.02 0.01 0.01
Physical Activity Slope & Smoking Slope -0.10 -0.12 -0.11 -0.11
Alcohol Consumption and Smoking (n = 15,166):
Alcohol Consumption Intercept & Alcohol Consumption Slope -0.23 -0.22 -0.23 -0.22
Smoking Intercept & Smoking Slope -0.67 -0.67 -0.67 -0.67
Alcohol Consumption Intercept & Smoking Intercept 0.25 0.26 0.26 0.25
Alcohol Consumption Intercept & Smoking Slope -0.13 -0.14 -0.14 -0.13
Alcohol Consumption Slope & Smoking Intercept -0.04 -0.03 -0.03 -0.03
Alcohol Consumption Slope & Smoking Slope 0.15 0.15 0.15 0.15

149
4.7.4 Education:
As illustrated in Table 27, the inclusion of education within each of the three parallel
process models had shown adequate fit of the longitudinal data; alcohol consumption and
leisure-time physical activity energy expenditure (CFI = 0.98, RMSEA = 0.01 [90% CI =
0.01 – 0.01], and SRMR = 0.04), leisure-time physical activity energy expenditure and
smoking (CFI = 0.97, RMSEA = 0.02 [90% CI = 0.01 – 0.02], and SRMR = 0.05), and
alcohol consumption and smoking (CFI = 0.97, RMSEA = 0.02 [90% CI = 0.01 – 0.02],
and SRMR = 0.04).
Education appeared to be positively associated with both alcohol consumption and
leisure-time physical activity during the majority of data collection cycles. Illustrated in
Tables 28 through 30, higher levels of education were related to greater levels of alcohol
consumption as well as leisure-time physical activity. Surprisingly, education seemed to
have a lesser influence on tobacco use as a significant association between these two
characteristics was only observed within half of the NPHS cycles (Tables 29 and 30).
Furthermore, a positive association between education and smoking was observed during
the early cycles, while this relationship became negative in the latter cycles.
Compared to the unadjusted findings, accounting for education had little effect on the
significance level of the covariances (Table 31) and strength of the correlations (Table
32) in any of the three parallel process growth curve models. Although the strength of
the correlations may have been slightly attenuated, the covariances preserved their
respective directional association as well as level of significance.
4.7.5 Income Adequacy:
The fit indices in Table 27 revealed that adequate fit was obtained when income
adequacy was incorporated into each of the following parallel process models; alcohol
consumption and physical activity energy expenditure (CFI = 0.97, RMSEA = 0.02 [90%
CI = 0.02 – 0.02], and SRMR = 0.05), physical activity energy expenditure and smoking
(CFI = 0.97, RMSEA = 0.03 [90% CI = 0.03 – 0.03], and SRMR = 0.04), and alcohol
consumption and smoking (CFI = 0.97, RMSEA = 0.03 [90% CI = 0.03 – 0.03], and
SRMR = 0.04).
150
The effects of income adequacy on each health behaviour are outlined in Tables 28
through 30. Income adequacy was positively associated with both alcohol consumption
and leisure-time physical activity suggesting that Canadians with a higher income
adequacy consumed greater quantities of alcohol and participated in higher levels of
leisure-time physical activity. The association between income adequacy and smoking
appeared limited to the later cycles of the NPHS as those Canadians reporting higher
income adequacies smoked in moderation or practiced abstinence (Tables 29 and 30).
Although income adequacy may have been a significant predictor of health behaviours,
this demographic characteristic appeared to have no substantial effect on any of the
behavioural covariances (Table 31) or correlations (Table 32). While income adequacy
may have attenuated the strength of several correlations, any reduction appeared minimal.
Furthermore, the statistical significance of the covariances was maintained. Therefore,
covariances that were significant in the unadjusted models remained significant after
controlling for income adequacy.
4.7.6 Body Mass Index:
In Table 27, the inclusion of BMI within each of the three parallel process models
demonstrated adequate fit of the NPHS data; alcohol consumption and leisure-time
physical activity energy expenditure (CFI = 0.97, RMSEA = 0.02 [90% CI = 0.02 –
0.02], and SRMR = 0.02), leisure-time physical activity energy expenditure and smoking
(CFI = 0.97, RMSEA = 0.03 [90% CI = 0.03 – 0.03], and SRMR = 0.02), and alcohol
consumption and smoking (CFI = 0.97, RMSEA = 0.03 [90% CI = 0.03 – 0.03], and
SRMR = 0.02).
Depicted in Tables 28 and 30, body mass index demonstrated a significant positive
association with alcohol consumption in the early cycles before changing to a significant
negative association at the sixth cycle. This suggests that in the early cycles, Canadians
who were overweight or obese consumed greater levels of alcohol. However, in the sixth
cycle, higher BMI scores were related to lower quantities of alcohol consumption. Not
surprisingly, Tables 28 and 29 revealed that body mass index was negatively associated
with physical activity at nearly each cycle. Consequently, overweight and obese
Canadians were less physically active compared to their underweight or normal weight

151
counterparts. Finally, in the mid and latter cycles of the NPHS, BMI was negatively
related to smoking such that overweight or obese Canadians reported lower use of
tobacco products compared to their underweight or normal weight counterparts (Tables
29 and 30).
Similar to the aforementioned demographic characteristics, Tables 31 and 32 illustrate
that the effect of BMI on the behavioural covariances and correlations, respectively, were
virtually negligible. Although a small number of the correlations may have experienced a
slight attenuation after accounting for BMI, covariances that were significant in the
unadjusted models remained statistically significant after adjusting for the BMI scores of
Canadians.
Both time invariant and varying covariates were associated with health behaviours.
However, these significant relationships did not appear to alter the covariances or
correlations between health behaviours. Consequently, although demographic
characteristics may predict the possession of unhealthy behaviours, these characteristics
do not appear to either promote nor inhibit multiple behavioural changes.
4.8 Unconditional Growth Curve Model of Mastery:
The correlation coefficients between the repeated measures of mastery are outlined in
Table 33. These correlations were positive and, as expected, demonstrated a tendency to
decrease in size with the passage of time.
Table 33: Correlation Coefficients for Mastery
Cycle 1:
Mastery
Cycle 4:
Mastery
Cycle 5:
Mastery
Cycle 6:
Mastery
Cycle 7:
Mastery
Cycle 1: Mastery 1.00
Cycle 4: Mastery 0.36 1.00
Cycle 5: Mastery 0.38 0.46 1.00
Cycle 6: Mastery 0.36 0.43 0.54 1.00
Cycle 7: Mastery 0.37 0.42 0.53 0.56 1.00
Since mastery was not assessed among Canadians during 1996/1997 as well as
1998/1999, only five repeated measures were available to model its longitudinal
trajectory. The observed and estimated trajectories of mastery are illustrated in Figure

152
13. Modelling the linear trajectory of mastery demonstrated reasonable fit (CFI = 0.98,
RMSEA = 0.04 [90% CI = 0.04 – 0.04], and SRMR = 0.07). The addition of a quadratic
factor appeared to improve the fit of the mastery model; chi-square difference test X2(4)
= 52.66, p < 0.001. However, for interpretation reasons, a linear trajectory was chosen to
represent mastery.

153
Figure 13: Observed and Estimated Trajectories of Mastery

154
According to Figure 14, Canadians reported an initial mastery score of 19.65 (99% CI =
19.55 – 19.73, p < 0.01) in 1994/1995. The mean mastery score had decreased by 0.02
(99% CI = -0.04 – [-0.03 x 10⁻¹
], p < 0.01) at each cycle of the NPHS. This contradicted
the findings in Table 13 in which mastery appeared to demonstrate relative stability. The
significant variances of the two latent variables indicated inter-individual variability in
both the intercept and slope of mastery. The negative covariance (cov = -0.06, 99% CI =
-0.24 – 0.06) between the intercept and slope of mastery revealed that Canadians with
higher initial scores in mastery decreased at a faster rate compared to their Canadian
counterparts who initially demonstrated lower mastery scores. However, this negative
covariance failed to reach statistical significance. A weak correlation (r = -0.07) between
the intercept and slope of mastery was observed.

155
Figure 14: Linear Growth Curve Model of Mastery (n = 14,797)
Mastery 1
Mastery 4
Mastery 5
Mastery 6
Mastery 7
Mastery
Intercept
Mean = 19.65 *
Variance = 6.20 *
1 1 1 1 1
cov = -0.06 Mastery
Slope
Mean = -0.02 *
Variance = 0.11 *
0 3 4 5 6
CI = -0.24 – 0.06
r = -0.07
cov: Covariance; CI: Confidence Interval; r: Correlation.
99% Confidence intervals correspond to the covariance. Factor loadings were predetermined.
* Significant at p ≤ 0.01.

156
4.9 Mediating Effects of Mastery:
Parallel process latent growth curve models were used to evaluate the potential mediating
effects of self perceived mastery on behavioural changes. In total, six parallel process
models were developed; alcohol consumption and leisure-time physical activity energy
expenditure, leisure-time physical activity energy expenditure and alcohol consumption,
leisure-time physical activity energy expenditure and smoking, smoking and leisure-time
physical activity energy expenditure, alcohol consumption and smoking, as well as
smoking and alcohol consumption. Figure 3 represents an illustration of how each of the
six models were created. In an attempt to simplify Figure 3, only parameter estimates
and confidence intervals between latent slopes are reported in the following mediation
figures. In accordance with the unconditional models developed in the previous sections,
linear trajectories were used to depict each health behaviour as well as mastery.
4.9.1 Alcohol Consumption and Leisure-Time Physical Activity Energy
Expenditure:
Outlined in Table 34, the mediation model involving alcohol consumption and leisure-
time physical activity energy expenditure demonstrated good fit; CFI = 0.97, RMSEA =
0.03 (90% CI = 0.03 – 0.03), and SRMR = 0.03. Considering the substantial sample size
(n = 15,162), a large and significant chi-square statistic, X2(165) = 2090.42, p < 0.01, was
expected.

157
Table 34: Fit Indices for Mediation Parallel Process Models
X
2 (df) CFI RMSEA
90% CI for
RMSEA SRMR
Alcohol Consumption & Physical Activity 2090.42 (165) * 0.97 0.03 0.03 - 0.03 0.03
Physical Activity & Alcohol Consumption 2070.98 (165) * 0.97 0.03 0.03 – 0.03 0.03
Physical Activity & Smoking 3944.85 (165) * 0.97 0.04 0.04 – 0.04 0.03
Smoking & Physical Activity 3979.51 (165) * 0.97 0.04 0.04 - 0.04 0.03
Alcohol Consumption & Smoking 4040.96 (165) * 0.97 0.04 0.04 – 0.04 0.03
Smoking & Alcohol Consumption 4046.09 (165) * 0.97 0.04 0.04 – 0.04 0.03 * Significant at p ≤ 0.01

158
Illustrated in Figure 15, the slope of alcohol consumption had a positive and significant
effect on the growth factor of mastery (α = 0.55, 99% CI = 0.23 – 0.85, p < 0.01)
indicating that as alcohol consumption increased, self perceived mastery also increased.
The positive and significant effect of the slope of mastery on the slope of leisure-time
physical activity energy expenditure (ß = 0.08, 99% CI = 0.02 – 0.14, p < 0.01) denoted
that increases in mastery were associated with a steeper rise in leisure-time physical
activity. The direct effect between alcohol consumption and leisure-time physical
activity was also positive and significant (ť = 0.26, 99% CI = 0.13 - 0.44, p < 0.01)
suggesting that increases in alcohol consumption resulted in an increase in leisure-time
physical activity. The indirect effect revealed that the mediated effect of mastery was
significant (αß = 0.04, 99% CI = 0.01 – 0.10, p < 0.01). Therefore, mastery appears to
mediate the association between the slope of alcohol consumption and slope of leisure-
time physical activity. However, since the direct effect remained significant, it appears
that mastery acts as a partial mediator.

159
Figure 15: Mediation of Mastery in the Alcohol Consumption and Leisure-Time Physical Activity Energy
Expenditure Model (n = 15,162)
Mastery
Slope
Alcohol Consumption
Slope
Physical Activity
Slope
α = 0.55 *
CI: Confidence Intervals.
Parameter estimates are unstandardized.
* Significant at p ≤ 0.01.
ß = 0.08 *
99% CI = 0.23 – 0.85 99% CI = 0.02 – 0.14
ť = 0.26 *
99% CI = 0.13 – 0.44

160
4.9.2 Leisure-Time Physical Activity Energy Expenditure and Alcohol
Consumption:
Evaluating the mediation of mastery in the relationship between leisure-time physical
activity energy expenditure and alcohol consumption revealed good fit of the longitudinal
data (Table 34); CFI = 0.97, RMSEA = 0.03 (90% CI = 0.03 – 0.03), and SRMR = 0.03.
The large and significant chi-square statistic (X2[165] = 2070.98, p < 0.01) was expected.
In Figure 16, the positive and significant effect of the leisure-time physical activity slope
on the slope of mastery (α = 0.46, 99% CI = 0.33 – 0.57, p < 0.01) implies that increases
in physical activity levels initiates an increase in the trajectory of self perceived mastery.
The slope-slope coefficient between mastery and alcohol consumption was positive (ß =
0.04, 99% CI = † – 0.08). This association did not appear to be significant. The
calculated indirect effect (αß = 0.02, 99% CI = † – 0.04) was not significant signifying
that mediation, in the form of changes in mastery, was not present in the relationship
between leisure-time physical activity energy expenditure and alcohol consumption. The
direct effect of leisure-time physical activity on alcohol consumption also failed to reach
statistical significance (ť = 0.04, 99% CI = -0.01 - 0.08).

161
Figure 16: Mediation of Mastery in the Leisure-Time Physical Activity Energy Expenditure and Alcohol
Consumption Model (n = 15,162)
Mastery
Slope
Physical Activity
Slope
Alcohol Consumption
Slope
α = 0.46 *
CI: Confidence Intervals.
Parameter estimates are unstandardized.
† Confidence interval was < 0.001.
* Significant at p ≤ 0.01.
ß = 0.04
99% CI = 0.33 – 0.57 99% CI = † – 0.08
ť = 0.04
99% CI = -0.01 – 0.08

162
4.9.3 Leisure-Time Physical Activity Energy Expenditure and Smoking:
Illustrated in Table 34, the mediation model of leisure-time physical activity and smoking
reported fit indices that suggested good model fit; CFI = 0.97, RMSEA = 0.04 (90% CI =
0.04 – 0.04), and SRMR = 0.03. Figure 17 presents the mediation model between
leisure-time physical activity and smoking. The positive effect between the slope of
leisure-time physical activity and slope of mastery (α = 0.45, 99% CI = 0.30 – 0.57, p <
0.01) indicated that increases in physical activity led to an increase in self perceived
mastery. The non-significant effect of mastery on smoking (ß = 0.07, 99% CI = -0.14 –
0.32) suggested that changes in mastery did not influence changes in smoking behaviour.
The mediated effect failed to reach statistical significance (αß = 0.03, 99% CI = -0.06 –
0.15) implying that the slope of mastery did not mediate the association of physical
activity on smoking behaviour. The direct effect between the growth factors of physical
activity and smoking was significant (ť = -0.46, 99% CI = -0.67 – [-0.25], p < 0.01).
Therefore, an increase in physical activity resulted in a decrease in tobacco use.

163
Figure 17: Mediation of Mastery in the Leisure-Time Physical Activity Energy Expenditure and Smoking
Model (n = 15,166)
Mastery
Slope
Physical Activity
Slope
Smoking
Slope
α = 0.45 *
CI: Confidence Intervals.
Parameter estimates are unstandardized.
* Significant at p ≤ 0.01.
ß = 0.07
99% CI = 0.30 – 0.57 99% CI = -0.14 – 0.32
ť = -0.46 *
99% CI = -0.67 – (-0.25)

164
4.9.4 Smoking and Leisure-Time Physical Activity Energy Expenditure:
Appropriate model fit was demonstrated by the mediation model of smoking and leisure-
time physical activity (Table 34); CFI = 0.97, RMSEA = 0.04 (90% CI = 0.04 – 0.04),
and SRMR = 0.03. In Figure 18, the effect of smoking on mastery was negative, but non-
significant (α = -0.02, 99% CI = -0.04 – 0.01). Therefore, changes in smoking were
unsuccessful in producing changes in mastery. However, changes in perceived mastery
were found to influence changes in physical activity (ß = 0.09, 99% CI = 0.02 – 0.15, p <
0.01). The estimated mediated effect was non-significant (αß = -0.01 x 10⁻¹
, 99% CI = -
0.04 x 10⁻¹
– 0.01 x 10⁻¹
) revealing that mastery did not mediate the relationship between
smoking and leisure-time physical activity. The direct effect of smoking on physical
activity also did not reach statistical significance (ť = -0.01, 99% CI = -0.02 – 0.01 x 10⁻¹
)
implying that changes in smoking did not lead to changes in leisure-time physical activity
energy expenditure.
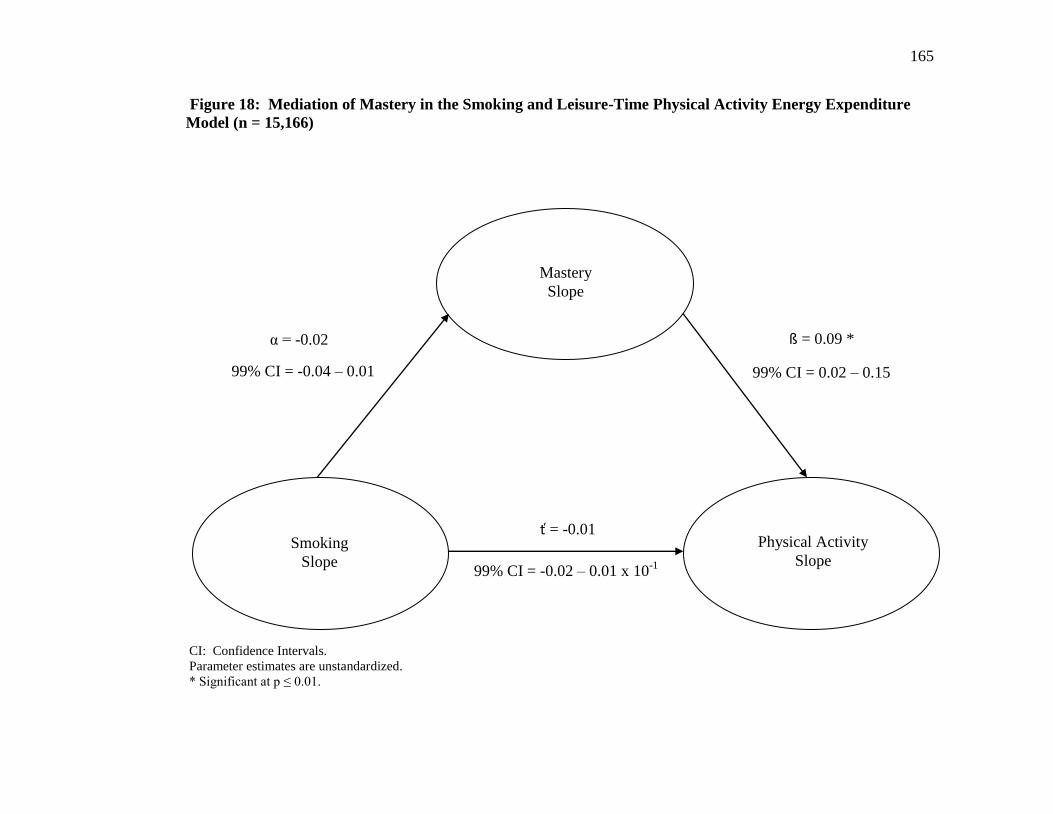
165
Figure 18: Mediation of Mastery in the Smoking and Leisure-Time Physical Activity Energy Expenditure
Model (n = 15,166)
Mastery
Slope
Smoking
Slope
Physical Activity
Slope
α = -0.02
CI: Confidence Intervals.
Parameter estimates are unstandardized.
* Significant at p ≤ 0.01.
ß = 0.09 *
99% CI = -0.04 – 0.01 99% CI = 0.02 – 0.15
ť = -0.01
99% CI = -0.02 – 0.01 x 10⁻¹
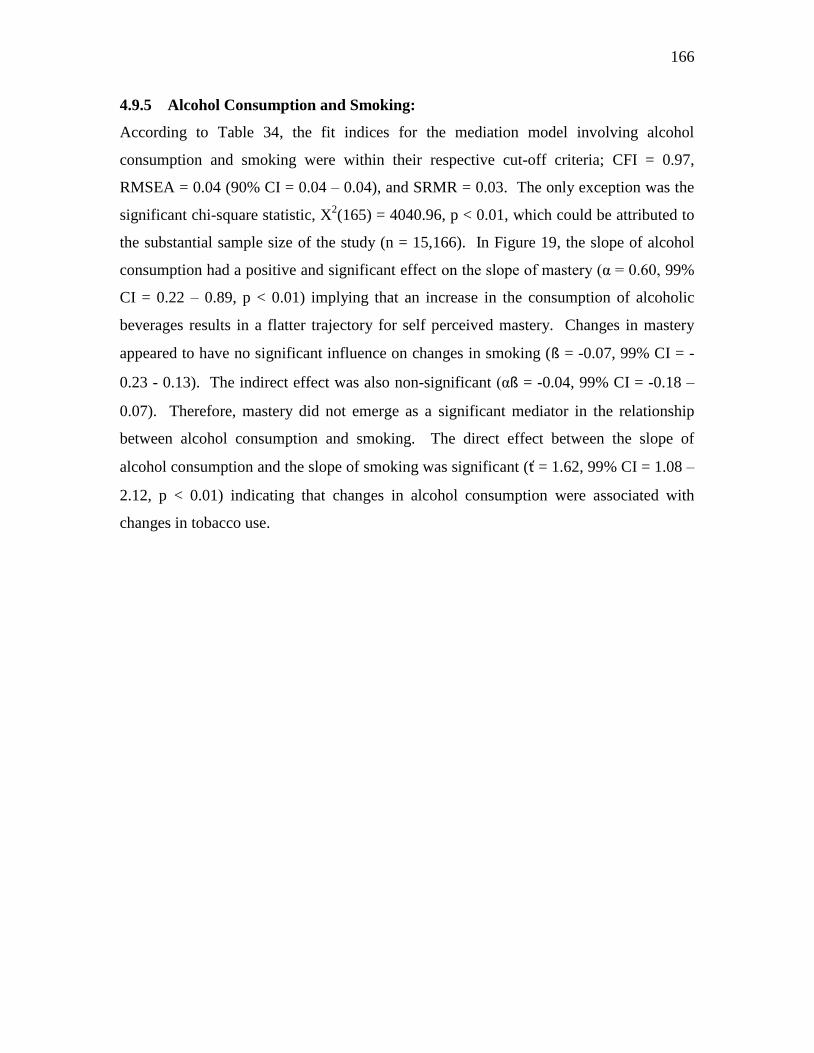
166
4.9.5 Alcohol Consumption and Smoking:
According to Table 34, the fit indices for the mediation model involving alcohol
consumption and smoking were within their respective cut-off criteria; CFI = 0.97,
RMSEA = 0.04 (90% CI = 0.04 – 0.04), and SRMR = 0.03. The only exception was the
significant chi-square statistic, X2(165) = 4040.96, p < 0.01, which could be attributed to
the substantial sample size of the study (n = 15,166). In Figure 19, the slope of alcohol
consumption had a positive and significant effect on the slope of mastery (α = 0.60, 99%
CI = 0.22 – 0.89, p < 0.01) implying that an increase in the consumption of alcoholic
beverages results in a flatter trajectory for self perceived mastery. Changes in mastery
appeared to have no significant influence on changes in smoking (ß = -0.07, 99% CI = -
0.23 - 0.13). The indirect effect was also non-significant (αß = -0.04, 99% CI = -0.18 –
0.07). Therefore, mastery did not emerge as a significant mediator in the relationship
between alcohol consumption and smoking. The direct effect between the slope of
alcohol consumption and the slope of smoking was significant (ť = 1.62, 99% CI = 1.08 –
2.12, p < 0.01) indicating that changes in alcohol consumption were associated with
changes in tobacco use.

167
Figure 19: Mediation of Mastery in the Alcohol Consumption and Smoking Model (n = 15,166)
Mastery
Slope
Alcohol Consumption
Slope
Smoking
Slope
α = 0.60 *
CI: Confidence Intervals.
Parameter estimates are unstandardized.
* Significant at p ≤ 0.01.
ß = -0.07
99% CI = 0.22 – 0.89 99% CI = -0.23 – 0.13
ť = 1.62 *
99% CI = 1.08 – 2.12

168
4.9.6 Smoking and Alcohol Consumption:
The mediation model of smoking and alcohol consumption fit the longitudinal data well
(Table 34); CFI = 0.97, RMSEA = 0.04 (90% CI = 0.04 – 0.04), and SRMR = 0.03. As
observed in Figure 20, changes in smoking had no significant effect on changes in
mastery (α = -0.01, 99% CI = -0.03 – 0.01). A lack of association was also observed
between changes in mastery and changes in alcohol consumption (ß = 0.04, 99% CI = † –
0.08). The mediated effect of mastery was shown to be non-significant (αß = †, 99% CI
= -0.02 x 10⁻¹
– 0.01 x 10⁻¹
) indicating that perceived mastery did not mediate the
relationship between the slopes of smoking and alcohol consumption. The direct effect
of smoking on alcohol consumption was significant (ť = 0.03, 99% CI = 0.02 – 0.04, p <
0.01).

169
Figure 20: Mediation of Mastery in the Smoking and Alcohol Consumption Model (n = 15,166)
Mastery
Slope
Smoking
Slope
Alcohol Consumption
Slope
α = -0.01
CI: Confidence Intervals.
Parameter estimates are unstandardized.
† Confidence interval was < 0.001.
* Significant at p ≤ 0.01.
ß = 0.04
99% CI = -0.03 – 0.01 99% CI = † – 0.08
ť = 0.03 *
99% CI = 0.02 – 0.04

170
Chapter 5
Discussion
5.1 Overview:
Although multiple health behaviour change research may represent the future of public
health policies and strategies (L. Gordon, et al., 2007; J. O. Prochaska, 2008), a number
of questions relating to the interrelationship of multiple behaviours continue to persist.
Using a longitudinal nationally representative population-based database of Canadians,
the current study attempted to address two of these concerns by assessing the following
objectives: 1) to evaluate co-variation among health behaviours; specifically alcohol
consumption, leisure-time physical activity, and smoking, and 2) to examine whether
mastery acts as a mediating cognitive mechanism that facilitates changes between
multiple health behaviours. In subsequent paragraphs, the discussion of the study results
were complemented with possible explanations as to why these findings may have
transpired as well as implications that these conclusions may have for future health
promotion programs and strategies.
5.2 Attrition:
For years, multiple health behavioural research has acknowledged the need for
longitudinal study designs in evaluating the interrelationship of behavioural change
(Blakely, et al., 2004; Butterfield, et al., 2004; Costakis, et al., 1999; Garrett, et al., 2004;
Klein-Geltink, et al., 2006; Pronk, Peek, et al., 2004). Compared to cross-sectional
designs, longitudinal studies are more appropriate for examining behavioural changes as
they are capable of evaluating behavioural trajectories over time. However, longitudinal
studies are not without limitations. One of the more common limitations associated with
longitudinal studies is attrition (Lilienfeld & Stolley, 1994; Statistics Canada, 2008).
Attrition refers to a reduction in the original sample size which is attributed to non-
response in the form of refusal, an inability to locate, incapable of being interviewed, or
partial response (Statistics Canada, 2008). When attrition is introduced into a
longitudinal study, there is always a concern that those individuals who remain in the
study may no longer represent the population from which they were obtained (Klesges, et
171
al., 1999). This is known as selection bias (Janzon, Hanson, Isacsson, Lindell, & Steen,
1986; Last, 2001). When present, this bias could possibly compromise the
generalizability of the research findings (Cunradi, Moore, Killoran, & Ames, 2005).
Generalizability, often known as external validity, refers to the ability of research
findings to present unbiased associations that are representative of the target population
from which the sample was recruited (Last, 2001). To avoid this potential limitation,
researchers should employ every possible method to retain study participants (Janzon, et
al., 1986). Although Statistics Canada utilized a variety of approaches to improve the
retention of sample participants (Statistics Canada, 2008), attrition could not be prevented
throughout subsequent cycles. By the seventh cycle of the current study, 67% of
Canadians had completed the NPHS survey. However, in this analysis, the proportion of
Canadians who provided valid responses for each of the variables of interest was
calculated at 51%. In comparison to studies of shorter duration, approximately 10 years
in length, response rates of approximately 70% have been reported (Goldberg, Chastang,
Zins, Niedhammer, & Leclerc, 2006; Radler & Ryff, 2010). As attrition rates are often
influenced by the duration of time between initial and follow-up periods (Cunradi, et al.,
2005), it is reasonable to conclude that attrition rates would likely resemble that of the
current study had these studies persisted for an additional four years.
Those individuals who did not provide valid responses for each of the variables of
interest were identified by specific demographic, cognitive-behavioural, behavioural, and
physical health characteristics. In regards to demographic characteristics, Canadians who
were younger, married or formerly married, and demonstrating higher levels of
education, income adequacy, and BMI scores were more likely to exhibit a willingness to
participate in the NPHS at the final assessment. The ability of demographic
characteristics to predict participation at future assessment periods has been evaluated by
others. In a national study, individuals who were married, better educated and reported
higher BMI scores were more likely to continue to participate in additional data
collection periods (Radler & Ryff, 2010). Others have also documented similar trends
between attrition and education (Cunradi, et al., 2005; de Graaf, Bijl, Smit, Ravelli, &
Vollebergh, 2000).

172
Variations in gender, age and marital status have been observed in previous research
(Cunradi, et al., 2005; de Graaf, et al., 2000; Goldberg, et al., 2006). Similar to the
current findings, de Graaf et al. (2000) found no association between attrition and gender.
However, others have found that males (Goldberg, et al., 2006) and females (Cunradi, et
al., 2005) were more likely to participate in a future follow-up. Further research is
required to clarify the association between attrition and gender.
In considering age, the current analysis found that younger Canadians were more likely to
participate in the seventh cycle of the NPHS. The use of a continuous rather than
categorical variable could be responsible for inconsistent findings between studies. The
current study had chosen to use a continuous variable to represent age, while other
studies have preferred to group age into specific categories (Cunradi, et al., 2005; de
Graaf, et al., 2000; Goldberg, et al., 2006). The utilization of age as a categorical
variable implies that each individual within a particular category is of the same age. For
example, in an 18 to 24 age grouping, no distinction is made between individuals 18
years of age and individuals who are 24 years of age. The use of a continuous variable
would be a more accurate representation of an individual’s actual age and may result in a
different trend than what was reported when age was categorized into specific groupings.
Furthermore, differences in the age range of the recruited sample may have also had a
role in the inconsistent findings. For example, at baseline, Canadians aged 12 to 102
years of age were included in the current analysis. Other studies have recruited samples
with more restrictive age ranges (Cunradi, et al., 2005; de Graaf, et al., 2000; Goldberg,
et al., 2006). Finally, as the current sample may have included a larger proportion of
older individuals, the increased likelihood of attrition among older individuals could be
attributed to mortality/morbidity (de Graaf, et al., 2000).
In regards to marital status, the present study found that married individuals were more
likely to participate in the seventh cycle of data collection. These results are in partial
agreement with those presented by de Graaf et al. (2000) who demonstrated that the odds
of failing to locate participants at a future follow-up period was reduced among those
living with a partner. However, in examining additional types of attrition, de Graaf et al.
reported that the likelihood of attrition as a result of refusal or morbidity/mortality was
not associated with marital status. In the current study, the most common form of

173
attrition was non-response which entailed both refusals and individuals who could not be
located (Statistics Canada, 2008). Had attrition been assessed in its different forms,
failure to locate, refusal, and morbidity/mortality, similar findings as those of de Graaf et
al., (2000) may have been reported. In additional studies, a higher probability of
participation was observed among married men, while no such association was
demonstrated among women (Goldberg, et al., 2001). Others have been unable to
identify a significant association between attrition and marital status (Cunradi, et al.,
2005; Goldberg, et al., 2006). Additional research is necessary to determine the
association between marital status and attrition.
Of particular interest was the evaluation between participation and behavioural and
physical health characteristics. There appears to be some consensus that both smoking
behaviour and physical health status are associated with attrition (Cunradi, et al., 2005;
Goldberg, et al., 2006; Morrison, et al., 1997). Furthermore, for leisure-time physical
activity energy expenditure, the findings in the current study were in agreement with
those of Radler and Ryff (2010) as vigorous exercise had no association with longitudinal
retention. For alcohol consumption, the findings are more controversial. Some have
shown that simply consuming alcohol is related to a reduced likelihood of participating in
a follow-up survey (Morrison, et al., 1997), whereas others have suggested that more
excessive amounts of alcohol consumption are related to lower participation at follow-up
(Goldberg, et al., 2006) and a greater likelihood of failing to locate individuals (de Graaf,
et al., 2000). Among other studies, the consumption of alcohol has shown no association
with retention (Radler & Ryff, 2010), non-response (Cunradi, et al., 2005) as well as
attrition due to refusal or morbidity/mortality (de Graaf, et al., 2000). It is difficult to
identify why the findings involving alcohol consumption substantially vary. Again, this
is an area in which future research will need to address.
From the logistic regression analysis, one could conclude that several characteristics were
associated with retention. The fact that specific individuals were less likely to participate
in the seventh cycle of the NPHS could have substantial implications on the external
validity of the study findings (Cunradi, et al., 2005). This analysis was concerned with
the effect that smoking behaviour, alcohol consumption, and the number of chronic
conditions an individual possessed would present on the internal and external validity of
174
this study. If specific individuals had withdrawn from this analysis, the results may not
be applicable to general smokers, consumers of alcohol, or individuals with chronic
conditions. Furthermore, the exclusion of specific individuals may bias the calculated
covariances and correlations. For example, according to the parameter estimates of the
logistic regression, for every additional cigarette that an individual smoked each day, the
odds of participation in the seventh cycle decreased by 1%. As a result, heavier smokers
exhibited a greater likelihood of attrition. Heavier smokers often demonstrate lower
levels of motivational readiness to achieve smoking cessation (DiClemente, et al., 1991;
Emmons, et al., 1994), higher levels of nicotine dependence, and a greater difficulty with
cravings, withdrawal symptoms and achieving cessation (Killen, Fortmann, Telch, &
Newman, 1988). Thus, it is reasonable to hypothesize that those smokers who were least
likely to change their smoking behaviour were no longer participating in the NPHS at the
final follow-up. Had heavier smokers continued to participate in the NPHS, their
inclusion may have attenuated significant concurrent behavioural changes that were
observed in their absence.
The trend observed for smoking was unlike the one reported for alcohol consumption as
greater quantities of alcohol consumption was associated with participating in the seventh
cycle. Therefore, concurrent changes between alcohol consumption and other behaviours
could be difficult to observe as individuals who consume excessive amounts of alcohol
report little desire to change their alcohol consumption (Rosal, et al., 2000). However, it
is conceivable that such individuals may choose to change additional health behaviours
(Rosal, et al., 2000) and this could increase one’s intentions on changing alcohol
consumption (Unger, 1996).
The likelihood of participating in the seventh cycle decreased by 7% for each additional
chronic condition that an individual possessed. However, unlike smoking, the possession
of numerous chronic diseases is associated with greater motivational readiness to change
unhealthy behaviours (Boyle, et al., 1998; Keenan, 2009). Thus, individuals who were
more likely to achieve behavioural changes were not included in the seventh cycle of the
NPHS. Had individuals who possessed multiple chronic conditions been retained at the
final follow-up, non-significant associations in concurrent behavioural changes may have
reached statistical significance. Whether the increased likelihood of implementing

175
behavioural changes among less addictive smokers would be offset by the challenge of
changing behaviours among individuals who consume greater quantities of alcohol and
possess fewer chronic conditions was unknown. However, all three indicators appeared
to play a significant role in attrition and thus may have influenced the generalizability of
the current results. Consequently, caution should be exhibited when generalizing these
findings back to the broader population.
5.3 Sample Characteristics:
In the past, multiple behavioural change studies have recruited samples that have
exclusively or predominantly consisted of males (Carmelli, et al., 1993; T. Gordon &
Doyle, 1986; Nagaya, et al., 2007), females (McDermott, et al., 2004; Perkins, et al.,
1993; Saules, et al., 2004), adolescences (Audrain-McGovern, et al., 2003; Terry-
McElrath & O'Malley, 2011), specific age groups (Breslau, et al., 1996; Carmelli, et al.,
1993; Perkins, et al., 1993), ever smokers (Boudreaux, et al., 2003), individuals
possessing a chronic condition (Boudreaux, et al., 2003; Boyle, et al., 1998), university
students (Keller, et al., 2008), smokers (Kahler, et al., 2009), as well as pregnant women
(Pirie, et al., 2000). This study attempted to resolve this limitation by incorporating a
large nationally representative sample of Canadians. In 1994/1995, the current sample
was comprised almost equally between males and females with an average age of 41
years. The majority of Canadians were married or cohabitating with a partner. Over
subsequent cycles of data collection, the proportion of married or cohabitating Canadians
increased resulting in a decrease in the percentage of single individuals. In regards to
education, over half of the initial sample had acquired at least some post-secondary
school. By the seventh cycle, this proportion of individuals had increased by nearly 20%.
This increasing trend in higher levels of education has been observed by others (Steffen,
et al., 2006). For income adequacy, Canadian households appeared to be earning greater
incomes over subsequent cycles. However, this trend could be misleading as the
percentage of Canadians who were unwilling to response to this particular question
increased from 5.0 to 44.6% over the duration of the NPHS. In 1994/1995, the average
BMI was 24.8 kg/m2 suggesting that the average Canadian was under weight or normal
weight. However, over time, BMI increased to 26.6 kg/m2 confirming that the majority
176
of individuals were overweight or obese. These findings were not surprising as others
have reported an increasing trend in weight gain and BMI scores with the passage of time
(D. E. King, Mainous, Carnemolla, & Everett, 2009; Mozaffarian, Hao, Rimm, Willett, &
Hu, 2011; Orpana, Tremblay, & Fines, 2007; Steffen, et al., 2006).
5.4 Prevalence of Multiple Health Behaviours:
The majority of research pertaining to health behaviours has typically evaluated single
health behaviours as opposed to multiple health behaviours (Klein-Geltink, et al., 2006;
Nigg & Long, 2012). Determining the prevalence of multiple unhealthy behaviours
would be beneficial for public health professionals and health promotion programs in
understanding the incidence, prevention, screening, and treatment of chronic diseases
(Pronk, Anderson, et al., 2004). The recognition of trends in multiple unhealthy
behaviours would also provide evidence of the success of innovative policies and
programs (Hale & Viner, 2012).
Previous literature has determined that 39 to 80% of the general population possess
multiple unhealthy behaviours or risk factors. Such behaviours/risk factors may include
physical inactivity, smoking, excessive alcohol consumption, unhealthy dietary intake, or
overweight/obesity (Berrigan, et al., 2003; Fine, et al., 2004; Klein-Geltink, et al., 2006;
Rosal, et al., 2001). The findings from Table 15 indicate that the engagement of multiple
unhealthy behaviours ranges from 21.5 to 26.9% in this sample of Canadians. At first
glance, this would suggest that these findings greatly underestimate the prevalence of
multiple unhealthy behaviours. However, there are two explanations that may provide
justification for the lower prevalence of multiple unhealthy behaviours observed in this
study. The utilization of diverse criteria to characterize health behaviours could be one
possibility. This is perhaps most evident in the evaluation of smoking status. Although
the classification of smoking status would seem to be relatively straightforward, various
criteria have been suggested to characterize smokers including current tobacco use
(Poortinga, 2007b; Rosal, et al., 2001), current daily tobacco use (Klein-Geltink, et al.,
2006), daily or occasional tobacco use (Coups, et al., 2004; Fine, et al., 2004) or whether
individuals had smoked a minimum of 100 cigarettes in their lifetime and were currently
smoking tobacco products (Pronk, Anderson, et al., 2004). Variations in the criteria for

177
alcohol consumption and physical inactivity appear to be just as common. While some
have often relied upon daily or weekly cut-offs to distinguish between excessive levels of
alcohol consumption (Klein-Geltink, et al., 2006; Poortinga, 2007b; Rosal, et al., 2001),
others have incorporated a measure of binge drinking as an adjunct to daily or weekly
alcohol consumption cut-offs (Berrigan, et al., 2003; Coups, et al., 2004; Fine, et al.,
2004; Pronk, Anderson, et al., 2004). Furthermore, while this study assessed physical
inactivity in regards to leisure-time energy expenditure, others have shown a tendency to
measure physical inactivity by assessing a lack of adherence to specific frequency and
duration guidelines (Coups, et al., 2004; Fine, et al., 2004; Poortinga, 2007b; Pronk,
Anderson, et al., 2004; Rosal, et al., 2001). In this study, the criteria utilized to
distinguish healthy from unhealthy behaviours were based upon Canadian guidelines for
alcohol consumption (Bondy, et al., 1999; Wilkins, 2002) and leisure-time physical
activity energy expenditure (Katzmarzyk & Tremblay, 2007; Stephens, et al., 1986).
With the exception of Klein-Geltink et al. (2006), the majority of the aforementioned
studies have incorporated American recommendations for health behaviours. Until
health professionals can agree upon recommended guidelines for healthy behaviours, it is
expected that prevalence rates will continue to vary between studies.
The lower prevalence rates of multiple unhealthy behaviours reported in the current study
could also be attributed to the exclusion of dietary habits. Unlike previous studies
(Berrigan, et al., 2003; Poortinga, 2007b; Pronk, Anderson, et al., 2004; Rosal, et al.,
2001), this study does not take into consideration dietary habits as information pertaining
to fruit and vegetable consumption was limited to only a few cycles in the NPHS.
Furthermore, data pertaining to dietary fat intake was non-existent. Had dietary habits
been included in some capacity, either fruit and vegetable consumption and/or saturated
fat intake, the prevalence rates of multiple unhealthy behaviours would have surely
increased. For example, smokers and physically inactive individuals are known to
consume high fat diets (Rosal, et al., 2001). Therefore, these individuals would no longer
possess one unhealthy behaviour, either smoking or leisure–time physical inactivity, but
rather multiple unhealthy behaviours; unhealthy diet and smoking or unhealthy diet and
leisure-time physical inactivity.

178
The addition of dietary habits would also reduce the prevalence rates of specific
behavioural combinations. For instance, the behavioural combination of physical
inactivity and smoking demonstrates an initial prevalence rate of 21.5%. However, this
behavioural combination includes both individuals with and without adequate dietary
habits. The evaluation of individuals with unhealthy dietary habits would create an
additional behavioural category; physical inactivity, smoking, and unhealthy diet. This
new category would remove individuals from the physical inactivity and smoking
category and consequently decrease the prevalence rate of Canadians who were strictly
physically inactive smokers.
Similar to dietary intake, prevalence rates of multiple unhealthy behaviours have often
included BMI estimates (Coups, et al., 2004; Fine, et al., 2004; Klein-Geltink, et al.,
2006; Pronk, Anderson, et al., 2004). However, obesity is a product of both physical
inactivity and/or unhealthy dietary habits as opposed to an actual health behaviour.
Therefore, obesity was not included in the prevalence rates of multiple health behaviours.
Although several inconsistencies exist in the prevalence rates of single and multiple
health behaviours, a number of similarities were observed. As in other studies, physical
inactivity was the most common unhealthy behaviour reported in this study (Coups, et al.,
2004; Fine, et al., 2004; Klein-Geltink, et al., 2006; Pronk, Anderson, et al., 2004). The
proportion of excessive consumers of alcohol and current daily smokers was similar to
that of Canadian and American adult samples (Coups, et al., 2004; Klein-Geltink, et al.,
2006; Rosal, et al., 2001). Furthermore, the percentage of Canadians who exclusively
consumed excessive amounts of alcohol or were strictly smokers was similar to the
prevalence rates reported by Klein-Geltink et al. (2006). In regards to multiple health
behaviours, other studies have demonstrated prevalence rates of 4% for excessive alcohol
consumption and physical inactivity (Rosal, et al., 2001), 13% for physical inactivity and
smoking (Rosal, et al., 2001), and 1 to 2% for excessive alcohol consumption and
smoking (Klein-Geltink, et al., 2006; Rosal, et al., 2001). In addition, our prevalence
estimates for the simultaneous inclusion of all three unhealthy behaviours resembled that
of Klein-Geltink et al., (2006), while the proportion of Canadians meeting the
recommendations for all three behaviours was similar to that reported by Fine et al.
(2004).

179
Perhaps the most favourable changes were among those Canadians who were initially
physically inactive and smoking. The proportion of physically inactive smokers steadily
declined from a high of 21.5% in 1994/1995 to a low of 14.2% in 2006/2007. This
decrease in physically inactive smokers is not surprising considering that both cross-
sectional and longitudinal studies have documented that physical activity is associated
with smoking cessation (W. K. deRuiter, et al., 2008; Gauthier, et al., 2012; Nagaya, et
al., 2007; Perkins, et al., 1993; Wen, Wai, Tsai, & Yang, 2012). Social unacceptability
could also be responsible for the decreasing prevalence of smoking. Furthermore, it is
also possible smokers encounter stricter legislation as well as more effective and
accessible resources and professional assistance. While one cannot discount that positive
behavioural changes in physical activity and smoking had some influence on the
decreasing trend of physically inactive smokers, another likely explanation would be
attrition. As smokers became unwilling or unable to continue to participate in the NPHS,
they were no longer included in the calculated prevalence rates of multiple behavioural
combinations. Therefore, the declining trend in the proportion of Canadians who were
physically inactive and smoking could be attributed to a lack of participation. The
percentage of individuals who met the recommended guidelines for all three health
behaviours, alcohol consumption, physical activity, and smoking behaviour, also
demonstrated a positive trend particularly from 2000/2001 (13.3%) to 2006/2007
(19.7%). However, once again, this increasing trend could be attributed to a reduction in
physically active smokers and/or attrition.
Interestingly, rates of multiple health behaviours that included alcohol consumption
appeared to increase across the seven cycles of the NPHS. Once again, one should not
overlook the role that attrition may have had on this increasing trend in alcohol
consumption. On the other hand, it is conceivable that alcohol consumption is considered
socially acceptable by the general population, particularly in comparison to tobacco use.
The evaluation of multiple health behaviour patterns provides a better understanding of
the risk associated with chronic diseases (Klein-Geltink, et al., 2006). As individuals
maintain multiple unhealthy behaviours, they will continue to exhibit an increased risk of
mortality from cancer, coronary heart disease, and stroke (Chang, et al., 2001; Knoops, et
al., 2004; Meng, et al., 1999). The current findings demonstrate that from 1994/1995 to
180
2006/2007, specific behavioural combinations had significantly improved while other
combinations demonstrated negative trends. Once unhealthy behavioural patterns are
recognized, public health professionals can begin to design and implement strategies that
not only meet the specific needs of individuals, but result in the adoption and
maintenance of favourable behavioural changes that reduce the risk of chronic diseases.
5.5 Single Health Behaviour Change:
In this observational study, unconditional growth curve findings suggest that Canadians
demonstrated the capability to adopt and/or maintain significant beneficial behavioural
changes as individuals reported an increase of 0.04 kcal/kg/day in leisure-time physical
activity energy expenditure. While this longitudinal trajectory was comparable to
previously reported trends for total leisure-time physical activity (Jacobs, et al., 1991;
Steffen, et al., 2006), high-intensity leisure-time physical activity (Jacobs, et al., 1991;
Steffen, et al., 2006; Talbot, Fleg, & Metter, 2003), and physical activity energy
expenditure (Craig, et al., 2004; I. M. Lee, et al., 1992), there a consensus in the scientific
community that physical activity typically declines with chronological age. This positive
behavioural trajectory for leisure-time physical activity could be attributed to the
heterogeneity of the sample, specifically the substantially large range in age at the first
cycle.
The resurgence of population based physical activity programs such as ParticipAction
have utilized mass media campaigns to increase awareness and interest in adopting
physical activity among the Canadian general population (Craig, Bauman, Gauvin,
Robertson, & Murumets, 2009; Plotnikoff, et al., 2009). Canada on the Move, another
population based program, has also promoted physical activity participation in the form
of daily walking (Craig, Tudor-Locke, & Bauman, 2007). In addition to population
initiatives, an environment that is conducive in supporting physical activity participation
is also critical. The development of accessible sidewalks, parks, playgrounds, and sport
opportunities within communities may provide such support and encouragement (Carson,
Kuhle, Spence, & Veugelers, 2010).
A favourable change in smoking behaviour was also observed as a reduction of 0.32
cigarettes/day at each biennial cycle was reported among Canadians. This decreasing

181
trend in tobacco use has been observed by others (Centers for Disease Control and
Prevention, 2012; Filion, et al., 2012; Le Faou, Baha, Rodon, Lagrue, & Menard, 2009;
McDermott, et al., 2008; Shields, 2007a; Waller, Cohen, Ferrence, Bull, & Adlaf, 2003).
Government legislation and pharmacological treatment are primarily responsible for the
reported decrease in daily tobacco use (Irvin & Brandon, 2000). Over the years,
legislation has played a critical role in tobacco control. Smoking restrictions, in the
home, public places, and the workplace, are increasing in popularity and appear to be an
effective strategy in decreasing daily cigarette use as well as enhancing motivational
readiness for achieving smoking cessation (Shields, 2007a, 2007b). Higher cigarette
prices may also contribute to a reduction in daily cigarette use (Farrelly, Nimsch, Hyland,
& Cummings, 2004) as youth smoking is often susceptible to fluctuations in cigarette
costs (Kostova, Ross, Blecher, & Markowitz, 2011). Finally, one should not overlook the
critical role that nicotine replacement therapy has had in decreasing smoking rates (Stead,
Perera, Bullen, Mant, & Lancaster, 2008). As daily cigarette use continues to decrease
through legislation and pharmacological agents, the odds of achieving smoking cessation
is enhanced (Hymowitz, et al., 1997) and consequently health benefits should become
apparent.
Unfortunately, not all behavioural changes exhibited a favourable longitudinal trend as
alcohol consumption increased biennially by 0.03 beverages/day. In recent years, both
the prevalence of individuals consuming moderate or excessive quantities of alcohol (D.
E. King, et al., 2009; Li, et al., 2009) and the average consumption of alcohol has
increased (Mays, Depadilla, Thompson, Kushner, & Windle, 2010). However, compared
to other health behaviours, alcohol consumption is unusual as small quantities of alcohol
appear to be beneficial to one’s health, whereas excessive amounts result in adverse
consequences (Knoops, et al., 2004; Ronksley, et al., 2011). Subsequently, the increasing
trend in alcohol consumption could be attributed to the prevention of cardiovascular
disease. Since the majority of the general population continues to acknowledge the
health benefits associated with moderate alcohol consumption (Ogborne & Smart, 2001),
the initiation of this behaviour could become more appealing and acceptable. Similar to
smoking, social norms may have a prominent role in the consumption of alcohol. The
perception that others partake in the consumption of alcoholic beverages can result in a

182
greater likelihood of actual use (Arbour-Nicitopoulos, Kwan, Lowe, Taman, & Faulkner,
2010) as well as the consumption of higher quantities of alcohol (Haug, Ulbricht, Hanke,
Meyer, & John, 2011; O'Grady, Cullum, Tennen, & Armeli, 2011).
Demographic characteristics may play a central role in the behavioural change process.
As individuals age, they demonstrate a greater likelihood of adhering to multiple healthy
behaviours (Berrigan, et al., 2003; Fine, et al., 2004; Pronk, Anderson, et al., 2004;
Ramage-Morin, Shields, & Martel, 2010). On average, it is not until age 53 that
individuals typically meet the recommended guidelines for alcohol consumption, physical
activity, tobacco use, and diet (Berrigan, et al., 2003). Over time, one becomes more
aware of the health implications associated with unhealthy behaviours. Thus,
improvements in health behaviours could be attributed to education (Boniface, et al.,
2001; Pronk, Anderson, et al., 2004). Susceptibility to chronic diseases often increases
with age. Perhaps by adopting a healthier lifestyle, one may believe they can prevent or
delay the occurrence of debilitating conditions. The influence of age, education, and
additional demographic characteristics on behavioural changes will be discussed in
further detail in subsequent sections.
Although each of these three behavioural trajectories had reached statistical significance,
one could argue that the estimated magnitude of such behavioural changes were quite
small. However, small and attainable behavioural changes at the population level can
have considerable effects on morbidity, mortality, and health care costs (Atkins &
Clancy, 2004; Guttman, Kegler, & McLeroy, 1996; Lean, Lara, & Hill, 2006; Rose,
1985). For example, if the prevalence of Canadians who participated in sufficient levels
of physical activity were to increase by 10%, a savings of $150 million per year would be
incurred by the Canadian health care system (Katzmarzyk, et al., 2000). In the case of
alcohol, a slight decline in consumption during a 20 year period had been associated with
substantial reductions in morbidity and mortality rates (Smart & Mann, 1987). While the
behavioural changes observed in the current analysis were small, it is important to
consider that these changes most likely occurred without the assistance of public health
interventions. It is expected that more substantial behavioural changes could be acquired
through the support of public health interventions (Emmons, Shadel, et al., 1999).
Although one must acknowledge the cost associated with developing and implementing

183
such interventions, only a small reduction in unhealthy behaviours, 1.0 to 1.5%, would be
necessary to offset the cost of these health promotion programs (Ozminkowski, et al.,
2004).
Aside from the behavioural trajectories, each of the three unconditional growth curve
models revealed a significant negative covariance between their respective intercept and
slope. In the case of alcohol consumption, the negative covariance suggested that
Canadians who reported high levels of alcohol consumption in 1994/1995 demonstrated
slower rates of positive growth over time. On the other hand, those Canadians who
demonstrated lower levels of alcohol consumption in 1994/1995 were shown to increase
their consumption at a faster rate over subsequent cycles. A significant negative
correlation between the intercept and slope of alcohol consumption has been previously
reported (Curran, et al., 1997; Mays, et al., 2010). The negative intercept-slope
covariance for leisure-time physical activity had a similar interpretation as that of alcohol
consumption. For smoking, the negative covariance implied that Canadians who initially
smoked greater quantities of cigarettes would demonstrate a steeper decline in their
smoking behaviour. These findings are in agreement with previous research (Friend &
Pagano, 2005; Garcia, Fernandez, Schiaffino, Peris, & Borras, 2005; Joseph, Bliss, Zhao,
& Lando, 2005; McDermott, et al., 2008). There are two possible explanations that may
account for the observed negative intercept-slope covariances. First, known as regression
to the mean, individuals may initially report an extreme value, but state values that are
considered “normal” on subsequent assessments (Davis, 1976). These ‘normal’ values
would suggest that growth was occurring at a slower rate when in actuality this would not
be the case. Second, it is likely that a ceiling effect was present for alcohol consumption
and leisure-time physical activity energy expenditure. In other words, individuals with
initially high levels of a particular behaviour have little opportunity to achieve additional
improvements compared to their counterparts who reported lower initial values. Others
have also suggested the existence of a ceiling effect among health behavioural changes
(Emmons, Linnan, Shadel, Marcus, & Abrams, 1999). Unlike alcohol consumption and
leisure-time physical activity energy expenditure, smoking behaviour did not demonstrate
a ceiling effect, but rather a floor effect. Thus, Canadians with lower initial values

184
exhibited little opportunity to incur further reductions in smoking compared to Canadians
who demonstrated higher levels of tobacco use.
Over the last 12 years, it is reasonable to believe that favourable changes in health
behaviours would have a significant reduction on the occurrence of chronic conditions in
Canada. However, as observed in the current study as well as by others (Deering, Lix,
Bruce, & Young, 2009; D. S. Lee, et al., 2009), chronic conditions among Canadians
appear to be on the rise. The increasing trajectory of alcohol consumption could be
partially responsible. Undoubtedly, an unhealthy diet as well as obesity would also have
a critical role in escalating the prevalence of chronic conditions (Deering, et al., 2009;
Knoops, et al., 2004). Furthermore, it important to consider that although favourable
changes were observed for leisure-time physical activity and smoking, the majority of the
Canadian population continue to be physically inactive while a modest proportion of the
general population partakes in tobacco use.
5.6 Multiple Health Behaviours:
To evaluate the interrelationship of multiple health behaviours, three parallel process
latent growth curve models were developed: alcohol consumption and leisure-time
physical activity energy expenditure, leisure-time physical activity energy expenditure
and smoking, and alcohol consumption and smoking. Cross-behavioural findings of each
parallel process model are discussed in subsequent paragraphs.
5.6.1 Alcohol Consumption and Leisure-Time Physical Activity Energy
Expenditure:
The positive intercept-intercept covariance between alcohol consumption and leisure-
time physical activity energy expenditure suggested that Canadians who reported a high
level of physical activity in 1994/1995 also consumed elevated quantities of alcohol
consumption in 1994/1995. Conversely, Canadians participating in lower levels of
physical activity also consumed lower quantities of alcohol or practiced abstinence. This
positive relationship between physical activity and alcohol consumption has been
previously observed by others (M. T. French, Popovici, & Maclean, 2009; Poortinga,
2007a; Tao, et al., 2007; Terry-McElrath & O'Malley, 2011; Westerterp, Meijer, Goris, &
185
Kester, 2004) and could be attributed to membership in sports or exercise programs
(Poortinga, 2007a). Participating in leisure-time physical activity not only provides a
chance to enhance one’s physical health, but also the opportunity to interact and develop
social relationships with teammates or colleagues. Once established, such friendships
may enhance exercise adherence (Unger & Johnson, 1995) and subsequently strengthen
social relationships as individuals continue to socialize with colleagues outside of
exercise facilities (Unger & Johnson, 1995). It is conceivable that interacting with
friends after the completion of an exercise session may occur while consuming alcoholic
beverages (M. T. French, et al., 2009).
In 1994/1995, alcohol consumption appeared to have no significant association with the
rate of change in leisure-time physical activity energy expenditure. However, this was
not the case for the covariance between initial levels of physical activity and future
consumption of alcohol. This weak, but significant, cross-behavioural covariance
suggested that Canadians with initially higher levels of energy expenditure during
leisure-time physical activity also reported significantly steeper positive trajectories of
alcohol consumption over subsequent years. Conversely, Canadians who demonstrated
lower levels of leisure-time physical activity also reported a flatter increase in their
alcohol consumption. Previous prospective epidemiological research has confirmed that
higher levels of physical activity at baseline are related to the adoption or an increase of
alcohol consumption (Aaron, et al., 1995; Wichstrom & Wichstrom, 2009).
The slope-slope covariance between leisure-time physical activity and alcohol
consumption implied that steeper increases in physical activity were related to greater
increases in alcohol consumption. On the other hand, as Canadians reported flatter
increases in their leisure-time physical activity, a shallower positive trajectory in the
consumption of alcohol would ensue. Unfortunately, this covariance did not reach
statistical significance. These findings coincide with others who have also been unable to
observe a significant association in concurrent changes between both behaviours
(Laaksonen, et al., 2002; Terry-McElrath & O'Malley, 2011). While it has been
suggested that promoting and integrating physical activity into alcohol treatment
programs could produce beneficial changes in alcohol consumption (Sinyor, et al., 1982),
the current findings implied that improving one’s leisure-time physical activity may not

186
translate into changes in alcohol consumption. Perhaps an observational study was
insufficient in producing similar behavioural changes that would occur during the course
of an intervention. Despite the lack of association in behavioural changes between
alcohol consumption and physical activity, the incorporation of physical activity as an
adjunct to alcohol treatment may provide alternative benefits. Individuals participating in
such programs often possess the capability and express an interest in physical activity
(Read, et al., 2001; Sinyor, et al., 1982) as well as experience a reduction in the urge to
consume alcohol (Ussher, et al., 2004).
5.6.2 Leisure-Time Physical Activity Energy Expenditure and Smoking:
The negative cross-behavioural intercept-intercept covariance indicated that, initially,
Canadians who reported high levels of leisure-time physical activity energy expenditure
also exhibited a lower daily quantity of cigarette use which may have included complete
abstinence. On the other hand, Canadians who demonstrated lower levels of physical
activity also smoked a greater number of cigarettes each day. These findings were not
surprising as smokers often demonstrate poor adherence to physical activity programs
(Cooper, et al., 2007) and thus report less physical activity compared to their non-
smoking counterparts (Barrett, Anda, Croft, Serdula, & Lane, 1995; Campbell, et al.,
2000; Cooper, et al., 2007; Larson, Story, Perry, Neumark-Sztainer, & Hannan, 2007;
Pate, Heath, Dowda, & Trost, 1996; Terry-McElrath & O'Malley, 2011; Wichstrom &
Wichstrom, 2009). It has been suggested that physical activity programs may need to be
specifically structured and tailored to meet the needs of current smokers (Cooper, et al.,
2007). Naturally, interventions developed for those individuals who are currently taking
action to change an unhealthy behaviour would be ineffective for individuals who have
no intention of changing their behaviour (Nigg, et al., 1999). Smokers may require
additional focus, motivation, and encouragement to improve adherence rates and
consequently physical activity levels (Cooper, et al., 2007).
A significant positive covariance was observed between the intercept of physical activity
and the slope of smoking. This suggested that Canadians who participated in high levels
of physical activity in 1994/1995 demonstrated a shallower decrease in daily cigarette
use. Alternatively, those individuals who initially expended lower levels of energy

187
during leisure-time physical activity exhibited a greater decline in tobacco use over
subsequent cycles. The positive covariance between these two latent variables was
unexpected as it was believed that Canadians with higher initial levels of physical activity
would report steeper declines in tobacco use. However, others have also reported a
similar association (Wichstrom & Wichstrom, 2009). Once again, this covariance could
be attributed to a floor effect. Compared to physically active smokers, physically
inactive Canadians reported significantly greater levels of tobacco use. Consequently,
physically inactive smokers could reduce their cigarette use at a faster or steeper rate
compared to physically active smokers.
The positive covariance between the intercept of smoking and the slope of physical
activity did not reach statistical significance. Therefore, initial smoking status was not
related to changes in leisure-time physical activity energy expenditure. Coinciding with
the present results, Cooper et al. (2007) found that initial smoking behaviour was not
associated with changes in physical activity suggesting that tobacco use does not hinder
or prevent improvements in physical activity levels.
As a final point, a significant negative slope-slope covariance was found between leisure-
time physical activity energy expenditure and tobacco use. Therefore, an increasing
positive trajectory in physical activity energy expenditure corresponded to a steeper
decline in smoking behaviour. Alternatively, a flatter positive trend in physical activity
coincided with a shallower negative trend in tobacco use. In previous studies,
behavioural intentions to change physical activity and smoking were not significantly
associated with one another (Boudreaux, et al., 2003). However, behavioural intentions
do not always translate into actual behaviour change (Callaghan, et al., 2007). The
current findings confirm that changes in these two health behaviours are interrelated
(Laaksonen, et al., 2002; Nagaya, et al., 2007; Terry-McElrath & O'Malley, 2011).
However, it is important to acknowledge that the observed slope-slope correlation was
weak (r = -0.11).
Unfortunately, causality was not a focal point in the current analysis. Furthermore, it
would be impractical to establish such a relationship as covariances and correlations are
not indicative of cause and effect associations (H. Frank & Althoen, 1994; Kitchens,
1998). Therefore it was difficult to determine which behavioural change, physical
188
activity or smoking, should be initially implemented. Establishing causality in the
interrelationship between physical activity energy expenditure and smoking would be an
area of research that should be addressed in the future as a consensus has yet to be
reached (Audrain-McGovern, et al., 2003; Costakis, et al., 1999; Nagaya, et al., 2007).
The development of innovative strategies, policies, and public health programs that
educate, prevent, and assist younger and more dependent smokers to achieve smoking
cessation are necessary (P. I. Frank, et al., 2004). Physical activity may provide such an
opportunity. In recent years, consideration has been given to physical activity as a
potential tobacco harm reduction strategy (W. deRuiter & Faulkner, 2006; W. K.
deRuiter, et al., 2008; Everson, Taylor, & Ussher, 2010; Weinstein, Marcus, & Moser,
2005). Physical activity has shown the ability to diminish the urge to smoke (Daniel,
Cropley, & Fife-Schaw, 2007; A. H. Taylor, Katomeri, & Ussher, 2005), minimize
withdrawal symptoms (Daniel, et al., 2007), reduce the number of cigarettes smoked on a
daily basis (W. K. deRuiter, et al., 2008), improve the likelihood of attempting cessation
(W. K. deRuiter, et al., 2008; Gauthier, et al., 2012), lower the risk of mortality from
ischemic heart disease and stroke (Wen, et al., 2012), and enhance the quality of life
among smokers (Ferrucci, et al., 1999). Furthermore, smokers have reported a tendency
to possess a greater number of unhealthy behaviours suggesting that smoking facilitates
the adoption of additional unhealthy behaviours (Campbell, et al., 2000; Emmons,
Linnan, et al., 1999; Emmons, et al., 1994; Keller, et al., 2008; Prattala, et al., 1994;
Rosal, et al., 2001). Health professionals may have more success in changing one’s
smoking behaviour if they initially target other health behaviours such as physical
activity (Butterfield, et al., 2004). Initially, focusing on physical activity would be a
reasonable choice as smokers express a greater interest in changing their physical activity
levels as opposed to achieving smoking cessation (Campbell, et al., 2000; Garrett, et al.,
2004). As a successful change in physical activity is adopted and maintained, additional
favourable behavioural changes including smoking cessation may ensue (Audrain-
McGovern, et al., 2003; Costakis, et al., 1999; Finnegan & Suler, 1985; Sherwood, et al.,
2000).
A transfer effect refers to the acquisition of knowledge, competence, and skills during the
adoption of one behaviour which is later conveyed towards additional behaviours (S. M.

189
Barnett & Ceci, 2002). This transfer effect may also provide justification for the
observed co-variation between physical activity and smoking. Evidence of a transfer
effect between physical activity and smoking has been presented suggesting that regular
physical activity is associated with a reduction in smoking behaviour (Nigg, Lee,
Hubbard, & Min-Sun, 2009). Therefore, promoting physical activity may discourage one
from adopting smoking behaviour as physically active individuals could be more health
conscious and aware of the health consequences linked with tobacco use (Nigg, et al.,
2009).
Although physical activity has the potential to act as a gateway behaviour for smoking
cessation, one cannot discount the possibility that smoking cessation facilitates changes
in physical activity (Nagaya, et al., 2007). Weight gain is often acknowledged as a
barrier in achieving smoking cessation (Milligan, et al., 1997). Individuals may choose
to adopt physical activity as an effective means of weight management while attempting
to change their smoking behaviour. Physical activity has demonstrated short-term
success in delaying weight gain following smoking cessation (Marcus, et al., 1999).
Furthermore, in an attempt to become more health conscious, individuals who achieve
smoking cessation may decide to adopt additional healthy behaviours including an active
lifestyle (Finnegan & Suler, 1985; Nagaya, et al., 2007).
As physical activity and smoking demonstrated a significant interrelationship with one
another, it is reasonable to believe that public health programs that incorporate both
behaviours could have a substantial impact on the health and well-being of smokers
compared to programs which focus exclusively on smoking cessation. However, if such
programs are to be implemented, health professionals will need to dedicate more time in
advising and promoting physical activity as a smoking cessation strategy (Everson, et al.,
2010). Naturally these multiple health behaviour programs would need to be tailored to
address the specific needs and concerns of smokers. Poor adherence towards physical
activity would certainly be one concern that health professionals would need to consider
(Cooper, et al., 2007; Marcus, et al., 1999). Perhaps adherence rates could be enhanced
by promoting leisure-time activities that are popular among smokers including walking,
gardening, ice skating, and jogging (Gauthier, et al., 2012). Other concerns may include
the recruitment of sedentary smokers, achieving cessation rather than harm reduction, and
190
maintaining favourable behavioural changes once such programs have concluded. The
integration of both behaviors into a single program is not without its challenges.
However, if successful, such programs could provide smokers with an innovative and
effective strategy for achieving smoking cessation and living a healthier lifestyle.
5.6.3 Alcohol Consumption and Smoking:
A significant positive intercept-intercept covariance was observed between alcohol
consumption and smoking. This suggested that in 1994/1995, Canadians who smoked a
greater number of cigarettes on a daily basis also consumed higher quantities of alcohol.
On the other hand, Canadians who were non-smokers or smoked a fewer number of
cigarettes also exhibited abstinence from alcohol or consumed smaller quantities of
alcohol. This covariance was expected as smoking usually occurs in conjunction with
alcohol consumption. Smokers often consume greater volumes of alcohol as well as
consume alcohol more frequently compared to former or non-smokers (Breslau, et al.,
1996; Carmelli, et al., 1993; S. A. French, Hennrikus, & Jeffery, 1996; Perkins, et al.,
1993; Torabi, et al., 1993). In addition, individuals who consume higher quantities of
alcohol typically smoke more cigarettes compared to their counterparts who consume
alcohol in moderation or practice abstinence (Burling & Ziff, 1988; T. Gordon & Doyle,
1986).
A significant negative covariance was found between the intercept of alcohol
consumption and the rate of change in smoking. Therefore, Canadians who initially
consumed higher quantities of alcohol demonstrated a steeper decline in tobacco use.
This finding was unanticipated as intuition would have one believe that lower initial
levels of alcohol consumption would be associated with a greater decline in cigarette use.
Nevertheless, a positive relationship between the consumption of low to moderate levels
of alcohol and smoking cessation has been verified by previous research (Breitling,
Muller, Raum, Rothenbacher, & Brenner, 2010). Furthermore, in this sample, excessive
consumers of alcohol also smoked significantly greater quantities of cigarettes. Thus, it
is likely that these individuals could reduce their tobacco use at a steeper rate compared
to their counterparts who consumed lower levels of alcohol and smoked fewer cigarettes
per day.
191
The non-significant intercept-slope covariance between smoking and alcohol
consumption indicated that baseline smoking status had no influence on changes in
alcohol consumption over time. This negative covariance contrasts with the findings of
Laaksonen et al. (2002). However, the utilization of dichotomous health behaviours and
a logistic regression analysis was unlike the methodology and statistical analysis
employed in the current study. Therefore, it is not surprising that differences in results
occurred between the two studies.
The positive relationship between the slopes of alcohol consumption and smoking
behaviour suggested that increases in the consumption of alcohol were associated with a
slower decline in smoking behaviour, while a decrease in the positive trajectory of
alcohol consumption corresponded to a further reduction in smoking behaviour. The fact
that changes in one health behaviour influenced changes in the other behaviour coincides
with the findings of cross-sectional (Keller, et al., 2008) and longitudinal research
(Breslau, et al., 1996; Dierker, et al., 2006; Shaw, et al., 2011). Unfortunately, the
current findings were in contrast with those of Carmelli et al. (1993) such that individuals
who achieved smoking cessation may report an increase, albeit small, in their levels of
alcohol consumption compared to their non-smoking counterparts. However, as former
smokers reported a smaller increase in alcohol consumption compared to continuing
smokers, the findings may suggest that positive changes in smoking can result in
beneficial changes in alcohol consumption that would otherwise not be experienced by
those individuals who were persistent smokers (Carmelli, et al., 1993). Laaksonen et al.
(2002) was also unable to report a significant association in behavioural changes between
smoking and alcohol consumption. However, as previously mentioned, methodological
and statistical inconsistencies between this study and that conducted by Laaksonen et al.
(2002) could be responsible for these conflicting results.
The positive correlation between alcohol consumption and smoking could be attributed to
specific cues. The urge to participate in both behaviours demonstrates a positive
association (Gulliver, et al., 1995). As these behaviours share several prompts, exposure
to an unhealthy behaviour may act as a gateway that leads to the participation in an
additional risky health behaviour (Miller, et al., 1983; Sobell, Sobell, Kozlowski, &
Toneatto, 1990). In this case, it is believed that alcohol consumption may induce or

192
promote smoking related cues (Epstein, Sher, Young, & King, 2007; Field, Mogg, &
Bradley, 2005; Sayette, Martin, Wertz, Perrott, & Peters, 2005) as tobacco products are
often desired when consuming excessive quantities of alcohol in an attempt to enhance
the effects of alcoholic beverages (Epstein, et al., 2007). Furthermore, smokers will use
tobacco products several times throughout the day without succumbing to alcohol
consumption (Kahler, et al., 2009). However, others have suggested that individuals who
achieve smoking cessation may acquire specific cognitive behavioural techniques as well
as coping strategies which assist in the ability to quit drinking (Burling & Ziff, 1988).
Therefore, it appears that reducing or eliminating social, behavioural, or environmental
cues may assist in initiating the adoption of healthier alcohol and smoking behaviours
(Ellingstad, et al., 1999; Epstein, et al., 2007). This transfer effect between alcohol
consumption and smoking as been observed by others (Nigg, et al., 2009). As these two
behaviours appear to share similar characteristics, it not surprising that a stronger
correlation was observed between alcohol consumption and smoking as opposed to
leisure-time physical activity and smoking.
Again, causality could not be established through the use of covariances and correlations.
A randomized study design would be more appropriate for establishing causality than
observational data. However, if the sequence in which behavioural changes are
administered is irrelevant, treatment programs which focus on changing both behaviours
may become more effective by adopting a choice-based approach (Berg, et al., 2012;
Campbell, et al., 2002). Permitting individuals to choose and prioritize behavioural
changes to adopt and successfully maintain could provide the motivation, incentive, and
self-efficacy to change additional behaviours that are more challenging and influential to
their overall health and well-being (Strecher, et al., 2002). However, as previous
research has contrasting opinions as to which behavioural change should be initially
administered (Breslau, et al., 1996), future research pertaining to this discipline is
necessary.
Individuals who desire to quit smoking and drinking concurrently could represent a
population which should be targeted by treatment programs as the majority of individuals
may opt to achieve smoking cessation during or after the resolution of alcoholism
(Ellingstad, et al., 1999). Addiction programs which incorporate alcohol abstinence in

193
conjunction with smoking cessation could lead to favourable changes in both unhealthy
behaviours by offering cognitive behavioural techniques that are similar across both
behaviours (Burling & Ziff, 1988; Miller, et al., 1983). Hence, a transfer effect between
these two behaviours may ensue. Furthermore, adopting and maintaining a healthy
behaviour may diminish specific cues that are associated with additional behaviours
(Ellingstad, et al., 1999). Consequently, favourable changes in both behaviours may
transpire from the enrolment in such treatment programs (J. J. Prochaska, et al., 2004).
5.6.4 Summary of Multiple Health Behaviours:
The current analysis observed a significant interrelationship between specific health
behaviours; leisure-time physical activity energy expenditure and smoking as well as
alcohol consumption and smoking. These weak, but significant correlations between
behaviours suggest that favourable changes in one health behaviour were significantly
associated with positive changes in additional health behaviours. The fact that specific
health behaviours demonstrate a tendency to interrelate suggests that one behaviour may
act as a gateway behaviour; “a behaviour that, when intervened upon, has a positive
influence on other behaviour changes” (Nigg, et al., 2002, pg. 676). Thus, health
professionals can no longer consider health behaviours to be independent, but rather
interrelated. Therefore, adopting smoking cessation may provide a teachable moment in
which individuals implement additional favourable behaviours including participation in
leisure-time physical activity and/or partaking in moderation or abstinence of alcohol.
Unfortunately, the association between alcohol consumption and leisure-time physical
activity energy expenditure did not reach statistical significance.
The fact that health behaviours interrelate could be attributed to complementary
mediating cognitive-behavioural mechanisms that are mutual among behaviours (Bock, et
al., 1998; T. K. King, et al., 1996). As a favourable change in one health behaviour
transpires, changes in cognitive-behavioural mechanisms could initiate the adoption of
additional healthy behaviours (Bock, et al., 1998; Boyle, O'Connor, Pronk, & Tan, 2000;
T. K. King, et al., 1996; Unger, 1996). Therefore, the success of behavioural
interventions may depend on the inclusion of techniques and strategies that enhance
cognitive-behavioural mechanisms. Potentially, mastery could represent a cognitive-

194
behavioural mechanism that facilitates multiple behavioural changes. Such potential is
discussed in subsequent sections. As public health programs accept the notion that health
behaviours are interrelated, the impact on the health and well-being at the population
level could be substantial.
It is important to acknowledge that while the majority of cross behavioural covariances
had reached statistical significance, many of the correlations would be considered weak.
However, the interpretation of correlation coefficients is often subjective and varies from
one discipline to the next (Norman & Streiner, 2000). In addition, this is not the first
study to report weak associations between multiple behaviours (Boyle, et al., 1998;
Garrett, et al., 2004; Lippke, et al., 2012). In fact, weak correlations between health-
promoting behaviours such as physical activity and health-risk behaviours including
alcohol consumption or smoking are not unusual (Lippke, et al., 2012). Furthermore,
multiple behavioural changes can be difficult to achieve without an intervention that is
tailored towards the motivational readiness of its participants. For these reasons, in this
observational study, the magnitude of each cross-behavioural correlation was expected to
be small. Evaluating how individuals adopt and maintain healthy behaviours in a natural
environment is an essential step in understanding the behavioural change process (J. O.
Prochaska, et al., 1992). Consequently, the findings of the present study are intended to
be exploratory and to guide the future development of public health programs and
strategies. Had similar correlations been evaluated in a multiple health behaviour change
intervention, the strength of such correlations may have been greater (Emmons, Shadel,
et al., 1999). Conceivably, the observed significant correlations could be attributed to the
substantial sample size that was recruited for this study. Although caution should be
considered in the interpretation of these findings, this analysis indicates that a weak
association exists between health behavioural changes which may substantially effect
mortality and quality of life of individuals at the population level.
5.6.5 Implications of Findings:
The occurrence of co-variation between health behaviours can have numerous
implications. Perhaps the most obvious benefit of co-variation would be a reduction in
the likelihood of encountering morbidity and mortality (Chang, et al., 2001; Haveman-

195
Nies, et al., 2002; Knoops, et al., 2004; Meng, et al., 1999). As quality of life and
longevity are enhanced by the adoption of multiple healthy behaviours, improvements in
workplace productivity as well as reductions in worker’s compensation claims and health
care costs would certainly ensue (Edington, 2001). The co-variation of health behaviours
may also provide health professionals with an efficient strategy for managing and/or
treating multiple health behaviours. Health professionals can concentrate their time and
resources on enhancing one behaviour as opposed to improving two behaviours (Pronk,
Peek, et al., 2004; Tucker & Reicks, 2002). For example, by assisting individuals in
achieving smoking cessation, health professionals could indirectly influence changes in
alcohol consumption as well as leisure-time physical activity energy expenditure.
Furthermore, if co-variation occurs in a sequential fashion, multiple behavioural
programs could provide an opportunity for individuals to choose which behavioural
changes are initially implemented (de Vries, Kremers, et al., 2008). This may bring
about greater success in achieving behavioural changes (Ampt, et al., 2009; Berg, et al.,
2012; Campbell, et al., 2000; Strecher, et al., 2002).
It is also hopeful that these findings will inform and direct both government as well as
private agencies as to where monetary funding should be allocated. Health Canada may
decide that the re-assignment of funding from single to multiple behavioural
interventions would be more practical and sensible for Canadians. Furthermore, these
findings may convince agencies to financially support specific behavioural interventions.
One option that appears promising would be incorporating smoking cessation with the
promotion of physical activity or alcohol abstinence. For example, in 2013, Statistics
Canada estimated nearly 30 million individuals over the age of 14 residing in Canada
(Statistics Canada, 2013). According to the findings of this study, 14% of the Canadian
population are characterized as physically inactive smokers. This would be equivalent to
approximately 4.1 million Canadians. If only 10% of these individuals achieve co-
variation in these two behaviours, the implications on morbidity, mortality, and health
care expenditures could be substantial. A similar case could be made for smokers who
consume excessive quantities of alcohol. The current findings suggest that 1% of the
general population or approximately 295,000 Canadians simultaneously participate in
excessive alcohol consumption and tobacco use. Once again, if only 10% of these

196
individuals are successful in achieving co-variation, the impact on public health could be
considerable. If the current findings influence the dissemination of government funding,
they may consequently induce future policy decisions and recommendations.
Although multiple behavioural change programs appear to be a promising avenue for
public health, a number of challenges will need to be addressed before the development
and implementation of such programs can commence. One challenge that continues to
hinder behavioural change research is the fact that health behaviours are often viewed
within isolated silos representing individual entities rather than being inter-related (Hale
& Viner, 2012; Orleans, 2005; J. O. Prochaska, 2008). However, the findings of this
study provide evidence to suggest that this perspective is dated and perhaps no longer
relevant. There is a sense of urgency among researchers and policymakers to break away
from traditional beliefs that address health behaviours independently of one another
(Orleans, 2004, 2005; Pronk, Peek, et al., 2004). Such beliefs leave providers, program
planners, and policymakers with few options to effectively assist, counsel, educate, and
treat the majority of the general population who possess multiple unhealthy behaviours
(Orleans, 2005). In recent years, researchers and policymakers have been called upon to
collaborate with one another to develop comprehensive multi-disciplinary initiatives and
strategies that facilitate multiple health behaviour change (Atkins & Clancy, 2004;
Jordan, Ory, & Goldman Sher, 2005; J. O. Prochaska, 2005; S. Solomon & Kington,
2002). The collaboration of health professionals across multiple disciplines would be
beneficial as individuals could contribute and share their own unique set of resources,
concepts, strategies, and expertise (S. D. Solomon, 2005). This concept of collaboration
could be particularly essential for excessive alcohol consumption and tobacco use. Since
alcohol consumption and smoking demonstrate an inter-relationship, treatment for both
behaviours may necessitate the incorporation of individuals with an expertise in
addictions as cues related to alcohol consumption may trigger a relapse in smoking and
vice versa.
If public health professionals and policymakers recognize that health behaviours are
inter-related as opposed to independent entities, the development of new and innovative
behavioral change theories will be essential in explaining how, when, and why multiple
behavioural changes can be facilitated (Orleans, 2005). Theory-comparison may provide

197
valuable insight into this process (Nigg, et al., 2002). Theory-comparison allows for the
evaluation and integration of multiple theories simultaneously (Nigg, et al., 2002). This
is essential for numerous reasons. First, theory A may explain motivating factors that
promote the adoption of healthier behaviours, while theory B can provide an
understanding into how individuals can maintain such favourable changes (Nigg, et al.,
2002). Independently, these theories describe specific aspects of the behavioural change
process. However, through theory-comparison, one may compose a new theory that fully
explains the process of multiple behavioural change (Nigg, et al., 2002). Furthermore,
existing theories may not completely explain differences in behavioural changes
necessitating the development of new theories (Nigg, et al., 2002).
Although the health benefits of physical activity are well known, a significant proportion
of the general population are unable or unwilling to participate in adequate levels of
leisure-time physical activity. The findings of this study reiterate this perspective as over
70% of this Canadian sample did not satisfy the recommended guideline for a physically
active lifestyle at any data collection period. For this reason, public health professionals
need to focus their attention and resources on developing innovative approaches in
motivating the general population to participate in sufficient levels of physical activity
(Talbot, et al., 2003). Considering that a substantial proportion of the general population
is physically inactive as well as the health risks associated with the adoption of such a
lifestyle, public health programs should reflect on devoting as much effort and resources
into increasing physical activity levels as they put forth into implementing other
behavioural changes such as smoking cessation. Once a physically active lifestyle is
adopted, the findings of this study suggest that positive behavioural changes in tobacco
use are more likely to ensue among daily and occasional smokers.
5.7 Demographic Covariates:
Demographic characteristics can have a substantial influence on the behavioural change
process. These characteristics are often indicative of whether individuals possess the
willingness and/or capability to adopt and/or maintain behavioural changes (Boyle, et al.,
1998). Such characteristics may include gender, chronological age, marital status,
education, income, and BMI (T. A. Barnett, et al., 2008; Fine, et al., 2004; Li, et al.,

198
2009; Poortinga, 2007b; Prattala, et al., 1994; Schmitz, French, & Jeffery, 1997;
Vandelanotte, et al., 2008). The effect that each demographic characteristic had on the
interrelationship of multiple health behaviours is discussed in the following paragraphs.
For the purpose of the current analysis, gender and age were considered time-invariant
covariates, while marital status, education, income adequacy, and BMI were deemed
time-varying covariates.
5.7.1 Gender:
It was not surprising that gender was significantly associated with alcohol consumption,
leisure-time physical activity, and smoking as the effects of gender on health behaviours
are well established. Males often demonstrate a tendency to possess a greater number of
unhealthy behaviours (Emmons, McBride, Puleo, Pollak, Marcus, et al., 2005; Fine, et
al., 2004; Li, et al., 2009). More specifically, compared to females, males report a greater
likelihood of consuming more alcohol (Allison, et al., 1999; Casswell, Pledger, &
Hooper, 2003; Klein-Geltink, et al., 2006; Schuit, et al., 2002) and partaking in tobacco
use (Klein-Geltink, et al., 2006; Leatherdale & Shields, 2009; Li, et al., 2009). Physical
activity is the exception as males are typically more physically active than females (T. A.
Barnett, et al., 2008; Craig, et al., 2007; Klein-Geltink, et al., 2006; Leatherdale, Manske,
Faulkner, Arbour, & Bredin, 2010). In addition to possessing healthier behaviours at the
outset of the NPHS, females also exhibited more favourable behavioural trajectories
compared to their male counterparts. Over time, females reported a slower increase in
alcohol consumption and a more rapid positive growth in physical activity. However,
females demonstrated a flatter or slower decline in the use of tobacco products which
coincides with the findings of others (Vlasoff, et al., 2008).
5.7.2 Chronological Age:
Older individuals have a tendency to report a greater number of healthier behaviours
(Berrigan, et al., 2003; Fine, et al., 2004; Poortinga, 2007b; Rosal, et al., 2001). By their
early fifties, individuals often meet the recommended guidelines for various health
behaviours including alcohol consumption, physical activity, and smoking (Berrigan, et
al., 2003). The current analysis found that chronological age had a significant role in

199
alcohol consumption and smoking behaviour. Older Canadians demonstrated a slower
rate of positive growth in alcohol consumption and a steeper decline in smoking
behaviour compared to younger Canadians. Previous research has observed declines in
both alcohol consumption and tobacco use with age (Leatherdale & Shields, 2009;
Moore, et al., 2005; Shaw, et al., 2011; Shields, 2007a; van Loon, Tijhuis, Surtees, &
Ormel, 2005). In fact, age can have such a substantial effect on tobacco use that older
individuals are more likely to achieve smoking cessation (Hymowitz, et al., 1997).
In regards to leisure-time physical activity, younger individuals have been known to
possess activity levels that surpass their older counterparts (T. A. Barnett, et al., 2008; I.
M. Lee, et al., 1992; Schmitz, et al., 1997). Initially, this association was observed as
older Canadians reported lower levels of physical activity. However, over subsequent
cycles, older Canadians demonstrated an increase in leisure-time physical activity
confirming the findings of others (I. M. Lee, et al., 1992; Steffen, et al., 2006). Although
this increase in physical activity was significant, its magnitude was quite small. The
latter years of one’s life may provide the opportunity to dedicate more time towards a
physically active lifestyle as employment and familial obligations begin to decline (Satia,
et al., 2004). It is important to acknowledge that the slope of leisure-time physical
activity did not reach statistical significance in the parallel process model involving
alcohol consumption and physical activity. Perhaps the inclusion of alcohol consumption
attenuated any potential differences in physical activity between younger and older
Canadians.
5.7.3 Marital Status:
In nearly every cycle of the NPHS, marital status had a significant positive effect on both
alcohol consumption and tobacco use. Unmarried Canadians, including those who were
single, divorced, separated, or widowed, consumed higher quantities of alcohol as well as
reported greater use of tobacco. The importance of conducting oneself as a role model
for their children, married individuals may promote healthy behaviours by choosing to
participate in abstinence or moderation of alcohol consumption and smoking. This may
explain why the transition from being single to married is accompanied by a reduced
likelihood of partaking in excessive alcohol consumption and tobacco use (Karlamangla,

200
et al., 2006; McDermott, et al., 2004). Furthermore, being single may provide more
frequent opportunities to socialize with friends. Such social gatherings may contribute to
regular consumption of alcohol and/or tobacco use. Marital status was also positively
associated with physical activity as unmarried Canadians were expending more energy
during their leisure-time physical activity. Perhaps, married individuals may encounter
familial obligations and greater responsibilities which do not provide sufficient time to
participate in leisure-time physical activity. These associations between marital status
and health behaviours are not uncommon and have been previously observed by others
(Broms, Silventoinen, Lahelma, Koskenvuo, & Kaprio, 2004; Karlamangla, et al., 2006;
Leatherdale & Shields, 2009; McDermott, et al., 2004; Moore, et al., 2005; Schmitz, et
al., 1997; van Loon, et al., 2005).
5.7.4 Education:
Education is believed to be a strong predictor of multiple healthy behaviours (Berrigan, et
al., 2003; Emmons, McBride, Puleo, Pollak, Marcus, et al., 2005; Fine, et al., 2004; Li, et
al., 2009; Prattala, et al., 1994; Pronk, Anderson, et al., 2004; Rosal, et al., 2001).
However, the current findings suggest this was not necessarily the case for all health
behaviours. Education was significantly associated with alcohol consumption during
every cycle of data collection such that Canadians who had acquired at least some post-
secondary schooling consumed higher quantities of alcohol. In the early cycles,
education demonstrated a tendency to be negatively associated with leisure-time physical
activity. However, during the latter cycles, a positive relationship had emerged between
education and leisure-time physical activity suggesting that those individuals who had
acquired higher academic achievements expended greater amounts of energy expenditure
during their leisure-time. One explanation for this finding could be that highly educated
individuals often engage less physically demanding occupations. Since their occupation
does not provide adequate levels of physical activity, such individuals may feel that they
need to acquire more sufficient levels of physical activity. It is during their leisure-time
in which they have their only opportunity to be physically active. Others have also
observed a positive association between education and health behaviours; alcohol
consumption (Moore, et al., 2005) and physical activity (Schmitz, et al., 1997). Unlike

201
alcohol consumption and leisure-time physical activity energy expenditure, one’s
educational achievement appeared to have a lesser influence on smoking behaviour.
Initially, the association between education and tobacco use was positive before
becoming negative in the latter cycles. This transition from a positive to a negative
association could be attributed to individuals acquiring more awareness and education
about the harmful effects of tobacco use as they age. However, it is important to
acknowledge that significant associations between education and tobacco use were only
observed during half of the data collection cycles. Although this finding was unexpected,
others have also been unable to observe an association between education and smoking
cessation (Hymowitz, et al., 1997).
5.7.5 Income Adequacy:
The adherence to multiple health behaviours is associated with higher household income
(Berrigan, et al., 2003; Li, et al., 2009). The current analysis found that income adequacy
was perhaps most influential on alcohol consumption and physical activity. Both alcohol
consumption and leisure-time physical activity were positively associated with income
adequacy suggesting that Canadians earning higher incomes reported greater levels of
alcohol consumption and leisure-time physical activity energy expenditure. Positive
associations between income and alcohol consumption (Moore, et al., 2005) as well as
physical activity (T. A. Barnett, et al., 2008; Craig, et al., 2007; Iribarren, Luepker,
McGovern, Arnett, & Blackburn, 1997; Pomerleau, Pederson, Ostbye, Speechley, &
Speechley, 1997) have been acknowledged by others. Although occurring during the
latter cycles, the negative association between income adequacy and tobacco use implied
that Canadians earning higher incomes demonstrated lower tobacco use in the form of
moderation or complete abstinence. The relationship between household income and
tobacco use (Iribarren, et al., 1997; D. S. Lee, et al., 2009) as well as smoking cessation
(Hymowitz, et al., 1997) has been previously confirmed. The fact that this association
was only present during half of the data collection cycles may suggest that income
adequacy was not a strong predictor of tobacco use.
Education and income are two demographic characteristics that are often used inter-
changeably. After all, it is reasonable to believe that a positive association exists between

202
both attributes. However, this may not always be the case as tradesmen can earn high
incomes while spending relatively few years in an academic institution. In addition, in
the current analysis, income was not simply calculated on the basis of total annual
household income, but this variable took into consideration the number of individuals
residing in the household (Statistics Canada, 2008). It was interesting to note that at
various cycles, it was not unusual for income adequacy to be significantly associated with
a particular behaviour, while education demonstrated no such relationship and vice versa.
5.7.6 Body Mass Index:
Derived from one’s weight and height, BMI is often used as an indicator of body fat.
Therefore, it is not surprising that BMI, to some extent, was associated with alcohol
consumption, leisure-time physical activity, and smoking. The present analysis observed
a significant negative relationship between BMI and leisure-time physical activity as well
as smoking. These findings, which are in agreement with previous research (T. Gordon
& Doyle, 1986; Kimokoti, et al., 2010; Lahti-Koski, Pietinen, Heliovaara, & Vartiainen,
2002; Laitinen, Pietilainen, Wadsworth, Sovio, & Jarvelin, 2004; Schmitz, et al., 1997;
Zimmermann, Ekholm, Gronbaek, & Curtis, 2008), indicate that obese or overweight
Canadians reported less physical activity and reduced use or abstinence from tobacco
products. In the earlier cycles of the NPHS, previous findings were confirmed (Lahti-
Koski, et al., 2002; Laitinen, et al., 2004) as a positive association involving BMI and
alcohol consumption was observed. However, during the sixth cycle, this significant
relationship became negative suggesting that obese or overweight Canadians consumed
lower levels of alcohol.
5.7.7 Summary of Demographic Covariates:
Identifying demographic and cognitive behavioural characteristics that are associated
with multiple unhealthy behaviours could assist public health professionals in targeting
individuals who are at greatest risk of chronic disease as well as those who are
motivationally ready to adopt and maintain healthy behavioural changes (Poortinga,
2007b; Schuit, et al., 2002). It has been suggested that public health efforts and resources
should be targeted towards disadvantaged individuals as such individuals often appear to
203
partake in multiple unhealthy behaviours simultaneously (Babor, Sciamanna, & Pronk,
2004; Boniface, et al., 2001; Li, et al., 2009; Orleans, et al., 1999; Schuit, et al., 2002).
This analysis confirms that participating in unhealthy behaviours is generally associated
with unfavourable demographic characteristics; lower education and lesser income
adequacy. Therefore, it is recommended that multiple health behaviour interventions be
specifically tailored and intended for such disadvantaged individuals.
While demographic characteristics may identify which individuals possess specific
unhealthy behaviours, such characteristics do not appear to impede or hinder the
interrelationship of health behaviours. Despite the fact that behavioural correlations may
have been slightly attenuated after accounting for demographic characteristics, they
continued to exhibit comparable strength to those correlations that were unadjusted for
demographic characteristics. Likewise, covariances that were significant in the
unadjusted models remained significant in the adjusted models. The fact that estimates
for behavioural correlations and covariances remained relatively unchanged after
adjusting for demographic characteristics discredits the perception that specific
individuals are incapable of modifying unhealthy behaviours. One's gender,
chronological age, marital status, educational level, income status, or body composition
appeared to be irrelevant in the occurrence of co-variation. From the perspective of
health professionals and policymakers, these findings are advantageous for several
reasons. First, the success of strategies and public health programs in implementing
multiple behavioural changes is not dependent upon demographic characteristics of
individuals. Successful behavioural changes can be facilitated throughout the general
population which enhances the reach of such programs. Second, since specific
demographic characteristics are relatively difficult or impossible to alter, strategies and
programs need not be concerned with attempting to alter these characteristics. This will
allow the opportunity to dedicate greater resources towards characteristics that are more
easily modifiable and could provide greater success in promoting co-variation.
5.8 Mediating Effects of Mastery:
Mediation is the process by which a third variable, known as a mediator, either partially
or fully explains the causal relationship between the independent and dependent

204
variables. Consequently, the inclusion of a mediating variable attenuates the coefficient
between the independent and dependent variables. Alternatively, a moderator refers to a
variable that has no part in the causal relationship, but rather changes the direction and/or
strength of an association between the independent and dependent variables (Baron &
Kenny, 1986; MacKinnon, et al., 2007). Evaluating potential mediating variables may
provide essential information pertaining to the causal relationship between such variables
(MacKinnon, et al., 2007). In a single mediator model, the independent variable
influences the mediator and in succession the mediator effects the dependent variable
(MacKinnon, et al., 2007).
Mastery refers to the “extent to which one regards one’s life-chances as being under
one’s own control in contrast to being fatalistically ruled” (Pearlin & Schooler, 1978, pg.
5). Similar to self-efficacy and locus of control, personal control is a fundamental
component of perceived mastery (Pearlin & Pioli, 2003). However, unlike locus of
control, mastery tends to centre around controlling events that the individual perceives as
of great importance to their life as opposed to circumstances related to their environment
(Pearlin & Pioli, 2003). In the current analysis, mastery was believed to act as a potential
mediator in the interrelationship of health behaviours. Over the duration of the NPHS,
mastery demonstrated a small, but significant decline among Canadians. This
longitudinal trend coincides with the findings from previous empirical research
(Mirowsky, 1995; Pearlin, Nguyen, Schieman, & Milkie, 2007). Middle age has been
shown to represent an important period in one's lifetime as perceived control begins to
diminish at this point (Mirowsky & Ross, 2007). The findings of this analysis provide
some evidence to support the conclusions of Mirowsky and Ross (2007).
As was the case with each of the three health behaviours, a linear model was used to
depict the trajectory of mastery. Although the inclusion of an additional growth factor
may have provided superior fit over the linear model, the CFI and RMSEA of the linear
mastery model were within the appropriate cut-off values; ≥ 0.96 and ≤ 0.05,
respectively. The SRMR could have been improved, however it also remained within an
acceptable range (Hu & Bentler, 1999). The interpretability of more complex mediation
models was also a concern, thereby providing further justification for modeling mastery
as a linear trajectory.

205
Perceived mastery seemed to have the most consistent effect on leisure-time physical
activity as well as smoking. In both parallel process models, mastery appeared to have a
positive and significant influence on leisure-time physical activity. Allison et al. (1999)
was unable to detect a relationship between mastery and leisure-time physical inactivity,
while Cairney et al. (2005) observed a weak, albeit significant, correlation between these
aforementioned variables. It is important to consider that mastery may influence
physical activity longitudinally as opposed to within a cross-sectional design.
Furthermore, Allison et al. (1999) had accounted for the effects of demographic and/or
social characteristics in their analysis. Perhaps the association between mastery and
leisure-time physical activity would no longer reach statistical significance after
accounting for such characteristics. In addition to influencing physical activity, mastery,
in turn, was affected by physical activity verifying the findings of others (Sorensen, 1997;
Sorensen, et al., 1997). Unlike leisure-time physical activity, changes in smoking neither
initiated nor resulted from changes in mastery. This association has also been observed
by others (Allison, et al., 1999; Sneed, et al., 2001). Perhaps, in the case of tobacco use,
mastery may not provide individuals with sufficient self-control, discipline, and resolve
to achieve cessation. Alcohol consumption demonstrated an interesting association with
perceived mastery. Although changes in alcohol consumption had significantly and
positively influenced changes in perceived mastery, changes in mastery had no
significant effect on changes in alcohol consumption.
Unfortunately, for the majority of mediation models, mastery was unsuccessful in
mediating the co-variation of health behaviours. Some have suggested that mastery
denotes a more universal evaluation of perceived control rather than assessing specific
phases of health behaviours (Allison, et al., 1999; Cairney, et al., 2009). For this reason,
mastery is not perceived as significantly associated with health behaviours (Allison, et
al., 1999; Sneed, et al., 2001). Furthermore, mastery is recognized as an essential
mediating component of the stress process (Avison & Cairney, 2003). Therefore, while
mastery may support individuals in coping with stressful events, this cognitive
mechanism may not actually assist in the initiation or maintenance of such behavioural
changes. Finally, according to the Theory of Planned Behaviour, perceived behavioural
control can influence behaviours either directly or indirectly through one’s intentions
206
(Ajzen, 1991). Perhaps, as a potential mediator, mastery was inadequate in altering one’s
intentions to adopt favourable changes in excessive alcohol consumption and tobacco
use.
Interestingly, mastery appeared to demonstrate the properties of a suppressor variable
rather than a mediating variable. A suppressor variable is known to conceal the
relationship between causal and outcome variables (Cheung & Lau, 2008). The criteria
for establishing a suppresser variable within a causal relationship are twofold: 1) the
indirect and total effects demonstrate opposing signs (Rucker, et al., 2011), and 2) the
direct effect is greater than the total effect (Rucker, et al., 2011). In the alcohol
consumption and smoking model, mastery had fulfilled both of these criteria and thus
represented a suppressor variable. In the physical activity and smoking model, mastery
had only satisfied the first criterion and therefore could potentially act as a suppressor
variable (Rucker, May 17, 2013). In both cases, it could be worthwhile for health
promotion programs to include strategies that promote mastery as the association
between the independent and dependent variables is strengthened with the addition of
mastery (Rucker, et al., 2011).
Notwithstanding the inability of mastery to act as a potential mediator in the majority of
models, this analysis concluded that mastery mediates the association in which changes
in alcohol consumption initiates changes in leisure-time physical activity. Increasing
one’s alcohol consumption appeared to provide Canadians with a sense of control which
sequentially results in favourable changes in leisure-time physical activity. It was
surprising to observe a positive association between alcohol consumption and mastery.
Perhaps higher levels of education and/or income adequacy that were associated with
consuming greater quantities of alcohol provided individuals with a sense of control over
events that were deemed important. On the other hand, it is conceivable that any
improvements in mastery may not be genuine but rather a false sense of control that is
triggered by excessive alcohol consumption. Public health programs and strategies which
emphasize moderation and/or abstinence of alcohol could reduce one’s perception of
control over events thereby reducing leisure-time physical activity levels. Therefore,
programs that wish to promote physical activity following a reduction or abstinence in

207
alcohol consumption may need to focus their attention on additional cognitive
behavioural mechanisms instead of mastery.
The fact that both the indirect and direct effects between alcohol consumption and
leisure-time physical activity reached statistical significance suggests that mastery
partially mediates the relationship between these two health behaviours (MacKinnon, et
al., 2007). Although full mediation was not achieved, one should not discount the
valuable contribution that mastery has in the relationship between alcohol consumption
and leisure-time physical activity (Rucker, et al., 2011). As multiple behavioural change
is quite complex, it is unlikely that a single mediating cognitive-behavioural mechanism
such as mastery would provide a complete explanation in the association between alcohol
consumption and leisure-time physical activity. Other cognitive behavioural
determinants may have greater success in changing health behaviours. One such
mechanism could be self-efficacy (Bock, et al., 1998; DiClemente, et al., 1985; T. K.
King, et al., 1996; O'Hea, et al., 2004; Von Ah, Ebert, Ngamvitroj, Park, & Kang, 2004)
as it is often considered essential in the initiation of behaviour change (Love, et al.,
1996). Future research should evaluate the potential mediating effects of self-efficacy in
the interrelationship of multiple health behaviours. As the presence of multiple unhealthy
behaviours continues to be quite prevalent within the general population, the
identification and targeting of mediators that are associated with the adoption and
maintenance of positive behavioural changes will be essential (Costakis, et al., 1999;
Dierker, et al., 2006).
5.9 Strengths:
Although cross-sectional studies have provided valuable insight into the interrelationship
of multiple health behaviours, such study designs only provide a “snapshot” of
associations between health behaviours. The inability to account for change in health
behaviours is an essential limitation. Accordingly, over the last several decades, research
has acknowledged the necessity to evaluate the interrelationship of multiple health
behavioural change through a longitudinal study design (Boudreaux, et al., 2003;
Costakis, et al., 1999; Garrett, et al., 2004; Herrick, et al., 1997; Nigg, et al., 1999; Rosal,
et al., 2001). Longitudinal studies are not constrained to such a limitation as this type of

208
research design involves the collection of repeated measures of information on the same
individual over multiple time periods. As such, longitudinal studies appear to be a more
appropriate method to evaluate co-variation and could represent the future of multiple
health behaviour change (Blakely, et al., 2004).
Commencing in 1994/1995 with subsequent cycles occurring biennially, the current
analysis had utilized seven data collection periods representing 12 years of health
behaviour information. The duration of time that this study encompasses surpasses that
of previous observational longitudinal studies (Audrain-McGovern, et al., 2003; Breslau,
et al., 1996; Dierker, et al., 2006; Jessor, et al., 2006; Kahler, et al., 2009; Laaksonen, et
al., 2002; McDermott, et al., 2004; Murray, et al., 2002; Nagaya, et al., 2007; Perkins, et
al., 1993; Saules, et al., 2004). This presents a greater opportunity to not only evaluate
health behavioural changes, but to monitor the trajectories of these health behaviours
over a considerable period of one’s lifetime.
In addition to the length of time in which data was collected, the number of evaluation
cycles that were administered should also be considered a strong point of the current
analysis. In the past, naturally occurring longitudinal studies have typically measured
health behaviours on two occasions (Breslau, et al., 1996; Carmelli, et al., 1993; T.
Gordon & Doyle, 1986; Kahler, et al., 2009; Laaksonen, et al., 2002; McDermott, et al.,
2004; Murray, et al., 2002; Perkins, et al., 1993). In contrast to these research studies, the
current analysis had incorporated seven data collection periods. By utilizing numerous
cycles of data collection, this study offers several advantages that are unfeasible for
studies that have incorporated only two periods of data collection. As additional health
behaviour information is collected, the precision of parameter estimates is enhanced
(Francis, et al., 1991; Rimm & Stampfer, 2004; D. Rogosa, et al., 1982). Additional
improvements in the precision of the parameter estimates could also be achieved by the
relatively close spacing of the observation cycles (Francis, et al., 1991). Furthermore, the
incorporation of numerous assessment periods permits the opportunity to evaluate various
growth trajectories (Francis, et al., 1991). It has been reported that two data collection
cycles are inadequate to fit a linear change (MacCallum, et al., 1997; Streiner, 2008),
while more complex non-linear trajectories may require more than five measurement
occasions (MacCallum, et al., 1997). Thus, the evaluation of linear and non-linear
209
change is not a feasible option for researchers that have collected information at two time
periods.
The recruitment of a representative sample continues to be a challenge that will need to
be addressed within future multiple health behaviour research (Nigg, et al., 2002). The
evaluation of the interrelationship of multiple health behaviour change within various
subgroups including women (Perkins, et al., 1993), Japanese males (Nagaya, et al., 2007),
younger individuals (Breslau, et al., 1996), university students (Keller, et al., 2008),
middle-aged male twins (Carmelli, et al., 1993), individuals with at least one chronic
illness (Boudreaux, et al., 2003; Boyle, et al., 1998), as well as pregnant women (Pirie, et
al., 2000) may generate findings that are not applicable to the general population. The
recruitment of a large nationally representative population-based sample of over 15,000
Canadians which included individuals from diverse subgroups of the general population
enhanced the strong external validity of these findings.
From the perspective of policy markers, the utilization of dichotomous or categorical
variables would be preferred as the designated cut-off criteria indicating the presence or
absence of a healthy lifestyle would be fairly straightforward to interpret and easily
conveyed to the general population. However, it is believed that the use of continuous
variables had improved the ability of this study to detect changes, both favourable and
unfavourable, in alcohol consumption, leisure-time physical activity energy expenditure,
and smoking behaviour. By relying on specific health guidelines, behavioural changes
would otherwise be unnoticed unless one was to surpass the established cut-off criteria.
This study provides a good example of this concept. As a dichotomous variable,
notwithstanding the role of attrition, only a small proportion of Canadians, 8.0%, had
achieved smoking cessation from 1994/1995 to 2006/2007. However, overlooked by this
dichotomous variable were individuals who reported a reduction in tobacco use but were
unable to achieve smoking cessation. By employing a continuous variable, those
individuals who accomplished even the slightest behavioural change were recognized as
adopting a healthier smoking behaviour. Therefore, continuous variables are more
sensitive in identifying behavioural changes.
Unlike traditional statistical methods for evaluating longitudinal change, latent growth
curve analysis does not exclude individuals with incomplete data (Streiner, 2002, 2008;

210
Stull, 2008). Instead, the use of maximum likelihood estimation can fit linear and non-
linear trajectories based upon all available observations (Bollen & Curran, 2006; B.
Muthen, Kaplan, & Hollis, 1987; Wu, et al., 2009). This is an important advantage of
using growth curve modelling as attrition is often common among longitudinal study
designs. Aside from reducing attrition bias, additional benefits of utilizing latent growth
curve analysis include the ability to incorporate numerous and unequally spaced cycles of
data collection (Francis, et al., 1991; Willett & Sayer, 1996) as well as the capability to
estimate parameters that were free from measurement error (Stull, 2008).
5.10 Limitations:
In spite of the numerous strengths associated with this study, several limitations should
be considered that are not unusual for longitudinal survey research. One limitation that is
often associated with the utilization of a longitudinal study design is attrition (Lilienfeld
& Stolley, 1994). This study was not exempt from such a limitation. At the completion
of the seventh cycle of the NPHS, only 51% of Canadians had provided valid responses
for all variables of interest. According to Table 12, Canadians who completed the
household component questionnaire at the seventh assessment period were more likely to
be younger, married or formerly married, with higher levels of education, income
adequacy, and BMI scores compared to their counterparts who failed to participate in the
seventh cycle. Furthermore, mastery, alcohol consumption, smoking behaviour, as well
as the number of chronic conditions possessed also appeared to distinguish between
participation membership. These significant associations suggest that specific individuals
could be underrepresented within this sample. Consequently, over time, generalizing
these findings back to the broader population could be difficult as the sample may no
longer represent the population from which it was recruited. In anticipation of this
limitation, sampling weights were employed for this statistical analysis. Calculated by
Statistics Canada, these sampling weights indicate the probability that an individual was
selected at the initial assessment (Statistics Canada, 2008). Thus, each individual in the
sample represents themselves as well as numerous other Canadians who were not
recruited within the sample (Korn & Graubard, 1991; Statistics Canada, 2008). The
employment of sampling weights should provide estimates that are similar to those that

211
would be calculated for the entire population (Korn & Graubard, 1995). Statistics
Canada recommends the use of sampling weights for any statistical analysis that is
performed using the longitudinal NPHS (Statistics Canada, 2008). With the utilization of
such sampling weights, the representativeness of the Canadian target population is
preserved at the first cycle (Statistics Canada, 2008). Therefore, the sampling weights
contributed to the strong external validity of the study. However, in subsequent cycles,
the representativeness of this sample could be suspected as suggested by the logistic
regression model in Table 12.
Studies involving the surveillance of alcohol consumption and physical activity often
depend on self-reported measures (Finney, et al., 2003; Katzmarzyk & Tremblay, 2007).
However, one drawback that is frequently cited when relying on self-reported measures is
the possibility that participants may provide socially desirable responses (Barrett, et al.,
1995; Katzmarzyk & Tremblay, 2007; Satia, et al., 2004). Known as social desirability
bias, the tendency for participants to provide responses that they believe others will deem
as favourable may underestimate unhealthy behaviours such as alcohol consumption and
smoking behaviour, while overestimating healthy lifestyles including physical activity.
Although self-reported measures may threaten internal validity, they have been shown to
be valid in monitoring alcohol consumption (Del Boca & Darkes, 2003), physical activity
(Craig, et al., 2002), and smoking behaviour (Yeager & Krosnick, 2010). Perhaps the
most precise method in assessing health behaviours would involve a series of
biochemical and physiological techniques. However, such verification methods would be
extremely time consuming, expensive, invasive, and an exhaustion of resources. Such
techniques are often considered unfeasible for large population-based samples such as the
NPHS (Emmons, Shadel, et al., 1999; Oenema, Brug, Dijkstra, de Weerdt, & de Vries,
2008). Therefore, research that involves the recruitment of large population-based
samples have very few options and typically rely upon the use self-reported measures to
assess health behaviours (Emmons, Shadel, et al., 1999).
Recall decay, a form of response error, could also be introduced to research that relies on
self-reported measures. Recall decay refers to “a decline in the ability to recall an event
as the event recedes in time” (R. A. Johnson, et al., 1998, pg. 356). This form of
response bias may compromise the validity within this study. However, recall decay may

212
have been minimized as the time frame in which health behaviours were assessed was
relatively short. Smoking behaviour was measured at the present time. Alcohol
consumption was assessed over the previous week prior to the interview, while
individuals were asked to recall information from the previous three months for leisure-
time physical activity energy expenditure. Since individuals were asked to recall
information pertaining to recent participation in health behaviours, it is likely that any
recall decay that may have been experienced would have been minimal.
An additional dilemma associated with attrition pertains to missing data. Missing data
has proven to be challenging when utilizing traditional statistical methods as individuals
with missing responses are excluded from any analysis (Gueorguieva & Krystal, 2004).
When a substantial proportion of one’s sample is excluded from the analysis, bias could
be introduced as the findings are based upon individuals who may no longer be
representative of the original sample (Schafer & Olsen, 1998). Over the years, several
techniques have been developed to cope with missing data. The use of maximum
likelihood estimation fits a trajectory based upon all available observations (Bollen &
Curran, 2006; Wu, et al., 2009). Consequently, individuals who provide at least one valid
response are included in the analysis. Maximum likelihood estimation provides non-bias
estimates even if the assumption of data missing completely at random is violated (B.
Muthen, et al., 1987). Another approach for dealing with missing data is multiple
imputation. With multiple imputation, missing data is replaced with plausible responses
in multiple datasets (Schafer & Olsen, 1998). Such plausible responses are predicted
from reported answers of other individuals in the sample (Schafer & Olsen, 1998). In the
current analysis, multiple imputation was only utilized in the demographic time-varying
covariate models as a solution in preventing listwise deletion. Had multiple imputation
not been used in the aforementioned covariate models, these findings may have been
susceptible to bias. It was possible to use multiple imputation throughout the entire
analysis of the current study. However, in large sample sizes, whenever possible,
maximum likelihood estimates are recommended over multiple imputation (Schafer &
Olsen, 1998). Although one could argue that missing data may have influenced the
findings of this study, a supplementary analysis was performed in which missing data
was replaced with imputed data. As outlined in Appendix 1, few differences in

213
behavioural covariances and correlations were identified between the current findings and
the results of the imputed data. The fact that similarities were observed between the
original and imputed findings suggests that attrition bias had minimal influence on the
current findings. Consequently the external validity of the study remained strong.
The representativeness of the current sample was difficult to establish. Comparing
demographic characteristics with previous studies would be challenging as different time
frames and the use of various demographic categories have been used. In previous
datasets including the Canadian Community Health Survey, Statistics Canada has
typically employed a stratified multi-stage design to recruit individuals from the general
population with the objective of creating a representative sample. Had access been
granted to use the Canadian Community Health Survey as well as its respective sampling
weights, it would have been possible to conduct a comparison of the demographic
characteristics. Unfortunately, such a comparison could not be performed. The use of
sampling weights that were provided in the NPHS were adjusted by Statistics Canada to
represent the general population at 1994/1995. Thus, with the incorporation of the
sampling weights, it is reasonable to believe that the current sample was representative of
the general Canadian population at the initial data collection period and contributed to the
strong external validity of the study.
Maximum likelihood estimation assumes that observed variables demonstrate
multivariate normality (Bollen & Curran, 2006; Preacher, et al., 2008; Stull, 2008; Wu, et
al., 2009). Typically, this assumption is unrealistic (Olsson, et al., 2000). When this
assumption is violated, researchers should be aware of the possibility that standard errors
and significance testing could be incorrect (Bollen & Curran, 2006). As observed in
Table 16, all three health behaviours violated the assumption of multivariate normality.
However, maximum likelihood estimation has been shown to produce accurate estimates
despite violations of normality (Olsson, et al., 2000). Furthermore, the use of bootstrap
procedures that produce confidence intervals has been suggested for analyzing non-
normally distributed data (Bollen & Stine, 1990). MPLUS software offers 99% bias-
corrected bootstrap confidence intervals that “take non-normality of the parameter
estimate distribution into account” (L. K. Muthen & Muthen, 1998-2011, pg. 647).

214
With regards to physical activity, this study specifically focused upon leisure-time
physical activity energy expenditure. However, leisure-time physical activity represents
only one domain of total energy expenditure (Jacobi, et al., 2009; Weller & Corey, 1998).
Additional domains of energy expenditure that are often overlooked include occupational
and household. Measures for both occupational and household energy expenditure were
not considered for this analysis as they were unavailable in the seven cycles of the NPHS.
Therefore, these two domains of total energy expenditure could not be assessed. The
exclusion of occupational and household energy expenditure is likely to underestimate
total energy expenditure as non-leisure-time energy expenditure usually accounts for a
substantial amount, 40 to 82%, of one's total energy expenditure, particularly among
women (Steffen, et al., 2006; Weller & Corey, 1998).
When calculating variance estimates, the multi-stage survey design of the NPHS must be
taken into consideration (Statistics Canada, 2008). The use of bootstrapping weights,
which is recommended by Statistics Canada, provides unbiased estimates of variances
(Statistics Canada, 2008). However, this analysis was unable to employ the
recommended bootstrapping weights as a bootstrapping program for growth curve
models has not been developed (Statistics Canada, 2008). As bootstrap weights were not
utilized in the current analysis, it is possible that standard errors and/or confidence
intervals for parameter estimates were larger than if the bootstrap weights were
employed. As a result, associations that were previously non-significant may have
become significant had bootstrapping weights been applied. However, for the most part,
this is unlikely to occur as non-significant associations tended to have p-values that were
quite large. In an attempt to compensate for the inability to employ the bootstrapping
weights provided by Statistics Canada, bias-corrected bootstrap confidence intervals were
requested for each latent growth curve model.
MacKinnon (2008) described a technique in which mediation effects can be calculated
through the use of a parallel process model. Such models involve the development of
growth trajectories for the independent, mediating, and dependent variables. However,
the ability to establish a causal association in mediation models that assess variables at
simultaneous time periods could prove to be challenging and biased. Reverse or
concurrent causation may result from such models (Selig & Preacher, 2009). As outlined

215
by Selig and Preacher (2009), a sequential process approach could be more appropriate
for representing mediation models as the independent, mediating, and dependent
variables are repeatedly measured on a sequential continuum. Arguably, this technique
may not have been appropriate for this study as the independent, mediating, and
dependent variables would each require a minimum of three time periods to fit a linear
trajectory (MacCallum, et al., 1997; Streiner, 2008) for a total of nine assessment periods.
However, at the completion of this analysis, only eight cycles of data had been collected.
Consequently, it is important to acknowledge that although mastery demonstrated a
significant indirect effect between alcohol consumption and physical activity, one should
not disregard the fact that this finding could have been attributed to additional variables.
Finally, it is important to consider the possibility that more complex models may have
shown similar or enhanced fit of the longitudinal dataset (MacCallum & Austin, 2000).
The current analysis opted to develop simple unconditional and multivariate models by
incorporating linear trajectories as well as covariances that were deemed necessary to
answer the proposed research question. In an attempt to improve model fit, researchers
may choose to include additional growth factors, pathways, or covariances.
Consequently, in contrast with the proposed models in the current analysis, more
complex parallel process models may reveal dissimilar associations. Although model fit
could have been improved with the addition of growth factors or covariances between
residual variances, the minimum cut-offs for CFI, RMSEA, and SRMR for each
unconditional and multivariate model was upheld in the present analysis. MacCallum et
al. (1992) recommends that “... when an initial model fits well, it is probably unwise to
modify it to achieve even better fit because the modifications may simply be fitting small
idiosyncratic characteristics of the sample” (MacCallum, Roznowski, & Necowitz, 1992,
pg. 501). Modifications that are implemented for the purpose of enhancing model fit may
result in the development of models that lack generalizability (MacCallum, et al., 1992).
5.11 Future Research:
Although the findings of this study provide significant insight into the understanding of
multiple health behavioural change, they also re-affirm as well as introduce additional
questions that will need to be addressed by future research. The purpose of this study
216
was to evaluate the interrelationship of behavioural changes within a nationally
representative population-based multi-wave database. In addressing this research
question, this study incorporated several methodological strengths that contributed to its
novelty. The multi-wave longitudinal study design had the capability to recognize
behavioural trajectories over a considerable period of one's lifespan, while contributing to
the precision of calculated estimates. The use of a nationally representative sample
provided greater confidence that the findings were externally valid in the general
population. Assessing health behaviours as continuous variables was a more sensitive
approach in identifying behavioural changes. The evaluation of mastery as a potential
mediating mechanism was able to offer insight into the co-variation process. To my
knowledge, this is the first epidemiological study to evaluate the inter-relationship of
health behaviours using such methodological criteria. Consequentially, the integration of
these strengths yields a study that is unique in comparison to previous empirical research.
Future studies which employ a similar study design, sample, and outcomes are required
to verify these findings.
In previous epidemiological studies, the interrelationship of multiple health behaviour
change has often incorporated the evaluation of dietary intake. This analysis was unable
to evaluate dietary intake as information pertaining to fruit and vegetable consumption
was limited to only three of the first seven cycles of data collection. Furthermore, dietary
fat intake was completely non-existent. In previous research, dietary intake has typically
been evaluated with physical activity as these two behaviours are often used in
conjunction for weight management programs. The interrelationship between dietary
intake and physical activity is controversial (Bock, et al., 1998; Reedy, et al., 2005; W. C.
Taylor, et al., 2004; Wilcox, King, Castro, & Bortz, 2000). Future research should
evaluate the potential interrelationship between dietary intake and other health behaviours
by incorporating a similar methodology as the present analysis; a longitudinal study
design within a nationally representative population as well as the use of continuous
health behaviour outcomes. Dietary intake could be an effective gateway behaviour and
thus provide health professionals with an additional option in facilitating change in
supplementary health behaviours.

217
While these findings indicate that change in one health behaviour facilitates change in
another, a concern that continues to persist is how to produce the initial change in health
behaviours. In other words, why do some individuals decide to change health behaviours
while other individuals decide against making such changes? Surely, one should not
underestimate the role that cognitive-behavioural mechanisms play in behavioural
changes, particularly self-efficacy (DiClemente, et al., 1985; T. K. King, et al., 1996;
O'Hea, et al., 2004). The presence of chronic diseases has also been shown to increase an
individual’s motivational readiness to adopt healthier behaviours suggesting that
individuals with the greatest urgency to change unhealthy behaviours are often the most
motivated (Boyle, et al., 1998; Keenan, 2009). Thus, the diagnosis of an acute or chronic
condition could provide health professionals with the opportunity to intervene upon
unhealthy lifestyle behaviours (Keenan, 2009). This potential strategy could prove to be
most effective among older and disadvantaged individuals as they represent a segment of
the population who are more prone to chronic conditions. The identification of
demographic, cognitive-behavioural, and social determinants that distinguish between
individuals who choose to adopt and/or maintain health behaviours and their counterparts
who do not adopt healthy behaviours requires further evaluation (Boniface, et al., 2001;
Boyle, et al., 1998; Nigg, et al., 2002; O'Hea, Wood, & Brantley, 2003). This would
assist public health professionals in effectively allocating resources (Boniface, et al.,
2001; Boyle, et al., 1998).
Although it was established that individuals have the capacity to achieve behavioural
changes, it is unknown whether such changes had transpired in a simultaneous or
sequential fashion. The manner in which multiple behavioural changes are administered
continues to be a top priority among health professionals and requires further attention
(Nigg, et al., 2002; Orleans, 2005; Ory, et al., 2002; Pronk, Peek, et al., 2004; Spring,
Moller, & Coons, 2012; Sweet & Fortier, 2010). Simultaneous behaviour change has
often drawn criticism for overwhelming individuals and possibly hindering behavioural
change (Berg, et al., 2012). However, some have argued that this may not be the case
and have reported results that are in favour of using a simultaneous approach in achieving
behavioural change (Hyman, et al., 2007; J. J. Prochaska, et al., 2006). Others have
suggested that a sequential approach could prove to be more effective in adopting and

218
maintaining multiple behavioural changes (Spring, et al., 2004). In one instance,
Vandelanotte et al. (2008) observed that both simultaneous and sequential approaches
demonstrated similar success in multiple behavioural changes. If individuals are to be
successful in adopting and maintaining multiple behavioural changes, research must
determine an appropriate method of administering behavioural changes that does not
overwhelm individuals and allows them to take advantage of available resources.
If a sequential approach is deemed appropriate for multiple health behavioural changes,
an additional concern for health professionals arises in the form of causality (Orleans,
2005). In other words, do changes in smoking behaviour produce changes in physical
activity or do changes in physical activity result in changes in smoking behaviour? In the
case of physical activity and dietary fat intake, Vandelanotte et al. (2008) observed that
the order in which behavioural changes were initially administered had no influence on
the success of achieving changes in both behaviours. However, can similar conclusions
be drawn for other health behaviours such as alcohol consumption and smoking? The
order in which behavioural changes occurred was not a focal point of this study as
causality could not be determined through correlations. A randomized study design
would be appropriate for establishing causality between health behaviours. This could be
an avenue for future research to pursue. If the success of multiple health behaviour
interventions does not appear to be dependent upon the order in which behaviours are
administered, it could be meaningful to evaluate whether a choice-based intervention
provides greater success in changing multiple behaviours (Vandelanotte, et al., 2008).
Previous literature suggests that the presence of multiple unhealthy behaviours are
associated with specific demographic characteristics; male, a young age, and lower levels
of education and income (Berrigan, et al., 2003; Fine, et al., 2004; Laaksonen, et al.,
2003; Li, et al., 2009; Prattala, et al., 1994; Rosal, et al., 2001). As the probability of
possessing multiple unhealthy behaviours is greater among specific segments of the
general population, it appears that these individuals would benefit greatly from multiple
behavioural changes. Future research should determine whether the findings of this study
are consistent among various gender, age, educational, and socioeconomic groups (Pronk,
Peek, et al., 2004). Notwithstanding the role that demographic variables may have on
behavioural change, cognitive-behavioural characteristics should not be ignored. It is

219
conceivable that co-variation is more likely among individuals with higher levels of
mastery, self-efficacy, and/or motivational readiness to adopt healthier behaviours.
Unfortunately, information pertaining to cognitive-behavioural characteristics are not
typically addressed nor requested in large population-based health surveys. If findings
among various subgroups of the population are inconsistent, this would be an indication
that health professionals need to tailor public health programs, strategies, and policies
towards specific subgroups of the general population.
The mediation model involving alcohol consumption and physical activity revealed an
interesting relationship between these two behaviours. Alcohol consumption had a
positive influence on perceived mastery which in succession had a significant positive
effect on leisure-time physical activity. It was speculated that an increase in alcohol
consumption may provide individuals with a false sense of control that inadvertently
leads to a rise in leisure-time physical activity levels. However, this theory has yet to be
confirmed and requires further investigation into the interpretation of this relationship.

220
Chapter 6
Conclusion
6.1 Summary:
While multiple health behaviour change may represent the future of disease prevention
(L. Gordon, et al., 2007; J. O. Prochaska, 2008) several questions continue to persist,
most notably, do changes in one health behaviour influence changes in additional
behaviours (Butterfield, et al., 2004; Clark, et al., 2005; Costakis, et al., 1999; S. A.
French, et al., 1996; Herrick, et al., 1997; Rosal, et al., 2001)? This study attempted to
evaluate the interrelationship between multiple behavioural changes by incorporating a
longitudinal study design across multiple data collection cycles in a nationally
representative sample. Significant co-variation between health behaviours was observed
for leisure-time physical activity energy expenditure and smoking as well as alcohol
consumption and smoking. In both cases, these relationships suggested the occurrence of
a gateway behaviour wherein a favourable change in one behaviour was associated with a
positive change in the other. Unfortunately, these associations also implied that negative
behavioural changes facilitate unfavourable changes in an additional behaviour. One
should interpret these findings with caution as the correlations between behavioural
changes were weak and statistical significance could be attributed to the substantial
sample size of this secondary analysis. However, it can be argued that these weak
correlations have the potential to substantially influence the health and well-being of
thousands of individuals within the general population. It is important to consider that
co-variation between behaviours occurred in a natural environment, most likely without
the assistance of health professionals or interventions. The implementation of an
intervention may have resulted in stronger correlations between behavioural changes.
Nevertheless the findings of this study were exploratory and intended to guide the
development of tailored multiple behavioural interventions.
The second objective, another focal point in multiple health behaviour change research
(Nigg, et al., 2002; Rosal, et al., 2001), was to evaluate the potential mediating effect of
mastery in the interrelationship of behavioural changes. While mastery was significantly
associated with individual behaviours including leisure-time physical activity energy

221
expenditure and alcohol consumption, it was predominantly unsuccessful in mediating
the interrelationship of behavioural changes. The only exception in which mastery
mediated the interrelationship between multiple behavioural changes was observed
between alcohol consumption and leisure-time physical activity. In this case, increases in
alcohol consumption resulted in an enhancement of one’s perceived control which
consequently brought about a rise in leisure-time physical activity. Therefore, public
health programs which attempt to assist individuals in achieving moderation and/or
abstinence from the consumption of alcohol may inadvertently influence leisure-time
physical activity levels in a negative manner. Health professionals are unlikely to
endorse this notion as alternative forms of treatment for alcohol consumption exists that
do not compromise additional health behaviours. Future research will be required to
evaluate the mediation effect of additional cognitive-behavioural mechanisms between
behavioural changes (J. J. Prochaska & Prochaska, 2011; Sweet & Fortier, 2010).
Although the majority of behavioural change research has concentrated on single
behavioural change (Berg, et al., 2012; Costakis, et al., 1999; Coups, et al., 2004;
Emmons, et al., 1994; Nigg & Long, 2012; Pronk, Peek, et al., 2004), health
professionals are beginning to realize that multiple health behaviour change has the
potential to significantly impact the health and well-being of the general population by
effectively utilizing and allocating time, effort, and resources, while minimizing the strain
on the health care system, workers compensation costs, and workplace absenteeism
(Edington, 2001; J. J. Prochaska, Spring, et al., 2008; J. J. Prochaska, Velicer, et al.,
2008; Pronk, Peek, et al., 2004). However, if multiple health behavioural programs are to
be effective, a collaborative approach that considers the opinions and views of
researchers, primary care physicians, policy makers, health promotion professionals,
counsellors, individuals, and populations will be necessary (J. J. Prochaska, Velicer, et
al., 2008). The integration of pharmacological treatment, education, legislation and
policies, incentives, and prevention programs will also be essential in promoting
behavioural changes (S. Solomon & Kington, 2002; S. D. Solomon, 2005). Furthermore,
it is essential for individuals to establish realistic and attainable behavioural aspirations,
monitor their progress on a consistent basis, and integrate oneself with positive and
encouraging social support that promotes the adoption of such healthy behaviours as well

222
as enhances adherence to public health programs (Ory, et al., 2002). The development
and implementation of such interventions is long overdue.

223
References
Aarnio, M., Winter, T., Kujala, U., & Kaprio, J. (2002). Associations of health related
behaviour, social relationships, and health status with persistent physical activity
and inactivity: a study of Finnish adolescent twins. Br J Sports Med, 36(5), 360-
364.
Aaron, D. J., Dearwater, S. R., Anderson, R., Olsen, T., Kriska, A. M., & Laporte, R. E.
(1995). Physical activity and the initiation of high-risk health behaviors in
adolescents. Med Sci Sports Exerc, 27(12), 1639-1645.
Ajzen, I. (1985). From intentions to actions: A theory of planned behavior. In J. Kuhl &
J. Beckmann (Eds.), Action Control: From Cognition to Behavior (pp. 11-37).
Germany: Springer-Verlag Berlin Heidelberg.
Ajzen, I. (1991). The theory of planned behavior. Organ Behav Hum Decis Process, 50,
179-211.
Allison, K. R., Adlaf, E. M., Ialomiteanu, A., & Rehm, J. (1999). Predictors of health risk
behaviours among young adults: analysis of the National Population Health
Survey. Can J Public Health, 90(2), 85-89.
Ampt, A. J., Amoroso, C., Harris, M. F., McKenzie, S. H., Rose, V. K., & Taggart, J. R.
(2009). Attitudes, norms and controls influencing lifestyle risk factor management
in general practice. BMC Fam Pract, 10, 59.
Andrykowski, M. A., Beacham, A. O., Schmidt, J. E., & Harper, F. W. (2006).
Application of the theory of planned behavior to understand intentions to engage
in physical and psychosocial health behaviors after cancer diagnosis.
Psychooncology, 15(9), 759-771.
Apter, M. J. (1989). Reversal theory: Motivation, emotion, and personality. London:
Routledge.
Arbour-Nicitopoulos, K. P., Kwan, M. Y., Lowe, D., Taman, S., & Faulkner, G. E.
(2010). Social norms of alcohol, smoking, and marijuana use within a Canadian
university setting. J Am Coll Health, 59(3), 191-196.
Asparouhov, T. (2005). Sampling weights in latent variable modeling. Struct Equ
Modeling, 12(3), 411-434.

224
Atkins, D., & Clancy, C. (2004). Multiple risk factors interventions. Are we up to the
challenge? Am J Prev Med, 27(2 Suppl), 102-103.
Audrain-McGovern, J., Rodriguez, D., & Moss, H. B. (2003). Smoking progression and
physical activity. Cancer Epidemiol Biomarkers Prev, 12(11 Pt 1), 1121-1129.
Avison, W. R., & Cairney, J. (2003). Social structure, stress, and personal control. In S.
H. Zarit, L. I. Pearlin & K. W. Schaie (Eds.), Personal Control in Social and Life
Course Contexts. New York: Springer Publishing Company, Inc.
Babor, T. F., Sciamanna, C. N., & Pronk, N. P. (2004). Assessing multiple risk behaviors
in primary care. Screening issues and related concepts. Am J Prev Med, 27(2
Suppl), 42-53.
Bancej, C. M., Maxwell, C. J., Onysko, J., & Eliasziw, M. (2005). Mammography
utilization in Canadian women aged 50 to 69: identification of factors that predict
initiation and adherence. Can J Public Health, 96(5), 364-368.
Bandura, A. (1997). Self-efficacy: The exercise of control. New York: W.H. Freeman and
Company.
Barnett, S. M., & Ceci, S. J. (2002). When and where do we apply what we learn? A
taxonomy for far transfer. Psychol Bull, 128(4), 612-637.
Barnett, T. A., Gauvin, L., Craig, C. L., & Katzmarzyk, P. T. (2008). Distinct trajectories
of leisure time physical activity and predictors of trajectory class membership: a
22 year cohort study. Int J Behav Nutr Phys Act, 5, 57.
Baron, R. M., & Kenny, D. A. (1986). The moderator-mediator variable distinction in
social psychological research: conceptual, strategic, and statistical considerations.
J Pers Soc Psychol, 51(6), 1173-1182.
Barrett, D. H., Anda, R. F., Croft, J. B., Serdula, M. K., & Lane, M. J. (1995). The
association between alcohol use and health behaviors related to the risk of
cardiovascular disease: the South Carolina Cardiovascular Disease Prevention
Project. J Stud Alcohol, 56(1), 9-15.
Berg, C. J., Thomas, J. L., An, L. C., Guo, H., Collins, T., Okuyemi, K. S., et al. (2012).
Change in smoking, diet, and walking for exercise in Blacks. Health Educ Behav,
39(2), 191-197.
225
Berrigan, D., Dodd, K., Troiano, R. P., Krebs-Smith, S. M., & Barbash, R. B. (2003).
Patterns of health behavior in U.S. adults. Prev Med, 36(5), 615-623.
Blakely, F., Dunnagan, T., Haynes, G., Moore, S., & Pelican, S. (2004). Moderate
physical activity and its relationship to select measures of a healthy diet. J Rural
Health, 20(2), 160-165.
Bobo, J. K., Gilchrist, L. D., Schilling, R. F., 2nd, Noach, B., & Schinke, S. P. (1987).
Cigarette smoking cessation attempts by recovering alcoholics. Addict Behav,
12(3), 209-215.
Bock, B. C., Marcus, B. H., Rossi, J. S., & Redding, C. A. (1998). Motivational readiness
for change: Diet, exercise, and smoking. Am J Health Behav, 22(4), 248-258.
Bollen, K. A., & Curran, P. J. (2006). Latent Curve Models: A Structural Equation
Perspective. Hoboken, NJ: John Wiley & Sons, Inc.
Bollen, K. A., & Stine, R. (1990). Direct and indirect effects: Classical and bootstrap
estimates of variability. Sociol Methodol, 20, 115-140.
Bondy, S. J., Rehm, J., Ashley, M. J., Walsh, G., Single, E., & Room, R. (1999). Low-
risk drinking guidelines: the scientific evidence. Can J Public Health, 90(4), 264-
270.
Boniface, D. R., Cottee, M. J., Neal, D., & Skinner, A. (2001). Social and demographic
factors predictive of change over seven years in CHD-related behaviours in men
aged 18-49 years. Public Health, 115(4), 246-252.
Boudreaux, E. D., Francis, J. L., Carmack Taylor, C. L., Scarinci, I. C., & Brantley, P. J.
(2003). Changing multiple health behaviors: smoking and exercise. Prev Med,
36(4), 471-478.
Boyle, R. G., O'Connor, P., Pronk, N., & Tan, A. (2000). Health behaviors of smokers,
ex-smokers, and never smokers in an HMO. Prev Med, 31(2 Pt 1), 177-182.
Boyle, R. G., O'Connor, P. J., Pronk, N. P., & Tan, A. (1998). Stages of change for
physical activity, diet, and smoking among HMO members with chronic
conditions. Am J Health Promot, 12(3), 170-175.
Breitling, L. P., Muller, H., Raum, E., Rothenbacher, D., & Brenner, H. (2010). Low-to-
moderate alcohol consumption and smoking cessation rates: retrospective analysis
of 4576 elderly ever-smokers. Drug Alcohol Depend, 108(1-2), 122-129.

226
Breslau, N., Peterson, E., Schultz, L., Andreski, P., & Chilcoat, H. (1996). Are smokers
with alcohol disorders less likely to quit? Am J Public Health, 86(7), 985-990.
Broms, U., Silventoinen, K., Lahelma, E., Koskenvuo, M., & Kaprio, J. (2004). Smoking
cessation by socioeconomic status and marital status: the contribution of smoking
behavior and family background. Nicotine Tob Res, 6(3), 447-455.
Burling, T. A., & Ziff, D. C. (1988). Tobacco smoking: a comparison between alcohol
and drug abuse inpatients. Addict Behav, 13(2), 185-190.
Butterfield, R. M., Park, E. R., Puleo, E., Mertens, A., Gritz, E. R., Li, F. P., et al. (2004).
Multiple risk behaviors among smokers in the childhood cancer survivors study
cohort. Psychooncology, 13(9), 619-629.
Cairney, J., Faught, B. E., Hay, J., Wade, T. J., & Corna, L. M. (2005). Physical activity
and depressive symptoms in older adults. J Phys Act Health, 2, 98-114.
Cairney, J., Faulkner, G., Veldhuizen, S., & Wade, T. J. (2009). Changes over time in
physical activity and psychological distress among older adults. Can J Psychiatry,
54(3), 160-169.
Callaghan, R. C., Taykor, L., & Cunningham, J. A. (2007). Does progressive stage
transition mean getting better? A test of the Transtheoretical Model in alcoholism
recovery. Addiction, 102(10), 1588-1596.
Campbell, M. K., Tessaro, I., DeVellis, B., Benedict, S., Kelsey, K., Belton, L., et al.
(2000). Tailoring and targeting a worksite health promotion program to address
multiple health behaviors among blue-collar women. Am J Health Promot, 14(5),
306-313.
Campbell, M. K., Tessaro, I., DeVellis, B., Benedict, S., Kelsey, K., Belton, L., et al.
(2002). Effects of a tailored health promotion program for female blue-collar
workers: health works for women. Prev Med, 34(3), 313-323.
Carmelli, D., Swan, G. E., & Robinette, D. (1993). The relationship between quitting
smoking and changes in drinking in World War II veteran twins. J Subst Abuse,
5(2), 103-116.
Carson, V., Kuhle, S., Spence, J. C., & Veugelers, P. J. (2010). Parents' perception of
neighbourhood environment as a determinant of screen time, physical activity and
active transport. Can J Public Health, 101(2), 124-127.
227
Caspersen, C. J., Powell, K. E., & Christenson, G. M. (1985). Physical activity, exercise,
and physical fitness: definitions and distinctions for health-related research.
Public Health Rep, 100(2), 126-131.
Casswell, S., Pledger, M., & Hooper, R. (2003). Socioeconomic status and drinking
patterns in young adults. Addiction, 98(5), 601-610.
Centers for Disease Control and Prevention (2012). Consumption of cigarettes and
combustible tobacco - United States, 2000-2011. MMWR Morb Mortal Wkly Rep,
61, 565-569.
Chang, M., Hahn, R. A., Teutsch, S. M., & Hutwagner, L. C. (2001). Multiple risk factors
and population attributable risk for ischemic heart disease mortality in the United
States, 1971-1992. J Clin Epidemiol, 54(6), 634-644.
Cheong, J., Mackinnon, D. P., & Khoo, S. T. (2003). Investigation of Mediational
Processes Using Parallel Process Latent Growth Curve Modeling. Struct Equ
Modeling, 10(2), 238.
Cheung, G. W., & Lau, R. S. (2008). Testing mediation and suppression effects of latent
variables. Bootstrapping with structural equation models. Organ Res Methods,
11(2), 296-325.
Chinn, S., Jarvis, D., Melotti, R., Luczynska, C., Ackermann-Liebrich, U., Anto, J. M., et
al. (2005). Smoking cessation, lung function, and weight gain: a follow-up study.
Lancet, 365(9471), 1629-1635; discussion 1600-1621.
Chou, K. L. (2008). The prevalence and clustering of four major lifestyle risk factors in
Hong Kong Chinese older adults. J Aging Health, 20(7), 788-803.
Clark, P. G., Nigg, C. R., Greene, G., Riebe, D., & Saunders, S. D. (2002). The Study of
Exercise and Nutrition in Older Rhode Islanders (SENIOR): translating theory
into research. Health Educ Res, 17(5), 552-561.
Clark, P. G., Rossi, J. S., Greaney, M. L., Riebe, D. A., Greene, G. W., Saunders, S. D.,
et al. (2005). Intervening on exercise and nutrition in older adults: the Rhode
Island SENIOR Project. J Aging Health, 17(6), 753-778.
Collins, L. M. (2006). Analysis of longitudinal data: the integration of theoretical model,
temporal design, and statistical model. Annu Rev Psychol, 57, 505-528.

228
Conway, T. L., & Cronan, T. A. (1992). Smoking, exercise, and physical fitness. Prev
Med, 21(6), 723-734.
Cooper, T. V., Resor, M. R., Stoever, C. J., & Dubbert, P. M. (2007). Physical activity
and physical activity adherence in the elderly based on smoking status. Addict
Behav, 32(10), 2268-2273.
Costakis, C. E., Dunnagan, T., & Haynes, G. (1999). The relationship between the stages
of exercise adoption and other health behaviors. Am J Health Promot, 14(1), 22-
30.
Costanzo, P. R., Malone, P. S., Belsky, D., Kertesz, S., Pletcher, M., & Sloan, F. A.
(2007). Longitudinal differences in alcohol use in early adulthood. J Stud Alcohol
Drugs, 68(5), 727-737.
Coups, E. J., Gaba, A., & Orleans, C. T. (2004). Physician screening for multiple
behavioral health risk factors. Am J Prev Med, 27(2 Suppl), 34-41.
Craig, C. L., Bauman, A., Gauvin, L., Robertson, J., & Murumets, K. (2009).
ParticipACTION: A mass media campaign targeting parents of inactive children;
knowledge, saliency, and trialing behaviours. Int J Behav Nutr Phys Act, 6, 88.
Craig, C. L., Russell, S. J., & Cameron, C. (2002). Reliability and validity of Canada's
Physical Activity Monitor for assessing trends. Med Sci Sports Exerc, 34(9),
1462-1467.
Craig, C. L., Russell, S. J., Cameron, C., & Bauman, A. (2004). Twenty-year trends in
physical activity among Canadian adults. Can J Public Health, 95(1), 59-63.
Craig, C. L., Tudor-Locke, C., & Bauman, A. (2007). Twelve-month effects of Canada
on the Move: a population-wide campaign to promote pedometer use and
walking. Health Educ Res, 22(3), 406-413.
Cunningham, J. A., Faulkner, G., Selby, P., & Cordingley, J. (2006). Motivating smoking
reductions by framing health information as safer smoking tips. Addict Behav,
31(8), 1465-1468.
Cunningham, J. A., & Selby, P. L. (2010). Future intentions regarding quitting and
reducing cigarette use in a representative sample of Canadian daily smokers:
implications for public health initiatives. Int J Environ Res Public Health, 7(7),
2896-2902.

229
Cunningham, J. A., Selby, P. L., & Faulkner, G. (2007). Increasing perceived choice
about change in smokers: implications. Addict Behav, 32(9), 1907-1912.
Cunradi, C. B., Moore, R., Killoran, M., & Ames, G. (2005). Survey nonresponse bias
among young adults: the role of alcohol, tobacco, and drugs. Subst Use Misuse,
40(2), 171-185.
Curran, P. J., Harford, T. C., & Muthen, B. O. (1996). The relation between heavy
alcohol use and bar patronage: a latent growth model. J Stud Alcohol, 57(4), 410-
418.
Curran, P. J., Stice, E., & Chassin, L. (1997). The relation between adolescent alcohol use
and peer alcohol use: a longitudinal random coefficients model. J Consult Clin
Psychol, 65(1), 130-140.
Da Costa, D., Lowensteyn, I., & Dritsa, M. (2003). Leisure-time physical activity
patterns and relationship to generalized distress among Canadians with arthritis or
rheumatism. J Rheumatol, 30(11), 2476-2484.
Daniel, J. Z., Cropley, M., & Fife-Schaw, C. (2007). Acute exercise effects on smoking
withdrawal symptoms and desire to smoke are not related to expectation.
Psychopharmacology (Berl), 195(1), 125-129.
Davis, C. E. (1976). The effect of regression to the mean in epidemiologic and clinical
studies. Am J Epidemiol, 104(5), 493-498.
de Bruijn, G. J., & van den Putte, B. (2009). Adolescent soft drink consumption,
television viewing and habit strength. Investigating clustering effects in the
Theory of Planned Behaviour. Appetite, 53(1), 66-75.
de Graaf, R., Bijl, R. V., Smit, F., Ravelli, A., & Vollebergh, W. A. (2000). Psychiatric
and sociodemographic predictors of attrition in a longitudinal study: The
Netherlands Mental Health Survey and Incidence Study (NEMESIS). Am J
Epidemiol, 152(11), 1039-1047.
De Leon, J., Rendon, D. M., Baca-Garcia, E., Aizpuru, F., Gonzalez-Pinto, A., Anitua,
C., et al. (2007). Association between smoking and alcohol use in the general
population: stable and unstable odds ratios across two years in two different
countries. Alcohol Alcohol, 42(3), 252-257.

230
de Vries, H., Kremers, S., Smeets, T., & Reubsaet, A. (2008). Clustering of diet, physical
activity and smoking and a general willingness to change. Psychol Health, 23(3),
265-278.
de Vries, H., van 't Riet, J., Spigt, M., Metsemakers, J., van den Akker, M., Vermunt, J.
K., et al. (2008). Clusters of lifestyle behaviors: results from the Dutch SMILE
study. Prev Med, 46(3), 203-208.
Deering, K. N., Lix, L. M., Bruce, S., & Young, T. K. (2009). Chronic diseases and risk
factors in Canada's northern populations: longitudinal and geographic
comparisons. Can J Public Health, 100(1), 14-17.
Del Boca, F. K., & Darkes, J. (2003). The validity of self-reports of alcohol consumption:
state of the science and challenges for research. Addiction, 98 Suppl 2, 1-12.
Dergance, J. M., Mouton, C. P., Lichtenstein, M. J., & Hazuda, H. P. (2005). Potential
mediators of ethnic differences in physical activity in older Mexican Americans
and European Americans: results from the San Antonio Longitudinal Study of
Aging. J Am Geriatr Soc, 53(7), 1240-1247.
deRuiter, W., & Faulkner, G. (2006). Tobacco harm reduction strategies: the case for
physical activity. Nicotine Tob Res, 8(2), 157-168.
deRuiter, W. K., Faulkner, G., Cairney, J., & Veldhuizen, S. (2008). Characteristics of
physically active smokers and implications for harm reduction. Am J Public
Health, 98(5), 925-931.
DiClemente, C. C., Prochaska, J. O., Fairhurst, S. K., Velicer, W. F., Velasquez, M. M.,
& Rossi, J. S. (1991). The process of smoking cessation: an analysis of
precontemplation, contemplation, and preparation stages of change. J Consult
Clin Psychol, 59(2), 295-304.
DiClemente, C. C., Prochaska, J. O., & Gibertini, M. (1985). Self-efficacy and the stages
of self-change of smoking. Cognit Ther Res, 9(2), 181-200.
Dierker, L., Lloyd-Richardson, E., Stolar, M., Flay, B., Tiffany, S., Collins, L., et al.
(2006). The proximal association between smoking and alcohol use among first
year college students. Drug Alcohol Depend, 81(1), 1-9.
231
Doherty, S. C., Steptoe, A., Rink, E., Kendrick, T., & Hilton, S. (1998). Readiness to
change health behaviours among patients at high risk of cardiovascular disease. J
Cardiovasc Risk, 5(3), 147-153.
Driskell, M. M., Dyment, S., Mauriello, L., Castle, P., & Sherman, K. (2008).
Relationships among multiple behaviors for childhood and adolescent obesity
prevention. Prev Med, 46(3), 209-215.
Duncan, S. C., & Duncan, T. E. (1994). Modeling incomplete longitudinal substance use
data using latent variable growth curve methodology. Multivariate Behav Res,
29(4), 313-338.
Duncan, T. E., & Duncan, S. C. (2004). An introduction to latent growth curve modeling.
Behavior Therapy, 35(2), 333-363.
Dutton, G. R., Napolitano, M. A., Whiteley, J. A., & Marcus, B. H. (2008). Is physical
activity a gateway behavior for diet? Findings from a physical activity trial. Prev
Med, 46(3), 216-221.
Edington, D. W. (2001). Emerging research: a view from one research center. Am J
Health Promot, 15(5), 341-349.
Ellingstad, T. P., Sobell, L. C., Sobell, M. B., Cleland, P. A., & Agrawal, S. (1999).
Alcohol abusers who want to quit smoking: implications for clinical treatment.
Drug Alcohol Depend, 54(3), 259-265.
Emmons, K. M., Linnan, L. A., Shadel, W. G., Marcus, B., & Abrams, D. B. (1999). The
Working Healthy Project: a worksite health-promotion trial targeting physical
activity, diet, and smoking. J Occup Environ Med, 41(7), 545-555.
Emmons, K. M., Marcus, B. H., Linnan, L., Rossi, J. S., & Abrams, D. B. (1994).
Mechanisms in multiple risk factor interventions: smoking, physical activity, and
dietary fat intake among manufacturing workers. Working Well Research Group.
Prev Med, 23(4), 481-489.
Emmons, K. M., McBride, C. M., Puleo, E., Pollak, K. I., Clipp, E., Kuntz, K., et al.
(2005). Project PREVENT: a randomized trial to reduce multiple behavioral risk
factors for colon cancer. Cancer Epidemiol Biomarkers Prev, 14(6), 1453-1459.

232
Emmons, K. M., McBride, C. M., Puleo, E., Pollak, K. I., Marcus, B. H., Napolitano, M.,
et al. (2005). Prevalence and predictors of multiple behavioral risk factors for
colon cancer. Prev Med, 40(5), 527-534.
Emmons, K. M., Shadel, W. G., Linnan, L., Marcus, B. H., & Abrams, D. B. (1999). A
prospective analysis of change in multiple risk factors for cancer. Canc Res Ther
Contr, 8, 15-23.
Eng, P. M., Kawachi, I., Fitzmaurice, G., & Rimm, E. B. (2005). Effects of marital
transitions on changes in dietary and other health behaviours in US male health
professionals. J Epidemiol Community Health, 59(1), 56-62.
Epstein, A. M., Sher, T. G., Young, M. A., & King, A. C. (2007). Tobacco chippers show
robust increases in smoking urge after alcohol consumption.
Psychopharmacology (Berl), 190(3), 321-329.
Everett, S. A., Warren, C. W., Sharp, D., Kann, L., Husten, C. G., & Crossett, L. S.
(1999). Initiation of cigarette smoking and subsequent smoking behavior among
U.S. high school students. Prev Med, 29(5), 327-333.
Everson, E. S., Taylor, A. H., & Ussher, M. (2010). Determinants of physical activity
promotion by smoking cessation advisors as an aid for quitting: support for the
Transtheoretical Model. Patient Educ Couns, 78(1), 53-56.
Faden, V. B. (2006). Trends in initiation of alcohol use in the United States 1975 to 2003.
Alcohol Clin Exp Res, 30(6), 1011-1022.
Farrelly, M. C., Nimsch, C. T., Hyland, A., & Cummings, M. (2004). The effects of
higher cigarette prices on tar and nicotine consumption in a cohort of adult
smokers. Health Econ, 13(1), 49-58.
Feinstein, R. E., & Feinstein, M. S. (2001). Psychotherapy for health and lifestyle change.
J Clin Psychol, 57(11), 1263-1275.
Ferrucci, L., Izmirlian, G., Leveille, S., Phillips, C. L., Corti, M. C., Brock, D. B., et al.
(1999). Smoking, physical activity, and active life expectancy. Am J Epidemiol,
149(7), 645-653.
Field, M., Mogg, K., & Bradley, B. P. (2005). Alcohol increases cognitive biases for
smoking cues in smokers. Psychopharmacology (Berl), 180(1), 63-72.

233
Figueredo, A. J., McKnight, P. E., McKnight, K. M., & Sidani, S. (2000). Multivariate
modeling of missing data within and across assessment waves. Addiction, 95
Suppl 3, S361-380.
Filion, K. B., Steffen, L. M., Duval, S., Jacobs, D. R., Jr., Blackburn, H., & Luepker, R.
V. (2012). Trends in smoking among adults from 1980 to 2009: the Minnesota
heart survey. Am J Public Health, 102(4), 705-713.
Fine, L. J., Philogene, G. S., Gramling, R., Coups, E. J., & Sinha, S. (2004). Prevalence
of multiple chronic disease risk factors. 2001 National Health Interview Survey.
Am J Prev Med, 27(2 Suppl), 18-24.
Finnegan, D. L., & Suler, J. R. (1985). Psychological factors associated with maintenance
of improved health behaviors in postcoronary patients. J Psychol, 119(1), 87-94.
Finney, J. W., Moyer, A., & Swearingen, C. E. (2003). Outcome variables and their
assessment in alcohol treatment studies: 1968-1998. Alcohol Clin Exp Res,
27(10), 1671-1679.
Francis, D. J., Fletcher, J. M., Stuebing, K. K., Davidson, K. C., & Thompson, N. M.
(1991). Analysis of change: modeling individual growth. J Consult Clin Psychol,
59(1), 27-37.
Frank, H., & Althoen, S. C. (1994). Statistics: Concepts and Applications. New York:
Cambridge University Press.
Frank, P. I., Morris, J. A., Frank, T. L., Hazell, M. L., & Hirsch, S. (2004). Trends in
smoking habits: a longitudinal population study. Fam Pract, 21(1), 33-38.
French, M. T., Popovici, I., & Maclean, J. C. (2009). Do alcohol consumers exercise
more? Findings from a national survey. Am J Health Promot, 24(1), 2-10.
French, S. A., Hennrikus, D. J., & Jeffery, R. W. (1996). Smoking status, dietary intake,
and physical activity in a sample of working adults. Health Psychol, 15(6), 448-
454.
Friend, K. B., & Pagano, M. E. (2005). Changes in cigarette consumption and drinking
outcomes: findings from Project MATCH. J Subst Abuse Treat, 29(3), 221-229.
Garcia, M., Fernandez, E., Schiaffino, A., Peris, M., & Borras, J. M. (2005). Smoking
reduction in a population-based cohort. Prev Med, 40(6), 679-684.

234
Garrett, N. A., Alesci, N. L., Schultz, M. M., Foldes, S. S., Magnan, S. J., & Manley, M.
W. (2004). The relationship of stage of change for smoking cessation to stage of
change for fruit and vegetable consumption and physical activity in a health plan
population. Am J Health Promot, 19(2), 118-127.
Gary, V., & Guthrie, D. (1972). The effect of jogging on physical fitness and self-concept
in hospitalized alcoholics. Q J Stud Alcohol, 33(4), 1073-1078.
Gauthier, A. P., Snelling, S. J., & King, M. (2012). "Thinking outside the pack":
examining physically active smokers and implications for practice among ontario
residents. Health Promot Pract, 13(3), 395-403.
Goldberg, M., Chastang, J. F., Leclerc, A., Zins, M., Bonenfant, S., Bugel, I., et al.
(2001). Socioeconomic, demographic, occupational, and health factors associated
with participation in a long-term epidemiologic survey: a prospective study of the
French GAZEL cohort and its target population. Am J Epidemiol, 154(4), 373-
384.
Goldberg, M., Chastang, J. F., Zins, M., Niedhammer, I., & Leclerc, A. (2006). Health
problems were the strongest predictors of attrition during follow-up of the
GAZEL cohort. J Clin Epidemiol, 59(11), 1213-1221.
Gordon, L., Graves, N., Hawkes, A., & Eakin, E. (2007). A review of the cost-
effectiveness of face-to-face behavioural interventions for smoking, physical
activity, diet and alcohol. Chronic Illn, 3(2), 101-129.
Gordon, T., & Doyle, J. T. (1986). Alcohol consumption and its relationship to smoking,
weight, blood pressure, and blood lipids. The Albany Study. Arch Intern Med,
146(2), 262-265.
Gueorguieva, R., & Krystal, J. H. (2004). Move over ANOVA: progress in analyzing
repeated-measures data and its reflection in papers published in the Archives of
General Psychiatry. Arch Gen Psychiatry, 61(3), 310-317.
Gulliver, S. B., Rohsenow, D. J., Colby, S. M., Dey, A. N., Abrams, D. B., Niaura, R. S.,
et al. (1995). Interrelationship of smoking and alcohol dependence, use and urges
to use. J Stud Alcohol, 56(2), 202-206.
Guttman, N., Kegler, M., & McLeroy, K. R. (1996). Health promotion paradoxes,
antinomies and conundrums. Health Ed Res, 11(1), i-xiii.

235
Hale, D. R., & Viner, R. M. (2012). Policy responses to multiple risk behaviours in
adolescents. J Public Health (Oxf), 34 Suppl 1, i11-19.
Hammond, D. (2005). Smoking behaviour among young adults: beyond youth
prevention. Tob Control, 14(3), 181-185.
Harrell, J. S., Bangdiwala, S. I., Deng, S., Webb, J. P., & Bradley, C. (1998). Smoking
initiation in youth: the roles of gender, race, socioeconomics, and developmental
status. J Adolesc Health, 23(5), 271-279.
Haskell, W. L., Montoye, H. J., & Orenstein, D. (1985). Physical activity and exercise to
achieve health-related physical fitness components. Public Health Rep, 100(2),
202-212.
Haug, S., Ulbricht, S., Hanke, M., Meyer, C., & John, U. (2011). Overestimation of
drinking norms and its association with alcohol consumption in apprentices.
Alcohol Alcohol, 46(2), 204-209.
Haveman-Nies, A., de Groot, L. P., Burema, J., Cruz, J. A., Osler, M., & van Staveren,
W. A. (2002). Dietary quality and lifestyle factors in relation to 10-year mortality
in older Europeans: the SENECA study. Am J Epidemiol, 156(10), 962-968.
Health Canada (2005). Canadian guidelines for body weight classification in adults.
Health Canada. Retrieved from http://www.hc-sc.gc.ca/fn-an/nutrition/weights-
poids/guide-ld-adult/qa-qr-pub-eng.php
Herrick, A. B., Stone, W. J., & Mettler, M. M. (1997). Stages of change, decisional
balance, and self-efficacy across four health behaviors in a worksite environment.
Am J Health Promot, 12(1), 49-56.
Hu, L., & Bentler, P. M. (1999). Cutoff criteria for fit indexes in covariance structure
analysis: Conventional criteria versus new alternatives. Struct Equ Modeling,
6(1), 1-55.
Hughes, J. R., & Carpenter, M. J. (2006). Does smoking reduction increase future
cessation and decrease disease risk? A qualitative review. Nicotine Tob Res, 8(6),
739-749.
Hyland, A., Li, Q., Bauer, J. E., Giovino, G. A., Steger, C., & Cummings, K. M. (2004).
Predictors of cessation in a cohort of current and former smokers followed over
13 years. Nicotine Tob Res, 6 Suppl 3, S363-369.
236
Hyman, D. J., Pavlik, V. N., Taylor, W. C., Goodrick, G. K., & Moye, L. (2007).
Simultaneous vs sequential counseling for multiple behavior change. Arch Intern
Med, 167(11), 1152-1158.
Hymowitz, N., Cummings, K. M., Hyland, A., Lynn, W. R., Pechacek, T. F., & Hartwell,
T. D. (1997). Predictors of smoking cessation in a cohort of adult smokers
followed for five years. Tob Control, 6 Suppl 2, S57-62.
Iribarren, C., Luepker, R. V., McGovern, P. G., Arnett, D. K., & Blackburn, H. (1997).
Twelve-year trends in cardiovascular disease risk factors in the Minnesota Heart
Survey. Are socioeconomic differences widening? Arch Intern Med, 157(8), 873-
881.
Irvin, J. E., & Brandon, T. H. (2000). The increasing recalcitrance of smokers in clinical
trials. Nicotine Tob Res, 2(1), 79-84.
Jacobi, D., Charles, M. A., Tafflet, M., Lommez, A., Borys, J. M., & Oppert, J. M.
(2009). Relationships of self-reported physical activity domains with
accelerometry recordings in French adults. Eur J Epidemiol, 24(4), 171-179.
Jacobs, D. R., Jr., Hahn, L. P., Folsom, A. R., Hannan, P. J., Sprafka, J. M., & Burke, G.
L. (1991). Time trends in leisure-time physical activity in the upper midwest
1957-1987: University of Minnesota studies. Epidemiology, 2(1), 8-15.
Janzon, L., Hanson, B. S., Isacsson, S. O., Lindell, S. E., & Steen, B. (1986). Factors
influencing participation in health surveys. Results from prospective population
study 'Men born in 1914' in Malmo, Sweden. J Epidemiol Community Health,
40(2), 174-177.
Jessor, R., Costa, F. M., Krueger, P. M., & Turbin, M. S. (2006). A developmental study
of heavy episodic drinking among college students: the role of psychosocial and
behavioral protective and risk factors. J Stud Alcohol, 67(1), 86-94.
Johnson, M. F., Nichols, J. F., Sallis, J. F., Calfas, K. J., & Hovell, M. F. (1998).
Interrelationships between physical activity and other health behaviors among
university women and men. Prev Med, 27(4), 536-544.
Johnson, R. A., Gerstein, D. R., & Rasinski, K. A. (1998). Adjusting survey estimates for
response bias: An application to trends in alcohol and marijuana use. Public Opin
Q, 62, 354-377.

237
Jordan, P. J., Ory, M. G., & Goldman Sher, T. (2005). Yours, mine, and ours: the
importance of scientific collaboration in advancing the field of behavior change
research. Ann Behav Med, 29 Suppl, 7-10.
Joseph, A. M., Bliss, R. L., Zhao, F., & Lando, H. (2005). Predictors of smoking
reduction without formal intervention. Nicotine Tob Res, 7(2), 277-282.
Kahler, C. W., Borland, R., Hyland, A., McKee, S. A., O'Connor, R. J., Fong, G. T., et al.
(2009). Quitting smoking and change in alcohol consumption in the International
Tobacco Control (ITC) Four Country Survey. Drug Alcohol Depend, 110(1-2),
101-107.
Karlamangla, A., Zhou, K., Reuben, D., Greendale, G., & Moore, A. (2006).
Longitudinal trajectories of heavy drinking in adults in the United States of
America. Addiction, 101(1), 91-99.
Katzmarzyk, P. T., Gledhill, N., & Shephard, R. J. (2000). The economic burden of
physical inactivity in Canada. CMAJ, 163(11), 1435-1440.
Katzmarzyk, P. T., & Tremblay, M. S. (2007). Limitations of Canada's physical activity
data: implications for monitoring trends. Can J Public Health, 98 Suppl 2, S185-
194.
Keenan, P. S. (2009). Smoking and weight change after new health diagnoses in older
adults. Arch Intern Med, 169(3), 237-242.
Keller, S., Maddock, J. E., Hannover, W., Thyrian, J. R., & Basler, H. D. (2008).
Multiple health risk behaviors in German first year university students. Prev Med,
46(3), 189-195.
Kelsey, J. L., Whittemore, A. S., Evans, A. S., & Thompson, W. D. (1996). Methods in
Observational Epidemiology (2nd ed.). New York: Oxford University Press, Inc.
Killen, J. D., Fortmann, S. P., Telch, M. J., & Newman, B. (1988). Are heavy smokers
different from light smokers? A comparison after 48 hours without cigarettes.
JAMA, 260(11), 1581-1585.
Kimokoti, R. W., Newby, P. K., Gona, P., Zhu, L., Jasuja, G. K., Pencina, M. J., et al.
(2010). Diet quality, physical activity, smoking status, and weight fluctuation are
associated with weight change in women and men. J Nutr, 140(7), 1287-1293.
238
King, D. E., Mainous, A. G., 3rd, Carnemolla, M., & Everett, C. J. (2009). Adherence to
healthy lifestyle habits in US adults, 1988-2006. Am J Med, 122(6), 528-534.
King, T. K., Marcus, B. H., Pinto, B. M., Emmons, K. M., & Abrams, D. B. (1996).
Cognitive-behavioral mediators of changing multiple behaviors: smoking and a
sedentary lifestyle. Prev Med, 25(6), 684-691.
Kitchens, L. J. (1998). Exploring Statistics: A Modern Introduction to Data Analysis and
Inference (2nd ed.). Pacific Grove, CA: Brooks/Cole Publishing Company.
Klein-Geltink, J. E., Choi, B. C., & Fry, R. N. (2006). Multiple exposures to smoking,
alcohol, physical inactivity and overweight: Prevalences according to the
Canadian Community Health Survey Cycle 1.1. Chronic Dis Can, 27(1), 25-33.
Klesges, R. C., Williamson, J. E., Somes, G. W., Talcott, G. W., Lando, H. A., &
Haddock, C. K. (1999). A population comparison of participants and
nonparticipants in a health survey. Am J Public Health, 89(8), 1228-1231.
Knoops, K. T., de Groot, L. C., Kromhout, D., Perrin, A. E., Moreiras-Varela, O.,
Menotti, A., et al. (2004). Mediterranean diet, lifestyle factors, and 10-year
mortality in elderly European men and women: the HALE project. JAMA,
292(12), 1433-1439.
Kopec, J. A., Sayre, E. C., & Esdaile, J. M. (2004). Predictors of back pain in a general
population cohort. Spine (Phila Pa 1976), 29(1), 70-77; discussion 77-78.
Korn, E. L., & Graubard, B. I. (1991). Epidemiologic studies utilizing surveys:
accounting for the sampling design. Am J Public Health, 81(9), 1166-1173.
Korn, E. L., & Graubard, B. I. (1995). Examples of differing weighted and unweighted
estimates from a sample survey. Amer. Statistician, 49(3), 291-295.
Kostova, D., Ross, H., Blecher, E., & Markowitz, S. (2011). Is youth smoking responsive
to cigarette prices? Evidence from low- and middle-income countries. Tob
Control, 20(6), 419-424.
Kristjansson, S. D., Kircher, J. C., & Webb, A. K. (2007). Multilevel models for repeated
measures research designs in psychophysiology: an introduction to growth curve
modeling. Psychophysiology, 44(5), 728-736.

239
Kukafka, R., Khan, S. A., Kaufman, D., & Mark, J. (2009). An evidence-based decision
aid to help patients set priorities for selecting among multiple health behaviors.
AMIA Annu Symp Proc, 2009, 343-347.
Kvaavik, E., Batty, G. D., Ursin, G., Huxley, R., & Gale, C. R. (2010). Influence of
individual and combined health behaviors on total and cause-specific mortality in
men and women: the United Kingdom health and lifestyle survey. Arch Intern
Med, 170(8), 711-718.
Kwan, M. Y., Cairney, J., Faulkner, G. E., & Pullenayegum, E. E. (2012). Physical
activity and other health-risk behaviors during the transition into early adulthood:
a longitudinal cohort study. Am J Prev Med, 42(1), 14-20.
Laaksonen, M., Luoto, R., Helakorpi, S., & Uutela, A. (2002). Associations between
health-related behaviors: a 7-year follow-up of adults. Prev Med, 34(2), 162-170.
Laaksonen, M., Prattala, R., & Lahelma, E. (2003). Sociodemographic determinants of
multiple unhealthy behaviours. Scand J Public Health, 31(1), 37-43.
Lahti-Koski, M., Pietinen, P., Heliovaara, M., & Vartiainen, E. (2002). Associations of
body mass index and obesity with physical activity, food choices, alcohol intake,
and smoking in the 1982-1997 FINRISK Studies. Am J Clin Nutr, 75(5), 809-817.
Laitinen, J., Pietilainen, K., Wadsworth, M., Sovio, U., & Jarvelin, M. R. (2004).
Predictors of abdominal obesity among 31-y-old men and women born in
Northern Finland in 1966. Eur J Clin Nutr, 58(1), 180-190.
Langlois, M. A., & Hallam, J. S. (2010). Integrating multiple health behavior theories
into program planning: the PER worksheet. Health Promot Pract, 11(2), 282-288.
Larson, N. I., Story, M., Perry, C. L., Neumark-Sztainer, D., & Hannan, P. J. (2007). Are
diet and physical activity patterns related to cigarette smoking in adolescents?
Findings from Project EAT. Prev Chronic Dis, 4(3), A51.
Last, J. M. (2001). A Dictionary of Epidemiology (4th ed.). New York: Oxford University
Press, Inc.
Le Faou, A. L., Baha, M., Rodon, N., Lagrue, G., & Menard, J. (2009). Trends in the
profile of smokers registered in a national database from 2001 to 2006: changes in
smoking habits. Public Health, 123(1), 6-11.

240
Lean, M., Lara, J., & Hill, J. O. (2006). ABC of obesity. Strategies for preventing
obesity. BMJ, 333(7575), 959-962.
Leatherdale, S. T., Manske, S., Faulkner, G., Arbour, K., & Bredin, C. (2010). A multi-
level examination of school programs, policies and resources associated with
physical activity among elementary school youth in the PLAY-ON study. Int J
Behav Nutr Phys Act, 7(1), 6.
Leatherdale, S. T., & Shields, M. (2009). Smoking cessation: intentions, attempts and
techniques. Health Rep, 20(3), 31-39.
Lee, C. W., & Kahende, J. (2007). Factors associated with successful smoking cessation
in the United States, 2000. Am J Public Health, 97(8), 1503-1509.
Lee, D. S., Chiu, M., Manuel, D. G., Tu, K., Wang, X., Austin, P. C., et al. (2009).
Trends in risk factors for cardiovascular disease in Canada: temporal, socio-
demographic and geographic factors. CMAJ, 181(3-4), E55-66.
Lee, I. M., Paffenbarger, R. S., Jr., & Hsieh, C. C. (1992). Time trends in physical
activity among college alumni, 1962-1988. Am J Epidemiol, 135(8), 915-925.
Li, F. X., Robson, P. J., Chen, Y., Qiu, Z., Lo Siou, G., & Bryant, H. E. (2009).
Prevalence, trend, and sociodemographic association of five modifiable lifestyle
risk factors for cancer in Alberta and Canada. Cancer Causes Control, 20(3), 395-
407.
Lilienfeld, D. E., & Stolley, P. D. (1994). Foundations of Epidemiology (3rd ed.). New
York: Oxford University Press, Inc.
Lippke, S., Nigg, C. R., & Maddock, J. E. (2012). Health-promoting and health-risk
behaviors: theory-driven analyses of multiple health behavior change in three
international samples. Int J Behav Med, 19(1), 1-13.
Llabre, M. M., Spitzer, S., Siegel, S., Saab, P. G., & Schneiderman, N. (2004). Applying
latent growth curve modeling to the investigation of individual differences in
cardiovascular recovery from stress. Psychosom Med, 66(1), 29-41.
Love, M. B., Davoli, G. W., & Thurman, Q. C. (1996). Normative beliefs of health
behavior professionals regarding the psychosocial and environmental factors that
influence health behavior change related to smoking cessation, regular exercise,
and weight loss. Am J Health Promot, 10(5), 371-379.

241
MacCallum, R. C., & Austin, J. T. (2000). Applications of structural equation modeling
in psychological research. Annu Rev Psychol, 51, 201-226.
MacCallum, R. C., Kim, C., Malarkey, W. B., & Kiecolt-Glaser, J. K. (1997). Studying
multivariate change using multilevel modls and latent curve models. Multivariate
Behav Res, 32(3), 215-253.
MacCallum, R. C., Roznowski, M., & Necowitz, L. B. (1992). Model modifications in
covariance structure analysis: the problem of capitalization on chance. Psychol
Bull, 111(3), 490-504.
MacKinnon, D. P. (2008). Longitudinal Mediation Models Introduction to Statistical
Mediation Analysis. New York: Lawrence Erlbaum Associates.
MacKinnon, D. P., Fairchild, A. J., & Fritz, M. S. (2007). Mediation analysis. Annu Rev
Psychol, 58, 593-614.
Maddi, S. R., Kobasa, S. C., & Hoover, M. (1979). An alienation test. J Humanist
Psychol, 19(4), 73-76.
Makrides, L., Sawatzky, C., Petrie, J., & Veinot, P. (2010). Modifiable health risks in
Atlantic Canadian employees: a 5-year report. Health Promot Int, 25(4), 384-393.
Marcus, B. H., Albrecht, A. E., King, T. K., Parisi, A. F., Pinto, B. M., Roberts, M., et al.
(1999). The efficacy of exercise as an aid for smoking cessation in women: a
randomized controlled trial. Arch Intern Med, 159(11), 1229-1234.
Mays, D., Depadilla, L., Thompson, N. J., Kushner, H. I., & Windle, M. (2010). Sports
participation and problem alcohol use: a multi-wave national sample of
adolescents. Am J Prev Med, 38(5), 491-498.
McBride, C. M., Emmons, K. M., & Lipkus, I. M. (2003). Understanding the potential of
teachable moments: the case of smoking cessation. Health Educ Res, 18(2), 156-
170.
McDermott, L., Dobson, A., & Owen, N. (2008). Smoking reduction and cessation
among young adult women: a 7-year prospective analysis. Nicotine Tob Res,
10(9), 1457-1466.
McDermott, L., Dobson, A., & Russell, A. (2004). Changes in smoking behaviour among
young women over life stage transitions. Aust N Z J Public Health, 28(4), 330-
335.

242
Meland, E., Maeland, J. G., & Laerum, E. (1999). The importance of self-efficacy in
cardiovascular risk factor change. Scand J Public Health, 27(1), 11-17.
Meng, L., Maskarinec, G., Lee, J., & Kolonel, L. N. (1999). Lifestyle factors and chronic
diseases: application of a composite risk index. Prev Med, 29(4), 296-304.
Miller, W. R., Hedrick, K. E., & Taylor, C. A. (1983). Addictive behaviors and life
problems before and after behavioral treatment of problem drinkers. Addict
Behav, 8(4), 403-412.
Milligan, R. A., Burke, V., Beilin, L. J., Richards, J., Dunbar, D., Spencer, M., et al.
(1997). Health-related behaviours and psycho-social characteristics of 18 year-old
Australians. Soc Sci Med, 45(10), 1549-1562.
Mills, C., Stephens, T., & Wilkins, K. (1994). Summary report of the workshop on data
for monitoring tobacco use. Chronic Dis Can, 15(3), 105-110.
Mirowsky, J. (1995). Age and the sense of control. Soc Psychol Quart, 58(1), 31-43.
Mirowsky, J., & Ross, C. E. (2007). Life course trajectories of perceived control and their
relationship to education. AJS, 112(5), 1339-1382.
Mitchell, C. M., Kaufman, C. E., Beals, J., & Pathways of Choice and Healthy Ways
Project Team (2005). Resistive efficacy and multiple sexual partners among
American Indian adults: A parallel-process latent growth curve model. Appl Dev
Sci, 9(3), 160-171.
Moore, A. A., Gould, R., Reuben, D. B., Greendale, G. A., Carter, M. K., Zhou, K., et al.
(2005). Longitudinal patterns and predictors of alcohol consumption in the United
States. Am J Public Health, 95(3), 458-465.
Morrison, T. C., Wahlgren, D. R., Hovell, M. F., Zakarian, J., Burkham-Kreitner, S.,
Hofstetter, C. R., et al. (1997). Tracking and follow-up of 16,915 adolescents:
minimizing attrition bias. Control Clin Trials, 18(5), 383-396.
Mozaffarian, D., Hao, T., Rimm, E. B., Willett, W. C., & Hu, F. B. (2011). Changes in
diet and lifestyle and long-term weight gain in women and men. N Engl J Med,
364(25), 2392-2404.
Muehrer, P. (2000). Research on adherence, behavior change, and mental health: a
workshop overview. Health Psychol, 19(3), 304-307.

243
Mulder, M., Ranchor, A. V., Sanderman, R., Bouma, J., & van den Heuvel, W. J. (1998).
The stability of lifestyle behaviour. Int J Epidemiol, 27(2), 199-207.
Murray, R. P., Cribbie, R. A., Istvan, J. A., & Barnes, G. E. (2002). Longitudinal analysis
of the relationship between changes in smoking and changes in drinking in a
community sample: the Winnipeg Health and Drinking Survey. Health Psychol,
21(3), 237-243.
Muthen, B., Kaplan, D., & Hollis, M. (1987). On structural equation modeling with data
that are not missing completely at random. Psychometrika, 52(3), 431-462.
Muthen, B. O., & Curran, P. J. (1997). General longitudinal modeling of individual
differences in experimental designs: A latent variable framework for analysis and
power estimation. Psychol Methods, 2(4), 371-402.
Muthen, L. K., & Muthen, B. (2010). MPLUS (Version 6.12). Los Angeles, CA: Muthen
& Muthen.
Muthen, L. K., & Muthen, B. O. (1998-2011). Mplus User's Guide (6th ed.). Los
Angeles, CA: Muthen & Muthen.
Nagaya, T., Yoshida, H., Takahashi, H., & Kawai, M. (2007). Cigarette smoking
weakens exercise habits in healthy men. Nicotine Tob Res, 9(10), 1027-1032.
Newbold, B. (2005). Health status and health care of immigrants in Canada: a
longitudinal analysis. J Health Serv Res Policy, 10(2), 77-83.
Nigg, C. R., Allegrante, J. P., & Ory, M. (2002). Theory-comparison and multiple-
behavior research: common themes advancing health behavior research. Health
Educ Res, 17(5), 670-679.
Nigg, C. R., Burbank, P. M., Padula, C., Dufresne, R., Rossi, J. S., Velicer, W. F., et al.
(1999). Stages of change across ten health risk behaviors for older adults.
Gerontologist, 39(4), 473-482.
Nigg, C. R., Lee, H. R., Hubbard, A. E., & Min-Sun, K. (2009). Gateway health
behaviors in college students: investigating transfer and compensation effects. J
Am Coll Health, 58(1), 39-44.
Nigg, C. R., & Long, C. R. (2012). A systematic review of single health behavior change
interventions vs. multiple health behavior change interventions among older
adults. Transl Behav Med.

244
Norman, G. R., & Streiner, D. L. (2000). Biostatistics: The Bare Essentials (2nd ed.).
Hamilton, Ontario: B.C. Decker Inc.
O'Connell, K. A., Gerkovich, M. M., & Cook, M. R. (1995). Reversal theory's mastery
and sympathy states in smoking cessation. Image J Nurs Sch, 27(4), 311-316.
O'Grady, M. A., Cullum, J., Tennen, H., & Armeli, S. (2011). Daily relationship between
event-specific drinking norms and alcohol use: a four-year longitudinal study. J
Stud Alcohol Drugs, 72(4), 633-641.
O'Hea, E. L., Boudreaux, E. D., Jeffries, S. K., Carmack Taylor, C. L., Scarinci, I. C., &
Brantley, P. J. (2004). Stage of change movement across three health behaviors:
the role of self-efficacy. Am J Health Promot, 19(2), 94-102.
O'Hea, E. L., Wood, K. B., & Brantley, P. J. (2003). The transtheoretical model: gender
differences across 3 health behaviors. Am J Health Behav, 27(6), 645-656.
Oenema, A., Brug, J., Dijkstra, A., de Weerdt, I., & de Vries, H. (2008). Efficacy and use
of an internet-delivered computer-tailored lifestyle intervention, targeting
saturated fat intake, physical activity and smoking cessation: a randomized
controlled trial. Ann Behav Med, 35(2), 125-135.
Ogborne, A. C., & Smart, R. G. (2001). Public opinion on the health benefits of moderate
drinking: results from a Canadian National Population Health Survey. Addiction,
96(4), 641-649.
Olsson, U. H., Foss, T., Troye, S. V., & Howell, R. D. (2000). The performance of ML,
GLS, and WLS estimation in structural equation modeling under conditions of
misspecification and nonnormality. Struct Equ Modeling, 7(4), 557-595.
Orleans, C. T. (2004). Addressing multiple behavioral health risks in primary care.
Broadening the focus of health behavior change research and practice. Am J Prev
Med, 27(2 Suppl), 1-3.
Orleans, C. T. (2005). The behavior change consortium: expanding the boundaries and
impact of health behavior change research. Ann Behav Med, 29 Suppl, 76-79.
Orleans, C. T., Gruman, J., Ulmer, C., Emont, S. L., & Hollendonner, J. K. (1999).
Rating our progress in population health promotion: report card on six behaviors.
Am J Health Promot, 14(2), 75-82.
245
Orpana, H. M., Tremblay, M. S., & Fines, P. (2007). Trends in weight change among
Canadian adults. Health Rep, 18(2), 9-16.
Ory, M. G., Jordan, P. J., & Bazzarre, T. (2002). The Behavior Change Consortium:
setting the stage for a new century of health behavior-change research. Health
Educ Res, 17(5), 500-511.
Ozminkowski, R. J., Goetzel, R. Z., Santoro, J., Saenz, B. J., Eley, C., & Gorsky, B.
(2004). Estimating risk reduction required to break even in a health promotion
program. Am J Health Promot, 18(4), 316-325.
Paavola, M., Vartiainen, E., & Haukkala, A. (2004). Smoking, alcohol use, and physical
activity: a 13-year longitudinal study ranging from adolescence into adulthood. J
Adolesc Health, 35(3), 238-244.
Park, I., & Schutz, R. W. (2005). An introduction to latent growth models: analysis of
repeated measures physical performance data. Res Q Exerc Sport, 76(2), 176-192.
Pate, R. R., Heath, G. W., Dowda, M., & Trost, S. G. (1996). Associations between
physical activity and other health behaviors in a representative sample of US
adolescents. Am J Public Health, 86(11), 1577-1581.
Patten, S. B., Williams, J. V., Lavorato, D. H., Modgill, G., Jette, N., & Eliasziw, M.
(2008). Major depression as a risk factor for chronic disease incidence:
longitudinal analyses in a general population cohort. Gen Hosp Psychiatry, 30(5),
407-413.
Pearlin, L. I., Nguyen, K. B., Schieman, S., & Milkie, M. A. (2007). The life-course
origins of mastery among older people. J Health Soc Behav, 48(2), 164-179.
Pearlin, L. I., & Pioli, M. F. (2003). Personal control: Some conceptual turf and future
directions. In S. H. Zarit, L. I. Pearlin & K. W. Schaie (Eds.), Personal Control in
Social and Life Course Contexts. New York: Springer Publishing Company, Inc.
Pearlin, L. I., & Schooler, C. (1978). The structure of coping. J Health Soc Behav, 19(1),
2-21.
Pederson, L. L., Koval, J. J., McGrady, G. A., & Tyas, S. L. (1998). The degree and type
of relationship between psychosocial variables and smoking status for students in
grade 8: is there a dose-response relationship? Prev Med, 27(3), 337-347.
246
Perkins, K. A., Rohay, J., Meilahn, E. N., Wing, R. R., Matthews, K. A., & Kuller, L. H.
(1993). Diet, alcohol, and physical activity as a function of smoking status in
middle-aged women. Health Psychol, 12(5), 410-415.
Pirie, P. L., Lando, H., Curry, S. J., McBride, C. M., & Grothaus, L. C. (2000). Tobacco,
alcohol, and caffeine use and cessation in early pregnancy. Am J Prev Med, 18(1),
54-61.
Plotnikoff, R. C., Hotz, S. B., Birkett, N. J., & Courneya, K. S. (2001). Exercise and the
transtheoretical model: a longitudinal test of a population sample. Prev Med,
33(5), 441-452.
Plotnikoff, R. C., Todosijczuk, I., Faulkner, G., Pickering, M. A., Cragg, S., Chad, K., et
al. (2009). ParticipACTION: Baseline assessment of the 'new ParticipACTION':
A quantitative survey of Canadian organizational awareness and capacity. Int J
Behav Nutr Phys Act, 6, 86.
Pomerleau, J., Pederson, L. L., Ostbye, T., Speechley, M., & Speechley, K. N. (1997).
Health behaviours and socio-economic status in Ontario, Canada. Eur J
Epidemiol, 13(6), 613-622.
Poortinga, W. (2007a). Associations of physical activity with smoking and alcohol
consumption: a sport or occupation effect? Prev Med, 45(1), 66-70.
Poortinga, W. (2007b). The prevalence and clustering of four major lifestyle risk factors
in an English adult population. Prev Med, 44(2), 124-128.
Prattala, R., Karisto, A., & Berg, M. A. (1994). Consistency and variation in unhealthy
behaviour among Finnish men, 1982-1990. Soc Sci Med, 39(1), 115-122.
Preacher, K. J., Wichman, A. L., MacCallum, R. C., & Briggs, N. E. (2008). Latent
Growth Curve Modeling. Thousand Oaks, CA: Sage Publications, Inc.
Prescott, C. A., Neale, M. C., Corey, L. A., & Kendler, K. S. (1997). Predictors of
problem drinking and alcohol dependence in a population-based sample of female
twins. J Stud Alcohol, 58(2), 167-181.
Prochaska, J. J., Delucchi, K., & Hall, S. M. (2004). A meta-analysis of smoking
cessation interventions with individuals in substance abuse treatment or recovery.
J Consult Clin Psychol, 72(6), 1144-1156.

247
Prochaska, J. J., Nigg, C. R., Spring, B., Velicer, W. F., & Prochaska, J. O. (2010). The
benefits and challenges of multiple health behavior change in research and in
practice. Prev Med, 50(1-2), 26-29.
Prochaska, J. J., & Prochaska, J. O. (2011). A Review of Multiple Health Behavior
Change Interventions for Primary Prevention. Am J Lifestyle Med, 5(3), 208-221.
Prochaska, J. J., & Sallis, J. F. (2004). A randomized controlled trial of single versus
multiple health behavior change: promoting physical activity and nutrition among
adolescents. Health Psychol, 23(3), 314-318.
Prochaska, J. J., Spring, B., & Nigg, C. R. (2008). Multiple health behavior change
research: an introduction and overview. Prev Med, 46(3), 181-188.
Prochaska, J. J., Velicer, W. F., Nigg, C. R., & Prochaska, J. O. (2008). Methods of
quantifying change in multiple risk factor interventions. Prev Med, 46(3), 260-
265.
Prochaska, J. J., Velicer, W. F., Prochaska, J. O., Delucchi, K., & Hall, S. M. (2006).
Comparing intervention outcomes in smokers treated for single versus multiple
behavioral risks. Health Psychol, 25(3), 380-388.
Prochaska, J. O. (2005). Health behavior change research: a consortium approach to
collaborative science. Ann Behav Med, 29 Suppl, 4-6.
Prochaska, J. O. (2008). Multiple Health Behavior Research represents the future of
preventive medicine. Prev Med, 46(3), 281-285.
Prochaska, J. O., DiClemente, C. C., & Norcross, J. C. (1992). In search of how people
change. Applications to addictive behaviors. Am Psychol, 47(9), 1102-1114.
Prochaska, J. O., Velicer, W. F., Rossi, J. S., Goldstein, M. G., Marcus, B. H., Rakowski,
W., et al. (1994). Stages of change and decisional balance for 12 problem
behaviors. Health Psychol, 13(1), 39-46.
Pronk, N. P., Anderson, L. H., Crain, A. L., Martinson, B. C., O'Connor, P. J., Sherwood,
N. E., et al. (2004). Meeting recommendations for multiple healthy lifestyle
factors. Prevalence, clustering, and predictors among adolescent, adult, and senior
health plan members. Am J Prev Med, 27(2 Suppl), 25-33.

248
Pronk, N. P., Peek, C. J., & Goldstein, M. G. (2004). Addressing multiple behavioral risk
factors in primary care. A synthesis of current knowledge and stakeholder
dialogue sessions. Am J Prev Med, 27(2 Suppl), 4-17.
Puska, P., Nissinen, A., Tuomilehto, J., Salonen, J. T., Koskela, K., McAlister, A., et al.
(1985). The community-based strategy to prevent coronary heart disease:
conclusions from the ten years of the North Karelia project. Annu Rev Public
Health, 6, 147-193.
Radler, B. T., & Ryff, C. D. (2010). Who participates? Accounting for longitudinal
retention in the MIDUS national study of health and well-being. J Aging Health,
22(3), 307-331.
Raitakari, O. T., Leino, M., Rakkonen, K., Porkka, K. V., Taimela, S., Rasanen, L., et al.
(1995). Clustering of risk habits in young adults. The Cardiovascular Risk in
Young Finns Study. Am J Epidemiol, 142(1), 36-44.
Ramage-Morin, P. L., Shields, M., & Martel, L. (2010). Health-promoting factors and
good health among Canadians in mid- to late life. Health Rep, 21(3), 45-53.
Raudenbush, S. W. (2001). Comparing personal trajectories and drawing causal
inferences from longitudinal data. Annu Rev Psychol, 52, 501-525.
Read, J. P., Brown, R. A., Marcus, B. H., Kahler, C. W., Ramsey, S. E., Dubreuil, M. E.,
et al. (2001). Exercise attitudes and behaviors among persons in treatment for
alcohol use disorders. J Subst Abuse Treat, 21(4), 199-206.
Reedy, J., Haines, P. S., & Campbell, M. K. (2005). The influence of health behavior
clusters on dietary change. Prev Med, 41(1), 268-275.
Rehm, J., Gnam, W., Popova, S., Baliunas, D., Brochu, S., Fischer, B., et al. (2007). The
costs of alcohol, illegal drugs, and tobacco in Canada, 2002. J Stud Alcohol
Drugs, 68(6), 886-895.
Rimm, E. B., & Stampfer, M. J. (2004). Diet, lifestyle, and longevity--the next steps?
JAMA, 292(12), 1490-1492.
Rogosa, D., Brandt, D., & Zimowski, M. (1982). A growth curve approach to the
measurement of change. Psychol Bull, 92(3), 726-748.
Rogosa, D. R., & Willett, J. B. (1985). Understanding correlates of change by modeling
individual differences in growth. Psychometrika, 50(2), 203-228.
249
Ronksley, P. E., Brien, S. E., Turner, B. J., Mukamal, K. J., & Ghali, W. A. (2011).
Association of alcohol consumption with selected cardiovascular disease
outcomes: a systematic review and meta-analysis. BMJ, 342, d671.
Rosal, M. C., Ockene, J. K., Hurley, T. G., & Reiff, S. (2000). Prevalence and co-
occurrence of health risk behaviors among high-risk drinkers in a primary care
population. Prev Med, 31(2 Pt 1), 140-147.
Rosal, M. C., Ockene, J. K., Ma, Y., Hebert, J. R., Merriam, P. A., Matthews, C. E., et al.
(2001). Behavioral risk factors among members of a health maintenance
organization. Prev Med, 33(6), 586-594.
Rose, G. (1985). Sick individuals and sick populations. Int J Epidemiol, 14(1), 32-38.
Rosen, C. S. (2000). Is the sequencing of change processes by stage consistent across
health problems? A meta-analysis. Health Psychol, 19(6), 593-604.
Rucker, D. D. (May 17, 2013). personal communication.
Rucker, D. D., Preacher, K. J., Tormala, Z. L., & Petty, R. E. (2011). Mediation analysis
in social psychology: Current practices and new recommendations. Soc Personal
Psychol Compass, 5/6, 359-371.
Satia, J. A., Campbell, M. K., Galanko, J. A., James, A., Carr, C., & Sandler, R. S.
(2004). Longitudinal changes in lifestyle behaviors and health status in colon
cancer survivors. Cancer Epidemiol Biomarkers Prev, 13(6), 1022-1031.
Saules, K. K., Pomerleau, C. S., Snedecor, S. M., Mehringer, A. M., Shadle, M. B.,
Kurth, C., et al. (2004). Relationship of onset of cigarette smoking during college
to alcohol use, dieting concerns, and depressed mood: results from the Young
Women's Health Survey. Addict Behav, 29(5), 893-899.
Sayette, M. A., Martin, C. S., Wertz, J. M., Perrott, M. A., & Peters, A. R. (2005). The
effects of alcohol on cigarette craving in heavy smokers and tobacco chippers.
Psychol Addict Behav, 19(3), 263-270.
Schafer, J. L., & Olsen, M. K. (1998). Multiple imputation for multivariate missing-data
problems: A data analyst's perspective. Multivariate Behav Res, 33(4), 545-571.
Schermelleh-Engel, K., Moosbrugger, H., & Muller, H. (2003). Evaluating the fit of
structural equation models: Tests of significance and descriptive goodness-of-fit
measures. MPR-online, 8(2), 23-74.
250
Schmitz, K., French, S. A., & Jeffery, R. W. (1997). Correlates of changes in leisure time
physical activity over 2 years: the Healthy Worker Project. Prev Med, 26(4), 570-
579.
Schuit, A. J., van Loon, A. J., Tijhuis, M., & Ocke, M. (2002). Clustering of lifestyle risk
factors in a general adult population. Prev Med, 35(3), 219-224.
Selig, J. P., & Preacher, K. J. (2009). Mediation models for longitudinal data in
developmental research. Res Hum Dev, 6(2-3), 144-164.
Shaw, B. A., Krause, N., Liang, J., & McGeever, K. (2011). Age differences in long-term
patterns of change in alcohol consumption among aging adults. J Aging Health,
23(2), 207-227.
Sherwood, N. E., Hennrikus, D. J., Jeffery, R. W., Lando, H. A., & Murray, D. M.
(2000). Smokers with multiple behavioral risk factors: how are they different?
Prev Med, 31(4), 299-307.
Shields, M. (2007a). Smoking-prevalence, bans and exposure to second-hand smoke.
Health Rep, 18(3), 67-85.
Shields, M. (2007b). Smoking bans: influence on smoking prevalence. Health Rep, 18(3),
9-24.
Sinyor, D., Brown, T., Rostant, L., & Seraganian, P. (1982). The role of a physical fitness
program in the treatment of alcoholism. J Stud Alcohol, 43(3), 380-386.
Smart, R. G., & Mann, R. E. (1987). Large decreases in alcohol-related problems
following a slight reduction in alcohol consumption in Ontario 1975-83. Br J
Addict, 82(3), 285-291.
Sneed, C. D., Morisky, D. E., Rotheram-Borus, M. J., Ebin, V. J., & Malotte, C. K.
(2001). Patterns of adolescent alcohol, cigarette, and marijuana use over a 6-
month period. Addict Behav, 26(3), 415-423.
Sobell, L. C., Sobell, M. B., Kozlowski, L. T., & Toneatto, T. (1990). Alcohol or tobacco
research versus alcohol and tobacco research. Br J Addict, 85(2), 263-269.
Solomon, S., & Kington, R. (2002). National efforts to promote behavior-change
research: views from the Office of Behavioral and Social Sciences Research.
Health Educ Res, 17(5), 495-499.

251
Solomon, S. D. (2005). A new wave of behavior change intervention research. Ann Behav
Med, 29 Suppl, 1-3.
Sorensen, M. (1997). Maintenance of exercise behavior for individuals at risk for
cardiovascular disease. Percept Mot Skills, 85(3 Pt 1), 867-880.
Sorensen, M., Anderssen, S., Hjerman, I., Holme, I., & Ursin, H. (1997). Exercise and
diet interventions improve perceptions of self in middle-aged adults. Scand J Med
Sci Sports, 7(5), 312-320.
Spring, B., Moller, A. C., & Coons, M. J. (2012). Multiple health behaviours: overview
and implications. J Public Health (Oxf), 34 Suppl 1, i3-10.
Spring, B., Pagoto, S., Pingitore, R., Doran, N., Schneider, K., & Hedeker, D. (2004).
Randomized controlled trial for behavioral smoking and weight control treatment:
effect of concurrent versus sequential intervention. J Consult Clin Psychol, 72(5),
785-796.
SPSS Software (2009). Rel. 18.0. Chicago: SPSS Inc.
Statistics Canada (2008). National Population Health Survey, Household Component,
Cycles 1 to 7 (1994/1995 to 2006/2007), Longitudinal Documentation: Statistics
Canada.
Statistics Canada (2013). Population by sex and age group Retrieved December 27, 2013,
from http://www.statcan.gc.ca/tables-tableaux/sum-som/l01/cst01/demo10a-
eng.htm
Stead, L. F., Perera, R., Bullen, C., Mant, D., & Lancaster, T. (2008). Nicotine
replacement therapy for smoking cessation. Cochrane Database Syst Rev(1),
CD000146.
Steffen, L. M., Arnett, D. K., Blackburn, H., Shah, G., Armstrong, C., Luepker, R. V., et
al. (2006). Population trends in leisure-time physical activity: Minnesota Heart
Survey, 1980-2000. Med Sci Sports Exerc, 38(10), 1716-1723.
Stephens, T., Craig, C. L., & Ferris, B. F. (1986). Adult physical activity in Canada:
findings from the Canada Fitness Survey I. Can J Public Health, 77(4), 285-290.
Stoolmiller, M. (1994). Antisocial behavior, delinquent peer association, and
unsupervised wandering for boys: Growth and change from childhood to early
adolescence. Multivariate Behav Res, 29(3), 263-288.
252
Stotts, A. L., Schmitz, J. M., & Grabowski, J. (2003). Concurrent treatment for alcohol
and tobacco dependence: are patients ready to quit both? Drug Alcohol Depend,
69(1), 1-7.
Strecher, V., Wang, C., Derry, H., Wildenhaus, K., & Johnson, C. (2002). Tailored
interventions for multiple risk behaviors. Health Educ Res, 17(5), 619-626.
Streiner, D. L. (2002). The case of the missing data: methods of dealing with dropouts
and other research vagaries. Can J Psychiatry, 47(1), 68-75.
Streiner, D. L. (2008). Missing data and the trouble with LOCF. Evid Based Ment Health,
11(1), 3-5.
Stull, D. E. (2008). Analyzing growth and change: latent variable growth curve modeling
with an application to clinical trials. Qual Life Res, 17(1), 47-59.
Swahn, M. H., Bossarte, R. M., & Sullivent, E. E., 3rd (2008). Age of alcohol use
initiation, suicidal behavior, and peer and dating violence victimization and
perpetration among high-risk, seventh-grade adolescents. Pediatrics, 121(2), 297-
305.
Sweet, S. N., & Fortier, M. S. (2010). Improving physical activity and dietary behaviours
with single or multiple health behaviour interventions? A synthesis of meta-
analyses and reviews. Int J Environ Res Public Health, 7(4), 1720-1743.
Talbot, L. A., Fleg, J. L., & Metter, E. J. (2003). Secular trends in leisure-time physical
activity in men and women across four decades. Prev Med, 37(1), 52-60.
Tao, F. B., Xu, M. L., Kim, S. D., Sun, Y., Su, P. Y., & Huang, K. (2007). Physical
activity might not be the protective factor for health risk behaviours and
psychopathological symptoms in adolescents. J Paediatr Child Health, 43(11),
762-767.
Taylor, A. H., Katomeri, M., & Ussher, M. (2005). Acute effects of self-paced walking
on urges to smoke during temporary smoking abstinence. Psychopharmacology
(Berl), 181(1), 1-7.
Taylor, W. C., Hepworth, J. T., Lees, E., Cassells, A., Gousse, Y., Sweeney, M. M., et al.
(2004). Readiness to change physical activity and dietary practices and
willingness to consult healthcare providers. Health Res Policy Syst, 2(1), 2.

253
Terry-McElrath, Y. M., & O'Malley, P. M. (2011). Substance use and exercise
participation among young adults: parallel trajectories in a national cohort-
sequential study. Addiction, 106(10), 1855-1865; discussion 1866-1857.
Toobert, D. J., Glasgow, R. E., Strycker, L. A., Barrera, M., Jr., Ritzwoller, D. P., &
Weidner, G. (2007). Long-term effects of the Mediterranean lifestyle program: a
randomized clinical trial for postmenopausal women with type 2 diabetes. Int J
Behav Nutr Phys Act, 4, 1.
Toobert, D. J., Strycker, L. A., Glasgow, R. E., Barrera Jr, M., & Angell, K. (2005).
Effects of the mediterranean lifestyle program on multiple risk behaviors and
psychosocial outcomes among women at risk for heart disease. Ann Behav Med,
29(2), 128-137.
Torabi, M. R., Bailey, W. J., & Majd-Jabbari, M. (1993). Cigarette smoking as a
predictor of alcohol and other drug use by children and adolescents: evidence of
the "gateway drug effect". J Sch Health, 63(7), 302-306.
Tucker, M., & Reicks, M. (2002). Exercise as a gateway behavior for healthful eating
among older adults: an exploratory study. J Nutr Educ Behav, 34 Suppl 1, S14-19.
Turner, R. J., & Roszell, P. (1994). Psychosocial Resources and the Stress Process. In W.
R. Avison & I. H. Gotlib (Eds.), Stress and Mental Health: Contemporary Issues
and Prospects for the Future (pp. 179-210). New York: Plenum Press.
Unger, J. B. (1996). Stages of change of smoking cessation: relationships with other
health behaviors. Am J Prev Med, 12(2), 134-138.
Unger, J. B., & Johnson, C. A. (1995). Social relationships and physical activity in health
club members. Am J Health Promot, 9(5), 340-343.
Ussher, M., Sampuran, A. K., Doshi, R., West, R., & Drummond, D. C. (2004). Acute
effect of a brief bout of exercise on alcohol urges. Addiction, 99(12), 1542-1547.
van Loon, A. J., Tijhuis, M., Surtees, P. G., & Ormel, J. (2005). Determinants of smoking
status: cross-sectional data on smoking initiation and cessation. Eur J Public
Health, 15(3), 256-261.
Vandelanotte, C., Reeves, M. M., Brug, J., & De Bourdeaudhuij, I. (2008). A randomized
trial of sequential and simultaneous multiple behavior change interventions for
physical activity and fat intake. Prev Med, 46(3), 232-237.

254
Vlasoff, T., Laatikainen, T., Korpelainen, V., Uhanov, M., Pokusajeva, S., Rogacheva,
A., et al. (2008). Ten year trends in chronic disease risk factors in the Republic of
Karelia, Russia. Eur J Public Health, 18(6), 666-673.
Von Ah, D., Ebert, S., Ngamvitroj, A., Park, N., & Kang, D. H. (2004). Predictors of
health behaviours in college students. J Adv Nurs, 48(5), 463-474.
Waller, B. J., Cohen, J. E., Ferrence, R., Bull, S., & Adlaf, E. M. (2003). The early 1990s
cigarette price decrease and trends in youth smoking in Ontario. Can J Public
Health, 94(1), 31-35.
Wankel, L. M., & Sefton, J. M. (1992). Physical activity, leisure, and recreation. In C.
Bouchard, B. D. McPherson & A. W. Taylor (Eds.), Physical Activity Sciences.
Champaign, IL: Human Kinetics Books.
Ward, K. D., Vander Weg, M. W., Klesges, R. C., Kovach, K. W., Elrod, M. C., DeBon,
M., et al. (2003). Characteristics of highly physically active smokers in a
population of young adult military recruits. Addict Behav, 28(8), 1405-1418.
Weinstein, N. D., Marcus, S. E., & Moser, R. P. (2005). Smokers' unrealistic optimism
about their risk. Tob Control, 14(1), 55-59.
Weinstein, N. D., Rothman, A. J., & Sutton, S. R. (1998). Stage theories of health
behavior: conceptual and methodological issues. Health Psychol, 17(3), 290-299.
Weller, I., & Corey, P. (1998). The impact of excluding non-leisure energy expenditure
on the relation between physical activity and mortality in women. Epidemiology,
9(6), 632-635.
Wen, C. P., Wai, P. M. J., Tsai, M. K., & Yang, Y. C. (2012). Physical activity as a harm
reduction strategy for smokers. Circulation, e48-49.
Westerterp, K. R., Meijer, E. P., Goris, A. H., & Kester, A. D. (2004). Alcohol energy
intake and habitual physical activity in older adults. Br J Nutr, 91(1), 149-152.
Wichstrom, T., & Wichstrom, L. (2009). Does sports participation during adolescence
prevent later alcohol, tobacco and cannabis use? Addiction, 104(1), 138-149.
Wilcox, S., King, A. C., Castro, C., & Bortz, W. (2000). Do changes in physical activity
lead to dietary changes in middle and old age? Am J Prev Med, 18(4), 276-283.
Wilkins, K. (2002). Moderate alcohol consumption and heart disease. Health Rep, 14(1),
9-24.

255
Willett, J. B., & Sayer, A. G. (1994). Using covariance structure analysis to detect
correlates and predictors of individual change over time. Psychol Bull, 116(2),
363-381.
Willett, J. B., & Sayer, A. G. (1996). Cross-domain analyses of change over time:
Combining growth modeling and covariance structure analysis. In G. A.
Marcoulides & R. E. Schumacker (Eds.), Advanced Structural Equation
Modeling: Issues and Techniques. Mahwah, New Jersey: Lawrence Erlbaum
Associates.
Wu, W., West, S. G., & Taylor, A. B. (2009). Evaluating model fit for growth curve
models: Integration of fit indices from SEM and MLM frameworks. Psychol
Methods, 14(3), 183-201.
Yeager, D. S., & Krosnick, J. A. (2010). The validity of self-reported nicotine product
use in the 2001-2008 National Health and Nutrition Examination Survey. Med
Care, 48(12), 1128-1132.
Zhang, B., Cohen, J., Ferrence, R., & Rehm, J. (2006). The impact of tobacco tax cuts on
smoking initiation among Canadian young adults. Am J Prev Med, 30(6), 474-
479.
Zimmermann, E., Ekholm, O., Gronbaek, M., & Curtis, T. (2008). Predictors of changes
in physical activity in a prospective cohort study of the Danish adult population.
Scand J Public Health, 36(3), 235-241.
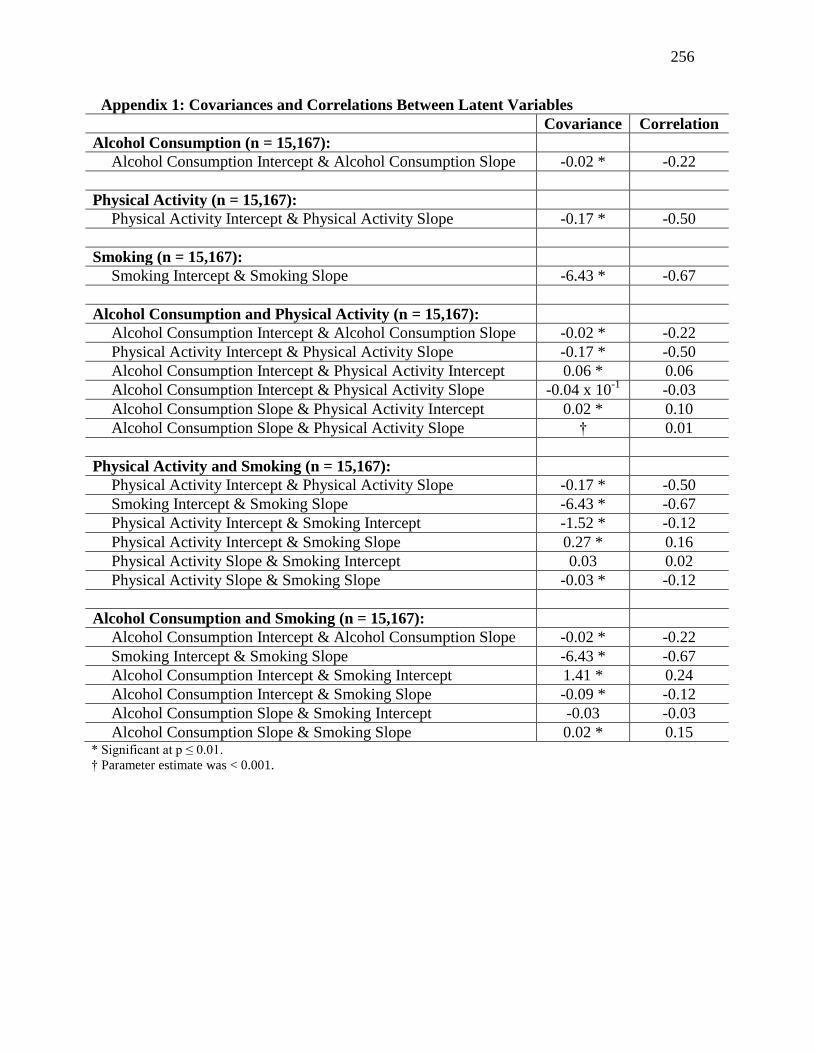
256
Appendix 1: Covariances and Correlations Between Latent Variables
Covariance Correlation
Alcohol Consumption (n = 15,167):
Alcohol Consumption Intercept & Alcohol Consumption Slope -0.02 * -0.22
Physical Activity (n = 15,167):
Physical Activity Intercept & Physical Activity Slope -0.17 * -0.50
Smoking (n = 15,167):
Smoking Intercept & Smoking Slope -6.43 * -0.67
Alcohol Consumption and Physical Activity (n = 15,167):
Alcohol Consumption Intercept & Alcohol Consumption Slope -0.02 * -0.22
Physical Activity Intercept & Physical Activity Slope -0.17 * -0.50
Alcohol Consumption Intercept & Physical Activity Intercept 0.06 * 0.06
Alcohol Consumption Intercept & Physical Activity Slope -0.04 x 10⁻¹
-0.03
Alcohol Consumption Slope & Physical Activity Intercept 0.02 * 0.10
Alcohol Consumption Slope & Physical Activity Slope † 0.01
Physical Activity and Smoking (n = 15,167):
Physical Activity Intercept & Physical Activity Slope -0.17 * -0.50
Smoking Intercept & Smoking Slope -6.43 * -0.67
Physical Activity Intercept & Smoking Intercept -1.52 * -0.12
Physical Activity Intercept & Smoking Slope 0.27 * 0.16
Physical Activity Slope & Smoking Intercept 0.03 0.02
Physical Activity Slope & Smoking Slope -0.03 * -0.12
Alcohol Consumption and Smoking (n = 15,167):
Alcohol Consumption Intercept & Alcohol Consumption Slope -0.02 * -0.22
Smoking Intercept & Smoking Slope -6.43 * -0.67
Alcohol Consumption Intercept & Smoking Intercept 1.41 * 0.24
Alcohol Consumption Intercept & Smoking Slope -0.09 * -0.12
Alcohol Consumption Slope & Smoking Intercept -0.03 -0.03
Alcohol Consumption Slope & Smoking Slope 0.02 * 0.15 * Significant at p ≤ 0.01.
† Parameter estimate was < 0.001.