Embed Size (px)
Citation preview

THE INTERNAT IONAL ROLE OF THE EUROJULY 2014

THE INTERNATIONAL ROLE OF THE EURO
JULY 2014
In 2014 all ECB publications feature
a motif taken from the €20 banknote.
© European Central Bank, 2014
Address Kaiserstrasse 29 60311 Frankfurt am Main Germany
Postal address Postfach 16 03 19 60066 Frankfurt am Main Germany
Telephone +49 69 1344 0
Website http://www.ecb.europa.eu
All rights reserved. Reproduction for educational and non-commercial purposes is permitted provided that the source is acknowledged.
As at 31 May 2014.
ISSN 1725-6593 (epub)ISSN 1725-6593 (online)ISBN 978-92-899-1372-0 (epub)ISBN 978-92-899-1371-3 (online)EU Catalogue Number QB-XN-14-001-EN-E (epub)EU Catalogue Number QB-XN-14-001-EN-N (online)
3ECB
The international role of the euroJuly 2014
AbbREvIATIONs 5
FOREwORd 6
1 INTROdUcTION 7
2 MAIN FINdINgs 8
3 PRIcE-bAsEd INdIcATORs ANd EURO AREA cAPITAL FLOws 11
3.1 Price-based indicators 11
3.2 Euro area capital flows and foreign demand for euro area assets 16
4 REcENT dEvELOPMENTs IN THE INTERNATIONAL UsE OF THE EURO 19
4.1 The euro in global foreign exchange reserves and exchange rate anchoring 19
4.2 The euro in international debt markets 21
4.3 The euro as a parallel currency 22
4.4 The euro in other market segments 29
Box 1 The role of the euro in global foreign exchange trading 30
Box 2 The use of the Chinese renminbi in international trade financing 32
sPEcIAL FEATUREs 35
A dIssEcTINg FOREIgN INvEsTMENTs IN EURO AREA bONd MARkETs dURINg THE sOvEREIgN dEbT cRIsIs 35
1 Introduction 35
2 A standard gravity model of international portfolio flows 36
3 Impact of sovereign rating changes and portfolio asymmetries after OMT 39
4 Conclusion 43
b REsERvE dIvERsIFIcATION ANd gLObAL FOREIgN ExcHANgE MARkETs: AN OvERvIEw OF THE LITERATURE 45
1 Introduction 45
2 Reserve diversification as a multifaceted concept 46
3 Theoretical channels of the impact of reserve diversification on global foreign exchange markets 47
4 Empirical evidence on the impact of reserve diversification on global foreign exchange markets 49
5 Concluding remarks 51
cONTENTs
4ECBThe international role of the euroJuly 20144
c AN OvERvIEw OF TRENds IN bONd MARkET IssUANcE dENOMINATEd IN FOREIgN cURRENcY 54
1 Introduction 54
2 Which factors affect the choice of currency in which the debt is denominated? 55
3 Trends in foreign currency-denominated issuance 56
4 Conclusions 60
sTATIsTIcAL ANNEx 64
1 The euro in global foreign exchange reserves and exchange rate anchoring 64
2 The euro in international debt markets 68
3 The euro in international loan and deposit markets 75
4 The euro in international trade in goods and services 77
5 The euro as a parallel currency: the use of euro-denominated bank loans and deposits in countries outside the euro area 79

5ECB
The international role of the euroJuly 2014 5
AbbREvIATIONsBIS Bank for International SettlementsCESEE central, eastern and south-eastern EuropeCHF Swiss francCLS continuous linked settlementCNY Chinese renminbiCOFER currency composition of foreign exchange reservesEA euro areaECB European Central BankERM II exchange rate mechanism IIESCB European System of Central BanksEU European UnionEUR euroGBP pound sterlingi.i.p. international investment positionIMF International Monetary FundJPY Japanese yenMFI monetary financial institutionNEER nominal effective exchange rateOeNB Oesterreichische NationalbankOMTs Outright Monetary TransactionsOMS other Member StatesSEK Swedish kronaULCT unit labour costs of the total economyUSD US dollar
AbbREvIAT IONs

6ECBThe international role of the euroJuly 20146
FOREwORdThis is the 13th annual review of the international role of the euro published by the ECB. It presents the main findings of the continued monitoring and analysis conducted by the ECB and the Eurosystem as regards the development, determinants and implications of the use of the euro by non-euro area residents.
This review finds that, in an environment of improving market sentiment towards the euro area, various indicators used to assess the international use of the euro turned to or remained in positive territory in 2013. Notwithstanding these developments, the international use of the euro declined in other market segments. This may be the result of several factors, including pertinent shifts in the global monetary and financial system, as well as the lingering effects of the euro area crisis. The on-going adjustment and rebalancing process in the euro area and the moves towards a genuine Economic and Monetary Union, including the completion of the banking union, remain, therefore, of the essence.
This review also examines in greater depth issues that have a bearing on the euro’s international role and the global currency order, including the demand for euro area debt securities during the euro area sovereign debt crisis, the global financial impact of official reserve diversification, and recent developments in foreign currency bond issuance. This analysis is presented in the form of three special features.
The international role of the euro is primarily determined by market forces, and the Eurosystem neither hinders nor promotes the international use of the euro. At the same time, the ECB will continue to monitor developments and disseminate information with respect to the international role of the euro on a regular basis.
Mario DraghiPresident of the European Central Bank

7ECB
The international role of the euroJuly 2014
1 INTROdUcTION
This report reviews developments in the international role of the euro in 2013, tracking a comprehensive set of indicators covering a number of different market segments. As in previous issues, the main focus is on measures of the euro’s relevance in financial markets, such as the use of the euro in foreign exchange reserves or in debt securities markets. In addition, the report includes a chapter on price-based measures, which may provide a better understanding of the international use of the euro.
The first part (Chapter 3 and 4) of the review continues to provide high-quality and timely data as well as an analysis of the changes during the period under review. The Statistical Annex contains historical time series for many key data for use by academic researchers, professionals and the general public. Where relevant, the review removes exchange rate-related valuation effects by showing statistical time series at constant exchange rates, so as to facilitate comparisons over time. Data are compiled by the ECB and the national central banks of the Eurosystem, also drawing on data available from international financial institutions such as the Bank for International Settlements and the International Monetary Fund. The report also presents survey-based evidence prepared by the Oesterreichische Nationalbank looking at the use of the euro as a parallel currency in central, eastern and south-eastern Europe.
The second part of the review offers an in-depth analysis of issues that have a bearing on the international role of the euro and the international monetary system. This year, this second part contains three special features: an analysis of the impact of foreign investors on the international use of the euro during the peak phase of the euro area sovereign debt crisis; an overview of the academic literature on the global financial impact of official reserve diversification; and a stock-taking and analysis of a number of stylised facts on foreign currency bond issuance.

8ECBThe international role of the euroJuly 20148
2 MAIN FINdINgs
dEvELOPMENTs IN THE INTERNATIONAL ROLE OF THE EURO IN 2013The year 2013 was characterised by a gradual return of investor confidence in euro area financial markets, as financial fragmentation continued to decline. These positive developments – which started in mid-2012 after a number of policy measures were taken at the European and national levels – continued throughout 2013.
Against the background of this improving market sentiment towards the euro area, various indicators used to assess the international use of the euro which are examined in this report increased in 2013. In particular, international investors’ interest in euro area securities, which are mostly denominated in euro, grew markedly over the course of the year. These capital inflows reflected both domestic and external factors, including improving euro area macroeconomic fundamentals, a further reduction in perceived tail risks, and a rebalancing of international investors away from emerging market securities. Sustained capital inflows to the euro area were mirrored in a broad-based and steady strengthening of the euro exchange rate, which appreciated by 7% in nominal effective terms in 2013, the second largest appreciation since 1999 (see Table 1).
In addition to these indicators, some of the volume measures of the international use of the euro turned to or remained in positive territory in 2013. For instance, statistics on net shipments of euro banknotes to destinations outside the euro area show that foreign demand for euro banknotes increased for a third consecutive year, suggesting that the euro area sovereign debt crisis did not have an impact on the use of euro banknotes outside the euro area (see Table 1). With respect to the use of the euro as a parallel currency in central, eastern and south-eastern Europe (CESEE), the euro’s share in foreign deposits increased somewhat, on average. Evidence from the OeNB Euro Survey further suggests that CESEE households’ trust in the euro in most countries has recovered markedly since the spring of 2012, and that it currently stands close to the levels observed prior to the onset of the euro area sovereign debt crisis. In addition, the survey results suggest that the euro is relatively “more trusted” than both the local currency and the US dollar in the majority of the CESEE countries. Finally, data on the use of the euro as an invoicing or settlement currency for extra-euro area exports and imports suggest that the share of the euro has increased slightly in 2013, in particular in the services sector.
Notwithstanding these developments, the international use of the euro declined in other market segments. The euro’s share in global foreign exchange reserves decreased by around one percentage point in 2013 (see Table 1). The share of the US dollar remained broadly unchanged, in contrast, and foreign exchange reserve managers further invested in non-traditional reserve currencies, such as the Australian dollar and Canadian dollar. At the disaggregated level, the share of the euro in the holdings of central banks of both advanced and emerging market economies declined modestly. Despite this decline in the use of the euro by foreign exchange reserve managers, the euro continued to perform its function as a credible store of value for foreign central banks as the second most important international reserve currency.
As regards international debt markets, the share of the euro as an international financing currency declined by around 1.5 percentage points in 2013 (see Table 1). The euro’s share decreased in tandem with that of the Japanese yen and those of the “other” currencies. Conversely, the US dollar further extended its leading role as a financing unit in international debt markets, at the expense of all other funding currencies.

9ECB
The international role of the euroJuly 2014 9
2� Main f indings
Overall, these developments may be regarded as the result of several factors. On the one hand, the international use of the euro might still be affected by the lingering effects of the euro area crisis. The on-going adjustment and rebalancing process in the euro area and the moves towards a genuine Economic and Monetary Union, including the completion of the banking union, remain, therefore, of the essence.
On the other hand, the trends observed over recent years in the currency composition of both global foreign exchange reserves and international bond issuance could also be indicative of more structural shifts in the global monetary and financial system. For instance, the increasing shares of non-traditional reserve currencies in global foreign exchange reserves may reflect efforts by central banks to further diversify – albeit still modestly – their reserve holdings in the wake of the global financial crisis. Moreover, the dominant role of the US dollar in international debt markets may be partly the result of stronger reliance on the part of private and public debt issuers, in particular in emerging market economies, on the favourable liquidity conditions prevailing in US dollar-denominated debt markets.
Table 1 key data on the international role of the euro
Share of the euro(percentages, unless otherwise indicated)
Total outstanding amounts
Indicator Latest Comparison period
Difference (percentage
points)
Latest Comparison period
Unit Difference (percentages)
Stock of global foreign exchange reserves with known currency composition, at constant exchange rates
24.4 (Q4 2013)
25.3 (Q4 2012)
-0.9
11,674 (Q4 2013)
10,952 (Q4 2012)
USD billions
6.6
International debt securities: narrow measure, i.e. excluding home currency issuance, at constant exchange rates
25.3 (Q4 2013)
26.7 (Q4 2012)
-1.4 12,421 (Q4 2013)
11,758 (Q4 2012)
USD billions
5.6
Euro nominal effective exchange rate (annual growth rate)
7.0 (2013)
-0.3 (2012)
7.3
… …
… …
Foreign demand for euro area portfolio investments (in percentage of euro area GDP)
3.7(2013)
3.0 (2012)
0.7 … ...
… ...
Daily foreign exchange trading (settled by CLS), annual averages, at current exchange rates, as a percentage of foreign exchange settlement
37.4(2013)
39.2(2012)
-1.8 3,764(2013)
3,689(2012)
EUR billions
2.0
Foreign currency-denominated loans in CESEE countries, as a percentage of total foreign currency loans, at current exchange rates
82.7(2013)
81.2(2012)
1.5 212.3(2013)
212.3(2012)
EUR billions
0.0
Foreign currency-denominated deposits in CESEE countries, as a percentage of total foreign currency deposits, at current exchange rates
78.0 (2013)
77.7 (2012)
0.3 203.5(2013)
217.6 (2012)
EUR billions -6.5
Invoicing of goods exported from the euro area to non-euro area countries, at current exchange rates
67.2 (2013)
66.7 (2012)
0.5
… …
… …
……
Invoicing of goods imported to the euro area from non-euro area countries, at current exchange rates
51.7(2013)
51.3(2012)
0.4 … …
… …
……
Foreign holdings of euro area debt denominated in euro (as percentage of total euro-denominated debt)
19.6(H1 2013)
18.1(H1 2012)
1.5 16,921(H1 2013)
17,091(H1 2012)
EUR billions
-1.0
Cumulative net shipments of euro banknotes to destinations outside the euro area (not seasonally adjusted)
… …
… …
… …
144.5 (Dec. 2013)
131.4 (Dec. 2012)
EUR billions 9.9
Sources: BIS, ECB and national sources.

10ECBThe international role of the euroJuly 201410
MAIN FINdINgs OF THE sPEcIAL FEATUREsAgainst the background of the increased interest in euro area securities among international investors observed in 2013 and described in Chapter 3 of this report, the first special feature aims to analyse the role of foreign investors for the international use of the euro at the peak of the euro area sovereign debt crisis. To this end, this special feature uses a standard gravity model of international portfolio flows to assess the extent to which foreign investments in the euro area were disproportionate and whether patterns of foreign portfolio flows to the euro area changed after policy measures were taken at the European and national level in mid-2012. It finds that foreign investments in the bond markets of stressed euro area countries were disproportionately small relative to the predictions of a standard gravity model of international portfolio allocation. In addition, it finds that this underinvestment in stressed euro area countries cannot be fully explained by rating changes and that it disappeared after the announcement of the ECB’s OMT programme. The temporary underinvestment confined to stressed euro area bond markets is consistent with the muted overall euro area capital outflows observed and the limited decline in the international use of the euro during the sovereign debt crisis.
The second special feature article deals with the observation that central banks are tending to invest a small but increasing share of their reserve holdings in non-traditional reserve currencies, as described in Section 4.1 of this report. In response to discussions as to whether central banks might diversify their foreign exchange reserves away from traditional reserve assets, which have been reignited by the global financial crisis, this special feature provides an overview of the academic literature on the global financial impact of official reserve diversification. It discusses the multifaceted concept of official reserve diversification, examines the main theoretical channels through which its impact may unfold and reviews the empirical evidence available. It shows in particular that the impact of reserve diversification on global foreign exchange markets is not mechanical, but that it depends on an array of factors, including the degree of substitutability between reserve assets and related changes in interest rates; the endogenous adjustment of the current account in the medium term; and, importantly, whether private investors – whose portfolio holdings are even larger than those of central banks – regard diversification by central banks as a credible signal that prompts them to alter the composition of their own holdings.
Finally, against the background of marked shifts in international debt issuance observed since the global financial crisis, as documented in Section 4.2, the third special feature article highlights a number of stylised facts on foreign currency bond issuance. It finds that gross bond issuance across the globe has reached unprecedented levels since the global financial crisis and that an increasingly large fraction of bonds have been issued in foreign currency, especially in emerging markets. An analysis of the features of foreign currency issuance reveals that emerging markets borrowers enjoy a substantial “discount” when borrowing in foreign currency, suggesting that interest rate differentials might be an important determinant for the choice of issuance currency. The declining share of the euro in global bond issuance since 2008 is found to stem mainly from lower issuance in euro by non-euro area financial corporations. By contrast, the issuance in euro by other non-euro area borrowers was not strongly affected by the crisis in absolute terms and has recently picked up. The strong rise in US dollar issuance, especially by non-financial corporations, and the relatively low yields of securities issued in US dollars further suggest that quantitative easing may have affected the currency composition of bond issuance in recent years.
11ECB
The international role of the euroJuly 2014
3 PRIcE-bAsEd INdIcATORs ANd EURO AREA cAPITAL FLOws
3.1 PRIcE-bAsEd INdIcATORs
3.1.1 dEvELOPMENTs IN THE ExcHANgE RATE OF THE EURO
The nominal effective exchange rate of the euro appreciated markedly in 2013. Following a period of relatively pronounced fluctuations at the start of year, developments between May and December 2013 were characterised by a broad-based and steady strengthening of the nominal effective exchange rate of the euro. This reflected both external and internal factors, including the sell-off of emerging market currencies and better than expected data on economic adjustment and the end of the recession in the euro area. Since the start of 2014, the nominal effective exchange rate of the euro has been broadly stable.
The nominal effective exchange rate of the euro, as measured vis-à-vis 20 of the euro area’s major trading partners (NEER-20), has increased markedly (by 4.0%) between the beginning of 2013 and end-May 2014. When additionally accounting for the group of other emerging market economies that are included in the broader effective exchange rate aggregate of 39 trading partners (NEER-39), the euro appreciated by 5.8% in nominal effective terms.
The first four months of 2013 saw relatively pronounced fluctuations in the nominal effective exchange rate of the euro. Specifically, the euro appreciated by almost 4% in January 2013, stabilised in February and depreciated in March and April to the level observed at the start of the year. Between May and December 2013 euro exchange rate developments were characterised by a broad-based and steady strengthening against the currencies of all its major trading partners. Since the start of 2014, the nominal effective exchange rate of the euro has been broadly stable amid historically low levels of exchange rate volatility.
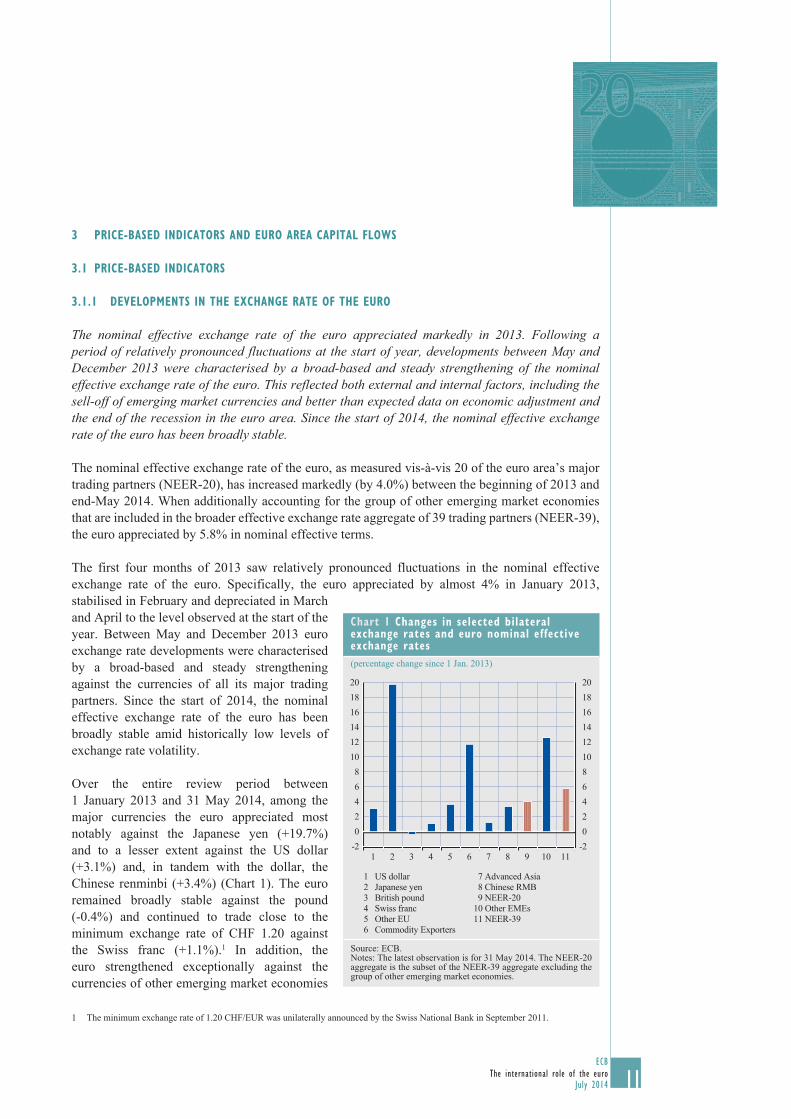
Over the entire review period between 1 January 2013 and 31 May 2014, among the major currencies the euro appreciated most notably against the Japanese yen (+19.7%) and to a lesser extent against the US dollar (+3.1%) and, in tandem with the dollar, the Chinese renminbi (+3.4%) (Chart 1). The euro remained broadly stable against the pound (-0.4%) and continued to trade close to the minimum exchange rate of CHF 1.20 against the Swiss franc (+1.1%).1 In addition, the euro strengthened exceptionally against the currencies of other emerging market economies
1 The minimum exchange rate of 1.20 CHF/EUR was unilaterally announced by the Swiss National Bank in September 2011.
chart 1 changes in selected bilateral exchange rates and euro nominal effective exchange rates(percentage change since 1 Jan. 2013)
181614121086420
-2
20181614121086420
-2
20
7 Advanced Asia 8 Chinese RMB 9 NEER-20 10 Other EMEs11 NEER-39
1 US dollar2 Japanese yen3 British pound4 Swiss franc5 Other EU6 Commodity Exporters
1110987654321
Source: ECB.Notes: The latest observation is for 31 May 2014. The NEER-20 aggregate is the subset of the NEER-39 aggregate excluding the group of other emerging market economies.
12ECBThe international role of the euroJuly 201412
(+12.5%) and advanced commodity-exporting economies (+11.7%). Finally, the euro also appreciated against the currencies of other EU Member States (+3.6%) and the currencies of other advanced Asian economies (+1.2%).2
If the increase in the broader effective exchange rate of the euro (NEER-39) is broken down by the trading partners’ currency, the euro’s development against the group of other emerging market economies contributed to the overall increase of the NEER-39 by approximately 2.5 percentage points (Table 2). The euro’s gain against the Japanese yen accounted for another 1.1 percentage points, while the euro’s increase against the US dollar and the Chinese renminbi contributed 0.4 and 0.5 percentage point respectively.
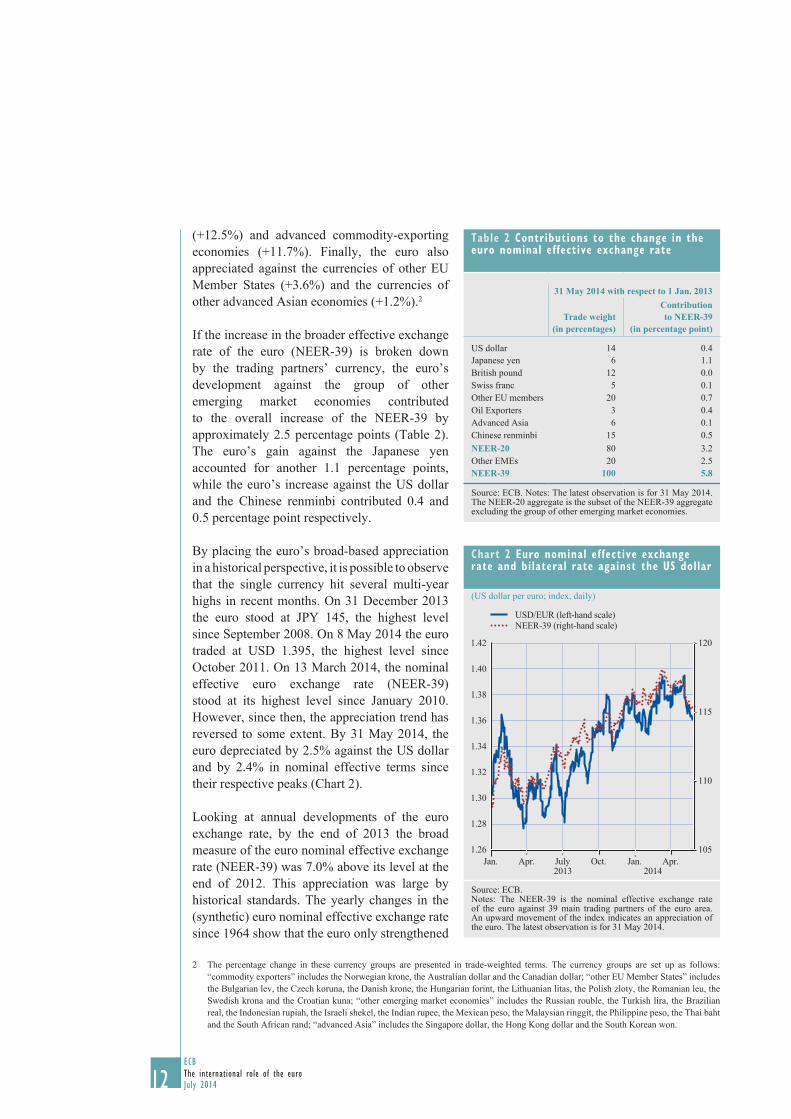
By placing the euro’s broad-based appreciation in a historical perspective, it is possible to observe that the single currency hit several multi-year highs in recent months. On 31 December 2013 the euro stood at JPY 145, the highest level since September 2008. On 8 May 2014 the euro traded at USD 1.395, the highest level since October 2011. On 13 March 2014, the nominal effective euro exchange rate (NEER-39) stood at its highest level since January 2010. However, since then, the appreciation trend has reversed to some extent. By 31 May 2014, the euro depreciated by 2.5% against the US dollar and by 2.4% in nominal effective terms since their respective peaks (Chart 2).
Looking at annual developments of the euro exchange rate, by the end of 2013 the broad measure of the euro nominal effective exchange rate (NEER-39) was 7.0% above its level at the end of 2012. This appreciation was large by historical standards. The yearly changes in the (synthetic) euro nominal effective exchange rate since 1964 show that the euro only strengthened
2 The percentage change in these currency groups are presented in trade-weighted terms. The currency groups are set up as follows: “commodity exporters” includes the Norwegian krone, the Australian dollar and the Canadian dollar; “other EU Member States” includes the Bulgarian lev, the Czech koruna, the Danish krone, the Hungarian forint, the Lithuanian litas, the Polish zloty, the Romanian leu, the Swedish krona and the Croatian kuna; “other emerging market economies” includes the Russian rouble, the Turkish lira, the Brazilian real, the Indonesian rupiah, the Israeli shekel, the Indian rupee, the Mexican peso, the Malaysian ringgit, the Philippine peso, the Thai baht and the South African rand; “advanced Asia” includes the Singapore dollar, the Hong Kong dollar and the South Korean won.
Table 2 contributions to the change in the euro nominal effective exchange rate
31 May 2014 with respect to 1 Jan. 2013
Trade weight (in percentages)
Contribution to NEER-39
(in percentage point)
US dollar 14 0.4Japanese yen 6 1.1British pound 12 0.0Swiss franc 5 0.1Other EU members 20 0.7Oil Exporters 3 0.4Advanced Asia 6 0.1Chinese renminbi 15 0.5NEER-20 80 3.2Other EMEs 20 2.5NEER-39 100 5.8
Source: ECB. Notes: The latest observation is for 31 May 2014. The NEER-20 aggregate is the subset of the NEER-39 aggregate excluding the group of other emerging market economies.
chart 2 Euro nominal effective exchange rate and bilateral rate against the Us dollar
(US dollar per euro; index, daily)
105
110
115
120
1.26
1.28
1.30
1.32
1.34
1.36
1.38
1.40
1.42
2013 2014Jan. Apr. July Oct. Jan. Apr.
USD/EUR (left-hand scale)NEER-39 (right-hand scale)
Source: ECB.Notes: The NEER-39 is the nominal effective exchange rate of the euro against 39 main trading partners of the euro area.An upward movement of the index indicates an appreciation of the euro. The latest observation is for 31 May 2014.

13ECB
The international role of the euroJuly 2014 13
3� Price-based indicators
and euro area caPital flows
more on four occasions (Chart 3). For the period since the inception of the euro in 1999, it only performed better in 2003 (+11%).
The strength of the euro in the reference period relates to both external and internal factors. On the external side, the euro largely appreciated on the back of the sell-off of several emerging market currencies following the start of the US Federal Reserve System’s tapering discussion in May 2013. This sell-off partly reflected global investors’ alleged concerns that the steady stream of portfolio inflows that had entered emerging market economies in recent years could reverse once the Federal Reserve started tightening its monetary policy. Moreover, the weakening of emerging market currencies reflected deteriorating macroeconomic fundamentals in several emerging market economies, such as widening current account deficits and downward revisions to their medium-term growth outlook. Adding to the pronounced weakening of emerging market currencies, a downward correction in the currencies of advanced country commodity exporters (the Canadian dollar, the Australian dollar and the Norwegian krone) contributed to the strengthening of the euro, reflecting an overall drop in commodity prices in 2013. In addition, the weakness of these three currencies reflects a declining demand for alternative safe-haven currencies that had persistently increased against the backdrop of financial crises in traditional reserve currency issuing economies. Finally, on the back of quantitative and qualitative easing, announced by the Bank of Japan in April 2013, which led to higher inflation expectations and lower real interest rates in Japan, a general depreciation of the yen occurred, which also contributed to the euro’s appreciating trend.
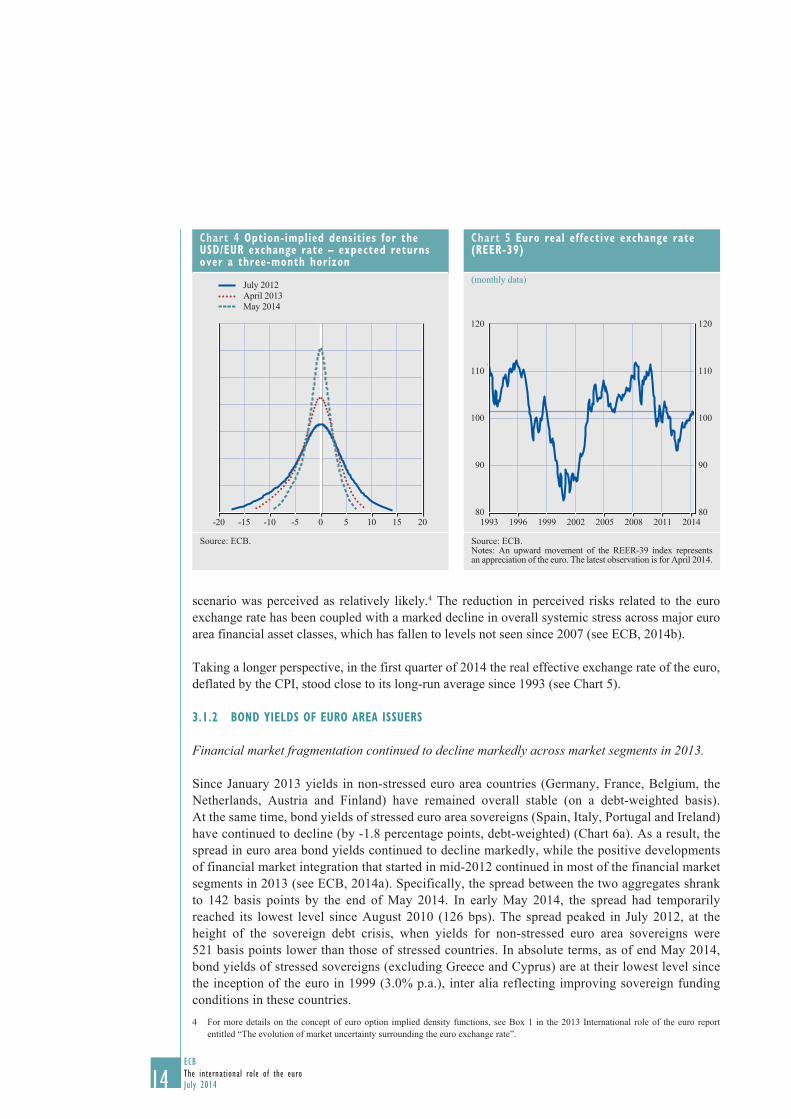
In addition, the euro was supported by internal factors. In particular, the strength of the euro partly reflected better than expected data on economic adjustment and the end of the recession in the euro area. Supported by these positive real economic developments, the euro area not only displayed a widening current account surplus in 2013, but also received large portfolio inflows throughout the whole reference period (see Chapter 3.2).3 Finally, 2013 saw a further reduction in investors’ perception of tail risks related to the euro exchange rate. This perception is reflected in a reduction of the right skewness in the distribution of expected returns of the USD/EUR exchange rate implied in foreign exchange option prices (Chart 4). Comparing the expected return distributions of USD/EUR options with a three-month maturity at different points in time, it is possible to see that investors were less inclined to believe that the euro would depreciate by more than 10% against the US dollar over the next three months in May 2014, than they were in April 2013. By way of comparison, in July 2012, when the euro hit a multi-year low against the US dollar, such a
3 According to the monetary approach to the balance of payments, financial transactions with the rest of the world have an impact on the value of currencies. There is evidence that portfolio flows can track the movements in exchange rates, in contrast with net foreign direct investment (FDI) flows which are less important (see, for example, Brooks et al, “Exchange rates and capital flows”, IMF Working Paper no. 01/190, 2001). Part of these portfolio inflows was channelled through monetary and financial institutions (MFIs) resident in the euro area, and therefore was accompanied by an increase in their net external position, which appears in the balance of payments of the euro area as a net outflow of “other investment” (see Chart 9).
chart 3 Historical distribution of annual changes in the euro nominal effective exchange rate(observations since 1964; percentages)
0
2
4
6
8
10
12
14
0
2
4
6
8
10
12
14
1) -15% to -13%2) -13% to -11%3) -11% to -9%4) -9% to -7%5) -7% to -5%
6) -5% to -3%7) -3% to -1%
10) 3% to 5%
8) -1% to 1%9) 1% to 3%
11) 5% to 7%12) 7% to 9%13) 9% to 11%14) 11% to 13%15) 13% to 15%
1 2 3 4 5 6 7 8 9 10 11 12 13 14 15
Source: ECB.Notes: Synthetic euro nominal effective exchange rate between 1964 and 1998.
14ECBThe international role of the euroJuly 201414
scenario was perceived as relatively likely.4 The reduction in perceived risks related to the euro exchange rate has been coupled with a marked decline in overall systemic stress across major euro area financial asset classes, which has fallen to levels not seen since 2007 (see ECB, 2014b).
Taking a longer perspective, in the first quarter of 2014 the real effective exchange rate of the euro, deflated by the CPI, stood close to its long-run average since 1993 (see Chart 5).
3.1.2 bONd YIELds OF EURO AREA IssUERs
Financial market fragmentation continued to decline markedly across market segments in 2013.
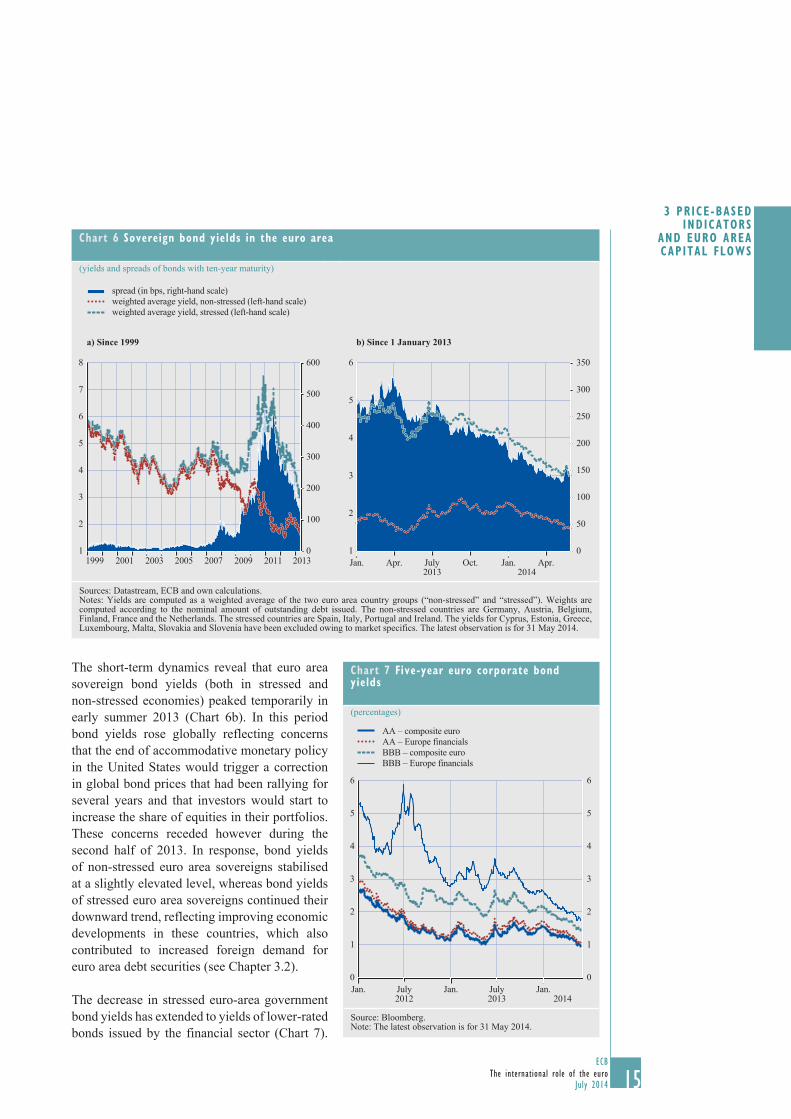
Since January 2013 yields in non-stressed euro area countries (Germany, France, Belgium, the Netherlands, Austria and Finland) have remained overall stable (on a debt-weighted basis). At the same time, bond yields of stressed euro area sovereigns (Spain, Italy, Portugal and Ireland) have continued to decline (by -1.8 percentage points, debt-weighted) (Chart 6a). As a result, the spread in euro area bond yields continued to decline markedly, while the positive developments of financial market integration that started in mid-2012 continued in most of the financial market segments in 2013 (see ECB, 2014a). Specifically, the spread between the two aggregates shrank to 142 basis points by the end of May 2014. In early May 2014, the spread had temporarily reached its lowest level since August 2010 (126 bps). The spread peaked in July 2012, at the height of the sovereign debt crisis, when yields for non-stressed euro area sovereigns were 521 basis points lower than those of stressed countries. In absolute terms, as of end May 2014, bond yields of stressed sovereigns (excluding Greece and Cyprus) are at their lowest level since the inception of the euro in 1999 (3.0% p.a.), inter alia reflecting improving sovereign funding conditions in these countries. 4 For more details on the concept of euro option implied density functions, see Box 1 in the 2013 International role of the euro report
entitled “The evolution of market uncertainty surrounding the euro exchange rate”.
chart 4 Option-implied densities for the Usd/EUR exchange rate – expected returns over a three-month horizon
-20 -15 -10 -5 0 5 10 15 20
July 2012April 2013May 2014
Source: ECB.
chart 5 Euro real effective exchange rate (REER-39)
(monthly data)
80
90
100
110
120
80
90
100
110
120
1993 1996 1999 2002 2005 2008 2011 2014
Source: ECB.Notes: An upward movement of the REER-39 index represents an appreciation of the euro. The latest observation is for April 2014.
15ECB
The international role of the euroJuly 2014 15
3� Price-based indicators
and euro area caPital flows
The short-term dynamics reveal that euro area sovereign bond yields (both in stressed and non-stressed economies) peaked temporarily in early summer 2013 (Chart 6b). In this period bond yields rose globally reflecting concerns that the end of accommodative monetary policy in the United States would trigger a correction in global bond prices that had been rallying for several years and that investors would start to increase the share of equities in their portfolios. These concerns receded however during the second half of 2013. In response, bond yields of non-stressed euro area sovereigns stabilised at a slightly elevated level, whereas bond yields of stressed euro area sovereigns continued their downward trend, reflecting improving economic developments in these countries, which also contributed to increased foreign demand for euro area debt securities (see Chapter 3.2).
The decrease in stressed euro-area government bond yields has extended to yields of lower-rated bonds issued by the financial sector (Chart 7).
chart 6 sovereign bond yields in the euro area
(yields and spreads of bonds with ten-year maturity)
spread (in bps, right-hand scale)weighted average yield, non-stressed (left-hand scale)weighted average yield, stressed (left-hand scale)
a) Since 1999 b) Since 1 January 2013
0
100
200
300
400
500
600
1
2
3
4
5
6
7
8
1999 2001 2003 2005 2007 2009 2011 20130
50
100
150
200
250
300
350
1
2
3
4
5
6
Jan. Apr. July Oct. Jan. Apr.2013 2014
Sources: Datastream, ECB and own calculations.Notes: Yields are computed as a weighted average of the two euro area country groups (“non-stressed” and “stressed”). Weights are computed according to the nominal amount of outstanding debt issued. The non-stressed countries are Germany, Austria, Belgium, Finland, France and the Netherlands. The stressed countries are Spain, Italy, Portugal and Ireland. The yields for Cyprus, Estonia, Greece, Luxembourg, Malta, Slovakia and Slovenia have been excluded owing to market specifics. The latest observation is for 31 May 2014.
chart 7 Five-year euro corporate bond yields
(percentages)
0
1
2
3
4
5
6
0
1
2
3
4
5
6
Jan. July Jan. July Jan.2012 2013 2014
AA – composite euro
BBB – composite euroAA – Europe financials
BBB – Europe financials
Source: Bloomberg.Note: The latest observation is for 31 May 2014.
16ECBThe international role of the euroJuly 201416
As was the case for the government bond segment, lower-rated financial institutions’ debt has continued to converge towards bond yields of higher-rated entities since January 2013. Apart from favorable external factors, this development reflects the improving capital positions of these financial institutions and is also consistent with a decline in risks related to adverse feedback loops between the euro area sovereign and banking sector after the announcement of OMTs and the commitment of euro area leaders to the completion of the banking union.
Finally, also bond yields in the European corporate sector (mainly encompassing non-financial corporates) with an investment grade rating (AA and BBB) have declined since January 2013.
3.2 EURO AREA cAPITAL FLOws ANd FOREIgN dEMANd FOR EURO AREA AssETs
Foreign investors’ interest in euro area debt and equity instruments increased markedly in 2013, reflecting the return of investor confidence in euro area securities on account of improving macroeconomic fundamentals and a further reduction in perceived euro area tail risks.
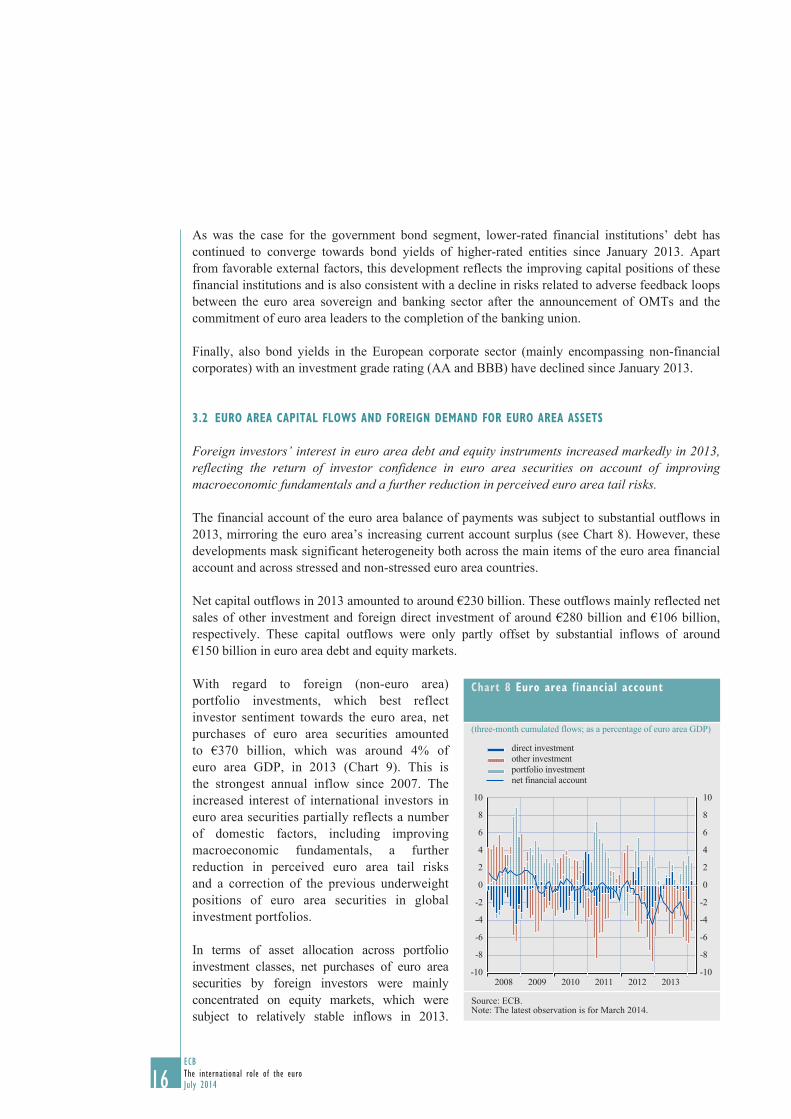
The financial account of the euro area balance of payments was subject to substantial outflows in 2013, mirroring the euro area’s increasing current account surplus (see Chart 8). However, these developments mask significant heterogeneity both across the main items of the euro area financial account and across stressed and non-stressed euro area countries.
Net capital outflows in 2013 amounted to around €230 billion. These outflows mainly reflected net sales of other investment and foreign direct investment of around €280 billion and €106 billion, respectively. These capital outflows were only partly offset by substantial inflows of around €150 billion in euro area debt and equity markets.
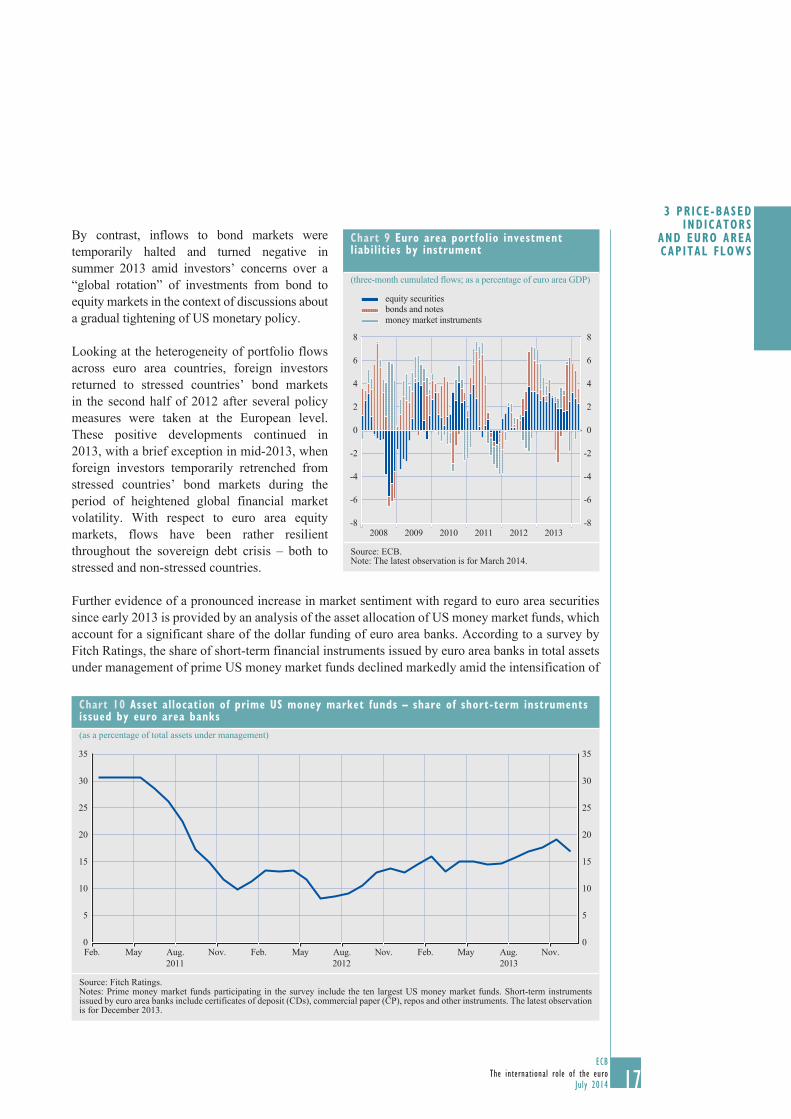
With regard to foreign (non-euro area) portfolio investments, which best reflect investor sentiment towards the euro area, net purchases of euro area securities amounted to €370 billion, which was around 4% of euro area GDP, in 2013 (Chart 9). This is the strongest annual inflow since 2007. The increased interest of international investors in euro area securities partially reflects a number of domestic factors, including improving macroeconomic fundamentals, a further reduction in perceived euro area tail risks and a correction of the previous underweight positions of euro area securities in global investment portfolios.
In terms of asset allocation across portfolio investment classes, net purchases of euro area securities by foreign investors were mainly concentrated on equity markets, which were subject to relatively stable inflows in 2013.
chart 8 Euro area financial account
(three-month cumulated flows; as a percentage of euro area GDP)
-10
-8
-6
-4
-2
0
2
4
6
8
10
-10
-8
-6
-4
-2
0
2
4
6
8
10
2008 2009 2010 2011 2012 2013
direct investment
portfolio investmentother investment
net financial account
Source: ECB.Note: The latest observation is for March 2014.
17ECB
The international role of the euroJuly 2014 17
3� Price-based indicators
and euro area caPital flows
By contrast, inflows to bond markets were temporarily halted and turned negative in summer 2013 amid investors’ concerns over a “global rotation” of investments from bond to equity markets in the context of discussions about a gradual tightening of US monetary policy.
Looking at the heterogeneity of portfolio flows across euro area countries, foreign investors returned to stressed countries’ bond markets in the second half of 2012 after several policy measures were taken at the European level. These positive developments continued in 2013, with a brief exception in mid-2013, when foreign investors temporarily retrenched from stressed countries’ bond markets during the period of heightened global financial market volatility. With respect to euro area equity markets, flows have been rather resilient throughout the sovereign debt crisis – both to stressed and non-stressed countries.
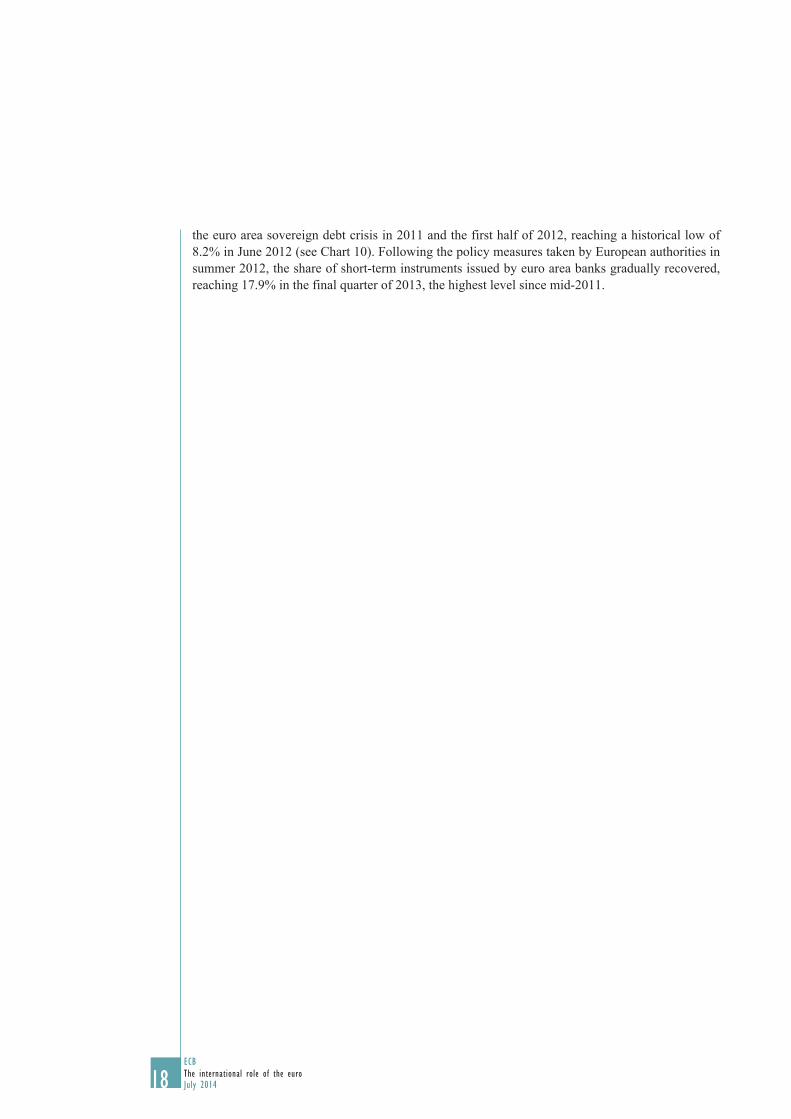
Further evidence of a pronounced increase in market sentiment with regard to euro area securities since early 2013 is provided by an analysis of the asset allocation of US money market funds, which account for a significant share of the dollar funding of euro area banks. According to a survey by Fitch Ratings, the share of short-term financial instruments issued by euro area banks in total assets under management of prime US money market funds declined markedly amid the intensification of
chart 9 Euro area portfolio investment liabilities by instrument
(three-month cumulated flows; as a percentage of euro area GDP)
-8
-6
-4
-2
0
2
4
6
8
-8
-6
-4
-2
0
2
4
6
8
2008 2009 2010 2011 2012 2013
equity securitiesbonds and notesmoney market instruments
Source: ECB.Note: The latest observation is for March 2014.
chart 10 Asset allocation of prime Us money market funds – share of short-term instruments issued by euro area banks(as a percentage of total assets under management)
0
5
10
15
20
25
30
35
0
5
10
15
20
25
30
35
Feb. May Aug. Nov. Feb. May Aug. Nov. Feb. May Aug. Nov.2011 2012 2013
Source: Fitch Ratings.Notes: Prime money market funds participating in the survey include the ten largest US money market funds. Short-term instruments issued by euro area banks include certificates of deposit (CDs), commercial paper (CP), repos and other instruments. The latest observation is for December 2013.
18ECBThe international role of the euroJuly 201418
the euro area sovereign debt crisis in 2011 and the first half of 2012, reaching a historical low of 8.2% in June 2012 (see Chart 10). Following the policy measures taken by European authorities in summer 2012, the share of short-term instruments issued by euro area banks gradually recovered, reaching 17.9% in the final quarter of 2013, the highest level since mid-2011.

19ECB
The international role of the euroJuly 2014
4 REcENT dEvELOPMENTs IN THE INTERNATIONAL UsE OF THE EURO
4.1 THE EURO IN gLObAL FOREIgN ExcHANgE REsERvEs ANd ExcHANgE RATE ANcHORINg
The share of the euro in global foreign exchange reserves continued to decline in 2013. While the share of the US dollar remained broadly unchanged, the shares of the Australian and Canadian dollar further increased, possibly reflecting central banks’ intention to further diversify reserve holdings towards non-traditional reserve currencies.
Foreign exchange reserves continued to grow in 2013, though at reduced speed, reaching a new historical high of USD 11.7 trillion at the end of 2013 (see Chart 11a and Table A1 in the Statistical Annex). According to IMF data, which, however, only cover the currency composition of 53% of global foreign exchange reserves, the shares of major reserve currencies showed just small changes throughout 2013 (see Chart 11b). Such inertia in the currency composition of foreign exchange reserves is likely to result from a combination of factors, including network externalities, exchange rate anchoring and the liquidity properties of major reserve currencies.5 The euro’s share in global foreign exchange reserves continued to decline moderately – a trend observed from mid-2010 – and stood at 24.4% at the end of 2013 (down by 0.9 percentage point since the end of 2012, after adjustment for exchange rate effects). Over the same period, the share of US dollar-denominated assets in global foreign exchange reserves remained stable at 61.2%. By contrast, the share of reserves invested in the Japanese yen increased for the second consecutive year, albeit from a low level. At the end of 2013 the yen’s share stood at its highest level since 2006 (at 3.9%). Similarly, the importance of the Canadian dollar and the Australian dollar as non-traditional reserve currencies continued to grow.6 At the end of 2013 their combined share stood at 3.4%, an increase of 0.8 percentage point compared with the end of 2012.
5 See, for example, Beck and Rahbari (2011).6 For a discussion of the determinants of the growing importance of non-traditional currencies since the onset of the global financial crisis
see ECB (2013), Special Feature A entitled “Global safe asset shortage, non-traditional reserve currencies, and the global financial crisis”.
chart 11 currency composition of global foreign exchange reserves
(USD trillions; at current exchange rates) (percentages; at constant end-2013 exchange rates)
a) Amounts b) Shares
0
2
4
6
8
10
12
0
2
4
6
8
10
12
1999 2001 2003 2005 2007 2009 2011 2013
USDEURJPYundisclosed
0
10
20
30
40
50
60
70
80
0
10
20
30
40
50
60
70
80
1999 2001 2003 2005 2007 2009 2011 2013
USDEURJPY
Sources: IMF and ECB calculations.Note: The latest observation is for the final quarter of 2013.
20ECBThe international role of the euroJuly 201420
The share of “other currencies” (comprising all currencies other than the special drawing right (SDR) currencies, namely the Australian dollar, the Canadian dollar and the Swiss franc) in global foreign exchange reserves remained rather stable, slightly down from 3.2% to 2.9%.
At the disaggregated level, the share of the euro in the official reserves of the central banks of advanced economies declined in 2013, following the temporary increase in 2012, which partly reflected the large-scale purchases of euro-denominated assets by the Swiss National Bank.7 By contrast, the share of the Canadian dollar and the Australian dollar, as well as that of the Japanese yen increased over the same period, possibly reflecting central banks’ intention to further diversify reserve holdings.
The share of euro reserves held by emerging market central banks again declined in 2013, albeit at a much slower pace than in 2012, when the euro’s share had decreased by 3.5 percentage points, possibly reflecting heightened tensions in euro area sovereign debt markets and a relatively high share of euro-denominated assets prior to the crisis. The decline in 2013 by 1.1 percentage points was mirrored in increases in the shares of foreign currency reserves in most other currencies, with the exception of the pound sterling. Again, to the extent that emerging market central banks are holding reserves in excess of precautionary needs, diversification may have been a possible driver.8
Among the non-euro area central banks which disclose the currency composition of their foreign exchange reserves, Croatia, Lithuania, Romania, the United Kingdom and Canada reported decreases in the share of reserves in euro, while the Czech Republic and the United States reported increases. For the other countries, it remained relatively stable (see Table A2 in the Statistical Annex).
Putting these developments into a somewhat longer-term perspective, and focusing on developments since the start of the global financial crisis, the share of the US dollar in foreign exchange reserves has declined by 4.1 percentage points since the end of 2007 (at constant exchange rates). Over the same period, the euro’s share declined by only 0.6 percentage point. This decline in the shares of the US dollar, and to a lesser extent the euro, was mirrored by increases in the shares of reserves in “other” currencies – not the traditional reserve units reported by the IMF – and Japanese yen. This indicates that while the share of the euro in global reserves continues to be on a slightly declining trend, overall the developments might also reflect a broader diversification of portfolios in the wake of the global financial crisis, which seems to be carried out at the expense of both the euro and the US dollar. In fact, an empirical analysis of the drivers of the rise in non-traditional reserve currencies suggests that heightened credit risk of some advanced economy sovereigns has been an important factor in this context (ECB, 2013).
Overall, these findings suggest that the euro continued to perform its function as the second-most important reserve currency in the world in 2013, and that the US dollar’s status as the leading global reserve currency remained unchanged.
The use of the euro as a reference currency for the anchoring of exchange rates remained broadly unchanged. As in previous years, the use of the euro in the exchange rate regimes of countries outside the euro area was, to a large extent, underpinned by geographical and institutional factors, being observed mainly in countries neighbouring the euro area and countries that have established special institutional arrangements with the EU or its Member States (see Table A3 in the Statistical Annex). With the exception of the countries participating in ERM II, the decision to use the euro as 7 See ECB (2013).8 See Beck and Rahbari (2011) and Beck and Weber (2011).
21ECB
The international role of the euroJuly 2014 21
4� Recentdevelopments
in theinteRnational
use of the euRo
an anchor currency is a unilateral one and does not involve any commitment on the part of the ECB. The US dollar, on the other hand, continues to be widely used as an exchange rate anchor both in Asia and in Central and South America.
4.2 THE EURO IN INTERNATIONAL dEbT MARkETs
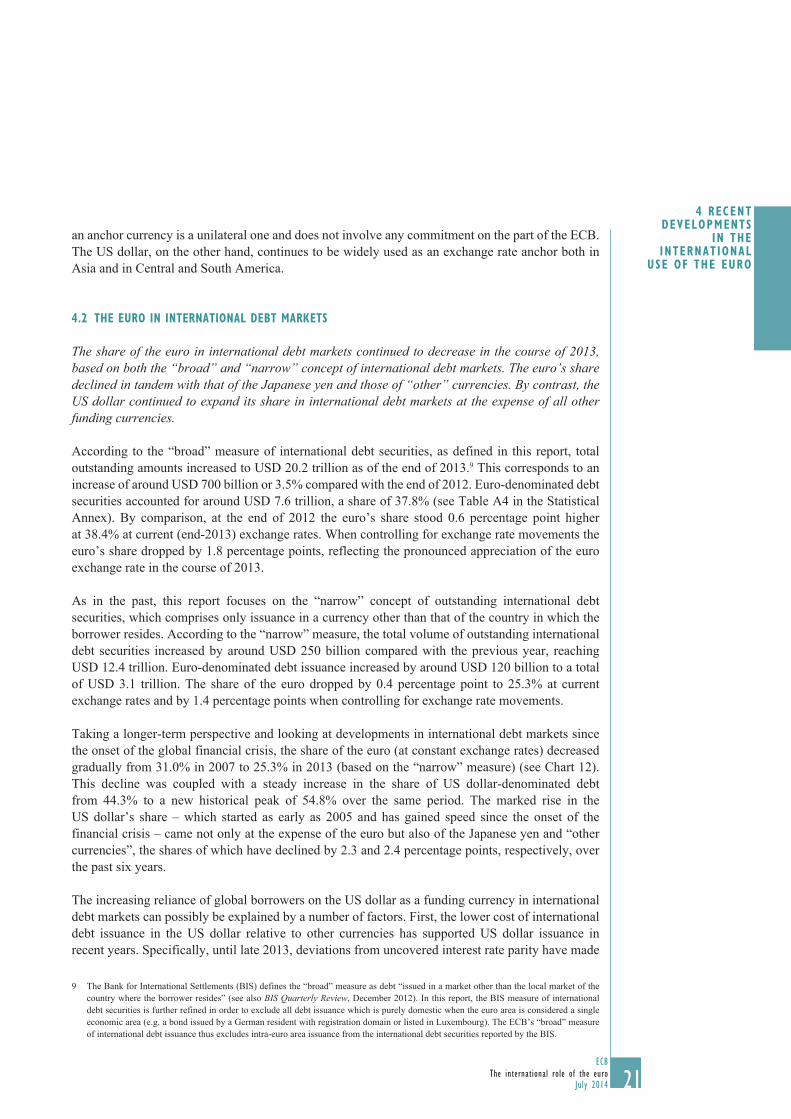
The share of the euro in international debt markets continued to decrease in the course of 2013, based on both the “broad” and “narrow” concept of international debt markets. The euro’s share declined in tandem with that of the Japanese yen and those of “other” currencies. By contrast, the US dollar continued to expand its share in international debt markets at the expense of all other funding currencies.
According to the “broad” measure of international debt securities, as defined in this report, total outstanding amounts increased to USD 20.2 trillion as of the end of 2013.9 This corresponds to an increase of around USD 700 billion or 3.5% compared with the end of 2012. Euro-denominated debt securities accounted for around USD 7.6 trillion, a share of 37.8% (see Table A4 in the Statistical Annex). By comparison, at the end of 2012 the euro’s share stood 0.6 percentage point higher at 38.4% at current (end-2013) exchange rates. When controlling for exchange rate movements the euro’s share dropped by 1.8 percentage points, reflecting the pronounced appreciation of the euro exchange rate in the course of 2013.
As in the past, this report focuses on the “narrow” concept of outstanding international debt securities, which comprises only issuance in a currency other than that of the country in which the borrower resides. According to the “narrow” measure, the total volume of outstanding international debt securities increased by around USD 250 billion compared with the previous year, reaching USD 12.4 trillion. Euro-denominated debt issuance increased by around USD 120 billion to a total of USD 3.1 trillion. The share of the euro dropped by 0.4 percentage point to 25.3% at current exchange rates and by 1.4 percentage points when controlling for exchange rate movements.
Taking a longer-term perspective and looking at developments in international debt markets since the onset of the global financial crisis, the share of the euro (at constant exchange rates) decreased gradually from 31.0% in 2007 to 25.3% in 2013 (based on the “narrow” measure) (see Chart 12). This decline was coupled with a steady increase in the share of US dollar-denominated debt from 44.3% to a new historical peak of 54.8% over the same period. The marked rise in the US dollar’s share – which started as early as 2005 and has gained speed since the onset of the financial crisis – came not only at the expense of the euro but also of the Japanese yen and “other currencies”, the shares of which have declined by 2.3 and 2.4 percentage points, respectively, over the past six years.
The increasing reliance of global borrowers on the US dollar as a funding currency in international debt markets can possibly be explained by a number of factors. First, the lower cost of international debt issuance in the US dollar relative to other currencies has supported US dollar issuance in recent years. Specifically, until late 2013, deviations from uncovered interest rate parity have made
9 The Bank for International Settlements (BIS) defines the “broad” measure as debt “issued in a market other than the local market of the country where the borrower resides” (see also BIS Quarterly Review, December 2012). In this report, the BIS measure of international debt securities is further refined in order to exclude all debt issuance which is purely domestic when the euro area is considered a single economic area (e.g. a bond issued by a German resident with registration domain or listed in Luxembourg). The ECB’s “broad” measure of international debt issuance thus excludes intra-euro area issuance from the international debt securities reported by the BIS.
22ECBThe international role of the euroJuly 20142222
it cheaper to borrow in US dollars and swap the proceeds into other currencies, including euro, than to borrow in other currencies directly. Second, until mid-2013, interest rate and exchange rate expectations may have also worked in favour of the US dollar. In particular, against the background of the US Federal Reserve’s monetary policy, which included among other unconventional monetary policies a large-scale asset purchase programme, market participants expected relatively low US interest rates and muted US dollar exchange rate volatility over a protracted period (see also Special Feature C). Third, recent dynamics in international bond issuance have been largely driven by emerging market economies, which have increasingly tended to switch from local to international bond market issuance.10 This increase in external financing has been particularly pronounced in Latin American countries, which tend to issue in US dollars, taking advantage of the favourable liquidity conditions prevailing in US dollar-denominated debt markets. Finally, the lingering effects of the euro area sovereign debt crisis may have continued to have an impact on the demand for euro-denominated international debt issuance.
4.3 THE EURO As A PARALLEL cURRENcY
4.3.1 cAsH sUbsTITUTION
Foreign demand for euro banknotes increased for the third consecutive year, as the annual growth rate remained clearly higher than that of the banknotes in domestic circulation, suggesting that the euro area sovereign debt crisis did not have any major impact on the use of euro banknotes outside the euro area.
10 See Caballero, J., Panizza, U. and Powell, A. (2014), “Balance Sheets and Credit Growth”, in Powell, A. (ed.), Global Recovery and Monetary Normalization: Escaping a Chronicle Foretold?, Latin American and Caribbean Macroeconomic Report 2014, Inter-American Development Bank, Chapter 4.
chart 12 stock of international debt securities (narrow measures): outstanding amounts and currency shares(USD trillions; at current exchange rates) (percentages; at constant end-2013 exchange rates)
a) Outstanding amounts b) Shares
0
2,000
4,000
6,000
8,000
10,000
12,000
14,000
0
2,000
4,000
6,000
8,000
10,000
12,000
14,000
1999 2001 2003 2005 2007 2009 2011 2013
other currenciesJPYEURUSD
0
10
20
30
40
50
60
0
10
20
30
40
50
60
1999 2001 2003 2005 2007 2009 2011 2013
USDEURJPY
Sources: BIS and ECB calculations.Note: The latest observation is for December 2013.
23ECB
The international role of the euroJuly 2014 23
4� Recentdevelopments
in theinteRnational
use of the euRo
23
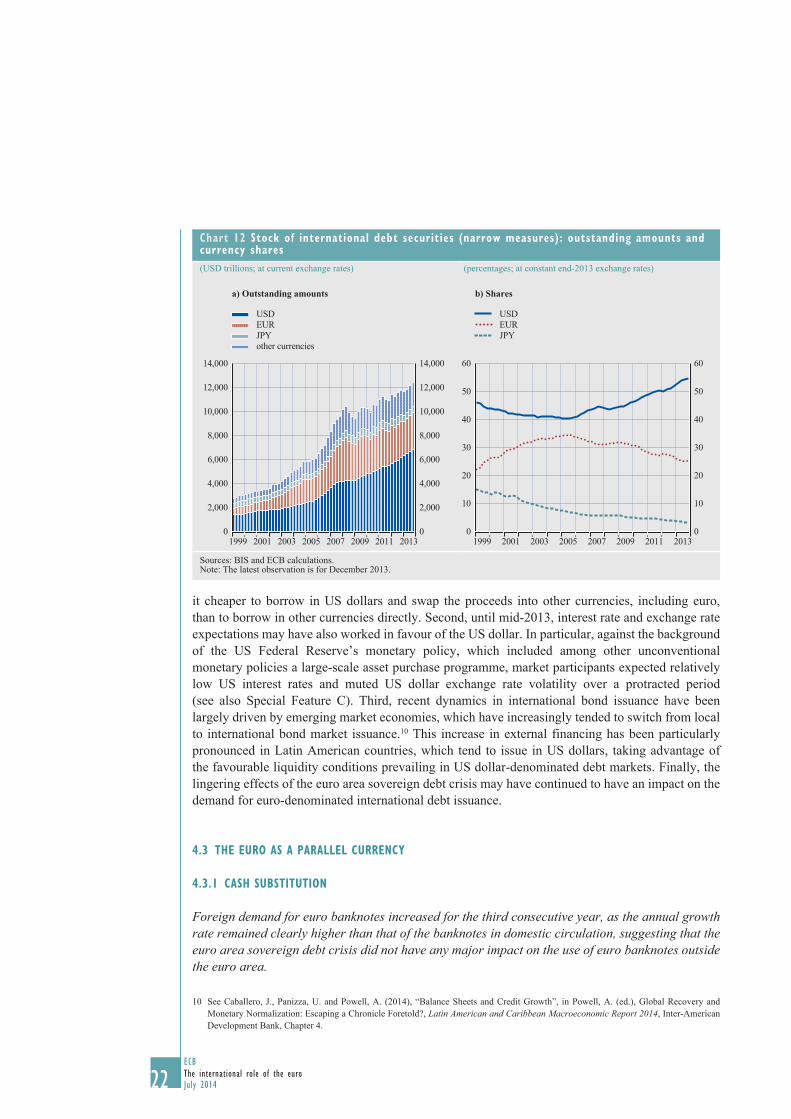
The use of euro banknotes outside the euro area cannot be estimated with exact precision. One estimate of the amount of euro banknotes circulating abroad (and reported regularly in this report) is represented by the accumulation over time of net shipments of euro banknotes by euro area monetary financial institutions (MFIs) to destinations outside the euro area. On the basis of this method, around EUR 143 billion worth of euro banknotes (after adjusting for seasonal effects) are estimated to have been in circulation outside the euro area at the end of December 2013 (see Chart 13). This was around 16% of the total euro currency in circulation in that month in the euro area. This estimate is regarded as a clear lower bound, given that the banking channel is just one of the several channels through which euro banknotes leave and re-enter the euro area. Anecdotal evidence suggests that the outflows of euro banknotes via non-MFI channels (e.g. via tourism or workers’ remittances) are, for most countries, greater than the inflows via such channels. Therefore, the net shipments by banks offer an incomplete picture of true net flows of banknotes. Other estimates suggest that around 25% of euro currency in circulation (potentially slightly higher) were circulating outside the euro area at the end of 2013.
In 2013 foreign demand for euro banknotes continued to grow for the third consecutive year at a double-digit rate, and the annual growth rate remained clearly higher than that of the banknotes in circulation within the euro area. Indeed, the annual growth rate of foreign demand for euro banknotes (based on the accumulation over time of net shipments of euro banknotes by euro area MFIs to destinations outside the euro area) stood at a similar level as that of 2011 (10% in December 2013), and just slightly lower than the level recorded in December 2012 (11%), while the domestic circulation of euro banknotes strengthened somewhat in 2013 (to 5.3%, from 2.4% in December 2012). Nonetheless, monthly net shipments in the last three years have not been as large
chart 13 Net shipments of euro banknotes to destinations outside the euro area
(EUR billions; adjusted for seasonal effects)
14
12
10
8
6
4
2
0
-2 0
20
40
60
80
100
120
140
160
2002 2004 2006 2008 2010 2012
monthly shipments (left-hand scale)cumulative shipments (right-hand scale)
Source: Eurosystem.Notes: Net shipments are the sum of euro banknotes sent to destinations outside the euro area minus euro banknotes received from outside the euro area. The latest observation is for March 2014.
chart 14 Foreign currency brought into and taken out of the Russian Federation by authorised banks(USD billions; USD/EUR)
0.6
0.8
1.0
1.2
1.4
1.6
1.8
-4
-2
2
0
4
6
8
in/out balance US dollar (left-hand scale)in/out balance Euro (left-hand scale)USD/EUR exchange rate (right-hand scale)
2005 2006 2007 2008 2009 2010 2011 2012 2013
Sources: Bank of Russia and ECB.Note: The latest observation is for December 2013.

24ECBThe international role of the euroJuly 20142424
as the average shipments observed in the period 2007-08, when foreign demand for euro banknotes peaked, in particular following the collapse of Lehman Brothers. The robust net shipments of euro banknotes in 2013 reflected both higher gross backflows of euro banknotes from non-euro area residents and higher gross outflows of banknotes outside the euro area. Overall, recent developments in the net shipments of euro banknotes abroad continue to suggest that the euro area sovereign debt crisis did not have any major impact on the use of euro banknotes outside the euro area.
Further evidence on the holdings of euro currency abroad can be derived from statistics provided by the monetary authorities of non-euro area countries. For example, the Central Bank of Russia publishes data on foreign currency brought into and taken out of the Russian Federation by authorised banks. These statistics show that in 2013 the net shipment of euro banknotes to Russia increased for the third consecutive year (see Chart 14), after the persistent net outflows observed for most of 2009 and 2010. The net increase in euro banknotes brought into the Russian Federation by authorised banks in 2013 was much higher than in the previous year. The data thus suggest that Russian residents may have increased their euro banknote holdings in the last three years, after reducing their holdings in 2010. By contrast, net holdings of US dollar banknotes brought into the Russian Federation by authorised banks declined in 2013, posting a marginal decrease (as had last occurred in 2010), in line with the strengthening of the euro vis-à-vis the US dollar.
Data collected from international banknote wholesale banks show increased sales of euro banknotes to regions outside the euro area in 2013 (see Chart 15). The increase is mainly due to increased demand from Russia. In value terms, net exports of euro banknotes to Russia doubled in 2013 as compared with 2012. As in previous years, a large share of euro banknote sales went to Switzerland
chart 15 Regional breakdown of euro banknote purchases from and sales to locations outside the euro area(EUR billions)
0
10
20
30
40
50
60
70
0
10
20
30
40
50
60
70
2009 2010 2011 2012 2013
Central and South America North America Africa Asia and Australia Middle East Switzerland
Russianon-EU Member States in eastern Europe excluding Russiaother non-euro EUnon-euro area EU Member States in eastern Europe
rest of Europe
a) Sales b) Purchases
0
10
20
30
40
50
60
70
0
10
20
30
40
50
60
70
2009 2010 2011 2012 2013
Central and South America North America Africa Asia and Australia Middle East Switzerland
Russianon-EU Member States in eastern Europe excluding Russiaother non-euro EUnon-euro area EU Member States in eastern Europe
rest of Europe
2009 2010 2011 2012 2013 0
10
20
30
40
50
60
70
0
10
20
30
40
50
60
70
Sources: ECB (based on data from wholesale banks).Notes: These data exclude trade between wholesale banks. From 2012 onwards figures contain data obtained from one additional wholesale bank which previously had not responded to this survey. These data differ from statistics on net shipments, as the latter do not take account of the recirculation of banknotes by wholesale banks outside the euro area (e.g. where a wholesale bank purchases a euro banknote from a client in Asia and sells it to a client in Russia).

25ECB
The international role of the euroJuly 2014 25
4� Recentdevelopments
in theinteRnational
use of the euRo
25
and to the United Kingdom. Both countries together had a share of nearly 50% of the total sales value. At the same time, backflows of euro banknotes (i.e. purchases from wholesale banks) stemmed mainly from EU Member States in eastern Europe and from Turkey, broadly in line with developments in previous years.
4.3.2 AssET ANd LIAbILITY sUbsTITUTION
After households in most CESEE countries temporarily reduced the share of foreign currency savings in their deposits in 2012, recent developments tentatively suggest that preferences are shifting back towards having foreign currency deposits, and in particular euro-denominated deposits, as their share in total foreign deposits rose in most CESEE countries in 2013. At the same time, the euro’s share in total deposits remained broadly stable compared with 2012.
Economic agents in central, eastern and south-eastern Europe use the euro widely in the domestic economy, notwithstanding the fact that the euro is not the legal tender in most of these countries.11
The euroisation of the liability side of banks’ balance sheets remained extensive in several non-euro area EU Member States from central and eastern Europe12, as well as in most EU candidate and potential candidate countries in south-eastern Europe.13 The use of the euro seems to be most widespread in the Western Balkans, a region which has previously experienced periods of macroeconomic instability. In 2013 the share of euro-denominated deposits in total deposits of EU Member States ranged from 55.8% in Croatia to 6.8% and 6.1% in the Czech Republic and Poland respectively (see Table A14 in the Statistical Annex). By comparison, in the Western Balkans this share ranges from 70.7 % in Serbia to 30.3% in Albania.
Furthermore, the euro remained the preferred store of value relative to other foreign currencies.14 Compared with 2012, the euro’s share in total foreign deposits rose in most CESEE countries (see Chart 16). This development could point to a possible reversal of currency preferences to the levels observed before the intensification of the euro area crisis in the first half of 2012. While economic agents in most CESEE countries reduced the share of both euro and other foreign currency savings in their deposits and thus turned to the local currency in 2012, there are indications that there was a shift in currency preferences towards foreign currency deposits, and in particular towards euro deposits in 2013. Evidence provided by the OeNB Euro Survey confirms that trust in the euro increased in CESEE countries in the autumn of 2013 (see Section 4.3.3 below).
On the asset side of banks’ balance sheets euroisation continues to be pronounced, in line with the developments on the liability side, also reflecting trade patterns and geographic proximity. The share of euro-denominated loans in total loans varies across countries but in general remains high, in particular in countries with exchange rate regimes in which the euro is the reference currency, notably countries having currency board arrangements, or pegged or tightly managed exchange rates. The share of euro-denominated loans in total loans ranged from 70.3 % in Lithuania to 9.4 % in the Czech Republic in 2013 (see Table A13 in the Statistical Annex).
11 Kosovo (in line with UNSCR 1244 and the ICJ Opinion on the Kosovo Declaration of Independence) and Montenegro use the euro as the official legal tender and are therefore excluded from this analysis.
12 Bulgaria, the Czech Republic, Croatia, Hungary, Lithuania, Poland and Romania. 13 Albania, Bosnia and Herzegovina, the former Yugoslav Republic of Macedonia, Serbia and Turkey.14 Valuation effects might explain these developments to some extent, as the data are not adjusted for exchange rate movements.

26ECBThe international role of the euroJuly 20142626
In general, loans denominated in foreign currencies could entail macroeconomic costs and pose risks to financial stability, specifically when economic agents face currency mismatches on their balance sheets.15 Against this background, various CESEE countries have embarked on de-euroisation strategies in the wake of the financial crisis. In particular, the implementation of the ESRB Recommendation on lending in foreign currencies should help reduce the number of new foreign exchange loans in these economies. However, the outstanding stock of foreign exchange loans is likely to disappear only gradually over time. In this context, the ratio of euro-denominated loans to euro-denominated deposits still remains relatively high in many countries.16
4.3.3 REsULTs FROM THE OENb EURO sURvEY OF HOUsEHOLds IN cENTRAL, EAsTERN ANd sOUTH-EAsTERN EUROPE
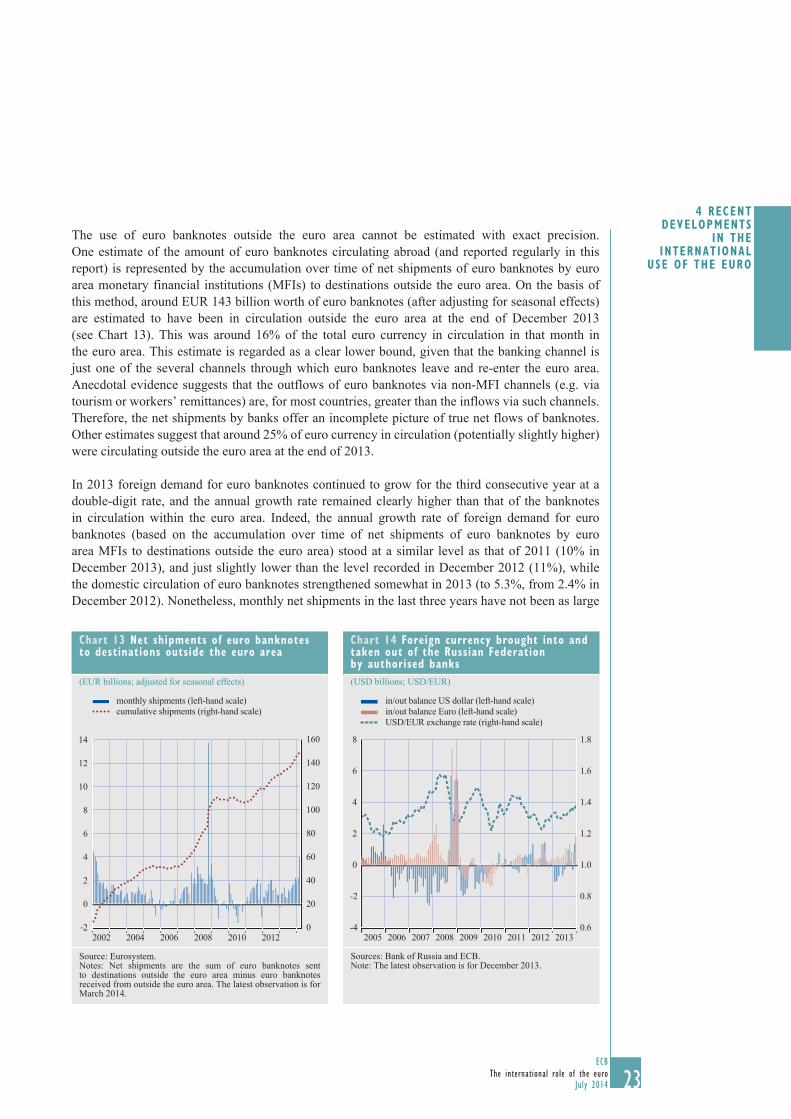
Results from the OeNB Euro Survey suggest that CESEE households’ trust in the euro has recovered markedly across all countries since spring 2012, and currently stands close to the levels observed prior to the onset of the sovereign debt crisis. In addition, the autumn 2013 Euro Survey results suggest that the euro is relatively “more trusted” than both the local currency and the US dollar in the majority of CESEE countries.
15 In order to address the risk stemming from lending in foreign currencies the European Systemic Risk Board published the Recommendation on lending in foreign currencies in October 2011 (see ESRB Recommendation on foreign exchange lending). In November 2013 the ESRB published a report assessing the implementation of the recommendation (see ESRB report on the implementation of the recommendation on foreign exchange lending). Further information can be found in The International Role of the euro, 2011, Box 3: “Risks and costs associated with foreign currency lending”.
16 This should not, however, mask the fact that banks are subject to indirect credit risk on account of exposure to unhedged borrowers, in particular households.
chart 16 The euro’s share in total foreign currency deposits in cEsEE countries
(in percent of foreign currency deposits)
0
20
40
60
80
100
0
20
40
60
80
100
HR RO BG LT CZ HU PL RS MK TR BA ALEU Member States EU candidate
countries EU potential
candidate countries
20122013
Sources: ECB, national central banks and ECB calculations.Notes: The definition of deposits is not unified across CESEE countries and deposits indexed to the euro, or other foreign currencies are not included. In December 2013 the ratio of foreign currency indexed deposits to total deposits was 3.3% in Croatia, 0.6% in the former Yugoslav Republic of Macedonia and 0.9% in Serbia. Kosovo (in line with UNSCR 1244 and the ICJ Opinion on the Kosovo Declaration of Independence) and Montenegro are excluded due to the lack of their own currency. Outstanding amounts are recorded at the end of December in each year.
27ECB
The international role of the euroJuly 2014 27
4� Recentdevelopments
in theinteRnational
use of the euRo
27
The OeNB Euro Survey of households has been conducted in ten CESEE countries since 2007 to shed light on the different dimensions, extent and drivers of euroisation. It collects information on the role of the euro for currency substitution, asset substitution and liability substitution as well as on households’ sentiments, expectations and trust in institutions.17
The results from the OeNB Euro Survey suggest that households’ trust in the euro temporarily decreased during the sovereign debt crisis, reaching historic lows in the autumn of 2011 and in spring 2012 (ECB 2013). However, trust in the euro has since recovered across countries (Chart 17). Households’ trust in the euro in most countries is gradually returning to the levels observed prior to the onset of the sovereign debt crisis in spring 2010. In nine out of ten countries, the majority of households agreed that “the euro will be very stable and trustworthy over the next five years”.18
This measure of “trust in the euro” is, of course, a very broad metric. It focuses on the long-term and encompasses monetary expectations as well as trust in (European) institutions (Beckmann and Scheiber, 2012). Previous research has shown that both factors play a role in euroisation.19
17 For more details on the survey, recent publications and a summary of recent results see: http://www.oenb.at/en/Monetary-Policy/Surveys/OeNB-Euro-Survey.html
18 For Croatia, the decline from spring 2013 to autumn 2013 coincides with accession to the European Union, but is likely to be due to a change in the interviewer team, which led to a decline in the overall response rate and more pessimistic responses, even to questions unrelated to European issues.
19 Regarding monetary expectations, Ize and Levy Yeyati (2003) argue that households will opt for the foreign currency if they expect the volatility of inflation to be higher than the volatility of the real exchange rate. This “minimum variance portfolio” theory has been (re)confirmed empirically, e.g. by Levy Yeyati (2006) using aggregate data, and by Fidrmuc et al. (2013) using micro-data. Regarding institutions, De Nicolo et al. (2005) find that a lack of government efficiency and of the rule of law, as well as a notable incidence of corruption, is associated with higher levels of dollarisation.
chart 17 Trust in the euro
a) EU Member States b) Potential candidate countries
-1.0
-0.5
0.0
0.5
1.0
1.5
2.0
-1.0
-0.5
0.0
0.5
1.0
1.5
2.0
2007 2008 2009 2010 2011 2012 20142013
2 Autumn1 Spring
2 1 2 1 2 1 2 1 2 1 2 1 12
Czech RepublicHungaryPoland
BulgariaCroatiaRomania
-1.0
-0.5
0.0
0.5
1.0
1.5
2.0
-1.0
-0.5
0.0
0.5
1.0
1.5
2.0
FYR MacedoniaSerbia
AlbaniaBosnia and Herzegovina
2007 2008 2009 2010 2011 2012 2013 2014
2 Autumn1 Spring
2 1 2 1 2 1 2 1 2 1 2 1 12
Source: OeNB Euro Survey.Notes: Respondents were asked to what extent, on a scale from 1 (strongly agree) to 6 (strongly disagree), they agreed with the above statement. The normalised sample means ranged from -2.5 (“exclusively trust in the domestic currency”) via 0 (“neutral”) to 2.5 (“exclusively trust in the euro”).
28ECBThe international role of the euroJuly 20142828
Differences in exchange rate regimes across countries also play an important role in influencing the preferences for one currency against another.
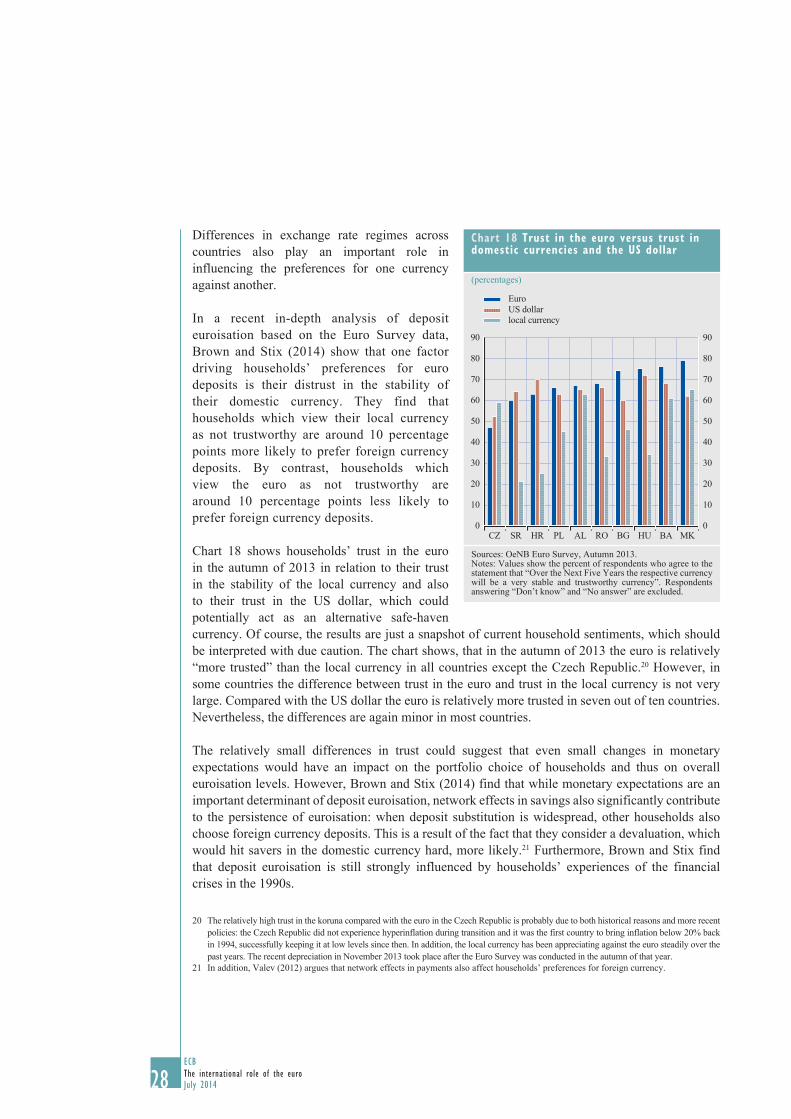
In a recent in-depth analysis of deposit euroisation based on the Euro Survey data, Brown and Stix (2014) show that one factor driving households’ preferences for euro deposits is their distrust in the stability of their domestic currency. They find that households which view their local currency as not trustworthy are around 10 percentage points more likely to prefer foreign currency deposits. By contrast, households which view the euro as not trustworthy are around 10 percentage points less likely to prefer foreign currency deposits.
Chart 18 shows households’ trust in the euro in the autumn of 2013 in relation to their trust in the stability of the local currency and also to their trust in the US dollar, which could potentially act as an alternative safe-haven currency. Of course, the results are just a snapshot of current household sentiments, which should be interpreted with due caution. The chart shows, that in the autumn of 2013 the euro is relatively “more trusted” than the local currency in all countries except the Czech Republic.20 However, in some countries the difference between trust in the euro and trust in the local currency is not very large. Compared with the US dollar the euro is relatively more trusted in seven out of ten countries. Nevertheless, the differences are again minor in most countries.
The relatively small differences in trust could suggest that even small changes in monetary expectations would have an impact on the portfolio choice of households and thus on overall euroisation levels. However, Brown and Stix (2014) find that while monetary expectations are an important determinant of deposit euroisation, network effects in savings also significantly contribute to the persistence of euroisation: when deposit substitution is widespread, other households also choose foreign currency deposits. This is a result of the fact that they consider a devaluation, which would hit savers in the domestic currency hard, more likely.21 Furthermore, Brown and Stix find that deposit euroisation is still strongly influenced by households’ experiences of the financial crises in the 1990s.
20 The relatively high trust in the koruna compared with the euro in the Czech Republic is probably due to both historical reasons and more recent policies: the Czech Republic did not experience hyperinflation during transition and it was the first country to bring inflation below 20% back in 1994, successfully keeping it at low levels since then. In addition, the local currency has been appreciating against the euro steadily over the past years. The recent depreciation in November 2013 took place after the Euro Survey was conducted in the autumn of that year.
21 In addition, Valev (2012) argues that network effects in payments also affect households’ preferences for foreign currency.
chart 18 Trust in the euro versus trust in domestic currencies and the Us dollar
(percentages)
0
10
20
30
40
50
60
70
80
90
0
10
20
30
40
50
60
70
80
90
CZ SR HR PL AL RO BG HU BA MK
EuroUS dollarlocal currency
Sources: OeNB Euro Survey, Autumn 2013.Notes: Values show the percent of respondents who agree to the statement that “Over the Next Five Years the respective currency will be a very stable and trustworthy currency”. Respondents answering “Don’t know” and “No answer” are excluded.
29ECB
The international role of the euroJuly 2014 29
4� Recentdevelopments
in theinteRnational
use of the euRo
29
4.4 THE EURO IN OTHER MARkET sEgMENTs
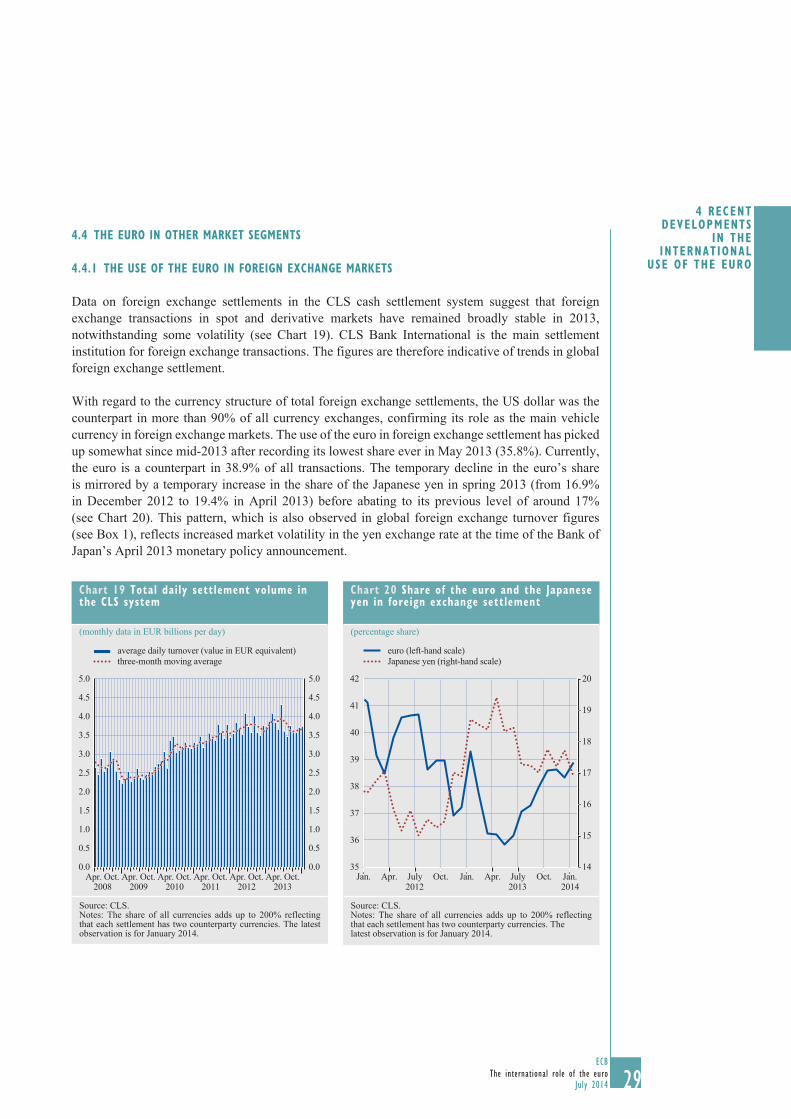
4.4.1 THE UsE OF THE EURO IN FOREIgN ExcHANgE MARkETs
Data on foreign exchange settlements in the CLS cash settlement system suggest that foreign exchange transactions in spot and derivative markets have remained broadly stable in 2013, notwithstanding some volatility (see Chart 19). CLS Bank International is the main settlement institution for foreign exchange transactions. The figures are therefore indicative of trends in global foreign exchange settlement.
With regard to the currency structure of total foreign exchange settlements, the US dollar was the counterpart in more than 90% of all currency exchanges, confirming its role as the main vehicle currency in foreign exchange markets. The use of the euro in foreign exchange settlement has picked up somewhat since mid-2013 after recording its lowest share ever in May 2013 (35.8%). Currently, the euro is a counterpart in 38.9% of all transactions. The temporary decline in the euro’s share is mirrored by a temporary increase in the share of the Japanese yen in spring 2013 (from 16.9% in December 2012 to 19.4% in April 2013) before abating to its previous level of around 17% (see Chart 20). This pattern, which is also observed in global foreign exchange turnover figures (see Box 1), reflects increased market volatility in the yen exchange rate at the time of the Bank of Japan’s April 2013 monetary policy announcement.
chart 19 Total daily settlement volume in the cLs system
(monthly data in EUR billions per day)
0.0
0.5
1.0
1.5
2.0
2.5
3.0
3.5
4.0
4.5
5.0
0.0
0.5
1.0
1.5
2.0
2.5
3.0
3.5
4.0
4.5
5.0
Apr. Apr.Oct. Apr.Oct. Apr.Oct. Apr.Oct. Apr.Oct. Oct.2008 2009 2010 2011 2012 2013
average daily turnover (value in EUR equivalent)three-month moving average
Source: CLS.Notes: The share of all currencies adds up to 200% reflecting that each settlement has two counterparty currencies. The latest observation is for January 2014.
chart 20 share of the euro and the Japanese yen in foreign exchange settlement
(percentage share)
14
15
16
17
18
19
20
35
36
37
38
39
40
41
42
Jan. Apr. July Oct. Jan. Jan.Apr. July Oct.
euro (left-hand scale)Japanese yen (right-hand scale)
2012 2013 2014
Source: CLS.Notes: The share of all currencies adds up to 200% reflecting that each settlement has two counterparty currencies. Thelatest observation is for January 2014.
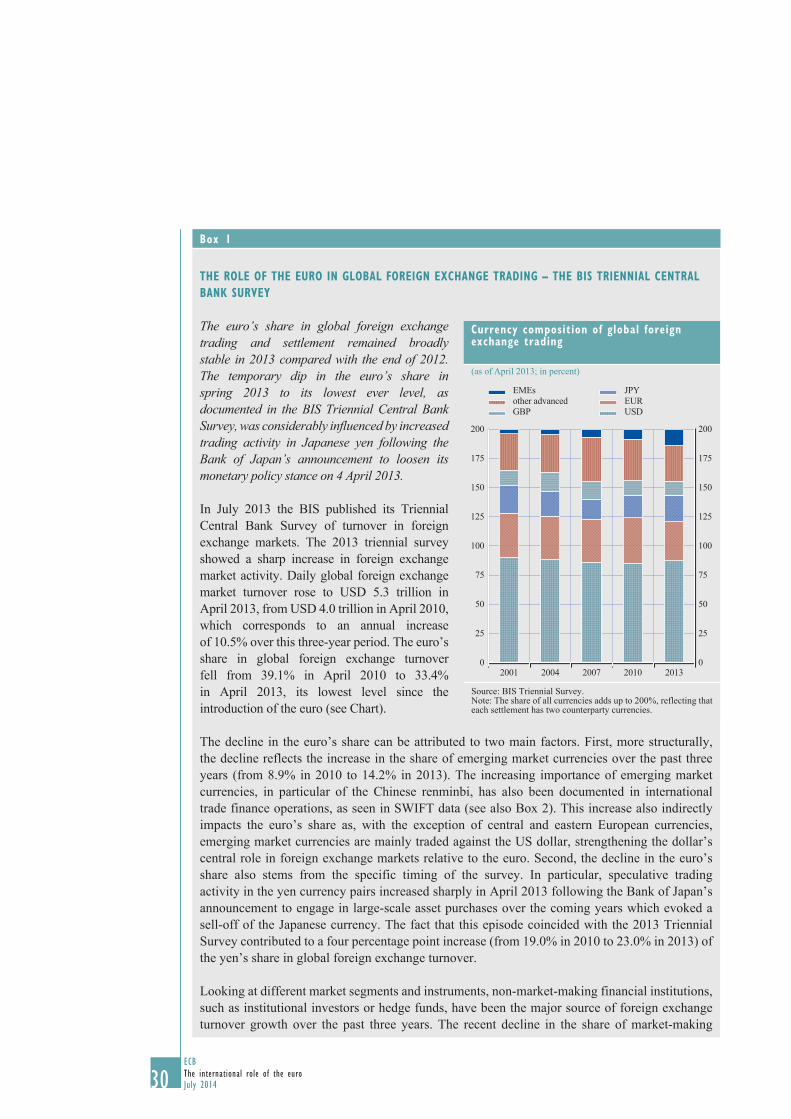
30ECBThe international role of the euroJuly 20143030
box 1
THE ROLE OF THE EURO IN gLObAL FOREIgN ExcHANgE TRAdINg – THE bIs TRIENNIAL cENTRAL bANk sURvEY
The euro’s share in global foreign exchange trading and settlement remained broadly stable in 2013 compared with the end of 2012. The temporary dip in the euro’s share in spring 2013 to its lowest ever level, as documented in the BIS Triennial Central Bank Survey, was considerably influenced by increased trading activity in Japanese yen following the Bank of Japan’s announcement to loosen its monetary policy stance on 4 April 2013.
In July 2013 the BIS published its Triennial Central Bank Survey of turnover in foreign exchange markets. The 2013 triennial survey showed a sharp increase in foreign exchange market activity. Daily global foreign exchange market turnover rose to USD 5.3 trillion in April 2013, from USD 4.0 trillion in April 2010, which corresponds to an annual increase of 10.5% over this three-year period. The euro’s share in global foreign exchange turnover fell from 39.1% in April 2010 to 33.4% in April 2013, its lowest level since the introduction of the euro (see Chart).
The decline in the euro’s share can be attributed to two main factors. First, more structurally, the decline reflects the increase in the share of emerging market currencies over the past three years (from 8.9% in 2010 to 14.2% in 2013). The increasing importance of emerging market currencies, in particular of the Chinese renminbi, has also been documented in international trade finance operations, as seen in SWIFT data (see also Box 2). This increase also indirectly impacts the euro’s share as, with the exception of central and eastern European currencies, emerging market currencies are mainly traded against the US dollar, strengthening the dollar’s central role in foreign exchange markets relative to the euro. Second, the decline in the euro’s share also stems from the specific timing of the survey. In particular, speculative trading activity in the yen currency pairs increased sharply in April 2013 following the Bank of Japan’s announcement to engage in large-scale asset purchases over the coming years which evoked a sell-off of the Japanese currency. The fact that this episode coincided with the 2013 Triennial Survey contributed to a four percentage point increase (from 19.0% in 2010 to 23.0% in 2013) of the yen’s share in global foreign exchange turnover.
Looking at different market segments and instruments, non-market-making financial institutions, such as institutional investors or hedge funds, have been the major source of foreign exchange turnover growth over the past three years. The recent decline in the share of market-making
currency composition of global foreign exchange trading
(as of April 2013; in percent)
0
25
50
75
100
125
150
175
200
0
25
50
75
100
125
150
175
200
2001 2004 2007 2010 2013
EMEsother advancedGBP
JPYEURUSD
Source: BIS Triennial Survey.Note: The share of all currencies adds up to 200%, reflecting that each settlement has two counterparty currencies.

31ECB
The international role of the euroJuly 2014 31
4� Recentdevelopments
in theinteRnational
use of the euRo
31
4.4.2 THE UsE OF THE EURO IN INTERNATIONAL TRAdE INvOIcINg
Available data on the use of the euro as an invoicing currency for extra-euro area exports and imports suggest that the share of the euro has increased slightly between 2012 and 2013, in particular in the services sector.
In 2013 the use of the euro in the settlement or invoicing of international trade flows increased compared with 2012. The share of the euro in the euro area’s exports of goods rose by 0.5 percentage point to 67.2% (see Table A11 in the Statistical Annex). The share of the euro in the euro area’s imports of goods, at 51.7%, was also higher in 2013 than in 2012, when it stood at 51.3%. Regarding services, the euro’s share in international trade increased significantly, for both exports and imports of services (by 6.7 and 5.6 percentage points, respectively).
Taking a medium-term perspective, the euro’s share in the euro area’s exports of goods was, at 67.2%, significantly higher than in 2007 before the onset of the global financial crisis, when it stood at 59.6%. Similarly, the euro’s share in the imports of goods recovered to levels markedly above those observed in 2007.
Notwithstanding these advances, aggregate changes for the euro area hide some developments in stressed euro area countries, for instance in most countries there has been a decline in the use of the euro as the invoicing currency for goods since the sovereign debt crisis. Bilateral trade statistics from the IMF suggest that this could be due to a reduction in the levels of trade these countries have with European trading partners, while their trade with the developing Asian and Middle Eastern countries has increased over this period, resulting mainly in an increase in the use of the US dollar
financial institutions was largely driven by two factors. First, an increasing number of major dealing banks are able to match their customer trades directly on their own books, reducing the need to offload inventory imbalances and hedge risk via the traditional inter-dealer market. Second, more sophisticated electronic dealing technology which has promoted a more efficient liquidity aggregation and algorithmic trading has become accessible to a much broader range of market participants (including smaller banks, hedge funds and private individuals). Finally, the continuing decline in trading costs has made algorithmic high-frequency trading more profitable, adding to overall turnover in all segments of the market. Turning to instruments, spot trading has grown by 38% over the last three years to a daily turnover of USD 2.05 trillion which is now close to the USD 2.20 trillion daily trading in foreign exchange swaps (+27%). Finally, forwards (USD 680 billion; +43%) foreign exchange options (USD 337 billion; +63%) and currency swaps (USD 54 billion; +26%) make up a smaller fraction of the foreign exchange market.
Considering that the timing of the 2013 Triennial Survey most likely led to an overstatement of both the total daily foreign exchange turnover figure and the share of the Japanese yen in global foreign exchange markets, the BIS provided an extrapolation of the survey data for the period between April and October 2013 in its December 2013 Quarterly Review. According to these estimates, total foreign exchange trading has abated moderately, by USD 300 billion to USD 5.0 billion per day, since April 2013. At the same time, trading in the JPY/USD daily spot and derivative markets fell from USD 800 billion to USD 700 billion and trading in JPY/EUR halved to USD 90 billion per day after doubling in the period between winter 2012 and spring 2013. Finally, trading in the USD/EUR spot and derivative markets rebounded from USD 1.2 trillion to USD 1.3 trillion per day.

32ECBThe international role of the euroJuly 20143232
and of “other” currencies as the invoicing currency. This is also consistent with the finding that the growing presence of the Chinese renminbi in the international monetary system continued in 2013 (see Box 2). Stressed countries also tend to use the euro as invoicing currency the least, while the new euro area member states, which have a stronger trade link with CESEE countries, which in turn tend to trade in euro, show the largest shares for the euro as the invoicing currency.
The share of the euro as an invoicing/settlement currency in the external trade of most non-euro area EU Member States remained by and large stable in 2013 in relation to the 2012 figures (see Table A12 in the Statistical Annex).
box 2
THE UsE OF THE cHINEsE RENMINbI IN INTERNATIONAL TRAdE FINANcINg
The increased use of the Chinese renminbi in international trade financing continued in 2013, partly supported by a number of policy measures taken by the Chinese authorities.
The emergence of the Chinese renminbi as a currency used in international financial transactions is particularly visible in the area of trade financing. According to data from SWIFT, the share of the renminbi in traditional instruments of trade finance has risen sharply over the past few quarters.5 In October 2013 the renminbi advanced to become the second most used currency for settling cross-border payments in trade finance, with a share of 8.7%, while the US dollar still accounts for the lion’s share in worldwide trade finance.6 In the period between April 2012 and October 2013 the share of the renminbi increased by 4.6 percentage points. Over the same period, the euro’s share remained broadly stable (-0.4 percentage point), while the US dollar’s share decreased by more than 3 percentage points.7
Recent measures taken by the Chinese authorities will further enable the international use of the Chinese renminbi. In particular, over the past year the authorities announced several steps to liberalise its external and financial sector. The country’s broader financial reform agenda includes a gradual retreat from foreign exchange intervention towards a managed floating exchange rate regime, a softening of capital controls, the introduction of greater competition
1 See SWIFT, Renminbi Tracker November 2013.6 Note that available data does not allow conclusions to be drawn on the currency of invoicing.7 One of the top five countries using the Chinese renminbi for trade finance was situated in the euro area; the others were exclusively
located in the Asia-Pacific region, according to SWIFT.
currency shares in global trade finance transactions
0
20
40
60
80
100
0
20
40
60
80
100
USD EUR JPY CNY
January 2012 April 2012 October 2013
Source: SWIFT. RMB Monthly Tracker.Note: Based on value of payments.

33ECB
The international role of the euroJuly 2014 33
4� Recentdevelopments
in theinteRnational
use of the euRo
33
in the banking sector and a liberalisation of interest rates (by abolishing deposit rate ceilings). A step forward in this medium-term reform agenda was taken in April 2014 when the People’s Bank of China announced a doubling of the fluctuation band of the Chinese renminbi from +/-1% to +/-2 per cent in relation to its central parity with the US dollar.
Moreover, offshore clearing facilities for trade in renminbi have been expanded, which could further facilitate its use in international financial transactions. Specifically, Frankfurt and London took steps to become clearing hubs in Europe after the People’s Bank of China signed memoranda of understanding on renminbi clearing and settlement with the Deutsche Bundesbank and the Bank of England. Similarly, in order to foster the international use of the renminbi in trade, a network of bilateral swap agreements between the People’s Bank of China and 25 foreign central banks with a total amount of more than USD 400 billion (as of May 2014) has been established.8
8 For an analysis of the link between trade finance and central bank swap lines, see CGFS (2014).
REFERENcEs
Aizenman, J. and Hutchison, M.M. (2012), “Exchange Market Pressure and Absorption by International Reserves: Emerging Markets and Fear of Reserve Loss During the 2008-2009 crisis”, Journal of International Money and Finance, Vol. 31, pp. 1076-1091.
Auboin, M. (2012), “Use of Currencies in International Trade: Any Change in the Picture?”, WTO Staff Working Paper, ERSD-2012-10.
Beck, R. and Rahbari, E. (2011), “Optimal Reserve Composition in the Presence of Sudden Stops”, Journal of International Money and Finance, Vol. 30, pp 1107-1127.
Beck, R. and Weber, S. (2011), “Should Large Reserve Holdings Be More Diversified?”, International Finance, 14(3), pp. 415-444.
Beckmann, E. and Scheiber, T. (2012), “The Impact of Memories of High Inflation on Households’ Trust in Currencies”, Focus on European Economic Integration, Q4/12, Oesterreichische Nationalbank, pp. 80-93.
Brown, M. and Stix, H. (2014), The Euroization of Bank Deposits in Eastern Europe, mimeo.
Committee on the Global Financial System (2014), “Trade finance: developments and issues”, CGFS Papers, No 50, January.
De Nicolo, G.P., Honohan, P. and Ize, A. (2005), “Deposit dollarization: Causes and Consequences”, Journal of Banking and Finance, Vol. 29, pp. 1697-1727.
Dominguez, K.M.E., Hashimoto, Y. and Ito, T. (2012), “International Reserves and the Global Financial Crisis”, Journal of International Economics, Vol. 88, pp. 388-406.
European Central Bank (2014), Financial Stability Review, May.
34ECBThe international role of the euroJuly 20143434
European Central Bank (2014), Financial Integration Report, April.
European Central Bank (2013), The international role of the euro, July.
European Central Bank (2012), The international role of the euro, July.
Fidrmuc, J., Hake, M. and Stix, H. (2013), “Households’ Foreign Currency Borrowing in Central and Eastern Europe”, Journal of Banking and Finance, 37(6), pp. 1880-1897.
Goldberg, L.S. (2009), The Euro at Ten: The Next Global Currency?, Peterson Institute for International Economics, Washington D.C., pp. 61-68
Goldberg, L.S. and Tille, C. (2009), “Micro, Macro, and Strategic Forces in International Trade Invoicing”, CEPR Discussion Papers, No 7534.
Goldberg, L.S. and Tille, C. (2013), “A bargaining theory of trade invoicing and pricing”, CEPR Discussion Papers, No 9447.
Ize, A. and Levy Yeyati, E. (2003), “Financial Dollarization”, Journal of International Economics, Vol. 59, pp. 323-347.
Ligthart, J.E. and Da Silva, J. (2007), “Currency Invoicing in International Trade: A Panel Data Approach”, Tilburg University, Center for Economic Research Discussion Paper, No 25.
Stix, H. (2010), “The Euro as a Safe Haven Asset in Central, Eastern and South-Eastern Europe” in Nowotny, E., Mooslechner, P. and Ritzberger-Grünwald, D. (eds.), The Euro and Economic Stability: Focus on Central, Eastern and South-Eastern Europe, Edward Elgar, Cheltenham, pp. 109-128.
Valev, N.T. (2012), “The Hysteresis of Currency Substitution: Currency Risk versus Network Externalities”, Journal of International Money and Finance, Vol. 29, pp. 224-235.

35ECB
The international role of the euroJuly 2014
sPEcIAL FEATUREsA dIssEcTINg FOREIgN INvEsTMENTs IN EURO AREA bONd MARkETs dURINg THE sOvEREIgN dEbT
cRIsIs22
At the peak of the euro area sovereign debt crisis (around the second half of 2011 and the first half of 2012) foreign investors retrenched from euro area bond markets. However, it is unclear to what extent these outflows reflected a general pattern of repatriation of overseas debt investments by global investors or a decision to disproportionately reduce foreign investments in euro area bond markets. Against this background, this special feature uses a standard gravity model of international portfolio flows to assess the extent to which the reduction in foreign investments in euro area bond markets was disproportionately large and whether this pattern changed after a number of policy measures were taken at the European level around the middle of 2012. It has been found that foreign investments in bond markets of stressed euro area countries were disproportionately small. In addition, this underinvestment cannot be fully explained by rating changes affecting the stressed countries. There is also evidence that this underinvestment disappeared after the announcement of the ECB’s OMT programme. To the extent that euro area financial market fragmentation was driven by foreigners’ disproportionate investments across euro area debt markets, this special feature finds that the impact of foreign investors has most likely been small. This largely reflects the limited quantitative significance of foreign portfolio debt investments in stressed countries and the absence of overinvestment in non-stressed economies. The temporary underinvestment in stressed euro area bond markets is consistent with the muted and temporary portfolio outflows from the euro area as a whole and the limited decline in the international use of the euro witnessed during the period of the euro area sovereign debt crisis.
1 INTROdUcTION
It has been well documented that the launch of Economic and Monetary Union in 1999 resulted in greater financial integration in the euro area and in an increase in foreign investments in euro area debt and equity markets which also contributed to the growing importance of the euro in the international monetary system (see Lane, 2006; Spiegel, 2009; Blank and Buch, 2007; ECB, 2008a; ECB, 2008b; and Papaioannou and Portes, 2008). This period of global financial integration23 was temporarily halted and partly reversed with the onset of the global financial crisis in 2008, when gross portfolio flows dropped sharply on account of repatriation of capital by global investors in response to heightened volatility in financial markets during the post-Lehman period.
While several studies have examined international portfolio flows during the global financial crisis (see Fratzscher, 2012; Milesi-Ferretti and Tille, 2011; and Galstyan and Lane, 2013), few studies have so far looked at the patterns of international portfolio flows during the euro area sovereign debt crisis.24 In this respect, it remains unclear to what extent the retrenchment by foreign investors from euro area debt markets at the peak of the sovereign debt crisis (Chart 21) continued to reflect the earlier tendency of global investors to repatriate their foreign portfolio debt from all destination countries across the globe; or to what extent these outflows reflected a systematic underinvestment of foreign investors in euro area debt markets more specifically, possibly driven by the high bond
22 Prepared by R. Beck, G. Georgiadis and J. Gräb.23 Financial globalisation in the pre-crisis era reflected a number of factors, including, in particular, a generalised financial deepening,
a reduction in home bias and lower capital-flow restrictions (see Milesi-Ferretti and Tille, 2011).24 Examining foreign portfolio flows to the euro area may shed light on the evolution of the international role of the euro because they are
largely denominated in euro and thus involve the purchase of euro-denominated debt or equity by non-residents. At the end of 2013 the outstanding amounts of securities other than shares issued by euro area residents stood at €16,385.7 billion, of which €14,533.9 billion (around 89%) were denominated in euro.

36ECBThe international role of the euroJuly 20143636
market volatility in the euro area at the time or the perceived tail risk of a euro area break-up. All in all, the extent of retrenchment from the euro area as a whole appears limited and therefore raises the question of whether foreign investors essentially underinvested in stressed euro area countries, while at the same time tending to overinvest in non-stressed euro area countries. This approach of disproportionately adjusting investments across euro area debt markets points to the contribution that foreign investors may have made to euro area financial market fragmentation.25
Against this background, Section 2 of this special feature uses a standard gravity model of international portfolio investments to put the observed portfolio bond flows during the euro area sovereign debt crisis in the perspective of global investments that could have been expected from standard investment determinants. Building on these findings, Section 3 empirically analyses the role of sovereign credit ratings in the observed pattern of foreign portfolio investments in euro area bond markets during the sovereign debt crisis, and whether flows to the euro area differed systematically prior to and after the announcement of the ECB’s OMT programme. This programme aimed to reduce the unjustifiably high credit risk in certain euro area countries that had emerged on account of the perceived tail risk of a euro area break-up.
2 A sTANdARd gRAvITY MOdEL OF INTERNATIONAL PORTFOLIO FLOws
2.1 sTYLIsEd FAcTs
In order to benchmark international bond flows in the period of the euro area sovereign debt crisis, we use a standard gravity model of international financial investment. Since the seminal paper of Portes and Rey (2005), gravity models have been used extensively over the last ten years to model bilateral patterns in international financial investments (see, for example, Lane, 2006 and Spiegel, 2009). Ideally, one would need to resort to bilateral flow data, for example balance of payments data. However, euro area balance of payments data on portfolio flows do not provide information on the assets and liabilities of euro area countries by counterparty. Therefore, in this special feature data from the IMF’s Coordinated Portfolio Investment Survey (CPIS) on bilateral gross portfolio debt and equity holdings are used. The annual dataset covers around 70 investor countries and over 200 destination countries for the period from 2001 to 2012.26 Given that the euro area crisis
25 The non-stressed euro area countries include Germany, France, the Netherlands, Austria, Belgium and Finland. The stressed euro area countries include Italy, Spain, Ireland, Greece and Portugal. Other euro area countries are excluded owing to insufficient data availability.
26 The CPIS has various limitations (see Lane and Milesi-Ferretti, 2006). First, data for some major economies, including China, are missing. Second, the CPIS only provides information on the proximate destination of foreign portfolio investments, distorting the data for financial centres; for this reason major financial centres, such as Luxembourg, Switzerland and offshore tax havens, are excluded from the analysis. Third, being based on the residence principle, the CPIS does not account for the possibility that a resident entity may be foreign-owned. This represents an important deficiency to understand trends in foreign investment. In fact, BIS cross border banking statistics point out that banks in several jurisdictions had been using subsidiaries outside of the euro area to obtain funding; this trend could be related with the sovereign debt crisis or just a consequence of the strategy of asset liability management. Finally, the CPIS does not distinguish between debt issued by public and private agents, including financial institutions and corporate issuers.
chart 21 Foreign demand for euro area longterm debt instruments
(flows in EUR billion; 12-month cumulated)
-100
0
100
200
300
400
600
500
-100
0
100
200
300
400
600
500
2000 2005 2010 2015
Source: Euro area balance of payments data.

37ECB
The international role of the euroJuly 2014 37
SPECIAL FEATURES
37
manifested itself in financial stress in debt markets, the analysis presented here is confined to long-term debt securities.27
In order to analyse foreign portfolio debt investments in the euro area during the crisis, we consider the period between the end of 2009 and the end of 2011. The reasons for choosing this start and end point are straightforward: first, foreign holdings of euro area debt instruments as of the end of 2009 should not have been affected by the looming euro area crisis by that point in time; second, considering the annual frequency of the CPIS data, holdings as of the end of 2011 should better reflect the cumulated impact of the sovereign debt crisis on foreign investors’ euro area debt holdings than the end-2012 positions, which may have already been affected by the policy measures that were taken at the European and national levels during the second half of 2012, which included the launch of the banking union, the entry into effect of the ESM Treaty, the use being made by banks of the two three-year long-term refinancing operations offered by the ECB, the ECB’s announcement of the modalities of the OMTs and various other measures taken by national governments.
Chart 22 suggests that as of the end of 2009 major non-euro area economies’ holdings of euro area countries’ debt were largely concentrated on non-stressed countries, while holdings of stressed countries’ debt were relatively low. In fact, as of the end of 2009, France’s holdings of stressed euro area countries’ debt instruments (amounting to USD 745 billion) were almost 50% higher than the combined holdings of the United States, the United Kingdom and Japan (USD 510 billion). Moreover, (non-valuation-adjusted) changes in stock positions between 2009 and 2011 suggest that holdings of stressed euro area countries’ debt by major non-euro area countries dropped by around USD 115 billion (20%). At the same time, holdings of non-stressed euro area countries’ debt by major non-euro area countries increased by around 3% (USD 38 billion).28
27 The CPIS also includes information on bilateral equity and short-term debt asset and liability positions. However, foreign equity holdings might be driven by factors that are different from those that determine debt securities holdings. Short-term debt securities are not analysed because the available information in the CPIS is considerably sparser across countries than for long-term debt securities. By definition, the CPIS does not contain data on interbank markets which are covered under “Other investment flows” in the balance of payments data but which also showed very clear signs of financial stress.
28 By comparison, holdings of stressed euro area countries’ debt in non-stressed economies plunged by almost 50%, equivalent to around USD 600 billion.
chart 22 Major non-euro area countries’ holdings of euro area debt in 2009
(volumes in USD billion)
0
250
500
750
0
250
500
750
GBR JPN USA NOR DNK SWE CAN
non-stressedstressed
Source: CPIS.Note: The countries shown on the horizontal axis refer to investor countries.

38ECBThe international role of the euroJuly 20143838
2.2 EMPIRIcAL sPEcIFIcATION
In line with the literature on international portfolio flows, the variation in changes in bilateral portfolio debt holdings between the end of 2009 and the end of 2011 across 53 investor countries and 113 destination countries is examined based on the following gravity model (see Galstyan and Lane, 2013 and Lane, 2006):
∆ ln(Stockij0911) = αi + αj + β1 ln(Stockij09) + β2 ln(Stockij09)2 + β3 ln(Imp09ij) + β4 ln(Distij)
+ β5Langij + β6Zij + εij (1)
where ∆ ln(Stockij0911) = αi + αj + β1 ln(Stockij09) + β2 ln(Stockij09)2 + β3 ln(Imp09ij) + β4 ln(Distij)
+ β5Langij + β6Zij + εij (1) is the log change of country i’s holdings of country j’s long-term debt between
the end of 2009 and the end of 2011; ∆ ln(Stockij0911) = αi + αj + β1 ln(Stockij09) + β2 ln(Stockij09)2 + β3 ln(Imp09ij) + β4 ln(Distij)
+ β5Langij + β6Zij + εij (1) are investor and destination country fixed effects,
respectively; ∆ ln(Stockij0911) = αi + αj + β1 ln(Stockij09) + β2 ln(Stockij09)2 + β3 ln(Imp09ij) + β4 ln(Distij)
+ β5Langij + β6Zij + εij (1) is country j’s debt held by country i at the end of 2009; ln(Impij09) is the value
of bilateral imports of country i from country j in 2009; and ∆ ln(Stockij0911) = αi + αj + β1 ln(Stockij09) + β2 ln(Stockij09)2 + β3 ln(Imp09ij) + β4 ln(Distij)
+ β5Langij + β6Zij + εij (1) and
∆ ln(Stockij0911) = αi + αj + β1 ln(Stockij09) + β2 ln(Stockij09)2 + β3 ln(Imp09ij) + β4 ln(Distij)
+ β5Langij + β6Zij + εij (1) are standard gravity variables that control for the distance between countries i and j and whether they share a common language. Finally,
∆ ln(Stockij0911) = αi + αj + β1 ln(Stockij09) + β2 ln(Stockij09)2 + β3 ln(Imp09ij) + β4 ln(Distij)
+ β5Langij + β6Zij + εij (1) is a vector of dummy variables, which equals one for specific country pairs. The latter are included in order to test whether changes in portfolio debt holdings between specific country groups during the euro area sovereign debt crisis were disproportionate relative to what standard gravity variables would predict.
The investor and destination country fixed effects capture common portfolio dynamics (see Galstyan and Lane, 2013) and, importantly, multilateral resistance terms (Okawa and van Wincoop, 2013). Specifically, ∆ ln(Stockij0911) = αi + αj + β1 ln(Stockij09) + β2 ln(Stockij09)
2 + β3 ln(Imp09ij) + β4 ln(Distij)+ β5Langij + β6Zij + εij (1)
controls for uniform shifts in investor country i’s holdings of foreign debt assets, thereby capturing exogenous changes in a country’s net foreign asset position vis-à-vis all destination countries. By comparison, ∆ ln(Stockij0911) = αi + αj + β1 ln(Stockij09) + β2 ln(Stockij09)
2 + β3 ln(Imp09ij) + β4 ln(Distij)+ β5Langij + β6Zij + εij (1)
controls for uniform shifts in the destination country j’s foreign debt liability position, thereby capturing valuation effects that arise as a result of exchange rate and asset price movements.29, 30
2.3 EMPIRIcAL REsULTs
The regression results are reported in Table 3. The regression in column (1) tests whether foreign investors have disproportionately adjusted their investment in euro area bond markets during the sovereign debt crisis. Specifically, the dummy variable “EA” equals one if the investor country is a non-euro area economy and the destination country is a euro area country; the coefficient estimate is negative and statistically significant, suggesting that in the period between the end of 2009 and the end of 2011 foreign investors underinvested in euro area bond markets relative to the predictions of a gravity model. In fact, foreign investors were underweighted in euro area debt securities by around 20% relative to average investments across all country pairs over this period.31
29 Note that exchange rate effects are captured since CPIS data are reported in US dollar for all countries. This notwithstanding, ∆ ln(Stockij0911) = αi + αj + εij is unlikely
to capture all valuation effects (because of differences in portfolio composition) and will capture variations in factors other than valuation effects (such as the average change in global investors’ perception of country j).
30 The specification outlined in equation (1) may lead to a misinterpretation of the coefficients of the dummy variables,
∆ ln(Stockij0911) = αi + αj + β1 ln(Stockij09) + β2 ln(Stockij09)2 + β3 ln(Imp09ij) + β4 ln(Distij)
+ β5Langij + β6Zij + εij (1). In particular, for each dummy variable that is included in equation (1) one investor or destination country fixed effect is dropped from the regression as a result of multicollinearity. This changes the benchmark group, i.e. the group against which the comparisons are made, and hence complicates the interpretation of the respective dummy variable. To overcome this issue, the regression outlined in equation (1) is replaced by a two-stage estimator. In the first-stage regression, the dependent variable is regressed on the investor country and destination country fixed effects only, which removes aggregate common factors from the data: ∆ ln(Stockij0911) = αi + αj + εij The residuals from this regression, εij = β1 ln(Stkij09) + β2 ln(Stkij09)
2 + β3 ln(Imij09) + β4 ln(Dstij) + β5 Lngij + β6Zij ˆ ˆ ˆ ˆ ˆ ˆ, are then used to estimate the second-stage regression: εij = β1 ln(Stkij09) + β2 ln(Stkij09)
2 + β3 ln(Imij09) + β4 ln(Dstij) + β5 Lngij + β6Zij ˆ ˆ ˆ ˆ ˆ ˆ The regressions are estimated using generalised least squares. Robust standard errors are reported.
31 Note again, that one important caveat about these results is that the model specification is unlikely to capture all valuation effects (because of differences in portfolio composition) and will capture variations in factors other than valuation effects.

39ECB
The international role of the euroJuly 2014 39
SPECIAL FEATURES
39
The regression reported in column (2) tests whether the observed underinvestment by foreign residents in euro area bond markets occurred uniformly across stressed and non-stressed euro area countries, or whether non-euro area investors potentially overinvested in non-stressed euro area countries by rebalancing away from stressed euro area countries towards non-stressed euro area countries. The dummy variable “Non-stressed”, which equals one if the investor country is a non-euro area economy and the destination country is a non-stressed euro area country, is statistically insignificant, suggesting that there is no evidence of overinvestment by foreign investors in non-stressed bond markets. By contrast, the coefficient estimate of the dummy variable “Stressed”, which equals one for non-euro area investor countries and stressed euro area destination countries is negative and statistically significant. The results thus suggest that underinvestment by foreign investors in euro area debt markets has been confined to stressed euro area countries and that there is little evidence that foreign investors have engaged in intra-euro area rebalancing. To the extent that euro area financial market fragmentation was driven by foreigners’ disproportionate investments across euro area debt markets, these findings thus suggest that their contribution was small: first, foreign investors’ exposure to stressed countries was limited, as shown in Section 2.1; and second, there is little evidence of a parallel overinvestment in non-stressed economies.
3 IMPAcT OF sOvEREIgN RATINg cHANgEs ANd PORTFOLIO AsYMMETRIEs AFTER OMT
The observed underinvestment by foreign investors in euro area bond markets during the sovereign debt crisis could presumably be attributed to perceptions of heightened sovereign credit risk in stressed euro area countries (see Box). Against this background this section analyses the extent to which rating changes explain the disproportionate levels of portfolio debt investments in the euro area during the sovereign debt crisis, as documented in Section 2. The CPIS data cannot be used to examine this question, as their annual frequency makes it difficult to include cyclical fundamentals, such as ratings, in the regression. Therefore, data on net euro area bond purchases by foreign residents provided by the US Treasury and the Japanese Ministry of Finance have been used.32 While representing a considerably narrower sample in terms of the nationality of foreign investors, these data are available at a much higher frequency.33
32 The data from the US Treasury cover monthly net foreign bond purchases by US residents. Similarly, the data from the Japanese Ministry of Finance cover net foreign bond purchases by Japanese residents.
33 The data have been transformed so that positive numbers reflect inflows to destination countries. Euro area countries are treated individually in the regressions for Japanese data and aggregated into stressed and non-stressed blocks for the US data in order to account for secular trends in net bond purchases in some individual non-stressed euro area countries.
Table 3 Regression estimates of changes in long-term debt
(1) (2)
Stock in 2009 -0.266***(0.024)
-0.266***(0.024)
Stock in 2009 2 0.029***(0.007)
0.028***(0.007)
Imports in 2009 0.105*(0.058)
0.103*(0.058)
Distance -0.287***(0.046)
-0.284***(0.046)
Common language 0.304***(0.113)
0.306***(0.113)
EA -0.225***(0.079)
Non-stressed -0.164(0.104)
Stressed -0.276**(0.123)
Observations 1526 1526Marginal-R2 0.21 0.21
* p<0.10, ** p<0.05, *** p<0.01Notes: Standard errors in parentheses. The marginal R2 captures the explanatory power of the bilateral regressors that is not explained by the investor and destination country fixed effects. Estimated by GLS.
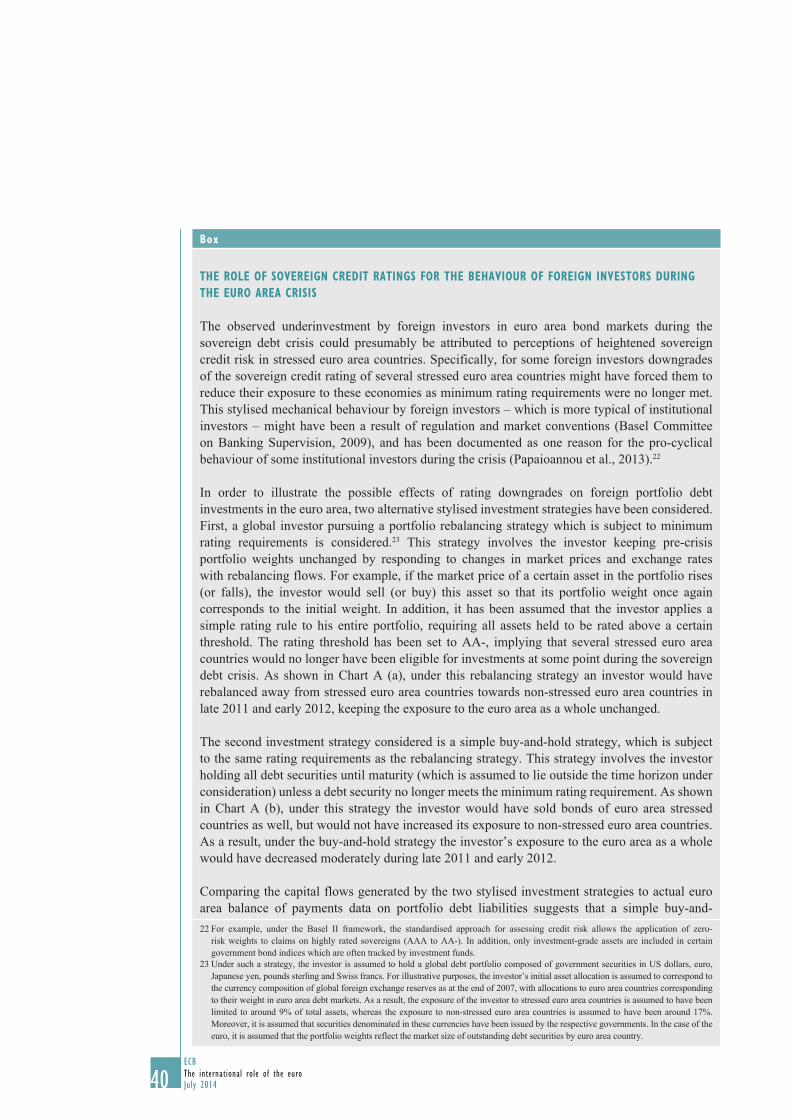
40ECBThe international role of the euroJuly 20144040
box
THE ROLE OF sOvEREIgN cREdIT RATINgs FOR THE bEHAvIOUR OF FOREIgN INvEsTORs dURINg THE EURO AREA cRIsIs
The observed underinvestment by foreign investors in euro area bond markets during the sovereign debt crisis could presumably be attributed to perceptions of heightened sovereign credit risk in stressed euro area countries. Specifically, for some foreign investors downgrades of the sovereign credit rating of several stressed euro area countries might have forced them to reduce their exposure to these economies as minimum rating requirements were no longer met. This stylised mechanical behaviour by foreign investors – which is more typical of institutional investors – might have been a result of regulation and market conventions (Basel Committee on Banking Supervision, 2009), and has been documented as one reason for the pro-cyclical behaviour of some institutional investors during the crisis (Papaioannou et al., 2013).22
In order to illustrate the possible effects of rating downgrades on foreign portfolio debt investments in the euro area, two alternative stylised investment strategies have been considered. First, a global investor pursuing a portfolio rebalancing strategy which is subject to minimum rating requirements is considered.23 This strategy involves the investor keeping pre-crisis portfolio weights unchanged by responding to changes in market prices and exchange rates with rebalancing flows. For example, if the market price of a certain asset in the portfolio rises (or falls), the investor would sell (or buy) this asset so that its portfolio weight once again corresponds to the initial weight. In addition, it has been assumed that the investor applies a simple rating rule to his entire portfolio, requiring all assets held to be rated above a certain threshold. The rating threshold has been set to AA-, implying that several stressed euro area countries would no longer have been eligible for investments at some point during the sovereign debt crisis. As shown in Chart A (a), under this rebalancing strategy an investor would have rebalanced away from stressed euro area countries towards non-stressed euro area countries in late 2011 and early 2012, keeping the exposure to the euro area as a whole unchanged.
The second investment strategy considered is a simple buy-and-hold strategy, which is subject to the same rating requirements as the rebalancing strategy. This strategy involves the investor holding all debt securities until maturity (which is assumed to lie outside the time horizon under consideration) unless a debt security no longer meets the minimum rating requirement. As shown in Chart A (b), under this strategy the investor would have sold bonds of euro area stressed countries as well, but would not have increased its exposure to non-stressed euro area countries. As a result, under the buy-and-hold strategy the investor’s exposure to the euro area as a whole would have decreased moderately during late 2011 and early 2012.
Comparing the capital flows generated by the two stylised investment strategies to actual euro area balance of payments data on portfolio debt liabilities suggests that a simple buy-and-22 For example, under the Basel II framework, the standardised approach for assessing credit risk allows the application of zero-
risk weights to claims on highly rated sovereigns (AAA to AA-). In addition, only investment-grade assets are included in certain government bond indices which are often tracked by investment funds.
23 Under such a strategy, the investor is assumed to hold a global debt portfolio composed of government securities in US dollars, euro, Japanese yen, pounds sterling and Swiss francs. For illustrative purposes, the investor’s initial asset allocation is assumed to correspond to the currency composition of global foreign exchange reserves as at the end of 2007, with allocations to euro area countries corresponding to their weight in euro area debt markets. As a result, the exposure of the investor to stressed euro area countries is assumed to have been limited to around 9% of total assets, whereas the exposure to non-stressed euro area countries is assumed to have been around 17%. Moreover, it is assumed that securities denominated in these currencies have been issued by the respective governments. In the case of the euro, it is assumed that the portfolio weights reflect the market size of outstanding debt securities by euro area country.
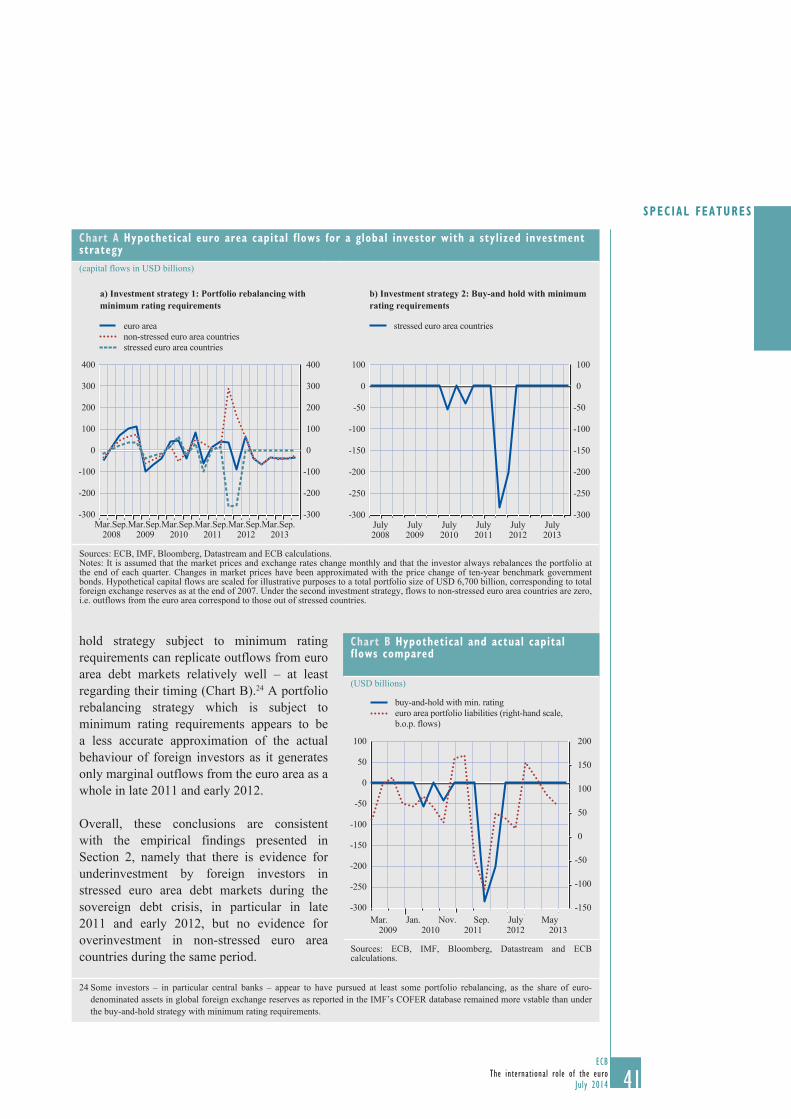
41ECB
The international role of the euroJuly 2014 41
SPECIAL FEATURES
41
hold strategy subject to minimum rating requirements can replicate outflows from euro area debt markets relatively well – at least regarding their timing (Chart B).24 A portfolio rebalancing strategy which is subject to minimum rating requirements appears to be a less accurate approximation of the actual behaviour of foreign investors as it generates only marginal outflows from the euro area as a whole in late 2011 and early 2012.
Overall, these conclusions are consistent with the empirical findings presented in Section 2, namely that there is evidence for underinvestment by foreign investors in stressed euro area debt markets during the sovereign debt crisis, in particular in late 2011 and early 2012, but no evidence for overinvestment in non-stressed euro area countries during the same period.
24 Some investors – in particular central banks – appear to have pursued at least some portfolio rebalancing, as the share of euro-denominated assets in global foreign exchange reserves as reported in the IMF’s COFER database remained more vstable than under the buy-and-hold strategy with minimum rating requirements.
chart A Hypothetical euro area capital flows for a global investor with a stylized investment strategy(capital flows in USD billions)
a) Investment strategy 1: Portfolio rebalancing with minimum rating requirements
b) Investment strategy 2: Buy-and hold with minimum rating requirements
-200
-300
-100
0
100
200
300
400
-200
-300
-100
0
100
200
300
400
Mar.Sep.Mar.Sep.Mar.Sep.Mar.Sep.Mar.Sep.Mar.Sep.2008 2009 2010 2011 2012 2013
euro areanon-stressed euro area countriesstressed euro area countries
-300
-250
-200
-150
-100
-50
0
100
-300
-250
-200
-150
-100
-50
100
0
stressed euro area countries
July July July July July July2008 2009 2010 2011 2012 2013
Sources: ECB, IMF, Bloomberg, Datastream and ECB calculations.Notes: It is assumed that the market prices and exchange rates change monthly and that the investor always rebalances the portfolio at the end of each quarter. Changes in market prices have been approximated with the price change of ten-year benchmark government bonds. Hypothetical capital flows are scaled for illustrative purposes to a total portfolio size of USD 6,700 billion, corresponding to total foreign exchange reserves as at the end of 2007. Under the second investment strategy, flows to non-stressed euro area countries are zero, i.e. outflows from the euro area correspond to those out of stressed countries.
chart b Hypothetical and actual capital flows compared
(USD billions)
0
50
100
-150
-100
-50
-300
-250
-200
100
150
200
-50
0
50
-150
-100
Mar.2009 2010 2011 2012 2013
Jan. Nov. Sep. July May
buy-and-hold with min. ratingeuro area portfolio liabilities (right-hand scale,b.o.p. flows)
Sources: ECB, IMF, Bloomberg, Datastream and ECB calculations.
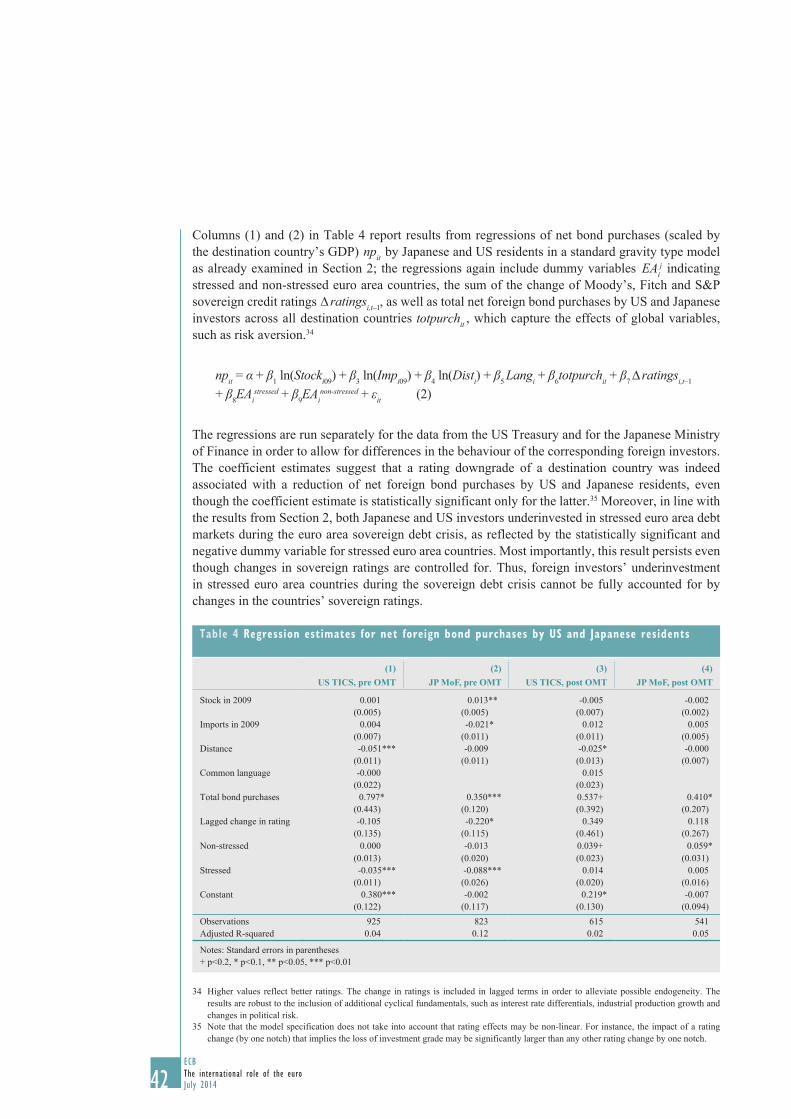
42ECBThe international role of the euroJuly 20144242
Columns (1) and (2) in Table 4 report results from regressions of net bond purchases (scaled by the destination country’s GDP) npit = α + β1 ln(Stocki09) + β3 ln(Impi09) + β4 ln(Disti) + β5 Langi + β6totpurchit + β7 ∆ ratingsi,t–1
+ β8EAistressed + β9EAi
non-stressed + εit (2) by Japanese and US residents in a standard gravity type model
as already examined in Section 2; the regressions again include dummy variables EAij indicating
stressed and non-stressed euro area countries, the sum of the change of Moody’s, Fitch and S&P sovereign credit ratings npit = α + β1 ln(Stocki09) + β3 ln(Impi09) + β4 ln(Disti) + β5 Langi + β6totpurchit + β7 ∆ ratingsi,t–1
+ β8EAistressed + β9EAi
non-stressed + εit (2), as well as total net foreign bond purchases by US and Japanese
investors across all destination countries npit = α + β1 ln(Stocki09) + β3 ln(Impi09) + β4 ln(Disti) + β5 Langi + β6totpurchit + β7 ∆ ratingsi,t–1 + β8EAi
stressed + β9EAinon-stressed + εit (2)
, which capture the effects of global variables, such as risk aversion.34
npit = α + β1 ln(Stocki09) + β3 ln(Impi09) + β4 ln(Disti) + β5 Langi + β6totpurchit + β7 ∆ ratingsi,t–1 + β8EAi
stressed + β9EAinon-stressed + εit (2)
The regressions are run separately for the data from the US Treasury and for the Japanese Ministry of Finance in order to allow for differences in the behaviour of the corresponding foreign investors. The coefficient estimates suggest that a rating downgrade of a destination country was indeed associated with a reduction of net foreign bond purchases by US and Japanese residents, even though the coefficient estimate is statistically significant only for the latter.35 Moreover, in line with the results from Section 2, both Japanese and US investors underinvested in stressed euro area debt markets during the euro area sovereign debt crisis, as reflected by the statistically significant and negative dummy variable for stressed euro area countries. Most importantly, this result persists even though changes in sovereign ratings are controlled for. Thus, foreign investors’ underinvestment in stressed euro area countries during the sovereign debt crisis cannot be fully accounted for by changes in the countries’ sovereign ratings.
34 Higher values reflect better ratings. The change in ratings is included in lagged terms in order to alleviate possible endogeneity. The results are robust to the inclusion of additional cyclical fundamentals, such as interest rate differentials, industrial production growth and changes in political risk.
35 Note that the model specification does not take into account that rating effects may be non-linear. For instance, the impact of a rating change (by one notch) that implies the loss of investment grade may be significantly larger than any other rating change by one notch.
Table 4 Regression estimates for net foreign bond purchases by Us and Japanese residents
(1) (2) (3) (4)US TICS, pre OMT JP MoF, pre OMT US TICS, post OMT JP MoF, post OMT
Stock in 2009 0.001 0.013** -0.005 -0.002(0.005) (0.005) (0.007) (0.002)
Imports in 2009 0.004 -0.021* 0.012 0.005(0.007) (0.011) (0.011) (0.005)
Distance -0.051*** -0.009 -0.025* -0.000(0.011) (0.011) (0.013) (0.007)
Common language -0.000 0.015(0.022) (0.023)
Total bond purchases 0.797* 0.350*** 0.537+ 0.410*(0.443) (0.120) (0.392) (0.207)
Lagged change in rating -0.105 -0.220* 0.349 0.118(0.135) (0.115) (0.461) (0.267)
Non-stressed 0.000 -0.013 0.039+ 0.059* (0.013) (0.020) (0.023) (0.031)
Stressed -0.035*** -0.088*** 0.014 0.005 (0.011) (0.026) (0.020) (0.016)
Constant 0.380*** -0.002 0.219* -0.007 (0.122) (0.117) (0.130) (0.094)
Observations 925 823 615 541 Adjusted R-squared 0.04 0.12 0.02 0.05
Notes: Standard errors in parentheses+ p<0.2, * p<0.1, ** p<0.05, *** p<0.01

43ECB
The international role of the euroJuly 2014 43
SPECIAL FEATURES
43
Existing evidence suggests that the policy measures taken by the ECB during the sovereign debt crisis, including the two three-year long-term refinancing operations and the announcement of the modalities of OMTs, the launch of the banking union, and the entry into effect of the ESM Treaty have contributed to alleviating euro area financial market fragmentation and effectively eliminating the perceived tail risk of a euro area break-up (see Altavilla, Giannone and Lenza, 2014; De Santis, 2014; and ECB 2013). Against this background, columns (3) and (4) in Table 4 report the results from regressions for the time period from the announcement of the OMTs until May 2013, asking whether it also helped to cease the underinvestment by foreign investors in euro area debt markets. The results suggest that neither Japanese nor US investors continued to underinvest in stressed euro area countries after July 2012. Moreover, the (marginally) statistically significant and positive coefficient estimate for the non-stressed euro area country dummy variable suggests that Japanese and US investors seem to have somewhat overinvested in the portfolio debt of non-stressed euro area countries.
4 cONcLUsION
This special feature examines the behaviour of foreign investors during the euro area sovereign debt crisis based on a standard gravity model, and finds that international investors significantly underinvested in stressed euro area countries’ debt markets during the peak period of this crisis. This underinvestment cannot be fully accounted for by changes in sovereign credit ratings of the countries concerned. To the extent that euro area financial market fragmentation was influenced by foreigners’ underinvestment in euro area stressed countries, this special feature finds that their impact was small and disappeared after the middle of 2012.
REFERENcEs
Ahmed, S. and Zlate, A. (2013), “Capital Flows to Emerging Markets: A Brave New World?”, International Finance Discussion Papers, No 1081, Board of Governors of the Federal Reserve System, Washington D.C.
Altavilla, C, Giannone, D. and Lenza, M. (2014), The Financial and Macroeconomic Effects of the OMT Announcement, mimeo.
Basel Committee on Banking Supervision (2009), “Stocktaking on the use of credit ratings”, The Joint Forum, June.
Blank, S. and Buch, C. (2007), “The Euro and Cross-Border Banking: Evidence from Bilateral Data”, Comparative Economic Studies, 49(3), pp. 389-410.
De Santis, R. (2014), Quantifying redenomination risk, mimeo.
European Central Bank (2008a, Monthly Bulletin, 10th Anniversary of the ECB, Frankfurt am Main, June.
European Central Bank (2008b), The international role of the euro, Frankfurt am Main, July.
European Central Bank (2013) “Financial Stability Review”, Frankfurt am Main, May.
44ECBThe international role of the euroJuly 20144444
Fratzscher, M. (2012), “Capital flows, push versus pull factors and the global financial crisis”, Journal of International Economics, Vol. 88(2), Elsevier, pp. 341-356.
Galstyan, V. and Lane, P.R. (2013), “Bilateral portfolio dynamics during the global financial crisis”, European Economic Review, Vol. 57(C), Elsevier, pp. 63-74.
Hale, G. and Obstfeld, M. (2013), The Euro and the Geography of International Debt Flows, mimeo.
Lane, P.R. (2006), “Global Bond Portfolios and EMU”, International Journal of Central Banking, Vol. 2(2), May.
Merler, S. and Pisani-Ferry, J. (2012). “Sudden stops in the euro area”, Policy Contributions, 2012/06, Bruegel.
Milesi-Ferretti, G.M. and Tille, C. (2011), “The great retrenchment: international capital flows during the global financial crisis”, Economic Policy, Vol. 26(66), pp. 285-342, April.
Okawa, Y. and van Wincoop, E. (2012), “Gravity in International Finance”, Journal of International Economics, Vol. 87(2), pp. 205-215.
Papaioannou, M.G. et al (2013), “Procyclical Behavior of Institutional Investors During the Recent Financial Crisis: Causes, Impacts, and Challenges”, IMF Working Paper, No 13/193.
Papaioannou, E. and Portes, R. (2008), “The international role of the euro: a status report”, European Economy-Economic Papers, No 317, Directorate General Economic and Monetary Affairs, European Commission.
Portes, R. and Rey, H. (2005), “The determinants of cross-border equity flows”, Journal of International Economics, Vol. 65(2), pp. 269-296, March.
Perold, A.F. and Sharpe, W.F. (1995), “Dynamic Strategies for Asset Allocation”, Financial Analysts Journal, Vol. 51, No 1, pp. 149-160, January/February.
Spiegel, M. (2009), “Monetary and Financial Integration in the EMU: Push or Pull?”, Review of International Economics, Vol. 17(4), Wiley Blackwell, pp. 751-776, September.
Zucman, G. (2013), “The Missing Wealth of Nations: Are Europe and the U.S. net Debtors or net Creditors?”, The Quarterly Journal of Economics, Vol. 128(3), pp. 1321-1364.

45ECB
The international role of the euroJuly 2014 45
SPECIAL FEATURES
b REsERvE dIvERsIFIcATION ANd gLObAL FOREIgN ExcHANgE MARkETs: AN OvERvIEw OF THE LITERATURE36
The global financial crisis has reignited discussions as to whether emerging market central banks – such as large reserve holders in emerging Asia or oil-exporting economies – might diversify their foreign exchange reserves away from traditional reserve assets. These discussions have in turn fuelled speculation among market observers as to the extent of the potential impact that reserve diversification – if any – could have on global foreign exchange markets. As a follow-up to last year’s report, which examined the emergence of non-traditional reserve currencies and that of the Chinese renminbi as an international currency, this special feature aims to provide an overview of the academic literature on the global financial impact of official reserve diversification. It discusses the multifaceted concept of official reserve diversification, examines the main theoretical channels through which its impact may unfold and reviews the empirical evidence available. The special feature shows in particular that the impact of reserve diversification on global foreign exchange markets is not mechanical, but that it depends on an array of factors, such as the degree of substitutability between reserve assets and related changes in interest rates; the endogenous adjustment of the current account in the medium term; and, importantly, whether private investors – whose portfolio holdings are even larger than those of central banks – regard diversification as a credible signal that prompts them to alter the composition of their own holdings.
1 INTROdUcTION
The global financial crisis has reignited discussions as to whether emerging market central banks – such as large reserve holders in emerging Asia or oil-exporting economies – might diversify their foreign exchange reserves away from traditional reserve assets, including US dollar-denominated financial assets. Some observers – such as Frankel (2013) and Prasad (2014) – stress that the crisis has underscored the US dollar’s resilience as a reserve currency, insofar as its share in global foreign exchange reserves has remained stable despite the downgrade of US sovereign debt by one rating agency. Others suggest that the crisis might induce reserve-hoarding countries to diversify their holdings into other currencies, such as the euro, owing to renewed confidence in the long-term stability of the euro area, as well as into non-traditional reserve currencies, such as the Australian dollar and Canadian dollar, and the Chinese renminbi, if and when it becomes fully convertible (see ECB, 2013, for additional evidence). These discussions have fuelled speculation among market observers as to the extent of the potential impact that reserve diversification – if any – could have on global foreign exchange markets.37
This special feature aims to provide an overview of the academic literature on the global financial impact of reserve diversification. A well-established feature of the composition of foreign exchange reserves is its persistence over time, which arises from the network externalities and lock-in effects that characterise international reserve currency status.38 Another conventional consideration is that
36 Prepared by Arnaud Mehl. 37 For instance, Goldman Sachs staff, based on a hypothetical scenario in which emerging market central banks would revert to their
pre-crisis allocations in euro, estimate that the latter may lead to a sizeable appreciation of the euro exchange rate, to 1.88 USD/EUR (see Goldman Sachs, “What if reserve managers aimed for pre-crisis EUR allocations?”, Global Markets Daily, 21 October 2013). Such estimates are overly simplistic, however. They are based on the assumption that changes in reserve allocations materialise solely via valuation effects. They hence assume that there is, for example, no endogenous response in bond yields, no medium-term effect on the current account, and no changes in allocations of private sector portfolios. Taking into account these effects could change the estimates substantially (and potentially even reverse the results).
38 Such inertia can emerge from optimal reserve composition models that incorporate precautionary motives (or other reserve holding motives) as well as specific currency unit characteristics. The currency composition of reserves tends to be driven by determinants which change slowly over time, including trade invoicing practices, the currency composition of external debt, exchange rate anchoring, inflation developments, financial market depth as well as trade and financial openness.
46ECBThe international role of the euroJuly 20144646
changes to the composition of foreign exchange reserves are likely to be hampered by the fact that large reserve holders are presumed to be reluctant to sell significant amounts of assets denominated in a particular currency, out of concerns about incurring valuation losses on their existing holdings.
The academic literature suggests that reserve diversification is, in fact, a multifaceted concept. It may take three distinct forms – namely passive, active and stabilising – although their relative importance is difficult to identify empirically. It is especially active diversification – i.e. when central banks buy (or sell) currencies that are appreciating (or depreciating) – which has raised concerns among observers. In theory, its impact on global foreign exchange markets is not mechanical but depends on an array of factors. These include the degree of substitutability between reserve assets and related changes in interest rates, the current account’s adjustment over the medium-term, and whether private investors – whose portfolio holdings are even larger than those of central banks – regard diversification as a credible signal that prompts them to alter the composition of their own holdings.
The historical and empirical evidence offers additional insights into the actual impact of reserve diversification on global foreign exchange markets. It suggests that concerns over the destabilising impact of reserve diversification on financial markets are primarily rooted in the experience of the interwar period, when uncooperative policies led to the collapse of the gold standard. Moreover, the demise of the pound as a major reserve currency in the early 1970s shows that a major rebalancing in reserve currency shares does not necessarily occur through the liquidation of existing reserve holdings, but rather through the acquisition of additional (in this case dollar-denominated) assets. The developments in the later part of the 1970s, when concerns surfaced about the dollar’s future as a reserve asset, suggest that these concerns did not lead to large sales of dollar assets, but instead to concerted efforts to stabilise the dollar. In line with this, several empirical studies on the more recent period find that reserve diversification has been stabilising, and that central banks tend to lean against the wind in managing their reserve holdings, which also helps to explain the relative stability of currency shares in global reserve holdings.
Finally, the resilience of the share of the US dollar in global foreign exchange reserves since the global financial crisis suggests that if the international monetary system were to evolve in the medium term, this would most likely be towards multi-polarity – with several international currencies playing consequential roles – rather than towards the replacement of the US dollar by another unit as the leading international currency.
Section 2 of this special feature reviews the alternative definitions of reserve diversification. In Section 3, the main theoretical channels of the impact of diversification on global foreign exchange markets are presented. The historical evidence and empirical evidence available are examined in Section 4, while Section 5 provides concluding remarks.
2 REsERvE dIvERsIFIcATION As A MULTIFAcETEd cONcEPT
In theory, reserve diversification can take three distinct forms (see, for example, Truman and Wong, 2006; and Wong, 2007). Passive diversification refers to changes in the currency composition of reserve holdings that are due not to actual sales or purchases of foreign assets, but to valuation effects on existing holdings. These valuation effects arise from capital gains and losses, interest payments or exchange rate changes. They can be sizeable, notably if reserve holdings are large. Stabilising diversification in turn refers to situations when central banks lean against the wind and
47ECB
The international role of the euroJuly 2014 47
SPECIAL FEATURES
47
intervene in foreign exchange markets against the market trend (i.e. they purchase a currency when it depreciates, or sell it when it appreciates). This often occurs when central banks seek to stabilise or anchor their exchange rate relative to a specific foreign currency or basket of foreign currencies. Active diversification refers to the opposite strategy: central banks alter the currency composition of their holdings according to the direction of the market trend, hence further adding pressure on foreign exchange markets in this direction. It is especially active diversification away from the US dollar – and its alleged potential impact on global financial markets – which has initiated discussions among observers. As Truman and Wong (2006) explain, one concern is that significant changes in the currency composition of major reserve holders in emerging market economies would trigger marked exchange rate adjustments, which, in turn, would have adverse spillover effects on other financial market segments, along with possible macroeconomic effects.
Empirically identifying the relative importance of passive, stabilising and active diversification is challenging. Available data on the currency composition of foreign exchange reserves are reported on a value basis, which incorporates all three forms of diversification. The data include changes which are due to both movements in major exchange rates and asset prices, as well as to actual official transactions in foreign exchange markets. Reserve changes therefore need to be adjusted for valuation effects to distinguish between developments that are due to prices and those that are due to quantities. This exercise requires an array of assumptions and is thus subject to some degree of uncertainty (see, for example, the discussion in Dominguez, Hashimoto and Ito (2012) for an attempt to estimate valuation effects as determinants of reserve holding developments in emerging economies during the early phase of the global financial crisis).39 Nevertheless, empirically identifying the effect of active, passive or stabilising diversification remains difficult. Since official transactions in foreign exchange markets do not occur randomly, but are always a reaction to conditions in these markets, the direction of causality between official transactions and exchange rate movements is indeed unclear (Engel, 2013). In other words, do exchange rate movements induce central banks to diversify their reserves? Or does diversification cause movements in exchange rates, in anticipation of the latter? This simultaneity bias is particularly important in the literature on foreign exchange interventions – where central banks are typically presumed to lean against the wind – but no satisfactory solution has emerged so far from this literature (ibid).40
3 THEORETIcAL cHANNELs OF THE IMPAcT OF REsERvE dIvERsIFIcATION ON gLObAL FOREIgN ExcHANgE MARkETs
In portfolio balance models, the impact of reserve diversification on global foreign exchange markets depends on the degree of substitutability between reserve assets in particular. A key assumption made in these models (see, for example, Branson and Henderson, 1984) is that domestic and foreign bonds are imperfect substitutes. This implies that expected yields on domestic and foreign bonds – adjusted for expected exchange rate movements – are not necessarily equal.41
39 A casual inspection of the data on the currency composition of global foreign exchange reserves reported in this report suggests that central banks pursue mixed strategies, since current weights remain broadly – albeit not completely – stable over time.
40 For instance, some studies have used high-frequency data to identify their “true” impact (i.e. with a view to minimising noise arising from other market-moving factors, such as macro data releases) at the cost of being mute on the long-term effect of interventions. Some studies use lagged interventions, but lose sight of their contemporaneous effects (which are presumably important). Finally, it is very difficult to find a valid instrument to deal with the simultaneity bias since almost any variable that is correlated with interventions will also be correlated with economic determinants of the exchange rate.
41 In other words, international investors may regard domestic and foreign bonds as having different characteristics other than their currency of denomination (such as liquidity or usability as an international reserve unit) and may regard one of the bonds as being riskier than the other. They will hence require a premium to hold this bond. By contrast, there is no distinction between domestic and foreign bonds in monetary models of exchange rate determination, and domestic and foreign assets are modelled as perfect substitutes.
48ECBThe international role of the euroJuly 20144848
In simple portfolio balance models with three regions (the United States, the euro area and emerging markets) and three currencies (two reserve currencies, i.e. the US dollar and the euro, and a third domestic currency), a change in the currency composition of the reserve holdings of emerging markets – initially assumed to be heavily tilted towards the US dollar – can be interpreted as a change from a situation in which the world investor base has an extreme preference for US dollars to one in which there is a stronger preference for the euro (see also Blanchard, Giavazzi and Sa, 2005, for a related discussion). Such changes in preferences lead to a decrease in the demand for US dollars and to an increase in the demand for the euro. As the relative demand for the euro increases, it leads to an appreciation of the latter vis-à-vis the US dollar, everything else being equal. But the magnitude of the euro’s appreciation vis-à-vis the US dollar may be less pronounced if investors consider euro and US dollar-denominated bonds as imperfect substitutes and US yields react to changes in reserve holdings. If the risk premium increases significantly together with US yields, the appreciation of the euro may even be reverted.42 In portfolio balance models with three or more currencies the extent of this effect, and whether bonds denominated in different currencies are substitutes or complements, depends on an array of factors, such as the correlation of their respective returns and relative variance magnitude (Branson and Henderson, 1984, p. 78).
More sophisticated models suggest that distinguishing between short-term and long-term effects, as well as portfolio and current account effects, is also important. An important study in this respect is by Blanchard, Giavazzi and Sa (2005), who use a portfolio balance framework to model the joint dynamics of the current account and the exchange rate, while allowing for imperfect asset substitutability and valuation effects. They show that a three-country version (the United States, the euro area and China) of their model sheds light on the impact of a revaluation of the Chinese renminbi on the euro’s exchange rate. In this model, if the renminbi appreciates against the US dollar, the euro also strengthens against the US dollar, due to portfolio and trade effects. As to the portfolio effect, the revaluation of the renminbi shifts Chinese demand away from US dollar-denominated assets towards euro-denominated assets, which puts upward pressure on the euro’s exchange rate. In terms of the trade effect, the revaluation induces US demand to shift away from Chinese goods (which have become more expensive) towards euro area goods, which also contributes to a strengthening of the euro.43 In a similar vein, the model helps to shed light on marked differences between the short-term and long-term impact of a change in the composition of China’s reserves away from the US dollar. In line with a portfolio effect, a decline in the share of the US dollar in China’s reserves leads to an initial depreciation of the US dollar and to an appreciation of the euro. In the longer run, however, the US current account balance improves, together with the US net external debt position. This enables the US dollar to gradually strengthen and eventually leads to a smaller depreciation.44 Simulations based on a calibrated version of the model (in which parameter values are taken as of 2005) suggest that changes in the composition of China’s reserves – if they are significant – can have a large impact on the US dollar exchange rate. Assuming a decline in the share of the US dollar in total foreign (private and central bank) portfolios from 30% to 28% (which corresponds to halving the share of the US dollar in the reserves of both the People’s Bank of China and the Bank of Japan, according to Blanchard, Giavazzi and Sa), the
42 By contrast, a sterilised foreign exchange intervention has no effect on exchange rates or interest rates in monetary models of exchange rate determination. In these models, such interventions indeed result in an exchange of perfectly substitutable domestic assets for foreign assets on the central bank’s balance sheet, while money supply remains unchanged.
43 Bernanke (2005) observes that this effect depends in turn on patterns of substitution and complementarity among goods and currencies. For instance, if Chinese goods and euro area goods are viewed as complements by potential buyers in other countries, a renminbi revaluation may reduce global demand for euro area exports to such an extent that it could lead to a weakening of the euro.
44 Bernanke further observes that the speed of adjustment of the exchange rate and the current account in this model crucially depends on the elasticities of foreign and domestic asset demands with respect to expected return differentials. As he puts it, dynamics may be even more complex if the degree of asset substitutability is not constant but varies over time or across (private vs public) investors (see Bernanke, 2005, p. 51).

49ECB
The international role of the euroJuly 2014 49
SPECIAL FEATURES
49
dollar would depreciate by up to 9% in real effective terms (see Blanchard, Giavazzi and Sa, 2005, p. 31). Recent extensions of the model have also helped to shed light on the impact of the growing role of the Chinese renminbi on other major currencies.45
The impact of reserve diversification also largely depends on whether private investors regard it as a credible signal which prompts them to alter the composition of their own holdings. It has been argued that the impact of official reserve management on exchange rates has weakened with the rapid expansion of private sector transactions in foreign exchange markets. As the argument goes, the magnitude of official transactions is now simply too small relative to the depth and liquidity of global foreign exchange markets to have any discernible effect, which would be a major difference relative to patterns of the more distant past.46 However, the impact of official diversification may be amplified by a signalling or coordination channel, following the model of Sarno and Taylor (2001). Statements (or even rumours) by emerging market authorities about a possible diversification of their reserve holdings in the future may indeed be interpreted by private investors as a signal that relative demand for global currencies could fundamentally change. Concerns about frontloading may prompt these investors to alter the composition of their own holdings, before any official transaction has taken place. In turn, this may create bandwagon effects which magnify the potential effect of actual official reserve diversification.
4 EMPIRIcAL EvIdENcE ON THE IMPAcT OF REsERvE dIvERsIFIcATION ON gLObAL FOREIgN ExcHANgE MARkETs
Concerns about the destabilising impact of reserve diversification on foreign exchange markets originate primarily from the experience of the interwar period, when uncooperative policies led to the collapse of the gold standard. In this period, France’s concerns were similar to those of China now (Accominotti, 2009). The Banque de France held more than half of the world’s foreign reserves, which were allocated into gold, pounds sterling and US dollars. Concerns that the pound might be taken off the gold standard after 1929 provided an incentive for the Banque de France to liquidate its holdings denominated in the British currency. But the large size of its holdings made it difficult to do so without precipitating the pound’s collapse and severe valuation losses. The Banque de France decided therefore not to liquidate its sterling reserves, but rather to intervene in foreign exchange markets in support of the pound sterling. However, its eventual exit from the gold standard in 1931 resulted in such heavy losses for the Banque de France, that it had to be put in technical bankruptcy and bailed out by the French government under strict conditionality. As concerns mounted that the US dollar would also leave the gold standard, the French authorities’ decision to resolutely stick to gold caused the Banque de France to convert all of its US dollar assets into gold, through fear of incurring additional losses. This helped precipitate the devaluation of the US dollar in 1933 and to the global transmission of a severe monetary contraction in subsequent years.47
45 For instance, in a three-currency model (dollar, euro, renminbi) the growing role of the renminbi as an investment currency (modelled as higher renminbi-denominated holdings in both US and euro area portfolios) can be shown to be either neutral or stabilising for the euro-dollar exchange rate, be it under a renminbi peg with respect to the dollar or a free float (see Bénassy-Quéré and Forouheshfar, 2013).
46 For instance, Truman and Wong (2006) report that the average absolute change in the US dollar’s share of global reserves between 1970 and 2005 stands at 2.2% (net of valuation effects). They calculate that, in terms of foreign exchange reserve holdings of US dollars as of the end of 2005, this corresponds to USD 92 billion for a full year, or less than USD 400 million per trading day, compared with about USD 2 trillion a day in turnover in global foreign exchange markets at that time.
47 See Eichengreen (1992) for an in-depth discussion of the role of the gold standard in the international transmission of the Great Depression.

50ECBThe international role of the euroJuly 20145050
The demise of the pound sterling as a major reserve currency in the early 1970s shows that a major rebalancing in reserve currency shares does not necessarily occur through the liquidation of existing reserve holdings, but rather through the acquisition of additional (in this case US dollar-denominated) assets. Between 1969 and 1975 the share of the pound sterling in global reserves declined markedly from about 25% to less than 4%. This decline did not mainly occur as a result of the liquidation of sterling assets (also known as “sterling balances”).48 It stemmed from the accumulation of significant US dollar-denominated assets, notably by industrialised and oil-exporting economies, due to foreign exchange market interventions in the wake of the collapse of the Bretton Woods system and to inflows of petrodollars after the first oil price shock. The outstanding amount of US dollar-denominated reserves more than sextupled between 1969 and 1975, from about USD 20 billion to over USD 120 billion. Sterling-denominated reserves, in turn, remained broadly unchanged, from USD 8 billion in 1969 to USD 6 billion in 1975.49 These developments therefore explain, to a large extent, the marked decrease in the relative share of the pound sterling in world reserves and the concomitant increase in the share of the US dollar (from about 63% to almost 80%). In future, if the experience of the early 1970s is any guide, large reserve holders could similarly diversify their holdings by purchasing large amounts of assets denominated in currencies other than the US dollar. Hence they would not necessarily need to liquidate their dollar-denominated assets to that end.
The later part of the 1970s, when concerns surfaced about the US dollar’s future as a reserve asset, suggests that these concerns did not materialise into the liquidation of US-dollar assets, but instead into concerted efforts to stabilise the US dollar. After the collapse of the Bretton Woods system, the continued depreciation of the US dollar in the 1970s – together with stagflation and US current account deficits of an unprecedented size – raised discussions about the future of the US dollar as a reserve currency.50 The creation of a “substitution account” to address an alleged “dollar overhang” in the portfolios of foreign central banks and to avoid putting additional downward pressure on the US dollar was openly discussed. This notwithstanding, central banks continued to accumulate US dollar-denominated reserves throughout the 1970s to stabilise the value of their existing dollar-denominated assets, including through concerted interventions in support of the US dollar that involved the Federal Reserve System, the Deutsche Bundesbank and the Bank of Japan. Consistently with this, Horii (1986) finds no evidence of large-scale diversification of reserves away from the US dollar in this decade, after controlling for valuation effects.51 In future, if this historical experience is also any guide, a loss of confidence in the US dollar’s ability to serve as an official store of value would not necessarily be associated with massive US dollar sales in the short term, since large reserve holders might have an interest in intervening in markets to stabilise the value of their existing US dollar holdings.
In line with this, several empirical studies that have focused on the more recent period find that reserve diversification was stabilising, and that central banks tend to lean against the wind in managing their reserve holdings. In particular, Lim (2007) uses the IMF’s aggregated COFER data for the period 1999-2005 and finds evidence that changes in the share of the US dollar (adjusted for valuation effects) are negatively correlated with the US dollar’s exchange rate. He interprets these findings as evidence that reserve diversification in response to exchange rate changes has tended to be stabilising for exchange markets, which also helps explain the relative stability of currency shares in global reserve holdings. Wong (2007) finds similar evidence over the same sample period,
48 See Schenk (2010) for more details.49 Moreover, part of the decline may have been due to valuation effects. For an analysis of these developments, see also McKinnon (2013).50 See Henning (1994) on these discussions.51 By contrast, he finds some evidence for stabilising reserve diversification in the early part of the 1980s, when the dollar was appreciating.

51ECB
The international role of the euroJuly 2014 51
SPECIAL FEATURES
51
with the share of the dollar in global reserves being negatively correlated with the US dollar’s exchange rate. Moreover, she finds that Japan was the main source of stabilising diversification among the advanced economies. Ouyang and Li (2013) reach similar conclusions for emerging economies over the period 1999-2012. As they explain, emerging economies tend to buy (or sell) assets denominated in depreciating (or appreciating) currencies, after controlling again for valuation effects, but also for a host of other determinants of reserve currency choice.
Finally, recent studies provide evidence in support of the existence of a signalling channel of reserve diversification. In particular, Fratzscher and Mehl (forthcoming) find that statements by Chinese authorities pointing to the possible diversification of China’s reserves led to a disproportionately large appreciation of the euro against the US dollar, and of the currencies anchored to the euro. This confirms earlier results in Fratzscher and Mehl (2009), according to which statements on exchange rates and reserves by emerging market policy-makers exert a statistically and economically significant impact on the exchange rate of the euro and the yen vis-à-vis the US dollar on the day they occur, with the euro being affected the strongest. On average, a statement pointing to the possibility of loosening the US dollar peg or diversifying reserves away from the US dollar leads to an appreciation of 0.25% of the euro and of 0.15% of the yen against the US dollar.
5 cONcLUdINg REMARks
While the aforementioned considerations were of particular relevance for the short to medium term, from a longer-term perspective, one open issue that might remain is whether a more diversified international monetary system – i.e. one with multiple international currencies, where the US dollar, the euro and possibly the renminbi and other currency units would all play consequential roles – would in turn be a source of stability or instability in global foreign exchange and financial markets.
Some observers have argued that the emergence of a multipolar monetary system would help solve Triffin’s dilemma and address potential shortages of global safe assets (see Fahri, Gourinchas and Rey, 2011). Since the supply of reserve assets would indeed become more elastic, a multipolar system could respond more flexibly to the growth in international real and financial transactions and grow with the global economy’s needs. Moreover, since investors would increasingly consider reserve assets denominated in different currencies as substitutes, a multipolar system might also exert disciplinary effects on the policies of reserve currency issuers. They would need to more swiftly address a worsening in their fundamentals to avoid potentially large and disruptive capital outflows. The ability of reserve currency issuers to run large current account deficits and use foreign capital to indulge in financial excesses would hence be markedly limited, which would make the global economy financially safer (Eichengreen, 2010).
However, other observers have expressed concerns that increasing substitutability between reserve currencies would foster instability in global foreign exchange and financial markets. As they argue, a multipolar currency system could increase the likelihood of self-fulfilling runs on reserve currencies, among both private and official investors, each of whose interests consist of anticipating crises ahead of others and in converting their holdings first. At the same time, official reserve managers have less incentive to “herd” – i.e. to buy or sell a currency because others do it – than other investors (ibid.). They often take a longer-term perspective, because, unlike private fund managers, they are not accountable to short-term-oriented investors. In addition, official reserve managers often pursue objectives which are not strictly related to the maximisation of risk-adjusted

52ECBThe international role of the euroJuly 20145252
returns, but to precautionary motives or global financial stability. In other words, official reserve managers are more likely to act as stabilising investors which, as a result, should contribute to stabilising global exchange rate configurations.
In any case, it remains essential that any transition towards a multipolar international monetary system occurs in an orderly manner so that disruptions and excessive volatility can be avoided.
REFERENcEs
Accominotti, O. (2009), “The Sterling Trap: Foreign Reserves Management at the Bank of France, 1928-1936”, European Review of Economic History, Vol. 13, pp. 349-376.
Bernanke, B. (2005), “Comments and discussion on Blanchard, Giavazzi and Sa (2005)”, Brookings Papers on Economic Activity, No 1, pp. 50-57.
Branson, W. and Henderson, D. (1984), “The specification and influence of asset markets”, NBER Working Paper, No 1283, Cambridge, Massachusetts, March.
Bénassy-Quéré, A. and Forouheshfar, Y. (2013), “The impact of yuan internationalization on the euro-dollar exchange rate”, CESifo Working Paper Series, No 4149, March.
Blanchard, O., Giavazzi, F. and Sa, F. (2005), “International investors, the US current account and the dollar”, Brookings Papers on Economic Activity, No 1, pp. 1-49.
Dominguez, K., Hashimoto, Y. and Ito, T. (2012), “International reserves and the global financial crisis”, Journal of International Economics, Vol. 88, pp. 388-406.
Eichengreen, B. (1992), Golden fetters: The gold standard and the great depression, Oxford University Press, Oxford.
Eichengreen, B. (2010). “A world of multiple reserve currencies”, Project Syndicate, 20 October.
Engel, C. (2013), “Exchange rates and interest parity”, NBER Working Paper, No 19336, August.
European Central Bank (2013), The international role of the euro, Frankfurt am Main, July.
Fahri, E., Gourinchas, P.O. and Rey, H. (2011), Reforming the international monetary system, CEPR, London.
Frankel, J. (2013), “The latest on the dollar’s international currency status”, Vox, 6 December.
Fratzscher, M. and Mehl, A. (2009), “Do China and oil exporters influence major currency configurations?”, Journal of Comparative Economics, Vol. 37, pp. 335-358.
Fratzscher, M. and Mehl, A. (forthcoming) “China’s dominance hypothesis and the emergence of a tripolar global currency system”, Economic Journal.

53ECB
The international role of the euroJuly 2014 53
SPECIAL FEATURES
53
Henning, R. (1994), Currencies and politics in the United States, Germany and Japan, Institute for International Economics, Washington D.C.
Horii, A. (1986), “The evolution of reserve currency diversification”, BIS Economic Paper, No 18, Basel, December.
Lim, E.G. (2007), “Do reserve portfolios respond to exchange rate changes using a portfolio rebalancing strategy? An econometric study using COFER Data”, IMF Working Paper, No 07/293, Washington D.C.
McKinnon, R. (2013), The unloved dollar standard: from Bretton Woods to the rise of China, Oxford University Press, Oxford.
Ouyang, A. and Li, J. (2013), “Too big to change: the stabilising force of reserve currency preferences in the international monetary system,” Emerging Markets Finance and Trade, 49(5), pp. 120-133.
Prasad, E. (2014), The Dollar Trap: How the U.S. Dollar Tightened Its Grip on Global Finance, Princeton University Press, Princeton, New Jersey.
Sarno, L. and Taylor, M. (2001), “Official intervention in the foreign exchange market: is it effective and, if so, how does it work?”, Journal of Economic Literature, 39(3), pp. 839-68.
Schenk, C. (2010), The decline of sterling – Managing the retreat of an international currency: 1945-1992, Cambridge University Press, Cambridge, UK.
Truman, E. and Wong, A. (2006), “The case for an international reserve diversification standard”, Institute for International Economics Working Paper, No 2, Washington D.C., May.
Wong, A. (2007), “Measurement and inference in international reserve diversification”, Institute for International Economics Working Paper, No 6, Washington D.C., July.
54ECBThe international role of the euroJuly 201454
c AN OvERvIEw OF TRENds IN bONd MARkET IssUANcE dENOMINATEd IN FOREIgN cURRENcY52
This special feature article highlights a number of stylised facts on bond issuance that is denominated in a currency which is not the domestic one (i.e. foreign currency issuance). Since 2009 an increasingly large fraction of bonds have been issued in foreign currency, especially in emerging markets, where borrowers enjoyed a substantial “discount” by issuing in foreign currency. This suggests that interest rate differentials might be an important determinant of the currency choice of issuance, at least in emerging markets. Of the bonds issued in non-domestic currencies, the share issued in euro has declined since the start of the global financial crisis in 2008. This decline mainly reflects lower issuance in euro by non-euro area financial corporations and a strong increase in US dollar issuance by non-US issuers. Overall, the total amounts of the issuance in euro by non-euro area non-financial corporations and sovereigns were not strongly affected by the crisis and have picked up recently. The strong rise in US dollar issuance (by non-US issuers), especially by non-financial corporations, suggests that quantitative easing policies might have affected the currency composition of global bond issuance in recent years by lowering US yields.
1 INTROdUcTION
Since the global financial crisis started in 2008, the landscape of international financial markets has changed substantially. As international bank activity shrank and the stock of bank cross-border claims decreased across the globe, sovereigns and firms increasingly relied on direct market financing by issuing bonds (Turner, 2014). This trend was supported by an unprecedented monetary accommodation at the global level, which created favourable financing conditions that further increased the incentives to issue bonds worldwide (Lo Duca, Nicoletti and Vidal, 2014).
In this context, gross global issuance of bonds reached record levels in 2013. While the largest share of bonds was issued in domestic currency, since 2009 an increasingly large proportion of the new issuance has been denominated in foreign currencies, especially in emerging market economies. On the one hand, these developments have enlarged the scale of local bond markets, which is an important step towards complete and developed financial markets in emerging economies.53 On the other hand, the increasingly large issuance of foreign currency bonds suggests that the exposure of sovereigns and firms to foreign exchange risk might be increasing in the presence of less than perfect hedging possibilities. The risks implied by currency mismatches for bond markets worldwide have been discussed recently (Turner, 2014; and Caballero, Panizza and Powell, 2014) and a number of commentators (Shin, 2013) have related the recently observed larger sensitivity of emerging markets to global financial conditions to their increased borrowing in foreign currency. Overall, large currency mismatches might amplify the transmission mechanism of external shocks, increase business cycle synchronisation worldwide and thereby have pro-cyclical implications for the global macro-financial cycle.
Against this background, the first part of this special feature article presents an overview of the literature on the reasons behind the choice of currency in which the debt is denominated. The second part reviews the most recent trends in the issuance of bonds denominated in foreign currencies, assesses the features of bonds issued in foreign currency relative to bonds denominated in local currency and discusses the role of the euro and the US dollar in the issuance of new bonds at the global
52 Prepared by Marco Lo Duca and Giulio Nicoletti.53 However, in the absence of sound fundamentals, appropriate institutional frameworks and diversified domestic investors bases, local bond
markets might be volatile, especially if the participation of leveraged foreign investors is substantial.

55ECB
The international role of the euroJuly 2014 55
Special FeatureS
level.54 The article focuses on gross bond issuance (i.e. the flow of new bonds issued worldwide), rather than on the existing stock of outstanding bonds as the former captures new trends.55
2 wHIcH FAcTORs AFFEcT THE cHOIcE OF cURRENcY IN wHIcH THE dEbT Is dENOMINATEd?
Issuers might decide to adopt non-domestic currencies for a number of reasons. The literature mainly differentiates between motives for the private sector and those for sovereigns.
Concerning the private sector, the literature has highlighted several factors which can induce a firm to issue debt in a foreign currency. These factors include the macroeconomic context, microeconomic settings and conditions, and country or market-specific institutional features.
Relative costs, such as interest rate differentials – both real and nominal – as well as exchange rate expectations and currency volatility can influence issuers in their choices of currency (see, for example, BIS, 2005).56 While in an ideal market the uncovered interest parity should prevent arbitrage between exchange rates and interest rates, the validity of this relationship at short horizons is limited from an empirical point of view. These motives have been examined in the recent literature also with respect to the decision of borrowing via bank loans in foreign currency.57 In recent years, two factors may have induced firms and sovereigns to issue in foreign currency. First, higher interest rates in emerging markets relative to advanced economies have been accompanied by a continued appreciation of emerging market currencies. This made issuing debt in foreign currency attractive for emerging market borrowers as their currency was appreciating and increased investors’ demand for such securities, owing to a search for higher yields. Second, monetary accommodation, associated with expectations of low interest rates for a protracted period of time could have encouraged the private sector to issue more debt in US dollars in key financial centres.
The microeconomic dimension or firms’ characteristics can also play a role in the currency choice of debt. For example, internationally active firms might find it attractive to issue liabilities that match the currencies of a part of their assets or the currency of their revenues (Kedia and Mozumadar, 2003). This may be the case for financial firms that have cross-border activities or non-financial corporations, especially exporting firms, when the currency of invoicing is not the domestic currency. While in this case the issuance in foreign currency reflects the choice of the borrower, firm-specific characteristics can also affect the ability of the borrower to issue in foreign markets, and thus the ability to use foreign currency.58
54 The article focuses on gross bond issuance (i.e. the flow of new bonds issued worldwide), distinguishing between the currency denomination of bonds (domestic currency versus foreign currency). As the focus is on the role of currencies, the article does not distinguish between bond issuance targeted at resident investors and bond issuance targeted at non-resident investors. This partially differs from the BIS data used in Section 4.2 of this report which looks at international bond issuance, i.e. issuance targeted at non-resident investors (BIS, 2003).
55 Also, this article focuses on the concept of nationality when separating bonds across countries. This means that a bond is classified as a foreign currency bond if the currency of denomination is not the domestic currency of the country of origin of the borrower. As noted by the BIS (see Turner, 2014), looking at the concept of nationality, which relates to the consolidated balance sheet of firms, is a more appropriate approach than the residence principle when evaluating the external positions of countries or sectors within a country.
56 For governments in particular, an important cost factor in the decision to issue more bonds in US dollars could have been the negative swap basis observed between euro and US dollar observed from the time of the Lehman collapse until recently; this additional factor made it cheaper to issue in US dollars and convert to euro via a swap.
57 Habib and Joy (2010) find that the choice of issuance currency is sensitive to deviations resulting from uncovered interest parity – especially for financial rather than non-financial issuers – but insensitive to deviations resulting from covered interest parity.
58 As asymmetric information between borrowers and lenders is typically higher in foreign markets compared with domestic ones, only firms that are perceived as more sound are typically able to issue in foreign markets. Having more tangible assets in the balance sheet and already being listed in a foreign equity market for example, are typically associated with stronger ability of the firm to issue debt in foreign currency, as such features help mitigate asymmetric information problems between borrowers and lenders in foreign markets (see Allayannis, Brown and Rodgers 2003).
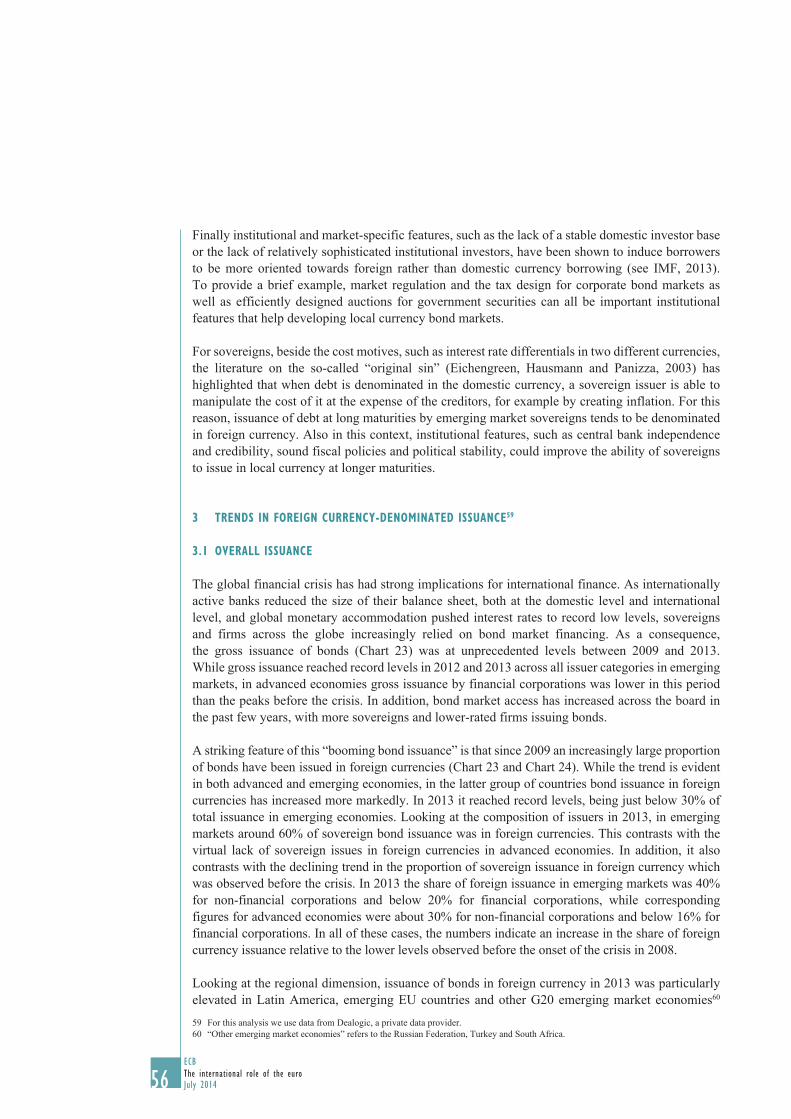
56ECBThe international role of the euroJuly 201456
Finally institutional and market-specific features, such as the lack of a stable domestic investor base or the lack of relatively sophisticated institutional investors, have been shown to induce borrowers to be more oriented towards foreign rather than domestic currency borrowing (see IMF, 2013). To provide a brief example, market regulation and the tax design for corporate bond markets as well as efficiently designed auctions for government securities can all be important institutional features that help developing local currency bond markets.
For sovereigns, beside the cost motives, such as interest rate differentials in two different currencies, the literature on the so-called “original sin” (Eichengreen, Hausmann and Panizza, 2003) has highlighted that when debt is denominated in the domestic currency, a sovereign issuer is able to manipulate the cost of it at the expense of the creditors, for example by creating inflation. For this reason, issuance of debt at long maturities by emerging market sovereigns tends to be denominated in foreign currency. Also in this context, institutional features, such as central bank independence and credibility, sound fiscal policies and political stability, could improve the ability of sovereigns to issue in local currency at longer maturities.
3 TRENds IN FOREIgN cURRENcY-dENOMINATEd IssUANcE59
3.1 OvERALL IssUANcE
The global financial crisis has had strong implications for international finance. As internationally active banks reduced the size of their balance sheet, both at the domestic level and international level, and global monetary accommodation pushed interest rates to record low levels, sovereigns and firms across the globe increasingly relied on bond market financing. As a consequence, the gross issuance of bonds (Chart 23) was at unprecedented levels between 2009 and 2013. While gross issuance reached record levels in 2012 and 2013 across all issuer categories in emerging markets, in advanced economies gross issuance by financial corporations was lower in this period than the peaks before the crisis. In addition, bond market access has increased across the board in the past few years, with more sovereigns and lower-rated firms issuing bonds.
A striking feature of this “booming bond issuance” is that since 2009 an increasingly large proportion of bonds have been issued in foreign currencies (Chart 23 and Chart 24). While the trend is evident in both advanced and emerging economies, in the latter group of countries bond issuance in foreign currencies has increased more markedly. In 2013 it reached record levels, being just below 30% of total issuance in emerging economies. Looking at the composition of issuers in 2013, in emerging markets around 60% of sovereign bond issuance was in foreign currencies. This contrasts with the virtual lack of sovereign issues in foreign currencies in advanced economies. In addition, it also contrasts with the declining trend in the proportion of sovereign issuance in foreign currency which was observed before the crisis. In 2013 the share of foreign issuance in emerging markets was 40% for non-financial corporations and below 20% for financial corporations, while corresponding figures for advanced economies were about 30% for non-financial corporations and below 16% for financial corporations. In all of these cases, the numbers indicate an increase in the share of foreign currency issuance relative to the lower levels observed before the onset of the crisis in 2008.
Looking at the regional dimension, issuance of bonds in foreign currency in 2013 was particularly elevated in Latin America, emerging EU countries and other G20 emerging market economies60 59 For this analysis we use data from Dealogic, a private data provider.60 “Other emerging market economies” refers to the Russian Federation, Turkey and South Africa.
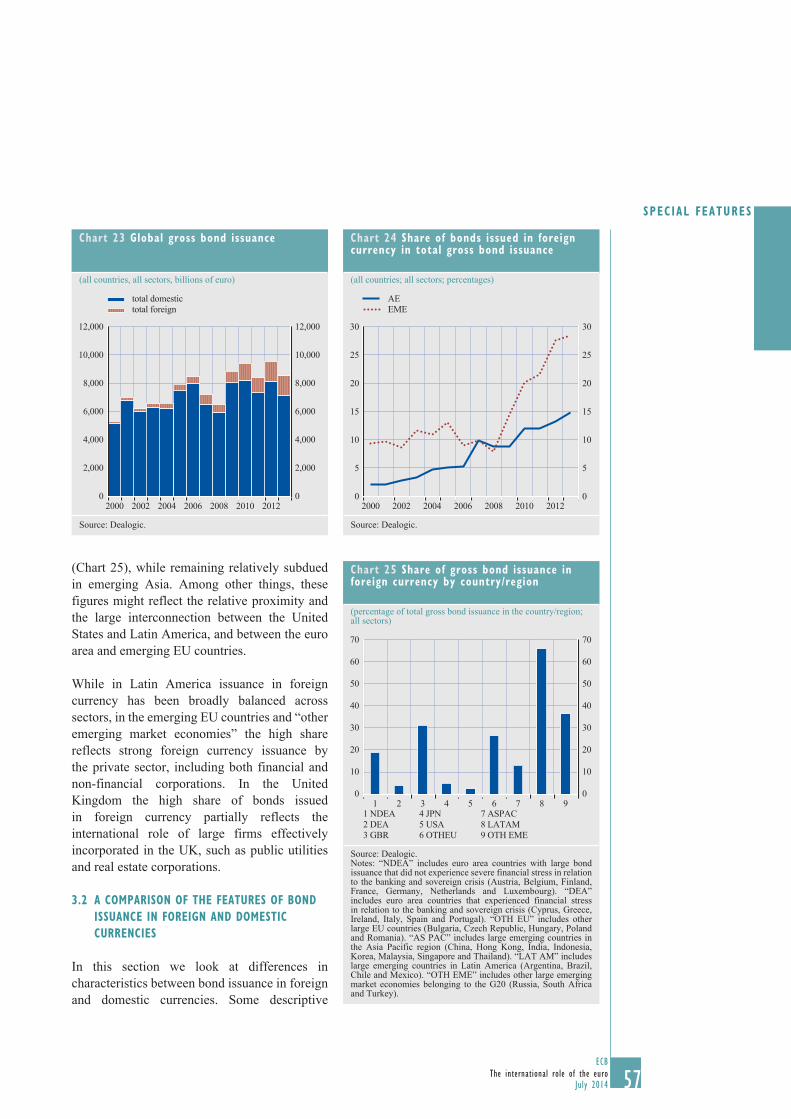
57ECB
The international role of the euroJuly 2014 57
Special FeatureS
(Chart 25), while remaining relatively subdued in emerging Asia. Among other things, these figures might reflect the relative proximity and the large interconnection between the United States and Latin America, and between the euro area and emerging EU countries.
While in Latin America issuance in foreign currency has been broadly balanced across sectors, in the emerging EU countries and “other emerging market economies” the high share reflects strong foreign currency issuance by the private sector, including both financial and non-financial corporations. In the United Kingdom the high share of bonds issued in foreign currency partially reflects the international role of large firms effectively incorporated in the UK, such as public utilities and real estate corporations.
3.2 A cOMPARIsON OF THE FEATUREs OF bONd IssUANcE IN FOREIgN ANd dOMEsTIc cURRENcIEs
In this section we look at differences in characteristics between bond issuance in foreign and domestic currencies. Some descriptive
chart 23 global gross bond issuance
(all countries, all sectors, billions of euro)
0
2,000
4,000
6,000
8,000
10,000
12,000
0
2,000
4,000
6,000
8,000
10,000
12,000
2000 2002 2004 2006 2008 2010 2012
total domestictotal foreign
Source: Dealogic.
chart 24 share of bonds issued in foreign currency in total gross bond issuance
(all countries; all sectors; percentages)
0
5
10
15
20
25
30
0
5
10
15
20
25
30
2000 2002 2004 2006 2008 2010 2012
AEEME
Source: Dealogic.
chart 25 share of gross bond issuance in foreign currency by country/region
(percentage of total gross bond issuance in the country/region; all sectors)
0
10
20
30
40
50
60
70
0
10
20
30
40
50
60
70
1 NDEA2 DEA3 GBR
4 JPN5 USA6 OTHEU
7 ASPAC8 LATAM9 OTH EME
1 2 3 4 5 6 7 8 9
Source: Dealogic.Notes: “NDEA” includes euro area countries with large bond issuance that did not experience severe financial stress in relation to the banking and sovereign crisis (Austria, Belgium, Finland, France, Germany, Netherlands and Luxembourg). “DEA” includes euro area countries that experienced financial stress in relation to the banking and sovereign crisis (Cyprus, Greece, Ireland, Italy, Spain and Portugal). “OTH EU” includes other large EU countries (Bulgaria, Czech Republic, Hungary, Poland and Romania). “AS PAC” includes large emerging countries in the Asia Pacific region (China, Hong Kong, India, Indonesia, Korea, Malaysia, Singapore and Thailand). “LAT AM” includes large emerging countries in Latin America (Argentina, Brazil, Chile and Mexico). “OTH EME” includes other large emerging market economies belonging to the G20 (Russia, South Africa and Turkey).
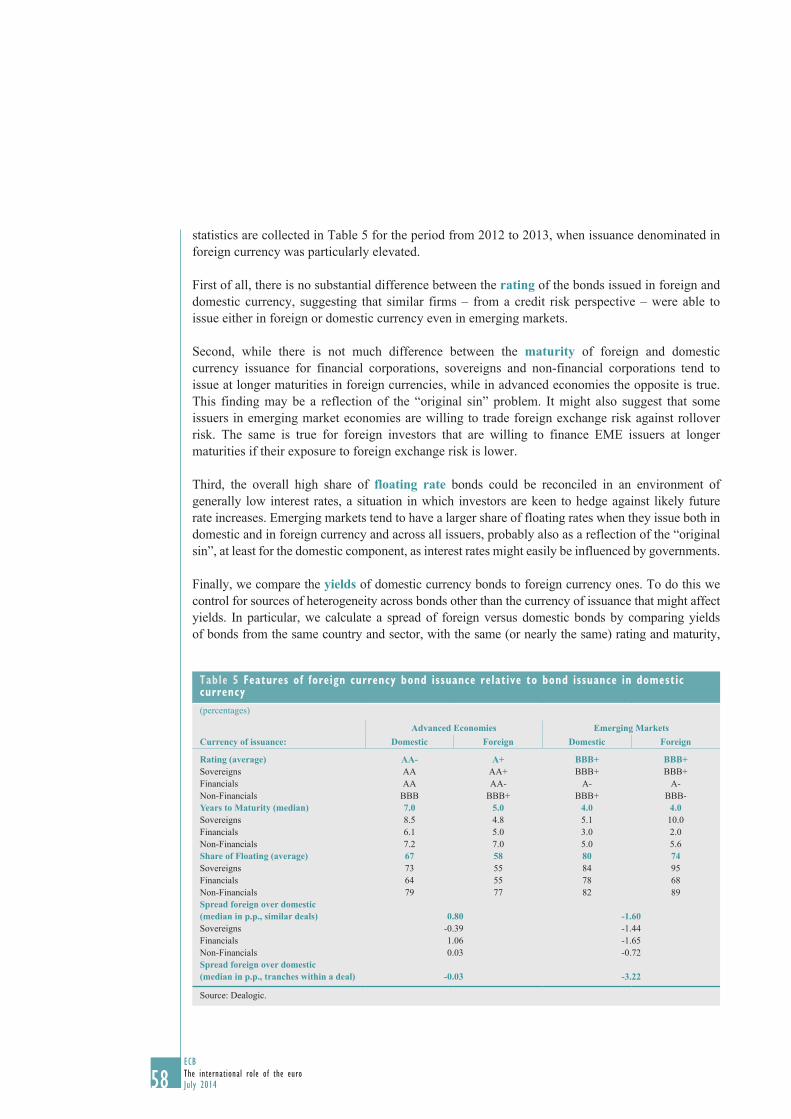
58ECBThe international role of the euroJuly 201458
statistics are collected in Table 5 for the period from 2012 to 2013, when issuance denominated in foreign currency was particularly elevated.
First of all, there is no substantial difference between the rating of the bonds issued in foreign and domestic currency, suggesting that similar firms – from a credit risk perspective – were able to issue either in foreign or domestic currency even in emerging markets.
Second, while there is not much difference between the maturity of foreign and domestic currency issuance for financial corporations, sovereigns and non-financial corporations tend to issue at longer maturities in foreign currencies, while in advanced economies the opposite is true. This finding may be a reflection of the “original sin” problem. It might also suggest that some issuers in emerging market economies are willing to trade foreign exchange risk against rollover risk. The same is true for foreign investors that are willing to finance EME issuers at longer maturities if their exposure to foreign exchange risk is lower.
Third, the overall high share of floating rate bonds could be reconciled in an environment of generally low interest rates, a situation in which investors are keen to hedge against likely future rate increases. Emerging markets tend to have a larger share of floating rates when they issue both in domestic and in foreign currency and across all issuers, probably also as a reflection of the “original sin”, at least for the domestic component, as interest rates might easily be influenced by governments.
Finally, we compare the yields of domestic currency bonds to foreign currency ones. To do this we control for sources of heterogeneity across bonds other than the currency of issuance that might affect yields. In particular, we calculate a spread of foreign versus domestic bonds by comparing yields of bonds from the same country and sector, with the same (or nearly the same) rating and maturity,
Table 5 Features of foreign currency bond issuance relative to bond issuance in domestic currency(percentages)
Currency of issuance: Advanced Economies Emerging Markets
Domestic Foreign Domestic Foreign
Rating (average) AA- A+ BBB+ BBB+Sovereigns AA AA+ BBB+ BBB+ Financials AA AA- A- A- Non-Financials BBB BBB+ BBB+ BBB- Years to Maturity (median) 7.0 5.0 4.0 4.0 Sovereigns 8.5 4.8 5.1 10.0 Financials 6.1 5.0 3.0 2.0 Non-Financials 7.2 7.0 5.0 5.6 Share of Floating (average) 67 58 80 74 Sovereigns 73 55 84 95 Financials 64 55 78 68 Non-Financials 79 77 82 89 Spread foreign over domestic (median in p.p., similar deals) 0.80 -1.60 Sovereigns -0.39 -1.44 Financials 1.06 -1.65 Non-Financials 0.03 -0.72 Spread foreign over domestic (median in p.p., tranches within a deal) -0.03 -3.22
Source: Dealogic.
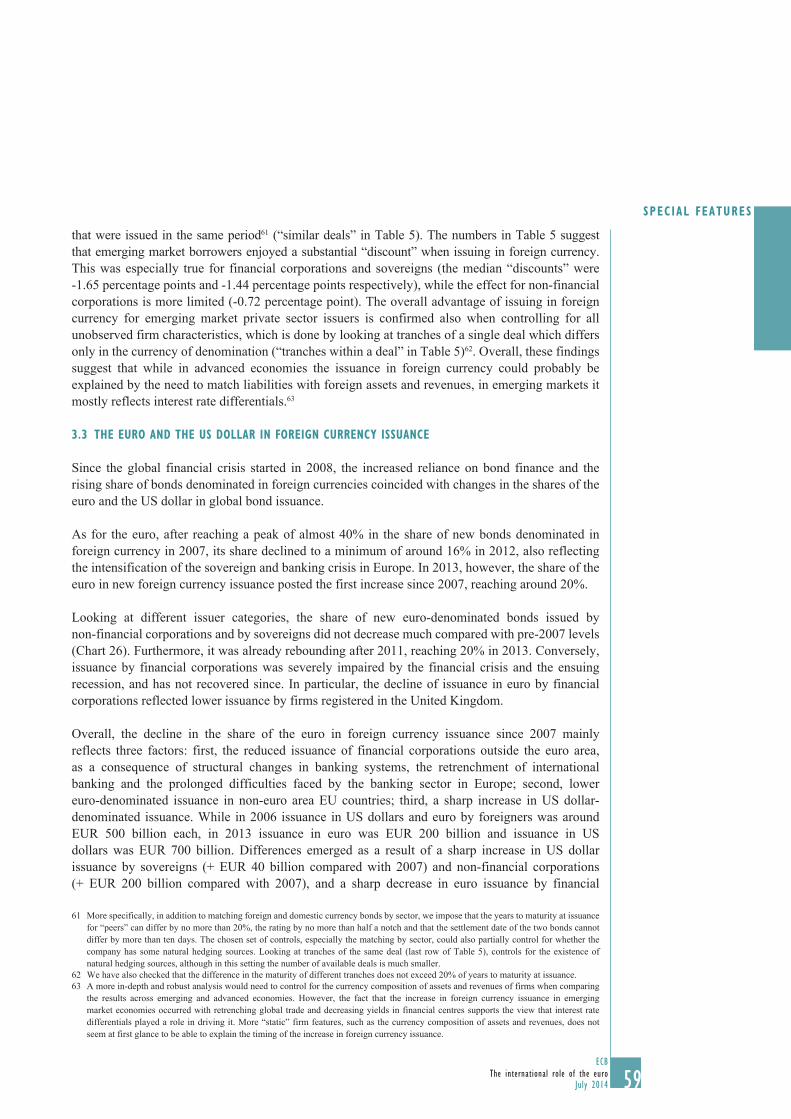
59ECB
The international role of the euroJuly 2014 59
Special FeatureS
that were issued in the same period61 (“similar deals” in Table 5). The numbers in Table 5 suggest that emerging market borrowers enjoyed a substantial “discount” when issuing in foreign currency. This was especially true for financial corporations and sovereigns (the median “discounts” were -1.65 percentage points and -1.44 percentage points respectively), while the effect for non-financial corporations is more limited (-0.72 percentage point). The overall advantage of issuing in foreign currency for emerging market private sector issuers is confirmed also when controlling for all unobserved firm characteristics, which is done by looking at tranches of a single deal which differs only in the currency of denomination (“tranches within a deal” in Table 5)62. Overall, these findings suggest that while in advanced economies the issuance in foreign currency could probably be explained by the need to match liabilities with foreign assets and revenues, in emerging markets it mostly reflects interest rate differentials.63
3.3 THE EURO ANd THE Us dOLLAR IN FOREIgN cURRENcY IssUANcE
Since the global financial crisis started in 2008, the increased reliance on bond finance and the rising share of bonds denominated in foreign currencies coincided with changes in the shares of the euro and the US dollar in global bond issuance.
As for the euro, after reaching a peak of almost 40% in the share of new bonds denominated in foreign currency in 2007, its share declined to a minimum of around 16% in 2012, also reflecting the intensification of the sovereign and banking crisis in Europe. In 2013, however, the share of the euro in new foreign currency issuance posted the first increase since 2007, reaching around 20%.
Looking at different issuer categories, the share of new euro-denominated bonds issued by non-financial corporations and by sovereigns did not decrease much compared with pre-2007 levels (Chart 26). Furthermore, it was already rebounding after 2011, reaching 20% in 2013. Conversely, issuance by financial corporations was severely impaired by the financial crisis and the ensuing recession, and has not recovered since. In particular, the decline of issuance in euro by financial corporations reflected lower issuance by firms registered in the United Kingdom.
Overall, the decline in the share of the euro in foreign currency issuance since 2007 mainly reflects three factors: first, the reduced issuance of financial corporations outside the euro area, as a consequence of structural changes in banking systems, the retrenchment of international banking and the prolonged difficulties faced by the banking sector in Europe; second, lower euro-denominated issuance in non-euro area EU countries; third, a sharp increase in US dollar-denominated issuance. While in 2006 issuance in US dollars and euro by foreigners was around EUR 500 billion each, in 2013 issuance in euro was EUR 200 billion and issuance in US dollars was EUR 700 billion. Differences emerged as a result of a sharp increase in US dollar issuance by sovereigns (+ EUR 40 billion compared with 2007) and non-financial corporations (+ EUR 200 billion compared with 2007), and a sharp decrease in euro issuance by financial
61 More specifically, in addition to matching foreign and domestic currency bonds by sector, we impose that the years to maturity at issuance for “peers” can differ by no more than 20%, the rating by no more than half a notch and that the settlement date of the two bonds cannot differ by more than ten days. The chosen set of controls, especially the matching by sector, could also partially control for whether the company has some natural hedging sources. Looking at tranches of the same deal (last row of Table 5), controls for the existence of natural hedging sources, although in this setting the number of available deals is much smaller.
62 We have also checked that the difference in the maturity of different tranches does not exceed 20% of years to maturity at issuance.63 A more in-depth and robust analysis would need to control for the currency composition of assets and revenues of firms when comparing
the results across emerging and advanced economies. However, the fact that the increase in foreign currency issuance in emerging market economies occurred with retrenching global trade and decreasing yields in financial centres supports the view that interest rate differentials played a role in driving it. More “static” firm features, such as the currency composition of assets and revenues, does not seem at first glance to be able to explain the timing of the increase in foreign currency issuance.
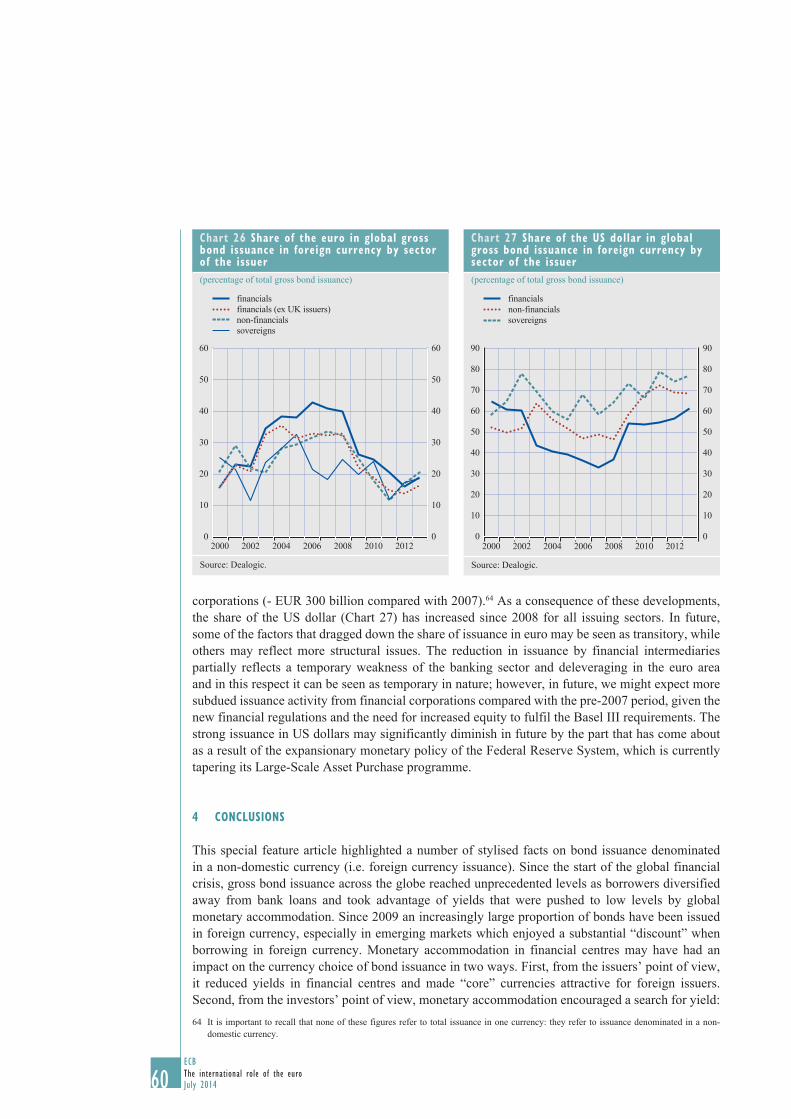
60ECBThe international role of the euroJuly 201460
corporations (- EUR 300 billion compared with 2007).64 As a consequence of these developments, the share of the US dollar (Chart 27) has increased since 2008 for all issuing sectors. In future, some of the factors that dragged down the share of issuance in euro may be seen as transitory, while others may reflect more structural issues. The reduction in issuance by financial intermediaries partially reflects a temporary weakness of the banking sector and deleveraging in the euro area and in this respect it can be seen as temporary in nature; however, in future, we might expect more subdued issuance activity from financial corporations compared with the pre-2007 period, given the new financial regulations and the need for increased equity to fulfil the Basel III requirements. The strong issuance in US dollars may significantly diminish in future by the part that has come about as a result of the expansionary monetary policy of the Federal Reserve System, which is currently tapering its Large-Scale Asset Purchase programme.
4 cONcLUsIONs
This special feature article highlighted a number of stylised facts on bond issuance denominated in a non-domestic currency (i.e. foreign currency issuance). Since the start of the global financial crisis, gross bond issuance across the globe reached unprecedented levels as borrowers diversified away from bank loans and took advantage of yields that were pushed to low levels by global monetary accommodation. Since 2009 an increasingly large proportion of bonds have been issued in foreign currency, especially in emerging markets which enjoyed a substantial “discount” when borrowing in foreign currency. Monetary accommodation in financial centres may have had an impact on the currency choice of bond issuance in two ways. First, from the issuers’ point of view, it reduced yields in financial centres and made “core” currencies attractive for foreign issuers. Second, from the investors’ point of view, monetary accommodation encouraged a search for yield: 64 It is important to recall that none of these figures refer to total issuance in one currency: they refer to issuance denominated in a non-
domestic currency.
chart 26 share of the euro in global gross bond issuance in foreign currency by sector of the issuer(percentage of total gross bond issuance)
60
0
10
20
30
40
50
60
0
10
20
30
40
50
2000 2002 2004 2006 2008 2010 2012
financialsfinancials (ex UK issuers)non-financialssovereigns
Source: Dealogic.
chart 27 share of the Us dollar in global gross bond issuance in foreign currency by sector of the issuer(percentage of total gross bond issuance)
0
10
20
30
40
50
60
70
80
90
0
10
20
30
40
50
60
70
80
90
2000 2002 2004 2006 2008 2010 2012
financialsnon-financialssovereigns
Source: Dealogic.

61ECB
The international role of the euroJuly 2014 61
Special FeatureS
global investors could buy bonds issued by foreigners but denominated in “core” currencies, thus enjoying higher yields, but remaining more insulated from exchange rate risk. Regarding advanced economies, the absence of any discount when issuing in foreign currency suggests that the currency choice of issuance could be the result of firms’ attempts to match the currency composition of assets and revenues with the currency denomination of liabilities.
The share of the euro in global bond issuance denominated in foreign currency (i.e. issuance in euro by non-euro area issuers) has declined since the start of the global financial crisis in 2008. However, the decline stems mainly from lower issuance in euro by non-euro area financial corporations and from a strong increase in issuance denominated in US dollars (by non- US issuers). Overall, the issuance in euro by non-euro area non-financial corporations and sovereigns was not strongly affected by the crisis in absolute terms and has recently picked up. The strong rise in US dollar issuance, especially by non-financial corporations, and the relatively low yields of securities issued in US dollars suggest that quantitative easing may have affected the currency composition of bond issuance in recent years.
REFERENcEs
Allayannis, G., Brown, G. and Klapper, L.F. (2003), Capital Structure and Financial Risk: Evidence from Foreign Debt Use in East Asia”. Journal of Finance, Vol. 58, pp. 2667-2710.
BIS (2005), “Currency choice in international bond issuance”, BIS quarterly review, June.
BIS (2003), “Guide to the international financial statistics”, BIS Paper No 14.
Caballero, J., Panizza, U. and Powell, A. (2014), “Balance Sheets and Credit Growth” in Powell, A. (ed.), Global Recovery and Monetary Normalization: Escaping a Chronicle Foretold?, Latin American and Caribbean Macroeconomic Report, Inter-American Development Bank, Chapter 4.
Crespo Cuaresma, J., Fidrmuc, J. and Hake, M. (2013), Demand and Supply Drivers of Foreign Currency Loans in CEECs: A Bayesian Meta-Analysis, mimeo.
Eichengreen, B., Hausmann, R. and Panizza, U. (2003), “The pain of original sin”, in Eichengreen et al. (eds.), Other People’s Money - Debt Denomination and Financial Instability in Emerging Market Economies, University of Chicago Press, Chicago and London.
IMF (2013), Local Currency Bond Markets – A Diagnostic framework.
Habib, M.M. and Joy, M. (2010), “Foreign-currency bonds: currency choice and the role of uncovered and covered interest parity”, Applied Financial Economics, Vol. 20, Issue 8.
Kedia, S. and Mozumadar, A. (2003), “Foreign currency-denominated debt: An empirical examination”, Journal of Business, Vol. 76, pp. 521-546.
Lo Duca, M., Nicoletti, G. and Vidal, A. (2014), “Global corporate bond issuance: what role for US quantitative easing?”, ECB Working Paper Series, No 1649, March 2014.
62ECBThe international role of the euroJuly 201462
Shin, H.S. (2013), “The second phase of global liquidity and its impact on emerging economies”, Keynote address at the Asia Economic Policy Conference, Federal Reserve Bank of San Francisco, November.
Turner, P. (2013), “The global long-term interest rate, financial risks and policy choices in EMEs”, BIS Working Paper Series, No 441, February.

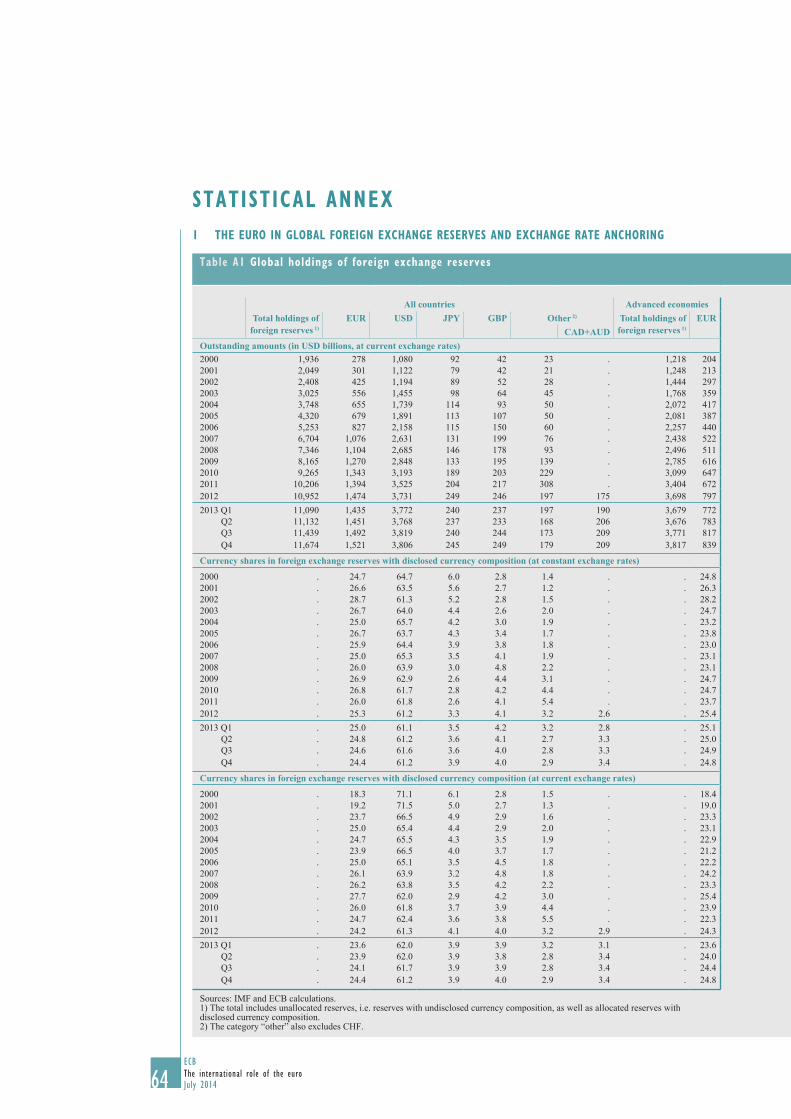
64ECBThe international role of the euroJuly 201464
1 THE EURO IN gLObAL FOREIgN ExcHANgE REsERvEs ANd ExcHANgE RATE ANcHORINg
sTATIsTIcAL ANNEx
Table A1 global holdings of foreign exchange reserves
All countries Advanced economies Advanced economies Emerging and developing economiesTotal holdings of
foreign reserves 1)EUR USD JPY GBP Other 2) Total holdings of
foreign reserves 1)EUR USD JPY GBP Other 2) Total holdings of
foreign reserves 1)EUR USD JPY GBP Other 2)
CAD+AUD CAD+AUD CAD+AUDOutstanding amounts (in USD billions, at current exchange rates) Outstanding amounts (in USD billions, at current exchange rates)2000 1,936 278 1,080 92 42 23 . 1,218 204 772 81 31 17 . 718 74 307 11 11 6 .2001 2,049 301 1,122 79 42 21 . 1,248 213 792 68 30 15 . 802 88 330 11 12 5 .2002 2,408 425 1,194 89 52 28 . 1,444 297 850 69 36 20 . 963 127 345 19 16 9 .2003 3,025 556 1,455 98 64 45 . 1,768 359 1,045 81 36 32 . 1,257 197 410 18 27 13 .2004 3,748 655 1,739 114 93 50 . 2,072 417 1,228 91 48 38 . 1,676 238 511 23 44 12 .2005 4,320 679 1,891 113 107 50 . 2,081 387 1,261 86 50 34 . 2,239 292 630 26 57 16 .2006 5,253 827 2,158 115 150 60 . 2,257 440 1,350 84 65 38 . 2,996 387 807 31 85 22 .2007 6,704 1,076 2,631 131 199 76 . 2,438 522 1,424 85 76 45 . 4,267 554 1,208 46 123 30 .2008 7,346 1,104 2,685 146 178 93 . 2,496 511 1,476 94 59 54 . 4,850 592 1,209 52 118 39 .2009 8,165 1,270 2,848 133 195 139 . 2,785 616 1,582 95 68 63 . 5,380 653 1,266 38 127 76 .2010 9,265 1,343 3,193 189 203 229 . 3,099 647 1,762 121 68 105 . 6,166 696 1,431 68 135 124 .2011 10,206 1,394 3,525 204 217 308 . 3,404 672 2,004 132 77 124 . 6,801 722 1,521 72 140 184 .2012 10,952 1,474 3,731 249 246 197 175 3,698 797 2,049 165 100 96 68 7,255 677 1,682 84 146 101 1082013 Q1 11,090 1,435 3,772 240 237 197 190 3,679 772 2,055 160 97 98 75 7,411 663 1,717 80 140 99 114
Q2 11,132 1,451 3,768 237 233 168 206 3,676 783 2,053 155 95 68 98 7,456 668 1,715 82 138 101 108 Q3 11,439 1,492 3,819 240 244 173 209 3,771 817 2,092 159 102 71 101 7,668 675 1,727 81 142 102 109 Q4 11,674 1,521 3,806 245 249 179 209 3,817 839 2,104 161 104 74 101 7,856 682 1,701 84 146 105 108
Currency shares in foreign exchange reserves with disclosed currency composition (at constant exchange rates) Currency shares in foreign exchange reserves with disclosed currency composition (at constant exchange rates)
2000 . 24.7 64.7 6.0 2.8 1.4 . . 24.8 63.3 7.3 2.8 1.4 . . 24.4 68.5 2.8 2.7 1.4 .2001 . 26.6 63.5 5.6 2.7 1.2 . . 26.3 62.5 6.7 2.7 1.2 . . 27.4 65.9 2.7 2.8 1.0 .2002 . 28.7 61.3 5.2 2.8 1.5 . . 28.2 61.3 5.7 2.7 1.4 . . 29.9 61.5 3.9 3.0 1.5 .2003 . 26.7 64.0 4.4 2.6 2.0 . . 24.7 65.7 5.2 2.1 2.0 . . 31.6 60.0 2.7 3.7 1.9 .2004 . 25.0 65.7 4.2 3.0 1.9 . . 23.2 67.4 4.9 2.3 2.1 . . 29.2 61.9 2.7 4.6 1.4 .2005 . 26.7 63.7 4.3 3.4 1.7 . . 23.8 66.5 5.1 2.5 1.8 . . 31.8 58.7 2.8 5.1 1.5 .2006 . 25.9 64.4 3.9 3.8 1.8 . . 23.0 67.3 4.8 2.7 1.9 . . 30.2 60.1 2.6 5.4 1.7 .2007 . 25.0 65.3 3.5 4.1 1.9 . . 23.1 67.2 4.3 3.0 2.1 . . 27.2 63.3 2.6 5.3 1.6 .2008 . 26.0 63.9 3.0 4.8 2.2 . . 23.1 67.4 3.7 3.1 2.5 . . 29.1 60.0 2.2 6.7 1.9 .2009 . 26.9 62.9 2.6 4.4 3.1 . . 24.7 66.1 3.5 2.9 2.6 . . 29.3 59.4 1.6 6.1 3.6 .2010 . 26.8 61.7 2.8 4.2 4.4 . . 24.7 65.1 3.5 2.7 3.9 . . 29.1 57.9 2.1 5.8 5.0 .2011 . 26.0 61.8 2.6 4.1 5.4 . . 23.7 66.2 3.2 2.7 4.1 . . 28.7 56.8 2.0 5.6 6.9 .2012 . 25.3 61.2 3.3 4.1 3.2 2.6 . 25.4 62.4 4.1 3.1 2.9 1.8 . 25.2 59.8 2.5 5.3 3.6 3.52013 Q1 . 25.0 61.1 3.5 4.2 3.2 2.8 . 25.1 62.1 4.3 3.2 2.9 2.0 . 24.9 59.9 2.5 5.3 3.5 3.6
Q2 . 24.8 61.2 3.6 4.1 2.7 3.3 . 25.0 62.2 4.4 3.1 2.1 2.9 . 24.7 60.0 2.7 5.2 3.5 3.7 Q3 . 24.6 61.6 3.6 4.0 2.8 3.3 . 24.9 62.4 4.4 3.1 2.1 2.9 . 24.2 60.7 2.6 5.1 3.6 3.7 Q4 . 24.4 61.2 3.9 4.0 2.9 3.4 . 24.8 62.1 4.7 3.1 2.2 3.0 . 24.1 60.1 3.0 5.2 3.7 3.8
Currency shares in foreign exchange reserves with disclosed currency composition (at current exchange rates) Currency shares in foreign exchange reserves with disclosed currency composition (at current exchange
2000 . 18.3 71.1 6.1 2.8 1.5 . . 18.4 69.7 7.3 2.8 1.5 . . 18.0 74.9 2.8 2.6 1.5 .2001 . 19.2 71.5 5.0 2.7 1.3 . . 19.0 70.5 6.1 2.7 1.4 . . 19.6 73.9 2.4 2.8 1.1 .2002 . 23.7 66.5 4.9 2.9 1.6 . . 23.3 66.4 5.4 2.8 1.6 . . 24.6 66.7 3.8 3.2 1.6 .2003 . 25.0 65.4 4.4 2.9 2.0 . . 23.1 67.1 5.2 2.3 2.0 . . 29.6 61.5 2.7 4.1 1.9 .2004 . 24.7 65.5 4.3 3.5 1.9 . . 22.9 67.3 5.0 2.7 2.1 . . 28.7 61.6 2.8 5.3 1.4 .2005 . 23.9 66.5 4.0 3.7 1.7 . . 21.2 69.2 4.7 2.7 1.8 . . 28.6 61.7 2.6 5.6 1.6 .2006 . 25.0 65.1 3.5 4.5 1.8 . . 22.2 68.1 4.2 3.3 1.9 . . 29.0 60.5 2.3 6.4 1.7 .2007 . 26.1 63.9 3.2 4.8 1.8 . . 24.2 66.0 4.0 3.5 2.1 . . 28.2 61.5 2.3 6.3 1.5 .2008 . 26.2 63.8 3.5 4.2 2.2 . . 23.3 67.2 4.3 2.7 2.5 . . 29.4 60.1 2.6 5.9 1.9 .2009 . 27.7 62.0 2.9 4.2 3.0 . . 25.4 65.1 3.9 2.8 2.6 . . 30.2 58.6 1.8 5.9 3.5 .2010 . 26.0 61.8 3.7 3.9 4.4 . . 23.9 65.1 4.5 2.5 3.9 . . 28.3 58.3 2.8 5.5 5.0 .2011 . 24.7 62.4 3.6 3.8 5.5 . . 22.3 66.5 4.4 2.5 4.1 . . 27.3 57.6 2.7 5.3 7.0 .2012 . 24.2 61.3 4.1 4.0 3.2 2.9 . 24.3 62.4 5.0 3.0 2.9 2.1 . 24.2 60.0 3.0 5.2 3.6 3.82013 Q1 . 23.6 62.0 3.9 3.9 3.2 3.1 . 23.6 63.0 4.9 3.0 3.0 2.3 . 23.5 60.9 2.8 5.0 3.5 4.1
Q2 . 23.9 62.0 3.9 3.8 2.8 3.4 . 24.0 63.0 4.8 2.9 2.1 3.0 . 23.7 60.9 2.9 4.9 3.6 3.8 Q3 . 24.1 61.7 3.9 3.9 2.8 3.4 . 24.4 62.5 4.8 3.0 2.1 3.0 . 23.8 60.8 2.8 5.0 3.6 3.8 Q4 . 24.4 61.2 3.9 4.0 2.9 3.4 . 24.8 62.1 4.7 3.1 2.2 3.0 . 24.1 60.1 3.0 5.2 3.7 3.8
Sources: IMF and ECB calculations.1) The total includes unallocated reserves, i.e. reserves with undisclosed currency composition, as well as allocated reserves with disclosed currency composition.2) The category “other” also excludes CHF.
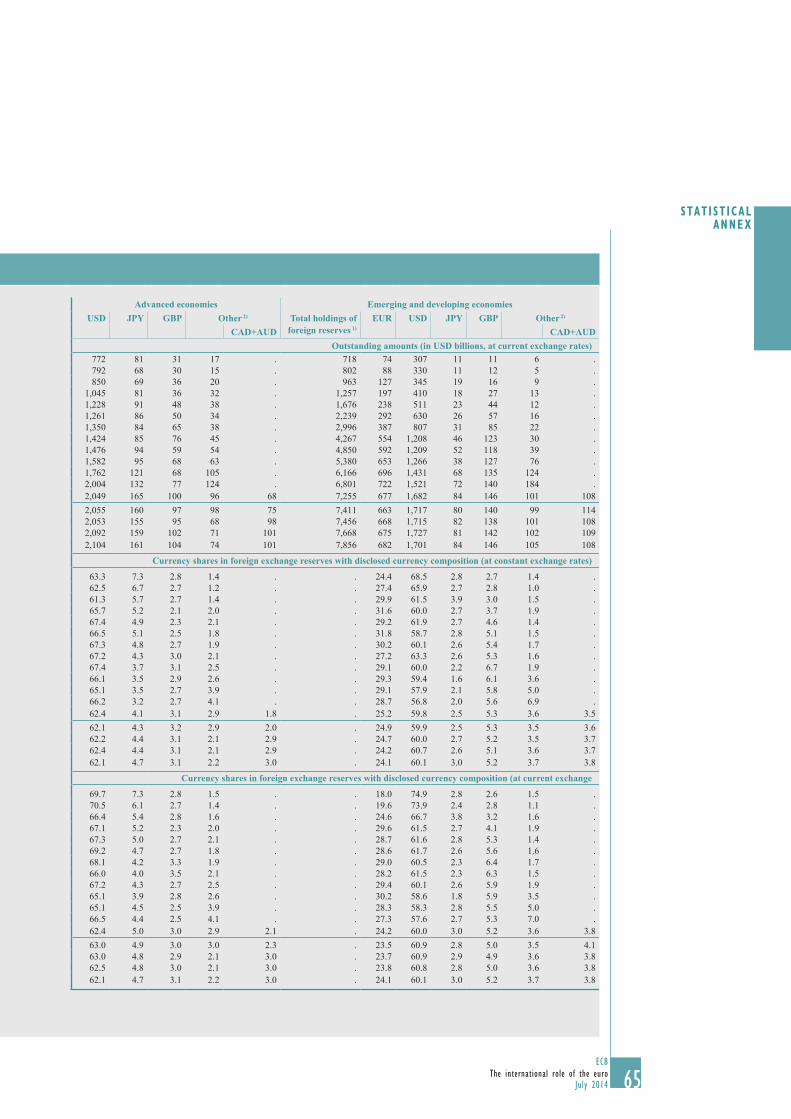
65ECB
The international role of the euroJuly 2014 65
STAT IST ICALANNEX
Table A1 global holdings of foreign exchange reserves
All countries Advanced economies Advanced economies Emerging and developing economiesTotal holdings of
foreign reserves 1)EUR USD JPY GBP Other 2) Total holdings of
foreign reserves 1)EUR USD JPY GBP Other 2) Total holdings of
foreign reserves 1)EUR USD JPY GBP Other 2)
CAD+AUD CAD+AUD CAD+AUDOutstanding amounts (in USD billions, at current exchange rates) Outstanding amounts (in USD billions, at current exchange rates)2000 1,936 278 1,080 92 42 23 . 1,218 204 772 81 31 17 . 718 74 307 11 11 6 .2001 2,049 301 1,122 79 42 21 . 1,248 213 792 68 30 15 . 802 88 330 11 12 5 .2002 2,408 425 1,194 89 52 28 . 1,444 297 850 69 36 20 . 963 127 345 19 16 9 .2003 3,025 556 1,455 98 64 45 . 1,768 359 1,045 81 36 32 . 1,257 197 410 18 27 13 .2004 3,748 655 1,739 114 93 50 . 2,072 417 1,228 91 48 38 . 1,676 238 511 23 44 12 .2005 4,320 679 1,891 113 107 50 . 2,081 387 1,261 86 50 34 . 2,239 292 630 26 57 16 .2006 5,253 827 2,158 115 150 60 . 2,257 440 1,350 84 65 38 . 2,996 387 807 31 85 22 .2007 6,704 1,076 2,631 131 199 76 . 2,438 522 1,424 85 76 45 . 4,267 554 1,208 46 123 30 .2008 7,346 1,104 2,685 146 178 93 . 2,496 511 1,476 94 59 54 . 4,850 592 1,209 52 118 39 .2009 8,165 1,270 2,848 133 195 139 . 2,785 616 1,582 95 68 63 . 5,380 653 1,266 38 127 76 .2010 9,265 1,343 3,193 189 203 229 . 3,099 647 1,762 121 68 105 . 6,166 696 1,431 68 135 124 .2011 10,206 1,394 3,525 204 217 308 . 3,404 672 2,004 132 77 124 . 6,801 722 1,521 72 140 184 .2012 10,952 1,474 3,731 249 246 197 175 3,698 797 2,049 165 100 96 68 7,255 677 1,682 84 146 101 1082013 Q1 11,090 1,435 3,772 240 237 197 190 3,679 772 2,055 160 97 98 75 7,411 663 1,717 80 140 99 114
Q2 11,132 1,451 3,768 237 233 168 206 3,676 783 2,053 155 95 68 98 7,456 668 1,715 82 138 101 108 Q3 11,439 1,492 3,819 240 244 173 209 3,771 817 2,092 159 102 71 101 7,668 675 1,727 81 142 102 109 Q4 11,674 1,521 3,806 245 249 179 209 3,817 839 2,104 161 104 74 101 7,856 682 1,701 84 146 105 108
Currency shares in foreign exchange reserves with disclosed currency composition (at constant exchange rates) Currency shares in foreign exchange reserves with disclosed currency composition (at constant exchange rates)
2000 . 24.7 64.7 6.0 2.8 1.4 . . 24.8 63.3 7.3 2.8 1.4 . . 24.4 68.5 2.8 2.7 1.4 .2001 . 26.6 63.5 5.6 2.7 1.2 . . 26.3 62.5 6.7 2.7 1.2 . . 27.4 65.9 2.7 2.8 1.0 .2002 . 28.7 61.3 5.2 2.8 1.5 . . 28.2 61.3 5.7 2.7 1.4 . . 29.9 61.5 3.9 3.0 1.5 .2003 . 26.7 64.0 4.4 2.6 2.0 . . 24.7 65.7 5.2 2.1 2.0 . . 31.6 60.0 2.7 3.7 1.9 .2004 . 25.0 65.7 4.2 3.0 1.9 . . 23.2 67.4 4.9 2.3 2.1 . . 29.2 61.9 2.7 4.6 1.4 .2005 . 26.7 63.7 4.3 3.4 1.7 . . 23.8 66.5 5.1 2.5 1.8 . . 31.8 58.7 2.8 5.1 1.5 .2006 . 25.9 64.4 3.9 3.8 1.8 . . 23.0 67.3 4.8 2.7 1.9 . . 30.2 60.1 2.6 5.4 1.7 .2007 . 25.0 65.3 3.5 4.1 1.9 . . 23.1 67.2 4.3 3.0 2.1 . . 27.2 63.3 2.6 5.3 1.6 .2008 . 26.0 63.9 3.0 4.8 2.2 . . 23.1 67.4 3.7 3.1 2.5 . . 29.1 60.0 2.2 6.7 1.9 .2009 . 26.9 62.9 2.6 4.4 3.1 . . 24.7 66.1 3.5 2.9 2.6 . . 29.3 59.4 1.6 6.1 3.6 .2010 . 26.8 61.7 2.8 4.2 4.4 . . 24.7 65.1 3.5 2.7 3.9 . . 29.1 57.9 2.1 5.8 5.0 .2011 . 26.0 61.8 2.6 4.1 5.4 . . 23.7 66.2 3.2 2.7 4.1 . . 28.7 56.8 2.0 5.6 6.9 .2012 . 25.3 61.2 3.3 4.1 3.2 2.6 . 25.4 62.4 4.1 3.1 2.9 1.8 . 25.2 59.8 2.5 5.3 3.6 3.52013 Q1 . 25.0 61.1 3.5 4.2 3.2 2.8 . 25.1 62.1 4.3 3.2 2.9 2.0 . 24.9 59.9 2.5 5.3 3.5 3.6
Q2 . 24.8 61.2 3.6 4.1 2.7 3.3 . 25.0 62.2 4.4 3.1 2.1 2.9 . 24.7 60.0 2.7 5.2 3.5 3.7 Q3 . 24.6 61.6 3.6 4.0 2.8 3.3 . 24.9 62.4 4.4 3.1 2.1 2.9 . 24.2 60.7 2.6 5.1 3.6 3.7 Q4 . 24.4 61.2 3.9 4.0 2.9 3.4 . 24.8 62.1 4.7 3.1 2.2 3.0 . 24.1 60.1 3.0 5.2 3.7 3.8
Currency shares in foreign exchange reserves with disclosed currency composition (at current exchange rates) Currency shares in foreign exchange reserves with disclosed currency composition (at current exchange
2000 . 18.3 71.1 6.1 2.8 1.5 . . 18.4 69.7 7.3 2.8 1.5 . . 18.0 74.9 2.8 2.6 1.5 .2001 . 19.2 71.5 5.0 2.7 1.3 . . 19.0 70.5 6.1 2.7 1.4 . . 19.6 73.9 2.4 2.8 1.1 .2002 . 23.7 66.5 4.9 2.9 1.6 . . 23.3 66.4 5.4 2.8 1.6 . . 24.6 66.7 3.8 3.2 1.6 .2003 . 25.0 65.4 4.4 2.9 2.0 . . 23.1 67.1 5.2 2.3 2.0 . . 29.6 61.5 2.7 4.1 1.9 .2004 . 24.7 65.5 4.3 3.5 1.9 . . 22.9 67.3 5.0 2.7 2.1 . . 28.7 61.6 2.8 5.3 1.4 .2005 . 23.9 66.5 4.0 3.7 1.7 . . 21.2 69.2 4.7 2.7 1.8 . . 28.6 61.7 2.6 5.6 1.6 .2006 . 25.0 65.1 3.5 4.5 1.8 . . 22.2 68.1 4.2 3.3 1.9 . . 29.0 60.5 2.3 6.4 1.7 .2007 . 26.1 63.9 3.2 4.8 1.8 . . 24.2 66.0 4.0 3.5 2.1 . . 28.2 61.5 2.3 6.3 1.5 .2008 . 26.2 63.8 3.5 4.2 2.2 . . 23.3 67.2 4.3 2.7 2.5 . . 29.4 60.1 2.6 5.9 1.9 .2009 . 27.7 62.0 2.9 4.2 3.0 . . 25.4 65.1 3.9 2.8 2.6 . . 30.2 58.6 1.8 5.9 3.5 .2010 . 26.0 61.8 3.7 3.9 4.4 . . 23.9 65.1 4.5 2.5 3.9 . . 28.3 58.3 2.8 5.5 5.0 .2011 . 24.7 62.4 3.6 3.8 5.5 . . 22.3 66.5 4.4 2.5 4.1 . . 27.3 57.6 2.7 5.3 7.0 .2012 . 24.2 61.3 4.1 4.0 3.2 2.9 . 24.3 62.4 5.0 3.0 2.9 2.1 . 24.2 60.0 3.0 5.2 3.6 3.82013 Q1 . 23.6 62.0 3.9 3.9 3.2 3.1 . 23.6 63.0 4.9 3.0 3.0 2.3 . 23.5 60.9 2.8 5.0 3.5 4.1
Q2 . 23.9 62.0 3.9 3.8 2.8 3.4 . 24.0 63.0 4.8 2.9 2.1 3.0 . 23.7 60.9 2.9 4.9 3.6 3.8 Q3 . 24.1 61.7 3.9 3.9 2.8 3.4 . 24.4 62.5 4.8 3.0 2.1 3.0 . 23.8 60.8 2.8 5.0 3.6 3.8 Q4 . 24.4 61.2 3.9 4.0 2.9 3.4 . 24.8 62.1 4.7 3.1 2.2 3.0 . 24.1 60.1 3.0 5.2 3.7 3.8
Sources: IMF and ECB calculations.1) The total includes unallocated reserves, i.e. reserves with undisclosed currency composition, as well as allocated reserves with disclosed currency composition.2) The category “other” also excludes CHF.

66ECBThe international role of the euroJuly 20146666
Table A2 currency composition of foreign exchange reserves for selected countries
(share of the euro in total foreign exchange reserve holdings; percentages; at current exchange rates)
2008 2009 2010 2011 2012 2013
Non-euro area EU Member States 61.3 63.7 61.1 60.9 58.0 55.6Bulgaria 99.1 99.1 99.6 99.9 99.9 100.0Croatia 76.6 71.7 73.7 75.9 80.3 68.7Czech Republic 62.6 61.3 57.4 60.1 58.7 69.7Lithuania 97.3 96.9 98.9 94.9 83.4 79.1Poland 33.7 36.7 35.0 30.4 30.9 30.7Romania 63.2 65.2 67.2 77.8 73.0 65.9Sweden 48.5 48.1 50.0 37.0 37.1 37.0United Kingdom 41.4 65.5 59.9 59.1 60.4 43.0
Candidate and potential candidate countriesTurkey 46.0 44.6 46.5 40.3 27.3 n.a.
Other industrial countriesCanada 40.4 41.9 40.0 37.0 34.9 31.9Norway 48.3 47.2 36.4 36.1 35.9 36.5Russia 40.0 33.2 43.1 42.1 40.4 41.0Switzerland 47.9 55.6 54.9 57.0 50.1 49.2United States 53.7 54.0 54.2 53.5 57.0 62.8
Latin American countriesChile 37.3 34.8 35.2 35.5 20.3 19.6Peru 14.9 17.4 16.8 38.0 30.0 30.0
Sources: National central banks and ECB calculations.Notes: Calculations are in general based on the international reserve and foreign currency liquidity statistics. Figures for Sweden and Poland up to 2010 refer to currency benchmarks as published in the annual reports of the central banks of these countries. Figures for Bulgaria and Serbia refer to currency compositions as published in the annual reports of the central banks of these countries. Figures for the United Kingdom refer to combined currency shares for the Bank of England and the UK government (including other foreign currency assets such as claims vis-à-vis residents). Data for the United States refer to combined currency shares for the Open Market Account (SOMA) at the Federal Reserve and the US Treasury Exchange Stabilization Fund (ESF); reciprocal currency arrangements are not included. In the case of Norway, currency shares refer to the fixed income part of Norges Bank’s foreign exchange reserve investment portfolio, while the currency composition is taken from quarterly reports. Data for Chile refer to the combined currency shares in the liquidity and the investment portfolio of the Central Bank of Chile. In the case of Peru, the share of the euro refers to reserve assets denominated in currencies other than the US dollar. According to the Central Reserve Bank of Peru, these are mostly euro-denominated assets. Latest data for Russia is for June 2013.

67ECB
The international role of the euroJuly 2014 67
STAT IST ICALANNEX
67
Table A3 countries and territories with exchange rate regimes linked to the euro
(as at end-May 2014)
Region Exchange rate regimes Countries
EU (non-euro area) ERM II Denmark, Lithuania Euro-based currency boards Managed floating regime with the euro as reference currency and an inflation target
Bulgaria Croatia, Czech Republic, Romania
Pro memoria: Free-floating regime with an inflation target
Hungary, Poland, Sweden, United Kingdom
EU acceding, candidate and potential candidate countries
Unilateral euroisation (no separate legal tender) Kosovo, Montenegro Euro-based currency boards Bosnia and Herzegovina Stabilised arrangement with euro as a reference currency
Former Yugoslav Republic of Macedonia
Pro memoria: Free-floating regime with an inflation target
Albania, Iceland, Serbia, Turkey
Others Euroisation European microstates, some French overseas collectivities
Pegs based on the euro CFA franc zone, CFP franc zone, Cape Verde, Comoros, São Tomé e Príncipe
Other arrangements using the euro as a reference currency
Switzerland
Crawling peg involving the euro Botswana Pegs and managed floats based on the SDR and other currency baskets involving the euro (share of the euro)
Algeria, Belarus, Fiji, Iran, Kuwait, Libya, Morocco (80%), Russian Federation (45%), Samoa, Singapore, Syria, Tunisia, Vanuatu
Sources: National central banks, IMF and ECB.Notes: Croatia: Managed floating regime with no preannounced path for the exchange rate.Denmark: Participates in ERM II with a +/-2.25% fluctuation band.Lithuania: Participates in ERM II with a +/-15% fluctuation band. Lithuania continues with its currency board arrangement as a unilateralcommitment.Bulgaria: Maintains a fixed exchange rate to the euro within the framework of a currency board arrangement.European microstates: Republic of San Marino, Vatican City, Principality of Monaco and Andorra. The other countries and jurisdictions are entitled to use the euro as their official currency. Liechtenstein uses the Swiss franc as its official currency.Saint Barthelémy, Saint Martin and Saint-Pierre and Miquelon are French overseas collectivities but use the euro as their official currency.CFA franc zone: WAEMU (Benin, Burkina Faso, Côte d’Ivoire, Guinea-Bissau, Mali, Niger, Senegal, Togo) and CEMAC (Cameroon, Central African Republic, Chad, Republic of Congo, Equatorial Guinea and Gabon).CFP franc zone: New Caledonia and the French overseas collectivities of French Polynesia and Wallis and Futuna.Switzerland: On 6 September 2011 the Swiss National Bank issued a statement establishing a minimum exchange rate for the euro of CHF 1.20 per euro. As stated in the Swiss National Bank’s annual report for 2011, the Swiss National Bank would “enforce this minimum rate with the utmost determination and was prepared to buy foreign currency in unlimited quantities.”Algeria: Managed floating regime with no preannounced path for the exchange rate.Belarus: The currency was pegged to a basket comprising the euro, the US dollar and the Russian rouble at the beginning of 2009, with afluctuation margin of 10%. In April 2011 the Belarussian rouble lost more than a third of its value against the US dollar after the central bank introduced a free floating exchange rate for trade between banks.Botswana: Weighted basket of currencies comprising the SDR and the South African rand (crawling peg since 2005).Fiji: The currency was pegged to a basket of international currencies in May 2007.Iran: Maintains de jure a managed floating arrangement against a basket of currencies including the euro, the US dollar and the Japanese yen.Kuwait: The currency was pegged to a basket of international currencies in May 2007.Libya: The rate of exchange is established using a basket of SDR currencies with a fluctuation margin of 25%.Morocco: Bi-currency basket comprising the euro (80%) and the US dollar (20%).Russian Federation: Trade-weighted currency basket for monitoring and setting ceilings for real appreciation (combined share of euro and eurolinked currencies of around 60%); since February 2005 US dollar-euro basket for daily exchange rate management (since February 2007 the euro’s share has been 45%). The Bank of Russia does not target a specific exchange rate level against the currency basket.Samoa: The central bank maintains an exchange rate peg based on a basket comprising the currencies of Samoa’s six main trading partners and countries that represent primary sources of tourism revenue, namely New Zealand, Australia, the United States and the euro area. The exchange rate can fluctuate within +/- 2% band.Singapore: Since 1981 a managed floating regime against an undisclosed basket of currencies maintained within an undisclosed target band.Syria: In August 2007, the authorities changed the de facto exchange rate regime from a peg to the US dollar to an SDR basket within a relatively wide fluctuation margin.Tunisia: The de facto exchange rate regime is a conventional peg to an undisclosed basket of currencies.Vanuatu: Weighted basket comprising (undisclosed) currencies of Vanuatu’s major trading partners.
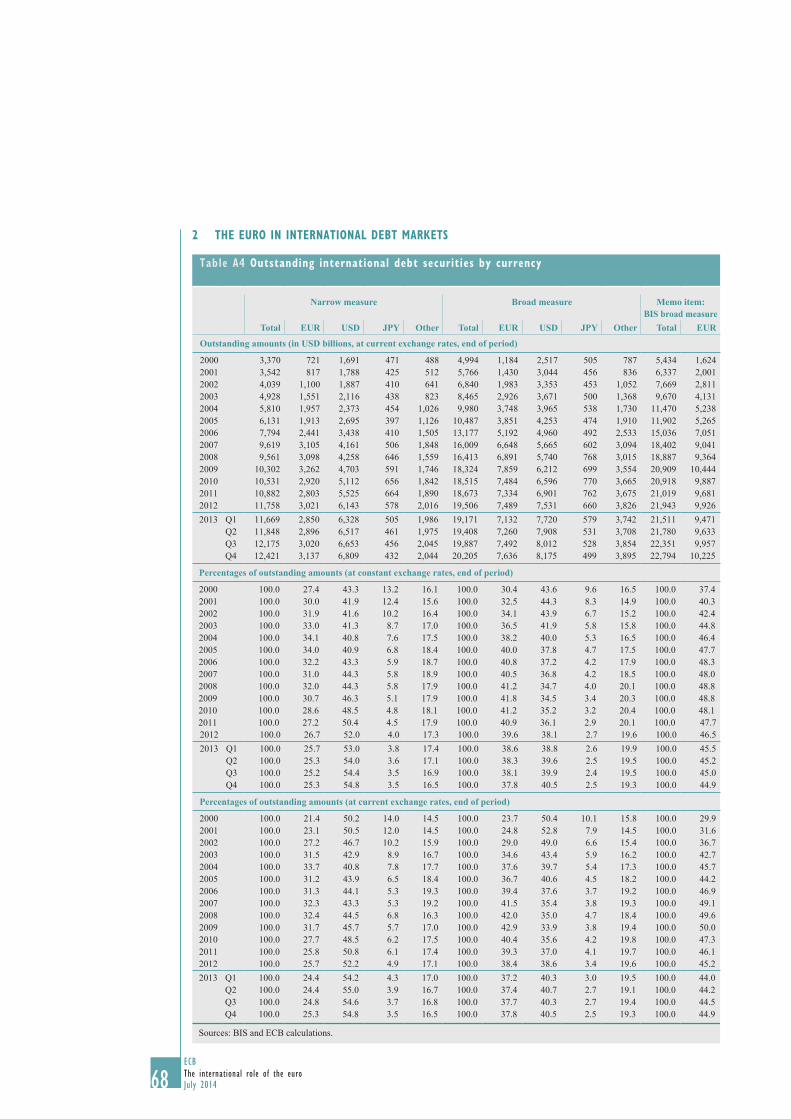
68ECBThe international role of the euroJuly 20146868
2 THE EURO IN INTERNATIONAL dEbT MARkETs
Table A4 Outstanding international debt securities by currency
Narrow measure Broad measure Memo item: BIS broad measure
Total EUR USD JPY Other Total EUR USD JPY Other Total EUR
Outstanding amounts (in USD billions, at current exchange rates, end of period)
2000 3,370 721 1,691 471 488 4,994 1,184 2,517 505 787 5,434 1,624 2001 3,542 817 1,788 425 512 5,766 1,430 3,044 456 836 6,337 2,001 2002 4,039 1,100 1,887 410 641 6,840 1,983 3,353 453 1,052 7,669 2,811 2003 4,928 1,551 2,116 438 823 8,465 2,926 3,671 500 1,368 9,670 4,131 2004 5,810 1,957 2,373 454 1,026 9,980 3,748 3,965 538 1,730 11,470 5,238 2005 6,131 1,913 2,695 397 1,126 10,487 3,851 4,253 474 1,910 11,902 5,265 2006 7,794 2,441 3,438 410 1,505 13,177 5,192 4,960 492 2,533 15,036 7,051 2007 9,619 3,105 4,161 506 1,848 16,009 6,648 5,665 602 3,094 18,402 9,041 2008 9,561 3,098 4,258 646 1,559 16,413 6,891 5,740 768 3,015 18,887 9,364 2009 10,302 3,262 4,703 591 1,746 18,324 7,859 6,212 699 3,554 20,909 10,444 2010 10,531 2,920 5,112 656 1,842 18,515 7,484 6,596 770 3,665 20,918 9,887 2011 10,882 2,803 5,525 664 1,890 18,673 7,334 6,901 762 3,675 21,019 9,681 2012 11,758 3,021 6,143 578 2,016 19,506 7,489 7,531 660 3,826 21,943 9,926 2013 Q1 11,669 2,850 6,328 505 1,986 19,171 7,132 7,720 579 3,742 21,511 9,471
Q2 11,848 2,896 6,517 461 1,975 19,408 7,260 7,908 531 3,708 21,780 9,633 Q3 12,175 3,020 6,653 456 2,045 19,887 7,492 8,012 528 3,854 22,351 9,957 Q4 12,421 3,137 6,809 432 2,044 20,205 7,636 8,175 499 3,895 22,794 10,225
Percentages of outstanding amounts (at constant exchange rates, end of period)
2000 100.0 27.4 43.3 13.2 16.1 100.0 30.4 43.6 9.6 16.5 100.0 37.4 2001 100.0 30.0 41.9 12.4 15.6 100.0 32.5 44.3 8.3 14.9 100.0 40.3 2002 100.0 31.9 41.6 10.2 16.4 100.0 34.1 43.9 6.7 15.2 100.0 42.4 2003 100.0 33.0 41.3 8.7 17.0 100.0 36.5 41.9 5.8 15.8 100.0 44.8 2004 100.0 34.1 40.8 7.6 17.5 100.0 38.2 40.0 5.3 16.5 100.0 46.4 2005 100.0 34.0 40.9 6.8 18.4 100.0 40.0 37.8 4.7 17.5 100.0 47.7 2006 100.0 32.2 43.3 5.9 18.7 100.0 40.8 37.2 4.2 17.9 100.0 48.3 2007 100.0 31.0 44.3 5.8 18.9 100.0 40.5 36.8 4.2 18.5 100.0 48.0 2008 100.0 32.0 44.3 5.8 17.9 100.0 41.2 34.7 4.0 20.1 100.0 48.8 2009 100.0 30.7 46.3 5.1 17.9 100.0 41.8 34.5 3.4 20.3 100.0 48.8 2010 100.0 28.6 48.5 4.8 18.1 100.0 41.2 35.2 3.2 20.4 100.0 48.1 2011 100.0 27.2 50.4 4.5 17.9 100.0 40.9 36.1 2.9 20.1 100.0 47.7 2012 100.0 26.7 52.0 4.0 17.3 100.0 39.6 38.1 2.7 19.6 100.0 46.5 2013 Q1 100.0 25.7 53.0 3.8 17.4 100.0 38.6 38.8 2.6 19.9 100.0 45.5
Q2 100.0 25.3 54.0 3.6 17.1 100.0 38.3 39.6 2.5 19.5 100.0 45.2 Q3 100.0 25.2 54.4 3.5 16.9 100.0 38.1 39.9 2.4 19.5 100.0 45.0 Q4 100.0 25.3 54.8 3.5 16.5 100.0 37.8 40.5 2.5 19.3 100.0 44.9
Percentages of outstanding amounts (at current exchange rates, end of period)
2000 100.0 21.4 50.2 14.0 14.5 100.0 23.7 50.4 10.1 15.8 100.0 29.9 2001 100.0 23.1 50.5 12.0 14.5 100.0 24.8 52.8 7.9 14.5 100.0 31.6 2002 100.0 27.2 46.7 10.2 15.9 100.0 29.0 49.0 6.6 15.4 100.0 36.7 2003 100.0 31.5 42.9 8.9 16.7 100.0 34.6 43.4 5.9 16.2 100.0 42.7 2004 100.0 33.7 40.8 7.8 17.7 100.0 37.6 39.7 5.4 17.3 100.0 45.7 2005 100.0 31.2 43.9 6.5 18.4 100.0 36.7 40.6 4.5 18.2 100.0 44.2 2006 100.0 31.3 44.1 5.3 19.3 100.0 39.4 37.6 3.7 19.2 100.0 46.9 2007 100.0 32.3 43.3 5.3 19.2 100.0 41.5 35.4 3.8 19.3 100.0 49.1 2008 100.0 32.4 44.5 6.8 16.3 100.0 42.0 35.0 4.7 18.4 100.0 49.6 2009 100.0 31.7 45.7 5.7 17.0 100.0 42.9 33.9 3.8 19.4 100.0 50.0 2010 100.0 27.7 48.5 6.2 17.5 100.0 40.4 35.6 4.2 19.8 100.0 47.3 2011 100.0 25.8 50.8 6.1 17.4 100.0 39.3 37.0 4.1 19.7 100.0 46.1 2012 100.0 25.7 52.2 4.9 17.1 100.0 38.4 38.6 3.4 19.6 100.0 45.2 2013 Q1 100.0 24.4 54.2 4.3 17.0 100.0 37.2 40.3 3.0 19.5 100.0 44.0
Q2 100.0 24.4 55.0 3.9 16.7 100.0 37.4 40.7 2.7 19.1 100.0 44.2 Q3 100.0 24.8 54.6 3.7 16.8 100.0 37.7 40.3 2.7 19.4 100.0 44.5 Q4 100.0 25.3 54.8 3.5 16.5 100.0 37.8 40.5 2.5 19.3 100.0 44.9
Sources: BIS and ECB calculations.

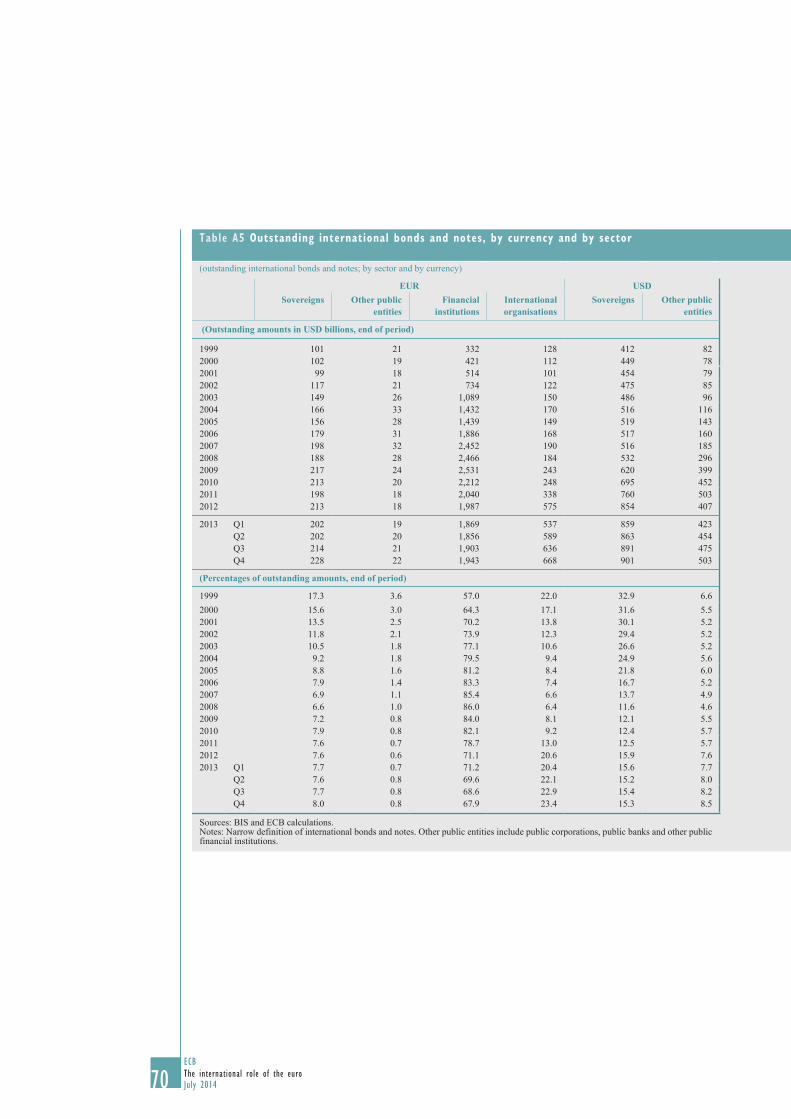
70ECBThe international role of the euroJuly 20147070
Table A5 Outstanding international bonds and notes, by currency and by sector
(outstanding international bonds and notes; by sector and by currency)
EUR USD USD JPYSovereigns Other public
entitiesFinancial
institutions International organisations
Sovereigns Other public entities
Financial institutions
International organisations
Sovereigns Other public entities
Financial institutions
International organisations
(Outstanding amounts in USD billions, end of period) (Outstanding amounts in USD billions, end of period)
1999 101 21 332 128 412 82 639 117 100 24 300 402000 102 19 421 112 449 78 762 134 86 20 291 322001 99 18 514 101 454 79 821 154 69 14 276 272002 117 21 734 122 475 85 892 168 68 15 267 302003 149 26 1,089 150 486 96 1,065 179 69 17 294 352004 166 33 1,432 170 516 116 1,257 184 62 16 321 352005 156 28 1,439 149 519 143 1,534 188 45 14 288 322006 179 31 1,886 168 517 160 2,229 186 39 14 309 312007 198 32 2,452 190 516 185 2,871 197 36 18 399 352008 188 28 2,466 184 532 296 2,878 228 42 31 509 452009 217 24 2,531 243 620 399 3,046 280 38 37 453 442010 213 20 2,212 248 695 452 3,239 322 45 42 498 492011 198 18 2,040 338 760 503 3,429 356 47 40 505 512012 213 18 1,987 575 854 407 3,726 392 42 31 436 44
2013 Q1 202 19 1,869 537 859 423 3,829 412 40 27 379 38Q2 202 20 1,856 589 863 454 3,921 424 37 27 342 35Q3 214 21 1,903 636 891 475 3,986 428 38 27 339 34Q4 228 22 1,943 668 901 503 4,067 431 35 26 321 31
(Percentages of outstanding amounts, end of period) (Percentages of outstanding amounts, end of period)
1999 17.3 3.6 57.0 22.0 32.9 6.6 51.1 9.4 21.5 5.1 64.7 8.72000 15.6 3.0 64.3 17.1 31.6 5.5 53.6 9.4 20.1 4.7 67.7 7.52001 13.5 2.5 70.2 13.8 30.1 5.2 54.4 10.2 17.9 3.6 71.5 7.02002 11.8 2.1 73.9 12.3 29.4 5.2 55.1 10.4 18.0 3.9 70.2 7.92003 10.5 1.8 77.1 10.6 26.6 5.2 58.3 9.8 16.7 4.0 70.9 8.42004 9.2 1.8 79.5 9.4 24.9 5.6 60.6 8.9 14.2 3.7 74.0 8.12005 8.8 1.6 81.2 8.4 21.8 6.0 64.4 7.9 11.9 3.7 75.9 8.42006 7.9 1.4 83.3 7.4 16.7 5.2 72.1 6.0 10.0 3.5 78.6 7.92007 6.9 1.1 85.4 6.6 13.7 4.9 76.2 5.2 7.4 3.6 81.8 7.22008 6.6 1.0 86.0 6.4 11.6 4.6 62.8 5.0 5.9 3.6 72.0 6.42009 7.2 0.8 84.0 8.1 12.1 5.5 59.5 5.5 5.8 4.7 70.1 6.82010 7.9 0.8 82.1 9.2 12.4 5.7 57.8 5.8 6.3 4.9 69.4 6.82011 7.6 0.7 78.7 13.0 12.5 5.7 56.4 5.9 6.5 4.8 69.6 7.12012 7.6 0.6 71.1 20.6 15.9 7.6 69.3 7.3 7.6 5.5 78.9 7.92013 Q1 7.7 0.7 71.2 20.4 15.6 7.7 69.3 7.5 8.2 5.6 78.3 7.9
Q2 7.6 0.8 69.6 22.1 15.2 8.0 69.3 7.5 8.3 6.1 77.7 8.0Q3 7.7 0.8 68.6 22.9 15.4 8.2 69.0 7.4 8.6 6.1 77.5 7.8Q4 8.0 0.8 67.9 23.4 15.3 8.5 68.9 7.3 8.6 6.4 77.7 7.4
Sources: BIS and ECB calculations.Notes: Narrow definition of international bonds and notes. Other public entities include public corporations, public banks and other public financial institutions.

71ECB
The international role of the euroJuly 2014 71
STAT IST ICALANNEX
71
Table A5 Outstanding international bonds and notes, by currency and by sector
(outstanding international bonds and notes; by sector and by currency)
EUR USD USD JPYSovereigns Other public
entitiesFinancial
institutions International organisations
Sovereigns Other public entities
Financial institutions
International organisations
Sovereigns Other public entities
Financial institutions
International organisations
(Outstanding amounts in USD billions, end of period) (Outstanding amounts in USD billions, end of period)
1999 101 21 332 128 412 82 639 117 100 24 300 402000 102 19 421 112 449 78 762 134 86 20 291 322001 99 18 514 101 454 79 821 154 69 14 276 272002 117 21 734 122 475 85 892 168 68 15 267 302003 149 26 1,089 150 486 96 1,065 179 69 17 294 352004 166 33 1,432 170 516 116 1,257 184 62 16 321 352005 156 28 1,439 149 519 143 1,534 188 45 14 288 322006 179 31 1,886 168 517 160 2,229 186 39 14 309 312007 198 32 2,452 190 516 185 2,871 197 36 18 399 352008 188 28 2,466 184 532 296 2,878 228 42 31 509 452009 217 24 2,531 243 620 399 3,046 280 38 37 453 442010 213 20 2,212 248 695 452 3,239 322 45 42 498 492011 198 18 2,040 338 760 503 3,429 356 47 40 505 512012 213 18 1,987 575 854 407 3,726 392 42 31 436 44
2013 Q1 202 19 1,869 537 859 423 3,829 412 40 27 379 38Q2 202 20 1,856 589 863 454 3,921 424 37 27 342 35Q3 214 21 1,903 636 891 475 3,986 428 38 27 339 34Q4 228 22 1,943 668 901 503 4,067 431 35 26 321 31
(Percentages of outstanding amounts, end of period) (Percentages of outstanding amounts, end of period)
1999 17.3 3.6 57.0 22.0 32.9 6.6 51.1 9.4 21.5 5.1 64.7 8.72000 15.6 3.0 64.3 17.1 31.6 5.5 53.6 9.4 20.1 4.7 67.7 7.52001 13.5 2.5 70.2 13.8 30.1 5.2 54.4 10.2 17.9 3.6 71.5 7.02002 11.8 2.1 73.9 12.3 29.4 5.2 55.1 10.4 18.0 3.9 70.2 7.92003 10.5 1.8 77.1 10.6 26.6 5.2 58.3 9.8 16.7 4.0 70.9 8.42004 9.2 1.8 79.5 9.4 24.9 5.6 60.6 8.9 14.2 3.7 74.0 8.12005 8.8 1.6 81.2 8.4 21.8 6.0 64.4 7.9 11.9 3.7 75.9 8.42006 7.9 1.4 83.3 7.4 16.7 5.2 72.1 6.0 10.0 3.5 78.6 7.92007 6.9 1.1 85.4 6.6 13.7 4.9 76.2 5.2 7.4 3.6 81.8 7.22008 6.6 1.0 86.0 6.4 11.6 4.6 62.8 5.0 5.9 3.6 72.0 6.42009 7.2 0.8 84.0 8.1 12.1 5.5 59.5 5.5 5.8 4.7 70.1 6.82010 7.9 0.8 82.1 9.2 12.4 5.7 57.8 5.8 6.3 4.9 69.4 6.82011 7.6 0.7 78.7 13.0 12.5 5.7 56.4 5.9 6.5 4.8 69.6 7.12012 7.6 0.6 71.1 20.6 15.9 7.6 69.3 7.3 7.6 5.5 78.9 7.92013 Q1 7.7 0.7 71.2 20.4 15.6 7.7 69.3 7.5 8.2 5.6 78.3 7.9
Q2 7.6 0.8 69.6 22.1 15.2 8.0 69.3 7.5 8.3 6.1 77.7 8.0Q3 7.7 0.8 68.6 22.9 15.4 8.2 69.0 7.4 8.6 6.1 77.5 7.8Q4 8.0 0.8 67.9 23.4 15.3 8.5 68.9 7.3 8.6 6.4 77.7 7.4
Sources: BIS and ECB calculations.Notes: Narrow definition of international bonds and notes. Other public entities include public corporations, public banks and other public financial institutions.
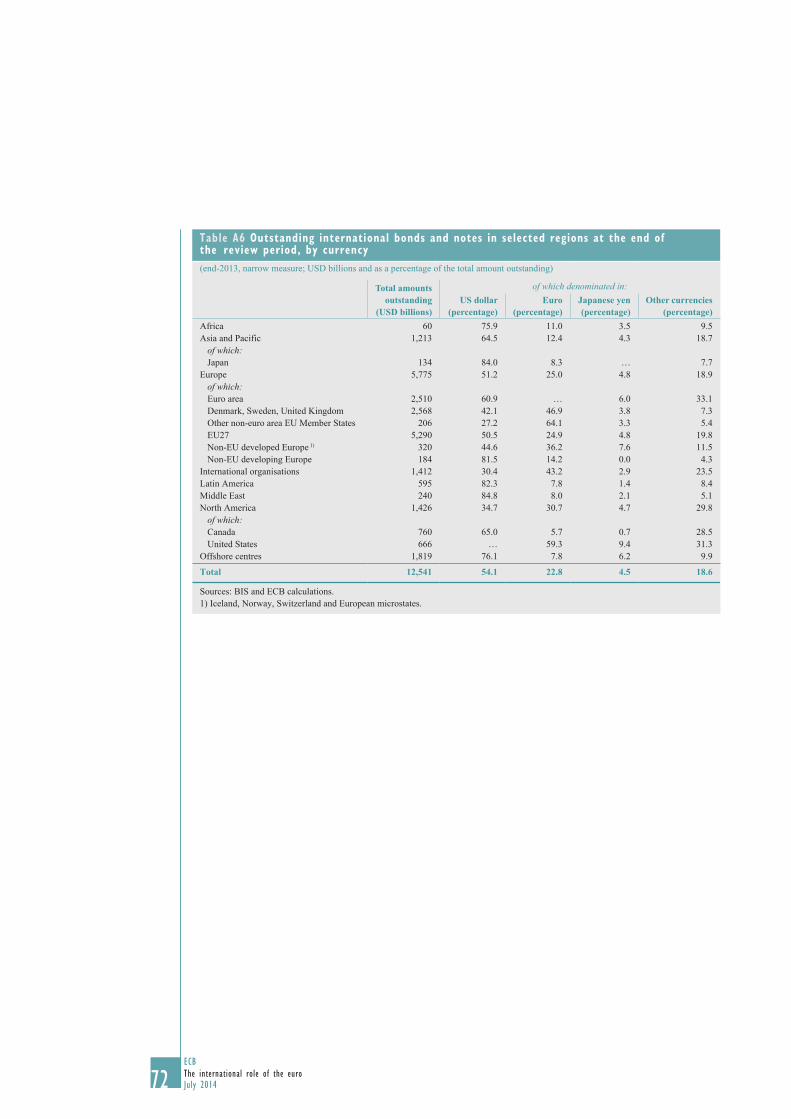
72ECBThe international role of the euroJuly 20147272
Table A6 Outstanding international bonds and notes in selected regions at the end of the review period, by currency (end-2013, narrow measure; USD billions and as a percentage of the total amount outstanding)
Total amounts outstanding
(USD billions)
of which denominated in: US dollar
(percentage)Euro
(percentage) Japanese yen
(percentage)Other currencies
(percentage)Africa 60 75.9 11.0 3.5 9.5 Asia and Pacific 1,213 64.5 12.4 4.3 18.7
of which: Japan 134 84.0 8.3 … 7.7
Europe 5,775 51.2 25.0 4.8 18.9 of which: Euro area 2,510 60.9 … 6.0 33.1 Denmark, Sweden, United Kingdom 2,568 42.1 46.9 3.8 7.3 Other non-euro area EU Member States 206 27.2 64.1 3.3 5.4 EU27 5,290 50.5 24.9 4.8 19.8Non-EU developed Europe 1) 320 44.6 36.2 7.6 11.5 Non-EU developing Europe 184 81.5 14.2 0.0 4.3
International organisations 1,412 30.4 43.2 2.9 23.5 Latin America 595 82.3 7.8 1.4 8.4 Middle East 240 84.8 8.0 2.1 5.1 North America 1,426 34.7 30.7 4.7 29.8
of which: Canada 760 65.0 5.7 0.7 28.5 United States 666 … 59.3 9.4 31.3
Offshore centres 1,819 76.1 7.8 6.2 9.9
Total 12,541 54.1 22.8 4.5 18.6
Sources: BIS and ECB calculations. 1) Iceland, Norway, Switzerland and European microstates.

73ECB
The international role of the euroJuly 2014 73
STAT IST ICALANNEX
73
Table A7 International dimensions of euro-denominated debt securities
(EUR billions; percentages)
Held by residents Held by non-residents Total
a) As at end-June 2013
Issued by residents 11,383 3,316 14,70067% 20% 87%
Issued by non-residents 1,456 765 2,2219% 5% 13%
Total 12,840 4,081 16,92176% 24% 100%
b) As at end-June 2012
Issued by residents 11,703 3,089 14,79268% 18% 87%
Issued by non-residents 1,486 814 2,3009% 5% 13%
Total 13,189 3,903 17,09177% 23% 100%
Source: ECB.
chart A1 debt securities issued by euro area countries, by holder
(percentages of total outstanding amounts; as at end-2012)
0
20
40
60
80
100
0
20
40
60
80
100
AT LU SI
holdings as reserve assets and by international organisationsother holders (non-reporters to IMF surveys)holders outside EU
other EU holdersother euro area holdersdomestic holders
DE ESSKPTNLMTITIEGREEFRFICYBE
Sources: ECB calculations, IMF (CPIS, SEFER and SSIO surveys) and national sources (national accounts and i.i.p. data).Notes: i.i.p. figures for Cyprus and the Netherlands include “special financial institutions”. Reserve assets and holdings by international organisations cannot be allocated to reporting countries, since the results of the IMF’s surveys on Securities Held as Foreign Exchange Reserves (SEFER) and Securities Held by International Organizations (SSIO) report figures only in aggregate form.
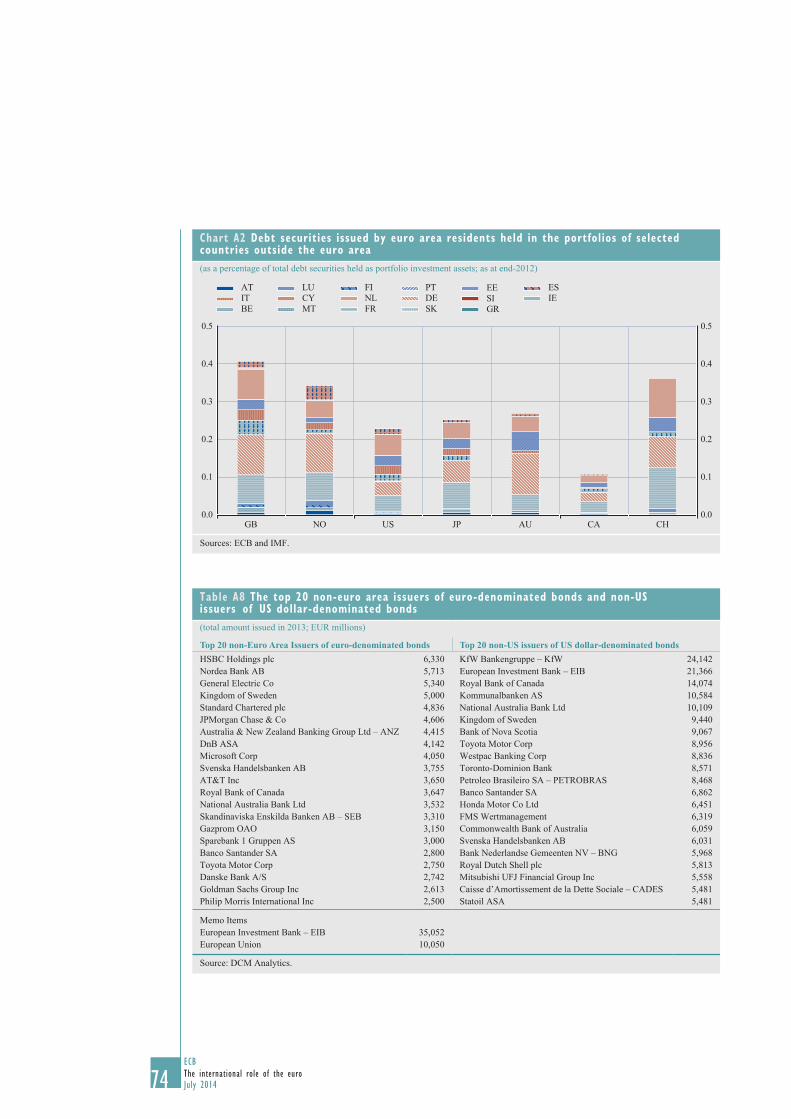
74ECBThe international role of the euroJuly 20147474
chart A2 debt securities issued by euro area residents held in the portfolios of selected countries outside the euro area(as a percentage of total debt securities held as portfolio investment assets; as at end-2012)
0.0
0.1
0.2
0.3
0.4
0.5
0.0
0.1
0.2
0.3
0.4
0.5
GB NO US JP AU CA CH
AT
BEIT CY
LU
MT
FI
FRNL DE
PT
SKIEESEE
GRSI
Sources: ECB and IMF.
Table A8 The top 20 non-euro area issuers of euro-denominated bonds and non-Us issuers of Us dollar-denominated bonds(total amount issued in 2013; EUR millions)
Top 20 non-Euro Area Issuers of euro-denominated bonds Top 20 non-US issuers of US dollar-denominated bondsHSBC Holdings plc 6,330 KfW Bankengruppe – KfW 24,142Nordea Bank AB 5,713 European Investment Bank – EIB 21,366General Electric Co 5,340 Royal Bank of Canada 14,074Kingdom of Sweden 5,000 Kommunalbanken AS 10,584Standard Chartered plc 4,836 National Australia Bank Ltd 10,109JPMorgan Chase & Co 4,606 Kingdom of Sweden 9,440Australia & New Zealand Banking Group Ltd – ANZ 4,415 Bank of Nova Scotia 9,067DnB ASA 4,142 Toyota Motor Corp 8,956Microsoft Corp 4,050 Westpac Banking Corp 8,836Svenska Handelsbanken AB 3,755 Toronto-Dominion Bank 8,571AT&T Inc 3,650 Petroleo Brasileiro SA – PETROBRAS 8,468Royal Bank of Canada 3,647 Banco Santander SA 6,862National Australia Bank Ltd 3,532 Honda Motor Co Ltd 6,451Skandinaviska Enskilda Banken AB – SEB 3,310 FMS Wertmanagement 6,319Gazprom OAO 3,150 Commonwealth Bank of Australia 6,059Sparebank 1 Gruppen AS 3,000 Svenska Handelsbanken AB 6,031Banco Santander SA 2,800 Bank Nederlandse Gemeenten NV – BNG 5,968Toyota Motor Corp 2,750 Royal Dutch Shell plc 5,813Danske Bank A/S 2,742 Mitsubishi UFJ Financial Group Inc 5,558Goldman Sachs Group Inc 2,613 Caisse d’Amortissement de la Dette Sociale – CADES 5,481Philip Morris International Inc 2,500 Statoil ASA 5,481
Memo ItemsEuropean Investment Bank – EIB 35,052European Union 10,050
Source: DCM Analytics.

75ECB
The international role of the euroJuly 2014 75
STAT IST ICALANNEX
75
3 THE EURO IN INTERNATIONAL LOAN ANd dEPOsIT MARkETs
Table A9 Outstanding international loans, by currency
All cross-border loans 1) Loans by banks outisde the euro area to borrowers outside the euro area 2)
Total EUR USD JPY Other Total EUR USD JPY Other
Outstanding amounts (in USD billions, at current exchange rates, end of period)
2001 2,029 296 1,266 83 385 392 51 201 46 952002 2,226 376 1,343 106 402 379 80 189 50 612003 2,685 514 1,551 117 504 422 111 237 44 302004 3,092 657 1,702 152 581 455 159 236 42 182005 3,433 632 2,010 118 672 552 145 296 58 542006 4,528 809 2,672 119 928 735 176 412 51 962007 5,677 1,170 3,131 182 1,193 1,114 306 697 73 392008 5,437 1,101 3,064 168 1,105 1,153 238 784 78 542009 5,155 972 2,964 110 1,109 1,185 221 810 49 1052010 5,583 1,029 3,218 125 1,212 1,242 214 863 52 1142011 5,881 1,110 3,336 195 1,239 1,443 244 935 65 1982012 6,090 1,193 3,436 165 1,297 1,535 221 983 54 2782013 6,048 1,106 3,441 191 1,310 1,542 219 1,068 62 193
2013 Q2 6,081 1,143 3,461 193 1,284 1,571 215 998 60 298Q3 6,063 1,134 3,431 198 1,301 1,543 218 1,025 68 233Q4 6,048 1,106 3,441 191 1,310 1,542 219 1,068 62 193
Percentages of outstanding amounts (at constant exchange rates, end of period)
2001 100.0 20.4 55.8 4.5 19.3 100.0 18.2 46.3 13.1 22.32002 100.0 20.7 56.2 5.0 18.1 100.0 25.4 45.8 13.7 15.22003 100.0 20.4 56.5 4.3 18.8 100.0 27.9 54.5 10.3 7.32004 100.0 21.6 55.1 4.8 18.5 100.0 35.3 51.7 9.0 4.02005 100.0 20.7 56.2 3.7 19.5 100.0 28.8 50.5 11.1 9.62006 100.0 18.6 58.5 3.0 19.9 100.0 24.5 54.9 7.7 12.92007 100.0 19.7 56.2 3.5 20.7 100.0 26.0 63.4 7.1 3.52008 100.0 20.0 56.1 2.7 21.3 100.0 20.6 68.5 5.9 5.02009 100.0 18.2 57.9 1.9 22.0 100.0 18.1 69.1 3.7 9.12010 100.0 18.9 57.3 1.7 22.0 100.0 17.8 69.7 3.2 9.32011 100.0 20.0 56.3 2.4 21.4 100.0 18.0 64.8 3.3 13.82012 100.0 20.4 56.1 2.2 21.4 100.0 15.0 64.0 2.9 18.12013 100.0 18.3 56.9 3.2 21.7 100.0 14.2 69.2 4.0 12.5
2013 Q2 100.0 19.5 56.1 3.0 21.4 100.0 14.3 63.1 3.6 19.0Q3 100.0 19.0 56.4 3.0 21.5 100.0 14.4 66.4 4.1 15.1Q4 100.0 18.3 56.9 3.2 21.7 100.0 14.2 69.2 4.0 12.5
Percentages of outstanding amounts (at current exchange rates, end of period)
2001 100.0 14.6 62.4 4.1 19.0 100.0 12.9 51.3 11.7 24.12002 100.0 16.9 60.3 4.7 18.0 100.0 21.0 49.8 13.1 16.02003 100.0 19.1 57.7 4.3 18.8 100.0 26.3 56.1 10.4 7.22004 100.0 21.3 55.0 4.9 18.8 100.0 35.0 51.9 9.2 3.92005 100.0 18.4 58.6 3.4 19.6 100.0 26.2 53.6 10.5 9.72006 100.0 17.9 59.0 2.6 20.5 100.0 23.9 56.0 6.9 13.12007 100.0 20.6 55.2 3.2 21.0 100.0 27.4 62.6 6.6 3.52008 100.0 20.2 56.3 3.1 20.3 100.0 20.6 68.0 6.7 4.62009 100.0 18.9 57.5 2.1 21.5 100.0 18.7 68.3 4.1 8.92010 100.0 18.4 57.6 2.2 21.7 100.0 17.2 69.5 4.2 9.12011 100.0 18.9 56.7 3.3 21.1 100.0 16.9 64.8 4.5 13.82012 100.0 19.6 56.4 2.7 21.3 100.0 14.4 64.0 3.5 18.12013 100.0 18.3 56.9 3.2 21.7 100.0 14.2 69.2 4.0 12.5
2013 Q2 100.0 18.8 56.9 3.2 21.1 100.0 13.7 63.5 3.8 19.0Q3 100.0 18.7 56.6 3.3 21.5 100.0 14.1 66.4 4.4 15.1Q4 100.0 18.3 56.9 3.2 21.7 100.0 14.2 69.2 4.0 12.5
Sources: BIS and ECB calculations.Note: Excluding interbank loans.1) Including loans to/from Japan, Switzerland, the United Kingdom and the United States in their domestic currency.2) Excluding loans to/from Japan, Switzerland, the United Kingdom and the United States in their domestic currency.
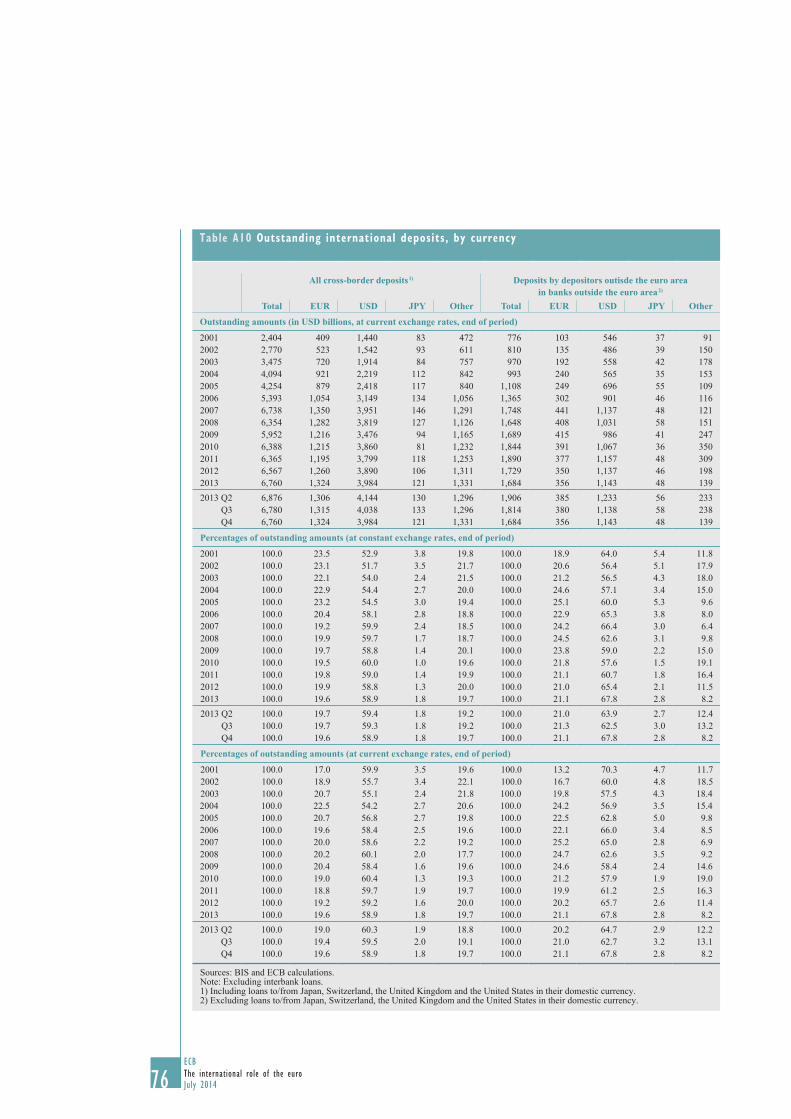
76ECBThe international role of the euroJuly 20147676
Table A10 Outstanding international deposits, by currency
All cross-border deposits 1) Deposits by depositors outisde the euro area in banks outside the euro area 2)
Total EUR USD JPY Other Total EUR USD JPY Other
Outstanding amounts (in USD billions, at current exchange rates, end of period)
2001 2,404 409 1,440 83 472 776 103 546 37 912002 2,770 523 1,542 93 611 810 135 486 39 1502003 3,475 720 1,914 84 757 970 192 558 42 1782004 4,094 921 2,219 112 842 993 240 565 35 1532005 4,254 879 2,418 117 840 1,108 249 696 55 1092006 5,393 1,054 3,149 134 1,056 1,365 302 901 46 1162007 6,738 1,350 3,951 146 1,291 1,748 441 1,137 48 1212008 6,354 1,282 3,819 127 1,126 1,648 408 1,031 58 1512009 5,952 1,216 3,476 94 1,165 1,689 415 986 41 2472010 6,388 1,215 3,860 81 1,232 1,844 391 1,067 36 3502011 6,365 1,195 3,799 118 1,253 1,890 377 1,157 48 3092012 6,567 1,260 3,890 106 1,311 1,729 350 1,137 46 1982013 6,760 1,324 3,984 121 1,331 1,684 356 1,143 48 1392013 Q2 6,876 1,306 4,144 130 1,296 1,906 385 1,233 56 233
Q3 6,780 1,315 4,038 133 1,296 1,814 380 1,138 58 238 Q4 6,760 1,324 3,984 121 1,331 1,684 356 1,143 48 139
Percentages of outstanding amounts (at constant exchange rates, end of period)
2001 100.0 23.5 52.9 3.8 19.8 100.0 18.9 64.0 5.4 11.82002 100.0 23.1 51.7 3.5 21.7 100.0 20.6 56.4 5.1 17.92003 100.0 22.1 54.0 2.4 21.5 100.0 21.2 56.5 4.3 18.02004 100.0 22.9 54.4 2.7 20.0 100.0 24.6 57.1 3.4 15.02005 100.0 23.2 54.5 3.0 19.4 100.0 25.1 60.0 5.3 9.62006 100.0 20.4 58.1 2.8 18.8 100.0 22.9 65.3 3.8 8.02007 100.0 19.2 59.9 2.4 18.5 100.0 24.2 66.4 3.0 6.42008 100.0 19.9 59.7 1.7 18.7 100.0 24.5 62.6 3.1 9.82009 100.0 19.7 58.8 1.4 20.1 100.0 23.8 59.0 2.2 15.02010 100.0 19.5 60.0 1.0 19.6 100.0 21.8 57.6 1.5 19.12011 100.0 19.8 59.0 1.4 19.9 100.0 21.1 60.7 1.8 16.42012 100.0 19.9 58.8 1.3 20.0 100.0 21.0 65.4 2.1 11.52013 100.0 19.6 58.9 1.8 19.7 100.0 21.1 67.8 2.8 8.22013 Q2 100.0 19.7 59.4 1.8 19.2 100.0 21.0 63.9 2.7 12.4
Q3 100.0 19.7 59.3 1.8 19.2 100.0 21.3 62.5 3.0 13.2 Q4 100.0 19.6 58.9 1.8 19.7 100.0 21.1 67.8 2.8 8.2
Percentages of outstanding amounts (at current exchange rates, end of period)
2001 100.0 17.0 59.9 3.5 19.6 100.0 13.2 70.3 4.7 11.72002 100.0 18.9 55.7 3.4 22.1 100.0 16.7 60.0 4.8 18.52003 100.0 20.7 55.1 2.4 21.8 100.0 19.8 57.5 4.3 18.42004 100.0 22.5 54.2 2.7 20.6 100.0 24.2 56.9 3.5 15.42005 100.0 20.7 56.8 2.7 19.8 100.0 22.5 62.8 5.0 9.82006 100.0 19.6 58.4 2.5 19.6 100.0 22.1 66.0 3.4 8.52007 100.0 20.0 58.6 2.2 19.2 100.0 25.2 65.0 2.8 6.92008 100.0 20.2 60.1 2.0 17.7 100.0 24.7 62.6 3.5 9.22009 100.0 20.4 58.4 1.6 19.6 100.0 24.6 58.4 2.4 14.62010 100.0 19.0 60.4 1.3 19.3 100.0 21.2 57.9 1.9 19.02011 100.0 18.8 59.7 1.9 19.7 100.0 19.9 61.2 2.5 16.32012 100.0 19.2 59.2 1.6 20.0 100.0 20.2 65.7 2.6 11.42013 100.0 19.6 58.9 1.8 19.7 100.0 21.1 67.8 2.8 8.22013 Q2 100.0 19.0 60.3 1.9 18.8 100.0 20.2 64.7 2.9 12.2
Q3 100.0 19.4 59.5 2.0 19.1 100.0 21.0 62.7 3.2 13.1 Q4 100.0 19.6 58.9 1.8 19.7 100.0 21.1 67.8 2.8 8.2
Sources: BIS and ECB calculations.Note: Excluding interbank loans.1) Including loans to/from Japan, Switzerland, the United Kingdom and the United States in their domestic currency.2) Excluding loans to/from Japan, Switzerland, the United Kingdom and the United States in their domestic currency.
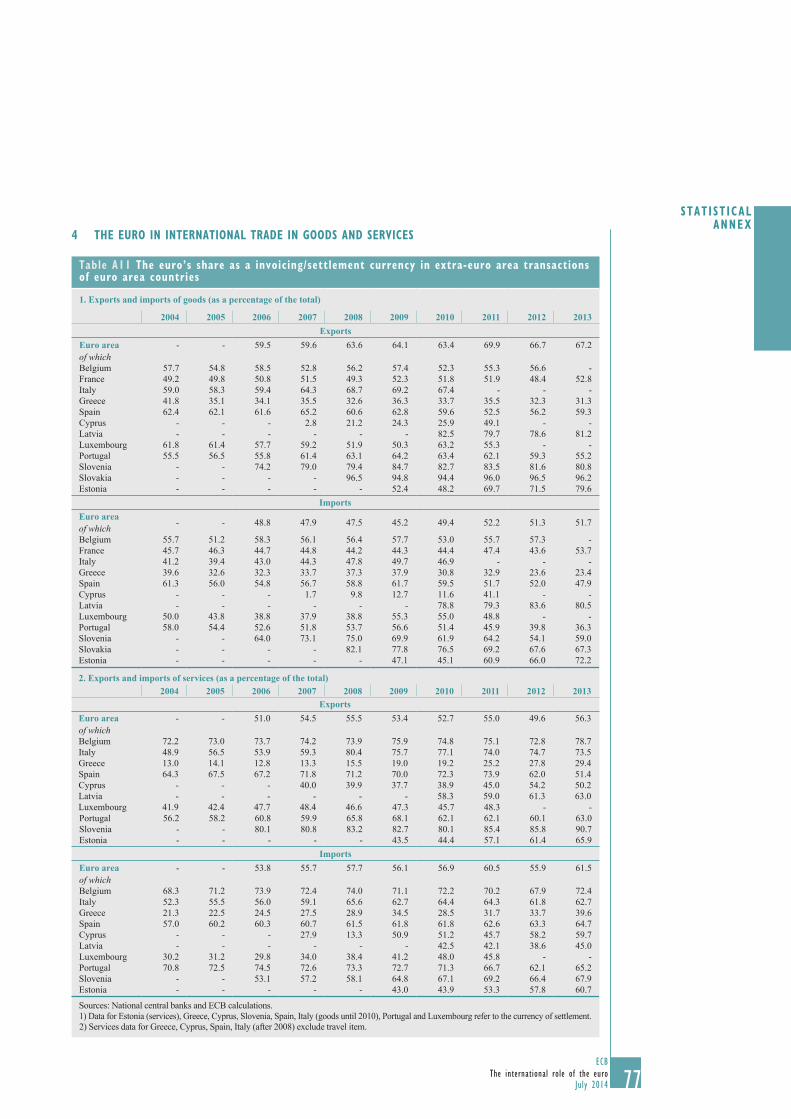
77ECB
The international role of the euroJuly 2014 77
STAT IST ICALANNEX
77
4 THE EURO IN INTERNATIONAL TRAdE IN gOOds ANd sERvIcEs
Table A11 The euro’s share as a invoicing/settlement currency in extra-euro area transactions of euro area countries
1. Exports and imports of goods (as a percentage of the total)
2004 2005 2006 2007 2008 2009 2010 2011 2012 2013 Exports
Euro areaof which
- - 59.5 59.6 63.6 64.1 63.4 69.9 66.7 67.2
Belgium 57.7 54.8 58.5 52.8 56.2 57.4 52.3 55.3 56.6 -France 49.2 49.8 50.8 51.5 49.3 52.3 51.8 51.9 48.4 52.8 Italy 59.0 58.3 59.4 64.3 68.7 69.2 67.4 - - -Greece 41.8 35.1 34.1 35.5 32.6 36.3 33.7 35.5 32.3 31.3 Spain 62.4 62.1 61.6 65.2 60.6 62.8 59.6 52.5 56.2 59.3 Cyprus - - - 2.8 21.2 24.3 25.9 49.1 - -Latvia - - - - - - 82.5 79.7 78.6 81.2 Luxembourg 61.8 61.4 57.7 59.2 51.9 50.3 63.2 55.3 - -Portugal 55.5 56.5 55.8 61.4 63.1 64.2 63.4 62.1 59.3 55.2 Slovenia - - 74.2 79.0 79.4 84.7 82.7 83.5 81.6 80.8 Slovakia - - - - 96.5 94.8 94.4 96.0 96.5 96.2 Estonia - - - - - 52.4 48.2 69.7 71.5 79.6
ImportsEuro areaof which - - 48.8 47.9 47.5 45.2 49.4 52.2 51.3 51.7
Belgium 55.7 51.2 58.3 56.1 56.4 57.7 53.0 55.7 57.3 -France 45.7 46.3 44.7 44.8 44.2 44.3 44.4 47.4 43.6 53.7 Italy 41.2 39.4 43.0 44.3 47.8 49.7 46.9 - - -Greece 39.6 32.6 32.3 33.7 37.3 37.9 30.8 32.9 23.6 23.4 Spain 61.3 56.0 54.8 56.7 58.8 61.7 59.5 51.7 52.0 47.9 Cyprus - - - 1.7 9.8 12.7 11.6 41.1 - -Latvia - - - - - - 78.8 79.3 83.6 80.5 Luxembourg 50.0 43.8 38.8 37.9 38.8 55.3 55.0 48.8 - -Portugal 58.0 54.4 52.6 51.8 53.7 56.6 51.4 45.9 39.8 36.3 Slovenia - - 64.0 73.1 75.0 69.9 61.9 64.2 54.1 59.0 Slovakia - - - - 82.1 77.8 76.5 69.2 67.6 67.3 Estonia - - - - - 47.1 45.1 60.9 66.0 72.2
2. Exports and imports of services (as a percentage of the total)2004 2005 2006 2007 2008 2009 2010 2011 2012 2013
ExportsEuro areaof which
- - 51.0 54.5 55.5 53.4 52.7 55.0 49.6 56.3
Belgium 72.2 73.0 73.7 74.2 73.9 75.9 74.8 75.1 72.8 78.7 Italy 48.9 56.5 53.9 59.3 80.4 75.7 77.1 74.0 74.7 73.5 Greece 13.0 14.1 12.8 13.3 15.5 19.0 19.2 25.2 27.8 29.4 Spain 64.3 67.5 67.2 71.8 71.2 70.0 72.3 73.9 62.0 51.4 Cyprus - - - 40.0 39.9 37.7 38.9 45.0 54.2 50.2 Latvia - - - - - - 58.3 59.0 61.3 63.0 Luxembourg 41.9 42.4 47.7 48.4 46.6 47.3 45.7 48.3 - -Portugal 56.2 58.2 60.8 59.9 65.8 68.1 62.1 62.1 60.1 63.0 Slovenia - - 80.1 80.8 83.2 82.7 80.1 85.4 85.8 90.7 Estonia - - - - - 43.5 44.4 57.1 61.4 65.9
ImportsEuro areaof which
- - 53.8 55.7 57.7 56.1 56.9 60.5 55.9 61.5
Belgium 68.3 71.2 73.9 72.4 74.0 71.1 72.2 70.2 67.9 72.4 Italy 52.3 55.5 56.0 59.1 65.6 62.7 64.4 64.3 61.8 62.7 Greece 21.3 22.5 24.5 27.5 28.9 34.5 28.5 31.7 33.7 39.6 Spain 57.0 60.2 60.3 60.7 61.5 61.8 61.8 62.6 63.3 64.7 Cyprus - - - 27.9 13.3 50.9 51.2 45.7 58.2 59.7 Latvia - - - - - - 42.5 42.1 38.6 45.0 Luxembourg 30.2 31.2 29.8 34.0 38.4 41.2 48.0 45.8 - -Portugal 70.8 72.5 74.5 72.6 73.3 72.7 71.3 66.7 62.1 65.2 Slovenia - - 53.1 57.2 58.1 64.8 67.1 69.2 66.4 67.9 Estonia - - - - - 43.0 43.9 53.3 57.8 60.7
Sources: National central banks and ECB calculations.1) Data for Estonia (services), Greece, Cyprus, Slovenia, Spain, Italy (goods until 2010), Portugal and Luxembourg refer to the currency of settlement.2) Services data for Greece, Cyprus, Spain, Italy (after 2008) exclude travel item.
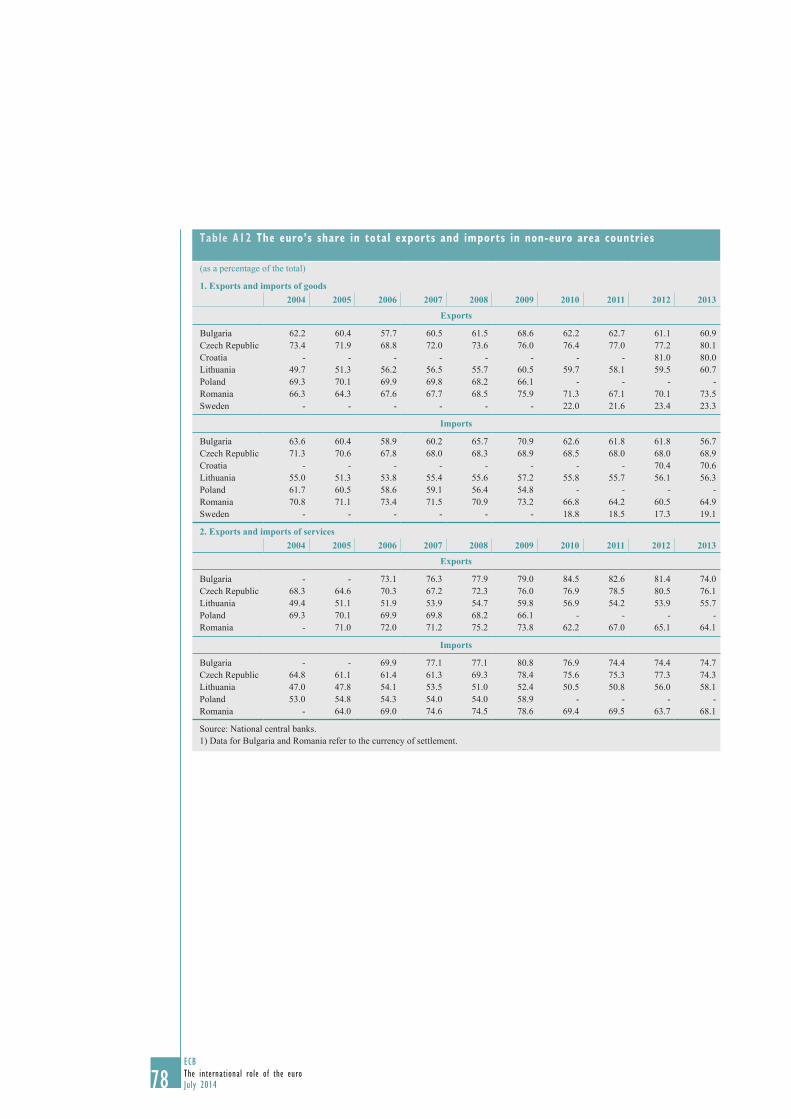
78ECBThe international role of the euroJuly 20147878
Table A12 The euro’s share in total exports and imports in non-euro area countries
(as a percentage of the total)
1. Exports and imports of goods2004 2005 2006 2007 2008 2009 2010 2011 2012 2013
Exports
Bulgaria 62.2 60.4 57.7 60.5 61.5 68.6 62.2 62.7 61.1 60.9Czech Republic 73.4 71.9 68.8 72.0 73.6 76.0 76.4 77.0 77.2 80.1Croatia - - - - - - - - 81.0 80.0Lithuania 49.7 51.3 56.2 56.5 55.7 60.5 59.7 58.1 59.5 60.7Poland 69.3 70.1 69.9 69.8 68.2 66.1 - - - -Romania 66.3 64.3 67.6 67.7 68.5 75.9 71.3 67.1 70.1 73.5Sweden - - - - - - 22.0 21.6 23.4 23.3
Imports
Bulgaria 63.6 60.4 58.9 60.2 65.7 70.9 62.6 61.8 61.8 56.7Czech Republic 71.3 70.6 67.8 68.0 68.3 68.9 68.5 68.0 68.0 68.9Croatia - - - - - - - - 70.4 70.6Lithuania 55.0 51.3 53.8 55.4 55.6 57.2 55.8 55.7 56.1 56.3Poland 61.7 60.5 58.6 59.1 56.4 54.8 - - - -Romania 70.8 71.1 73.4 71.5 70.9 73.2 66.8 64.2 60.5 64.9Sweden - - - - - - 18.8 18.5 17.3 19.1
2. Exports and imports of services2004 2005 2006 2007 2008 2009 2010 2011 2012 2013
Exports
Bulgaria - - 73.1 76.3 77.9 79.0 84.5 82.6 81.4 74.0Czech Republic 68.3 64.6 70.3 67.2 72.3 76.0 76.9 78.5 80.5 76.1Lithuania 49.4 51.1 51.9 53.9 54.7 59.8 56.9 54.2 53.9 55.7Poland 69.3 70.1 69.9 69.8 68.2 66.1 - - - -Romania - 71.0 72.0 71.2 75.2 73.8 62.2 67.0 65.1 64.1
Imports
Bulgaria - - 69.9 77.1 77.1 80.8 76.9 74.4 74.4 74.7Czech Republic 64.8 61.1 61.4 61.3 69.3 78.4 75.6 75.3 77.3 74.3Lithuania 47.0 47.8 54.1 53.5 51.0 52.4 50.5 50.8 56.0 58.1Poland 53.0 54.8 54.3 54.0 54.0 58.9 - - - -Romania - 64.0 69.0 74.6 74.5 78.6 69.4 69.5 63.7 68.1
Source: National central banks.1) Data for Bulgaria and Romania refer to the currency of settlement.

79ECB
The international role of the euroJuly 2014 79
STAT IST ICALANNEX
79
5 THE EURO As A PARALLEL cURRENcY: THE UsE OF EURO-dENOMINATEd bANk LOANs ANd dEPOsITs IN cOUNTRIEs OUTsIdE THE EURO AREA
Table A13 Outstanding euro-denominated bank loans in selected countries
Outstanding amounts
(in EUR millions)
As a percentage of total loans
As a percentage of foreign
currency loans
Outstanding amounts of foreign currency denominated loans
2012 2013 2012 2013 2012 2013 2012 2013
Non-euro area EU Member StatesBulgaria 17,242 16,430 61.5 58.5 96.9 97.0 17,803 16,929Czech Republic 6,354 7,550 7.5 9.4 92.4 93.4 6,878 8,086Croatia 3,135 3,529 9.6 11.0 95.9 96.6 3,269 3,655Lithuania 11,425 10,972 70.8 70.3 96.3 96.9 11,869 11,317Poland 20,568 21,635 10.0 10.3 33.2 36.6 61,889 59,155Romania 27,932 26,485 54.9 54.2 87.9 88.9 31,782 29,779
EU candidate and potential candidate countriesAlbania 2,151 2,085 55.3 54.4 89.0 89.7 2,416 2,324Bosnia and Herzegovina 91 84 1.3 1.1 88.7 95.2 103 89FYR Macedonia 1,819 1,855 52.5 50.2 95.9 96.3 1,898 1,926Serbia 9,488 8,952 65.2 66.6 86.1 87.1 11,019 10,279Turkey 19,759 22,168 8.3 9.1 31.2 32.3 63,363 68,736
Sources: National central banks and ECB calculations.Notes: Definitions of loans may vary across countries. Data may be subject to revisions as compared with previous issues of this report owing to methodological changes. Foreign exchange-indexed loans are not included.
Table A14 Outstanding euro-denominated bank deposits in selected countries
Outstanding amounts
(in EUR millions)
As a percentage of total deposits
As a percentage of foreign currency
deposits
Outstanding amounts of foreign currency deposits (in EUR millions)
2012 2013 2012 2013 2012 2013 2012 2013
Non-euro area EU Member StatesBulgaria 9,393 10,358 35.2 35.7 82.6 83.7 11,365 12,380Czech Republic 7,030 7,076 6.5 6.8 78.3 79.4 8,981 8,917Croatia 17,939 18,364 55.7 55.8 88.4 89.6 20,293 20,497Hungary 7,228 7,215 15.7 15.6 78.7 73.9 9,189 9,770Lithuania 2,673 2,890 21.3 21.9 77.5 79.7 3,450 3,627Poland 12,173 12,391 6.2 6.1 66.0 65.4 18,449 18,953Romania 13,794 14,212 31.0 29.5 85.3 86.3 16,180 16,466
EU candidate and potentialcandidate countriesAlbania 2,233 2,138 32.5 30.3 68.7 65.8 3,248 3,250Bosnia and Herzegovina 2,688 2,784 47.7 46.0 90.1 90.5 2,983 3,077FYR Macedonia 1,665 1,664 41.7 39.5 86.4 86.8 1,927 1,918Serbia 9,092 9,049 72.8 70.7 92.4 92.4 9,839 9,792Turkey 37,185 46,687 11.7 14.9 38.1 42.9 97,548 108,921
Sources: National central banks and ECB calculations.Notes: Definitions of deposits may vary across countries. Data may be subject to revisions as compared with previous issues of this report owing to methodological changes.