Embed Size (px)
Citation preview
The intelligent distribution network WSNs performance optimization and control method based on fuzzy cognition graph
Chunhua Fu, Xiaojing Wang, Lijun Zhang, Liying Qiao China Agricultural Means of Production Association, Beijing, China
Keywords: WSNs, Smart Distribution Power Grid, Quality of Service, FCM.
Abstract. Wireless Sensor network (Wireless Sensor Networks WSNs) with low cost, low power consumption and ad-hoc network and a series of characteristics of the experts and scholars at home and abroad for its application in the power system to give a high degree of attention. WSNs in intelligent distribution network is thought to have a very wide development and application of vision, its application in high performance in intelligent power distribution network data communication, the essence of which is of a random process is optimized and meet for multiple target data transmission of real-time, reliability, Quality of Service (Quality of Service, QoS) performance index requirements. The core is to optimize the way of channel preemption of the IEEE802.15.4 standard MAC protocol, so that the data transmission service can satisfy QoS requirements without adding additional network communication overhead.
1. Introduction
This paper explores a fuzzy cognitive graph modeling method for WSNs data transmission of smart distribution network. This paper analyzes the main factors that influence the data transmission performance of WSNs in smart distribution network, constructs a fuzzy cognition graph model, and expresses the relationship among various factors through mathematical methods. Building intelligent distribution network data transmission WSNs model, real-time and reliability of fuzzy cognitive map is given based on the concept of vertex attribute adjust the network parameters control variable value calculation method, and then the optimization of the presented control algorithm with the other two algorithms, the simulation experiment compare the simulation results, the results show that the proposed algorithm in data transmission are superior to other algorithms, the QoS aspects can be found in the proposed approach is feasible and effective.
2. Build the Model
WSNs is based on the analysis of intelligent distribution network data transmission, real-time and reliability guarantee QoS parameters can be concluded that the data generation rate, the rate of transmission power[1], communication, retreat time and the largest number of retreat is influence the reliability of smart distribution network real-time data transmission, the main factors.
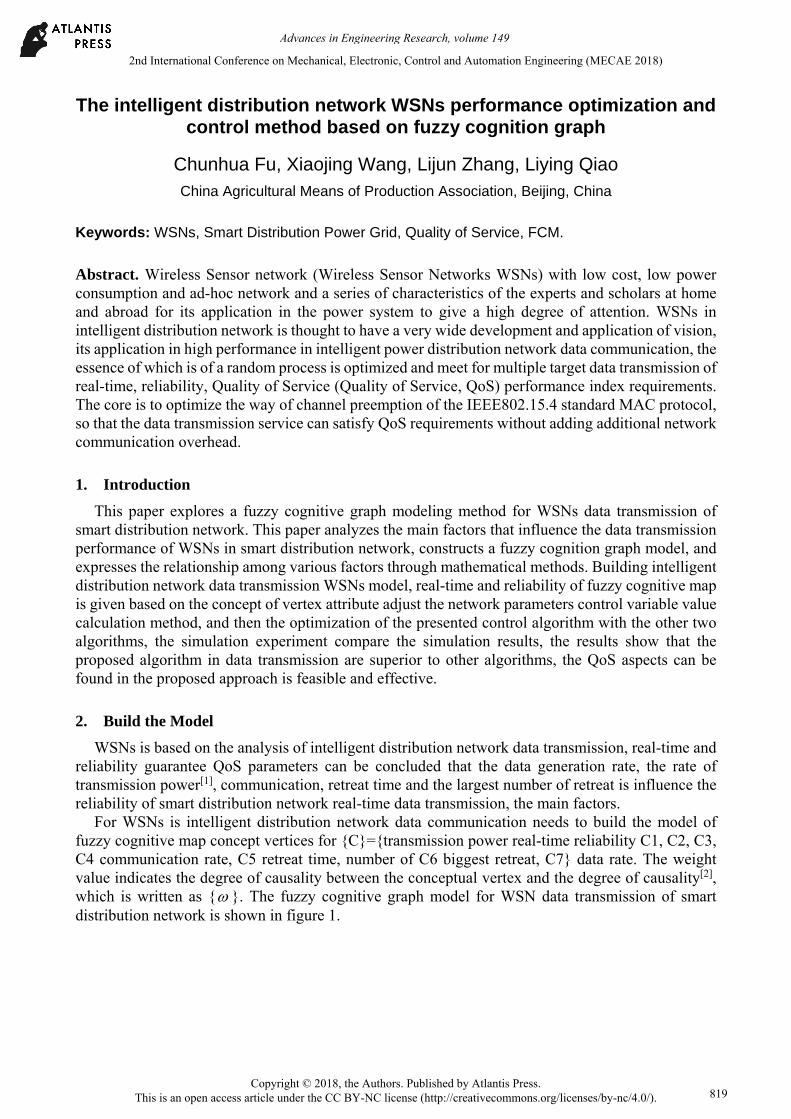
For WSNs is intelligent distribution network data communication needs to build the model of fuzzy cognitive map concept vertices for {C}={transmission power real-time reliability C1, C2, C3, C4 communication rate, C5 retreat time, number of C6 biggest retreat, C7} data rate. The weight value indicates the degree of causality between the conceptual vertex and the degree of causality[2], which is written as { }. The fuzzy cognitive graph model for WSN data transmission of smart distribution network is shown in figure 1.
2nd International Conference on Mechanical, Electronic, Control and Automation Engineering (MECAE 2018)
Copyright © 2018, the Authors. Published by Atlantis Press. This is an open access article under the CC BY-NC license (http://creativecommons.org/licenses/by-nc/4.0/).
Advances in Engineering Research, volume 149
819
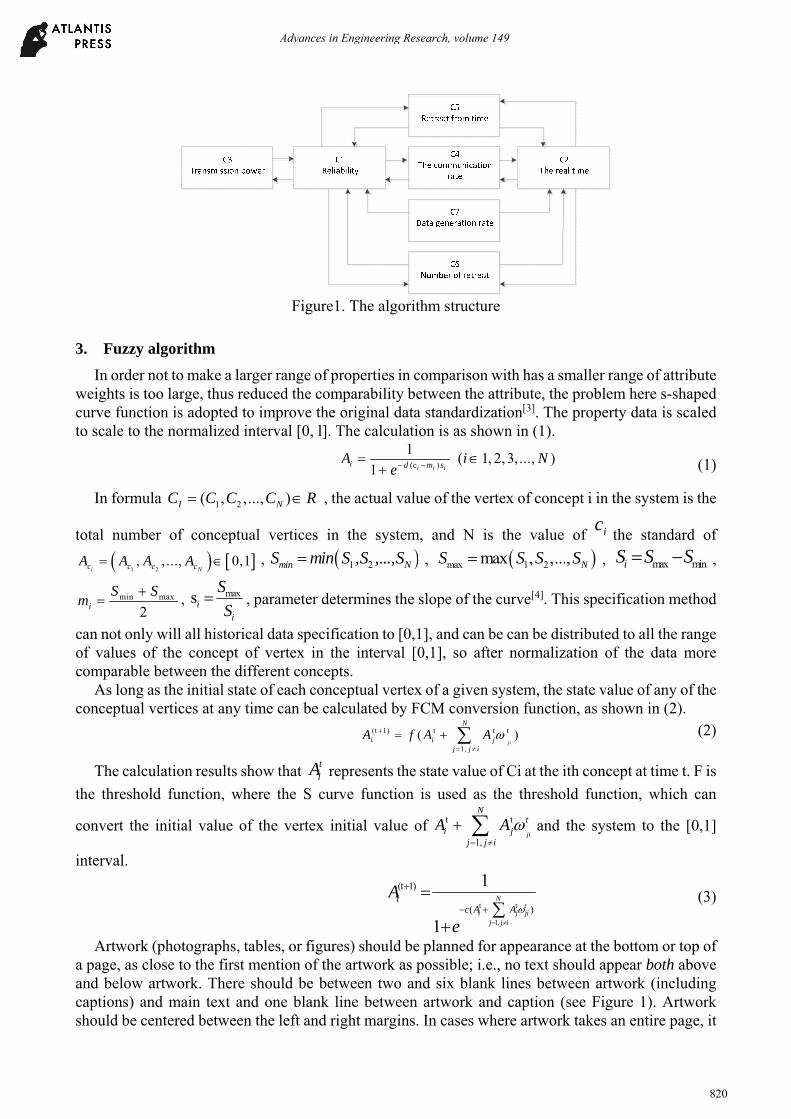
Figure1. The algorithm structure
3. Fuzzy algorithm
In order not to make a larger range of properties in comparison with has a smaller range of attribute weights is too large, thus reduced the comparability between the attribute, the problem here s-shaped curve function is adopted to improve the original data standardization[3]. The property data is scaled to scale to the normalized interval [0, l]. The calculation is as shown in (1).
(c )
1( 1, 2,3,..., )
1 i i ii d m sA i N
e (1)
In formula 1 2( , ,..., )I NC C C C R , the actual value of the vertex of concept i in the system is the
total number of conceptual vertices in the system, and N is the value of icthe standard of
1 2, , ..., 0,1
i Nc c c cA A A A , 1 2min NS min S ,S ,...,S , max 1 2max , ,..., NS S S S , max miniS S S ,
min max
2i
S Sm
, maxsi
i
S
S , parameter determines the slope of the curve[4]. This specification method
can not only will all historical data specification to [0,1], and can be can be distributed to all the range of values of the concept of vertex in the interval [0,1], so after normalization of the data more comparable between the different concepts.
As long as the initial state of each conceptual vertex of a given system, the state value of any of the conceptual vertices at any time can be calculated by FCM conversion function, as shown in (2).
(t 1) t t
1,
( )ji
Nt
i i jj j i
A f A A
(2)
The calculation results show that tiA represents the state value of Ci at the ith concept at time t. F is
the threshold function, where the S curve function is used as the threshold function, which can
convert the initial value of the vertex initial value of t t
1,ji
Nt
i jj j i
A A
and the system to the [0,1]
interval.
t t
1,
(t 1)
( )
1
1
Nt
i j jij j i
ic A A
A
e
(3)
Artwork (photographs, tables, or figures) should be planned for appearance at the bottom or top of a page, as close to the first mention of the artwork as possible; i.e., no text should appear both above and below artwork. There should be between two and six blank lines between artwork (including captions) and main text and one blank line between artwork and caption (see Figure 1). Artwork should be centered between the left and right margins. In cases where artwork takes an entire page, it
Advances in Engineering Research, volume 149
820

should be centered within the margins[5]. All print within the artwork should be in Helvetica/Univers/Arial font in the range of 8 point to 10 point.
4. OPTIMIZE
The non-linear Hebbian Learning method (NHL) was adopted by Papageorgiou as the Learning algorithm for the relationship matrix weight of fuzzy cognitive graph. The NHL weight learning formula is:
(t 1) (t 1) 0 (t 1) (t 1)(1 ) ( sgn( ) )t tji ji j i ji ji jA A A (4)
In the formula (4), γ is the attenuation coefficient, indicating the attenuation degree of each
iteration weight[6], usually 0<η<0.1,γ<0.1. 0ji is the initial weight, and sgn( 0
ji )is the symbolic
function. 0
0 0
0
1 0
sgn( ) 0 0
1 0
ji
ji ji
ji
(5)
The initial correlation matrix of the system in the system is specified before the NHL calculation is performed[7]. The concept of the vertices of the initial state values and the initial power generation into the formula (6) iteration, when the values of F1's most hours FCM to reach the final balance, stop the iteration, the output finally calculated weighting results.
21
1
(DOC T )m
i ii
F
(6)
M is the number of Output nodes of the system, and the DOC(Desired Output Concept) represents the state value of the ith Output node obtained by the calculation. Ti is the mean of the target of the ith
output node. If the DOCi state value of the ith output node is between min max[T ,T ]i i , then
min maxT TT i i
i 2
.
5. Simulation analysis
Firstly, the actual value of transmission power, communication rate, withdrawal time and the concept of avoidance number are normalized by formula (1). Taking the transmission power as an example, the normalized results are shown in figure 2.
10 11 12 13 14 15 16 17 18 19 200
0.1
0.2
0.3
0.4
0.5
0.6
0.7
0.8
0.9
1
Figure 2. Data normalization
Advances in Engineering Research, volume 149
821
Based on the above fuzzy cognitive model, the simulation experiment of WSNs was conducted. The simulation is based on a square area of 1Km2, with 100 nodes arranged according to the structure of the star network, and the no1 node is set to the coordinator node. The data packet length is set to 50B, and the time of the node transmission data is 313 symbols(5008μs). The data buffer queue length of two different priority levels is set to 7 packets (350B).
Two different data generation environments are simulated and analyzed. Real-time data generation rate is within 1 18 ,16kbit s kbit s range, and non-real-time data generation rate is
within 1 12 , 22kbit s kbit s range. real-time data generation rate is 18kbit s , non-real-time data
generation rate increases from 12kbit s to 122kbit s , (2) real-time data generation rate is 116kbit s , and non-real-time data generation rate increases to 12kbit s by 122kbit s .
The simulation results of data transmission delay are shown in figure 3.
Figure 3. Data transmission delay
Produced by the high priority data visible above rates remain at 8 kbit/s, when the real-time data transmission delay ms growth from 15 to 62 ms, change is bigger, and real-time data transmission is still able to maintain low delay, keep on 10 ms. In the rate of real time data for 16 kbit/s, when the real-time data generation rate increased from 2 kbit/s to 22 kbit/s, non real-time data from 20 ms increases to more than 70 ms delay, change in more than 50 ms, real-time data transmission delay some fluctuations, the overall rise, finally keep around 20 ms, basically meet the requirement of power distribution network data communications QoS metrics. This not only shows that applied in intelligent distribution network by adjusting the parameters of the corresponding fuzzy cognitive map of WSNs has met the requirement of the real-time network communication, and show that the improved channel access mechanism can ensure the intelligent distribution network real-time data transmission is not affected by non real-time data.
The effective throughput of real-time data as its production rate increases significantly reduced, and the main influence factors by FCM regulated makes real-time data throughput almost unaffected, still can ensure high throughput effectively.
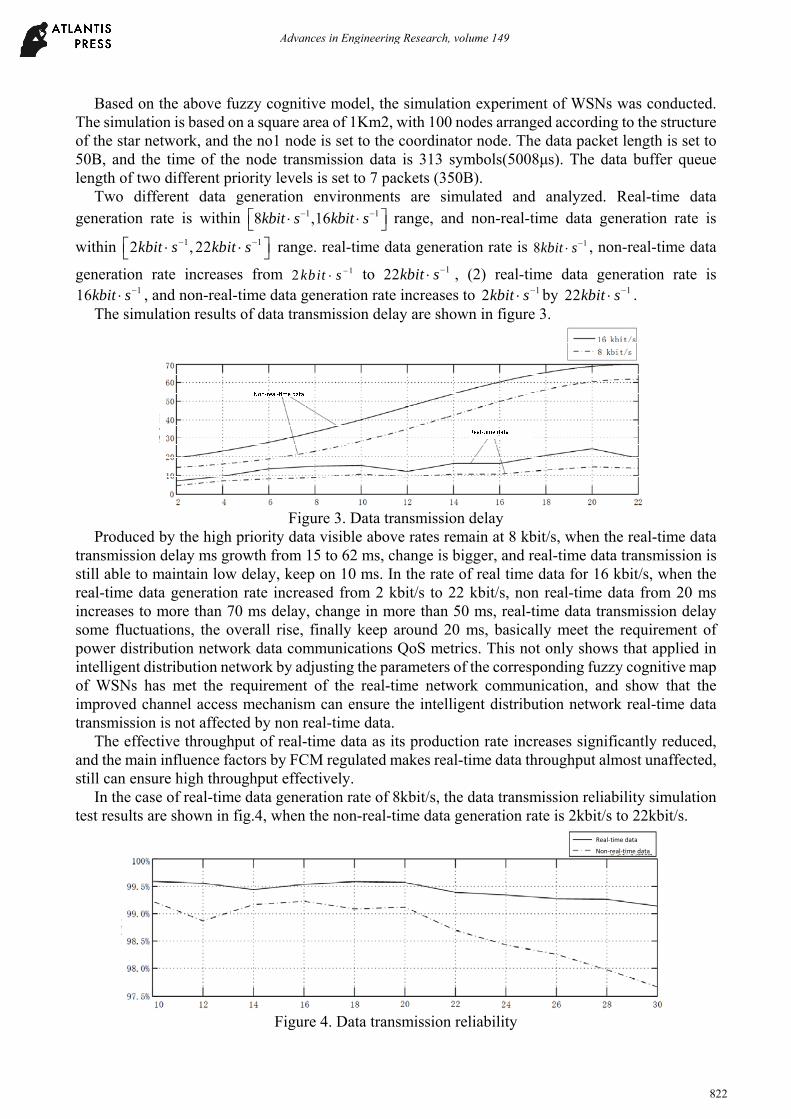
In the case of real-time data generation rate of 8kbit/s, the data transmission reliability simulation test results are shown in fig.4, when the non-real-time data generation rate is 2kbit/s to 22kbit/s.
Non-real-time data
Real-time data
Figure 4. Data transmission reliability
Advances in Engineering Research, volume 149
822
It can be seen from the above picture that in the process of increasing data production rate, the fuzzy cognitive map can keep the real-time data transmission reliability at a higher level by adjusting the corresponding network parameters. When the data production rate increased to more than 20 kbit/s, because of its high data rate, real-time control of the network can only slow down the fuzzy cognitive map data reliability grow along with the data generation rate and the rate of decline, but still keep the reliability in more than 99%. The non-real time data increases with its production rate, the fuzzy cognition graph takes corresponding measures, the decrease of reliability decreases, and the demand of the distribution network data communication is met.
Acknowledgements
This work was supported by the National Science & Technology Pillar Program during the 12th Five-year Plan Period (Grant No. 2015BAD18B02)
References
[1] Obama. Obama’s speech on the economy[N]. New York Times, 2009-01-09. [2] LU.B, HABETLER T G, HARLEY R G, et al. Energy evaluation goes wireless[J]. IEEE
Industry Applications Magazine, 2007,13(2): 17-23. [3] GUNGOR V C, LAMBERT F C. A survey on communication networks for electric system
automation[J].Computer Network, 2006, 50(7): 877-897. [4] LEON R A, VITTAL V,MANIMARAN G.Application of sensor network for secure electric
energy infrastructure[J].IEEE Trans on Power Delivery, 2007,22(2):1021-1028. [5] Saxena N,Roy A,Shin J.Dynamic duty cycle and adaptive contention window based QoS-MAC
protocol for wireless multimedia sensor networks[J].Computer Network. 2008, 52: 2532-2542. [6] H.Xiaoxia,F.Yuguang.Multi-constrained QoS multipath routing in wireless sensor ntworks[J].
Wireless Networks,2008,14(4): 465-478. [7] Munari A. Schott W Krishnan S. Energyefficient routing in mobile wireless sensor networks
using mobility prediction [J]. Proceeding of IEEE 34th Conference on Local Computer Networks, 2009,514-521.
Advances in Engineering Research, volume 149
823