Embed Size (px)
Citation preview
The Integration Of Crime Analysis Into Patrol Work:
A GuidebookBruce Taylor, Ph.D.NORC at the University of Chicago
Rachel Boba, Ph.D. Florida Atlantic University
with Sergeant Jeff EggeMinneapolis Police Department

The Integration Of Crime Analysis Into Patrol Work:
A GuidebookBruce Taylor, Ph.D.NORC at the University of Chicago
Rachel Boba, Ph.D. Florida Atlantic University
withSergeant Jeff EggeMinneapolis Police Department
The Office of Community Oriented Policing Services (the COPS Office) is the component of the U.S. Department of Justice responsible for advancing the practice of community policing by the nation’s state, local, and tribal law enforcement agencies through information and grant resources. The community policing philosophy promotes organizational strategies that support the systematic use of partnerships and problem-solving techniques to proactively address the immediate conditions that give rise to public safety issues such as crime, social disorder, and fear of crime. In its simplest form, community policing is about building relationships and solving problems.
The COPS Office awards grants to state, local, and tribal law enforcement agencies to hire and train community policing professionals, acquire and deploy cutting-edge crime-fighting technologies, and develop and test innovative policing strategies. The COPS Office funding also provides training and technical assistance to community members and local government leaders and all levels of law enforcement.
Since 1994, the COPS Office has invested more than $16 billion to add community policing officers to the nation’s streets, enhance crime fighting technology, support crime prevention initiatives, and provide training and technical assistance to help advance community policing. More than 500,000 law enforcement personnel, community members, and government leaders have been trained through COPS Office-funded training organizations.
The COPS Office has produced more than 1,000 information products—and distributed more than 2 million publications—including Problem Oriented Policing Guides, Grant Owner’s Manuals, fact sheets, best practices, and curricula. And in 2010, the COPS Office participated in 45 law enforcement and public-safety conferences in 25 states in order to maximize the exposure and distribution of these knowledge products. More than 500 of those products, along with other products covering a wide area of community policing topics—from school and campus safety to gang violence—are currently available, at no cost, through its online Resource Information Center at www.cops.usdoj.gov. More than 2 million copies have been downloaded in FY2010 alone. The easy to navigate and up to date website is also the grant application portal, providing access to online application forms.
Dear Colleagues,
Law enforcement agencies have faced many challenges in the last few years, specifically as severe budget cuts have threatened their ability to provide proactive policing services to communities across this nation. In this economic climate, it has become unavoidably apparent to police executives that they must police with a focus on enhanced strategies and response—with limited resources.
With support from the COPS Office, the Police Executive Research Forum (PERF) and Dr. Rachel Boba of Florida Atlantic University partnered on this guidebook to address the use of crime analysis and its application for patrol officers. This timely research provides a practical overview of the importance of crime analysis and its necessity in everyday operations for all policing agencies. An understanding of crime analysis and how it might be used to address the needs of patrol will help law enforcement agencies to maximize their agency’s resources.
This book will focus on organizational configuration and how a shift in thinking can allow for the use of crime analysis to support the patrol function. Studies have shown that data-driven approaches in responding to crime problems often leads to crime reduction and greater police effectiveness.
Although significant work is still needed to bring such an integrated approach to police organizations to make the use of crime analysis for patrol more palatable, this guidebook presents a clear illustration of how this can be accomplished. By providing concrete examples from progressive police agencies across the country, this material will be useful to police executives and crime analysts, as well as researchers assisting law enforcement agencies to make better use of their current resources. Police leaders will become more versed in actionable intelligence and how the use of crime analysis can be tailored to apply to key concepts such as CompStat, intelligence-led policing, and predictive policing. Finally, this guidebook serves as a complement to efforts at enhancing the use of problem analysis.
As with all COPS resources, it is my hope and intention that this material will assist you in your efforts to advance community policing through greater use of analysis and data-driven approaches.
Sincerely,
Bernard K. Melekian, DirectorOffice of Community Oriented Policing Services
This project was supported by Cooperative Agreement Number 2007-CK-WX-K010 awarded by the Office of Community Oriented Policing Services, U.S. Department of Justice. The opinions contained herein are those of the author(s) and do not necessarily represent the official position or policies of the U.S. Department of Justice or the Police Executive Research Forum. References to specific agencies, companies, products, or services should not be considered an endorsement by the author(s) or the U.S. Department of Justice. Rather, the references are illustrations to supplement discussion of the issues.
The Internet references cited in this publication were valid as of the date of this publication. Given that URLs and websites are in constant flux, neither the author nor the COPS Office can vouch for their current validity.
ISBN: 978-1-935676-33-1
September 2011
| 1 |
CONTENTS
Acknowledgments . . . . . . . . . . . . . . . . . . . . . . . . . . . . . . . . . . . . . . . . . . . . . . . . . . . 3
SECTION 1: Introduction . . . . . . . . . . . . . . . . . . . . . . . . . . . . . . . . . . . . . . . . . . . . . . . 5
Importance of Crime Analysis Integration . . . . . . . . . . . . . . . . . . . . . . . . . . . . . . . . . . 5
Summary of Crime Analysis Literature and Research on Integration . . . . . . . . . . . 6
Overview of the Project Research . . . . . . . . . . . . . . . . . . . . . . . . . . . . . . . . . . . . . . . . 7
National Survey Findings . . . . . . . . . . . . . . . . . . . . . . . . . . . . . . . . . . . . . . . . . . . . . . . . 8
Crime Analysis Prevalence and Importance . . . . . . . . . . . . . . . . . . . . . . . . . . . . 9
Use of Crime Analysis . . . . . . . . . . . . . . . . . . . . . . . . . . . . . . . . . . . . . . . . . . . . . . .10
Barriers to Integrating Crime Analysis . . . . . . . . . . . . . . . . . . . . . . . . . . . . . . . . . . 11
Results Summary . . . . . . . . . . . . . . . . . . . . . . . . . . . . . . . . . . . . . . . . . . . . . . . . . . .12
Guidebook Themes . . . . . . . . . . . . . . . . . . . . . . . . . . . . . . . . . . . . . . . . . . . . . . . . . . . . .13
SECTION 2: General Issues and Potential Barriers for Crime Analysis Integration . . . . . . . . . . . . . . . . . . . . . . . . . . . . . . . 15
Leading the Integration of Crime Analysis . . . . . . . . . . . . . . . . . . . . . . . . . . . . . . . . . .15
Importance of Accountability . . . . . . . . . . . . . . . . . . . . . . . . . . . . . . . . . . . . . . . . . . . . .17
Purposes of Crime Analysis Products . . . . . . . . . . . . . . . . . . . . . . . . . . . . . . . . . . . . .18
Informational Products for Situational Awareness . . . . . . . . . . . . . . . . . . . . . . .18
Analytical Products for Directing Crime Reduction Strategies . . . . . . . . . . . . .19
Contrasting Informational and Analytical Products . . . . . . . . . . . . . . . . . . . . . . .19
Audiences of Crime Analysis Products . . . . . . . . . . . . . . . . . . . . . . . . . . . . . . . . . . . 20
Developing Policies and Procedures for Crime Analysis . . . . . . . . . . . . . . . . . . . . . 22
SECTION 3: Crime Analysis Products and Examples . . . . . . . . . . . . . . . . . . . . . . . 23
Key Characteristics of Effective Crime Analysis Products . . . . . . . . . . . . . . . . . . . 23
Twelve Examples of Crime Analysis Products . . . . . . . . . . . . . . . . . . . . . . . . . . . . . 24
SECTION 4: Implementation Framework . . . . . . . . . . . . . . . . . . . . . . . . . . . . . . . . . . .41
Innovative Police Practitioner Discussions on Implementation Framework . . . . . .41
Organizational Structure . . . . . . . . . . . . . . . . . . . . . . . . . . . . . . . . . . . . . . . . . . . . .41
Technology and Training . . . . . . . . . . . . . . . . . . . . . . . . . . . . . . . . . . . . . . . . . . . . 42
Communication . . . . . . . . . . . . . . . . . . . . . . . . . . . . . . . . . . . . . . . . . . . . . . . . . . . 43
Stratified Model of Problem Solving, Analysis, and Accountability . . . . . . . . . . . . . 44
SECTION 5: Discussion and Future Considerations . . . . . . . . . . . . . . . . . . . . . . . . . 47
Discussion . . . . . . . . . . . . . . . . . . . . . . . . . . . . . . . . . . . . . . . . . . . . . . . . . . . . . . . . . . . . 47
Future Considerations . . . . . . . . . . . . . . . . . . . . . . . . . . . . . . . . . . . . . . . . . . . . . . . . . 48
CompStat . . . . . . . . . . . . . . . . . . . . . . . . . . . . . . . . . . . . . . . . . . . . . . . . . . . . . . . . 48
Intelligence-Led and Predictive Policing . . . . . . . . . . . . . . . . . . . . . . . . . . . . . . . 49
Advancing a Research Agenda . . . . . . . . . . . . . . . . . . . . . . . . . . . . . . . . . . . . . 50
Educating the Field . . . . . . . . . . . . . . . . . . . . . . . . . . . . . . . . . . . . . . . . . . . . . . . . .51
REFERENCES . . . . . . . . . . . . . . . . . . . . . . . . . . . . . . . . . . . . . . . . . . . . . . . . . . . . . . 53
NOTES . . . . . . . . . . . . . . . . . . . . . . . . . . . . . . . . . . . . . . . . . . . . . . . . . . . . . . . . . . . . 55
| 3 |
Acknowledgments
Acknowledgments
We are most grateful to the Police Executive Research Forum (PERF) for their support through this project. In particular, we thank Chuck Wexler for his leadership and Chris Koper for his support of the project as well as Bruce Kubu and Nathan Ballard for their work administering the national survey. We thank Sergeant Apollo Kowalyk, Edmonton Police Service, who provided important original ideas to help start the project during his Fellowship at PERF and made major contributions in the formative stages of the project.We would also like to thank the Office of Community Oriented Policing Services (the COPS Office) for funding the grant. In particular, we recognize Matthew Scheider and Nicole Scalisi for their participation in the focus groups as well as their contribution to the ideas presented in the guidebook.
Lastly, we would like to recognize the following agencies who allowed their personnel to participate in our focus groups, working groups, and our case study. They are:
Alexandria, Virginia Police Department
Arlington, Texas Police Department
Dallas, Texas Police Department
Danvers, Massachusetts Police Department
Edmonton, Alberta (Canada) Police Department
Fairfax County, Virginia Police Department
Hennepin County, Minnesota Sheriff ’s Office
Jacksonville, Florida Sheriff ’s Office
Lakewood, Colorado Police Department
Las Vegas, Nevada Metropolitan Police Department
Los Angeles, California Police Department
Mesa, Arizona Police Department
Minneapolis, Minnesota Police Department
Montgomery County, Maryland Police Department
Newport News, Virginia Police Department
Philadelphia, Pennsylvania Police Department
Port St. Lucie, Florida Police Department
Prince George’s County, Maryland Police Department
Roanoke, Virginia Police Department
Suffolk County, New York Police Department
Tulsa, Oklahoma Police Department
Washington, D.C. Metropolitan Police Department

| 5 |
SECTION 1: Introduction
SECTION 1: Introduction
T his guidebook has been developed for mid-level managers and commanders of police agencies who are looking for guidance in fully incorporating crime analysis into their agency, particularly into patrol. The guide presents a series of considerations and recommendations for crime analysis
integration, provides crime analysis product examples that have been implemented into innovative police agencies around the United States, discusses key issues of implementation, and outlines an implementation framework strategy. Notably, this guide is not a detailed plan that can be taken and immediately adopted by any one agency, but is a practical overview of the importance of crime analysis and its usefulness and offers recommendations and examples for crime analysis integration.
Importantly, the readers of the guide should have some level of understanding of crime analysis and its relevance for police practice. Although the value of crime analysis is discussed briefly, this guide primarily focuses on providing advice for agencies that are seeking to integrate crime analysis effectively. In addition, throughout this guidebook, the term “integration” refers to systematically using crime analysis processes and products as essential components of the everyday operations of a police agency. Integrated crime analysis involves merging the results of analysis with the patrol function and investigative elements of an agency so that they are coordinated to improve the agency’s effectiveness in its approach to public safety.
Consequently, the Introduction of the guidebook provides critical background material that was used to develop the considerations, recommendations, and products presented throughout the guide. It outlines why integration of crime analysis is important, presents a brief review of relevant crime analysis literature, and provides an overview of the goals, methods, and findings of the research that lead to the recommendations made in the guidebook. It ends with a brief introduction of the themes covered in the remainder of the guidebook.
Importance of Crime Analysis IntegrationReviews of over 30 years of policing research show that the most effective police strategies are those that are focused on areas, places, and offenders that contribute to a disproportionate amount of crime and disorder.1 The evidence suggests that when police target “hot spots” of crime, they can have a significant impact on overall crime levels.2 A common component in effective police strategies is the use of systematic crime analysis to help guide and prioritize crime reduction efforts, as police agencies are continually challenged with limited resources, deployment issues, and other pressures that test their capacity to provide quality public safety service and implement crime reduction strategies.
Crime analysis is a process that can maximize the use of agency resources available for understanding and addressing crime, provide the basis for proactive initiatives to prevent crime, monitor police performance, and take advantage of the volumes of information collected by police and other agencies. As we enter the second decade of the 21st century and the nationwide economic crisis continues to hit local cash-strapped governments hard, the efficient use of resources continues to be essential and
| 6 |
The Integration of Crime Analysis Into Patrol Work: A Guidebook
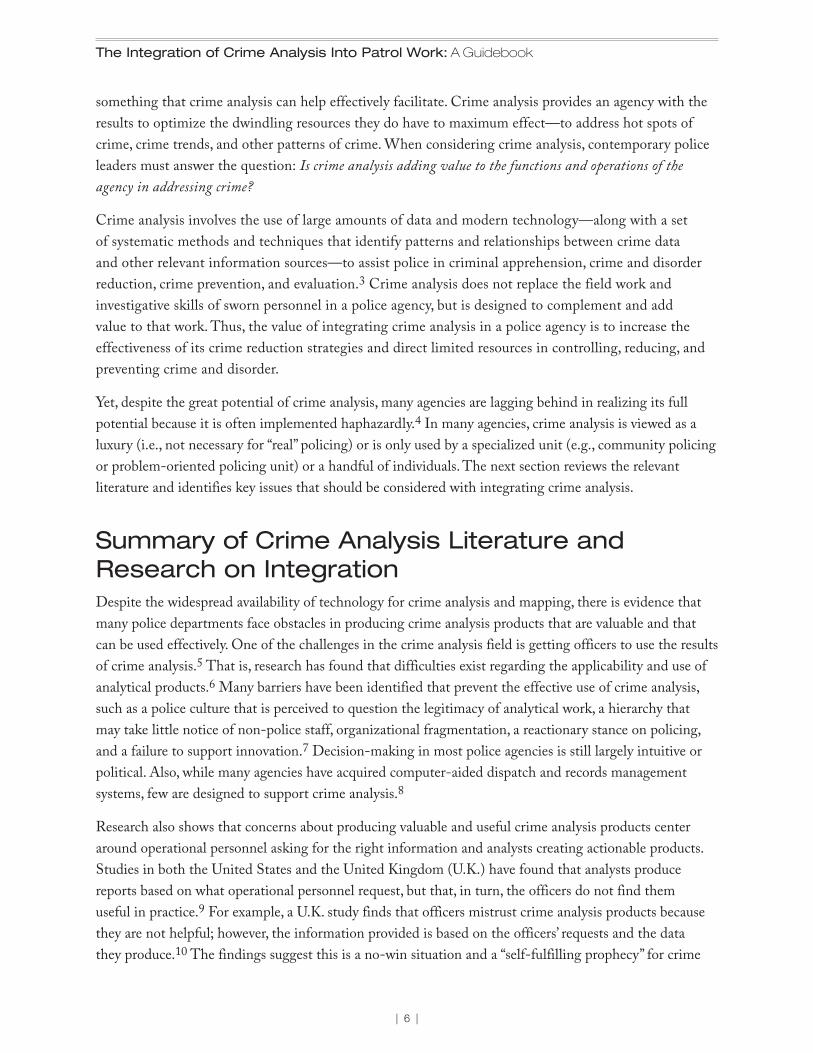
something that crime analysis can help effectively facilitate. Crime analysis provides an agency with the results to optimize the dwindling resources they do have to maximum effect—to address hot spots of crime, crime trends, and other patterns of crime. When considering crime analysis, contemporary police leaders must answer the question: Is crime analysis adding value to the functions and operations of the agency in addressing crime?
Crime analysis involves the use of large amounts of data and modern technology—along with a set of systematic methods and techniques that identify patterns and relationships between crime data and other relevant information sources—to assist police in criminal apprehension, crime and disorder reduction, crime prevention, and evaluation.3 Crime analysis does not replace the field work and investigative skills of sworn personnel in a police agency, but is designed to complement and add value to that work. Thus, the value of integrating crime analysis in a police agency is to increase the effectiveness of its crime reduction strategies and direct limited resources in controlling, reducing, and preventing crime and disorder.
Yet, despite the great potential of crime analysis, many agencies are lagging behind in realizing its full potential because it is often implemented haphazardly.4 In many agencies, crime analysis is viewed as a luxury (i.e., not necessary for “real” policing) or is only used by a specialized unit (e.g., community policing or problem-oriented policing unit) or a handful of individuals. The next section reviews the relevant literature and identifies key issues that should be considered with integrating crime analysis.
Summary of Crime Analysis Literature and Research on IntegrationDespite the widespread availability of technology for crime analysis and mapping, there is evidence that many police departments face obstacles in producing crime analysis products that are valuable and that can be used effectively. One of the challenges in the crime analysis field is getting officers to use the results of crime analysis.5 That is, research has found that difficulties exist regarding the applicability and use of analytical products.6 Many barriers have been identified that prevent the effective use of crime analysis, such as a police culture that is perceived to question the legitimacy of analytical work, a hierarchy that may take little notice of non-police staff, organizational fragmentation, a reactionary stance on policing, and a failure to support innovation.7 Decision-making in most police agencies is still largely intuitive or political. Also, while many agencies have acquired computer-aided dispatch and records management systems, few are designed to support crime analysis.8
Research also shows that concerns about producing valuable and useful crime analysis products center around operational personnel asking for the right information and analysts creating actionable products. Studies in both the United States and the United Kingdom (U.K.) have found that analysts produce reports based on what operational personnel request, but that, in turn, the officers do not find them useful in practice.9 For example, a U.K. study finds that officers mistrust crime analysis products because they are not helpful; however, the information provided is based on the officers’ requests and the data they produce.10 The findings suggest this is a no-win situation and a “self-fulfilling prophecy” for crime
| 7 |
SECTION 1: Introduction
analysts, since they are judged based on the quality of work of others. However, another issue also concerns the value of crime analysis products that are created by analysts unsolicited—that is, without being requested from sworn personnel. Researchers note that any analysis product, no matter how well developed and accurate, has no operational value to officers, supervisors, managers or commanders in police agencies unless it is actionable,11 meaning that the analysis can and will be used to guide crime reduction activities and not just be read and discarded. This issue of actionable analysis will be discussed later in the guidebook.
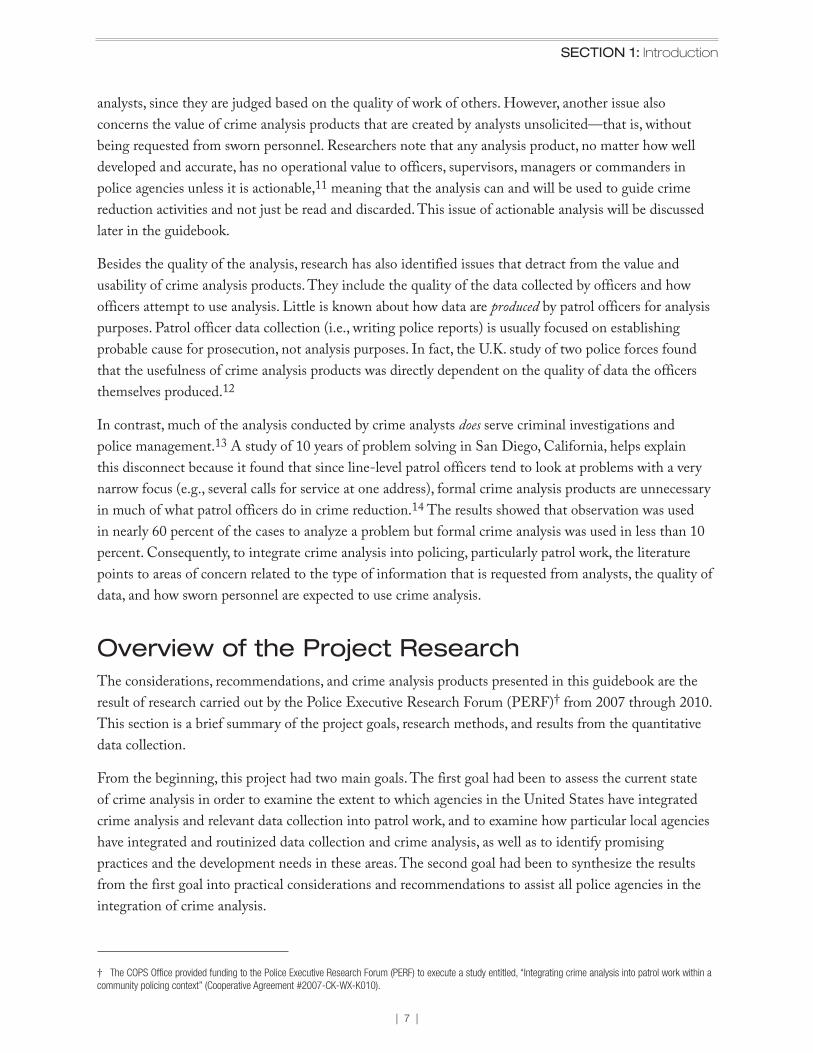
Besides the quality of the analysis, research has also identified issues that detract from the value and usability of crime analysis products. They include the quality of the data collected by officers and how officers attempt to use analysis. Little is known about how data are produced by patrol officers for analysis purposes. Patrol officer data collection (i.e., writing police reports) is usually focused on establishing probable cause for prosecution, not analysis purposes. In fact, the U.K. study of two police forces found that the usefulness of crime analysis products was directly dependent on the quality of data the officers themselves produced.12
In contrast, much of the analysis conducted by crime analysts does serve criminal investigations and police management.13 A study of 10 years of problem solving in San Diego, California, helps explain this disconnect because it found that since line-level patrol officers tend to look at problems with a very narrow focus (e.g., several calls for service at one address), formal crime analysis products are unnecessary in much of what patrol officers do in crime reduction.14 The results showed that observation was used in nearly 60 percent of the cases to analyze a problem but formal crime analysis was used in less than 10 percent. Consequently, to integrate crime analysis into policing, particularly patrol work, the literature points to areas of concern related to the type of information that is requested from analysts, the quality of data, and how sworn personnel are expected to use crime analysis.
Overview of the Project Research The considerations, recommendations, and crime analysis products presented in this guidebook are the result of research carried out by the Police Executive Research Forum (PERF)† from 2007 through 2010. This section is a brief summary of the project goals, research methods, and results from the quantitative data collection.
From the beginning, this project had two main goals. The first goal had been to assess the current state of crime analysis in order to examine the extent to which agencies in the United States have integrated crime analysis and relevant data collection into patrol work, and to examine how particular local agencies have integrated and routinized data collection and crime analysis, as well as to identify promising practices and the development needs in these areas. The second goal had been to synthesize the results from the first goal into practical considerations and recommendations to assist all police agencies in the integration of crime analysis.
† The COPS Office provided funding to the Police Executive Research Forum (PERF) to execute a study entitled, “Integrating crime analysis into patrol work within a community policing context” (Cooperative Agreement #2007-CK-WX-K010).
| 8 |
The Integration of Crime Analysis Into Patrol Work: A Guidebook
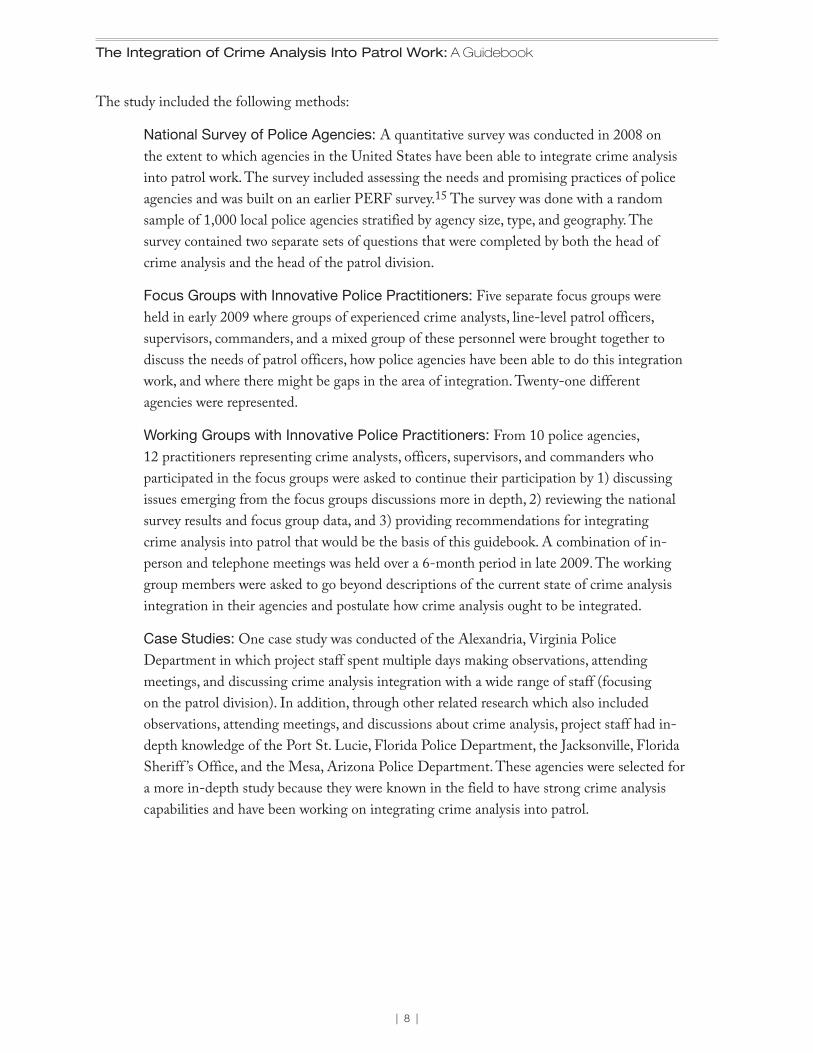
The study included the following methods:
National Survey of Police Agencies: A quantitative survey was conducted in 2008 on the extent to which agencies in the United States have been able to integrate crime analysis into patrol work. The survey included assessing the needs and promising practices of police agencies and was built on an earlier PERF survey.15 The survey was done with a random sample of 1,000 local police agencies stratified by agency size, type, and geography. The survey contained two separate sets of questions that were completed by both the head of crime analysis and the head of the patrol division.
Focus Groups with Innovative Police Practitioners: Five separate focus groups were held in early 2009 where groups of experienced crime analysts, line-level patrol officers, supervisors, commanders, and a mixed group of these personnel were brought together to discuss the needs of patrol officers, how police agencies have been able to do this integration work, and where there might be gaps in the area of integration. Twenty-one different agencies were represented.
Working Groups with Innovative Police Practitioners: From 10 police agencies, 12 practitioners representing crime analysts, officers, supervisors, and commanders who participated in the focus groups were asked to continue their participation by 1) discussing issues emerging from the focus groups discussions more in depth, 2) reviewing the national survey results and focus group data, and 3) providing recommendations for integrating crime analysis into patrol that would be the basis of this guidebook. A combination of in-person and telephone meetings was held over a 6-month period in late 2009. The working group members were asked to go beyond descriptions of the current state of crime analysis integration in their agencies and postulate how crime analysis ought to be integrated.
Case Studies: One case study was conducted of the Alexandria, Virginia Police Department in which project staff spent multiple days making observations, attending meetings, and discussing crime analysis integration with a wide range of staff (focusing on the patrol division). In addition, through other related research which also included observations, attending meetings, and discussions about crime analysis, project staff had in-depth knowledge of the Port St. Lucie, Florida Police Department, the Jacksonville, Florida Sheriff ’s Office, and the Mesa, Arizona Police Department. These agencies were selected for a more in-depth study because they were known in the field to have strong crime analysis capabilities and have been working on integrating crime analysis into patrol.
| 9 |
SECTION 1: Introduction
National Survey Findings Because the purpose of the focus groups, working groups, and the case studies had been to develop the considerations and recommendations for this guidebook, the specific results are not presented individually but are integrated into subsequent sections of this guide.† However, this section presents a brief snapshot of the main results of the national survey which will be published in more detail in an academic publication.
The quantitative survey focused on the extent to which agencies in the United States have been able to integrate crime analysis. The purpose of the national survey was to explore crime analysis integration on a broad level to determine its prevalence as well as its role in facilitating community partnerships, problem solving, and organizational transformation. The survey explored promising practices that were being conducted by agencies in order to successfully achieve and overcome barriers that hinder crime analysis integration.
The survey was conducted in 2008 with a random sample of 1,000 local‡ police agencies stratified by agency size, type, and geography. It was constructed based on an earlier PERF survey16 and other extant surveys. The survey contained components for both the head of crime analysis and the head of patrol to complete. PERF used a proven survey distribution plan (e.g., multiple waves of surveys, reminder letters, faxed survey/phone reminders), and achieved approximately a 60 percent response rate. While a 60 percent response rate is fairly good, it is a bit lower than PERF typically achieves in conducting law enforcement surveys. This lower response rate may reflect that the topic was of less interest to agencies and that they may not have seen a compelling reason to complete the survey (i.e., crime analysis integration may not be a high priority for many agencies).
What follows is a presentation of the key findings from the survey about the prevalence, importance, and use of crime analysis. In addition, results about who dictates the production of crime analysis products and the barriers that agencies face in integrating crime analysis are also discussed.
Crime Analysis Prevalence and Importance
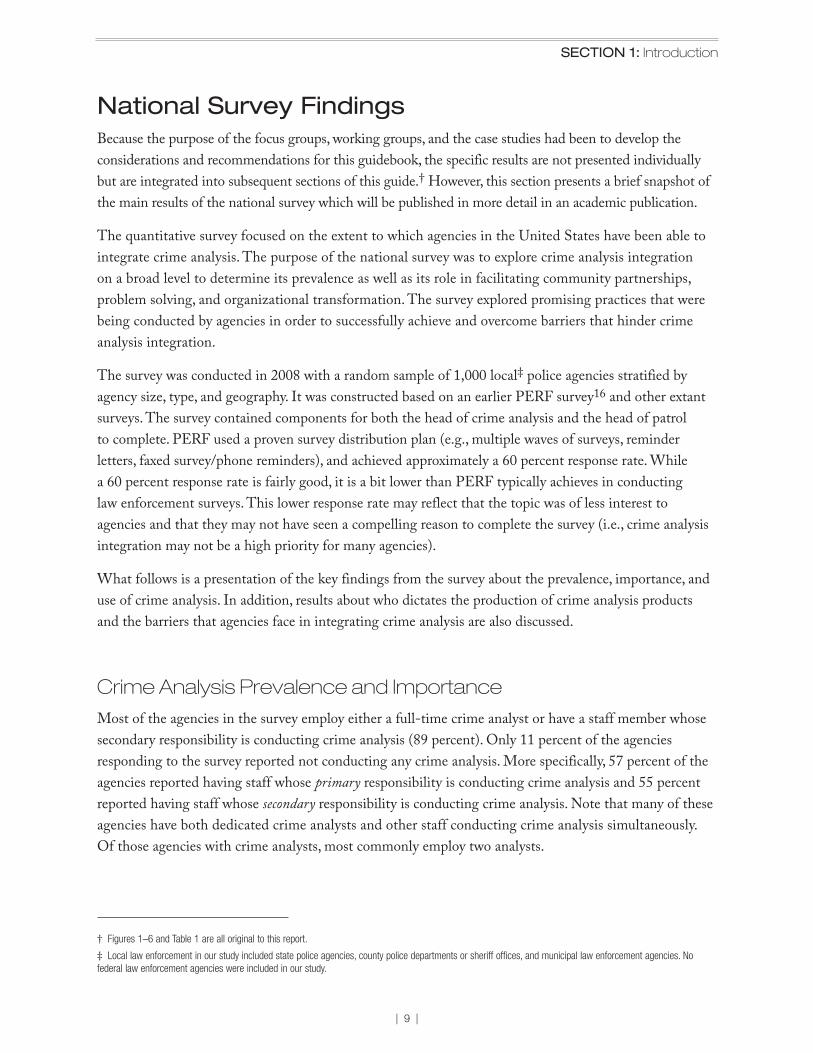
Most of the agencies in the survey employ either a full-time crime analyst or have a staff member whose secondary responsibility is conducting crime analysis (89 percent). Only 11 percent of the agencies responding to the survey reported not conducting any crime analysis. More specifically, 57 percent of the agencies reported having staff whose primary responsibility is conducting crime analysis and 55 percent reported having staff whose secondary responsibility is conducting crime analysis. Note that many of these agencies have both dedicated crime analysts and other staff conducting crime analysis simultaneously. Of those agencies with crime analysts, most commonly employ two analysts.
† Figures 1–6 and Table 1 are all original to this report.
‡ Local law enforcement in our study included state police agencies, county police departments or sheriff offices, and municipal law enforcement agencies. No federal law enforcement agencies were included in our study.
| 10 |
The Integration of Crime Analysis Into Patrol Work: A Guidebook
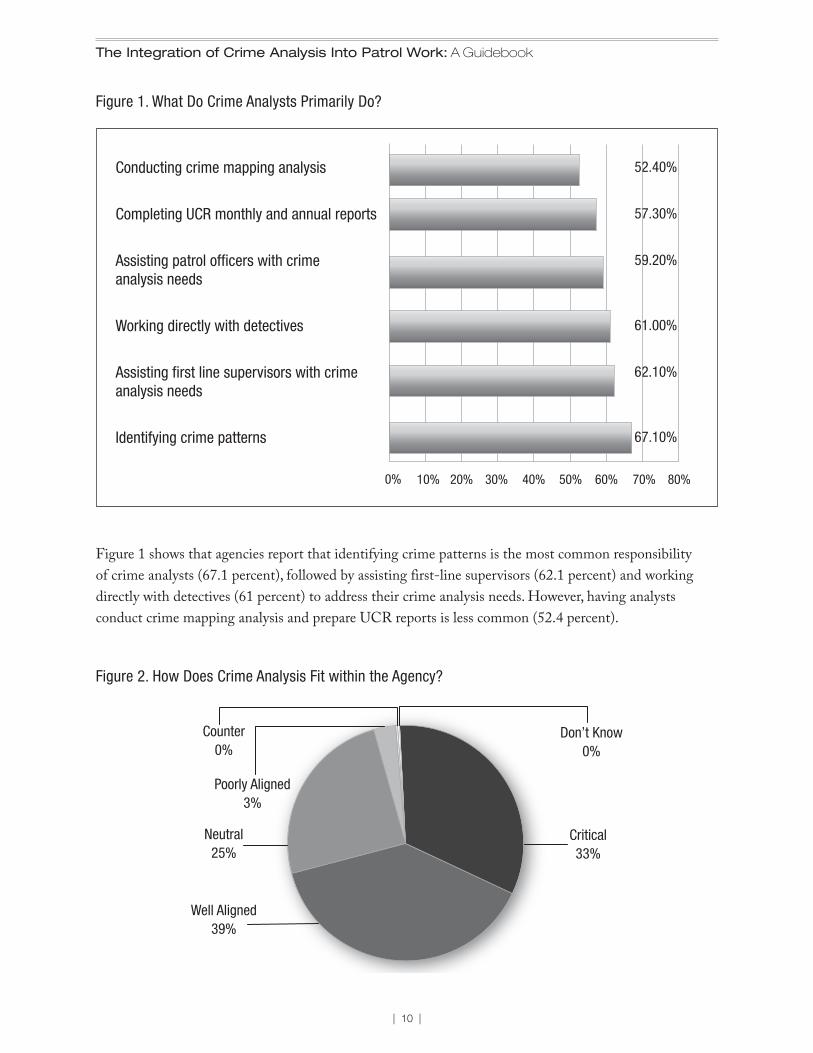
Figure 1 shows that agencies report that identifying crime patterns is the most common responsibility of crime analysts (67.1 percent), followed by assisting first-line supervisors (62.1 percent) and working directly with detectives (61 percent) to address their crime analysis needs. However, having analysts conduct crime mapping analysis and prepare UCR reports is less common (52.4 percent).
Conducting crime mapping analysis
Completing UCR monthly and annual reports
Assisting patrol of�cers with crime analysis needs
Working directly with detectives
Assisting �rst line supervisors with crime analysis needs
Identifying crime patterns
52.40%
57.30%
59.20%
61.00%
62.10%
67.10%
0% 10% 20% 30% 40% 50% 60% 70% 80%
Figure 1. What Do Crime Analysts Primarily Do?
Figure 2. How Does Crime Analysis Fit within the Agency?
Poorly Aligned3%
Counter0%
Don’t Know0%
Critical33%
Well Aligned39%
Neutral25%
| 11 |
SECTION 1: Introduction
Figure 2 indicates that most (72 percent) patrol commanders (i.e., the designated respondents to these questions) believe that crime analysis fits well within the agency by reporting that it is either well-aligned or critical to aiding the agency accomplish its mission and goals.
Finally, few analysts or patrol command personnel thought there is a lack of recognition of the value of crime analysis (12 percent), the lack of patrol using crime analysis (11 percent), or a lack of support for the idea of crime analysis (5 percent). In fact, crime analysis was perceived between a high or somewhat of a priority, with a mean score of 3.34 on a scale of 1 (not a priority at all) to 5 (vital).
Use of Crime Analysis
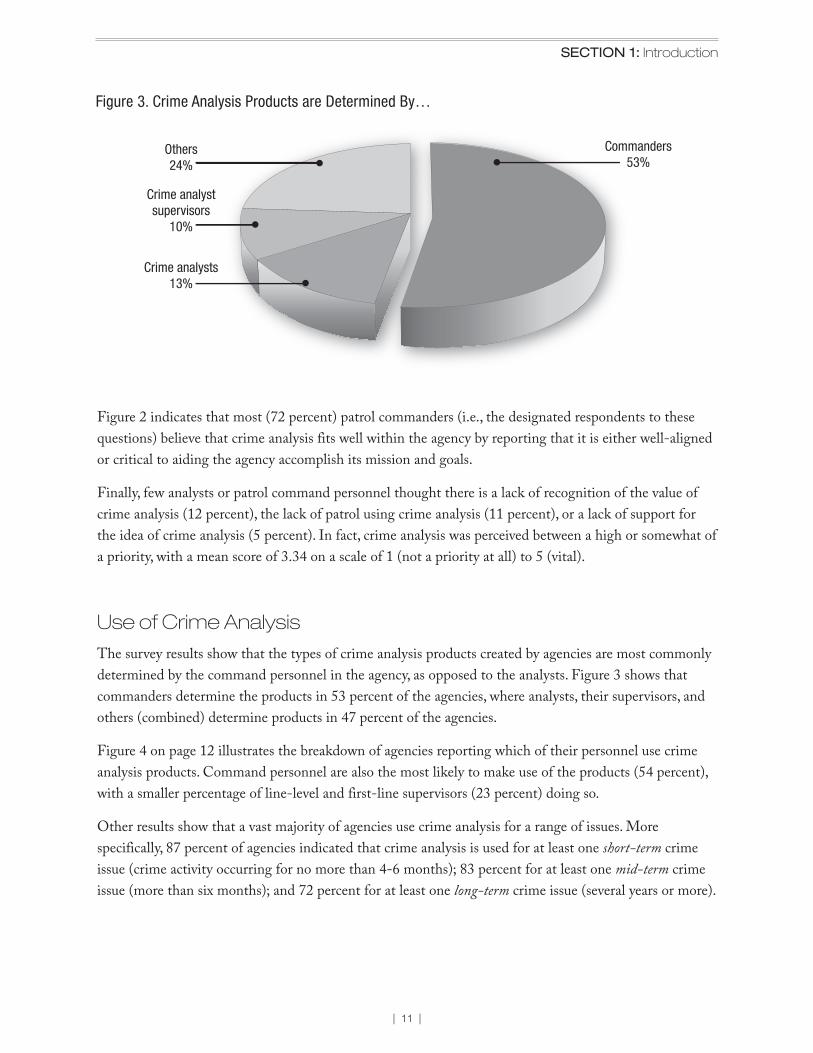
The survey results show that the types of crime analysis products created by agencies are most commonly determined by the command personnel in the agency, as opposed to the analysts. Figure 3 shows that commanders determine the products in 53 percent of the agencies, where analysts, their supervisors, and others (combined) determine products in 47 percent of the agencies.
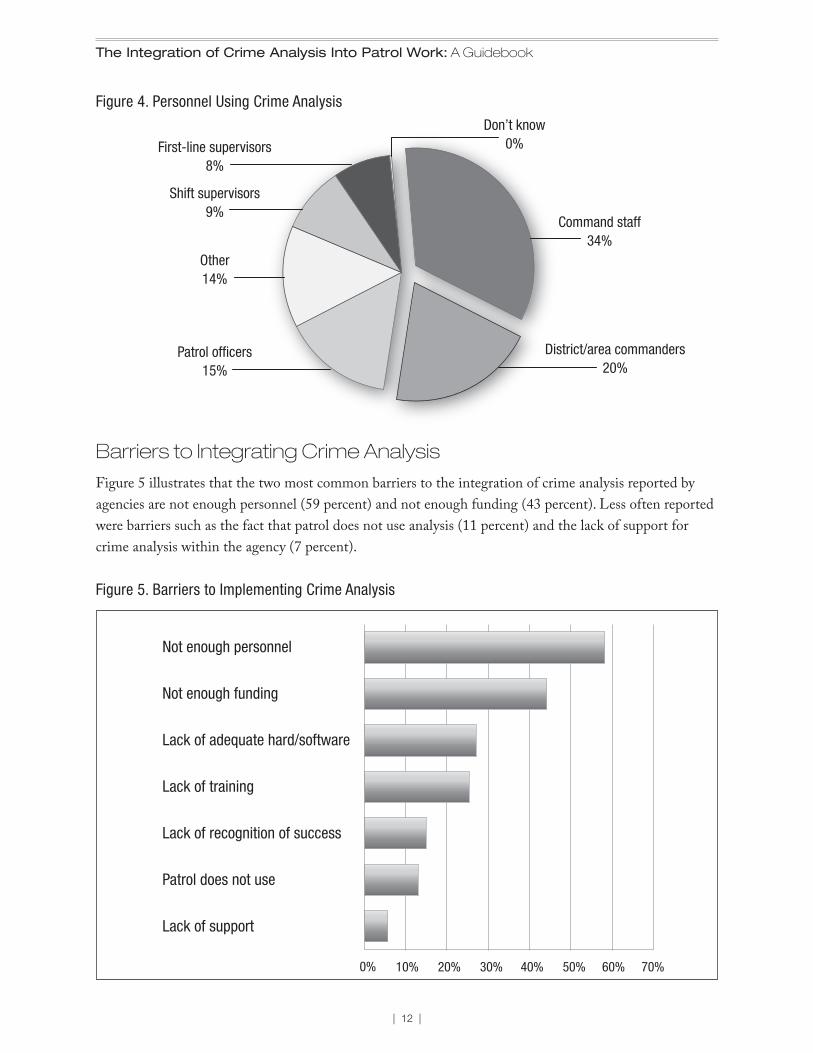
Figure 4 on page 12 illustrates the breakdown of agencies reporting which of their personnel use crime analysis products. Command personnel are also the most likely to make use of the products (54 percent), with a smaller percentage of line-level and first-line supervisors (23 percent) doing so.
Other results show that a vast majority of agencies use crime analysis for a range of issues. More specifically, 87 percent of agencies indicated that crime analysis is used for at least one short-term crime issue (crime activity occurring for no more than 4-6 months); 83 percent for at least one mid-term crime issue (more than six months); and 72 percent for at least one long-term crime issue (several years or more).
Figure 3. Crime Analysis Products are Determined By…
Commanders53%
Others24%
Crime analysts13%
Crime analyst supervisors
10%
| 12 |
The Integration of Crime Analysis Into Patrol Work: A Guidebook
Barriers to Integrating Crime Analysis
Figure 5 illustrates that the two most common barriers to the integration of crime analysis reported by agencies are not enough personnel (59 percent) and not enough funding (43 percent). Less often reported were barriers such as the fact that patrol does not use analysis (11 percent) and the lack of support for crime analysis within the agency (7 percent).
Figure 5. Barriers to Implementing Crime Analysis
Not enough personnel
Not enough funding
Lack of adequate hard/software
Lack of training
Lack of recognition of success
Patrol does not use
Lack of support
0% 10% 20% 30% 40% 50% 60% 70%
Figure 4. Personnel Using Crime Analysis
Don’t know
First-line supervisors 0%
8%
Shift supervisors9%
Command staff34%
Other14%
Patrol of�cers District/area commanders
15% 20%
| 13 |
SECTION 1: Introduction
Other implementation issues are also apparent in the survey results. About half the agencies reported having no feedback mechanism that communicates the impact of crime analysis efforts. Nearly 20 percent of the agencies indicated that line officers have little to no contact with crime analysis personnel, nor do they communicate regularly with them. In fact, only a small percentage of agencies have their crime analysts attend roll call briefings at least once per week (24 percent) and only 17 percent of the analysts conduct ride-alongs with patrol officers.
Results Summary
Overall, the survey results indicate that most police agencies have at least one staff member conducting crime analysis and often have two or more conducting crime analysis, whether they are designated crime analysts or conduct crime analysis as a secondary responsibility. Further, most agencies consider crime analysis a priority and critical to achieving the agency mission and well aligned with agency functions. These results are encouraging and provide the groundwork for a field wide movement to support a host of data-driven policing approaches.
However, there are other results that indicate much work still needs to be done to bring about an integrated approach within police organizations to make crime analysis an important part of how patrol operates. The survey responses suggest that few patrol officers make use of crime analysis or have contact with crime analysis personnel, agencies typically have no feedback mechanism for the impact of crime analysis, and analysts infrequently make use of opportunities (e.g., roll call briefings or ride-alongs) to better understand the operations and culture of patrol.
It is apparent from these results and the research literature discussed in the previous section that there is a need for greater attention and assistance for police agencies to integrate crime analysis into their operations. This guidebook seeks to contribute to this endeavor.
Guidebook ThemesBecause this guidebook’s primary purpose is to take the results of the COPS Office funded research project and translate them into a succinct practical guide for police agencies who are seeking to more fully integrate crime analysis into their day-to-day patrol operations, it does not simply focus on improving the crime analysis capacity of an agency, but presents recommendations and considerations for an organizational approach for crime analysis integration. From the literature reviewed and the research that was conducted as a precursor to and preparation for this guidebook, three critical themes emerge and help to organize the rest of the guidebook.
The first theme, discussed in Section II, concerns general issues and potential barriers for the integration of crime analysis that should be considered and examined within each agency that is attempting to implement crime analysis. That is, each agency’s organizational structure and culture, as well as other issues, dictate how crime analysis can be integrated into the agency. The discussion of this theme will explore how leadership, accountability, the purpose of analysis, the different audiences of crime analysis products, and policies and procedures for crime analysis facilitate the integration of crime analysis into patrol.
| 14 |
The Integration of Crime Analysis Into Patrol Work: A Guidebook
The second and most practical theme, discussed in Section III, is instruction for developing crime analysis products, and provides illustrations of products. More specifically, the section outlines key characteristics and standardized content for crime analysis products generally, and then illustrates concepts introduced in Section II with 12 specific product examples.
The third and final theme of the guide, discussed in Section IV, is the need for an implementation framework for integrating crime analysis into patrol. Recommendations are provided based on the focus and working group discussions as well as a model developed by one of the guidebook’s authors through practiced-based research.17
Finally, Section V contains conclusions from the guidebook and provides a discussion of the future implications of the considerations and recommendations made in this guidebook. It also makes some suggestions for future research that seeks to further hone these themes.
| 15 |
SECTION 2: General Issues and Potential Barriers for Crime Analysis Integration
SECTION 2: General Issues and Potential Barriers for Crime Analysis Integration
T he discussion of this first theme explores how leadership, accountability, the purpose and audiences of crime analysis products, as well as policies and procedures for crime analysis facilitate the integration of crime analysis. What follows is a discussion of each of these considerations. It should
be noted that for each agency seeking to integrate crime analysis, these issues can play out differently and should be examined based on the organizational culture and capacity of each agency so that tailored solutions are implemented.
Leading the Integration of Crime AnalysisOne of the most striking and important findings from this research is that leadership plays a crucial role in the integration of crime analysis into a police agency. In the focus group and working group discussions, leadership was discussed as much more than the ability of the individuals within the agency to introduce crime analysis to the agency and guide its adoption. The groups emphasized that the leadership required to integrate crime analysis, as with any major change in an agency, must be based in the highest rank within the agency. That is, in order for crime analysis to be fully and effectively integrated, the chief executive of the agency must be the leader and champion of crime analysis, focusing on four critical areas: 1) demonstrating and demanding value, 2) linking the priority of analysis to the organization’s mission, 3) having the right people in the right places, and 4) prioritizing technology and data quality.
Leadership has been described as a process of social influence where one person enlists the help and support of others in the accomplishment of a common task.18 For most strategies implemented in any size police organization, leadership must continually recognize and articulate the value and importance of the strategy. The leader, by definition, is the person out front showing what is most valuable to the agency. Traditionally, police leaders have emphasized the safety of the officers and the public, a quick response to emergencies and crime victims, prevention and enforcement efforts, and exhibiting equitable and reasonable treatment to all. This applies to integrating crime analysis as well. To be integral, the guiding principles of a police agency should also be the guiding principles of the crime analysis effort. The agency’s leadership should have a basic outward knowledge of how information and analysis can be used and should be able to illustrate how it is of value. The leadership has to constantly reinforce the importance and value of crime analysis, especially because it will take some time to fully integrate and change people’s attitudes and behaviors (i.e., it is not just creating and disseminating a new weekly report, but a new way of doing business). In other words, its adoption and use in everyday operations must not be a choice, but a way of doing things.
| 16 |
The Integration of Crime Analysis Into Patrol Work: A Guidebook
One way to do this is linking the priority of analysis to the organization’s mission, which by definition is the integration of analysis into the operations of the agency. It is the leader who must make sure this occurs. Experienced leaders know that to achieve success, it takes time and the combined efforts of many people working together and making decisions to accomplish the mission. The agency mission should guide the actions of the agency’s leaders, spell out its overall goals, provide a sense of direction, and direct decision-making. The mission provides leadership with the framework or context within which the agency’s strategies and activities are formulated. Two examples of missions linked with analysis are:
•Mission: Address hotspot areas and problem places/addresses; Analysis: Identify the areas, places, and addresses, understand the underlying causes of crime, determine when and where responses should be employed, and evaluate the effectiveness of the strategies used.
•Mission: Target repeat offenders; Analysis: Prioritize and identify the repeat offenders and evaluate the strategy’s overall impact on crime.
Another way to integrate crime analysis is for leaders to identify key personnel with both formal and informal legitimacy (e.g., rank and loyalty, respectively) in the agency to be involved in the planning, designing, and adapting of crime analysis for the patrol mission. In the focus groups with agencies, numerous examples emerged of influential sergeants and lieutenants being drawn into the crime analysis process and then later assuming leadership roles in advancing the integration of analysis. For example, in the Port St. Lucie, Florida Police Department, a sergeant with a master’s degree in criminology and criminal justice became integral to crime analysis integration through his work on a variety of research and grants. When he was promoted to lieutenant, he became the supervisor of the crime analysis unit and even after being transferred from patrol to narcotics and then to criminal investigations, the crime analysis unit has remained under his supervision because of his unique knowledge and experience. Even further, our research suggests that a team of creative and self-motivated people who understand and believe in the integration of crime analysis are best suited to anticipate the needs of the agency, the community, and the patrol effort. For crime analysis in particular, these individuals would best be a balance of sworn and civilian personnel.
Because crime analysis is dependent on technology for data mining and storage, and tabular and geographic information systems, as well as statistical, presentation, and word processing programs, another critical issue is that police leaders prioritize expenditures for hardware and software that permit the collection and examination of data and the dissemination of analysis products. In addition, an agency’s leadership needs to be attentive to general trends in technology for data and crime analysis, and make sure the crime analysis unit is exploring the feasibility of implementing new technologies.
However, it is not only funding and acquisition of technology that is important. To facilitate better analysis, it is also necessary that leaders ensure that data entry procedures are consistently applied and enforced and that data are available to analysts in a timely manner. The phenomenon of unreliable and ineffective data is only too common in police agencies. Even if the technology is there, if no policies are written or procedures enforced, the data on which analysis can be based will be worthless.
| 17 |
SECTION 2: General Issues and Potential Barriers for Crime Analysis Integration
Leadership represents a crucial determinant of police organizational efficacy,19 and its importance in the area of crime analysis is no exception. Bringing about the integration of crime analysis is going to take leadership from the very highest levels of the agency. While grassroots movements within agencies (e.g., among line officers and crime analysis personnel) to integrate crime analysis into police practice can be important to advancing crime analysis, the commitment and leadership from the agency executive team is essential to integrating it into agency operations, particularly patrol. Police leaders need to actively cultivate the agency environment to support the active use of crime analysis and become champions of crime analysis in a number of the critical areas as discussed previously.
Importance of AccountabilityAn important consideration in leadership is ensuring that crime analysis is integrated systematically and consistently—this occurs through accountability processes. More generally, accountability for crime reduction in policing involves laying out a strategy, creating expectations, and providing resources for accomplishing that strategy, ensuring the work is done, and evaluating effectiveness.
Based on the focus and working group discussions, accountability was noted as the primary barrier to an agency’s systematic integration and use of crime analysis. Granted, personnel here and there may “choose” to use crime analysis, but to get everyone to use it consistently they must be held accountable for using it. Just as agencies have to make sure officers clean and upkeep their uniforms and vehicles, they also have to make sure personnel use crime analysis. The “use” of crime analysis by patrol can take several forms. For example, in some cases line officers may use the crime analysis products directly and base their patrol strategy on patterns revealed in these products. However, in other cases, a supervisor may use a crime analysis product to develop a strategy for patrol officers to follow for a particular shift. Alternatively, a mixed approach of a supervisor developing a preliminary strategy that is then refined with input from the line officers is another way to make “use” of crime analysis.
The participants noted that for the chief or sheriff to say that crime analysis is important or to simply provide analysis products to patrol is not enough to integrate crime analysis into day-to-day operations. Police departments, and more specifically their patrol divisions, have been able to operate without crime analysis in the past, so it will take more than a superficial endorsement from the command staff and making products available for it to be adopted. It is not realistic to expect individual officers, supervisors, and managers to be “inspired” to use it just because it is available. In addition, accountability is inherently linked to the quality of the crime analysis products that are used. Part of accountability is having expectations that must be fulfilled, but sworn personnel can’t be asked to change and improve how they implement crime reduction strategies based on analysis that is not relevant or actionable.
Some of the focus and working group participants pointed out the significance of CompStat in creating a springboard for the advancement of crime analysis in an agency. Over the last 15 years, the CompStat model has diffused quickly within American police agencies and has become a widely embraced management model.20 It is a process that seeks to synthesize analysis of crime and disorder data, strategic problem solving, and a clear accountability structure.21 The focus and working group participants felt
| 18 |
The Integration of Crime Analysis Into Patrol Work: A Guidebook
that CompStat has created positive momentum for crime analysis integration and accountability, but that improvements to its current practices must be made. For example, they noted that accountability must occur at multiple levels within the organization simultaneously and that meetings focused on crime reduction accountability should occur daily, weekly, and monthly to ensure that the analysis is being acted upon consistently by all ranks in the agency. These issues are discussed more in depth in Section IV, Implementation Framework.
Purposes of Crime Analysis ProductsWhen integrating crime analysis, it is important to consider the crime analysis needs of an agency and its divisions as well as distinguish among the different types of crime analysis products that can be useful. This is essential because with the wealth of data and information that can be provided, crime analysis products must be focused and prioritized so that police personnel are not overwhelmed and/or provided products that are not relevant to their daily activities and responsibilities. From experience and the results of the focus and working groups with police practitioners, two categories of crime analysis products have emerged according to purpose. They are informational products that facilitate situational awareness and analytical products that direct crime reduction strategies.
Informational Products for Situational Awareness
Information refers to knowledge that is communicated about a particular fact or circumstance. In the crime analysis context, this refers to products that simply provide details about individual incidents (e.g., crime, calls for service, arrests, accidents), such as where, when, and how, or aggregate counts of incidents. Examples of informational products include a list of calls at a single address over several days, a list or map of parolees living in a particular area, or the counts of Part I crime types by geographic areas for one year.
Informational products provide patrol personnel facts for the purpose of providing situational awareness, which is the development of perceptions and understanding of the larger environment in which a person works. That is, informational products provide patrol personnel a context for their work environment, but do not necessarily elicit specific crime reduction strategies. For example, an informational product would be a list or map of all registered sexual offenders in a city. The product, updated and provided to officers, supervisors, and commanders on a daily basis, provides situational awareness by informing everyone where registered sex offenders live, but it does not direct specific responses because the information has not been filtered or prioritized.
| 19 |
SECTION 2: General Issues and Potential Barriers for Crime Analysis Integration
Analytical Products for Directing Crime Reduction Strategies
Analytical products, on the other hand, are developed by analyzing the essential characteristics of data and making conclusions about the relationships that exist among the facts. Analytical products distinguish and prioritize the elements of individual crimes or the relationships of clusters of crime and determine whether potential relationships exist with the purpose of directing crime reduction strategies. Thus, they are “action-oriented” in that analysis is not required by the user of the product, but has already been done.
One example is an analytical product that links six residential burglaries based on the following facts: entry is made through the rear slider and the crimes occur in a two block area of duplexes, during the day over several days. This product directs patrol officers to the two block area during the day to make field contacts, to disperse crime prevention flyers to residents in the two block area, and/or to dispatch undercover crime suppression units in that area during the time of the pattern. Another example is a list of registered sex offenders in which the offenders are prioritized by their status and type of crime. This product directs responses (e.g., house checks) to the worst and/or the most current registered offenders.
Contrasting Informational and Analytical Products
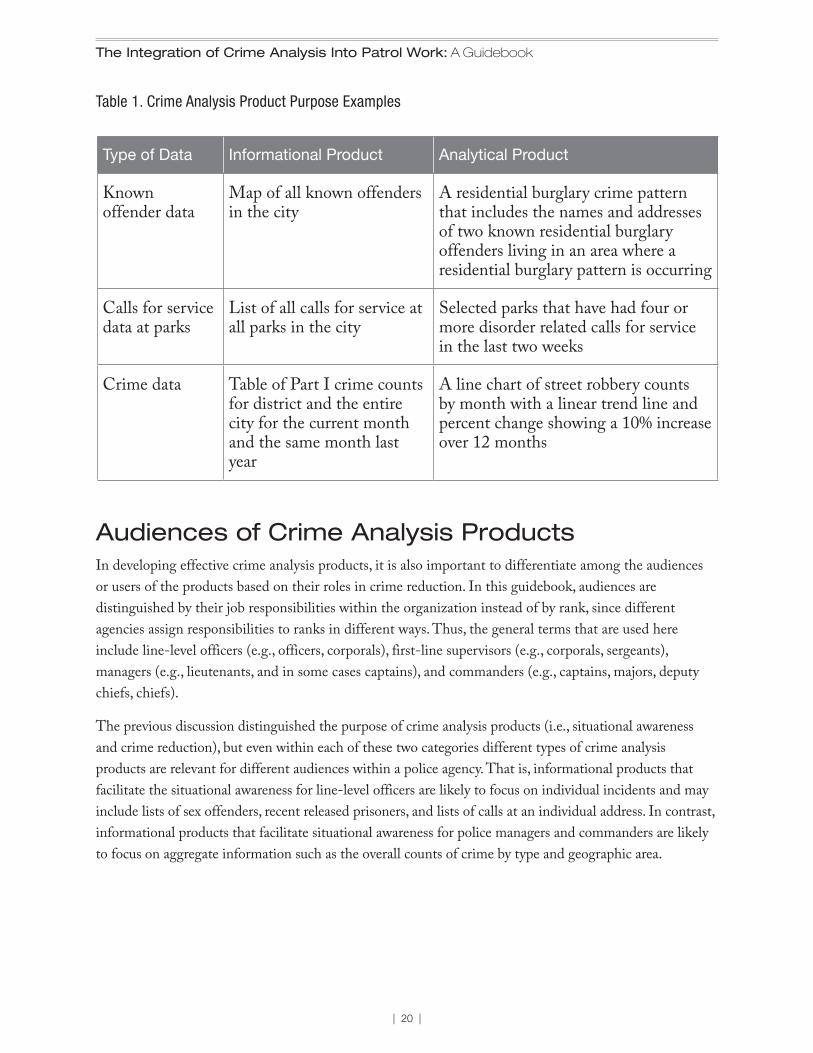
Although it may appear that informational and analytical products are similar because the data on which they are based are the same, the important differentiation is the purpose of the product itself, which influences the creation and final content. Yet, the systematic use of both informational and analytical products is important for police agencies to be effective in crime reduction. Officers, sergeants, and commanders need information to help them understand the environment in which they work as well as analysis to prioritize and direct specific crime reduction strategies. Table 1 on page 20 contrasts how similar data can be presented differently for informational and analytical purposes.
Importantly, not only do informational and analytical products have different purposes, they are typically created differently. Although this is not an exclusive difference, informational products are typically automated because they contain information directly from a database (e.g., all prison releases, counts of Part I crime). Analytical products, on the other hand, are typically produced by analysts who examine the data and identify relationships (e.g., a group of robberies that are linked by suspect description over several days, not all robberies occurring over those days). Granted, some analytical products can be automated, but analytical decisions are made before automation to distinguish and prioritize the information.
| 20 |
The Integration of Crime Analysis Into Patrol Work: A Guidebook
Audiences of Crime Analysis ProductsIn developing effective crime analysis products, it is also important to differentiate among the audiences or users of the products based on their roles in crime reduction. In this guidebook, audiences are distinguished by their job responsibilities within the organization instead of by rank, since different agencies assign responsibilities to ranks in different ways. Thus, the general terms that are used here include line-level officers (e.g., officers, corporals), first-line supervisors (e.g., corporals, sergeants), managers (e.g., lieutenants, and in some cases captains), and commanders (e.g., captains, majors, deputy chiefs, chiefs).
The previous discussion distinguished the purpose of crime analysis products (i.e., situational awareness and crime reduction), but even within each of these two categories different types of crime analysis products are relevant for different audiences within a police agency. That is, informational products that facilitate the situational awareness for line-level officers are likely to focus on individual incidents and may include lists of sex offenders, recent released prisoners, and lists of calls at an individual address. In contrast, informational products that facilitate situational awareness for police managers and commanders are likely to focus on aggregate information such as the overall counts of crime by type and geographic area.
Type of Data Informational Product Analytical Product
Known offender data
Map of all known offenders in the city
A residential burglary crime pattern that includes the names and addresses of two known residential burglary offenders living in an area where a residential burglary pattern is occurring
Calls for service data at parks
List of all calls for service at all parks in the city
Selected parks that have had four or more disorder related calls for service in the last two weeks
Crime data Table of Part I crime counts for district and the entire city for the current month and the same month last year
A line chart of street robbery counts by month with a linear trend line and percent change showing a 10% increase over 12 months
Table 1. Crime Analysis Product Purpose Examples
| 21 |
SECTION 2: General Issues and Potential Barriers for Crime Analysis Integration
Similarly, analytical products that direct crime reduction strategies for line-level officers and first-line supervisors are those designed to elicit immediate action and may include patterns of crime occurring in specific geographic areas in the past few days or weeks. Managers’ and commanders’ analytical products are likely to address more long-term action, such as whether crimes are increasing and decreasing over time, or an examination of parks, bars, or hotels where a disproportionate amount of activity is happening so that the problem solving process can be initiated.
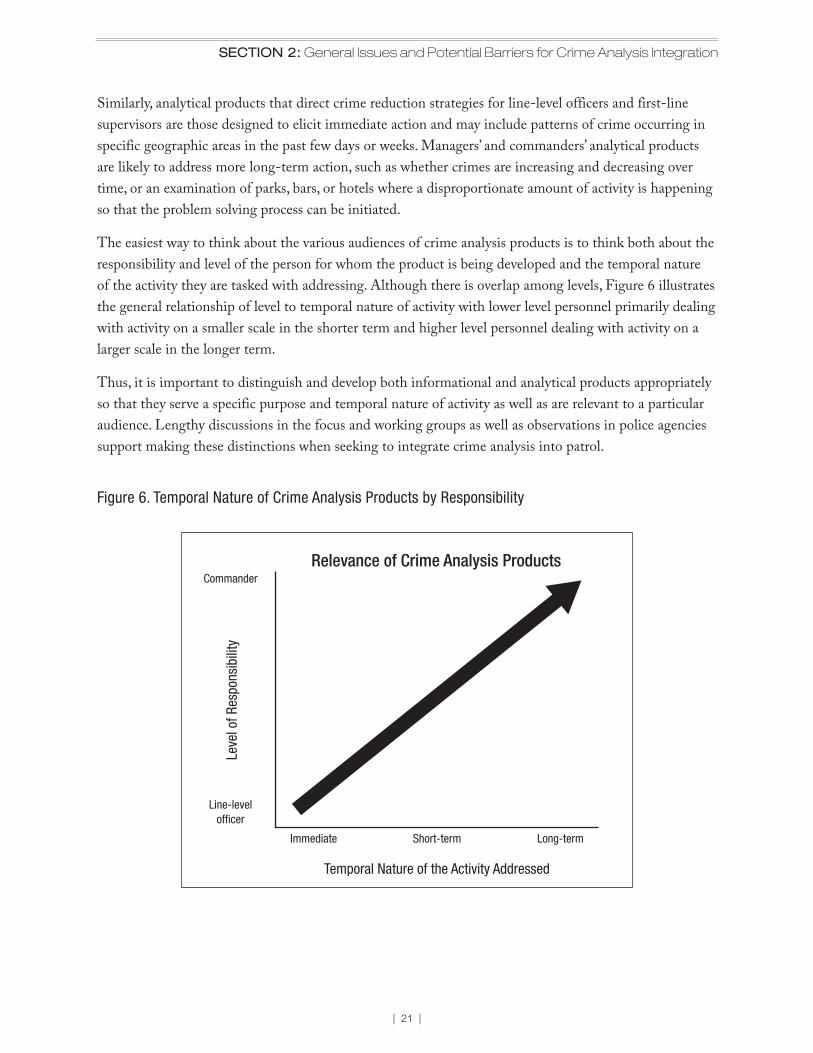
The easiest way to think about the various audiences of crime analysis products is to think both about the responsibility and level of the person for whom the product is being developed and the temporal nature of the activity they are tasked with addressing. Although there is overlap among levels, Figure 6 illustrates the general relationship of level to temporal nature of activity with lower level personnel primarily dealing with activity on a smaller scale in the shorter term and higher level personnel dealing with activity on a larger scale in the longer term.
Thus, it is important to distinguish and develop both informational and analytical products appropriately so that they serve a specific purpose and temporal nature of activity as well as are relevant to a particular audience. Lengthy discussions in the focus and working groups as well as observations in police agencies support making these distinctions when seeking to integrate crime analysis into patrol.
Figure 6. Temporal Nature of Crime Analysis Products by Responsibility
Relevance of Crime Analysis ProductsCommander
Leve
l of R
espo
nsib
ility
Line-levelof�cer
Immediate Short-term Long-term
Temporal Nature of the Activity Addressed
| 22 |
The Integration of Crime Analysis Into Patrol Work: A Guidebook
Developing Policies and Procedures for Crime AnalysisAs with many areas in policing where efforts are being made to institutionalize specific processes and practices, the integration of crime analysis also requires a set of policies and procedures that outline the agency’s expectations and guide integration. Agencies need to develop policies on the use of crime analysis and provide guidance for how crime analysis is to be produced as well.
At the broadest level, such policies would reflect agency priorities, such as focused and proactive hot spots policing, prediction or forecasting of long-term trends, emphasis on chronic high risk offenders, reduction of gun violence, measuring the effectiveness of problem solving, community partnerships, crime prevention or saturation patrol. More specifically, these policies would outline a close relationship between the need for a central repository of current and accurate data and the crime analysis process. In addition, the crime analysis function would be designated as the central location for an agency’s analysis products in order to avoid potential conflicts among departments or special units that produce their own sets of analysis results. Importantly, in the focus group discussions, examples arose in which there were attempts by non-crime analysis personnel to analyze data in their own way (often using unsound techniques and resulting in inaccurate results) to debunk results produced by crime analysts that did not support their objectives or painted them in a bad light. Specific policies on the crime analysis function should address these potential conflicts.
Finally, both policies and established procedures for crime analysis integration would illustrate the purpose and audiences of specific crime analysis products in order to ensure the appropriate products are created and distributed to the appropriate personnel. Policies would also clearly articulate the responsibility of agency management to reinforce the use of analytical products for problem solving and would contain specific information about how products would be disseminated, electronically stored, and queried for future reference. Consequently, for crime analysis to be integrated, as with any operational practice within a police agency, its policies and procedures must be integrated into the organizational culture through training, use, and accountability.
| 23 |
SECTION 3: Crime Analysis Products and Examples
SECTION 3: Crime Analysis Products and Examples
T his section of the guide provides practical guidance for the development of crime analysis products by outlining key characteristics and standardized content for crime analysis products as well as illustrating specific product examples based on the purposes, audiences, and temporal nature of
activity discussed throughout the guide.
Key Characteristics of Effective Crime Analysis ProductsFor crime analysis products to be useful they need to be “actionable,” in the sense that patrol personnel can use them to guide their activities. Crime analysis products should help patrol be more effective. Over time, patrol will get better at using crime analysis products, and developing responses and assigning officers based on these products. In order to integrate crime analysis into patrol, the products that both facilitate situational awareness and crime reduction strategies should be developed with a number of general considerations in mind, including:
Relevance: As discussed in Section II, there are a variety of different products that can be developed for patrol. Each product should be developed with consideration of the audience (line-level, first-line supervisors, managers, and commanders), the temporal nature of activity addressed (immediate, short-term, and long-term), and the purpose (situational awareness and crime reduction strategies).
Simplicity: The information conveyed in each product should be prepared using simple language and clear formatting. Lengthy paragraphs and discussions of findings, or too much information on a single page, should be avoided so that the product can be absorbed fairly easily and used in the field effectively. Also, using complicated statistical methods when simple ones will suffice may result in a confusing product that will not be useful—or used.
Consistency: The format and content of a product should be similar across shifts and geographic areas so that personnel at the same rank who are reassigned to a different shift or area receive similar products and do not have to re-familiarize themselves with crime analysis products upon each organizational move.
Automation: Those products that are nearly identical each day, week, or month and, once created, require little review by an analyst should be automated with the use of technology so time is saved for products requiring more in depth review by analysts. Dissemination of information should also be automated whenever appropriate, whether through email or an intranet site.
| 24 |
The Integration of Crime Analysis Into Patrol Work: A Guidebook
Twelve Examples of Crime Analysis ProductsTwelve examples are provided here that illustrate both informational and analytical products created and used by police agencies who participated in this research project from around the United States. These tangible examples provide clarity for agencies on the types of products they can begin to adapt to bring them closer to an integrated approach to crime analysis. The examples are broken down by purpose, temporal nature of activity, and by audience.
Although products could be developed for each audience discussed in the guidebook, for the sake of simplicity and brevity, only two types of audiences are presented in these examples. Line-level officers and first-line supervisors are referred to as “operational personnel” and unit, section, and division managers and commanders are referred to as “management personnel.” As noted previously, these classifications and categories are simplified since police agencies vary in how they assign responsibility to rank.
Thus, the following is an overview of the examples provided:
Situational AwarenessImmediate
1. Operational personnel 2. Management personnel
Short-Term3. Operational personnel 4. Management personnel
Long-Term5. Operational personnel 6. Management personnel
Crime Reduction Immediate
7. Operational personnel 8. Management personnel
Short-Term9. Operational personnel 10. Management personnel
Long-Term11. Operational personnel 12. Management personnel
The purpose of this section is to provide real examples for each of the purposes, audiences, and temporal nature of activity that is discussed in this guide in order to show those looking to implement crime analysis what such products might look like. In no way is this an exhaustive list of the types of products that could be produced, but they illustrate the wide range of possibilities that can be developed. Notably, these products are currently being used in police agencies and represent both common as well as innovative crime analysis products.
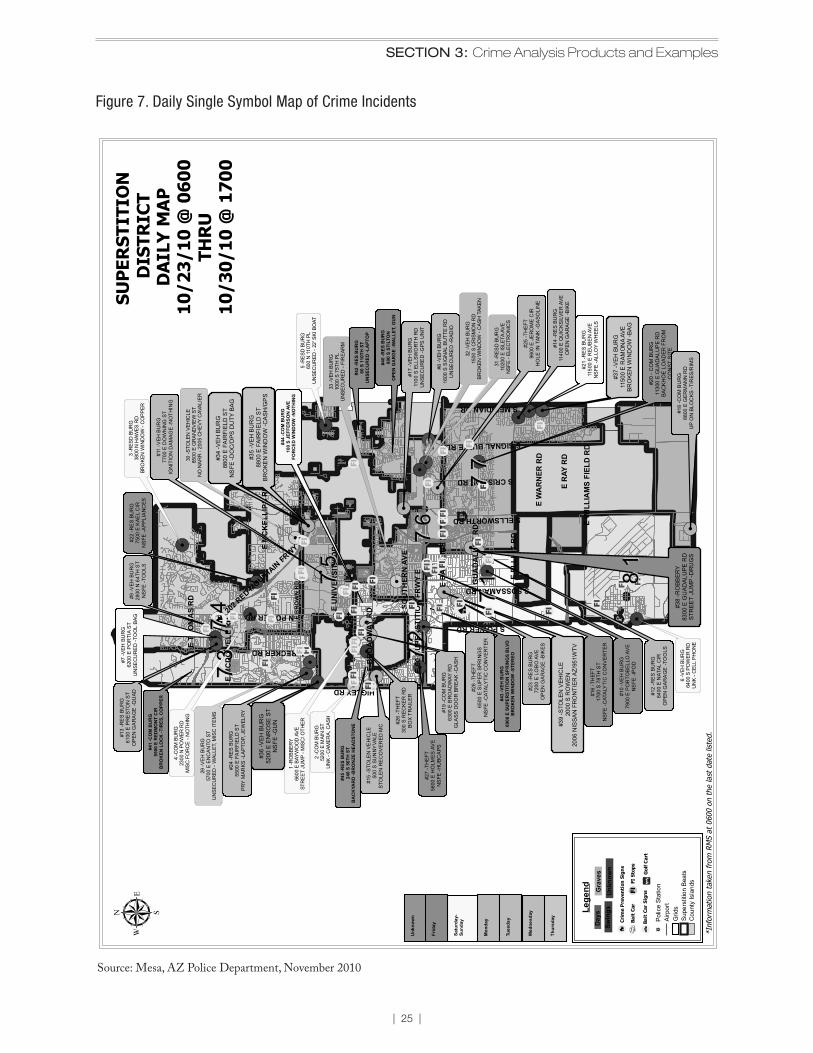
Example 1. Situational Awareness of Immediate Activity for Operational PersonnelDescription: Figure 7 on page 25 shows a map of the general locations of all crimes occurring during a one-week period across one of four police districts and lists certain characteristics about each crime (e.g., type of crime, record number, address, day of the week, shift, and property taken). The information in the product accumulates daily and is used to inform officers about all the crimes that have occurred over the last week as they may have not been working in the area, on the day, or on the shift when the crime occurred.
| 25 |
SECTION 3: Crime Analysis Products and Examples
a
a! .! .
! .
! .
! .
! .
! .
! .
! .
! .! .
! .
! .
! .
! .
! .
! .
! .
! .
! .
! .
! .
! .
! .
! .
! .
! .! .
! .! .
! .! .
! .
! .! .! .
! .
! .
! .
S SIGNAL BUTTE RDN 20
2 RED M
OUNTAIN FRWY S
S MERIDIAN DR
E TH
OM
AS
RD
S HIGLEY RD
S ELLSWORTH RD
E U
NIV
ERSI
TY D
R
E 60
SU
PER
STIT
ION
FR
WY
E
S SOSSAMAN RD
E EL
LIO
T R
D
E B
RO
AD
WAY
RD
N RECKER RD
E M
CK
ELLI
PS R
D
E B
RO
WN
RD
N POWER RDE
BA
SELI
NE
RD
E G
UA
DA
LUPE
RD
S POWER RD
E W
ILLI
AM
S FI
ELD
RD
E R
AY R
D
E W
AR
NER
RD
E SO
UTH
ERN
AVE
E M
AIN
ST
E M
CD
OW
ELL
RD
S CRISMON RD
cj
cj
#20
- CO
M B
UR
G11
300
E G
UA
DA
LUP
E R
DBA
CK
HO
E L
OA
DER
FR
OM
CO
NS
T S
ITE
6 -V
EH B
UR
G64
00 S
PO
WER
RD
UN
K - C
ELL
PHO
NE
3 -R
ESD
BU
RG
3800
N H
AWES
RD
BRO
KEN
WIN
DO
W -
CO
PPER
2 -C
OM
BU
RG
5200
E M
AIN
ST
UN
K - C
AMER
A, C
ASH
4 -C
OM
BU
RG
2300
N P
OW
ER R
DM
ISC
FO
RC
E - N
OTH
ING
5 -R
ESD
BU
RG
600
N 1
10TH
PL
UN
SEC
UR
ED -
22' S
KI B
OAT
1 -R
OBB
ERY
6600
E B
AYW
OO
D A
VEST
REE
T JU
MP
- MIS
C/ O
THER
#8 -V
EH B
UR
G16
00 S
SIG
NAL
BU
TTE
RD
UN
SEC
UR
ED
-RAD
IO
#9 -V
EH B
UR
G28
00 N
64T
H S
TN
SFE
-TO
OLS
#10
-VE
H B
UR
G79
00 E
PO
RTO
BEL
LO A
VE
NS
FE -I
PO
D
#13
-RE
S BU
RG
6100
E P
RE
STO
N S
TO
PEN
GA
RA
GE
-QU
AD #12
-RE
S BU
RG
8400
E N
ATAL
CIR
OP
EN G
AR
AG
E -T
OO
LS
#7 -V
EH B
UR
G62
00 E
PO
RTI
A ST
UN
SEC
UR
ED
-TO
OL
BAG
#16
-TH
EFT
1700
S 7
8TH
ST
NS
FE -C
ATA
LYTI
C C
ON
VER
TER
#14
-RE
S BU
RG
1140
0 E
QU
ICKS
ILVE
R A
VEO
PEN
GA
RA
GE
-BIK
E
#15
-STO
LEN
VE
HIC
LE50
0 S
SUN
NY
VALE
STO
LEN
RE
CO
VER
ED M
C
#11
-VEH
BU
RG
7700
E D
OW
NIN
G S
TIG
NIT
ION
DAM
AGE
-NO
THIN
G
#18
-CO
M B
UR
G88
00 E
GER
MAN
N R
DU
P O
N B
LOC
KS -T
IRES
/RIM
S
#26
-TH
EFT
300
S R
ECKE
R R
DBO
X TR
AIL
ER
#27
-TH
EFT
5600
E H
OLM
ES A
VE
NS
FE -H
UBC
APS
#22
-RE
S BU
RG
7500
E K
AEL
CIR
NS
FE -A
PPL
IAN
CES
#23
-RE
S BU
RG
7200
E L
OB
O A
VEO
PEN
GA
RA
GE
-BIK
ES
#25
-TH
EFT
9600
E J
ER
OM
E C
IRH
OLE
IN T
ANK
-GA
SOLI
NE
#21
-RE
S BU
RG
1150
0 E
REU
BEN
AVE
NS
FE -A
LLO
Y W
HEE
LS
#17
-VE
H B
UR
G11
00 S
ELL
SWO
RTH
RD
UN
SEC
UR
ED
-GPS
UN
IT
#19
-CO
M B
UR
G63
00 E
BR
OA
DW
AY R
DG
LASS
DO
OR
BR
EAK
-CA
SH
#24
-RE
S BU
RG
5500
E F
AIR
FIE
LD S
TPR
Y M
ARKS
-LA
PTO
P, J
EW
ELR
Y
#28
-TH
EFT
6500
E S
UP
ER S
PRIN
GS
NS
FE -C
ATA
LYTI
C C
ON
VER
TER
31 -R
ESD
BU
RG
1020
0 E
ISLE
TA A
VEN
SFE
- ELE
CTR
ON
ICS
32 -V
EH B
UR
G15
00 S
CR
ISM
ON
RD
BRO
KEN
WIN
DO
W -
CAS
H T
AKEN
29 -V
EH B
UR
G57
00 E
EN
CAN
TO S
TU
NSE
CU
RED
- W
ALLE
T, M
ISC
ITEM
S
33 -V
EH B
UR
G10
00 S
75T
H P
LU
NSE
CU
RED
- FI
REA
RM
30 -S
TOLE
N V
EHIC
LE85
00 E
GR
AN
DVI
EW S
TN
O N
AR
R -
2005
CH
EVY
CAV
ALIE
R
#36
-VEH
BU
RG
5200
E E
NR
OSE
ST
NS
FE -G
UN
#38
-RO
BBER
Y83
00 E
GU
ADAL
UPE
RD
STR
EET
JUM
P -D
RU
GS
#37
-VEH
BU
RG
1150
0 E
RAM
ON
A AV
EBR
OKE
N W
IND
OW
-BA
G
#34
-VEH
BU
RG
8800
E F
AIR
FIEL
D S
TN
SFE
-DO
C/D
PS D
UTY
BAG
#35
-VEH
BU
RG
8800
E F
AIR
FIEL
D S
TBR
OKE
N W
IND
OW
-CA
SH/G
PS
#39
-STO
LEN
VEH
ICLE
2000
S R
OW
EN20
06 N
ISSA
N F
RO
NTI
ER A
Z/95
1WTV
#45
-RES
BU
RG
240
S 56
TH S
TB
AC
KYA
RD
-BR
ON
ZE H
EAD
STO
NE
#44
-CO
M B
UR
G10
0 S
JEFF
ERSO
N A
VEFO
RC
ED W
IND
OW
-NO
THIN
G
#41
-CO
M B
UR
G55
00 E
RED
MO
NT
CIR
BR
OK
EN L
OC
K -T
IRES
, CO
PPE
R
#40
-RES
BU
RG
800
S ST
ILTO
NO
PEN
GA
RG
E -W
ALL
ET, G
UN
#43
-VEH
BU
RG
6900
E S
UPE
RST
ITIO
N S
PR
ING
S B
LVD
BR
OK
EN W
IND
OW
-STE
REO
#42
-RES
BU
RG
60 S
110
TH S
TU
NSE
CU
RED
-LA
PTO
P
cI
cI
cIcI
cI
cI
cI
cIcI
cI
cIcI
cI cI
cIcI
cI
cI
cI
cI
cI cI
cI
cI
cI
cI
cI
cI
cI
cI
cI
cI
cI cI
cI
cI cI
cI
cIcI
cI
cI cI
cI
cI
cI
cI
cI
cI
cI
cI
cIcI
cI
cI
cI
cI
cI
cI
cI7
67
6
74
74
77
77
81
81
71
71
73
73
75
75
72
72
SUP
ERST
ITIO
N
DIS
TRIC
Tµ
DA
ILY
MA
P10
/23/
10 @
060
0TH
RU
10/3
0/10
@ 1
700
*Inf
orm
atio
n ta
ken
from
RM
S at
060
0 on
the
last
dat
e lis
ted.
Lege
nd
caP
olic
e S
tatio
nA
irpor
t
Cou
nty
Isla
nds
Grid
sS
uper
stiti
on B
eats
Gra
ves
Days
Swin
gsUn
know
n
c+Ba
it C
ar S
igns
Bait
Car
cI
FI S
tops
cjCr
ime
Pre
vent
ion
Sign
s
!MG
olf C
art
Mon
day
Thur
sday
Wed
nesd
ay
Tues
day
Satu
rday
-Su
nday
Unk
now
n
Frid
ay
Figure 7. Daily Single Symbol Map of Crime Incidents
Source: Mesa, AZ Police Department, November 2010
| 26 |
The Integration of Crime Analysis Into Patrol Work: A Guidebook
Considerations: Although the format of this product may be distinct to the Mesa, Arizona Police Department, the information provided (e.g., complete list of incidents) is commonly disseminated in police agencies. Typically, these types of products can be automated when they are static (i.e., produced once a week), or the information can be provided in a dynamic way (i.e., each time the map is accessed, the most recent information is presented) through an interactive crime mapping website. In either case, this is an informational product because it does not indicate any relationships or patterns among the crimes, but simply provides data in a clear, understandable way, and the users must determine any patterns or relationships among the incidents themselves.
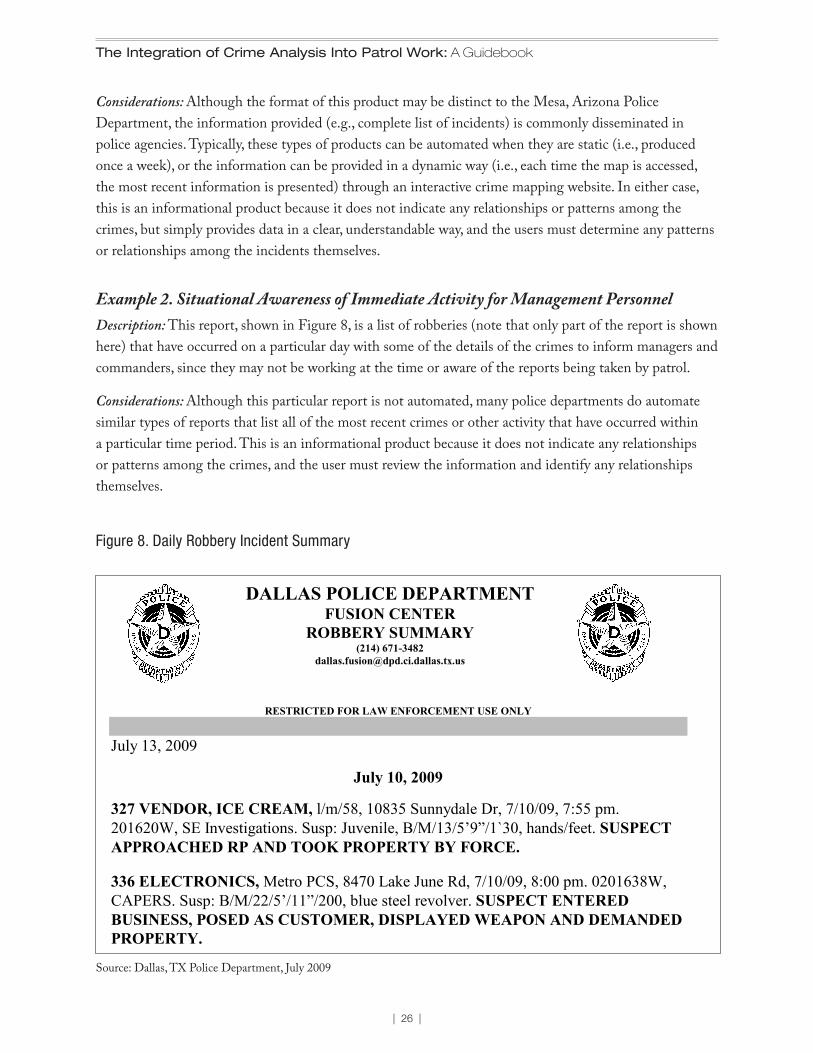
Example 2. Situational Awareness of Immediate Activity for Management PersonnelDescription: This report, shown in Figure 8, is a list of robberies (note that only part of the report is shown here) that have occurred on a particular day with some of the details of the crimes to inform managers and commanders, since they may not be working at the time or aware of the reports being taken by patrol.
Considerations: Although this particular report is not automated, many police departments do automate similar types of reports that list all of the most recent crimes or other activity that have occurred within a particular time period. This is an informational product because it does not indicate any relationships or patterns among the crimes, and the user must review the information and identify any relationships themselves.
Source: Dallas, TX Police Department, July 2009
Source: Listed DPD Offense Reports Prepared by: Donald E. Cooper Senior Criminal Intelligence Analyst [email protected]
1
DALLAS POLICE DEPARTMENT FUSION CENTER
ROBBERY SUMMARY (214) 671-3482
RESTRICTED FOR LAW ENFORCEMENT USE ONLY July 13, 2009
July 10, 2009
327 VENDOR, ICE CREAM, l/m/58, 10835 Sunnydale Dr, 7/10/09, 7:55 pm. 201620W, SE Investigations. Susp: Juvenile, B/M/13/5’9”/1`30, hands/feet. SUSPECT APPROACHED RP AND TOOK PROPERTY BY FORCE.
336 ELECTRONICS, Metro PCS, 8470 Lake June Rd, 7/10/09, 8:00 pm. 0201638W, CAPERS. Susp: B/M/22/5’/11”/200, blue steel revolver. SUSPECT ENTERED BUSINESS, POSED AS CUSTOMER, DISPLAYED WEAPON AND DEMANDED PROPERTY.
July 11, 2009
143 CONVENIENCE, Hub Food Store, 2801 N Fitzhugh Ave, 7/11/09, 8:20 pm. 0202722W, CAPERS. Susp: B/M/30/6’/200, shirt over face, handgun. SUSPECT ENTERED BUSINESS, DISPLAYED WEAPON AND DEMANDED PROPERTY. 215 VENDOR, La Fabulosa, 5900 Melody Ln, 7/11/09, 3:45 pm. 0202502W, NE Investigations. Susp 1: B/M/25/6’/215, chrome handgun. Susp 2: B/M/18/5’10”/150. SUSPECTS APPROACHED RP, DISPLAYED WEAPON AND DEMANDED PROPERTY. 225 ELECTRONICS, JC Communications, 2131 Oates Dr, 7/11/09, 2:30 pm. 0202459W, CAPERS. Susp: B/M, 5’7”, 190, handgun. SUSPECT ENTERED BUSINESS, DISPLAYED WEAPON AND DEMANDED PROPERTY. 227 GAS STATION, Tetco, 12516 E Northwest Hwy, 7/11/09, 5:30 pm. 0202620W, CAPERS. Susp: L/M/25/5’6”/170, spiked hair, blue steel semi-automatic handgun. SUSPECT ENTERED BUSINESS, ASK IF RP WAS ALONE, DISPLAYED WEAPON AND DEMANDED PROPERTY. 651 RESTAURANT, Subway, 7742 Forest Ln, 7/11/09, 8:05 pm. 0202726W, CAPERS. Susp: W/M/40/6’/220, blue steel handgun. SUSPECT ENTERED, EXITED AND RETURNED. SUSPECT WENT TO RESTROOM, EXITED, ATTEMPTED TO GET DRINK, WAITED IN LINE, DISPLAYED WEAPON AND DEMANDED PROPERTY.
Figure 8. Daily Robbery Incident Summary
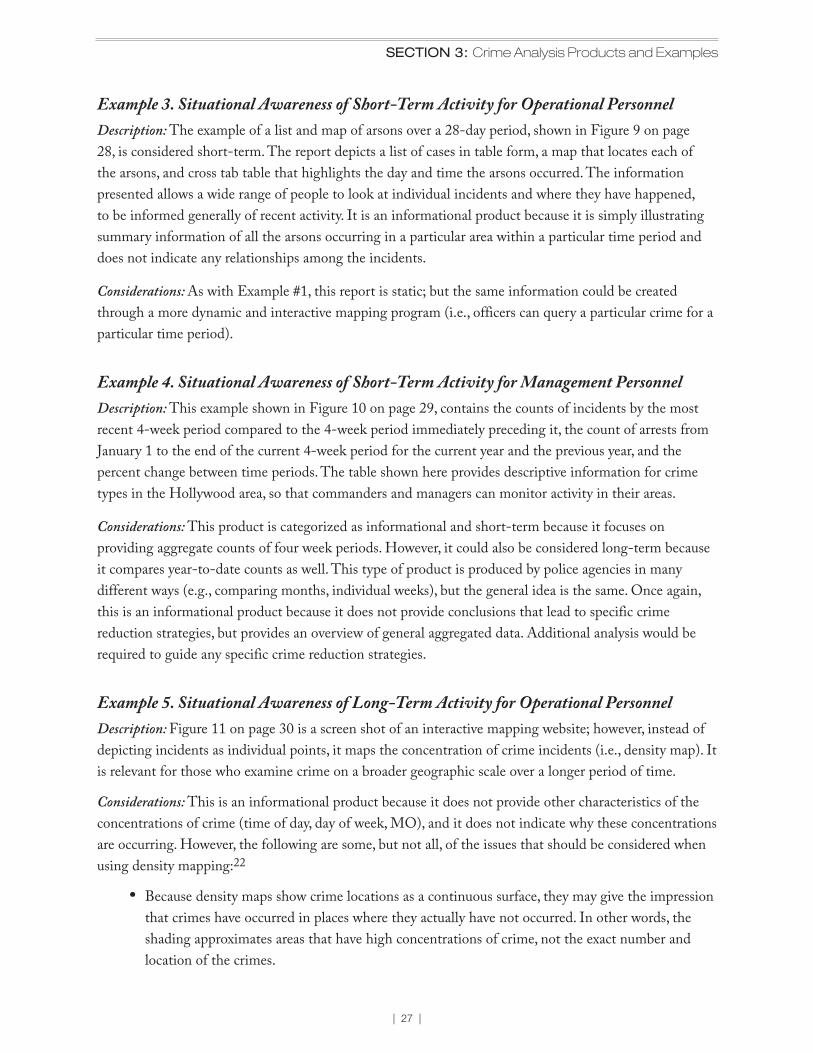
| 27 |
SECTION 3: Crime Analysis Products and Examples
Example 3. Situational Awareness of Short-Term Activity for Operational PersonnelDescription: The example of a list and map of arsons over a 28-day period, shown in Figure 9 on page 28, is considered short-term. The report depicts a list of cases in table form, a map that locates each of the arsons, and cross tab table that highlights the day and time the arsons occurred. The information presented allows a wide range of people to look at individual incidents and where they have happened, to be informed generally of recent activity. It is an informational product because it is simply illustrating summary information of all the arsons occurring in a particular area within a particular time period and does not indicate any relationships among the incidents.
Considerations: As with Example #1, this report is static; but the same information could be created through a more dynamic and interactive mapping program (i.e., officers can query a particular crime for a particular time period).
Example 4. Situational Awareness of Short-Term Activity for Management PersonnelDescription: This example shown in Figure 10 on page 29, contains the counts of incidents by the most recent 4-week period compared to the 4-week period immediately preceding it, the count of arrests from January 1 to the end of the current 4-week period for the current year and the previous year, and the percent change between time periods. The table shown here provides descriptive information for crime types in the Hollywood area, so that commanders and managers can monitor activity in their areas.
Considerations: This product is categorized as informational and short-term because it focuses on providing aggregate counts of four week periods. However, it could also be considered long-term because it compares year-to-date counts as well. This type of product is produced by police agencies in many different ways (e.g., comparing months, individual weeks), but the general idea is the same. Once again, this is an informational product because it does not provide conclusions that lead to specific crime reduction strategies, but provides an overview of general aggregated data. Additional analysis would be required to guide any specific crime reduction strategies.
Example 5. Situational Awareness of Long-Term Activity for Operational PersonnelDescription: Figure 11 on page 30 is a screen shot of an interactive mapping website; however, instead of depicting incidents as individual points, it maps the concentration of crime incidents (i.e., density map). It is relevant for those who examine crime on a broader geographic scale over a longer period of time.
Considerations: This is an informational product because it does not provide other characteristics of the concentrations of crime (time of day, day of week, MO), and it does not indicate why these concentrations are occurring. However, the following are some, but not all, of the issues that should be considered when using density mapping:22
• Because density maps show crime locations as a continuous surface, they may give the impression that crimes have occurred in places where they actually have not occurred. In other words, the shading approximates areas that have high concentrations of crime, not the exact number and location of the crimes.
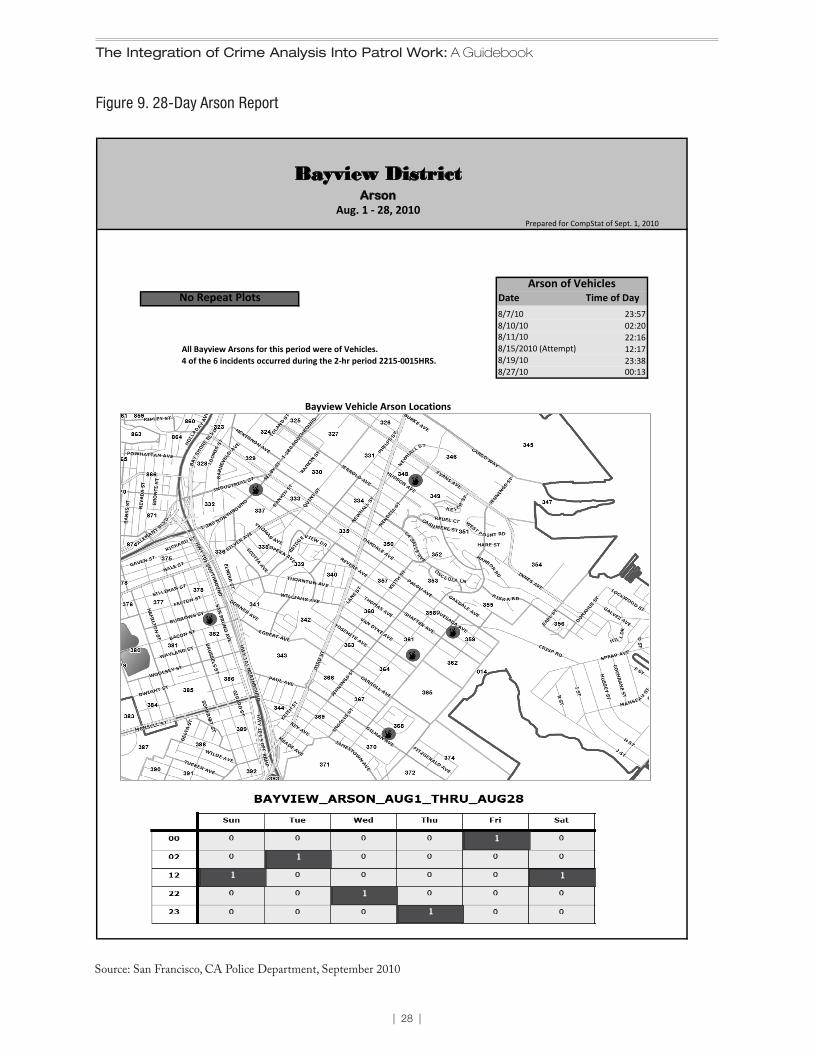
| 28 |
The Integration of Crime Analysis Into Patrol Work: A Guidebook
Figure 9. 28-Day Arson Report
Date Time of Day
23:5702:2022:16
All Bayview Arsons for this period were of Vehicles. 12:174 of the 6 incidents occurred during the 2-hr period 2215-0015HRS. 23:38
00:13
Bayview DistrictArson
Aug. 1 - 28, 2010Prepared for CompStat of Sept. 1, 2010
Bayview Vehicle Arson Locations
No Repeat Plots
8/10/108/11/10
8/19/108/27/10
8/15/2010 (Attempt)
Arson of Vehicles
8/7/10
Source: San Francisco, CA Police Department, September 2010
1
1
1
1
1
1
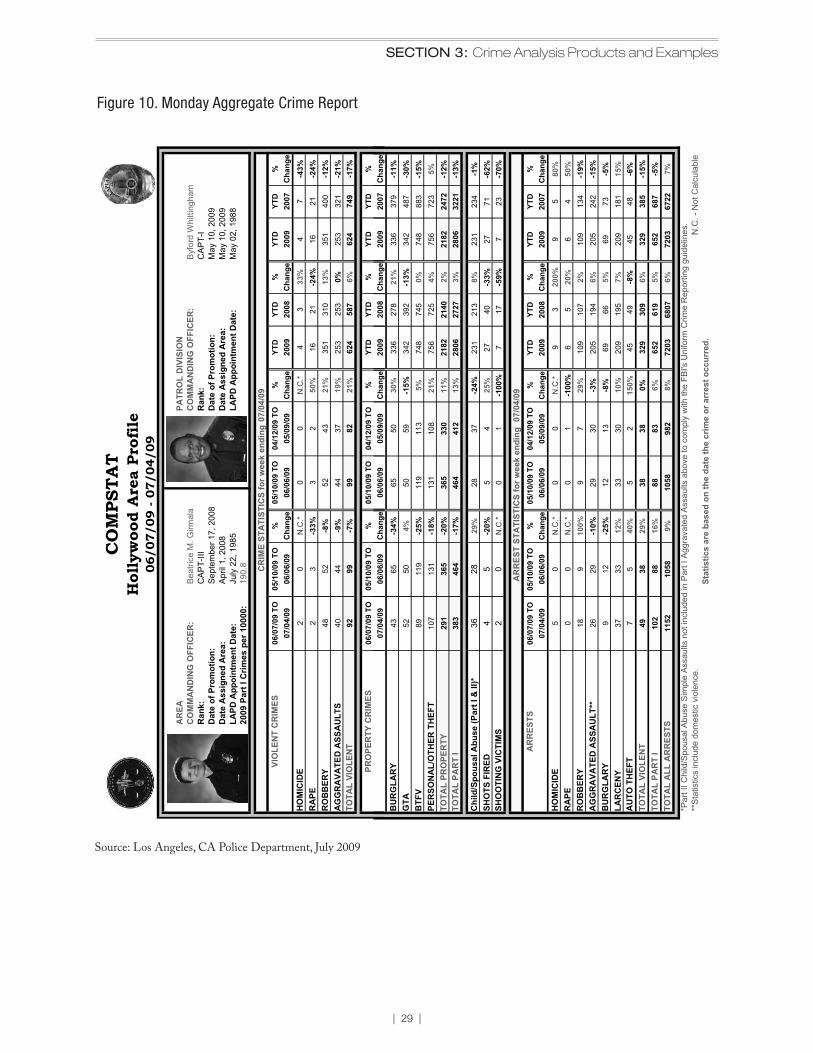
| 29 |
SECTION 3: Crime Analysis Products and Examples
Source: Los Angeles, CA Police Department, July 2009
Figure 10. Monday Aggregate Crime ReportC
OM
PSTA
TH
olly
woo
d A
rea
Prof
ile06
/07/
09 -
07/0
4/09
AR
EAPA
TRO
L D
IVIS
ION
CO
MM
AN
DIN
G O
FFIC
ER:
Bea
trice
M. G
irmal
aC
OM
MA
ND
ING
OFF
ICER
:B
yfor
d W
hitti
ngha
mR
ank:
Ran
k:D
ate
of P
rom
otio
n:D
ate
of P
rom
otio
n:D
ate
Ass
igne
d A
rea:
Dat
e A
ssig
ned
Are
a:LA
PD A
ppoi
ntm
ent D
ate:
LAPD
App
oint
men
t Dat
e:20
09 P
art I
Crim
es p
er 1
0000
:
CR
IME
STA
TIST
ICS
for w
eek
endi
ng
HO
MIC
IDE
RA
PER
OB
BER
YA
GG
RA
VATE
D A
SSA
ULT
STO
TAL
VIO
LEN
T
CA
PT-
IC
AP
T-III
May
02,
198
8
06/0
6/09
July
22,
198
5A
pril
1, 2
008
07/0
4/09
05/1
0/09
TO
04/1
2/09
TO
%
190.
8
05/1
0/09
TO
%
52 4482
Sep
tem
ber 1
7, 2
008
52
Cha
nge
N.C
.*-3
3%0
PRO
PER
TY C
RIM
ES
2
06/0
7/09
TO
99
48
%%
05/0
9/09
99
05/1
0/09
TO
-7%
20
04/1
2/09
TO
44
05/1
0/09
TO
07/0
4/09
92
06/0
6/09
-8%
Cha
nge
350
%3
2
4025
325
337
-9%
43
VIO
LEN
T C
RIM
ES06
/07/
09 T
O07
/04/
0906
/06/
0906
/06/
09
-24%
2007
47
2008
33%
16-2
4%21
Cha
nge
43
2009
Cha
nge
05/0
9/09
0N
.C.*
-17%
624
749
YTD
21%
0%19
%31
013
%
YTD
6%58
721
%62
4
YTD
YTD
351
YTD
YTD
%20
09
-21%
400
321
2116
%
253
-12%
351
Cha
nge
-43%
2007
2009
Cha
nge
Cha
nge
YTD
%%
YTD
Cha
nge
2009
2008
May
10,
200
9M
ay 1
0, 2
009
BU
RG
LAR
YG
TAB
TFV
PER
SON
AL/
OTH
ER T
HEF
TTO
TAL
PRO
PER
TY
TOTA
L PA
RT
I
Chi
ld/S
pous
al A
buse
(Par
t I &
II)*
SHO
TS F
IRED
SHO
OTI
NG
VIC
TIM
S
AR
RES
T ST
ATI
STIC
S fo
r wee
k en
ding
HO
MIC
IDE
RA
PER
OB
BER
YA
GG
RA
VATE
D A
SSA
ULT
**B
UR
GLA
RY
LAR
CEN
YA
UTO
TH
EFT
TOTA
L VI
OLE
NT
TOTA
L PA
RT
I TO
TAL
ALL
AR
RES
TS
*Par
t II C
hild
/Spo
usal
Abu
se S
impl
e A
ssau
lts n
ot in
clud
ed in
Par
t I A
ggra
vate
d A
ssau
lts a
bove
to c
ompl
y w
ith th
e FB
I's U
nifo
rm C
rime
Rep
ortin
g gu
idel
ines
.**
Sta
tistic
s in
clud
e do
mes
tic v
iole
nce.
N.C
. - N
ot C
alcu
labl
eSt
atis
tics
are
base
d on
the
date
the
crim
e or
arr
est o
ccur
red.
23 73-3
%
71
0-1
00%
29%
456
5
412
2
16%
50
131
50 119 9
83
12-2
5%33
13
Cha
nge
26 912
28
-10%
5965
28
-17%
-20%
365
5
07/0
4/09
52 89-2
5%11
9
-34%
65
g
113
108 4 1
342
342
30%g
g
487
-13%
-11%
278
g33
6-3
0%33
637
921
%-1
5%39
2
9
2009
YTD
YTD
%YT
D20
0920
0%
231
234
745
27
2806
-33%
756
4% 3%
231
2806
213
2140
195
3010
%69
6620
918
120
9-5
%7%
15%
687
309
-70%
06/0
6/09
-15% -1%
-62%5%
2%-1
2%-1
3%21
8232
2127
2724
72
1
5
205
3024
2-8
%
150%
40%
8%
40
756
-24%
-100
%
11%
725
723
25%
2182
8% 20%
64
3
05/0
9/09
Cha
nge
50
N.C
.*
05/1
0/09
TO
04/1
2/09
TO
%
77
49 1152
8810
238
29%
7203
9%10
5888
982
194
-15%
69
109
6%20
5
7%68
07
385
7
7203
6%5%
29
1058
-15%
49-8
%45
5%
-19%
383829
7 2
-5%
6722
6%32
948
652
AR
RES
TS06
/07/
09 T
O
0
05/1
0/09
TO
06/0
6/09
37
07/0
4/09
0 9 3350
-18%
29%
291
36107
5-2
0%
12%
50
N.C
.*
4% N.C
.*10
0%18
0N
.C.*
4
464
%
131
43 383
464
37
0
330
365
%
27
134
107
2%10
9
2007
Cha
nge
59
13%
50%
YTD
80%
Cha
nge
2008
-59%
17
748
0%88
35%
748
21%
0
-6%
0%32
961
965
26%
Prep
ared
by:
CO
MP
STA
T U
nit
Stat
istic
s ar
e Pr
elim
inar
y an
d Su
bjec
t to
Furt
her A
naly
sis
and
Rev
isio
nD
ate:
07/
06/0
9
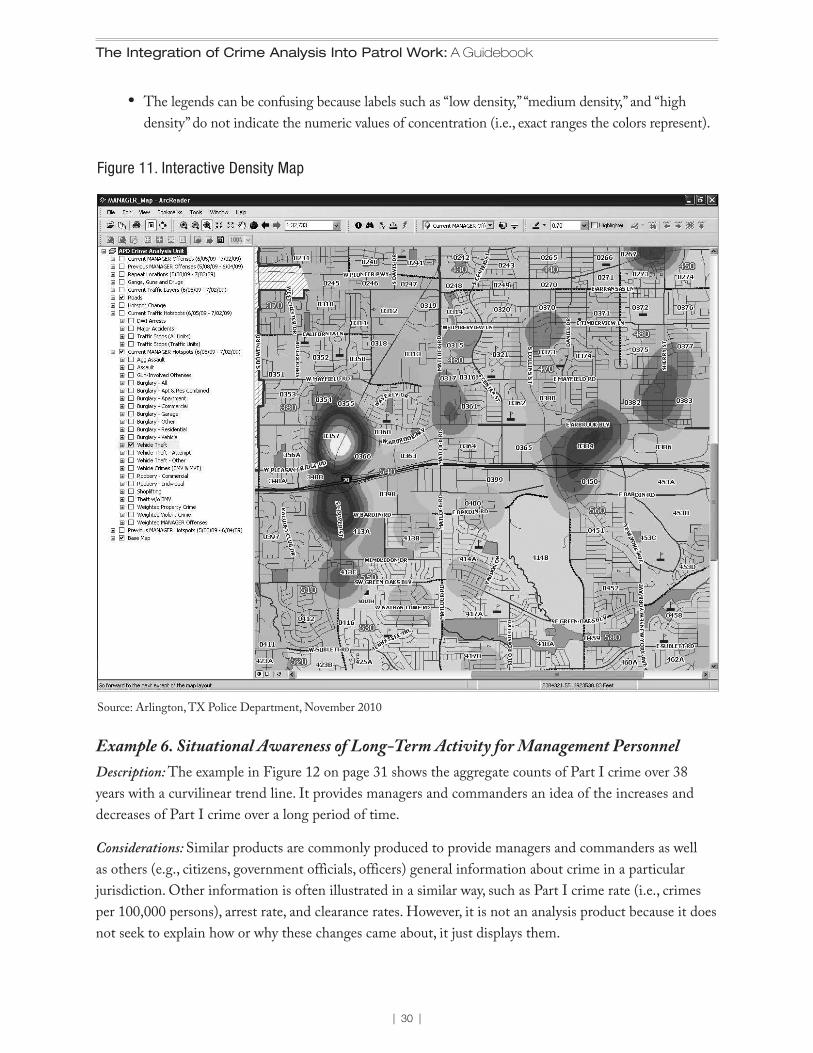
| 30 |
The Integration of Crime Analysis Into Patrol Work: A Guidebook
• The legends can be confusing because labels such as “low density,” “medium density,” and “high density” do not indicate the numeric values of concentration (i.e., exact ranges the colors represent).
Example 6. Situational Awareness of Long-Term Activity for Management PersonnelDescription: The example in Figure 12 on page 31 shows the aggregate counts of Part I crime over 38 years with a curvilinear trend line. It provides managers and commanders an idea of the increases and decreases of Part I crime over a long period of time.
Considerations: Similar products are commonly produced to provide managers and commanders as well as others (e.g., citizens, government officials, officers) general information about crime in a particular jurisdiction. Other information is often illustrated in a similar way, such as Part I crime rate (i.e., crimes per 100,000 persons), arrest rate, and clearance rates. However, it is not an analysis product because it does not seek to explain how or why these changes came about, it just displays them.
Source: Arlington, TX Police Department, November 2010
Figure 11. Interactive Density Map
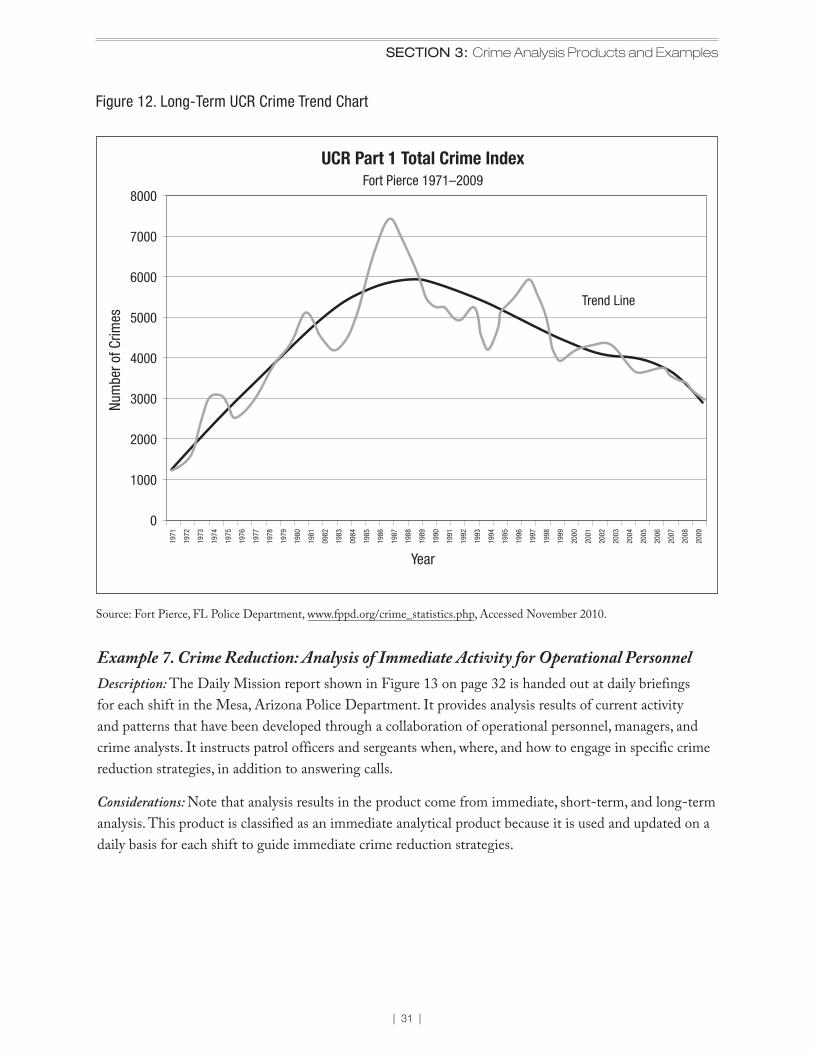
| 31 |
SECTION 3: Crime Analysis Products and Examples
Example 7. Crime Reduction: Analysis of Immediate Activity for Operational PersonnelDescription: The Daily Mission report shown in Figure 13 on page 32 is handed out at daily briefings for each shift in the Mesa, Arizona Police Department. It provides analysis results of current activity and patterns that have been developed through a collaboration of operational personnel, managers, and crime analysts. It instructs patrol officers and sergeants when, where, and how to engage in specific crime reduction strategies, in addition to answering calls.
Considerations: Note that analysis results in the product come from immediate, short-term, and long-term analysis. This product is classified as an immediate analytical product because it is used and updated on a daily basis for each shift to guide immediate crime reduction strategies.
Figure 12. Long-Term UCR Crime Trend Chart
UCR Part 1 Total Crime Index19
71
1972
1973
1974
1975
1976
1977
1978
1979
1980
1981
0982
1983
0984
1985
1986
1987
1988
1989
1990
1991
1992
1993
1994
1995
1996
1997
1998
1999
2000
2001
2002
2003
2004
2005
2006
2007
2008
2009
0
1000
2000
3000
4000
5000
Year
Num
ber o
f Crim
es
Fort Pierce 1971–2009
6000
7000
8000
Trend Line
Source: Fort Pierce, FL Police Department, www.fppd.org/crime_statistics.php, Accessed November 2010.
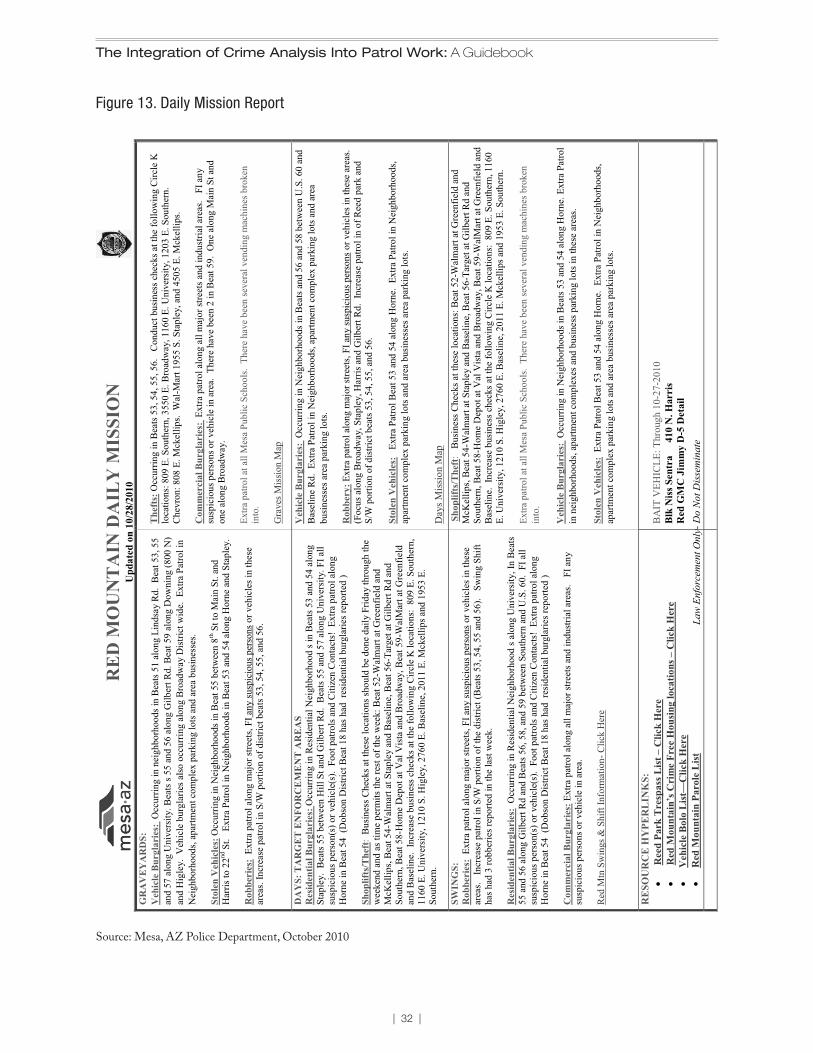
| 32 |
The Integration of Crime Analysis Into Patrol Work: A Guidebook
Source: Mesa, AZ Police Department, October 2010
RE
D M
OU
NT
AIN
DA
ILY
MIS
SIO
NU
pdat
ed o
n 10
/28/
2010
GR
AV
EY
AR
DS:
Veh
icle
Bur
glar
ies:
Occ
urrin
g in
nei
ghbo
rhoo
dsin
Bea
ts51
alon
g Li
ndsa
y R
d.B
eat 5
3,55
The
fts:
Occ
urrin
g in
Bea
ts 5
3, 5
4, 5
5, 5
6.
Con
duct
bus
ines
s che
cks a
t the
follo
win
g C
ircle
K
and
57 a
long
Uni
vers
ity.B
eats
s 55
and
56
alon
g G
ilber
t Rd.
Bea
t 59
alon
g D
owni
ng (8
00 N
) lo
catio
ns: 8
09 E
. Sou
ther
n,35
50 E
. Bro
adw
ay, 1
160
E. U
nive
rsity
, 120
3 E.
Sou
ther
n.
Che
vron
: 808
E. M
ckel
lips.
Wal
-Mar
t 195
5 S.
Sta
pley
, and
450
5 E.
Mck
ellip
s.an
d H
igle
y. V
ehic
le b
urgl
arie
s als
o oc
curr
ing
alon
g B
road
way
Dis
trict
wid
e. E
xtra
Pat
rol i
n N
eigh
borh
oods
, apa
rtmen
t com
plex
par
king
lots
and
are
a bu
sine
sses
.
Com
mer
cial
Bur
glar
ies:
Extra
pat
rol a
long
all
maj
or st
reet
s and
indu
stria
l are
as.
FI a
ny
8thSt
susp
icio
us p
erso
ns o
r veh
icle
in a
rea.
Ther
e ha
ve b
een
2 in
Bea
t 59.
One
alo
ng M
ain
St a
nd
Stol
en V
ehic
les:
Occ
urrin
g in
Nei
ghbo
rhoo
ds in
Bea
t 55
betw
een
to M
ain
St. a
nd
one
alon
g B
road
way
.H
arris
to 2
2ndSt
. E
xtra
Pat
rol i
n N
eigh
borh
oods
in B
eat 5
3 an
d 54
alo
ng H
orne
and
Stap
ley.
Extra
pat
rol a
t all
Mes
a Pu
blic
Sch
ools
.Th
ere
have
bee
n se
vera
lven
ding
mac
hine
s bro
ken
Rob
beri
es:
Extra
pat
rol a
long
maj
or st
reet
s, FI
any
susp
icio
us p
erso
nsor
veh
icle
s in
thes
e in
to.
area
s.In
crea
se p
atro
l in
S/W
por
tion
of d
istri
ct b
eats
53,
54,
55,
and
56.
Gra
ves M
issi
on M
ap
DA
YS:
TA
RG
ET
EN
FOR
CE
ME
NT
AR
EA
SV
ehic
le B
urgl
arie
s:O
ccur
ring
in N
eigh
borh
oods
in B
eats
and
56 a
nd 5
8 be
twee
n U
.S. 6
0 an
d R
esid
entia
l Bur
glar
ies:
Occ
urrin
g in
Res
iden
tial N
eigh
borh
ood
s in
Bea
ts 5
3 an
d 54
alo
ng
Bas
elin
e R
d. E
xtra
Pat
rol i
n N
eigh
borh
oods
, apa
rtmen
t com
plex
par
king
lots
and
are
a St
aple
y. B
eats
55
betw
een
Hill
St a
nd G
ilber
t Rd.
Bea
ts 5
5an
d 57
alon
g U
nive
rsity
. FI a
ll bu
sine
sses
area
par
king
lots
.
susp
icio
us p
erso
n(s)
or v
ehic
le(s
).Fo
ot p
atro
ls a
nd C
itize
n C
onta
cts!
Extra
pat
rol a
long
H
orne
in B
eat 5
4 (D
obso
n D
istri
ct B
eat 1
8 ha
s had
res
iden
tial b
urgl
arie
s rep
orte
d )
R
obbe
ry:E
xtra
pat
rol a
long
maj
or st
reet
s, FI
any
susp
icio
us p
erso
nsor
veh
icle
s in
thes
e ar
eas.
(Foc
us a
long
Bro
adw
ay, S
tapl
ey,H
arris
and
Gilb
ertR
d.In
crea
se p
atro
l in
of R
eed
park
and
Sh
oplif
ts/T
heft
: B
usin
ess C
heck
s at t
hese
loca
tions
shou
ld b
e do
ne d
aily
Frid
ay th
roug
h th
e S/
W p
ortio
n of
dis
trict
bea
ts 5
3, 5
4, 5
5, a
nd 5
6.w
eeke
nd a
nd a
s tim
e pe
rmits
the
rest
of t
he w
eek:
Bea
t 52-
Wal
mar
t at G
reen
field
and
McK
ellip
s, B
eat 5
4-W
alm
art a
t Sta
pley
and
Bas
elin
e, B
eat 5
6-Ta
rget
at G
ilber
t Rd
and
Stol
en V
ehic
les:
Extra
Pat
rol B
eat 5
3 an
d 54
alo
ng H
orne
.Ex
tra P
atro
l in
Nei
ghbo
rhoo
ds,
Sout
hern
,Bea
t 58-
Hom
e D
epot
at V
al V
ista
and
Bro
adw
ay, B
eat 5
9-W
alM
art a
t Gre
enfie
ld
apar
tmen
t com
plex
par
king
lots
and
are
a bu
sine
sses
are
a pa
rkin
g lo
ts.
an
d B
asel
ine.
Inc
reas
e bu
sine
ss c
heck
s at t
he fo
llow
ing
Circ
le K
loca
tions
: 80
9 E.
Sou
ther
n,
1160
E. U
nive
rsity
, 121
0 S.
Hig
ley,
276
0 E.
Bas
elin
e, 2
011
E. M
ckel
lips a
nd 1
953
E.
Sout
hern
.D
ays M
issi
on M
apSW
ING
S:Sh
oplif
ts/T
heft
: B
usin
ess C
heck
s at t
hese
loca
tions
: Bea
t 52-
Wal
mar
t at G
reen
field
and
R
obbe
ries
:Ex
tra p
atro
l alo
ng m
ajor
stre
ets,
FI a
ny su
spic
ious
per
sons
or v
ehic
les i
n th
ese
McK
ellip
s, B
eat 5
4-W
alm
art a
t Sta
pley
and
Bas
elin
e, B
eat 5
6-Ta
rget
at G
ilber
t Rd
and
area
s.In
crea
se p
atro
l in
S/W
por
tion
of th
e di
stric
t(B
eats
53,
54, 5
5 an
d 56
).Sw
ing
Shift
So
uthe
rn,B
eat 5
8-H
ome
Dep
ot a
t Val
Vis
ta a
nd B
road
way
, Bea
t 59-
Wal
Mar
t at G
reen
field
and
ha
s had
3 ro
bber
ies r
epor
ted
in th
e la
st w
eek.
B
asel
ine.
Inc
reas
e bu
sine
ss c
heck
s at t
he fo
llow
ing
Circ
le K
loca
tions
: 80
9 E.
Sou
ther
n, 1
160
E. U
nive
rsity
, 121
0 S.
Hig
ley,
276
0 E.
Bas
elin
e, 2
011
E. M
ckel
lips a
nd 1
953
E. S
outh
ern.
Res
iden
tial B
urgl
arie
s:O
ccur
ring
in R
esid
entia
l Nei
ghbo
rhoo
d sa
long
Uni
vers
ity,I
n B
eats
55
and
56 a
long
Gilb
ert R
dan
d B
eats
56,
58, a
nd 5
9 be
twee
n So
uthe
rn a
nd U
.S. 6
0. F
I all
Extra
pat
rol a
t all
Mes
a Pu
blic
Sch
ools
.Th
ere
have
bee
n se
vera
l ven
ding
mac
hine
s bro
ken
susp
icio
us p
erso
n(s)
or v
ehic
le(s
). F
oot p
atro
ls a
nd C
itize
n C
onta
cts!
Extra
pat
rol a
long
in
to.
H
orne
in B
eat 5
4 (D
obso
n D
istri
ct B
eat 1
8 ha
s had
res
iden
tial b
urgl
arie
s rep
orte
d )
V
ehic
le B
urgl
arie
s: O
ccur
ring
in N
eigh
borh
oods
in B
eats
53
and
54 a
long
Hor
ne.E
xtra
Pat
rol
Com
mer
cial
Bur
glar
ies:
Extra
pat
rola
long
all
maj
or st
reet
s and
indu
stria
l are
as.
FIan
y in
nei
ghbo
rhoo
ds, a
partm
ent c
ompl
exes
and
bus
ines
s par
king
lots
in th
ese
area
s. su
spic
ious
per
sons
or v
ehic
lein
are
a.
Stol
en V
ehic
les:
Extra
Pat
rol B
eat 5
3 an
d 54
alo
ng H
orne
.Ex
tra P
atro
l in
Nei
ghbo
rhoo
ds,
Red
Mtn
Sw
ings
& S
hift
Info
rmat
ion-
Clic
k H
ere
apar
tmen
t com
plex
par
king
lots
and
are
a bu
sine
sses
are
a pa
rkin
g lo
ts.
OU
RR
ES
C
EH
YPE
RL
INK
S:� � � �
Ree
dPa
r kT
reas
sp s
L
ist
–
Clic
kH
ere
BA
IT V
EHIC
LE:T
hrou
gh 1
0-27
-201
0
Red
Mou
ntai
n’s C
rim
e Fr
ee
Hou
sing
loca
tions
–C
lick
Her
e
Blk
Nis
s Sen
tra
4
10 N
. Har
ris
V
ehic
le
Bol
o
Lis
t—C
lick
Her
eR
ed G
MC
Jim
my
D-5
Det
ail
R
ed
Mou
ntai
n
Paro
leL
ist
Law
Enf
orce
men
t Onl
y-D
o N
ot D
issem
inat
e
Figure 13. Daily Mission Report
| 33 |
SECTION 3: Crime Analysis Products and Examples
Example 8. Crime Reduction: Analysis of Immediate Activity for Management PersonnelDescription: The example shown in Figure 14 on page 34 is a product that is provided to command personnel every day in preparation for a daily meeting. It is an aggregate count of crime types and brief summary of crimes that have been selected by the Chief of Police for daily review and prioritized by the agency in terms of immediate responses. The report also includes patterns of crime (and details of those cases) that have been identified since the previous report. The product is discussed by managers and commanders in a daily briefing so that they are aware of significant incidents each morning and ensure appropriate actions are taken immediately.
Considerations: The crime types selected as “cases of interest” and other information on the report that would vary by agency are based on the agency’s current crime reduction initiatives and politically sensitive incidents.
Example 9. Crime Reduction: Analysis of Short-Term Activity for Operational PersonnelDescription: In Figure 15 on page 35, an example is shown of a standardized crime pattern bulletin illustrating information about individual crimes that an analyst has substantively linked together by person, area, time, MO, etc. This is a common type of analytical product that many police agencies produce. The product provides direction for implementing short-term crime reduction strategies (e.g., directed and undercover patrol, providing crime preventing advice to residents in the pattern area, contacting the known offenders living in the pattern area).
Considerations: A large number of medium to large police agencies produce crime pattern bulletins, so there are many different examples of products, but the bulletins tend to contain very similar information and are typically standardized within an individual agency.23
Example 10. Crime Reduction: Analysis of Short-Term Activity for Management PersonnelDescription: The map in Figure 16 on page 36 depicts the locations of a specific type of crime (dots) and the patterns that have been identified from those crimes (white circles) over a three month period. This product assists management personnel in the evaluation of pattern response strategies implemented by operational personnel and helps management determine whether the strategies are working.
Considerations: This product could also be created using a density map to depict the incidents and circles to represent the pattern areas. In either case, this product can be created only if crime patterns are being identified by the agency.
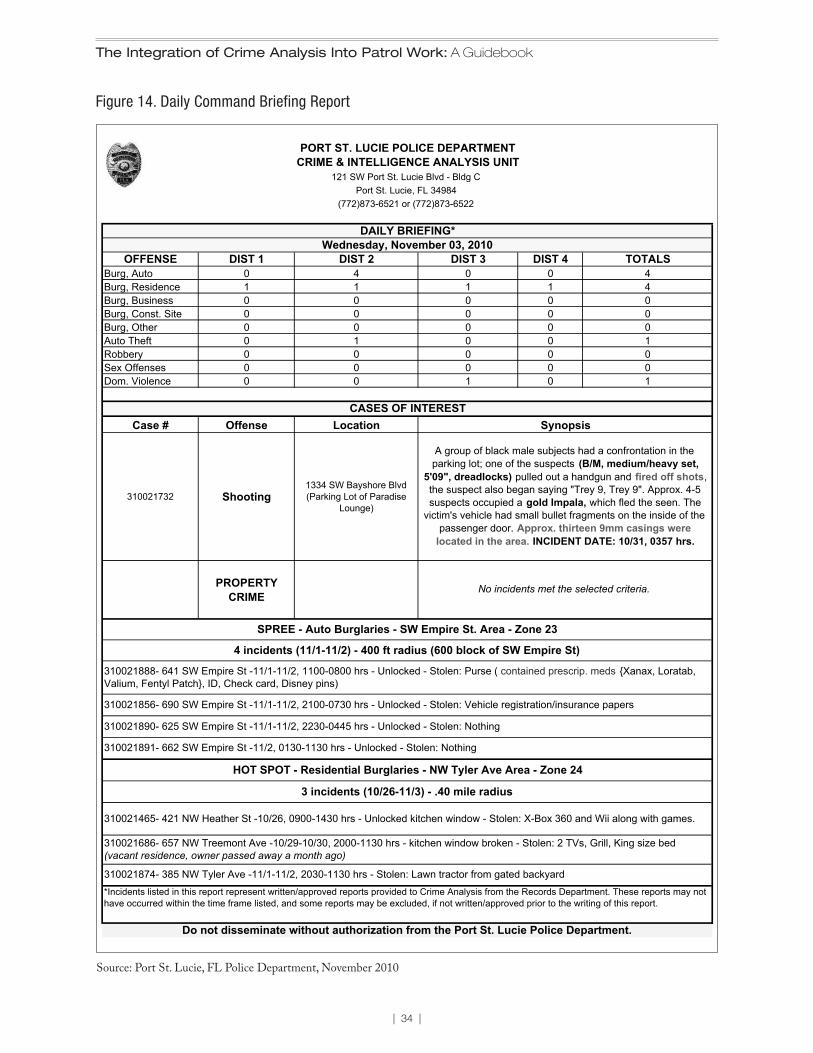
| 34 |
The Integration of Crime Analysis Into Patrol Work: A Guidebook
Source: Port St. Lucie, FL Police Department, November 2010
Figure 14. Daily Command Briefing Report
OFFENSE DIST 1 DIST 2 DIST 3 DIST 4 TOTALSBurg, Auto 0 4 0 0 4Burg, Residence 1 1 1 1 4Burg, Business 0 0 0 0 0Burg, Const. Site 0 0 0 0 0Burg, Other 0 0 0 0 0Auto Theft 0 1 0 0 1Robbery 0 0 0 0 0Sex Offenses 0 0 0 0 0Dom. Violence 0 0 1 0 1
Case # Offense Location
310021732 Shooting1334 SW Bayshore Blvd (Parking Lot of Paradise
Lounge)
PROPERTYCRIME
310021874- 385 NW Tyler Ave -11/1-11/2, 2030-1130 hrs - Stolen: Lawn tractor from gated backyard
CASES OF INTERESTSynopsis
PORT ST. LUCIE POLICE DEPARTMENTCRIME & INTELLIGENCE ANALYSIS UNIT
DAILY BRIEFING*Wednesday, November 03, 2010
121 SW Port St. Lucie Blvd - Bldg CPort St. Lucie, FL 34984
(772)873-6521 or (772)873-6522
No incidents met the selected criteria.
A group of black male subjects had a confrontation in the parking lot; one of the suspects (B/M, medium/heavy set,
5'09", dreadlocks) pulled out a handgun and fired off shots,the suspect also began saying "Trey 9, Trey 9". Approx. 4-5 suspects occupied a gold Impala, which fled the seen. The
victim's vehicle had small bullet fragments on the inside of the passenger door. Approx. thirteen 9mm casings were
located in the area. INCIDENT DATE: 10/31, 0357 hrs.
HOT SPOT - Residential Burglaries - NW Tyler Ave Area - Zone 24
3 incidents (10/26-11/3) - .40 mile radius
310021891- 662 SW Empire St -11/2, 0130-1130 hrs - Unlocked - Stolen: Nothing
310021856- 690 SW Empire St -11/1-11/2, 2100-0730 hrs - Unlocked - Stolen: Vehicle registration/insurance papers
Do not disseminate without authorization from the Port St. Lucie Police Department.
*Incidents listed in this report represent written/approved reports provided to Crime Analysis from the Records Department. These reports may not have occurred within the time frame listed, and some reports may be excluded, if not written/approved prior to the writing of this report.
310021890- 625 SW Empire St -11/1-11/2, 2230-0445 hrs - Unlocked - Stolen: Nothing
SPREE - Auto Burglaries - SW Empire St. Area - Zone 23
4 incidents (11/1-11/2) - 400 ft radius (600 block of SW Empire St)
310021888- 641 SW Empire St -11/1-11/2, 1100-0800 hrs - Unlocked - Stolen: Purse ( contained prescrip. meds {Xanax, Loratab, Valium, Fentyl Patch}, ID, Check card, Disney pins)
310021465- 421 NW Heather St -10/26, 0900-1430 hrs - Unlocked kitchen window - Stolen: X-Box 360 and Wii along with games.
310021686- 657 NW Treemont Ave -10/29-10/30, 2000-1130 hrs - kitchen window broken - Stolen: 2 TVs, Grill, King size bed (vacant residence, owner passed away a month ago)
*CONFIDENTIAL* - FOR LAW ENFORCEMENT PURPOSES ONLY Page 1 of 1
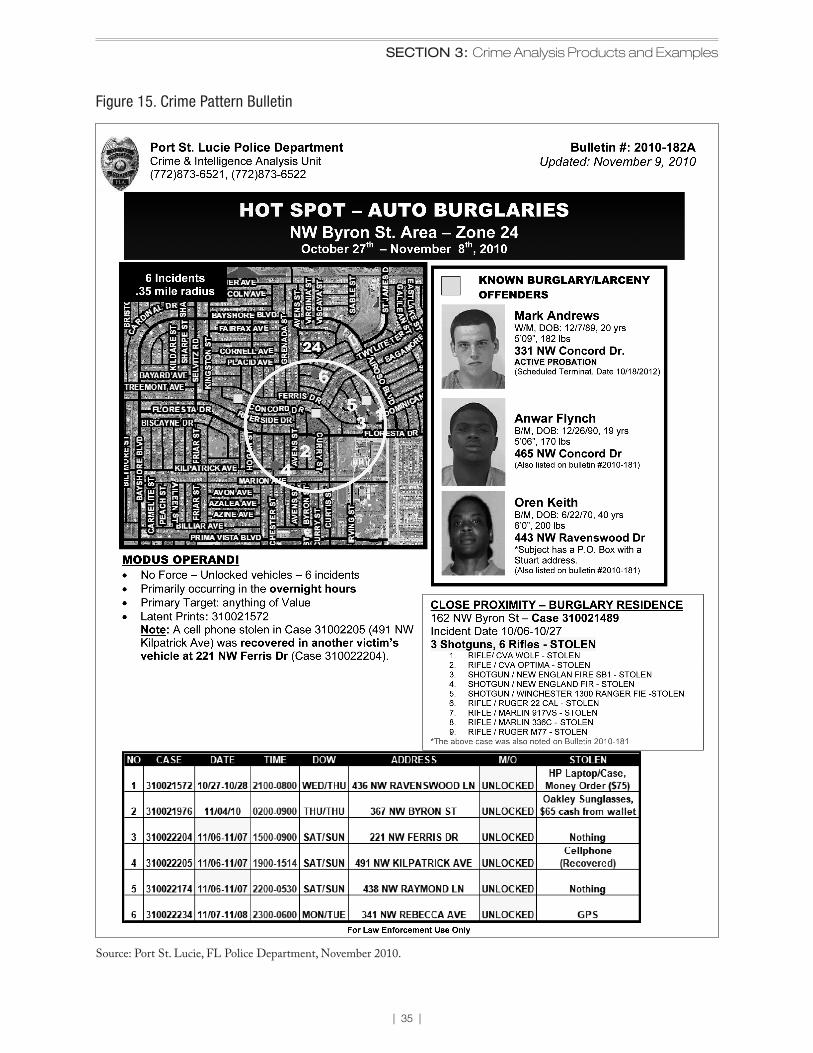
| 35 |
SECTION 3: Crime Analysis Products and Examples
Source: Port St. Lucie, FL Police Department, November 2010.
Figure 15. Crime Pattern Bulletin
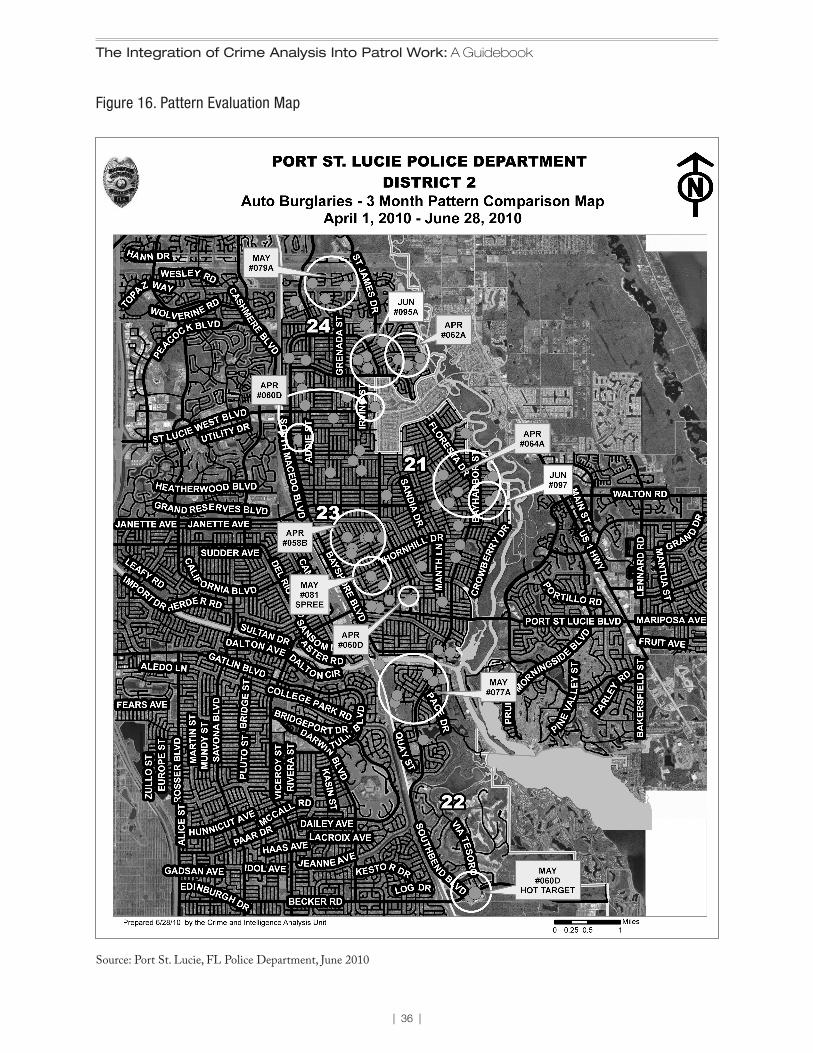
| 36 |
The Integration of Crime Analysis Into Patrol Work: A Guidebook
Source: Port St. Lucie, FL Police Department, June 2010
Figure 16. Pattern Evaluation Map
| 37 |
SECTION 3: Crime Analysis Products and Examples
Example 11. Crime Reduction: Analysis of Long-Term Activity for Operational PersonnelDescription: The examples in Figure 17 on page 38 illustrates an analytical product that was created for a location that has been determined to be a long-term problem. There are a number of different analytical techniques used in the product as well as conclusions based on the results, including recommendations for long-term responses. The purpose of the product is to help determine why the problem is occurring and help officers determine the appropriate responses as well as prioritize which responses should be implemented first at this location.
Considerations: An in-depth analytical product such as this varies by the unit of analysis and activity addressed, as different data and analytical techniques are appropriate in different circumstances.
Example 12. Crime Reduction: Analysis of Long-Term Activity for Management PersonnelDescription: The bar chart shown in Figure 18 on page 39 shows the robbery rates per 1,000 persons for five districts (i.e., Central, Southern, Mission, Northern, and Tenderloin) within one division (i.e., Metro) of the San Francisco Police Department as well as the robbery rate for the city overall. The data reflect robberies over a 6-month period ( January 1 to June 19, 2010), so this is considered a long-term product. This analytical product allows managers and commanders to compare individual district robbery rates to one another and to the city rate in order to evaluate the success of crime reduction strategies and/or identify potential long term robbery issues of a district.
Considerations: This chart could be created for a number of different data types (e.g., crime, calls, and rates), more specific crime or call types (e.g., street robbery, non-domestic aggravated assault, loud noise calls for service), and districts/divisions. One important consideration is the year-to-date analysis of this chart. The current example is considered long-term because it examines just over 6 months of data; however, a chart produced earlier in the year (e.g., February) would not be considered long-term since the data would only cover 1 month. A way to consistently create a product relevant for long-term activity is to use a “rolling” time period which examines the previous 6 to 12 months, no matter what month the chart is created (e.g., a February 2011 chart would reflect February 2010 to January 2011 and a December 2011 chart would reflect December 2010 to November 2011).
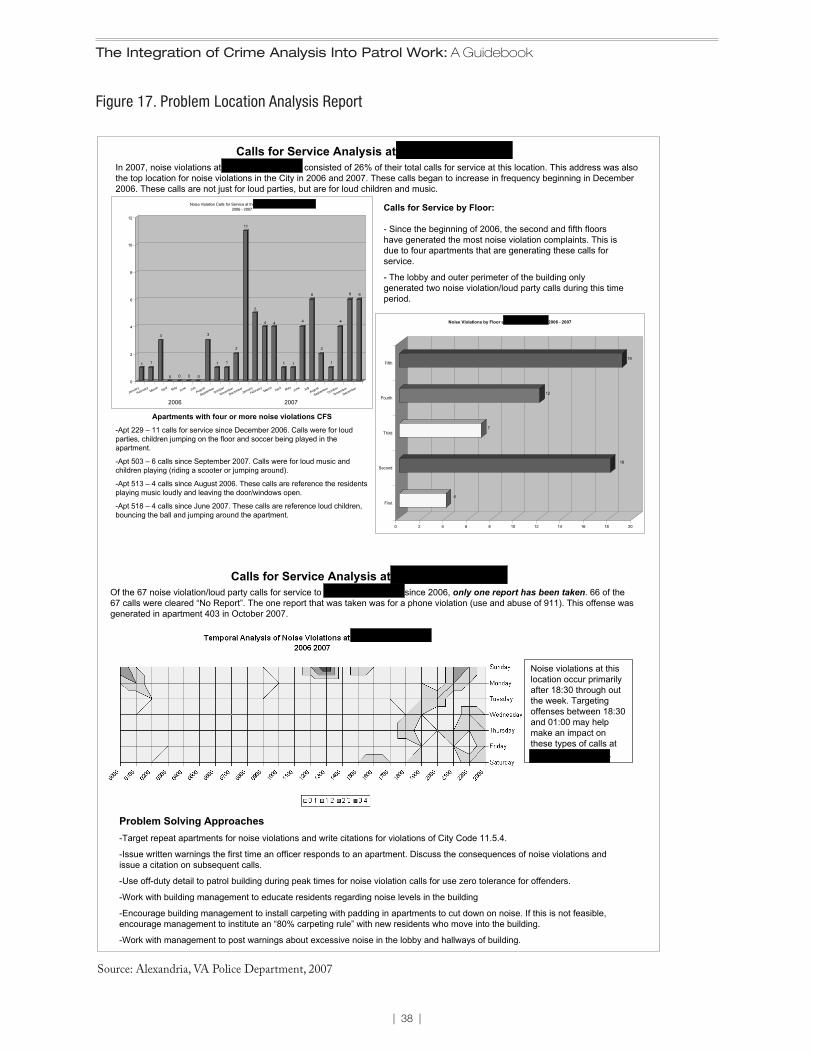
| 38 |
The Integration of Crime Analysis Into Patrol Work: A Guidebook
Source: Alexandria, VA Police Department, 2007
Figure 17. Problem Location Analysis Report
1 1
3
0 0 0 0
3
1 1
2
11
5
4 4
1 1
4
6
2
1
4
6 6
0
2
4
6
8
10
12
JanuaryFebruary
MarchApril May
June JulyAugust
SeptemberOctober
November
DecemberJanuary
FebruaryMarch
April MayJune July
August
SeptemberOctober
November
December
Noise Violation Calls for Service at the Brookside Apartments2006 - 2007
2006 2007
Calls for Service Analysis at 601 Four Mile Road
Apartments with four or more noise violations CFS
-Apt 229 – 11 calls for service since December 2006. Calls were for loud parties, children jumping on the floor and soccer being played in the apartment.
-Apt 503 – 6 calls since September 2007. Calls were for loud music and children playing (riding a scooter or jumping around).
-Apt 513 – 4 calls since August 2006. These calls are reference the residents playing music loudly and leaving the door/windows open.
-Apt 518 – 4 calls since June 2007. These calls are reference loud children, bouncing the ball and jumping around the apartment.
In 2007, noise violations at 601 Four Mile Road consisted of 26% of their total calls for service at this location. This address was also the top location for noise violations in the City in 2006 and 2007. These calls began to increase in frequency beginning in December 2006. These calls are not just for loud parties, but are for loud children and music.
4
18
7
12
19
0 2 4 6 8 10 12 14 16 18 20
First
Second
Third
Fourth
Fifth
Noise Violations by Floor at 601 Four Mile Road 2006 - 2007
Calls for Service by Floor:
- Since the beginning of 2006, the second and fifth floors have generated the most noise violation complaints. This is due to four apartments that are generating these calls for service.
- The lobby and outer perimeter of the building only generated two noise violation/loud party calls during this time period.
Calls for Service Analysis at 601 Four Mile RoadOf the 67 noise violation/loud party calls for service to 601 Four Mile Road since 2006, only one report has been taken. 66 of the 67 calls were cleared “No Report”. The one report that was taken was for a phone violation (use and abuse of 911). This offense wasgenerated in apartment 403 in October 2007.
Problem Solving Approaches-Target repeat apartments for noise violations and write citations for violations of City Code 11.5.4.
-Issue written warnings the first time an officer responds to an apartment. Discuss the consequences of noise violations and issue a citation on subsequent calls.
-Use off-duty detail to patrol building during peak times for noise violation calls for use zero tolerance for offenders.
-Work with building management to educate residents regarding noise levels in the building
-Encourage building management to install carpeting with padding in apartments to cut down on noise. If this is not feasible, encourage management to institute an “80% carpeting rule” with new residents who move into the building.
-Work with management to post warnings about excessive noise in the lobby and hallways of building.
Noise violations at this location occur primarily after 18:30 through out the week. Targeting offenses between 18:30 and 01:00 may help make an impact on these types of calls at 601 Four Mile Road.
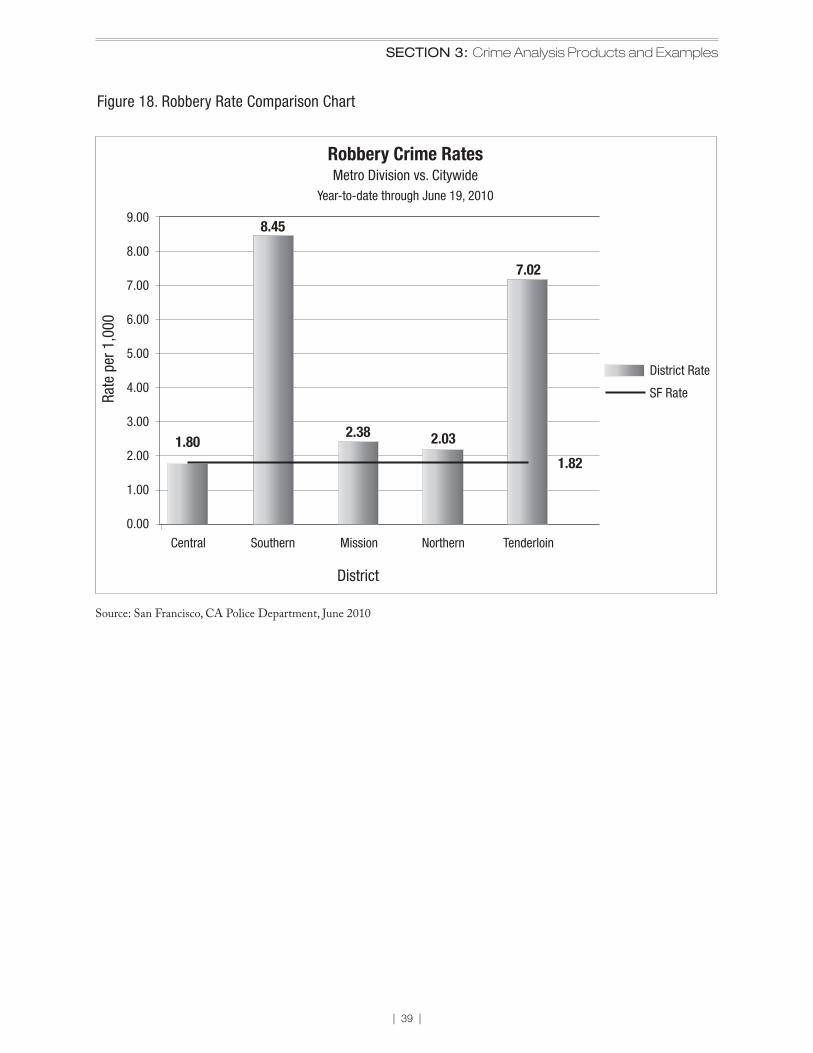
| 39 |
SECTION 3: Crime Analysis Products and Examples
Source: San Francisco, CA Police Department, June 2010
Figure 18. Robbery Rate Comparison Chart
0.00
1.00
2.00
3.00
4.00
5.00
6.00
7.00
8.00
9.00
Robbery Crime RatesMetro Division vs. Citywide
Year-to-date through June 19, 2010
Rate
per
1,0
00
District Rate
SF Rate
Central
1.80
Southern
8.45
District
Mission
2.38
Northern
2.03
Tenderloin
7.02
1.82

| 41 |
SECTION 4: Implementation Framework
SECTION 4: Implementation Framework
Although this research did not result in a simple implementation framework for integrating crime analysis into patrol work, this section provides the results from discussion with innovative practitioners obtained from the project focus groups, the working groups, and the case study on
how an agency might move toward the organizational integration of crime analysis. In addition, it also covers a model for institutionalizing problem solving, analysis, and accountability developed by Dr. Boba, co-author of this guide, through her work with the Port St. Lucie, Florida Police Department. Although Dr. Boba’s model addresses issues beyond integrating crime analysis into patrol, it does address the key issues discussed in this guidebook.
Innovative Police Practitioner Discussions on Implementation FrameworkAs noted in the first section, individuals from a variety of agencies and positions were brought together in both focus groups and working groups to discuss integration of crime analysis into patrol work. The following section is an overview of the considerations and recommendations discussed in these groups as they relate to development of an implementation framework for crime analysis. They include a discussion of the role of organizational structure, technological and training needs, and communication.
Organizational Structure
Adjustments to the organizational structure are likely necessary in order to integrate crime analysis. First, there needs to be a clear recognition of the role for first-line supervisors and managers. Just as in the development of community policing in many agencies that focused on empowering line-level officers,24 the critical role for first-line supervisors and managers is often overlooked when implementing a crime analysis program. Often, line officers are given all the responsibility for making use of crime analysis, yet little guidance is provided on the role for first-line supervisors and managers, who are, in fact, the key to the integration of crime analysis into patrol, because they have the biggest direct impact on line officers’ day-to-day activities.
First-line supervisors and managers can serve as facilitators for the use of crime analysis by holding their officers responsible for using the results of crime analysis, and can also serve as role models for using it themselves to combat existing or emerging patterns of crime activity. First-line supervisors and managers are also in a better position to improve the relevancy of crime analysis products by serving as important conduits between the analysts producing the reports and the officers using the reports. For example, in the Port St. Lucie, Florida Police Department, the Chief of Police has written a very specific general order dictating the role of all ranks (e.g., officers, sergeants, lieutenants, and captains) and their use of analysis to implement crime reduction strategies.
| 42 |
The Integration of Crime Analysis Into Patrol Work: A Guidebook
Another issue key to the integration of crime analysis, particularly important to the crime analyst practitioners, is the location of crime analysis within the organizational structure. The recommendation from the practitioners is that the crime analysis capacity should have a neutral placement and report to a supervisor fairly high within the organizational chart. That is, a crime analysis unit would not be placed in an operational division like the patrol or criminal investigations division when seeking to fully integrate crime analysis, because doing so would prioritize the unit’s work just for that division.25
Also, if crime analysis units are attached to specialized units (e.g., community policing units), they may become associated with only those units and their work may no longer be viewed as relevant for the entire agency. In the Jacksonville, Florida Sheriff ’s Office, the Crime Analysis Unit reports to a high level (sworn) commander and is in a self-contained unit that is placed within the Continuous Improvement Division, which also houses the information technology function. This neutral positioning facilitates the Crime Analysis Unit having access to and being relevant to the whole agency. In addition, this placement facilitates the unit being able to centralize a number of crime analysis functions (e.g., standardizing a number of automated reports), but also provides the flexibility to decentralize certain functions and allow particular analysts in the unit to develop expertise in certain areas when necessary (e.g., special expertise in sexually violent offenses).
Technology and Training
Technology and training are integral in achieving any longstanding changes within a police agency. These issues are particularly important for crime analysis integration since modern crime analysis relies on technology and both new and seasoned officers are often unfamiliar with the capabilities and potential uses of crime analysis products.
One of the most important issues discussed in the focus and working groups, particularly by experienced crime analysts, is the need to use technology to automate as much of the routine crime analysis functions as possible. For example, in both the Alexandria, Virginia Police Department and the Jacksonville, Florida Sheriff ’s Office, crime analyst administrators have automated as many crime analysis functions as possible, which has led to greater accessibility to information by sworn personnel and has freed up time for analysts to work on more sophisticated analyses. Another issue related to technology is that it can help facilitate the collection of better quality data by officers. By using standardized software programs with drop down menus and quality control features, police agencies can help officers to write better reports, check to ensure they have done so, and improve the quality of analysis overall.
In an agency striving for the integration of crime analysis, training of all sworn personnel is important, because they need to understand the capabilities of crime analysis as well as the purpose of the crime analysis products (as discussed in Section II). Training of sworn personnel would not discuss how the products are created, but would focus on what they mean, how they can be used, and examples of successful use of the products. Training should be tailored to the responsibilities of the individuals attending the training and should seek to improve data collection at the call-for-service and crime-report level (i.e., poor data collection results in poor crime analysis). Crime analysis training can also be integrated into the normal police training (e.g., academy training, field officer training, and in-service
| 43 |
SECTION 4: Implementation Framework
training) of the agency. For example, when first integrating crime analysis, the Port St. Lucie, Florida Police Department initially provided separate training for line-level, supervisors, and commanders. Now that crime analysis is used regularly, yearly in-service training is provided for all staff, reviewing current practices, covering new products, and soliciting feedback about the crime analysis process.
Communication
Lastly, effective communication of crime analysis results was emphasized as an important issue in the focus and working group discussions. The practitioners asserted that crime analysis products must be focused, easy to understand, and should not overwhelm, and that ineffective communication would cause sworn officer consumers to not make appropriate use of these products. More specifically, it was noted that crime analysis products should not be particularly fancy, but should focus on brevity, relevance, and readability. For example, it is recommended and supported by the focus and working group practitioners that short-term crime pattern bulletins be no more than one page.
Another issue that is more of an outcome of integrating crime analysis than a facilitator is the process of moving away from communication and distribution networks for crime analysis products that are based on personal relationships. If the use of crime analysis is integrated, products are proactively created (i.e., not predominantly driven by requests) and are provided in a systematic way to all relevant personnel. Many agencies are using Internet-based software to create “blogs” or “threads” through which officers and supervisors communicate in real time about crime reduction strategies. Using this type of software, crime analysis information is posted and personnel from various divisions log in from their own computers and document response activity, which is then available for everyone else to see.26
As discussed previously, line-level officers use particular products that are relevant to their daily activities, but these tend to be informational, because patrol officers are more focused on their own shift. In fact, the practitioners asserted that in general, crime analysis results should be targeted at supervisors, managers, and commanders, as they have a larger responsibility to direct resources, address more complex issues than individual incidents, and will, therefore, make the best use of crime analysis results.
Although the results should be made available to everyone to view, it was discussed that crime analysis results would typically be conveyed to officers by their superiors along with direction for responses, so the products should be developed and communicated with this in mind. As shown in the crime analysis product example #7 (page 31), high level commanders at the Mesa, Arizona Police Department work with crime analysts to assess key patterns that each police service area will address and the general strategies that will be used. This plan is then translated into simple daily mission statements—tailored to each geographic area of the city—that are provided to line officers by their front line supervisors. Police supervisors work with the commanders on the plan and have an opportunity to provide input into their mission statements. Also, the line-level officers can work with the supervisors to alter the mission statements as necessary. The data that form the basis for the mission statements are available to all line officers, but the results of the crime analysis products are geared more for the higher level personnel while the line officers have the responsibility to implement the daily mission strategies.
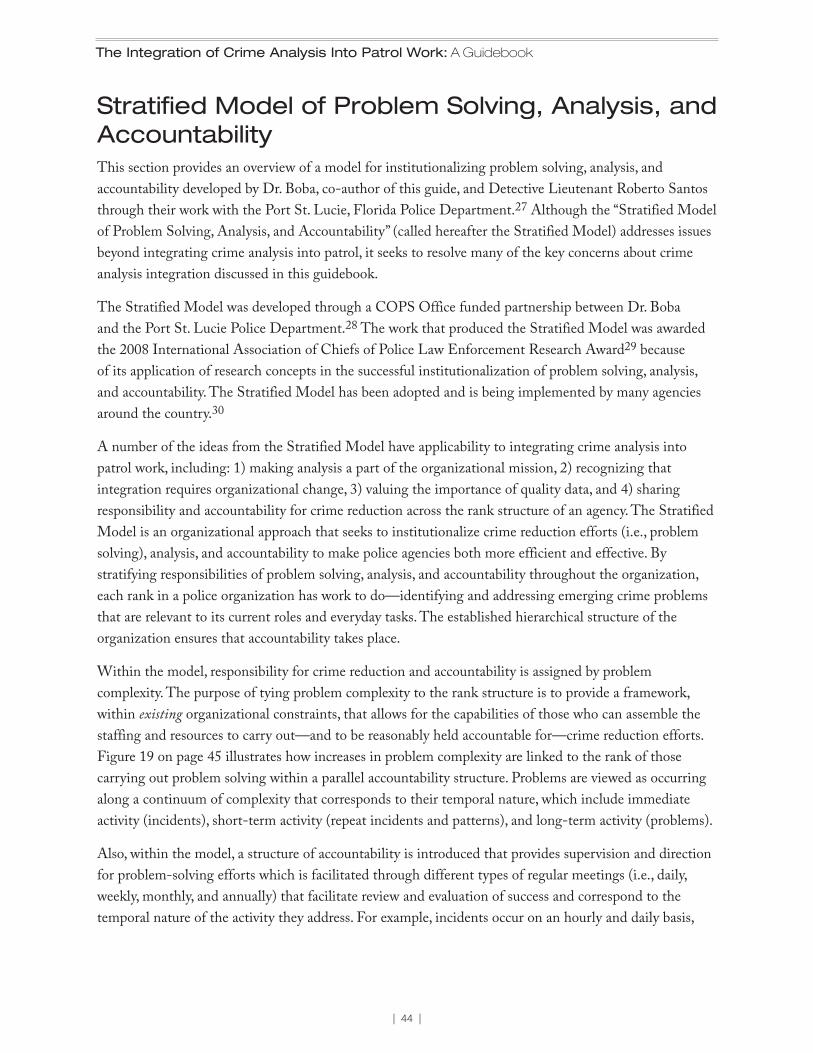
| 44 |
The Integration of Crime Analysis Into Patrol Work: A Guidebook
Stratified Model of Problem Solving, Analysis, and AccountabilityThis section provides an overview of a model for institutionalizing problem solving, analysis, and accountability developed by Dr. Boba, co-author of this guide, and Detective Lieutenant Roberto Santos through their work with the Port St. Lucie, Florida Police Department.27 Although the “Stratified Model of Problem Solving, Analysis, and Accountability” (called hereafter the Stratified Model) addresses issues beyond integrating crime analysis into patrol, it seeks to resolve many of the key concerns about crime analysis integration discussed in this guidebook.
The Stratified Model was developed through a COPS Office funded partnership between Dr. Boba and the Port St. Lucie Police Department.28 The work that produced the Stratified Model was awarded the 2008 International Association of Chiefs of Police Law Enforcement Research Award29 because of its application of research concepts in the successful institutionalization of problem solving, analysis, and accountability. The Stratified Model has been adopted and is being implemented by many agencies around the country.30
A number of the ideas from the Stratified Model have applicability to integrating crime analysis into patrol work, including: 1) making analysis a part of the organizational mission, 2) recognizing that integration requires organizational change, 3) valuing the importance of quality data, and 4) sharing responsibility and accountability for crime reduction across the rank structure of an agency. The Stratified Model is an organizational approach that seeks to institutionalize crime reduction efforts (i.e., problem solving), analysis, and accountability to make police agencies both more efficient and effective. By stratifying responsibilities of problem solving, analysis, and accountability throughout the organization, each rank in a police organization has work to do—identifying and addressing emerging crime problems that are relevant to its current roles and everyday tasks. The established hierarchical structure of the organization ensures that accountability takes place.
Within the model, responsibility for crime reduction and accountability is assigned by problem complexity. The purpose of tying problem complexity to the rank structure is to provide a framework, within existing organizational constraints, that allows for the capabilities of those who can assemble the staffing and resources to carry out—and to be reasonably held accountable for—crime reduction efforts. Figure 19 on page 45 illustrates how increases in problem complexity are linked to the rank of those carrying out problem solving within a parallel accountability structure. Problems are viewed as occurring along a continuum of complexity that corresponds to their temporal nature, which include immediate activity (incidents), short-term activity (repeat incidents and patterns), and long-term activity (problems).
Also, within the model, a structure of accountability is introduced that provides supervision and direction for problem-solving efforts which is facilitated through different types of regular meetings (i.e., daily, weekly, monthly, and annually) that facilitate review and evaluation of success and correspond to the temporal nature of the activity they address. For example, incidents occur on an hourly and daily basis,
| 45 |
SECTION 4: Implementation Framework
thus supervisors meet with officers out on the road and have daily meetings or briefings to ensure officers are addressing incidents effectively. On the other hand, problems are manifested over several months or years so meetings that ensure accountability of analysis and problem solving occur monthly and are carried out by mid-level and command officers.
Notably, crime analysis products are also linked to responsibility and complexity of the problem at hand and are integral in directing crime reduction strategies for those problems. For example, short-term crime patterns are systematically identified by crime analysts, and personnel in various divisions of the agency (e.g., patrol, criminal investigations, and crime prevention) implement strategies together to address the patterns. In addition, crime analysis is used to assess the success of the strategies.
The Stratified Model seeks to integrate much more than just crime analysis, but its concepts help outline a framework for integration of crime analysis as discussed in this guidebook. That is, crime analysis can be broken down and applied to different levels of activity, personnel have different responsibilities for problem solving therefore require different types of analysis, and crime analysis can be used to identify problems, understand their underlying causes, as well as assess whether police strategies are effective. A more detailed discussion of the Stratified Model and its practical implementation is also the topic of another COPS Office guidebook entitled, A Police Organizational Model for Crime Reduction: Institutionalizing Problem Solving, Analysis, and Accountability (Boba and Santos, 2011) and can be found on the COPS Office website.
Chief
Systematic Accountability
Rank
Systematic Problem Solving
Of�cer
Incident Repeat Incident Pattern Problem
Level of Problem Complexity
Source: Boba and Santos (2011)
Figure 19. Stratified Model of Problem Solving, Analysis, and Accountability

| 47 |
SECTION 5: Discussion and Future Considerations
SECTION 5: Discussion and Future Considerations
DiscussionAs discussed throughout this guidebook, a significant body of research has emerged that highlights the importance of data-driven approaches for police effectiveness in crime reduction (e.g., hotspots policing, problem solving or intelligence-led policing). To implement these approaches requires the use of crime analysis to help guide the efforts of patrol. More broadly, the use of crime analysis can bring an agency into a 21st century approach of using information and analysis to guide decision making and making more effective use of limited resources in a targeted fashion.
In this guidebook, the importance of “integrating” crime analysis into patrol has been emphasized because without integration, crime analysis can never reach its potential and will go unused by the very people it is designed to assist. The extensive data collection conducted for this project has shown how agencies have successfully implemented crime analysis by incorporating it into the day-to-day process of the agency. These agencies have been able to demonstrate the value of crime analysis in a number of ways. They have used crime analysis to reveal important patterns and trends that are otherwise not discernible, have provided “actionable” products that direct focused police responses, and have emphasized the importance of patrol field work and investigative skills while demonstrating how crime analysis can add value to that work.
The primary task of this guidebook has been to take the research results of a COPS Office funded project and translate them into practical assistance for police agencies who are seeking to more fully integrate crime analysis into their day-to-day patrol operations. The intention here is that the guidebook will be used by upper police managers and leaders who are looking for recommendations and guidance for fully incorporating crime analysis into their agency, particularly into patrol. A series of considerations and recommendations have been provided that can be used to create a plan for integration. They are not intended to provide “how-to” information or be a step-by-step guide to crime analysis integration because the process of integration is agency specific and varies by the nature of the agency and the types of issues it addresses. Consequently, this guidebook provides some of the critical ingredients of successful crime analysis systems that have to be mixed with a variety of local conditions and processes to be successful. That is, each agency’s organizational structure, culture, and nature of crime and disorder within the jurisdiction will dictate how crime analysis can be integrated.
The guidebook not only focuses on improving the crime analysis capacity of an agency, but also presents an organizational approach for the integration of crime analysis into policing by detailing how issues such as leadership, accountability, policies and procedures, clarity of crime analysis purpose and audience, as well as roles for analysts and patrol need to be attended to in order to facilitate the integration of crime analysis into patrol. The guidebook has provided crime analysis product examples that have been effectively implemented into innovative police agencies from around the United States.
| 48 |
The Integration of Crime Analysis Into Patrol Work: A Guidebook
Lastly, recommendations have been provided for adapting an agency’s organizational structure, fulfilling technological (e.g., automation of reports) and training needs, and engendering effective communication processes, and a brief overview has been provided of a recent innovative implementation framework for the institutionalization of problem solving, crime analysis, and accountability.
Future Considerations This guidebook has focused on making recommendations and presenting products that an individual agency would use to implement and integrate crime analysis. However, this last section expands the focus to discuss what steps can be taken on a larger scale to advance the integration of crime analysis within the entire field of policing. Some of these key future considerations include, but may not be limited to the following:
• Taking advantage of the momentum created by CompStat and its focus on crime analysis.
• Linking the importance of crime analysis with new ideas in policing, such as intelligence-led policing and predictive policing.
• Advancing a research agenda that seeks to better understand the various manifestations of crime analysis and how integrating crime analysis makes police agencies more effective.
• Educating the field of policing about the benefits of crime analysis.
What follows is a brief discussion of each consideration.
CompStat
The CompStat model is an attempt to synthesize an accountability structure, crime analysis, and strategic problem solving.31 The role of crime analysis is integral to the CompStat process, with the name itself (i.e., “comp” = computer and “stat” = statistics) emphasizing this point. In a national assessment of the adoption and elements of CompStat, researchers concluded that the strategy appeared to be new and innovative in its use of technology and crime analysis.32 CompStat is important because it takes the analysis of up-to-date computerized crime, arrest, and disorder-related data to produce statistics and maps (i.e., crime analysis) to guide regular crime reduction strategy meetings in which managers are held accountable for the strategies implemented in their geographic areas. In addition, others have asserted that CompStat is complementary to a problem-oriented policing approach because it can be implemented within the problem-solving process.33
| 49 |
SECTION 5: Discussion and Future Considerations
Due to its success in New York, CompStat has diffused quickly within U.S. police agencies and has become a widely-embraced management model. In 1999–2000, over a third of agencies with 100 or more officers reported implementing a “CompStat-like” program.34 In fact, due to CompStat’s flexibility, Maryland’s Governor Martin O’Malley used this model to create CitiStat when he was Mayor of Baltimore and now StateStat for the state of Maryland, innovatively expanding the CompStat model as a means to oversee and manage multiple government agencies.35
Consequently, CompStat has been one of the significant influences surrounding the adoption of crime analysis and crime mapping by police departments in the 1990s.36 Just as CompStat has been embraced by a very large number of agencies as a progressive management tool, integrated analysis can also be embraced as an operations tool for directing crime reduction strategies in patrol work. A guidebook such as this is intended to reach police executives in order to educate and provide “best practice” examples of integrated crime analysis with which to ellicit a sea of change similar to what CompStat has generated. Interestingly, crime analysis and CompStat are inherently linked, thus the integration of crime analysis need not start from zero but can build on the success and adoption of CompStat that already exists.
Thus, the future for crime analysis and CompStat is to have the idea of integrated crime analysis (not just crime statistics and mapping) substantively linked to CompStat, particularly at the operational level, through discussions and presentations at the leading police executive organizations, such as the Police Executive Research Forum, the International Association of Chiefs of Police, and the National Sheriffs’ Association. Once on firm ground, crime analysis integration can perhaps be discussed as a topic unto itself at these same conferences. Given the wide adoption and popularity of CompStat, integrated crime analysis can perhaps ride on its “coat tails” until a critical mass of agencies begin the implementation process.
Intelligence-Led and Predictive Policing
In recent years, there have been new policing strategies that have been put forth by both academics and practitioners; the most notable of which are Intelligence-Led Policing and Predictive Policing. Intelligence-led policing is a contemporary business model and management philosophy that puts the intelligence [analytical] function within the overall mission of the police organization and seeks to reduce and prevent crime as well as disrupt offender activity, guided by the combination of crime analysis and criminal intelligence.37 Interestingly, the idea that intelligence is part of an agency’s overall mission is perfectly in line with the idea of integrating crime analysis into patrol work.
Predictive policing is another new strategy envisioned by the former Chief of Police of the Los Angeles Police Department (LAPD), William J. Bratton. While at the LAPD, Bratton and his staff began developing predictive policing to include the use of new technology, business processes, and advanced analytical techniques to direct patrol and proactive responses.38 The main focus of predictive policing is to take analytical methods used in business and other non-government disciplines to anticipate or predict future demand and identify trends, patterns, and relationships in crime and other types of police data (e.g., disorder, traffic related).
| 50 |
The Integration of Crime Analysis Into Patrol Work: A Guidebook
These strategies are so new that their impact on policing has not been fully examined, but what is important is their central reliance on crime analysis. That is, new and innovative strategies being created and developed by both researchers and practitioners are those that incorporate and seek to fully integrate the use of crime analysis. For example, at the First Predictive Policing Symposium, hosted by the Los Angeles Police Department and the National Institute of Justice, it was noted that no matter how advanced the crime analysis, officers still have to be engaged in the process to be able to use the results.39 This is precisely the strength of an integrated crime analysis framework as presented in this guidebook. Once again, integration of crime analysis can be linked to the popularity of other police approaches. If the chief executive needs to use the terms “intelligence-led policing” or “predictive policing” to secure or rally support for the integration of crime analysis, so be it, because in the end they all seek to make crime analysis invaluable to police practice.
Advancing a Research Agenda
Many researchers have written about the importance of a practically focused research agenda for policing. In a recent article, two Australian academics lay out the issues of police research.40 They assert that police leaders have historically been defensive as a consequence of researchers who primarily seek out the problems of policing and treat agencies as research subjects. They advocate, on the other hand, a type of research in which researchers and police work together to implement policies and practices in an attempt to make police organizations more effective and evaluate both their process and impact. In fact, one of the most important points is that researchers must recognize practitioner knowledge and experiences as part of the research process.41
Even further, it is not enough to recognize practitioner knowledge and experience, but that “practiced-based evidence” should also be pursued, as it is action-oriented research that seeks to understand and help police agencies of their own accord implement policies in a comprehensive way, and not research of programs or strategies implemented haphazardly or temporarily by the agency for the sake of research.42 The distinction can be illustrated with the following example:
[L]et’s take the case of problem-oriented policing (POP). There are numerous evaluations and examples of how POP has been implemented into individual units in agencies and applied to specific problems, and a review of the existing research indicates that POP shows the most promise for effective policing.…Yet, POP has not been institutionalized into police organizations or policing overall as Goldstein intended…instead of examining the lack of implementation of POP by looking at what is deficient in policing, the practice-based evidence approach would examine the lack of implementation by looking at what is deficient with POP that makes it difficult to implement in the practical police environment.43
This relates to crime analysis integration in that there is a need to more fully understand the importance and effectiveness of crime analysis in policing from the perspective of police, not of researchers. To date, survey and case study research on crime analysis and crime mapping has only provided insight into their prevalence, the characteristics of practice, and the sophistication of technology used for crime analysis
| 51 |
SECTION 5: Discussion and Future Considerations
and crime mapping. Examples include: 1) Crime Analysis Through Computer Mapping,44 a compilation of over 25 essays describing advanced application and uses of crime mapping; 2) Crime Mapping Case Studies: Successes in the Field, Volumes I and II,45 each a volume of 15 case studies written by practitioners and researchers which documents scenarios of how mapping was successfully used in police practice; and 3) Crime Mapping Case Studies: From Practice and Research, Volume 1,46 a series of articles that seek to document the developments of crime mapping by providing real world examples. There have been no detailed studies conducted on evaluating the relevance, quality, and usefulness of specific crime analysis products.
The importance of rigorously testing crime analysis in the practical context cannot be overstated. Without such research, police agencies are continually “reinventing the wheel” when they seek to implement and attempt to integrate crime analysis. This research cannot be done outside and independent of the culture and daily routines of police practice, which is why the research must be done as “practice-based.”
As a result, more work needs to be done to develop and advance a formalized research agenda to better understand the various manifestations of integrated crime analysis and how it can deliver important outcomes for an agency. The research community can work with police to develop measures of the level of integration of crime analysis and begin to study the effectiveness of the various components. In addition, these measures of the integration process can be used in practice to guide agency leadership toward targets for crime analysis integration, and ways to modify efforts if those targets are not reached. This guidebook provides a first step in this direction; however, the knowledge it provides at this point is mostly descriptive and qualitative, so there is much more work to be done.
Educating the Field
The final consideration for the future of crime analysis integration is to accelerate the education of the policing field on the benefits of crime analysis integration. As was discussed at length in the focus groups for this project—and thus is a clear focus of the guidebook—the integration of crime analysis, just like any major change in policing, cannot occur without the explicit support and push of police leaders. They must be provided with the knowledge about the importance and usefulness of crime analysis, so that they can take the initiative and make crime analysis an invaluable priority to the operations of their agencies.
In order to educate commanders and chiefs in the more than 17,000 police agencies in the United States, all the work discussed thus far in this section is integral. That is, it is important to link crime analysis integration with innovative practices that have been overwhelmingly accepted and adopted by police agencies (i.e., CompStat), to emphasize the connection of crime analysis with any new police crime reduction strategies, such as intelligence-led policing and predictive policing, and to promote the examples and encouraging results of practice-oriented research on crime analysis integration.

| 52 |
The Integration of Crime Analysis Into Patrol Work: A Guidebook
Ultimately, crime analysis cannot be integrated as a grassroots movement from the bottom of police organizations, but more likely will become incorporated into day-to-day operations when chiefs make it a priority, when the usefulness of crime analysis products have been tested, when there are policies that hold people accountable for responding based on crime analysis results, and when officers themselves experience successful results.
| 53 |
References
REFERENCES
Beck, C., and C. McCue. 2009. Predictive policing: What can we learn from Wal-Mart and Amazon about fighting crime in a recession? Police Chief Magazine 76 (November): 18–20, 22, 23, 24.
Block, R. C., M. Dabdoub, and S. Fregly. Eds. 1995. Crime analysis through computer mapping. Washington, D.C.: Police Executive Research Forum.
Boba, R. 2009. Crime analysis with crime mapping. Thousand Oaks, CA: Sage.
Boba, R. 2010. A practice-based evidence approach in Florida. Police Practice and Research 11:122–128.
Boba, R., and J. Crank. 2008. Institutionalizing problem-oriented policing: Rethinking problem identification, analysis, and accountability. Police Practice and Research 9(5): 379–393.
Boba, R., and R. Santos. 2011. A Police Organizational Model for Crime Reduction: Institutionalizing Problem Solving, Analysis, and Accountability. Washington D.C.: U.S. Department of Justice, Office of Community Oriented Policing Services.
Bradley, D., and C. Nixon. 2009. Ending the ‘dialogue of the deaf ’: Evidence and policing policies and practices, an Australian case study. Police Practice and Research: An International Journal 10(5–6): 423–435.
Bratton, W. J. 1998. Crime is down in New York City: Blame the police. In Zero tolerance: Policing a free society, 2nd ed., ed. Norman Dennis, 29–42. London: IEA.
Chainey, S., and L. Thompson., eds. 2007. Crime mapping case studies: From practice and research (Volume 1). West Sussex, England: John Wiley & Sons, Ltd.
Chemers, M. M. 2002. Integrating models of leadership and intelligence: Efficacy and effectiveness. In Multiple Intelligences and Leadership, ed. R. E. Riggio, S. E. Murphy, and F. J. Pirozzolo, 139–160. Mahwah, NJ: Lawrence Erlbaum Associates.
Cope, N. 2004. Intelligence led policing or policing led intelligence? The British Journal of Criminology 44:188–203.
Cordner, G., and E. P. Biebel. 2005. Problem-oriented policing in practice. Criminology & Public Policy 4:155–181.
Eck, J. 2006. Science, values, and problem-oriented policing: Why problem-oriented policing? In Police innovation: Contrasting perspectives, ed. D. L. Weisburd and A. Braga, 117–132. Cambridge, U.K.: Cambridge University Press.
Fenton, J. 2007. O’Malley installing StateStat: Statistics-based management is coming to Md. government. Baltimore Sun, February 12. www.baltimoresun.com.
Fillichio, C. 2005. Getting ahead of the curve: Baltimore Citistat. Public Manager 34:51–53.
| 54 |
The Integration of Crime Analysis Into Patrol Work: A Guidebook
LaVigne, N., and J. Wartell. eds. 1998. Crime mapping case studies. Vol. 1. Washington D.C.: Police Executive Research Forum.
LaVigne, N., and J. Wartell. eds. 2000. Crime mapping case studies. Vol. 2. Washington D.C.: Police Executive Research Forum.
McCue, C. 2007. Data mining and predictive analysis: Intelligence gathering and crime analysis. Burlington, MA: Butterworth-Heinemann.
O’Shea, T. C., and K. Nicholls. 2003. Police crime analysis: A survey of U.S. police departments with 100 or more sworn personnel. Police Practice and Research 4:233–250.
Port St. Lucie, Florida Police Department (PSLPD). 2008. IACP and Sprint-Nextel Excellence in Law Enforcement Research Award application.
Ratcliffe, J. 2010. Intelligence-led policing: Anticipating risk and influencing action. In Intelligence 2010: Revising the basic elements, eds. M. B. Peterson, B. Morehouse, and R. Wright. IALEIA.
Schafer, J. A. 2008. Effective police leadership: experiences and perspectives of law enforcement leaders. FBI Law Enforcement Bulletin 77(7): 18–25.
Scott, M. 2000. Problem-oriented policing: Reflections on the f irst 20 years. Washington, D.C.: U.S. Department of Justice, Office of Community Oriented Policing Services.
Sherman, L., D. Gottfredson, D. MacKenzie, J. Eck, P. Reuter, and S. Bushway. 1997. Preventing crime: what works, what doesn’t, what’s promising. Washington D.C.: Office of Justice Programs. Chapter 8.
Taylor, B. G., A. Kowalyk, and R. Boba. 2008. The integration of crime analysis into law enforcement agencies: An exploratory study into the perceptions of crime analysts. Police Quarterly 10(2): 154–169.
Uchida, C. 2010. A national discussion on predictive policing: Defining our terms and mapping successful implementation strategies. Washington D.C.: National Institute of Justice. Weisburd, D. L., and A. Braga. 2006. Police innovation: Contrasting perspectives. Cambridge, U.K.: Cambridge University Press.
Weisburd, D., and J. Eck. 2004. What can police do to reduce crime, disorder, and fear? The Annals of the American Academy of Political and Social Science, 593:42–65.
Weisburd, D., S. D. Mastrofski, A. McNally, R. Greenspan, and J. J. Willis. 2003. Reforming to preserve: Compstat and strategic problem solving in American policing, Criminology and Public Policy 2:421–456.
| 55 |
Notes
NOTES
1. Sherman, et al. 1997; Weisburd and Eck 2004.
2. Weisburd and Braga 2006; Weisburd and Eck 2004.
3. Boba 2009.
4. Boba and Crank 2008; O’Shea and Nicholls 2003.
5. Cordner and Biebel 2005; Cope 2004; O’Shea and Nicholls 2003.
6. Boba and Crank 2008; Cope 2004; Cordner and Biebel 2005; O’Shea and Nicholls 2003.
7. Cope 2004.
8. Boba 2009.
9. O’Shea and Nicholls 2003.
10. Cope 2004.
11. Boba and Santos 2011; McCue 2007.
12. Cope 2004.
13. O’Shea and Nicholls 2003.
14. Cordner and Biebel 2005.
15. Taylor, Kowalyk, and Boba 2009.
16. Ibid.
17. Boba 2010; Boba and Santos 2011.
18. Chemers 2002.
19. Schafer 2008.
20. Weisburd, Mastrofski, McNally, Greenspan, and Willis 2003.
21. Ibid.
22. For a more detailed discussion, see Boba 2009, Chapter 14.
23. For more information and the key components of a crime pattern bulletin, see Boba, 2008, Chapter 11.
24. Cordner and Biebel 2005.
25. Boba 2009.
26. The PSLPD has developed and Intranet site that is regularly used by all personnel.
| 56 |
The Integration of Crime Analysis Into Patrol Work: A Guidebook
27. For more information, see Boba and Crank 2008; Boba and Santos 2011; Port St. Lucie, FL Police 2008.
28. The Stratified Model was developed through a research partnership between Dr. Boba and the Port St. Lucie, FL Police Department which began in January 2004. Two separate COPS cooperative agreements (#2003-CK-WX-K042 and #2007-CK-WX-K007) provided funding for the collaboration. Although the funding has ended, the partnership is still ongoing.
29. Port St. Lucie, FL Police Department 2008.
30. Agencies that have or are in the process of implementing the model include: Fort Pierce, FL Police Department; Dayton, OH Police Department; Cincinnati, OH Police Department; Anne Arundel County, MD Police Department; Champaign, IL Police Department, as well as others. For the most recent list of agencies, contact Dr. Rachel Boba at [email protected].
31. Bratton 1998.
32. Weisburd, et al. 2003.
33. Eck 2006.
34. Weisburd, et al. 2003.
35. Fillichio 2005; Fenton 2007.
36. Boba 2009.
37. Ratcliffe 2010.
38. Beck and McCue 2009; Uchida 2010.
39. Uchida 2010.
40. Bradley and Nixon 2009.
41. Ibid.
42. Boba 2010.
43. Boba 2010: 123–24.
44. Block, Dabdoub, and Fregly 1995.
45. LaVigne and Wartell 1998 and 2000.
46. Chainey and Thompson 2007.

U.S. Department of JusticeOffice of Community Oriented Policing Services145 N Street, N.E.Washington, DC 20530
To obtain details on COPS Office programs, call the COPS Office Response Center at 800.421.6770
Visit COPS Online at www.cops.usdoj.gov
The Integration of Crime Analysis Into Patrol Work: A Guidebook explores the data and analysis needs of
patrol officers and the importance of analysis throughout the police organization. This guidebook explores the
current state of the field as it relates to the use of crime analysis and analytical products, the needs of the
police organization, and best practices in crime analysis and data collection as they relate to patrol work. The
guidebook also illustrates the work of a select group of agencies that successfully integrated crime analysis
into patrol services. Helpful examples of crime analysis products are provided. The purpose of this document
is to offer guidance to law enforcement agencies on integrating data collection and crime analysis into regular
patrol work within a community policing context.
ISBN: 978-1-935676-33-1
e061120376
September 2011