Embed Size (px)
Citation preview
Crime in Missouri 2011
MISSOURI STATE HIGHWAY PATROL STATISTICAL ANALYSIS CENTER
1510 East Elm Jefferson City, Missouri 65101
(573) 751-9000


v
Crime in Missouri, 2011 Contents
CONTENTS PAGE EXECUTIVE SUMMARY .............................................................................................. xiii INTRODUCTION ............................................................................................................. 1 1.0 MISSOURI CRIME CLOCK ................................................................................... 5 2.0 MISSOURI CRIME INDEX COMPARISON ANALYSIS ....................................... 9 3.0 MISSOURI ARREST ANALYSIS ....................................................................... 19 4.0 MISSOURI DETAILED CRIME INDEX ANALYSIS .......................................... 27 4.1 Murder ........................................................................................................... 29 4.2 Forcible Rape ................................................................................................ 37 4.3 Robbery ......................................................................................................... 41 4.4 Aggravated Assault ....................................................................................... 47 4.5 Burglary ......................................................................................................... 51 4.6 Larceny/Theft ................................................................................................. 57 4.7 Motor Vehicle Theft ....................................................................................... 63 4.8 Arson ............................................................................................................. 69 5.0 MISSOURI DOMESTIC VIOLENCE ANALYSIS ................................................ 75 5.1 Domestic Violence Related Incidents ............................................................ 77 5.2 Domestic Violence Related Homicides .......................................................... 81 6.0 MISSOURI COUNTY AND CITY CRIME AND ARREST ANALYSIS ................ 85 6.1 Missouri Political Subdivision Index Crime Analysis ...................................... 87 6.2 Missouri Political Subdivision Part II Arrest Analysis ................................... 122 7.0 MISSOURI LAW ENFORCEMENT OFFICERS KILLED ................................. 139 8.0 MISSOURI LAW ENFORCEMENT OFFICERS ASSAULTED ....................... 145 9.0 MISSOURI LAW ENFORCEMENT EMPLOYMENT ....................................... 155 10.0 MISSOURI LAW ENFORCEMENT AGENCY EMPLOYMENT / ASSAULT ANALYSIS ....................................................................................... 163 11.0 MISSOURI HATE CRIME ANALYSIS................................................................ 181 GLOSSARY ................................................................................................................ 189

vii
Crime in Missouri, 2011 Tables
TABLES
MISSOURI CRIME INDEX COMPARISON ANALYSIS PAGE 2.0.1 Crime Index Offenses, state of Missouri, 2011 ..................................................... 11 2.0.2 Actual Reported Crime Index Offenses, state of Missouri, 2002 - 2011 ............... 12 2.0.3 Crime Index Offense Rates, state of Missouri, 2002 - 2011 ................................. 13 2.0.4 Property Crime Index Economic Analysis of Property Stolen 2010 - 2011 ........................................................................................................... 14 MISSOURI ARREST ANALYSIS 3.0.1 Crime Index Clearance Rates, state of Missouri, 2002 - 2011 ............................. 21 3.0.2 Crime Index Arrests, state of Missouri, 2002 - 2011 ............................................. 22 3.0.3 Crime Index Arrest Rates, state of Missouri, 2002 - 2011 .................................... 23 MISSOURI DETAIL CRIME INDEX ANALYSIS Murder 4.1.1 Murder Rates by Population Group, 2011 ............................................................ 30 4.1.2 Murder Clearance Rates, 2010 - 2011 .................................................................. 31 4.1.3 Murder Arrests by Sex and Age Group, 2011 ....................................................... 31 4.1.4 Murder Arrests by Race and Age Group, 2011..................................................... 31 4.1.5 Murder Victims by Sex and Age Group, 2011....................................................... 32 4.1.6 Murder Victims by Race and Age Group, 2011 .................................................... 32 4.1.7 Type of Weapon Used by Offenders in Murders, 2011 ......................................... 33 4.1.8 Circumstances with Murders, 2011 ....................................................................... 34 Forcible Rape 4.2.1 Forcible Rape Rates by Population Group, 2011 ................................................. 38 4.2.2 Actual / Attempted Rape Offenses, 2011 .............................................................. 39 4.2.3 Forcible Rape Clearance Rates, 2010 - 2011....................................................... 39 4.2.4 Forcible Rape Arrests by Sex and Age Group, 2011 ............................................ 39 4.2.5 Forcible Rape Arrests by Race and Age Group, 2011 .......................................... 40 Robbery 4.3.1 Number of Robberies and Robbery Rates by Population Group, 2011 ................ 42 4.3.2 Type of Weapon Used in Robberies, 2011 ........................................................... 43 4.3.3 Robbery Loss / Location, 2011 ............................................................................. 43 4.3.4 Robbery Clearance Rates, 2010 - 2011 ............................................................... 44 4.3.5 Robbery Arrests by Sex and Age Group, 2011..................................................... 44 4.3.6 Robbery Arrests by Race and Age Group, 2011 .................................................. 44
viii
Crime in Missouri, 2011 Tables
PAGE Aggravated Assault 4.4.1 Aggravated Assault Rates by Population Group, 2011 ......................................... 48 4.4.2 Type of Weapon Used in Aggravated Assaults, 2011 .......................................... 49 4.4.3 Aggravated Assault Clearance Rates, 2010 - 2011 .............................................. 49 4.4.4 Aggravated Assault Arrests by Sex and Age Group, 2011 ................................... 49 4.4.5 Aggravated Assault Arrests by Race and Age Group, 2011 ................................. 50 Burglary 4.5.1 Burglary Rates by Population Group, 2011 .......................................................... 52 4.5.2 Type of Burglary, 2011 ......................................................................................... 53 4.5.3 Burglary Loss / Location / Time, 2011 .................................................................. 53 4.5.4 Burglary Clearance Rates, 2010 - 2011................................................................ 54 4.5.5 Burglary Arrests by Sex and Age Group, 2011 ..................................................... 54 4.5.6 Burglary Arrests by Race and Age Group, 2011 ................................................... 54 Larceny / Theft 4.6.1 Theft Rates by Population Group, 2011................................................................ 58 4.6.2 Theft by Value of Stolen Items, 2011 .................................................................... 59 4.6.3 Nature of Theft, 2011 ............................................................................................ 59 4.6.4 Theft Clearance Rates, 2010 - 2011 ..................................................................... 60 4.6.5 Theft Arrests by Sex and Age Group, 2011 .......................................................... 60 4.6.6 Theft Arrests by Race and Age Group, 2011 ........................................................ 60 Motor Vehicle Theft 4.7.1 Motor Vehicle Theft Rates by Population Group, 2011 ......................................... 64 4.7.2 Type of Vehicle Stolen, 2011 ................................................................................ 65 4.7.3 Motor Vehicle Theft Yearly Loss, 2010 - 2011 ...................................................... 65 4.7.4 Motor Vehicle Theft Clearance Rates, 2010 - 2011 .............................................. 66 4.7.5 Motor Vehicle Theft Arrests by Sex and Age Group, 2011 ................................... 66 4.7.6 Motor Vehicle Theft Arrests by Race and Age Group, 2011 ................................. 66 Arson 4.8.1 Arson Rates by Population Group, 2011 .............................................................. 70 4.8.2 Arson Loss by Type of Property, 2011.................................................................. 71 4.8.3 Arson Clearance Rates, 2010 - 2011.................................................................... 72 4.8.4 Arson Arrests by Sex and Age Group, 2011 ......................................................... 72 4.8.5 Arson Arrests by Race and Age Group, 2011....................................................... 72
ix
Crime in Missouri, 2011 Tables
PAGE MISSOURI DOMESTIC VIOLENCE ANALYSIS 5.1.1 Domestic Violence Incidents by Victim / Offender Relationship and Domestic Violence Rates by County, 2011 ........................................................... 78 5.2.1 Domestic Violence Related Homicides, Victim / Offender Relationship, 2011 ..... 83 MISSOURI COUNTY AND CITY CRIME AND ARREST ANALYSIS 6.1.1 Index Offenses by Crime Type and Political Subdivision, 2011 ............................ 88 6.1.2 Index Arrests by Crime Type and Political Subdivision, 2011 ............................. 105 6.2.1 Part II Arrests by Crime Type and Political Subdivision, 2011 ............................ 123 6.2.2 Missouri Uniform Crime Reporting Program, All Arrests by Age, Sex, and Crime, 2011 ......................................................................................... 136 6.2.3 Missouri Uniform Crime Reporting Program, All Arrests by Crime Type and Race, 2011 ......................................................................................................... 138 MISSOURI LAW ENFORCEMENT OFFICERS KILLED 7.1.1 Law Enforcement Officers Killed in the Line of Duty, state of Missouri, 2002 - 2011 ......................................................................................................... 142 MISSOURI LAW ENFORCEMENT OFFICERS ASSAULTED 8.1.1 Law Enforcement Officer Assaults and Assault Rates, state of Missouri, 2007 - 2011 ......................................................................................................... 148 8.1.2 Law Enforcement Officer Assaults by Type of Weapon, state of Missouri, 2007 - 2011 ......................................................................................................... 149 8.1.3 Law Enforcement Officer Assaults by Population Group, state of Missouri, 2011 .................................................................................................................... 150 8.1.4 Law Enforcement Officer Assaults, Occurrence of Injury by Type of Weapon, state of Missouri, 2011 ........................................................................................ 150 8.1.5 Law Enforcement Officer Assaults, Type of Assignment by Type of Circumstance, state of Missouri, 2011 ................................................................ 151 MISSOURI LAW ENFORCEMENT EMPLOYMENT 9.1.1 Law Enforcement Sworn Employees by Population Group, state of Missouri, 2007 - 2011 ......................................................................................................... 158 9.1.2 Law Enforcement Civilian Employees by Population Group, state of Missouri, 2007 - 2011 ......................................................................................................... 159 9.1.3 Law Enforcement Sworn and Civilian Employees by Population Group, state of Missouri, 2007 - 2011 ..................................................................................... 160 9.1.4 Law Enforcement Sworn and Civilian Employees by Sex and Population Group, state of Missouri, 2011 ............................................................................ 161
x
Crime in Missouri, 2011 Tables
PAGE MISSOURI LAW ENFORCEMENT AGENCY EMPLOYMENT / ASSAULT ANALYSIS 10.1.1 Law Enforcement Employment and Assaults by Reporting Agency, 2011 ....... 167 MISSOURI HATE CRIME ANALYSIS 11.1.1 Hate Crime Incidents by Year, state of Missouri, 2009 - 2011 .......................... 185 11.1.2 Hate Crime Incidents by Bias Motivation, state of Missouri, 2011 .................... 185 11.1.3 Hate Crime Incidents by Offense Type, state of Missouri, 2011 ....................... 186 11.1.4 Hate Crime Incidents by Location, state of Missouri, 2011 ............................... 186 11.1.5 Hate Crime Known Offenders by Race, state of Missouri, 2011 ....................... 187 11.1.6 Hate Crime Incidents by Victim Type, state of Missouri, 2011 .......................... 187
xi
Crime in Missouri, 2011 Figures
FIGURES
PAGE MISSOURI CRIME CLOCK 1.0.1 Missouri Crime Clock, 2011 .................................................................................... 7 MISSOURI CRIME INDEX COMPARISON ANALYSIS 2.0.1 Crime Index Offense Rates, state of Missouri, Time Series ................................. 15 2.0.2 Crime Index Offense Rates, state of Missouri by County, 2011 ........................... 15 2.0.3 Violent Index Offense Rates, state of Missouri, Time Series ................................ 16 2.0.4 Violent Index Offense Rates, state of Missouri by County, 2011 .......................... 16 2.0.5 Property Index Offense Rates, state of Missouri, Time Series ............................. 17 2.0.6 Property Index Offense Rates, state of Missouri by County, 2011 ....................... 17 MISSOURI ARREST ANALYSIS 3.0.1 Crime Index Arrest Rates, state of Missouri, Time Series .................................... 24 3.0.2 Violent Index Arrest Rates, state of Missouri, Time Series ................................... 25 3.0.3 Property Index Arrest Rates, state of Missouri, Time Series ................................ 26 MISSOURI DETAIL CRIME INDEX ANALYSIS 4.1.1 Murder Offense Rates, state of Missouri, Time Series ......................................... 35 4.2.1 Rape Offense Rates, state of Missouri, Time Series ............................................ 40 4.3.1 Robbery Offense Rates, state of Missouri, Time Series ....................................... 45 4.4.1 Aggravated Assault Offense Rates, state of Missouri, Time Series ..................... 50 4.5.1 Burglary Offense Rates, state of Missouri, Time Series ....................................... 55 4.6.1 Theft Offense Rates, state of Missouri, Time Series ............................................ 61 4.7.1 Motor Vehicle Theft Offense Rates, state of Missouri, Time Series ..................... 67 4.8.1 Arson Offense Rates, state of Missouri, Time Series ........................................... 73 MISSOURI LAW ENFORCEMENT OFFICERS KILLED 7.1.1 Law Enforcement Officers Killed in the Line of Duty, state of Missouri, 2002 - 2011 ......................................................................................................... 142 MISSOURI LAW ENFORCEMENT OFFICERS ASSAULTED 8.1.1 Missouri Law Enforcement Assault Clock, 2011 ................................................ 146 8.1.2 Law Enforcement Officer Assault Rates, state of Missouri, 2007 - 2011 ............ 149 8.1.3 Law Enforcement Officer Assaults by Type of Activity, state of Missouri, 2011 .................................................................................................................... 152
xii
Crime in Missouri, 2011 Figures
PAGE 8.1.4 Law Enforcement Officer Assaults by Type of Assignment, state of Missouri, 2011 .................................................................................................................... 152 8.1.5 Law Enforcement Officer Assaults, Twenty-Four Hour Analysis, state of Missouri, 2011 .................................................................................................... 153
xiii
Crime in Missouri, 2011 Executive Summary
EXECUTIVE SUMMARY This Digest is produced annually by the Missouri State Highway Patrol (MSHP) Statistical Analysis Center (SAC). Prior to 2001, the primary source of data was from law enforcement agencies who voluntarily submitted crime statistics to the Federal Bureau of Investigation's (FBI) National Uniform Crime Reporting Program (UCR). In 2001, Missouri law enforcement agencies were statutorily required to submit their crime statistics to Missouri's UCR Program. The Crime Index is the sum of eight major offenses and is used to measure the magnitude of crime in the United States. Only eight major offenses are included in the Index because of their frequency of occurrence and the fact they are most likely to be reported to law enforcement agencies. These Index offenses are: murder, forcible rape, robbery, aggravated assault, burglary, larceny / theft, motor vehicle theft, and arson. The first four make up the Violent Crime Index and the last four make up the Property Crime Index. In 2011, 227,501 Crime Index offenses were reported in the state of Missouri. In 2011, one Index Crime was committed every 2.3 minutes. In 24.5 of every 100 Crime Index offenses, the cases were cleared by arrest or exceptional means. Violent Crime Index Violent offenses made up 11.8 percent of the total 2011 Missouri Crime Index. There were 26,852 Violent Index offenses reported in 2011. A violent offense was committed in Missouri every 19.6 minutes. In 50.8 of every 100 Violent Index offenses, the cases were cleared by arrest or exceptional means.
385 murders were reported in 2011. While murder is the most serious Index offense, it made up only 0.2 percent of the total 2011 Missouri Crime Index. One murder was committed every 22.8 hours. Of every 100 murders, 72.5 percent were cleared by arrest or exceptional means.
1,457 forcible rapes were reported in 2011. Forcible rape accounted for 0.6 percent of the total 2011 Missouri Crime Index. One forcible rape was committed every 6.0 hours. In 52.6 percent of every 100 forcible rapes, the cases were cleared by arrest or exceptional means.
Of the index offenses reported in 2011: 11.8% were violent offenses One violent crime was committed every 19.6 minutes
xiv
Crime in Missouri, 2011 Executive Summary
6,258 robberies were reported in 2011. Robbery accounted for 2.8 percent of the total 2011 Missouri Crime Index. One robbery occurred every 1.4 hours. In 31.1 percent of every 100 robberies, the cases were cleared by arrest or exceptional means. 18,752 aggravated assaults were reported in 2011.
Aggravated assault accounted for 8.3 percent of the total 2011 Missouri Crime Index. One aggravated assault occurred every 28.0 minutes. In 56.8 percent of every 100 aggravated assaults, the cases were cleared by arrest or exceptional means.
Property Crime Index Property offenses made up 88.2 percent of the total 2011 Missouri Crime Index. There were 200,199 Property Index offenses reported in 2011. Property offenses accounted for $293,142,334 in property stolen or destroyed. One such offense occurred every 2.6 minutes in the state. In 20.9 percent of every 100 Property Index offenses, the cases were cleared by arrest or exceptional means.
44,765 burglaries were reported in 2011. Burglary accounted for 19.7 percent of the total 2011 Missouri Crime Index. One burglary occurred every 11.7 minutes and $82,664,716 in property / cash was stolen in 2011 due to this offense. In 14.2 percent of every 100 burglaries, the cases were cleared by arrest or exceptional means.
138,632 thefts were reported in 2011. Larcenies and thefts
accounted for 61.0 percent of the total 2011 Missouri Crime Index. One larceny / theft occurred every 3.8 minutes and $99,160,420 in property / cash was stolen in 2011 due to this offense. In 24.0 percent of every 100 larcenies and thefts, cases were cleared by arrest or exceptional means.
15,295 motor vehicle thefts reported in 2011. Motor vehicle
theft accounted for 6.7 percent of the total 2011 Missouri Crime Index. One motor vehicle theft occurred every 34.4 minutes and $85,634,639 in property was stolen in 2011 due to this offense. In 12.8 percent of every 100 motor vehicle thefts, the cases were cleared by arrest or exceptional means.
1,507 arsons reported in 2011. Arson accounted for 0.7
percent of the total 2011 Missouri Crime Index. One arson occurred every 5.8 hours and $25,682,559 in property was destroyed. Of all arson cases, 16.5% were cleared by arrest or exceptional means.
Between 2010 and 2011:
Violent Crime decreased 0.9%
Murder decreased 11.5%
Rape increased 2.8%
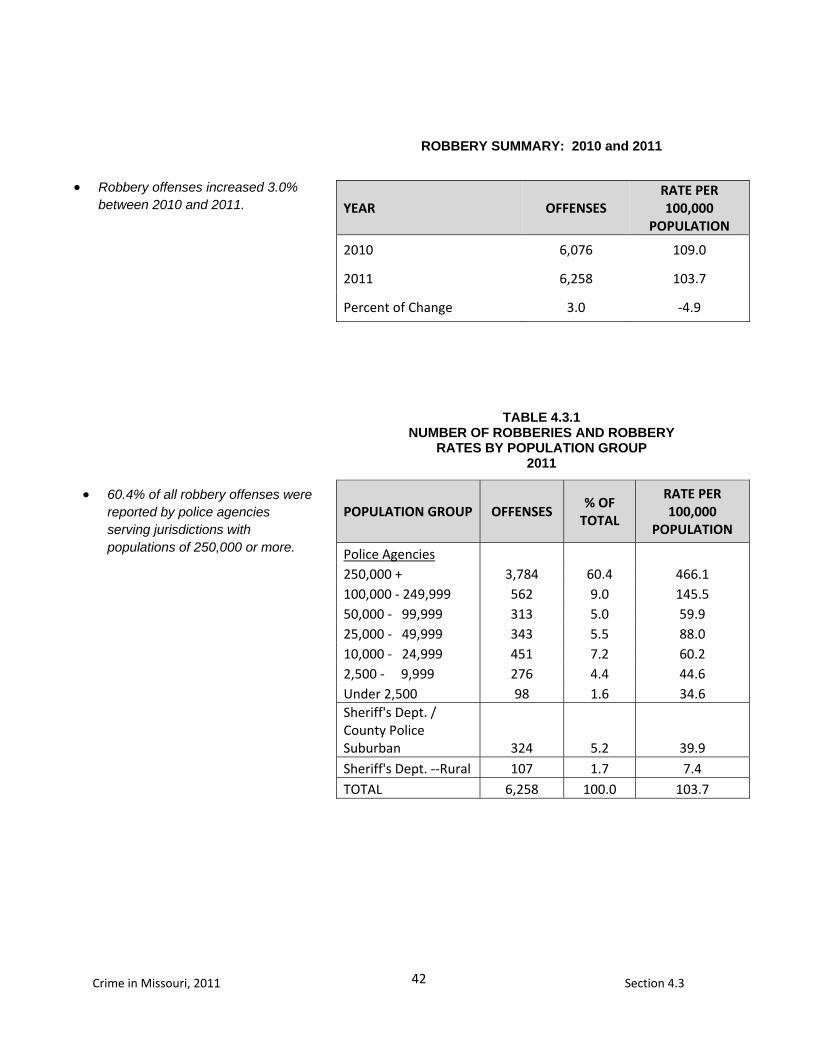
Robbery increased 3.0%
Aggravated Assault decreased 2.2%
Of the index offenses reported in 2011: 88.2% were property offenses One property crime was committed every 2.6 minutes
Between 2010 and 2011:
Property Crime increased 0.04%
Burglary increased
2.8%
Larceny / Theft decreased 0.4%
Motor Vehicle Theft
decreased 3.4%
Arson increased 1.1%
xv
Crime in Missouri, 2011 Executive Summary
In addition to crime index offense and arrest data, this publication contains data on domestic violence incidents, officers killed or assaulted in the line of duty, law enforcement employment levels, and hate crimes in Missouri. Domestic Violence In 2011, law enforcement agencies in Missouri reported 40,602 incidents of domestic violence. In these incidents, 71 were homicides. These included:
8,956 incidents of spousal abuse (includes former spouses).
12,519 incidents between individuals living together or individuals who have lived together in the past.
7,264 incidents between blood relatives.
5,178 incidents between couples with child(ren) in common.
Law Enforcement Officers Killed In 2011, four officers were killed feloniously and three were killed accidentally in the line of duty in the state of Missouri. Law Enforcement Officers Assaulted In 2011, 2,428 law enforcement officers were assaulted in the line of duty in the state of Missouri. An officer was assaulted in the state of Missouri every 3.6 hours and assaults resulted in an injury to the officer every 17.3 hours Law Enforcement Employment Missouri law enforcement agencies employed 20,363 persons in 2011. Of these, 14,625 were sworn officers and 5,738 were civilians. Hate Crimes In 2011, 121 hate crime incidents were committed by 137 known offenders. Of these incidents, 63.9% involved bias motivation aimed toward victims' race.
22.1% of all domestic violence incidents reported in 2011 involved spouses (includes former spouses).
In 2011, seven officers died in the line of duty.
In 2011, 18.0% of all assaults on officers involved a weapon.
Missouri law enforcement agencies employed 14,625 sworn officers in 2011.
Of all hate crime incidents in 2011, 66.1% involved crimes against persons and 33.9% were crimes against property.
71 homicides in 2011 were domestic violence related.

1
Crime in Missouri, 2011 Introduction
INTRODUCTION This publication is one in a series prepared by the Missouri State Highway Patrol, Statistical Analysis Center (SAC). It is designed to present data on crime and arrest activity in Missouri from 2002 through 2011 with special emphasis on the most recent year's crime and arrest activity. The crime and arrest data in this publication are segmented into eleven parts. The first section displays the Missouri Crime Clock. This clock offers an overview of the frequency of occurrence of Crime Index offenses committed in the state in relation to time. The Crime Index is the sum of the eight major offenses used to indicate the occurrence of crime in the United States. The eight offenses making up the total Crime Index are: murder, forcible rape, robbery, aggravated assault, burglary, motor vehicle theft, larceny / theft, and arson. The second section provides data related to Crime Index offenses committed in the state of Missouri. Its purpose is to provide a comparison of the various types of Crime Index offenses so their relative importance can be assessed. In addition, Crime Index activity is displayed by geographical regions of the State and also over time to observe trends. The third section presents data on arrest activity and clearance rates associated with Crime Index offenses as well as arrest activity associated with other classes of criminal offenses. These data describe criminal enforcement activity being performed in the state by crime type. The fourth section provides a series of data and analysis related to each of the eight types of Crime Index offenses. Data are provided on crime activity, clearance rates, crime patterns, and arrest activity associated with each of these offenses. Section 5 provides summary data on domestic violence incidents committed in Missouri and identifies relationships between domestic violence victims and offenders. The sixth section provides summary data on Crime Index offenses and arrest activity for specific political subdivisions in the state. Sections seven and eight provide summary data on law enforcement officers killed and assaulted while on duty. Section nine provides uniformed and civilian employment information for Missouri law enforcement agencies. Section 10 provides data on law enforcement employees as well as the number of assaults on sworn personnel for specific political subdivisions in the state. Finally, Section 11 identifies the number and characteristics of 2011 hate crimes in Missouri. Trends of these crimes from 2009 through 2011 are also analyzed in Section 11. Prior to 2001, data in this Digest were provided on a voluntary basis by Missouri law enforcement agencies to the Federal Bureau of Investigation's (FBI) National Uniform Crime Reporting (UCR) Program. In 2001, State Statute RSMo 43.505 was enacted
Eight offenses make up the Crime Index. They are:
Murder
Rape
Robbery
Aggravated Assault
Burglary
Larceny / Theft
Motor Vehicle Theft
Arson
2
Crime in Missouri, 2011 Introduction
requiring Missouri law enforcement agencies to report their UCR crime statistics to the Missouri UCR Program administered by the Missouri State Highway Patrol. The national UCR Program was initiated in 1930 by the Committee on Uniform Crime Reports of the International Association of Chiefs of Police (IACP). This committee developed uniform offense and arrest classifications as well as reporting procedures which could be used by law enforcement agencies throughout the nation. The FBI was designated to administer the program and became the national clearinghouse for UCR data. The Committee on Uniform Crime Reports of the IACP continues to serve the national Program in an advisory capacity. In 1966, the National Sherriff's Association also established a Committee on Uniform Crime Reports to act as an advisory body for this program and to promote reporting to the UCR Program. Crime and arrest data are collected on a monthly basis by several methods in Missouri. Missouri law enforcement agencies have the option of reporting their crime activity on a web-based UCR reporting application. Data from all Missouri law enforcement agencies are moved to a central data repository maintained by the MSHP. Data presented in this report identify crime and arrest activity in specific political subdivisions as reported to the Missouri UCR Program. It is important to note that statistics for a political subdivision include not only crime and arrest activity reported by a local law enforcement agency, but also crime and arrest activity reported by state agencies (e.g., MSHP, Department of Conservation). No effort has been made to estimate an individual law enforcement agency's crime and arrest activity. Slight discrepancies may be found if comparisons are made with FBI UCR publications and this digest covering the same subject matter for the State of Missouri. Discrepancies may be noted when examining actual reported figures. This is a result of updates having been made to UCR files between the time the FBI data were processed and the time the SAC analysis was performed. This report is merely a snap shot of crime summary data reported to the Missouri UCR Program. Law enforcement agencies continually update their UCR data for a variety of reasons. Some Missouri law enforcement agencies report to
3
Crime in Missouri, 2011 Introduction
the Missouri Incident Reporting System (MIBRS) instead of the UCR Summary Program. These incident data are aggregated strictly by UCR hierarchical rule while the FBI aggregates NIBRS data on less strict UCR hierarchical rules. These different data aggregation methods can cause some discrepancies between national and state UCR statistics. For this reason, statistics in this report may be different than statistics obtained from other sources or reports.

5
Crime in Missouri, 2011 Section 1.0
1.0 MISSOURI CRIME CLOCK
The Missouri crime clocks summarize criminal activity in the
state during 2011 in relation to time. From this perspective, an
appreciation of the relative frequency of various criminal
offenses can be obtained. These clocks should be viewed with
care. They are designed to convey annual crime experience by
showing the relative frequency of occurrence of the index
offenses. This mode of display should not be taken to imply a
regularity in the commission of crime. Rather, they represent
the annual ratio of crime to fixed time intervals.

7
Crime in Missouri, 2011 Section 1.0
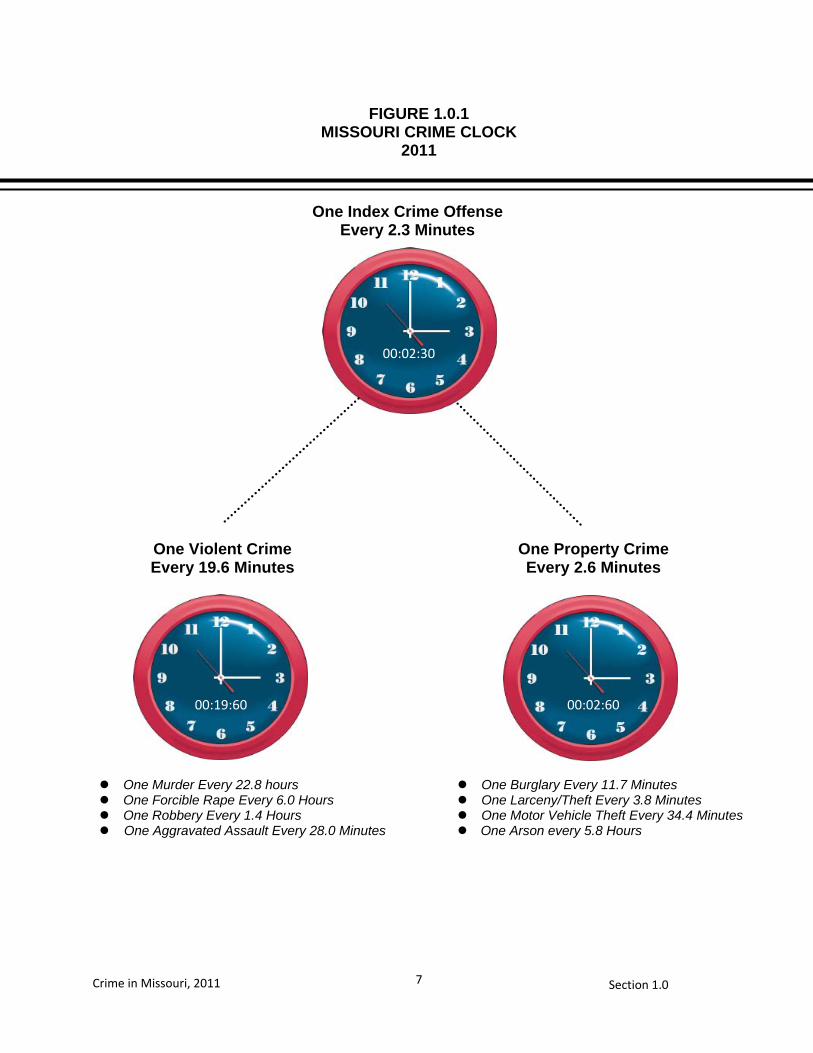
FIGURE 1.0.1 MISSOURI CRIME CLOCK
2011
One Property Crime Every 2.6 Minutes
One Violent Crime Every 19.6 Minutes
One Murder Every 22.8 hours One Forcible Rape Every 6.0 Hours One Robbery Every 1.4 Hours One Aggravated Assault Every 28.0 Minutes
One Burglary Every 11.7 Minutes One Larceny/Theft Every 3.8 Minutes One Motor Vehicle Theft Every 34.4 Minutes One Arson every 5.8 Hours
One Index Crime Offense Every 2.3 Minutes
00:02:30
00:19:60 00:02:60

9
Section 2.0Crime in Missouri, 2011
2.0 MISSOURI CRIME INDEX COMPARISON ANALYSIS
A series of tables and figures summarizes crime index offenses
committed in the state of Missouri. The purpose of these
displays is to compare the various types of crime index offenses
being committed according to their relative contribution to the
crime index. In addition, crime index offense rates are
displayed by geographic regions of the state, and over time, in
order to identify trends.

11
Section 2.0Crime in Missouri, 2011
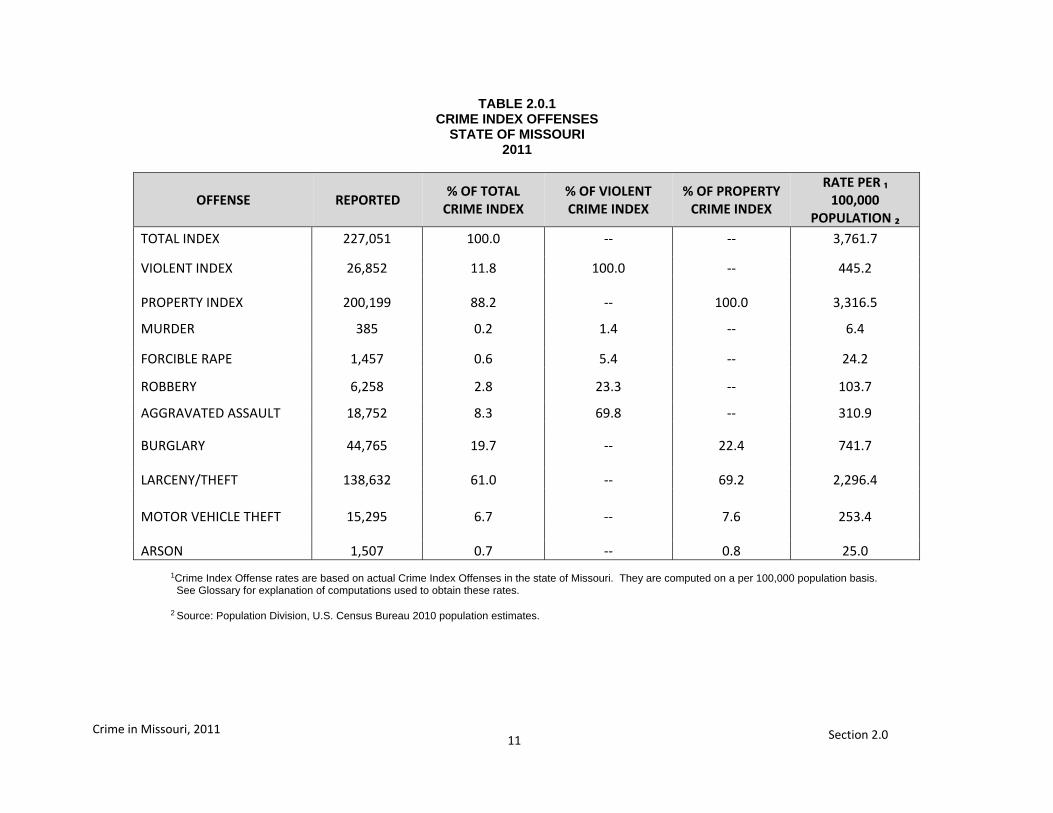
TABLE 2.0.1 CRIME INDEX OFFENSES
STATE OF MISSOURI 2011
OFFENSE REPORTED % OF TOTAL
CRIME INDEX % OF VIOLENT CRIME INDEX
% OF PROPERTY CRIME INDEX
RATE PER ₁ 100,000
POPULATION ₂ TOTAL INDEX 227,051 100.0 -- -- 3,761.7
VIOLENT INDEX 26,852 11.8 100.0 -- 445.2
PROPERTY INDEX 200,199 88.2 -- 100.0 3,316.5
MURDER 385 0.2 1.4 -- 6.4
FORCIBLE RAPE 1,457 0.6 5.4 -- 24.2
ROBBERY 6,258 2.8 23.3 -- 103.7
AGGRAVATED ASSAULT 18,752 8.3 69.8 -- 310.9
BURGLARY 44,765 19.7 -- 22.4 741.7
LARCENY/THEFT 138,632 61.0 -- 69.2 2,296.4
MOTOR VEHICLE THEFT 15,295 6.7 -- 7.6 253.4
ARSON 1,507 0.7 -- 0.8 25.0
1Crime Index Offense rates are based on actual Crime Index Offenses in the state of Missouri. They are computed on a per 100,000 population basis. See Glossary for explanation of computations used to obtain these rates. 2 Source: Population Division, U.S. Census Bureau 2010 population estimates.
12
Section 2.0Crime in Missouri, 2011
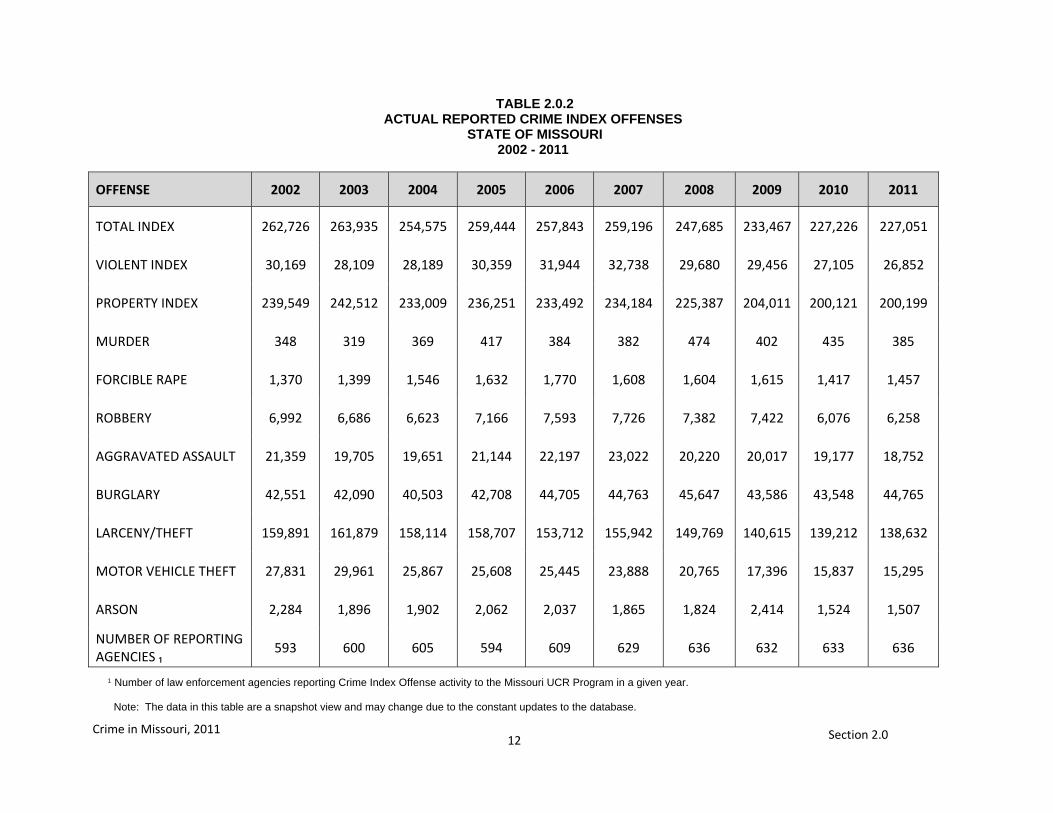
TABLE 2.0.2 ACTUAL REPORTED CRIME INDEX OFFENSES
STATE OF MISSOURI 2002 - 2011
1 Number of law enforcement agencies reporting Crime Index Offense activity to the Missouri UCR Program in a given year. Note: The data in this table are a snapshot view and may change due to the constant updates to the database.
OFFENSE 2002 2003 2004 2005 2006 2007 2008 2009 2010 2011
TOTAL INDEX 262,726 263,935 254,575 259,444 257,843 259,196 247,685 233,467 227,226 227,051
VIOLENT INDEX 30,169 28,109 28,189 30,359 31,944 32,738 29,680 29,456 27,105 26,852
PROPERTY INDEX 239,549 242,512 233,009 236,251 233,492 234,184 225,387 204,011 200,121 200,199
MURDER 348 319 369 417 384 382 474 402 435 385
FORCIBLE RAPE 1,370 1,399 1,546 1,632 1,770 1,608 1,604 1,615 1,417 1,457
ROBBERY 6,992 6,686 6,623 7,166 7,593 7,726 7,382 7,422 6,076 6,258
AGGRAVATED ASSAULT 21,359 19,705 19,651 21,144 22,197 23,022 20,220 20,017 19,177 18,752
BURGLARY 42,551 42,090 40,503 42,708 44,705 44,763 45,647 43,586 43,548 44,765
LARCENY/THEFT 159,891 161,879 158,114 158,707 153,712 155,942 149,769 140,615 139,212 138,632
MOTOR VEHICLE THEFT 27,831 29,961 25,867 25,608 25,445 23,888 20,765 17,396 15,837 15,295
ARSON 2,284 1,896 1,902 2,062 2,037 1,865 1,824 2,414 1,524 1,507
NUMBER OF REPORTING AGENCIES ₁
593 600 605 594 609 629 636 632 633 636
13
Section 2.0Crime in Missouri, 2011
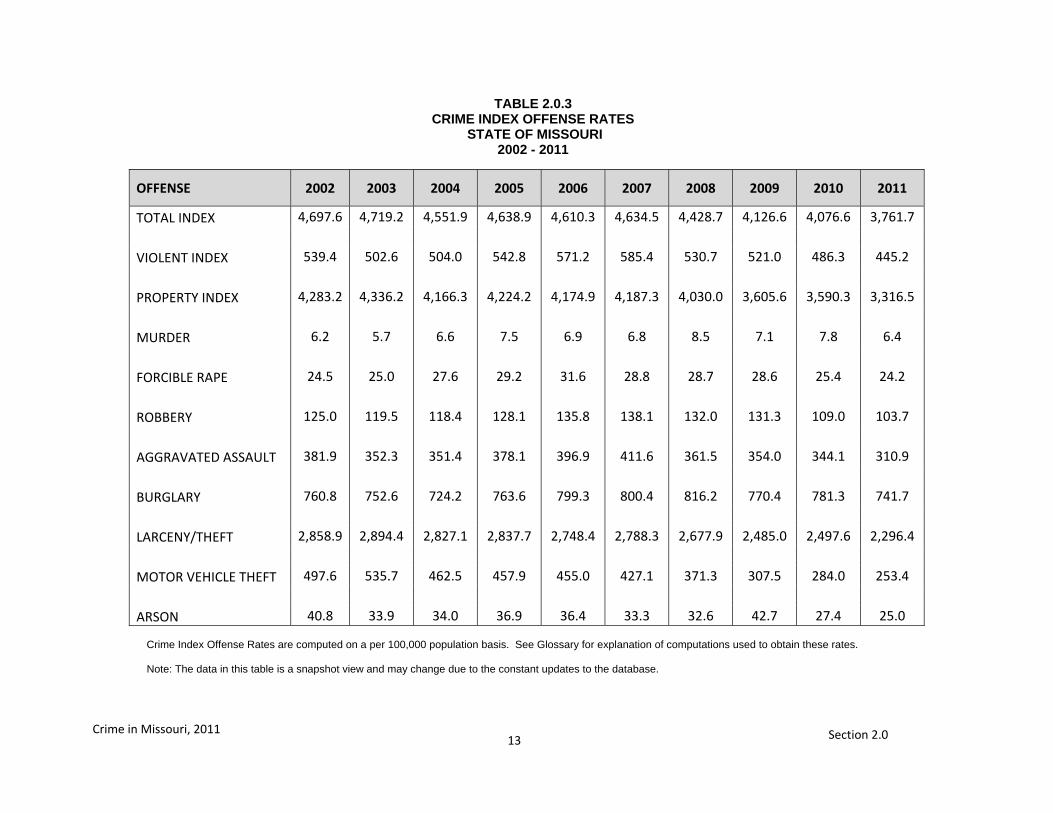
TABLE 2.0.3 CRIME INDEX OFFENSE RATES
STATE OF MISSOURI
2002 - 2011
OFFENSE 2002 2003 2004 2005 2006 2007 2008 2009 2010 2011
TOTAL INDEX 4,697.6 4,719.2 4,551.9 4,638.9 4,610.3 4,634.5 4,428.7 4,126.6 4,076.6 3,761.7
VIOLENT INDEX 539.4 502.6 504.0 542.8 571.2 585.4 530.7 521.0 486.3 445.2
PROPERTY INDEX 4,283.2 4,336.2 4,166.3 4,224.2 4,174.9 4,187.3 4,030.0 3,605.6 3,590.3 3,316.5
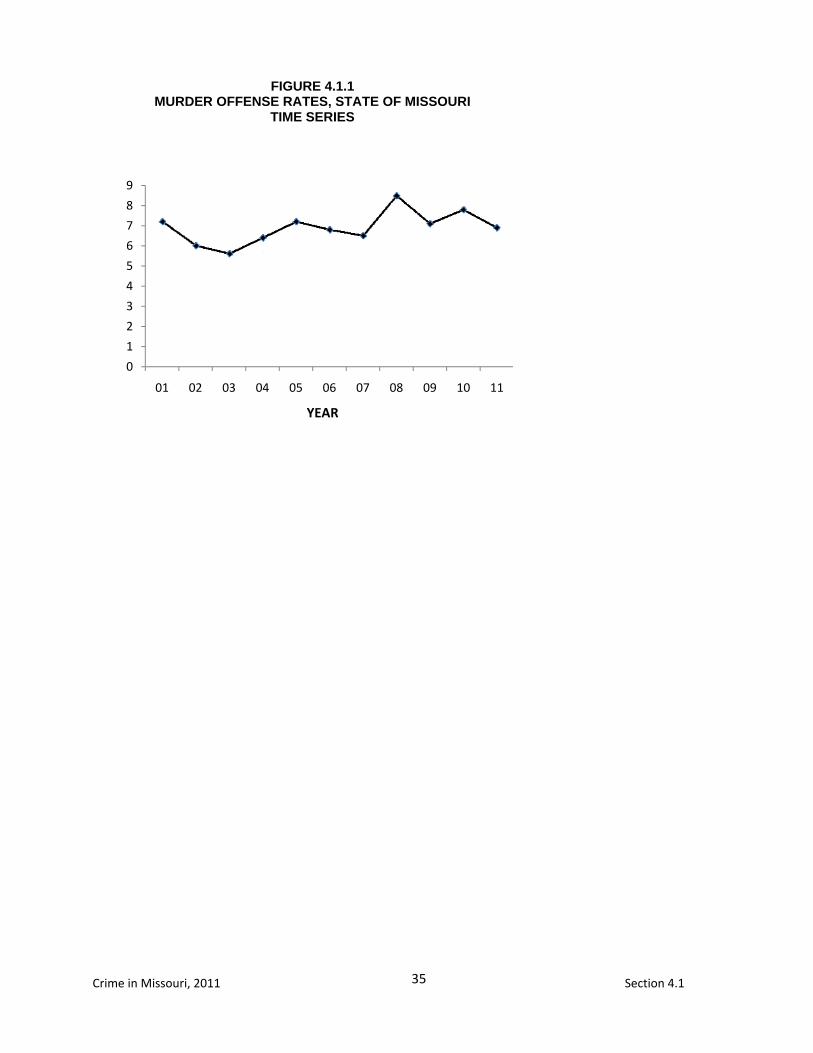
MURDER 6.2 5.7 6.6 7.5 6.9 6.8 8.5 7.1 7.8 6.4
FORCIBLE RAPE 24.5 25.0 27.6 29.2 31.6 28.8 28.7 28.6 25.4 24.2
ROBBERY 125.0 119.5 118.4 128.1 135.8 138.1 132.0 131.3 109.0 103.7
AGGRAVATED ASSAULT 381.9 352.3 351.4 378.1 396.9 411.6 361.5 354.0 344.1 310.9
BURGLARY 760.8 752.6 724.2 763.6 799.3 800.4 816.2 770.4 781.3 741.7
LARCENY/THEFT 2,858.9 2,894.4 2,827.1 2,837.7 2,748.4 2,788.3 2,677.9 2,485.0 2,497.6 2,296.4
MOTOR VEHICLE THEFT 497.6 535.7 462.5 457.9 455.0 427.1 371.3 307.5 284.0 253.4
ARSON 40.8 33.9 34.0 36.9 36.4 33.3 32.6 42.7 27.4 25.0 Crime Index Offense Rates are computed on a per 100,000 population basis. See Glossary for explanation of computations used to obtain these rates. Note: The data in this table is a snapshot view and may change due to the constant updates to the database.
14
Crime in Missouri, 2011 Section 2.0
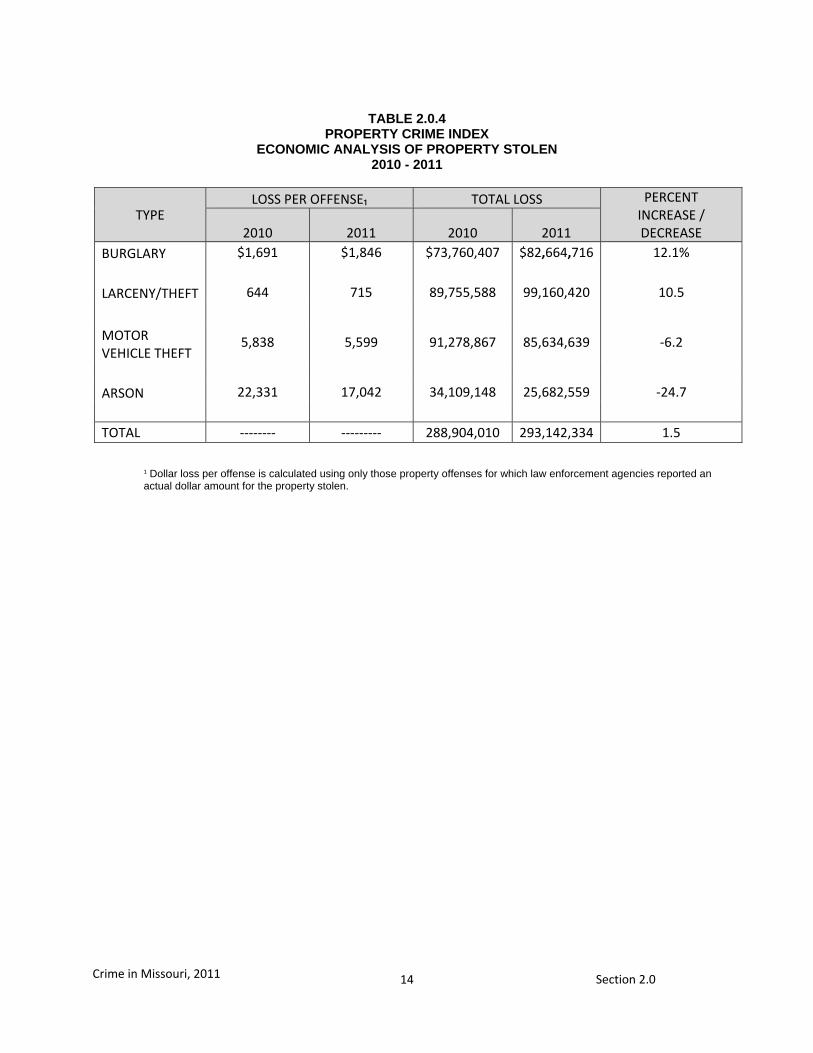
TABLE 2.0.4
PROPERTY CRIME INDEX ECONOMIC ANALYSIS OF PROPERTY STOLEN
2010 - 2011
TYPE LOSS PER OFFENSE₁ TOTAL LOSS PERCENT
INCREASE / DECREASE 2010 2011 2010 2011
BURGLARY $1,691 $1,846 $73,760,407 $82,664,716 12.1%
LARCENY/THEFT 644 715 89,755,588 99,160,420 10.5
MOTOR VEHICLE THEFT
5,838 5,599 91,278,867 85,634,639 -6.2
ARSON 22,331 17,042 34,109,148 25,682,559 -24.7
TOTAL -------- --------- 288,904,010 293,142,334 1.5
1 Dollar loss per offense is calculated using only those property offenses for which law enforcement agencies reported an actual dollar amount for the property stolen.
15
Crime in Missouri, 2011 Section 2.0
LEGEND:1
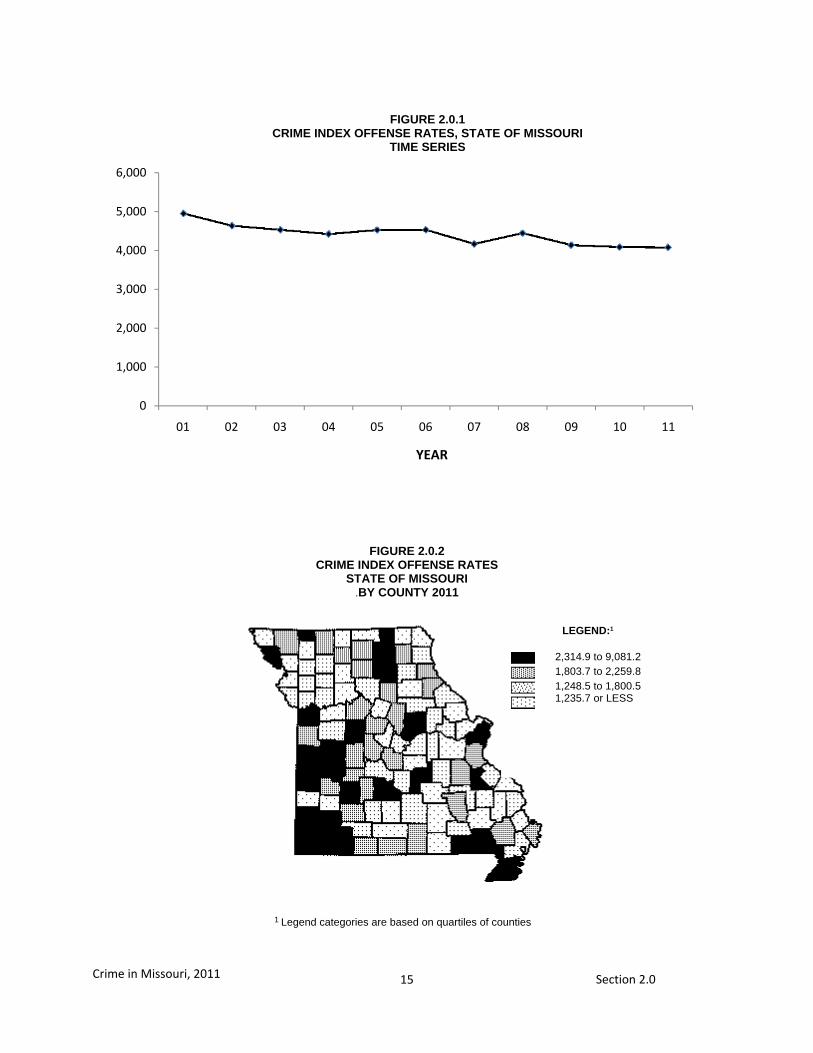
FIGURE 2.0.2 CRIME INDEX OFFENSE RATES
STATE OF MISSOURI .BY COUNTY 2011
0
1,000
2,000
3,000
4,000
5,000
6,000
01 02 03 04 05 06 07 08 09 10 11
1 Legend categories are based on quartiles of counties
2,314.9 to 9,081.2 1,803.7 to 2,259.8 1,248.5 to 1,800.5 1,235.7 or LESS
YEAR
FIGURE 2.0.1CRIME INDEX OFFENSE RATES, STATE OF MISSOURI
TIME SERIES
16
Crime in Missouri, 2011 Section 2.0
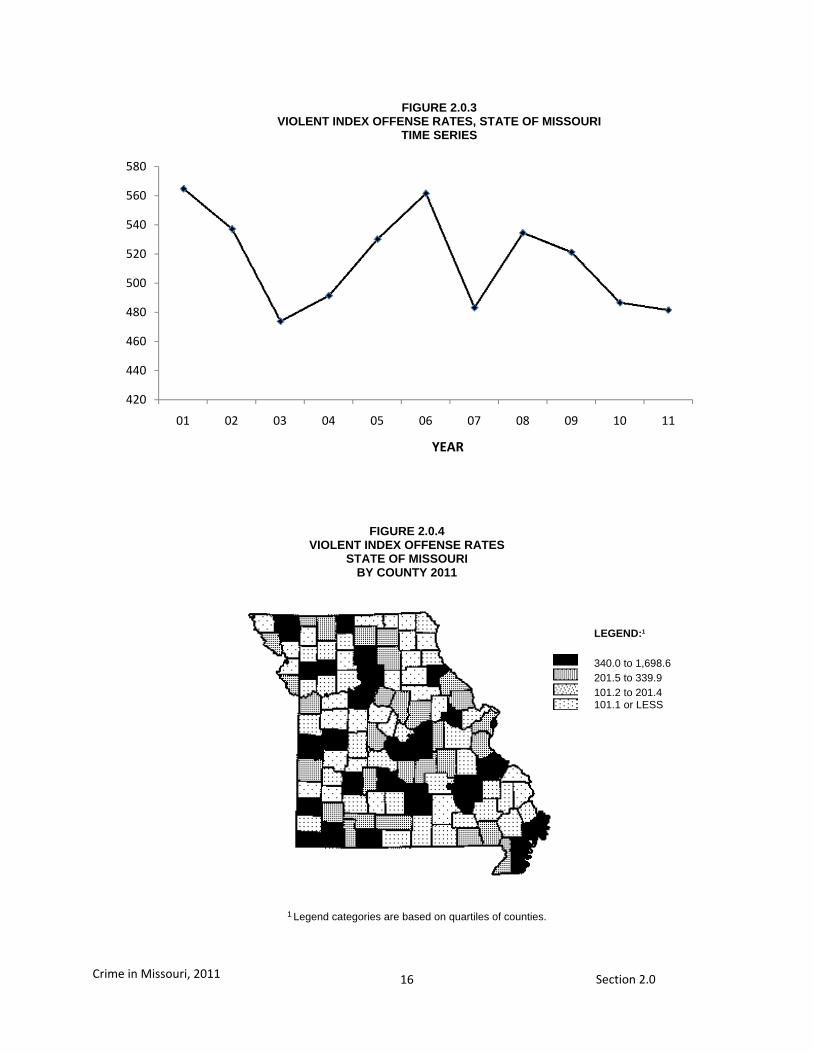
FIGURE 2.0.4 VIOLENT INDEX OFFENSE RATES
STATE OF MISSOURI BY COUNTY 2011
1 Legend categories are based on quartiles of counties.
420
440
460
480
500
520
540
560
580
01 02 03 04 05 06 07 08 09 10 11
LEGEND:1
340.0 to 1,698.6 201.5 to 339.9 101.2 to 201.4 101.1 or LESS
FIGURE 2.0.3VIOLENT INDEX OFFENSE RATES, STATE OF MISSOURI
TIME SERIES
YEAR
17
Crime in Missouri, 2011 Section 2.0
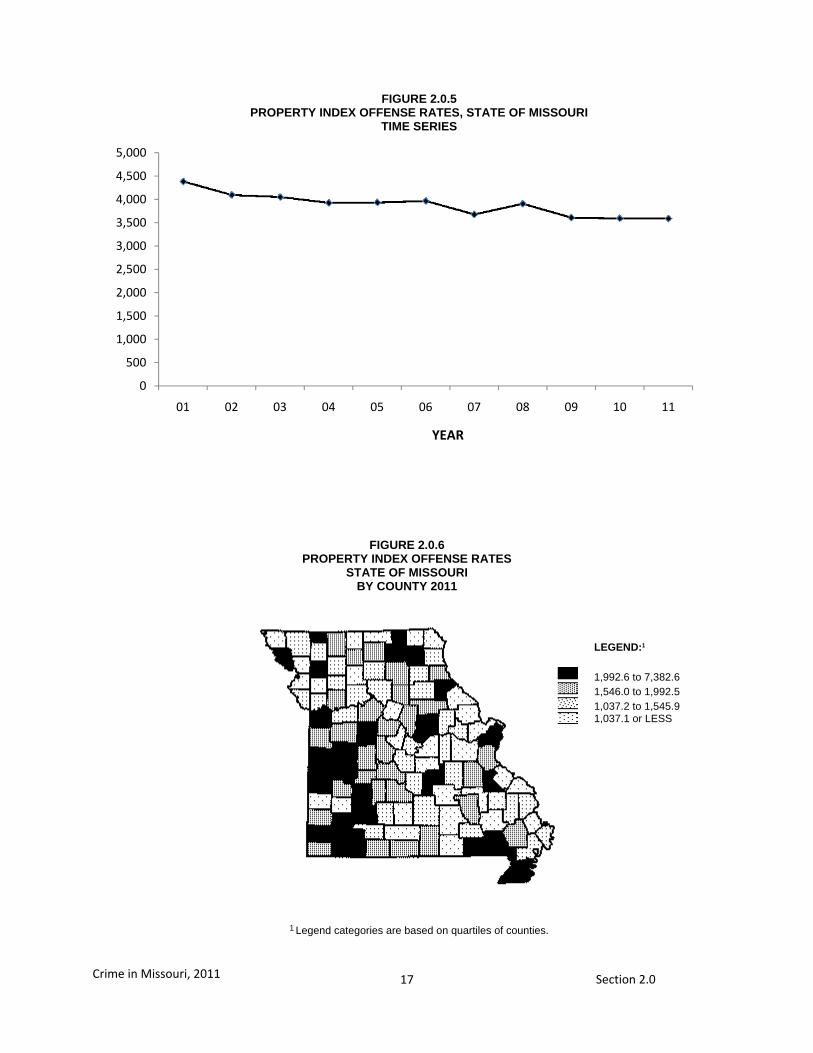
FIGURE 2.0.6 PROPERTY INDEX OFFENSE RATES
STATE OF MISSOURI BY COUNTY 2011
1 Legend categories are based on quartiles of counties.
0
500
1,000
1,500
2,000
2,500
3,000
3,500
4,000
4,500
5,000
01 02 03 04 05 06 07 08 09 10 11
LEGEND:1
1,992.6 to 7,382.6 1,546.0 to 1,992.5 1,037.2 to 1,545.9 1,037.1 or LESS
FIGURE 2.0.5PROPERTY INDEX OFFENSE RATES, STATE OF MISSOURI
TIME SERIES
YEAR

19
Crime in Missouri, 2011 Section 3.0
3.0 MISSOURI ARREST ANALYSIS
A series of tables and figures summarizes Missouri crime index
arrest clearance rates, actual arrest activity associated with
crime index offenses, and arrest activity associated with all
other classes of criminal activity reported to the UCR Program.
The purpose of these displays is to provide an overview of
criminal enforcement activity being performed in the state by
class of crime. In addition, arrest rates are displayed over time
in order to observe trends.

21
Crime in Missouri, 2011 Section 3.0
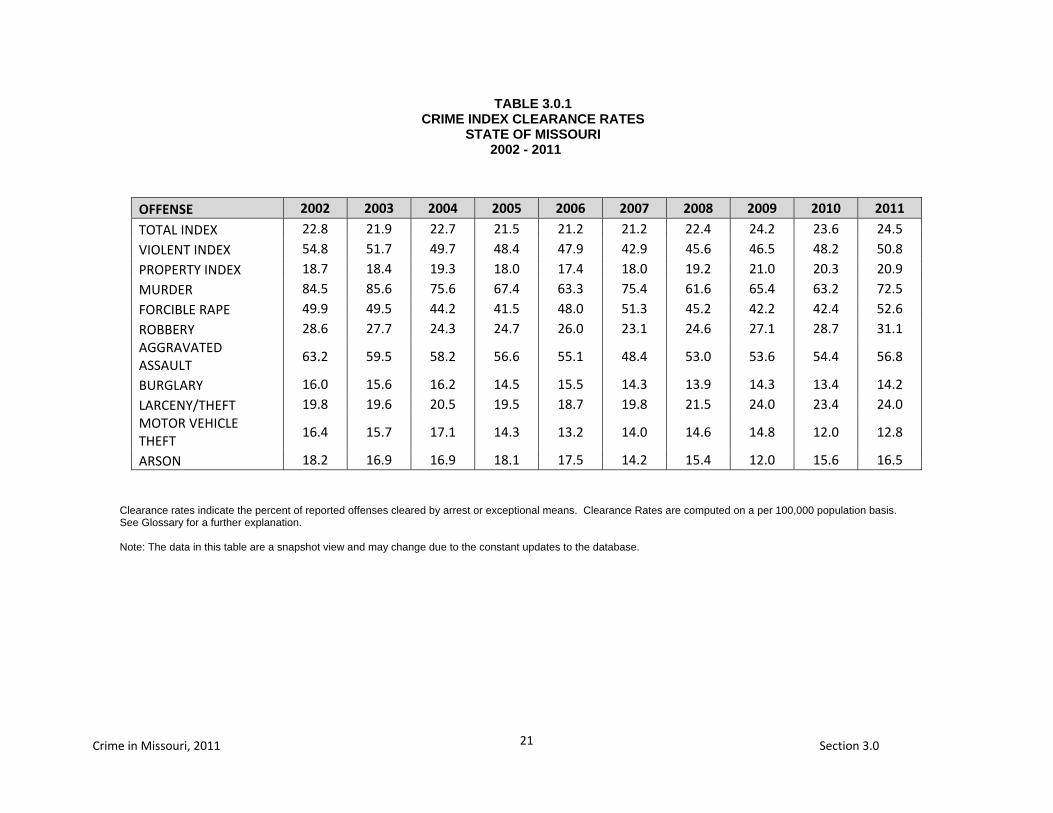
TABLE 3.0.1 CRIME INDEX CLEARANCE RATES
STATE OF MISSOURI 2002 - 2011
Clearance rates indicate the percent of reported offenses cleared by arrest or exceptional means. Clearance Rates are computed on a per 100,000 population basis. See Glossary for a further explanation. Note: The data in this table are a snapshot view and may change due to the constant updates to the database.
OFFENSE 2002 2003 2004 2005 2006 2007 2008 2009 2010 2011
TOTAL INDEX 22.8 21.9 22.7 21.5 21.2 21.2 22.4 24.2 23.6 24.5
VIOLENT INDEX 54.8 51.7 49.7 48.4 47.9 42.9 45.6 46.5 48.2 50.8
PROPERTY INDEX 18.7 18.4 19.3 18.0 17.4 18.0 19.2 21.0 20.3 20.9
MURDER 84.5 85.6 75.6 67.4 63.3 75.4 61.6 65.4 63.2 72.5
FORCIBLE RAPE 49.9 49.5 44.2 41.5 48.0 51.3 45.2 42.2 42.4 52.6
ROBBERY 28.6 27.7 24.3 24.7 26.0 23.1 24.6 27.1 28.7 31.1 AGGRAVATED ASSAULT
63.2 59.5 58.2 56.6 55.1 48.4 53.0 53.6 54.4 56.8
BURGLARY 16.0 15.6 16.2 14.5 15.5 14.3 13.9 14.3 13.4 14.2
LARCENY/THEFT 19.8 19.6 20.5 19.5 18.7 19.8 21.5 24.0 23.4 24.0 MOTOR VEHICLE THEFT
16.4 15.7 17.1 14.3 13.2 14.0 14.6 14.8 12.0 12.8
ARSON 18.2 16.9 16.9 18.1 17.5 14.2 15.4 12.0 15.6 16.5
22
Crime in Missouri, 2011 Section 3.0
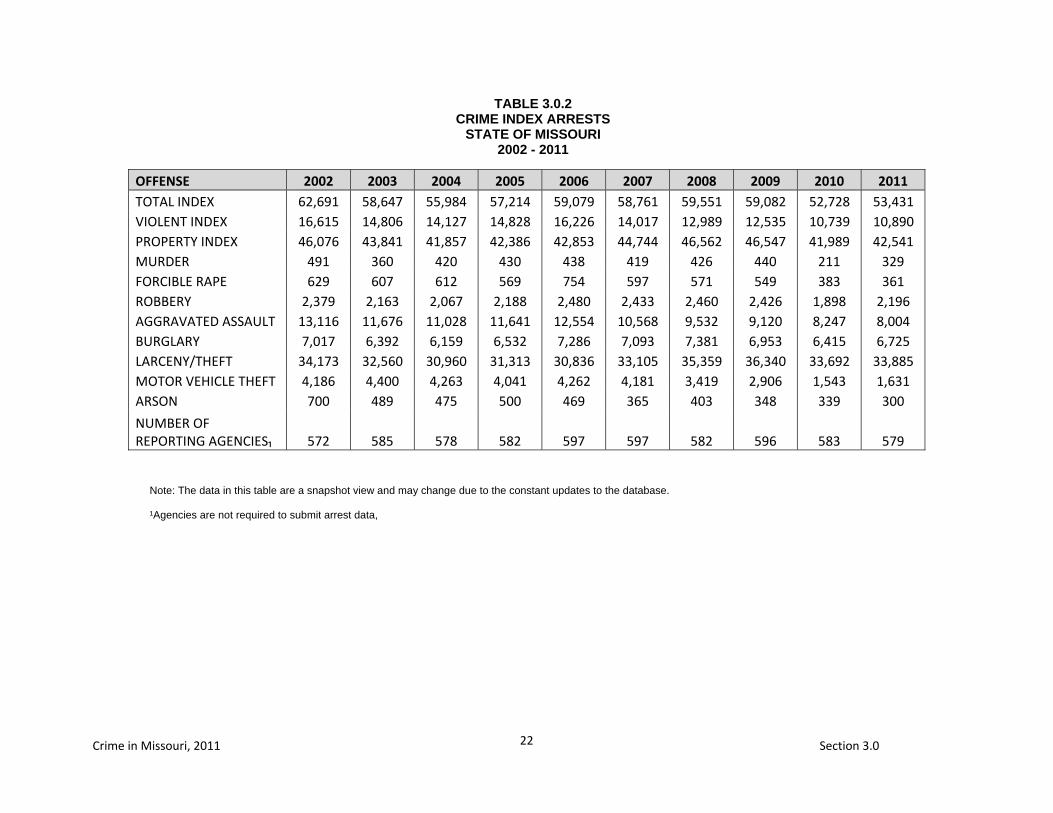
TABLE 3.0.2 CRIME INDEX ARRESTS
STATE OF MISSOURI 2002 - 2011
Note: The data in this table are a snapshot view and may change due to the constant updates to the database. ¹Agencies are not required to submit arrest data,
OFFENSE 2002 2003 2004 2005 2006 2007 2008 2009 2010 2011 TOTAL INDEX 62,691 58,647 55,984 57,214 59,079 58,761 59,551 59,082 52,728 53,431 VIOLENT INDEX 16,615 14,806 14,127 14,828 16,226 14,017 12,989 12,535 10,739 10,890 PROPERTY INDEX 46,076 43,841 41,857 42,386 42,853 44,744 46,562 46,547 41,989 42,541 MURDER 491 360 420 430 438 419 426 440 211 329 FORCIBLE RAPE 629 607 612 569 754 597 571 549 383 361 ROBBERY 2,379 2,163 2,067 2,188 2,480 2,433 2,460 2,426 1,898 2,196 AGGRAVATED ASSAULT 13,116 11,676 11,028 11,641 12,554 10,568 9,532 9,120 8,247 8,004 BURGLARY 7,017 6,392 6,159 6,532 7,286 7,093 7,381 6,953 6,415 6,725 LARCENY/THEFT 34,173 32,560 30,960 31,313 30,836 33,105 35,359 36,340 33,692 33,885 MOTOR VEHICLE THEFT 4,186 4,400 4,263 4,041 4,262 4,181 3,419 2,906 1,543 1,631 ARSON 700 489 475 500 469 365 403 348 339 300
NUMBER OF REPORTING AGENCIES₁ 572 585 578 582 597 597 582 596 583 579
23
Crime in Missouri, 2011 Section 3.0
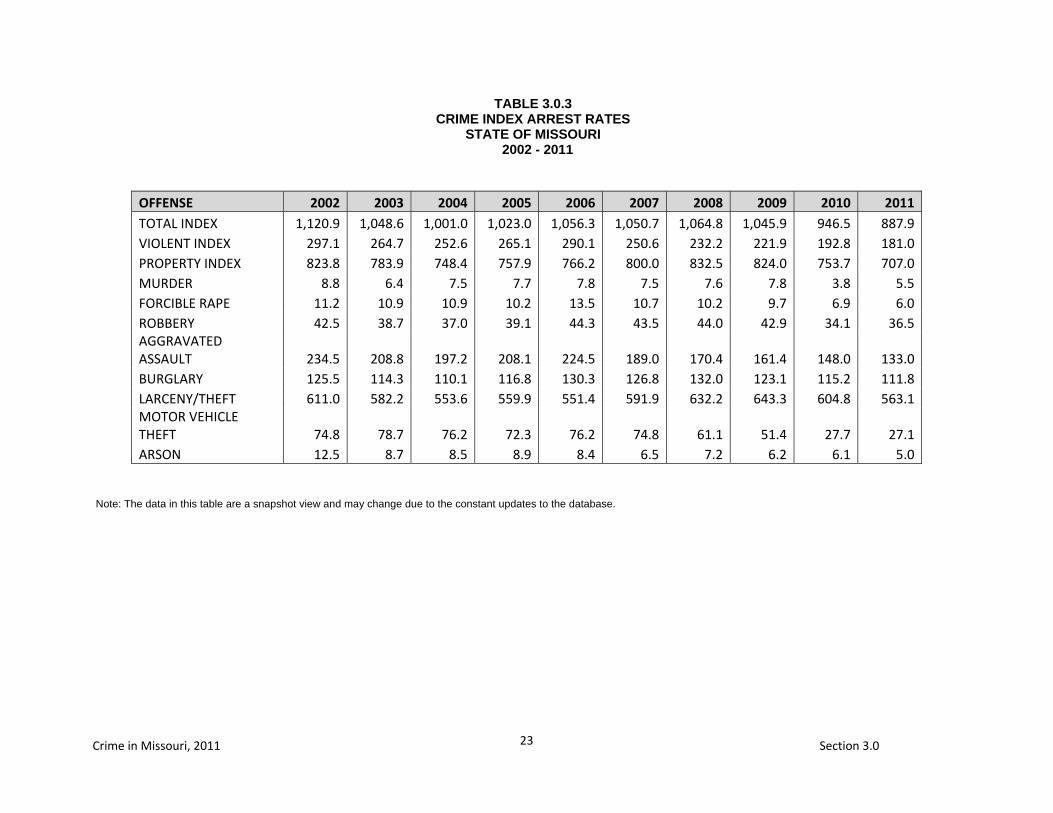
TABLE 3.0.3 CRIME INDEX ARREST RATES
STATE OF MISSOURI
2002 - 2011
OFFENSE 2002 2003 2004 2005 2006 2007 2008 2009 2010 2011TOTAL INDEX 1,120.9 1,048.6 1,001.0 1,023.0 1,056.3 1,050.7 1,064.8 1,045.9 946.5 887.9VIOLENT INDEX 297.1 264.7 252.6 265.1 290.1 250.6 232.2 221.9 192.8 181.0PROPERTY INDEX 823.8 783.9 748.4 757.9 766.2 800.0 832.5 824.0 753.7 707.0MURDER 8.8 6.4 7.5 7.7 7.8 7.5 7.6 7.8 3.8 5.5FORCIBLE RAPE 11.2 10.9 10.9 10.2 13.5 10.7 10.2 9.7 6.9 6.0ROBBERY 42.5 38.7 37.0 39.1 44.3 43.5 44.0 42.9 34.1 36.5AGGRAVATED ASSAULT 234.5 208.8 197.2 208.1 224.5 189.0 170.4 161.4 148.0 133.0BURGLARY 125.5 114.3 110.1 116.8 130.3 126.8 132.0 123.1 115.2 111.8LARCENY/THEFT 611.0 582.2 553.6 559.9 551.4 591.9 632.2 643.3 604.8 563.1MOTOR VEHICLE THEFT 74.8 78.7 76.2 72.3 76.2 74.8 61.1 51.4 27.7 27.1ARSON 12.5 8.7 8.5 8.9 8.4 6.5 7.2 6.2 6.1 5.0
Note: The data in this table are a snapshot view and may change due to the constant updates to the database.
24
Crime in Missouri, 2011 Section 3.0
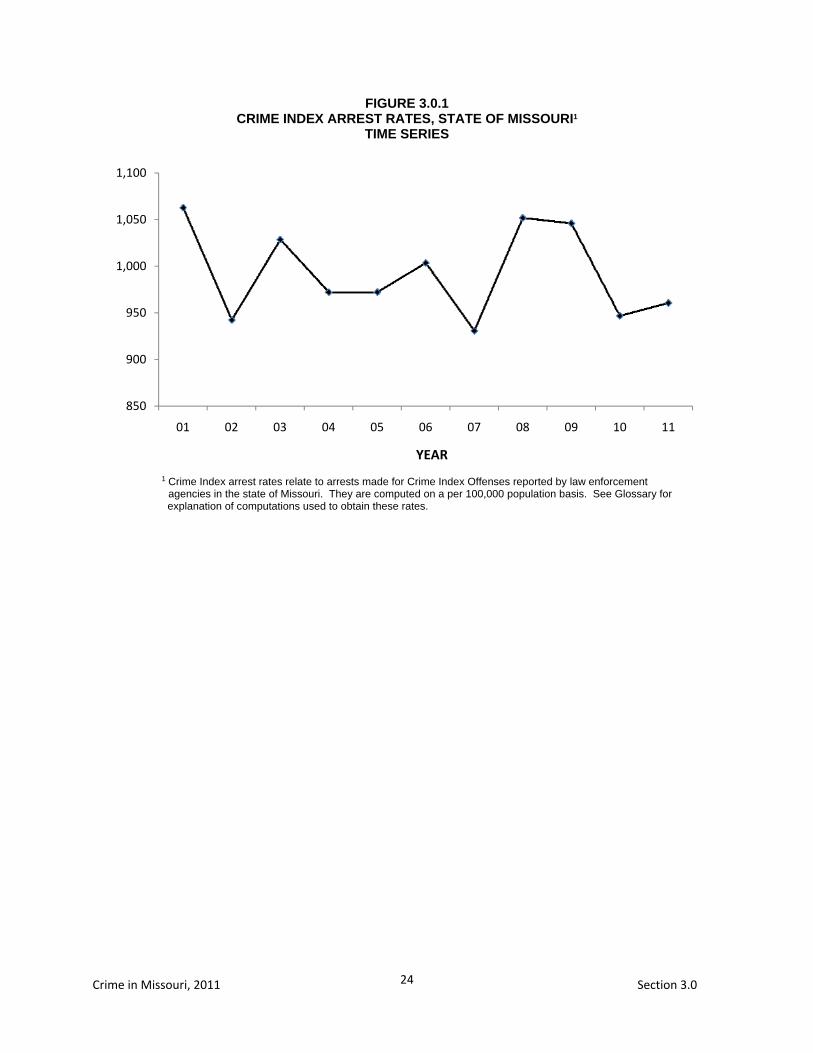
FIGURE 3.0.1 CRIME INDEX ARREST RATES, STATE OF MISSOURI1
TIME SERIES
1 Crime Index arrest rates relate to arrests made for Crime Index Offenses reported by law enforcement agencies in the state of Missouri. They are computed on a per 100,000 population basis. See Glossary for explanation of computations used to obtain these rates.
850
900
950
1,000
1,050
1,100
01 02 03 04 05 06 07 08 09 10 11
YEAR
25
Crime in Missouri, 2011 Section 3.0
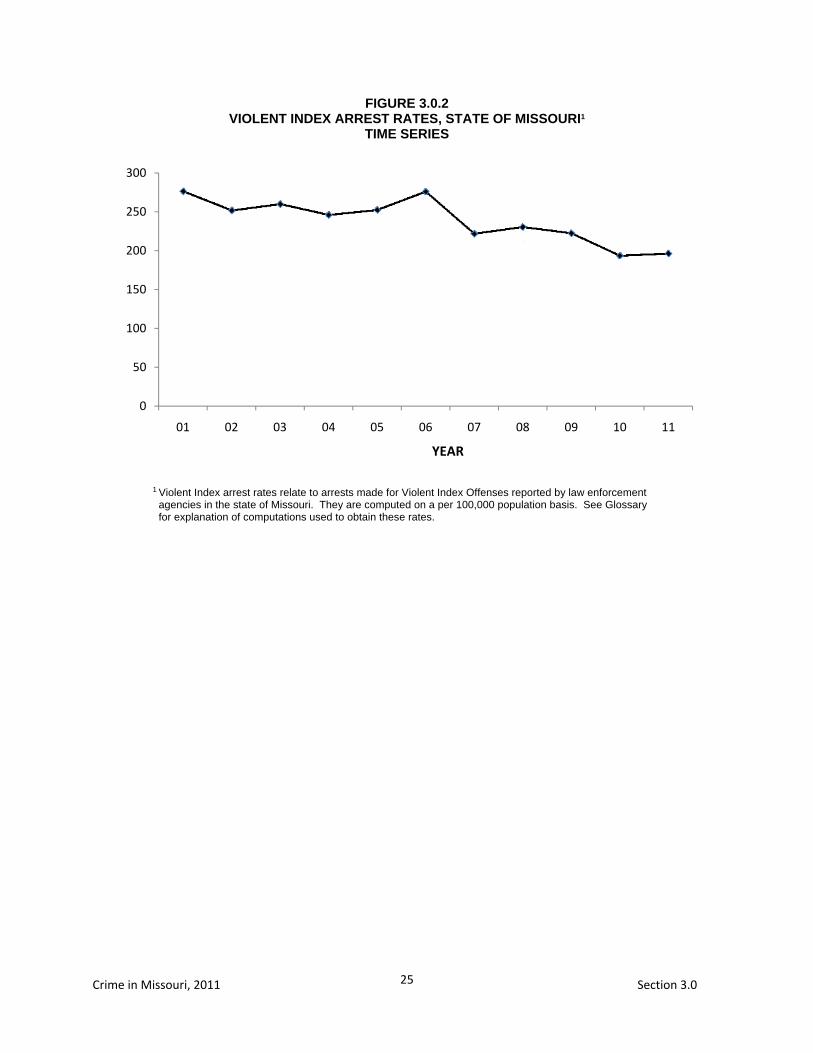
FIGURE 3.0.2 VIOLENT INDEX ARREST RATES, STATE OF MISSOURI1
TIME SERIES
1 Violent Index arrest rates relate to arrests made for Violent Index Offenses reported by law enforcement agencies in the state of Missouri. They are computed on a per 100,000 population basis. See Glossary for explanation of computations used to obtain these rates.
0
50
100
150
200
250
300
01 02 03 04 05 06 07 08 09 10 11
YEAR
26
Crime in Missouri, 2011 Section 3.0
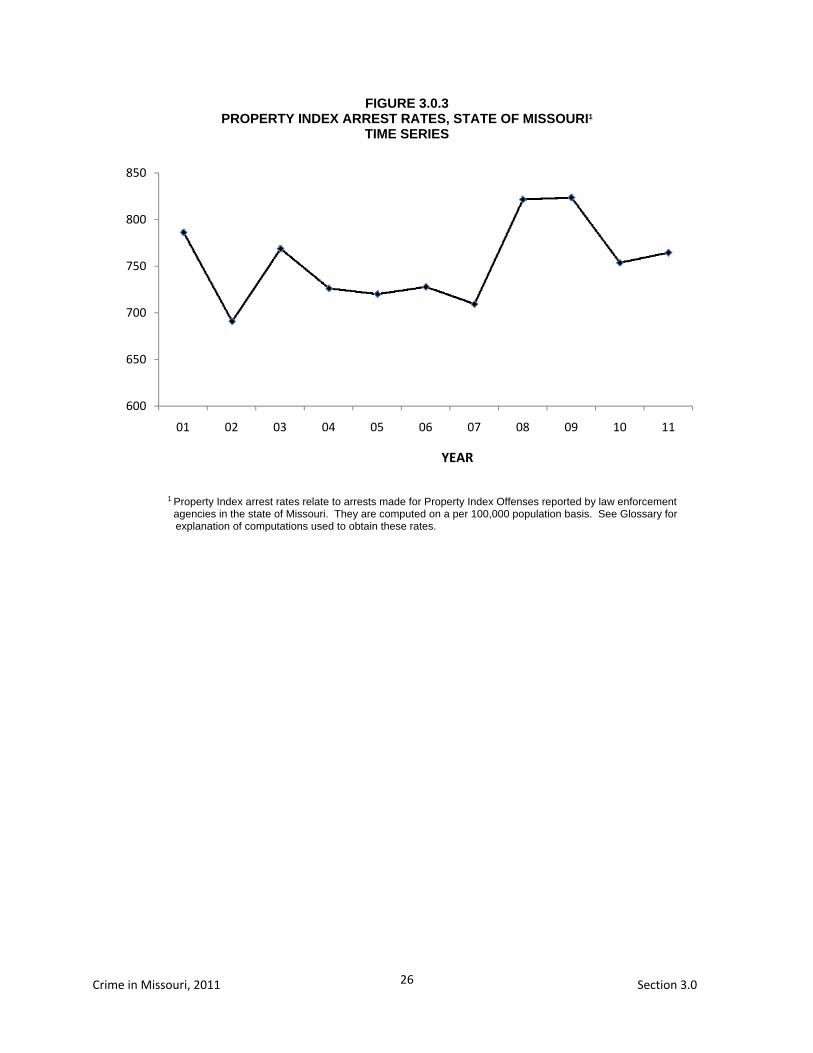
FIGURE 3.0.3 PROPERTY INDEX ARREST RATES, STATE OF MISSOURI1
TIME SERIES
1 Property Index arrest rates relate to arrests made for Property Index Offenses reported by law enforcement agencies in the state of Missouri. They are computed on a per 100,000 population basis. See Glossary for explanation of computations used to obtain these rates.
600
650
700
750
800
850
01 02 03 04 05 06 07 08 09 10 11
YEAR
27 Crime in Missouri, 2011 Section 4.0
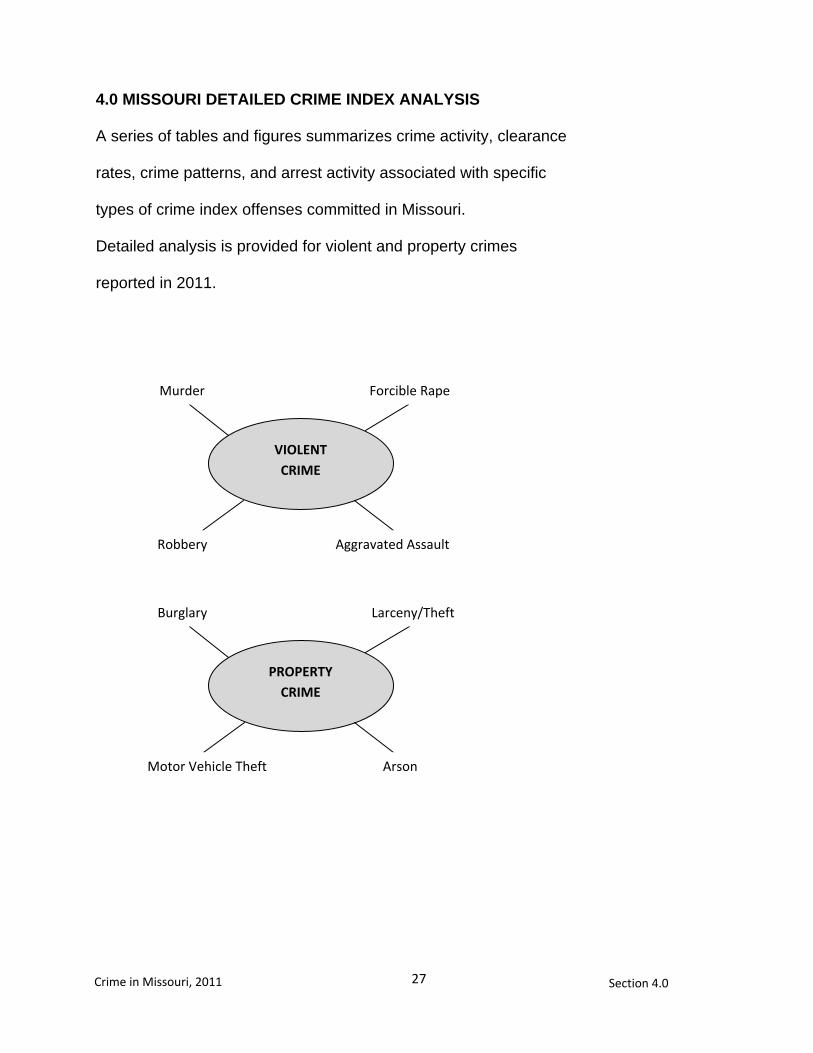
4.0 MISSOURI DETAILED CRIME INDEX ANALYSIS
A series of tables and figures summarizes crime activity, clearance
rates, crime patterns, and arrest activity associated with specific
types of crime index offenses committed in Missouri.
Detailed analysis is provided for violent and property crimes
reported in 2011.
Murder Forcible Rape
Robbery Aggravated Assault
VIOLENT CRIME
Burglary Larceny/Theft
Motor Vehicle Theft Arson
PROPERTY CRIME

29
Crime in Missouri, 2011 Section 4.1
4.1 MURDER
DEFINITION
Murder and non-negligent manslaughter are the willful killing
of one human being by another. Not included in this offense
classification are deaths caused by negligence, suicide,
accident, justifiable homicide (the killing of a felon by a
peace officer in the line of duty or a private citizen during the
commission of a felony), and attempts to murder (these are
classified as aggravated assaults). Murder offenses are
reported on a per victim basis.
2011 Summary
385 murders were reported in 2011.
One murder occurred
every 22.8 hours.
Murder accounted for 0.2 percent of the Total Crime Index and 1.4 percent of all Violent Index offenses.
The murder rate per
100,000 population was 6.4.
72.5 percent of every
100 murders were cleared by arrest or exceptional means.
329 persons were
reported arrested for murder in 2011. Of these, 92.4 percent were adults and 7.6 percent were juveniles. Of those arrested, 86.9 percent were male and 13.1 percent were female.
Of all murder victims
reported in 2011, 78.6 percent were male and 21.2 percent were female. Of the victims, 87.7 percent were adults and 10.1 percent were juveniles.
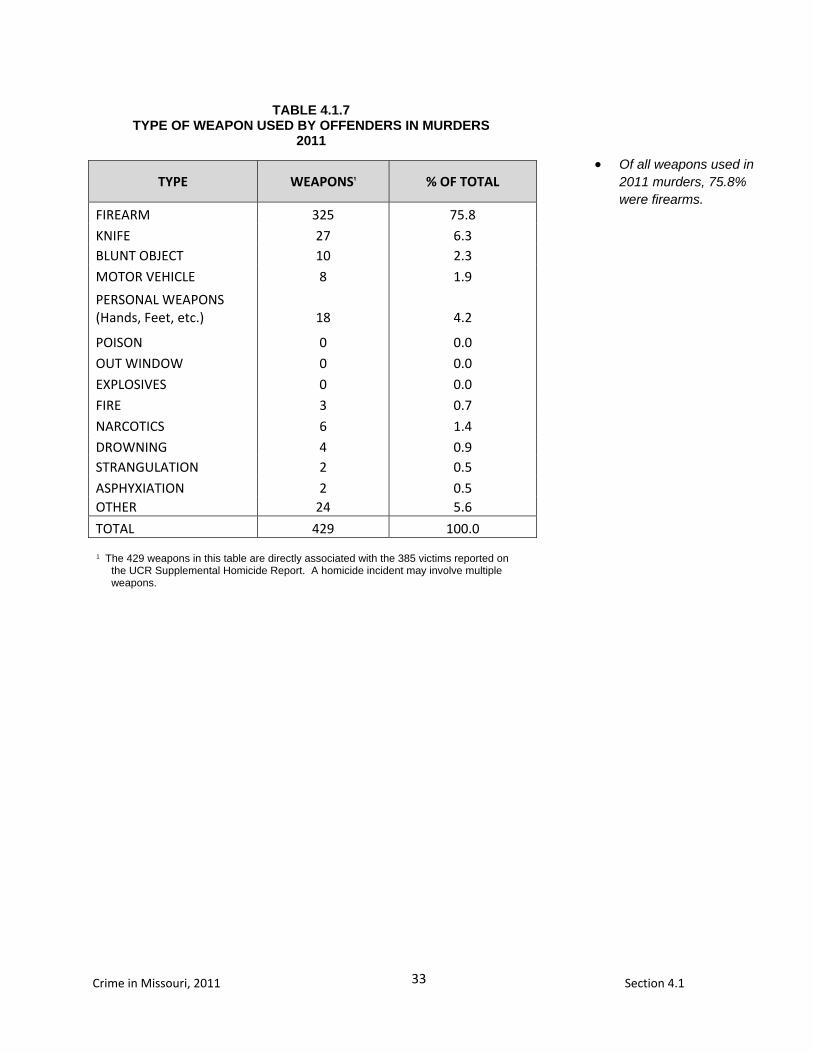
Of all weapons used in
2011 murders, 75.8 percent were firearms and 6.3 percent were knives.
30
Crime in Missouri, 2011 Section 4.1
MURDER SUMMARY: 2010 and 2011
TABLE 4.1.1 MURDER RATES BY POPULATION GROUP
2011
POPULATION GROUP OFFENSES % OF
TOTAL
RATE PER 100,000
POPULATION
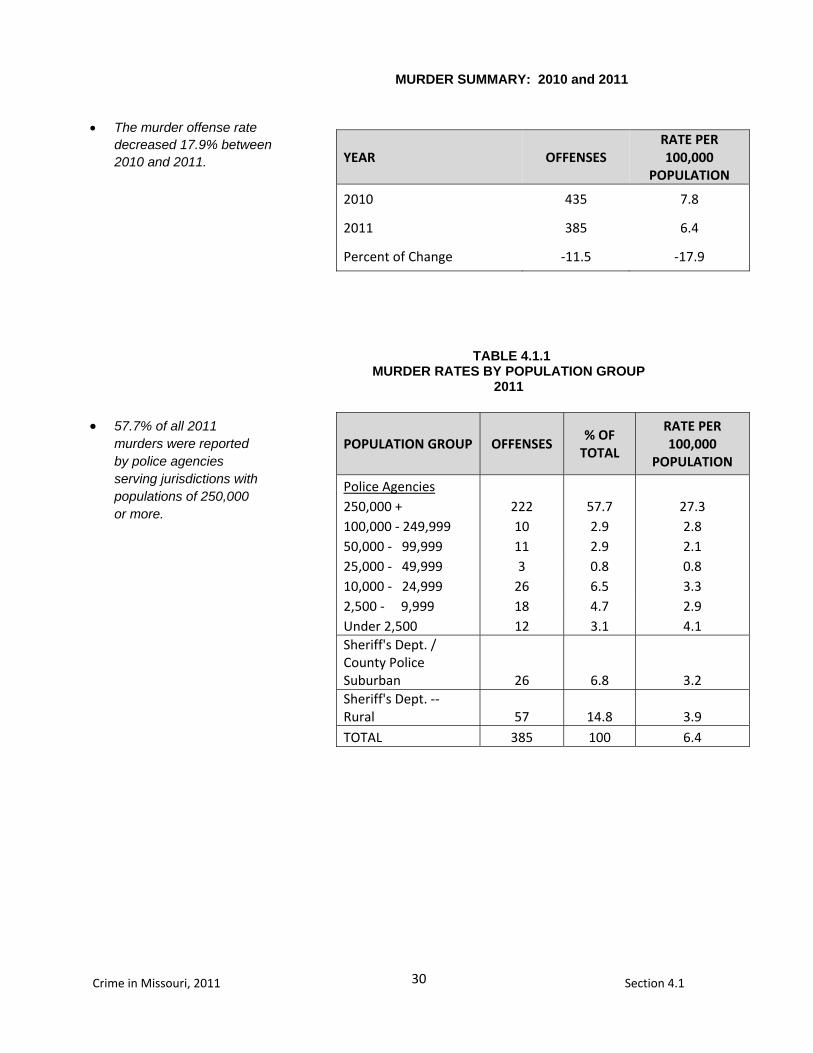
Police Agencies 250,000 + 222 57.7 27.3 100,000 - 249,999 10 2.9 2.8 50,000 - 99,999 11 2.9 2.1 25,000 - 49,999 3 0.8 0.8 10,000 - 24,999 26 6.5 3.3 2,500 - 9,999 18 4.7 2.9 Under 2,500 12 3.1 4.1 Sheriff's Dept. / County Police Suburban 26 6.8 3.2 Sheriff's Dept. -- Rural 57 14.8 3.9 TOTAL 385 100 6.4
YEAR OFFENSES RATE PER 100,000
POPULATION
2010 435 7.8
2011 385 6.4
Percent of Change -11.5 -17.9
The murder offense rate decreased 17.9% between 2010 and 2011.
57.7% of all 2011 murders were reported by police agencies serving jurisdictions with populations of 250,000 or more.
31
Crime in Missouri, 2011 Section 4.1
YEAR PERCENT CLEARED % OF CLEARED OFFENSES
ONLY JUVENILES
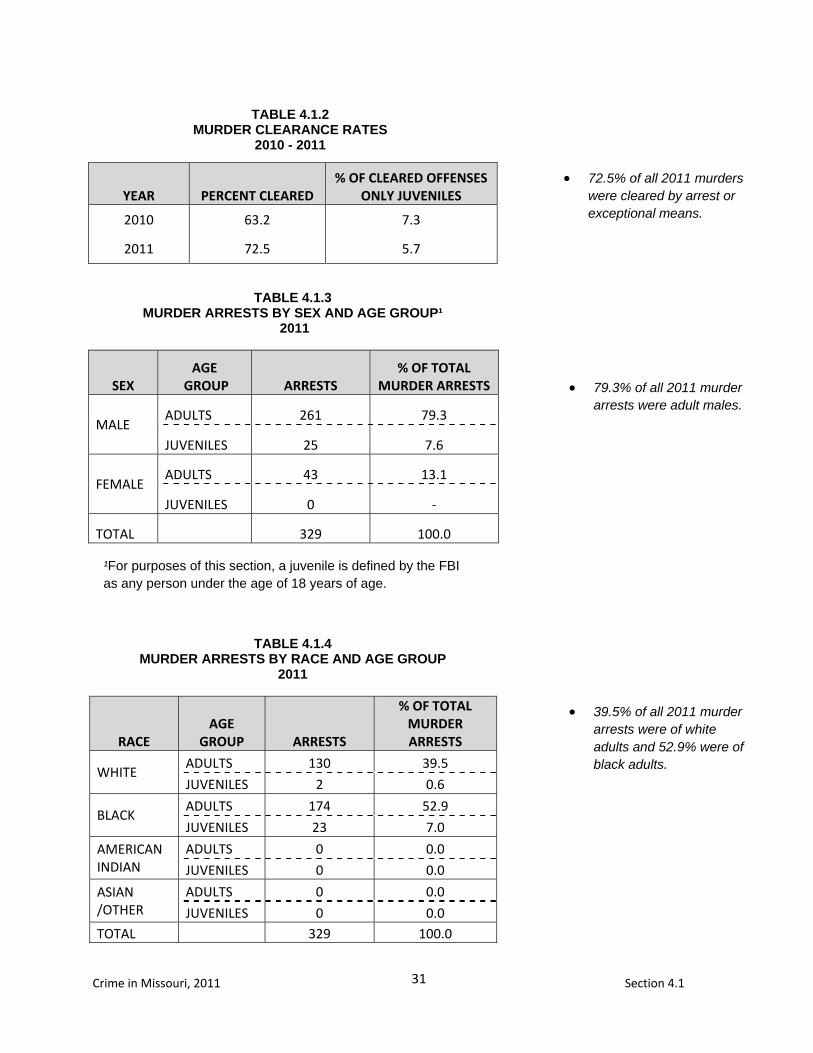
2010 63.2 7.3
2011 72.5 5.7
SEX AGE
GROUP ARRESTS % OF TOTAL
MURDER ARRESTS
MALE ADULTS 261 79.3
JUVENILES 25 7.6
FEMALE ADULTS 43 13.1
JUVENILES 0 -
TOTAL 329 100.0
RACE AGE
GROUP ARRESTS
% OF TOTAL MURDER ARRESTS
WHITE ADULTS 130 39.5
JUVENILES 2 0.6
BLACK ADULTS 174 52.9
JUVENILES 23 7.0
AMERICAN INDIAN
ADULTS 0 0.0
JUVENILES 0 0.0
ASIAN /OTHER
ADULTS 0 0.0
JUVENILES 0 0.0 TOTAL 329 100.0
TABLE 4.1.2
MURDER CLEARANCE RATES 2010 - 2011
TABLE 4.1.3 MURDER ARRESTS BY SEX AND AGE GROUP¹
2011
TABLE 4.1.4 MURDER ARRESTS BY RACE AND AGE GROUP
2011
72.5% of all 2011 murders were cleared by arrest or exceptional means.
79.3% of all 2011 murder arrests were adult males.
39.5% of all 2011 murder arrests were of white adults and 52.9% were of black adults.
¹For purposes of this section, a juvenile is defined by the FBI as any person under the age of 18 years of age.
32
Crime in Missouri, 2011 Section 4.1
SEX AGE
GROUP VICTIMS % OF TOTAL
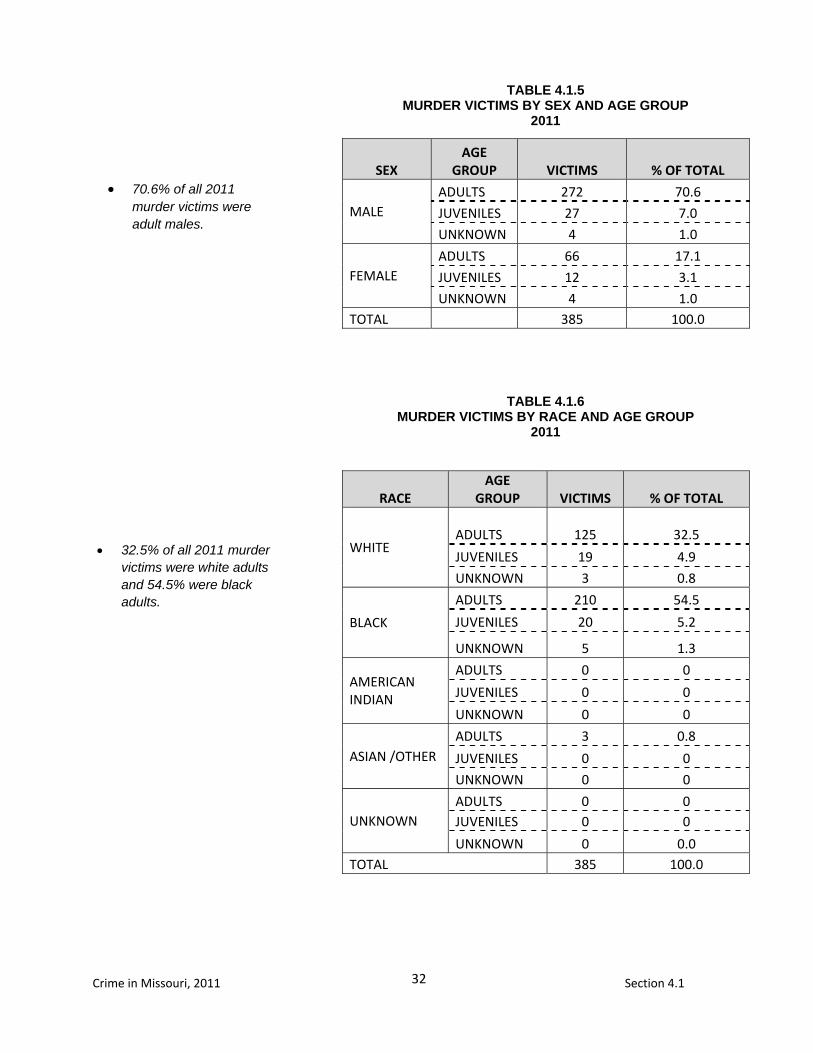
MALE ADULTS 272 70.6
JUVENILES 27 7.0
UNKNOWN 4 1.0
FEMALE ADULTS 66 17.1
JUVENILES 12 3.1
UNKNOWN 4 1.0 TOTAL 385 100.0
RACE AGE
GROUP VICTIMS % OF TOTAL
WHITE ADULTS 125
32.5
JUVENILES 19 4.9
UNKNOWN 3 0.8
BLACK
ADULTS 210 54.5
JUVENILES 20 5.2
UNKNOWN 5 1.3
AMERICAN INDIAN
ADULTS 0 0
JUVENILES 0 0
UNKNOWN 0 0
ASIAN /OTHER ADULTS 3 0.8
JUVENILES 0 0
UNKNOWN 0 0
UNKNOWN ADULTS 0 0 JUVENILES 0 0
UNKNOWN 0 0.0 TOTAL 385 100.0
70.6% of all 2011 murder victims were adult males.
TABLE 4.1.5 MURDER VICTIMS BY SEX AND AGE GROUP
2011
TABLE 4.1.6 MURDER VICTIMS BY RACE AND AGE GROUP
2011
32.5% of all 2011 murder victims were white adults and 54.5% were black adults.
33
Crime in Missouri, 2011 Section 4.1
TYPE WEAPONS₁ % OF TOTAL
FIREARM 325 75.8 KNIFE 27 6.3 BLUNT OBJECT 10 2.3
MOTOR VEHICLE 8 1.9
PERSONAL WEAPONS (Hands, Feet, etc.) 18 4.2
POISON 0 0.0 OUT WINDOW 0 0.0
EXPLOSIVES 0 0.0 FIRE 3 0.7
NARCOTICS 6 1.4 DROWNING 4 0.9 STRANGULATION 2 0.5
ASPHYXIATION 2 0.5 OTHER 24 5.6
TOTAL 429 100.0
TABLE 4.1.7 TYPE OF WEAPON USED BY OFFENDERS IN MURDERS
2011
1 The 429 weapons in this table are directly associated with the 385 victims reported on the UCR Supplemental Homicide Report. A homicide incident may involve multiple weapons.
Of all weapons used in 2011 murders, 75.8% were firearms.
34
Crime in Missouri, 2011 Section 4.1
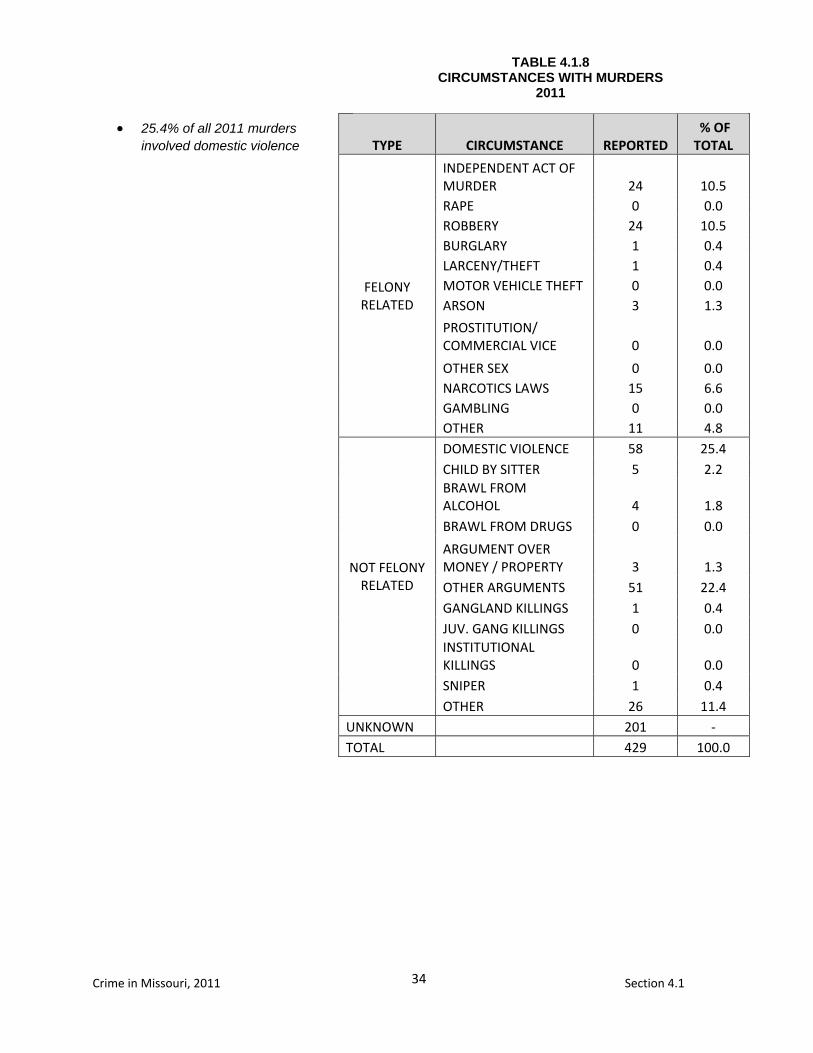
TYPE CIRCUMSTANCE REPORTED % OF TOTAL
FELONY RELATED
INDEPENDENT ACT OF MURDER 24 10.5 RAPE 0 0.0 ROBBERY 24 10.5 BURGLARY 1 0.4 LARCENY/THEFT 1 0.4 MOTOR VEHICLE THEFT 0 0.0 ARSON 3 1.3
PROSTITUTION/ COMMERCIAL VICE 0 0.0
OTHER SEX 0 0.0 NARCOTICS LAWS 15 6.6 GAMBLING 0 0.0 OTHER 11 4.8
NOT FELONY RELATED
DOMESTIC VIOLENCE 58 25.4 CHILD BY SITTER 5 2.2 BRAWL FROM ALCOHOL 4 1.8 BRAWL FROM DRUGS 0 0.0
ARGUMENT OVER MONEY / PROPERTY 3 1.3 OTHER ARGUMENTS 51 22.4 GANGLAND KILLINGS 1 0.4 JUV. GANG KILLINGS 0 0.0 INSTITUTIONAL KILLINGS 0 0.0 SNIPER 1 0.4 OTHER 26 11.4
UNKNOWN 201 - TOTAL 429 100.0
TABLE 4.1.8 CIRCUMSTANCES WITH MURDERS
2011
25.4% of all 2011 murders involved domestic violence
35
Crime in Missouri, 2011 Section 4.1
0
1
2
3
4
5
6
7
8
9
01 02 03 04 05 06 07 08 09 10 11
FIGURE 4.1.1 MURDER OFFENSE RATES, STATE OF MISSOURI
TIME SERIES
YEAR

37
Crime in Missouri, 2011 Section 4.2
4.2 FORCIBLE RAPE
DEFINITION
Forcible rape is the carnal knowledge of a female forcibly
and against her will. Assaults or attempts to commit rape by
force or threat of force are also included. However, statutory
rape (without force), sex attacks on males, and other types
of sex offenses are not included in this category. Forcible
rape offenses are reported on a per victim basis.
2011 Summary
1,457 rapes were reported in 2011.
One rape occurred every 6.0 hours.
Rape accounted for 0.6
percent of the Total Crime Index and 5.4 percent of all Violent Index offenses.
The rape rate per 100,000
population was 24.2.
Rape by force constituted 91.9 percent of all rapes while attempted rape accounted for 8.1 percent.
In 2011, 52.6 percent of
every 100 rapes were cleared by arrest or exceptional means.
360 persons were reported
arrested for rape. Of those, 87.6 percent were adults.
38
Crime in Missouri, 2011 Section 4.2
YEAR OFFENSES RATE PER 100,000
POPULATION
2010 1,417 25.4
2011 1,457 24.2
Percent of Change 3.0 -4.7
POPULATION GROUP OFFENSES % OF
TOTAL
RATE PER 100,000
POPULATION
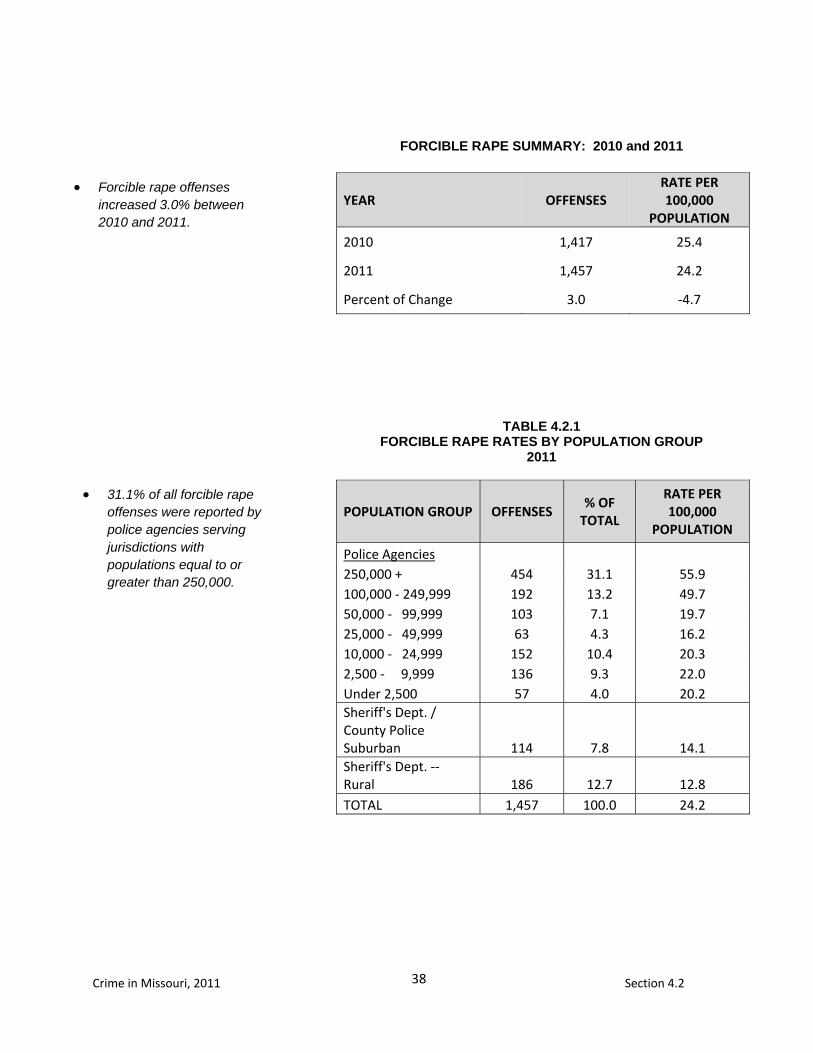
Police Agencies 250,000 + 454 31.1 55.9 100,000 - 249,999 192 13.2 49.7 50,000 - 99,999 103 7.1 19.7 25,000 - 49,999 63 4.3 16.2 10,000 - 24,999 152 10.4 20.3 2,500 - 9,999 136 9.3 22.0 Under 2,500 57 4.0 20.2 Sheriff's Dept. / County Police Suburban 114 7.8 14.1 Sheriff's Dept. -- Rural 186 12.7 12.8 TOTAL 1,457 100.0 24.2
FORCIBLE RAPE SUMMARY: 2010 and 2011
TABLE 4.2.1 FORCIBLE RAPE RATES BY POPULATION GROUP
2011
Forcible rape offenses increased 3.0% between 2010 and 2011.
31.1% of all forcible rape offenses were reported by police agencies serving jurisdictions with populations equal to or greater than 250,000.
39
Crime in Missouri, 2011 Section 4.2
TYPE OFFENSES % OF TOTAL
FORCIBLE RAPE 1,340 91.9
ATTEMPTED RAPE 117 8.1
TOTAL 1,457 100.0
YEAR PERCENT CLEARED % OF CLEARED
OFFENSES ONLY JUVENILES
2010 42.4 13.1
2011 52.6 11.2
SEX AGE GROUP ARRESTS
RAPE ARRESTS
MALE ADULTS 315 87.5
JUVENILES 45 12.5
FEMALE ADULTS 0 0.0
JUVENILES 0 0.0
TOTAL 360 100.0
TABLE 4.2.2 ACTUAL / ATTEMPTED RAPE OFFENSES
2011
TABLE 4.2.3 FORCIBLE RAPE CLEARANCE RATES
2010 - 2011
TABLE 4.2.4 FORCIBLE RAPE ARRESTS BY SEX AND AGE GROUP¹
2011
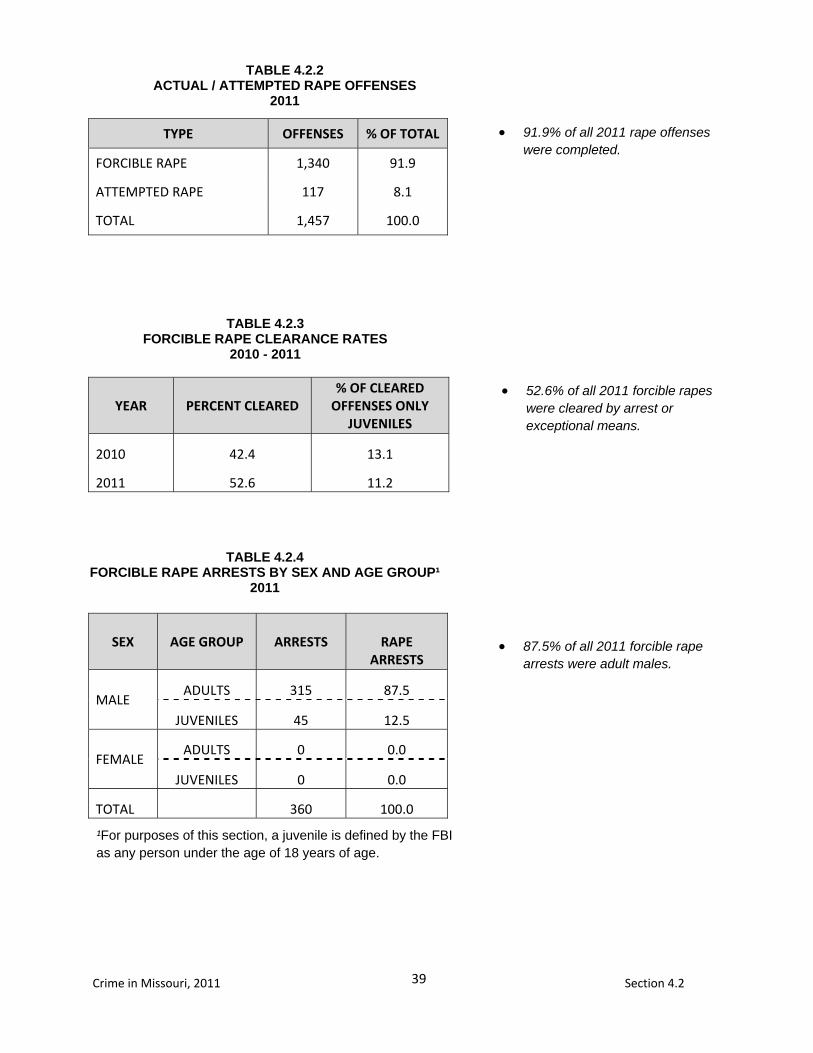
91.9% of all 2011 rape offenses were completed.
87.5% of all 2011 forcible rape arrests were adult males.
52.6% of all 2011 forcible rapes were cleared by arrest or exceptional means.
¹For purposes of this section, a juvenile is defined by the FBI as any person under the age of 18 years of age.
40
Crime in Missouri, 2011 Section 4.2
0
5
10
15
20
25
30
35
01 02 03 04 05 06 07 08 09 10 11
RACE AGE
GROUP ARRESTS
% OF TOTAL RAPE ARRESTS
WHITE ADULTS 173 48.1
JUVENILES 20 5.6
BLACK ADULTS 139 38.6
JUVENILES 25 6.9
AMERICAN INDIAN
ADULTS 1 0.3
JUVENILES 0 0.0
ASIAN /OTHER
ADULTS 2 0.6
JUVENILES 0 0.0 TOTAL 360 100.0
TABLE 4.2.5 FORCIBLE RAPE ARRESTS BY RACE AND AGE GROUP
2011
FIGURE 4.2.1 RAPE OFFENSE RATES, STATE OF MISSOURI
TIME SERIES
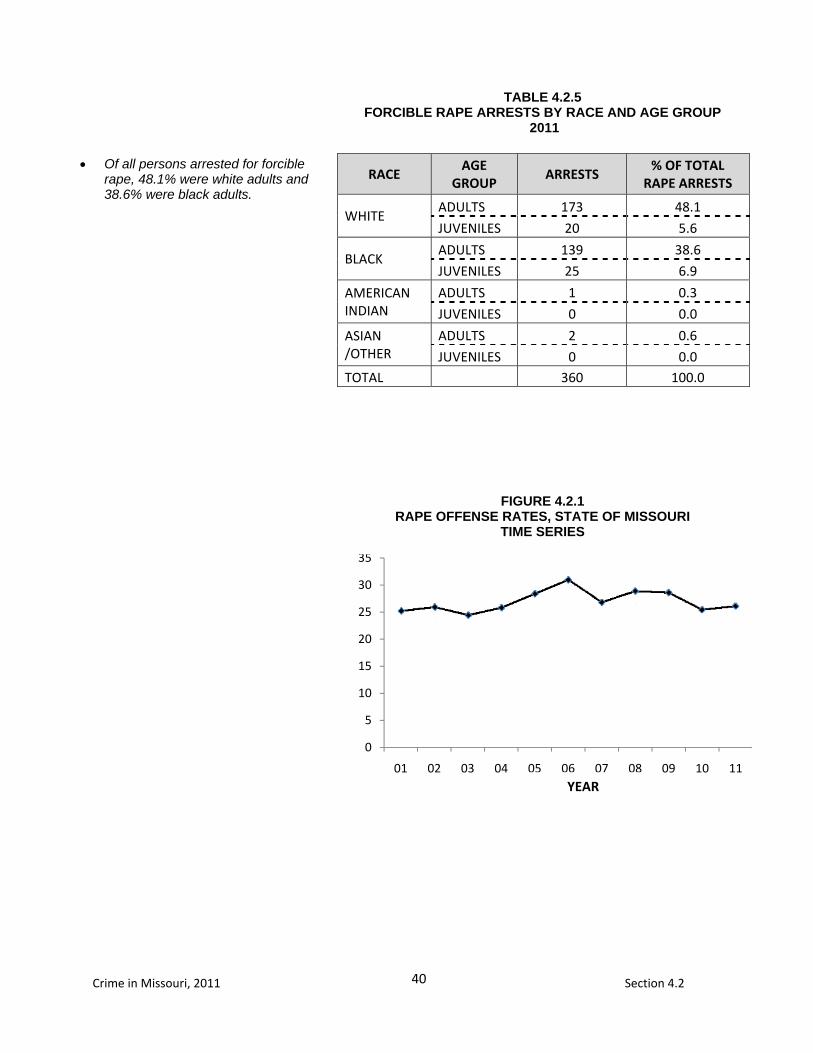
Of all persons arrested for forcible rape, 48.1% were white adults and 38.6% were black adults.
YEAR
41
Crime in Missouri, 2011 Section 4.3
4.3 ROBBERY
DEFINITION
Robbery is the taking or attempting to take anything of value
from the care, custody, or control of a person or persons by
force or threat of force or violence and/or by putting the
victim in fear. Robbery involves a theft / larceny but is
aggravated by the element of force or threat of force.
Robbery offenses are reported on an incident-by-incident
basis.
2011 Summary
6,258 robberies were
reported in 2011.
One robbery occurred every 1.4 hours.
Robbery accounted for 2.8
percent of the Total Crime Index and 23.3 percent of all Violent Index offenses.
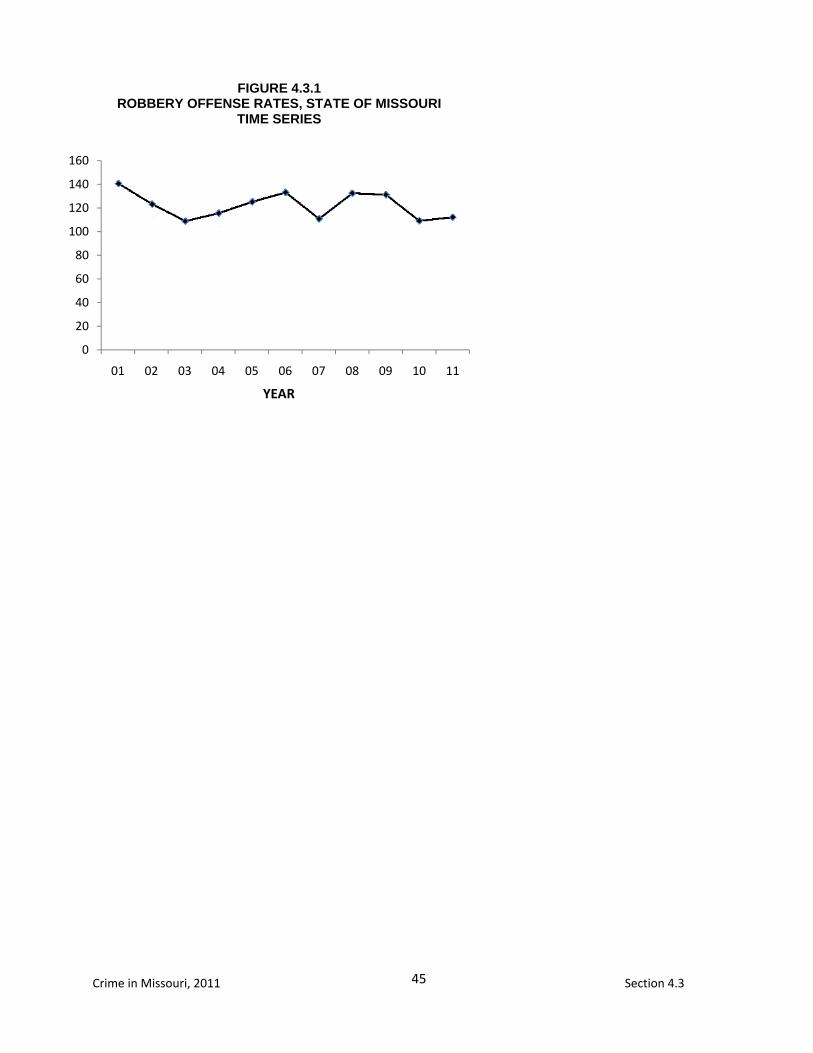
The robbery rate per 100,000
population was 103.7.
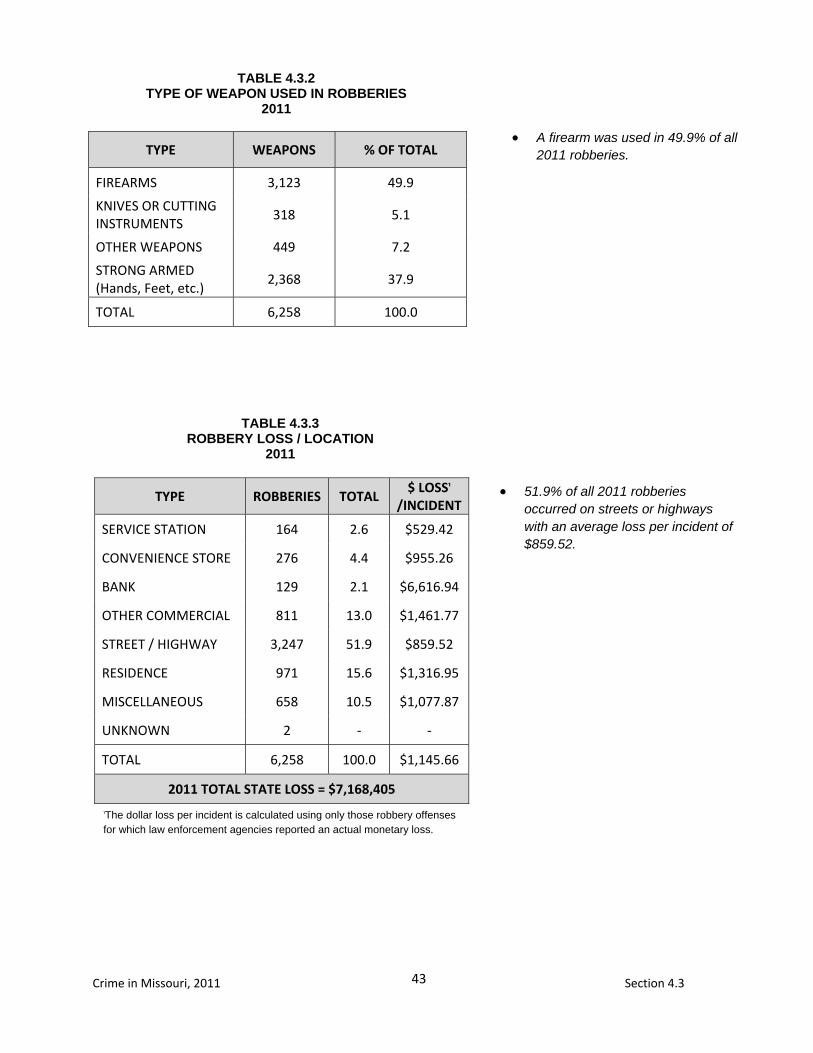
A firearm was used in 49.9 percent of all robberies.
Street / Highway robbery
was the most prevalent class of robbery accounting for 51.9 percent of all such offenses.
$7,168,405 in property / cash
was stolen in robberies.
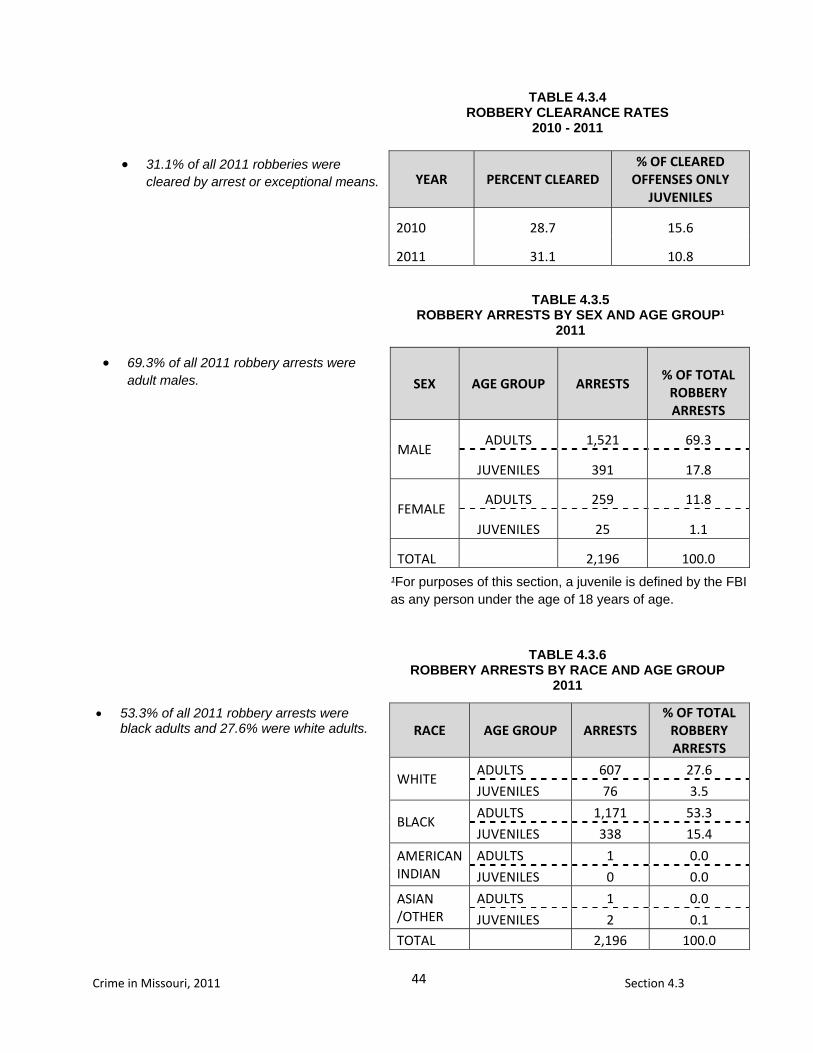
31.1 percent of every 100 robberies were cleared by arrest or exceptional means.
2,196 persons were reported
arrested for robbery in 2011. Of these, 81.1 percent were adults and 18.9 percent were juveniles.
42
Crime in Missouri, 2011 Section 4.3
POPULATION GROUP OFFENSES % OF
TOTAL
RATE PER 100,000
POPULATION
Police Agencies 250,000 + 3,784 60.4 466.1 100,000 - 249,999 562 9.0 145.5 50,000 - 99,999 313 5.0 59.9 25,000 - 49,999 343 5.5 88.0 10,000 - 24,999 451 7.2 60.2 2,500 - 9,999 276 4.4 44.6 Under 2,500 98 1.6 34.6 Sheriff's Dept. / County Police Suburban 324 5.2 39.9 Sheriff's Dept. --Rural 107 1.7 7.4 TOTAL 6,258 100.0 103.7
YEAR OFFENSES RATE PER 100,000
POPULATION
2010 6,076 109.0
2011 6,258 103.7
Percent of Change 3.0 -4.9
ROBBERY SUMMARY: 2010 and 2011
TABLE 4.3.1 NUMBER OF ROBBERIES AND ROBBERY
RATES BY POPULATION GROUP 2011
Robbery offenses increased 3.0% between 2010 and 2011.
60.4% of all robbery offenses were reported by police agencies serving jurisdictions with populations of 250,000 or more.
43
Crime in Missouri, 2011 Section 4.3
TYPE ROBBERIES TOTAL $ LOSS₁
/INCIDENT
SERVICE STATION 164 2.6 $529.42
CONVENIENCE STORE 276 4.4 $955.26
BANK 129 2.1 $6,616.94
OTHER COMMERCIAL 811 13.0 $1,461.77
STREET / HIGHWAY 3,247 51.9 $859.52
RESIDENCE 971 15.6 $1,316.95
MISCELLANEOUS 658 10.5 $1,077.87
UNKNOWN 2 - -
TOTAL 6,258 100.0 $1,145.66
2011 TOTAL STATE LOSS = $7,168,405
TYPE WEAPONS % OF TOTAL
FIREARMS 3,123 49.9
KNIVES OR CUTTING INSTRUMENTS
318 5.1
OTHER WEAPONS 449 7.2
STRONG ARMED (Hands, Feet, etc.)
2,368 37.9
TOTAL 6,258 100.0
TABLE 4.3.2 TYPE OF WEAPON USED IN ROBBERIES
2011
TABLE 4.3.3 ROBBERY LOSS / LOCATION
2011
₁The dollar loss per incident is calculated using only those robbery offenses for which law enforcement agencies reported an actual monetary loss.
A firearm was used in 49.9% of all 2011 robberies.
51.9% of all 2011 robberies occurred on streets or highways with an average loss per incident of $859.52.
44
Crime in Missouri, 2011 Section 4.3
YEAR PERCENT CLEARED % OF CLEARED
OFFENSES ONLY JUVENILES
2010 28.7 15.6
2011 31.1 10.8
SEX AGE GROUP ARRESTS
% OF TOTAL
ROBBERY ARRESTS
MALE ADULTS 1,521 69.3
JUVENILES 391 17.8
FEMALE ADULTS 259 11.8
JUVENILES 25 1.1
TOTAL 2,196 100.0
RACE AGE GROUP ARRESTS % OF TOTAL
ROBBERY ARRESTS
WHITE ADULTS 607 27.6
JUVENILES 76 3.5
BLACK ADULTS 1,171 53.3
JUVENILES 338 15.4
AMERICAN INDIAN
ADULTS 1 0.0
JUVENILES 0 0.0
ASIAN /OTHER
ADULTS 1 0.0
JUVENILES 2 0.1 TOTAL 2,196 100.0
TABLE 4.3.4 ROBBERY CLEARANCE RATES
2010 - 2011
TABLE 4.3.5 ROBBERY ARRESTS BY SEX AND AGE GROUP¹
2011
69.3% of all 2011 robbery arrests were adult males.
31.1% of all 2011 robberies were cleared by arrest or exceptional means.
TABLE 4.3.6 ROBBERY ARRESTS BY RACE AND AGE GROUP
2011
53.3% of all 2011 robbery arrests were black adults and 27.6% were white adults.
¹For purposes of this section, a juvenile is defined by the FBI as any person under the age of 18 years of age.
45
Crime in Missouri, 2011 Section 4.3
0
20
40
60
80
100
120
140
160
01 02 03 04 05 06 07 08 09 10 11
FIGURE 4.3.1 ROBBERY OFFENSE RATES, STATE OF MISSOURI
TIME SERIES
YEAR

47
Crime in Missouri, 2011 Section 4.5
4.4 AGGRAVATED ASSAULT
DEFINITION
Aggravated assault is an unlawful attack or attempted attack
by one person upon another for the purpose of inflicting
severe or aggravated bodily injury. This type of assault
usually is accompanied by the use of a weapon or by means
likely to produce death or great bodily harm. All assaults or
attempted assaults by one person upon another with the
intent to kill, maim, or inflict severe bodily injury with the use
of any dangerous weapon are classified under this category
of offense. Aggravated assault offenses are reported on a
per victim basis.
2011 Summary
18,752 aggravated assaults were reported in 2011.
One aggravated assault
occurred every 28.0 minutes.
Aggravated assault
accounted for 8.3 percent of the Total Crime Index and 69.8 percent of all Violent Index offenses.
The aggravated assault
rate per 100,000 population was 310.9.
A firearm was used in
28.2 percent of the cases.
56.8 percent of every
100 aggravated assaults were cleared by arrest or exceptional means.
8,004 persons were
arrested for aggravated assault in 2011. Of these, 91.0 percent were adults and 9.0 percent were juveniles.
48
Crime in Missouri, 2011 Section 4.5
POPULATION GROUP OFFENSES % OF
TOTAL
RATE PER 100,000
POPULATION
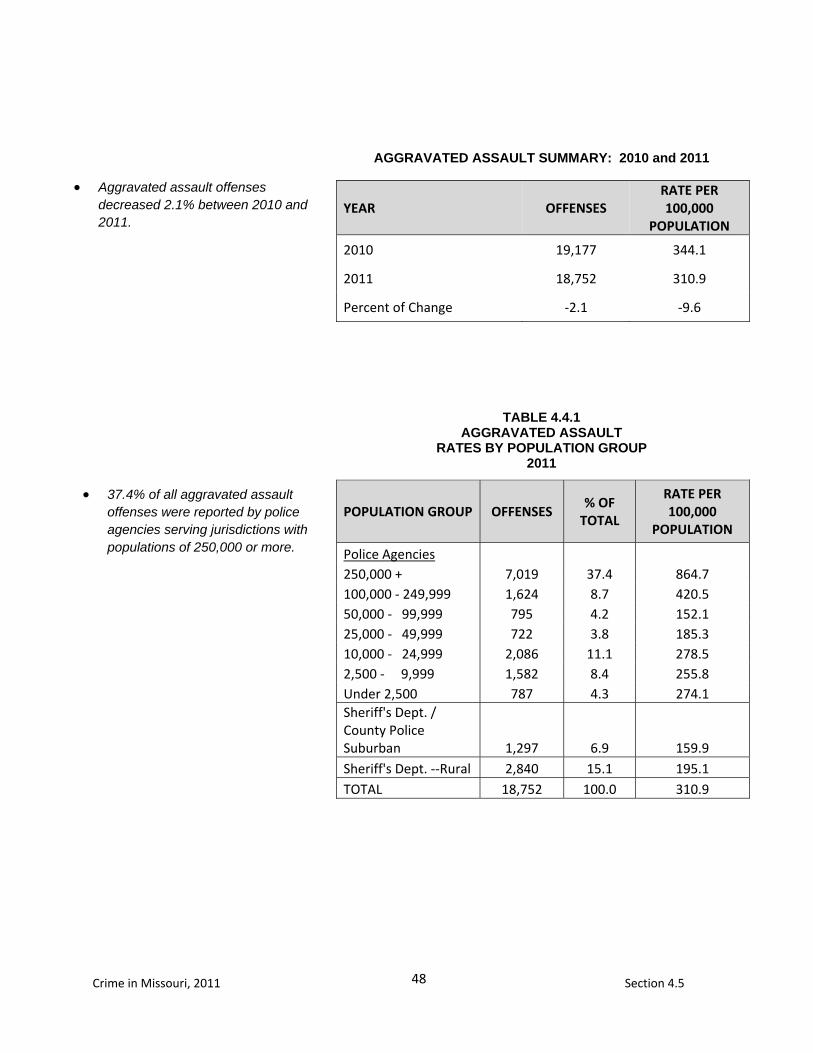
Police Agencies 250,000 + 7,019 37.4 864.7 100,000 - 249,999 1,624 8.7 420.5 50,000 - 99,999 795 4.2 152.1 25,000 - 49,999 722 3.8 185.3 10,000 - 24,999 2,086 11.1 278.5 2,500 - 9,999 1,582 8.4 255.8 Under 2,500 787 4.3 274.1 Sheriff's Dept. / County Police Suburban 1,297 6.9 159.9 Sheriff's Dept. --Rural 2,840 15.1 195.1 TOTAL 18,752 100.0 310.9
YEAR OFFENSES RATE PER 100,000
POPULATION
2010 19,177 344.1
2011 18,752 310.9
Percent of Change -2.1 -9.6
TABLE 4.4.1 AGGRAVATED ASSAULT
RATES BY POPULATION GROUP 2011
Aggravated assault offenses decreased 2.1% between 2010 and 2011.
37.4% of all aggravated assault offenses were reported by police agencies serving jurisdictions with populations of 250,000 or more.
AGGRAVATED ASSAULT SUMMARY: 2010 and 2011
49
Crime in Missouri, 2011 Section 4.5
TYPE WEAPONS % OF TOTAL
FIREARMS 5,286 28.2
KNIVES OR CUTTING INSTRUMENTS
2,514 13.4
OTHER WEAPONS 4,960 26.4
HANDS, FEET, ETC. / AGGRAVATED INJURY
5,992 32.0
TOTAL 18,752 100.0
YEAR PERCENT CLEARED % OF CLEARED
OFFENSES ONLY JUVENILES
2010 54.4 9.2
2011 56.8 7.7
SEX AGE GROUP ARRESTS
% OF TOTAL
AGGRAVATED ASSAULT ARRESTS
MALE ADULTS 5,823 72.8
JUVENILES 546 6.8
FEMALE ADULTS 1,455 18.2
JUVENILES 180 2.2
TOTAL 8,004 100.0
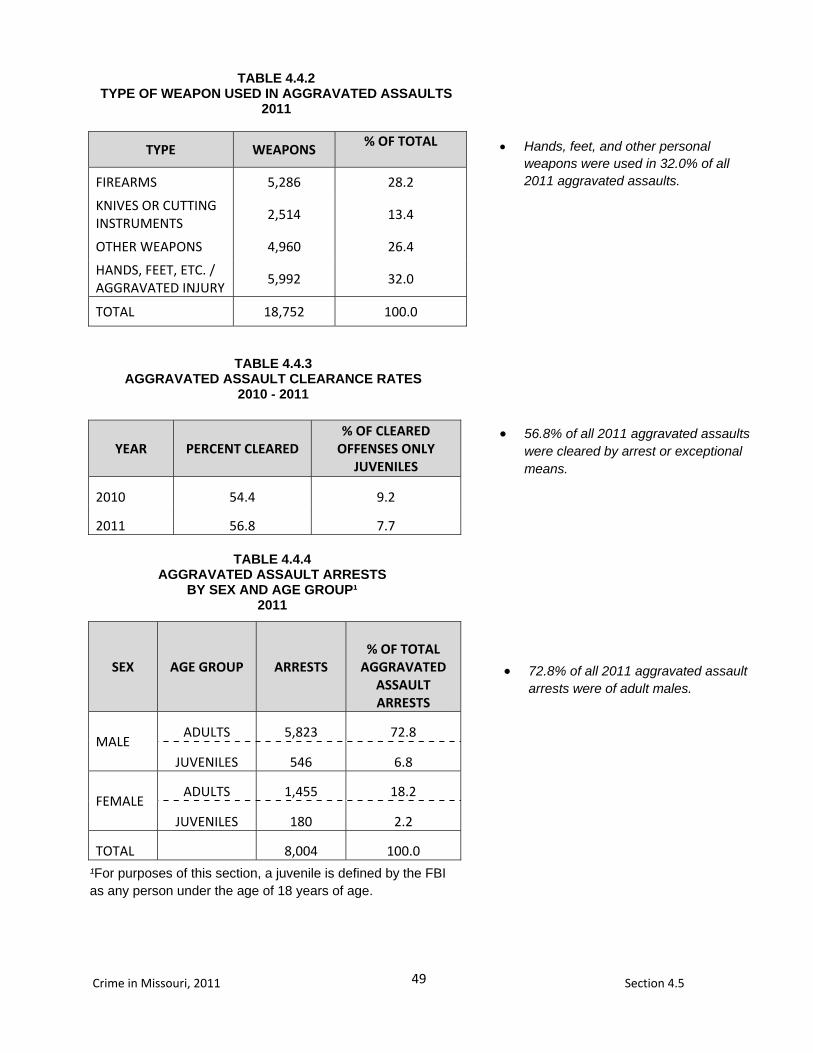
TABLE 4.4.2 TYPE OF WEAPON USED IN AGGRAVATED ASSAULTS
2011
Hands, feet, and other personal weapons were used in 32.0% of all 2011 aggravated assaults.
TABLE 4.4.3 AGGRAVATED ASSAULT CLEARANCE RATES
2010 - 2011
TABLE 4.4.4 AGGRAVATED ASSAULT ARRESTS
BY SEX AND AGE GROUP¹ 2011
56.8% of all 2011 aggravated assaults were cleared by arrest or exceptional means.
72.8% of all 2011 aggravated assault arrests were of adult males.
¹For purposes of this section, a juvenile is defined by the FBI as any person under the age of 18 years of age.
50
Crime in Missouri, 2011 Section 4.5
300310320330340350360370380390400
01 02 03 04 05 06 07 08 09 10 11
RACE AGE GROUP ARRESTS
% OF TOTAL AGGRAVATED
ASSAULT ARRESTS
WHITE ADULTS 4,331 54.1
JUVENILES 387 4.8
BLACK ADULTS 2,910 36.4
JUVENILES 337 4.2
AMERICAN INDIAN
ADULTS 9 0.1
JUVENILES 0 0.0
ASIAN /OTHER
ADULTS 28 0.3
JUVENILES 2 0.0 TOTAL 8,004 100.0
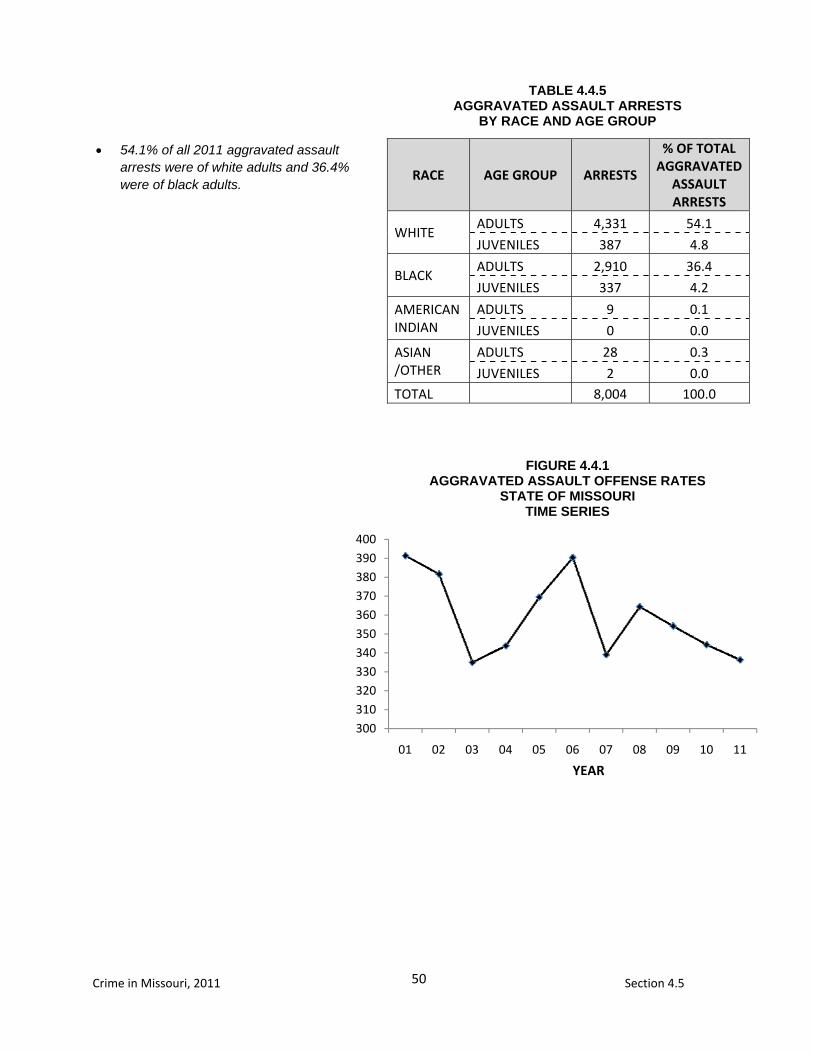
TABLE 4.4.5 AGGRAVATED ASSAULT ARRESTS
BY RACE AND AGE GROUP
54.1% of all 2011 aggravated assault arrests were of white adults and 36.4% were of black adults.
FIGURE 4.4.1 AGGRAVATED ASSAULT OFFENSE RATES
STATE OF MISSOURI TIME SERIES
YEAR
51
Crime in Missouri, 2011 Section 4.5
4.5 BURGLARY
DEFINITION
Burglary is the unlawful entry or attempted unlawful entry of
a structure to commit a felony or a theft. Burglary offenses
are reported on an incident-by-incident basis.
2011 Summary
44,765 burglaries were reported during 2011.
One burglary occurred
every 11.7 minutes.
Burglary accounted for 19.7 percent of the Total Crime Index and 22.4 percent of all Property Index offenses.
The burglary rate per
100,000 population was 741.7.
Residential dwellings
were involved in 79.3 percent of all burglaries and forcible entry was involved in 57.6 percent.
$82,664,716 in property /
cash was stolen during burglaries.
14.2 percent of every 100
burglaries were cleared by arrest or exceptional means.
6,725 persons were
reported arrested for burglary in 2011. Of these, 80.7 percent were adults and 19.3 percent were juveniles.
52
Crime in Missouri, 2011 Section 4.5
POPULATION GROUP OFFENSES % OF
TOTAL
RATE PER 100,000
POPULATION
Police Agencies 250,000 + 13,868 31.0 1708.4 100,000 - 249,999 4,029 9.0 1043.2 50,000 - 99,999 3,007 6.7 575.4 25,000 - 49,999 2,196 4.9 563.7 10,000 - 24,999 5,126 11.4 684.4 2,500 - 9,999 3,948 8.8 637.9 Under 2,500 1,741 3.9 599.5 Sheriff's Dept. / County Police Suburban 3,689 8.2 454.7 Sheriff's Dept. --Rural 7,161 16.0 492.0 TOTAL 44,765 100.0 741.7
YEAR OFFENSES RATE PER 100,000
POPULATION
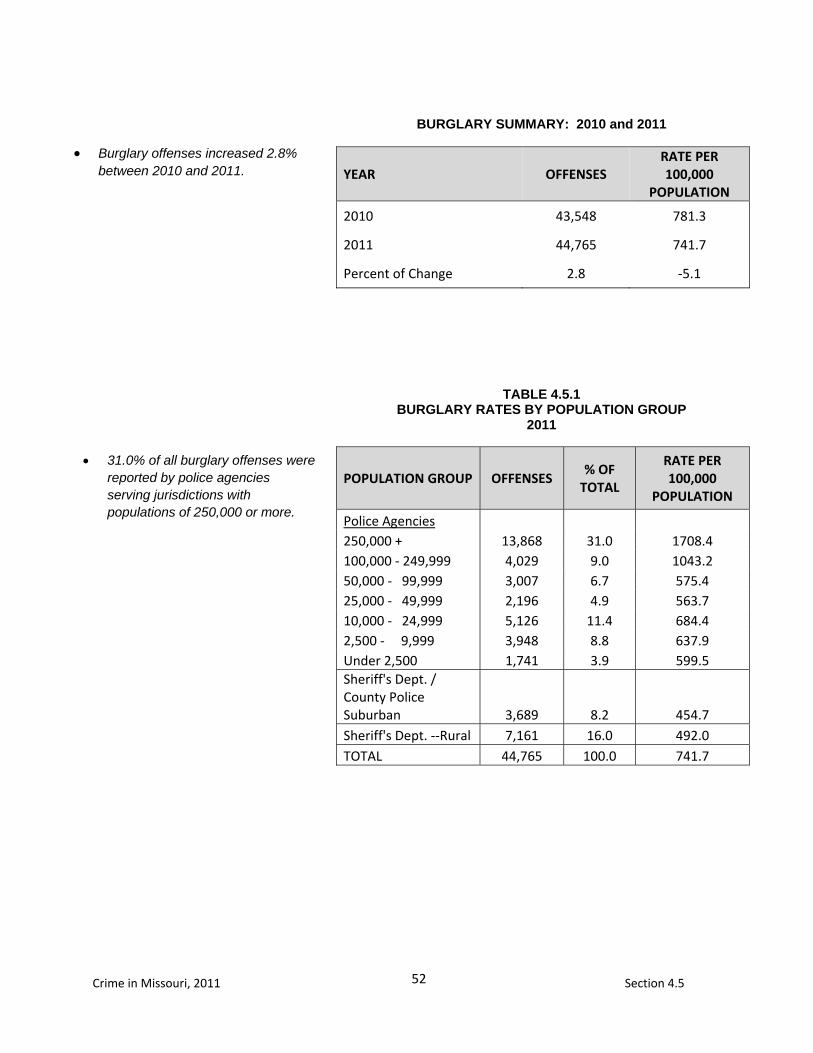
2010 43,548 781.3
2011 44,765 741.7
Percent of Change 2.8 -5.1
TABLE 4.5.1 BURGLARY RATES BY POPULATION GROUP
2011
Burglary offenses increased 2.8% between 2010 and 2011.
31.0% of all burglary offenses were reported by police agencies serving jurisdictions with populations of 250,000 or more.
BURGLARY SUMMARY: 2010 and 2011
53
Crime in Missouri, 2011 Section 4.5
TYPE BURGLARIES TOTAL $ LOSS₁
/INCIDENT
RESIDENCE
NIGHT (6 p.m. to 6 a.m.)
8,520 19.0 $1,640.53
DAY (6 a.m. to 6 p.m.)
15,026 33.6 $1,768.77
TIME UNKNOWN 11,962 26.7 $1,873.19
NON-RESIDENCE
NIGHT (6 p.m. to 6 a.m.)
4,149 9.3 $1,877.75
DAY (6 a.m. to 6 p.m.)
1,915 4.3 $2,505.08
TIME UNKNOWN 3,193 7.1 $2,228.22
TOTAL 44,765 100.0 $1,846.64
2011 TOTAL STATE LOSS = $82,664,716
TYPE OFFENSES % OF TOTAL
FORCIBLE ENTRY 25,775 57.6
UNLAWFUL ENTRY NO FORCE
16,142 36.1
ATTEMPTED FORCIBLE ENTRY
2,848 6.4
TOTAL 44,765 100.0
TABLE 4.5.2 TYPE OF BURGLARY
2011
TABLE 4.5.3 BURGLARY LOSS / LOCATION / TIME
2011
₁The dollar loss per incident is calculated using only those burglary offenses for which law enforcement agencies reported an actual monetary loss.
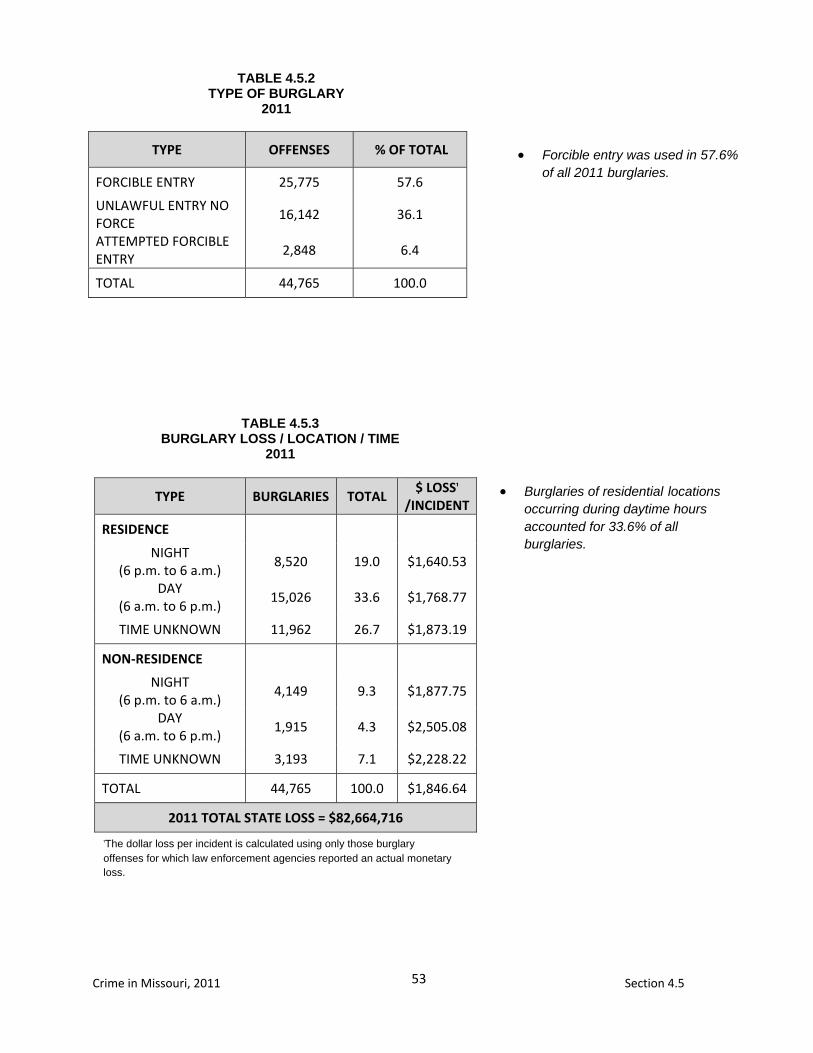
Forcible entry was used in 57.6% of all 2011 burglaries.
Burglaries of residential locations occurring during daytime hours accounted for 33.6% of all burglaries.
54
Crime in Missouri, 2011 Section 4.5
YEAR PERCENT CLEARED % OF CLEARED
OFFENSES ONLY JUVENILES
2010 13.4 14.2
2011 14.2 10.8
SEX AGE GROUPS ARRESTS
% OF TOTAL BURGLARY ARRESTS
MALE ADULTS 4,750 70.6
JUVENILES 1,204 17.9
FEMALE ADULTS 676 10.1
JUVENILES 95 1.4
TOTAL 6,725 100.0
RACE AGE GROUPS ARRESTS % OF TOTAL
BURLARY ARRESTS
WHITE ADULTS 3,211 47.7
JUVENILES 628 9.3
BLACK ADULTS 2,201 32.7
JUVENILES 667 9.9
AMERICAN INDIAN
ADULTS 2 0.0
JUVENILES 0 0.0
ASIAN /OTHER
ADULTS 12 0.2
JUVENILES 4 0.1 TOTAL 6,725 100.0
TABLE 4.5.4 BURGLARY CLEARANCE RATES
2010 - 2011
TABLE 4.5.5 BURGLARY ARRESTS BY SEX AND AGE GROUP¹
2011
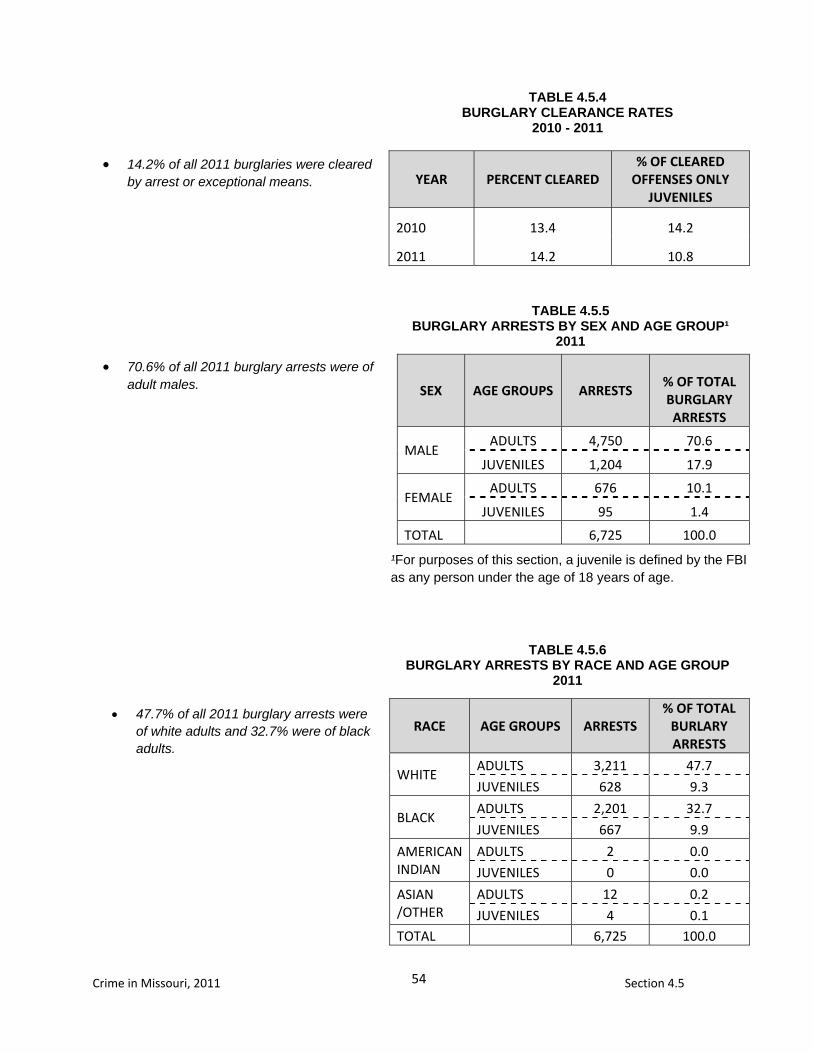
70.6% of all 2011 burglary arrests were of adult males.
14.2% of all 2011 burglaries were cleared by arrest or exceptional means.
TABLE 4.5.6
BURGLARY ARRESTS BY RACE AND AGE GROUP 2011
47.7% of all 2011 burglary arrests were of white adults and 32.7% were of black adults.
¹For purposes of this section, a juvenile is defined by the FBI as any person under the age of 18 years of age.
55
Crime in Missouri, 2011 Section 4.5
640660680700720740760780800820840
01 02 03 04 05 06 07 08 09 10 11
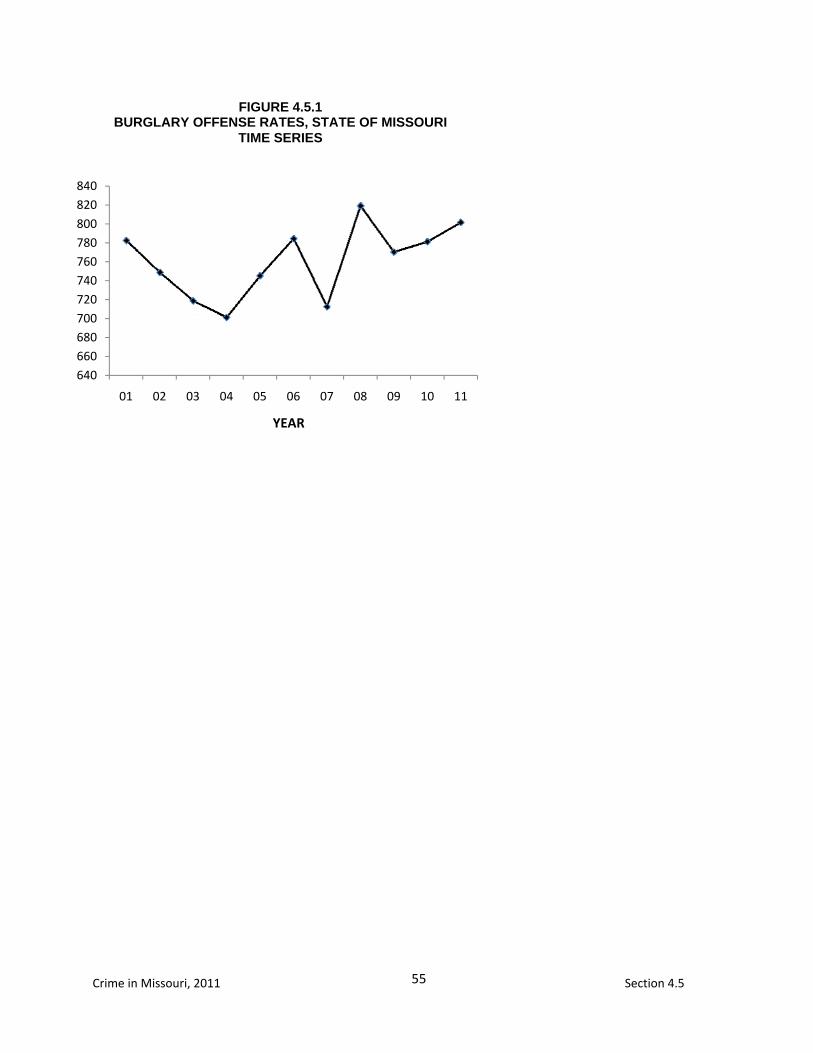
FIGURE 4.5.1 BURGLARY OFFENSE RATES, STATE OF MISSOURI
TIME SERIES
YEAR

57
Crime in Missouri, 2011 Section 4.6
4.6 LARCENY / THEFT
DEFINITION
Theft is the unlawful taking, carrying, leading, or riding away
of property from the possession or constructive possession
of another. Attempted thefts are also included. This
category includes crimes such as shoplifting, pocket-picking,
purse-snatching, thefts from motor vehicles, thefts of motor
vehicle parts or accessories, bicycle thefts, etc., in which no
use of force, violence, or fraud occurs. It does not include
embezzlement, "con" games, forgery, or worthless checks.
Motor vehicle theft is also excluded inasmuch as it is a
separate crime index offense. Theft offenses are reported
on an incident-by-incident basis.
2011 Summary
There were 138,632 thefts reported during 2011.
In 2011, one theft occurred
every 3.8 minutes. Theft accounted for 61.0
percent of the Total Crime Index and 69.2 percent of all Property Index offenses.
The theft rate per 100,000
population in 2011 was 2,296.4.
In 2011, 33.1 percent of all
thefts involved the taking of vehicle parts / accessories or other types of property from a vehicle.
Due to this offense
$99,160,420 in property / cash was stolen in 2011.
In 2011, 24.0 percent of
every 100 thefts were cleared by arrest or exceptional means.
33,885 persons were
reported arrested for theft in 2011. Of these persons, 80.2 percent were adults and 19.8 percent were juve-niles. Of those arrested, 57.7 percent were male and 42.3 percent were female.

58
Crime in Missouri, 2011 Section 4.6
POPULATION GROUP OFFENSES % OF
TOTAL
RATE PER 100,000
POPULATION
Police Agencies 250,000 + 30,642 22.1 3,774.8 100,000 - 249,999 19,499 14.1 5,048.6 50,000 - 99,999 12,956 9.3 2,479.1 25,000 - 49,999 9,366 6.8 2,404.3 10,000 - 24,999 21,573 15.6 2,880.4 2,500 - 9,999 15,704 11.3 2,537.3 Under 2,500 5,656 4.1 1,935.3 Sheriff's Dept. / County Police Suburban 10,415 7.5 1,283.6 Sheriff's Dept. --Rural 12,821 9.2 880.9 TOTAL 138,632 100.0 2,296.4
YEAR OFFENSES RATE PER 100,000
POPULATION
2010 139,212 2,497.6
2011 138,632 2,296.4
Percent of Change -0.4 -8.1
TABLE 4.6.1 THEFT RATES BY POPULATION GROUP
2011
The theft offense rate decreased 8.1 % between 2010 and 2011.
22.1% of all 2011 thefts were reported by police agencies serving jurisdictions with populations of 250,000 or more.
THEFT SUMMARY: 2010 and 2011
59
Crime in Missouri, 2011 Section 4.6
TYPE OFFENSES % OF
TOTAL $ LOSS₁
/INCIDENT
POCKET PICKING 391 0.3 $284.10
PURSE SNATCHING 505 0.4 $255.24
SHOPLIFTING 25,240 18.2 $147.60
FROM MOTOR VEHICLE
30,593 22.1 $581.96
PARTS & ACCESSORY 15,246 11.0 $23.42
BICYCLES 2,630 1.9 $257.58
FROM BUILDINGS 22,551 16.3 $1,043.81
COIN MACHINES 371 0.3 $83.86
ALL OTHERS 41,105 29.7 $1,145.81
UNKNOWN 0 - -
TOTAL 138,631 100.0 $715.19
2011 TOTAL STATE LOSS = $99,160,420
TYPE OFFENSES % OF TOTAL
THEFTS
$200 AND OVER 57,004 41.1
$50 to $199 32,676 23.6
UNDER $50 48,951 35.3
UNKNOWN 0 -
TOTAL 138,631 100.0
TABLE 4.6.2 THEFT BY VALUE OF STOLEN ITEMS
2011
TABLE 4.6.3
NATURE OF THEFT 2011
₁ The dollar loss per incident is calculated using only those theft offenses for which law enforcement agencies reported an actual monetary loss.
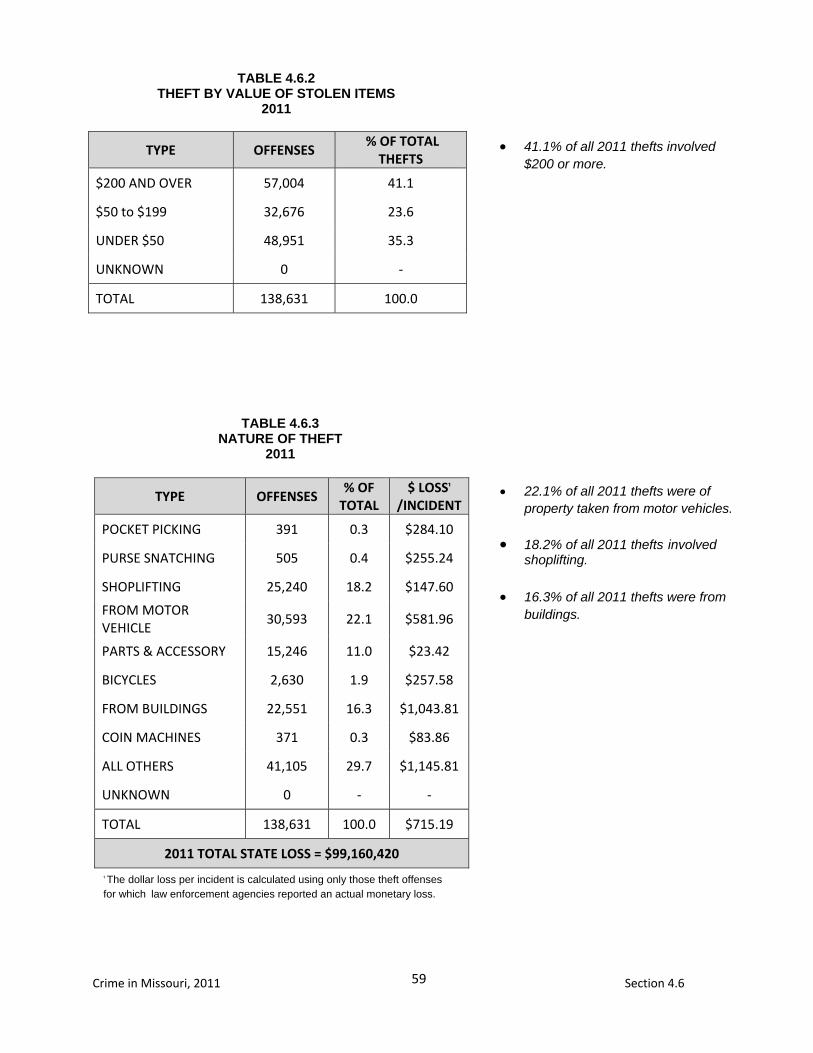
41.1% of all 2011 thefts involved $200 or more.
22.1% of all 2011 thefts were of property taken from motor vehicles.
18.2% of all 2011 thefts involved shoplifting.
16.3% of all 2011 thefts were from
buildings.
60
Crime in Missouri, 2011 Section 4.6
YEAR PERCENT CLEARED % OF CLEARED
OFFENSES ONLY JUVENILES
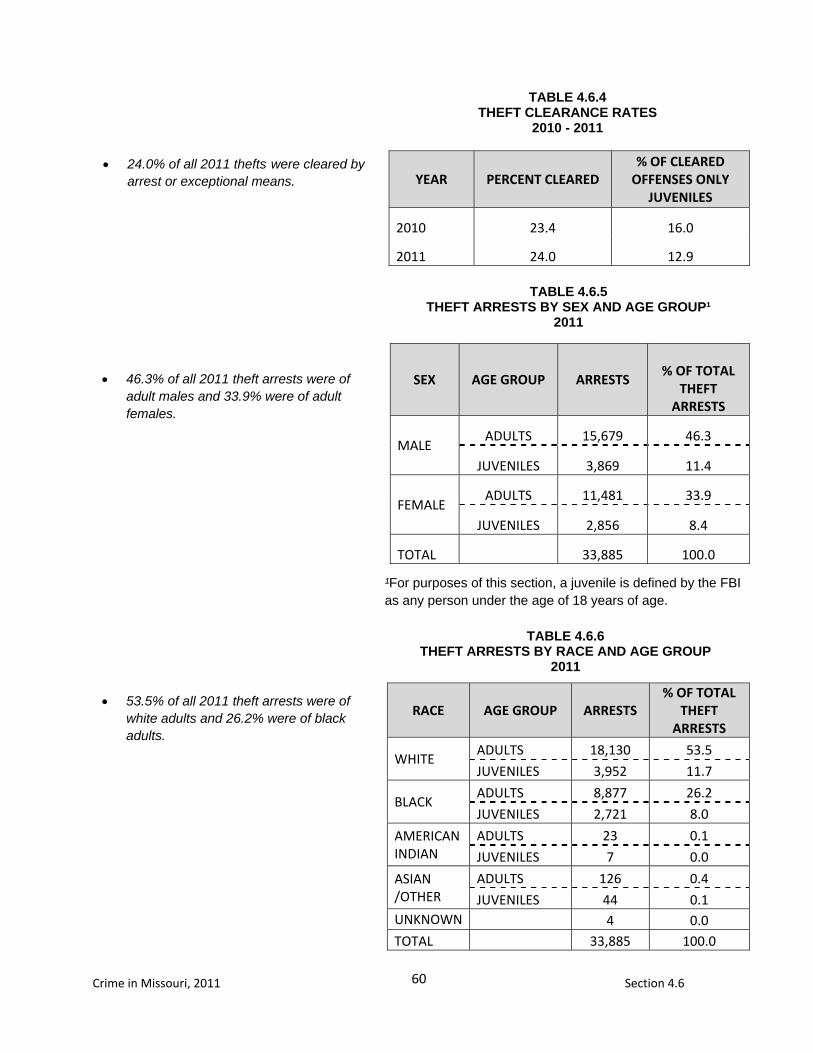
2010 23.4 16.0
2011 24.0 12.9
SEX AGE GROUP ARRESTS
% OF TOTAL
THEFT ARRESTS
MALE ADULTS 15,679 46.3
JUVENILES 3,869 11.4
FEMALE ADULTS 11,481 33.9
JUVENILES 2,856 8.4
TOTAL 33,885 100.0
RACE AGE GROUP ARRESTS % OF TOTAL
THEFT ARRESTS
WHITE ADULTS 18,130 53.5
JUVENILES 3,952 11.7
BLACK ADULTS 8,877 26.2
JUVENILES 2,721 8.0
AMERICAN INDIAN
ADULTS 23 0.1
JUVENILES 7 0.0
ASIAN /OTHER
ADULTS 126 0.4
JUVENILES 44 0.1 UNKNOWN 4 0.0 TOTAL 33,885 100.0
TABLE 4.6.4 THEFT CLEARANCE RATES
2010 - 2011
TABLE 4.6.5 THEFT ARRESTS BY SEX AND AGE GROUP¹
2011
46.3% of all 2011 theft arrests were of adult males and 33.9% were of adult females.
24.0% of all 2011 thefts were cleared by arrest or exceptional means.
TABLE 4.6.6
THEFT ARRESTS BY RACE AND AGE GROUP 2011
53.5% of all 2011 theft arrests were of white adults and 26.2% were of black adults.
¹For purposes of this section, a juvenile is defined by the FBI as any person under the age of 18 years of age.
61
Crime in Missouri, 2011 Section 4.6
0
500
1,000
1,500
2,000
2,500
3,000
3,500
01 02 03 04 05 06 07 08 09 10 11
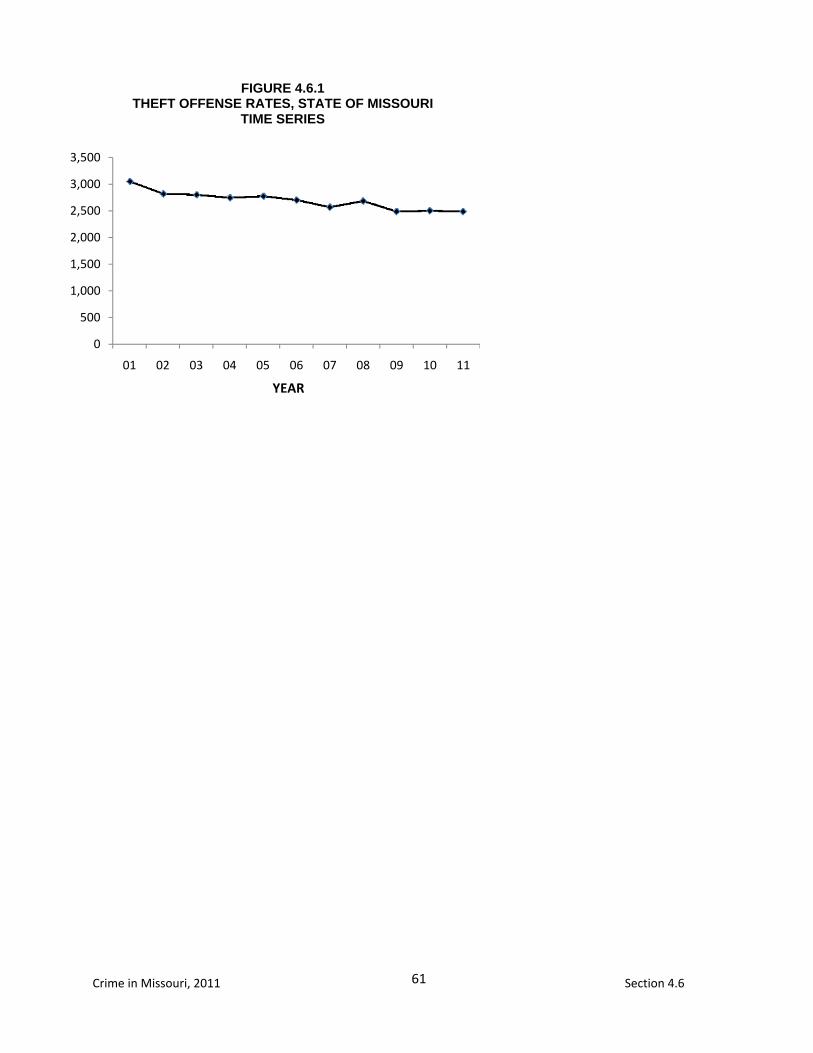
FIGURE 4.6.1 THEFT OFFENSE RATES, STATE OF MISSOURI
TIME SERIES
YEAR

63
Crime in Missouri, 2011 Section 4.7
4.7 MOTOR VEHICLE THEFT
DEFINITION
Motor vehicle theft is the theft or attempted theft of a motor
vehicle. By definition, a motor vehicle is a self-propelled
vehicle that runs on the surface and not on rails. Motor
vehicles include automobiles, trucks, buses, motorcycles,
motor scooters, snowmobiles, etc. Motor vehicle theft
offenses are reported on a per vehicle basis.
2011 Summary
There were 15,295 motor vehicle thefts reported during 2011.
In 2011, one motor vehicle
theft occurred every 34.4 minutes.
Motor vehicle theft
accounted for 6.7 percent of the Total Crime Index and 7.6 percent of all Property Index offenses.
The motor vehicle theft rate
per 100,000 population was 253.4 in 2011.
The value of vehicles stolen
in 2011 was $85,634,639. In 2011, 12.8 percent of
every 100 motor vehicle thefts were cleared by arrest or exceptional means.
1,631 persons were reported
arrested for motor vehicle theft in 2011. Of these, 83.6 percent were adults and 16.4 percent were juveniles. Of those arrested, 83.9 percent were male and 16.1 percent were female.
64
Crime in Missouri, 2011 Section 4.7
POPULATION GROUP OFFENSES % OF
TOTAL
RATE PER 100,000
POPULATION
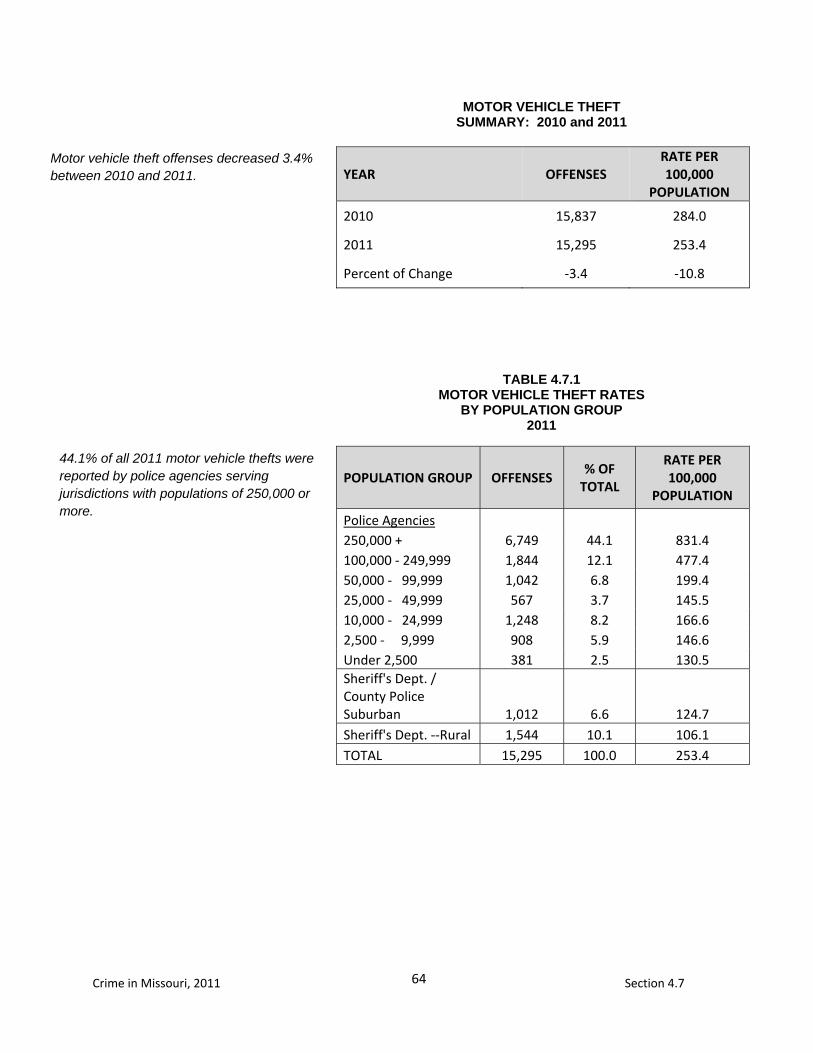
Police Agencies 250,000 + 6,749 44.1 831.4 100,000 - 249,999 1,844 12.1 477.4 50,000 - 99,999 1,042 6.8 199.4 25,000 - 49,999 567 3.7 145.5 10,000 - 24,999 1,248 8.2 166.6 2,500 - 9,999 908 5.9 146.6 Under 2,500 381 2.5 130.5 Sheriff's Dept. / County Police Suburban 1,012 6.6 124.7 Sheriff's Dept. --Rural 1,544 10.1 106.1 TOTAL 15,295 100.0 253.4
YEAR OFFENSES RATE PER 100,000
POPULATION
2010 15,837 284.0
2011 15,295 253.4
Percent of Change -3.4 -10.8
TABLE 4.7.1 MOTOR VEHICLE THEFT RATES
BY POPULATION GROUP 2011
Motor vehicle theft offenses decreased 3.4% between 2010 and 2011.
44.1% of all 2011 motor vehicle thefts were reported by police agencies serving jurisdictions with populations of 250,000 or more.
MOTOR VEHICLE THEFT SUMMARY: 2010 and 2011
65
Crime in Missouri, 2011 Section 4.7
YEAR ESTIMATED $ LOSS PER INCIDENT₁
PERCENT₂ RECOVERED
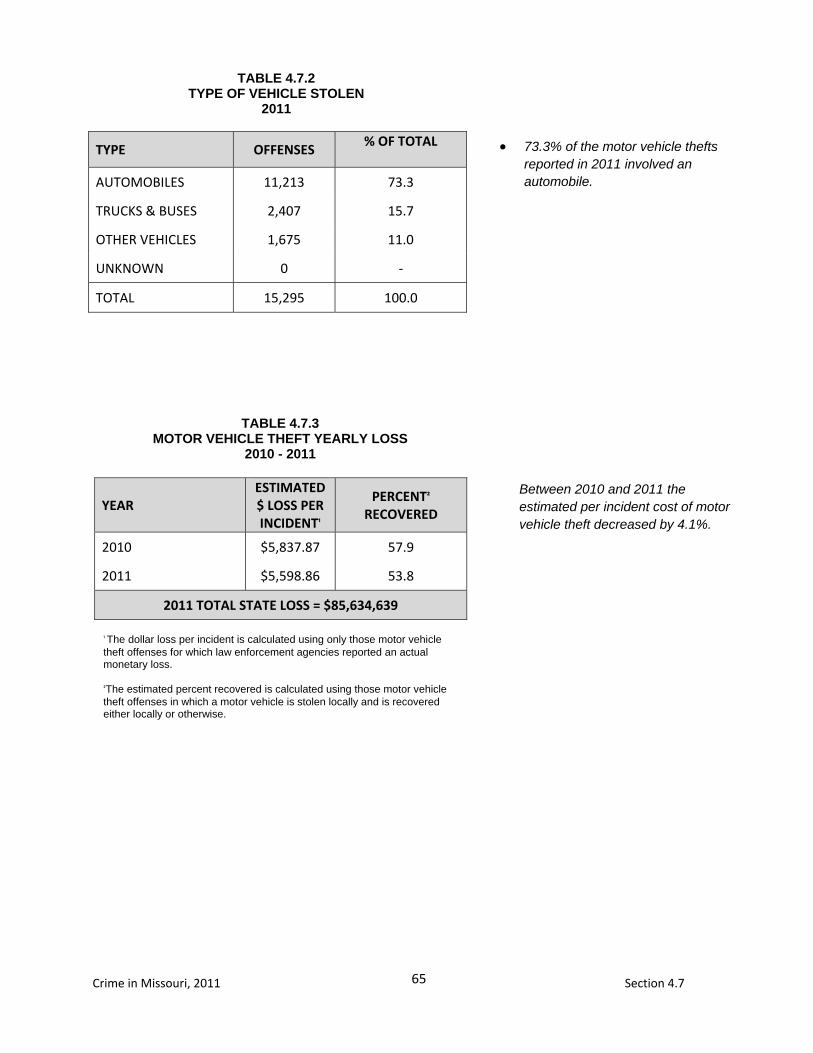
2010 $5,837.87 57.9
2011 $5,598.86 53.8
2011 TOTAL STATE LOSS = $85,634,639
TYPE OFFENSES % OF TOTAL
AUTOMOBILES 11,213 73.3
TRUCKS & BUSES 2,407 15.7
OTHER VEHICLES 1,675 11.0
UNKNOWN 0 -
TOTAL 15,295 100.0
TABLE 4.7.2 TYPE OF VEHICLE STOLEN
2011
TABLE 4.7.3 MOTOR VEHICLE THEFT YEARLY LOSS
2010 - 2011
₁ The dollar loss per incident is calculated using only those motor vehicle theft offenses for which law enforcement agencies reported an actual monetary loss. ₂The estimated percent recovered is calculated using those motor vehicle theft offenses in which a motor vehicle is stolen locally and is recovered either locally or otherwise.
73.3% of the motor vehicle thefts reported in 2011 involved an automobile.
Between 2010 and 2011 the estimated per incident cost of motor vehicle theft decreased by 4.1%.
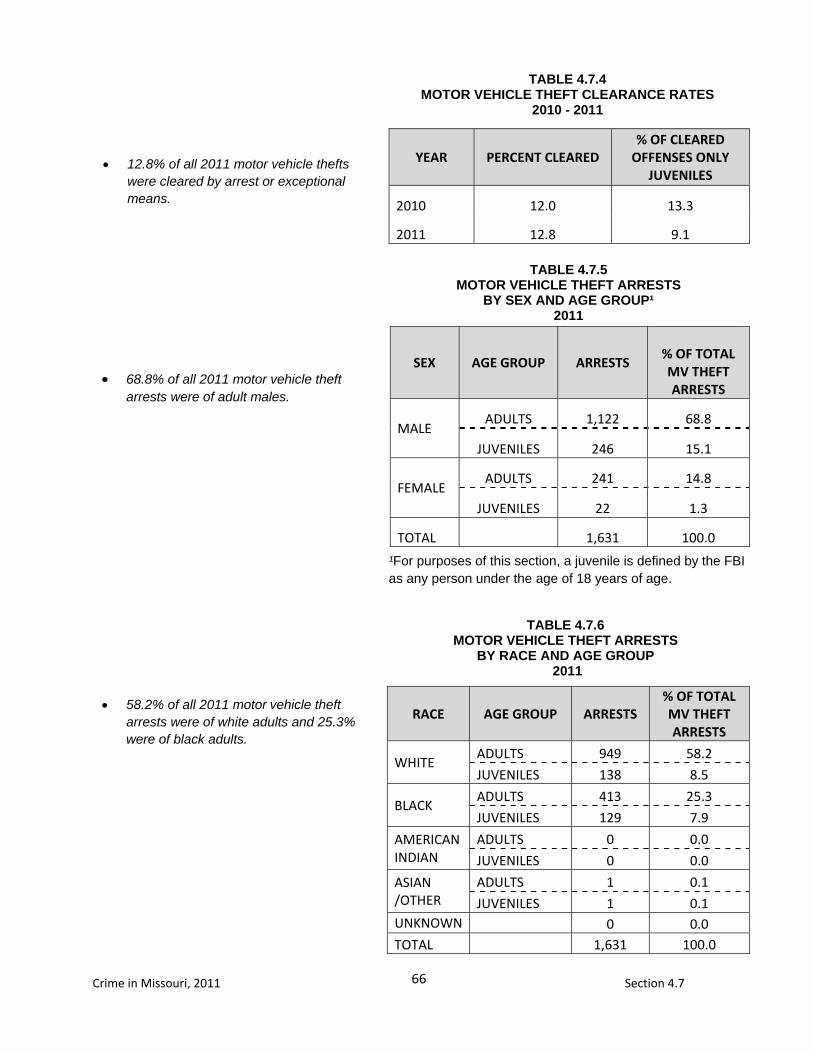
66
Crime in Missouri, 2011 Section 4.7
YEAR PERCENT CLEARED % OF CLEARED
OFFENSES ONLY JUVENILES
2010 12.0 13.3
2011 12.8 9.1
SEX AGE GROUP ARRESTS
% OF TOTAL MV THEFT ARRESTS
MALE ADULTS 1,122 68.8
JUVENILES 246 15.1
FEMALE ADULTS 241 14.8
JUVENILES 22 1.3
TOTAL 1,631 100.0
RACE AGE GROUP ARRESTS % OF TOTAL MV THEFT ARRESTS
WHITE ADULTS 949 58.2
JUVENILES 138 8.5
BLACK ADULTS 413 25.3
JUVENILES 129 7.9
AMERICAN INDIAN
ADULTS 0 0.0
JUVENILES 0 0.0
ASIAN /OTHER
ADULTS 1 0.1
JUVENILES 1 0.1 UNKNOWN 0 0.0 TOTAL 1,631 100.0
TABLE 4.7.4 MOTOR VEHICLE THEFT CLEARANCE RATES
2010 - 2011
TABLE 4.7.5 MOTOR VEHICLE THEFT ARRESTS
BY SEX AND AGE GROUP¹ 2011
68.8% of all 2011 motor vehicle theft arrests were of adult males.
12.8% of all 2011 motor vehicle thefts were cleared by arrest or exceptional means.
58.2% of all 2011 motor vehicle theft arrests were of white adults and 25.3% were of black adults.
TABLE 4.7.6
MOTOR VEHICLE THEFT ARRESTS BY RACE AND AGE GROUP
2011
¹For purposes of this section, a juvenile is defined by the FBI as any person under the age of 18 years of age.
67
Crime in Missouri, 2011 Section 4.7
0
100
200
300
400
500
600
01 02 03 04 05 06 07 08 09 10 11
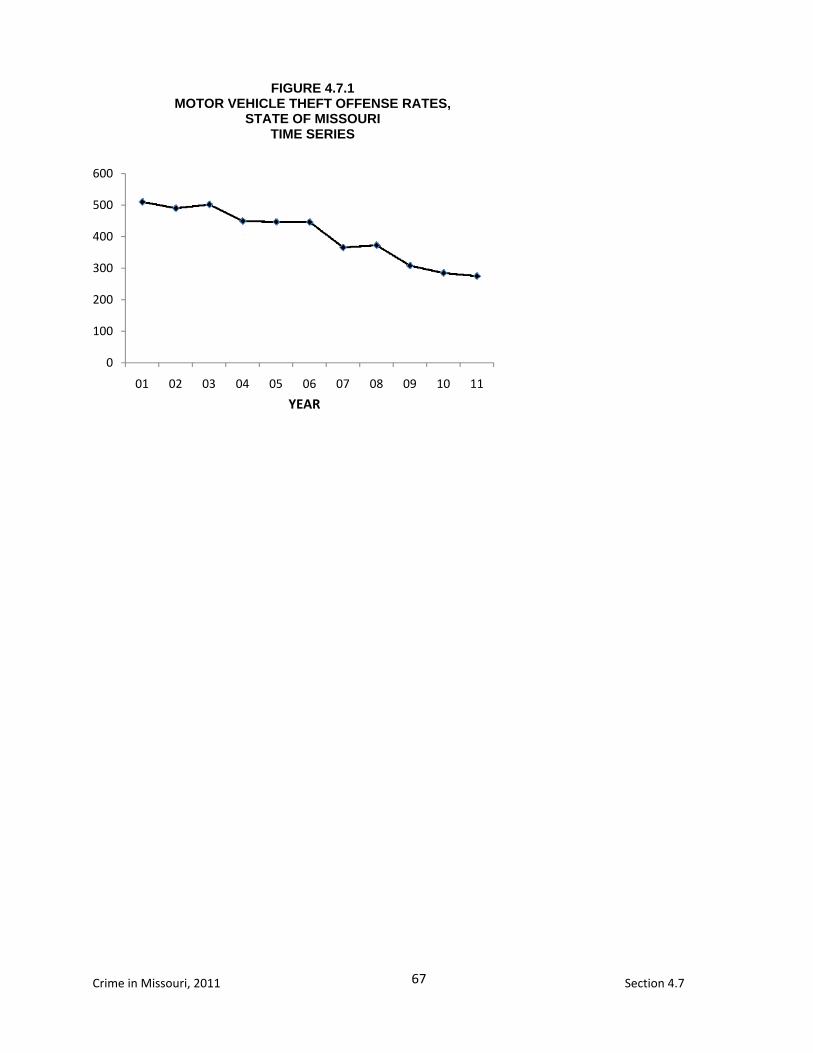
FIGURE 4.7.1 MOTOR VEHICLE THEFT OFFENSE RATES,
STATE OF MISSOURI TIME SERIES
YEAR

69
Crime in Missouri, 2011 Section 4.8
4.8 ARSON
DEFINITION
Arson is defined as any willful or malicious burning or
attempt to burn, with or without intent to defraud, a dwelling
house, public building, motor vehicle or aircraft, personal
property of another, etc. Only fires determined through
investigation to have been willfully or maliciously set are
classified as arsons. Fires of suspicious or unknown origins
are excluded. Arson offenses are reported on an incident-
by-incident basis.
2011 Summary
There were 1,507 arsons reported during 2011.
In 2011, one arson occurred
every 5.8 hours.
Arsons accounted for 0.7 percent of the Total Crime Index and 0.8 percent of all Property Index offenses.
The arson rate per 100,000
population in 2011 was 25.0.
Residential dwellings accounted for 46.8 percent of all types of property destroyed by arson. .
Arson accounted for $25,682,559 in property loss in 2011.
In 2011, 16.5 percent of
every 100 arsons were cleared by arrest or exceptional means.
300 persons were reported
arrested for arson in 2011. Of these, 55.3 percent were adults. Of those arrested, 83.3 percent were male and 16.6 percent were female.
70
Crime in Missouri, 2011 Section 4.8
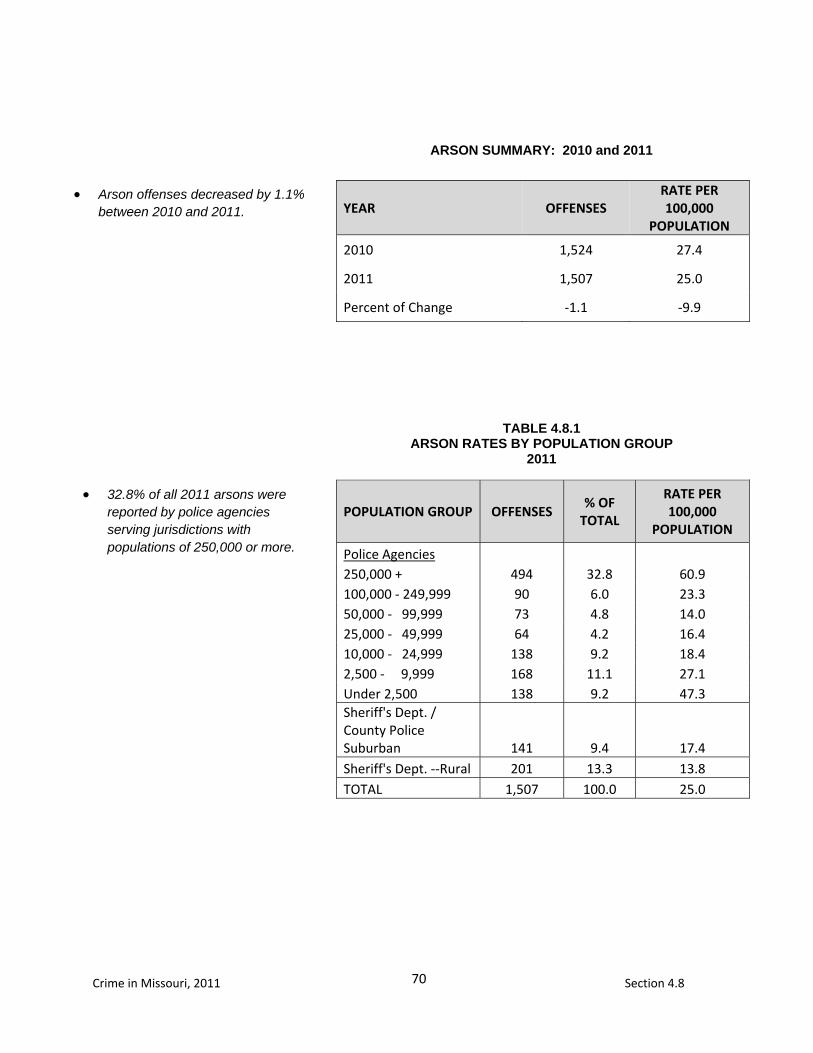
POPULATION GROUP OFFENSES % OF
TOTAL
RATE PER 100,000
POPULATION
Police Agencies 250,000 + 494 32.8 60.9 100,000 - 249,999 90 6.0 23.3 50,000 - 99,999 73 4.8 14.0 25,000 - 49,999 64 4.2 16.4 10,000 - 24,999 138 9.2 18.4 2,500 - 9,999 168 11.1 27.1 Under 2,500 138 9.2 47.3 Sheriff's Dept. / County Police Suburban 141 9.4 17.4 Sheriff's Dept. --Rural 201 13.3 13.8 TOTAL 1,507 100.0 25.0
YEAR OFFENSES RATE PER 100,000
POPULATION
2010 1,524 27.4
2011 1,507 25.0
Percent of Change -1.1 -9.9
TABLE 4.8.1 ARSON RATES BY POPULATION GROUP
2011
Arson offenses decreased by 1.1% between 2010 and 2011.
32.8% of all 2011 arsons were reported by police agencies serving jurisdictions with populations of 250,000 or more.
ARSON SUMMARY: 2010 and 2011
71
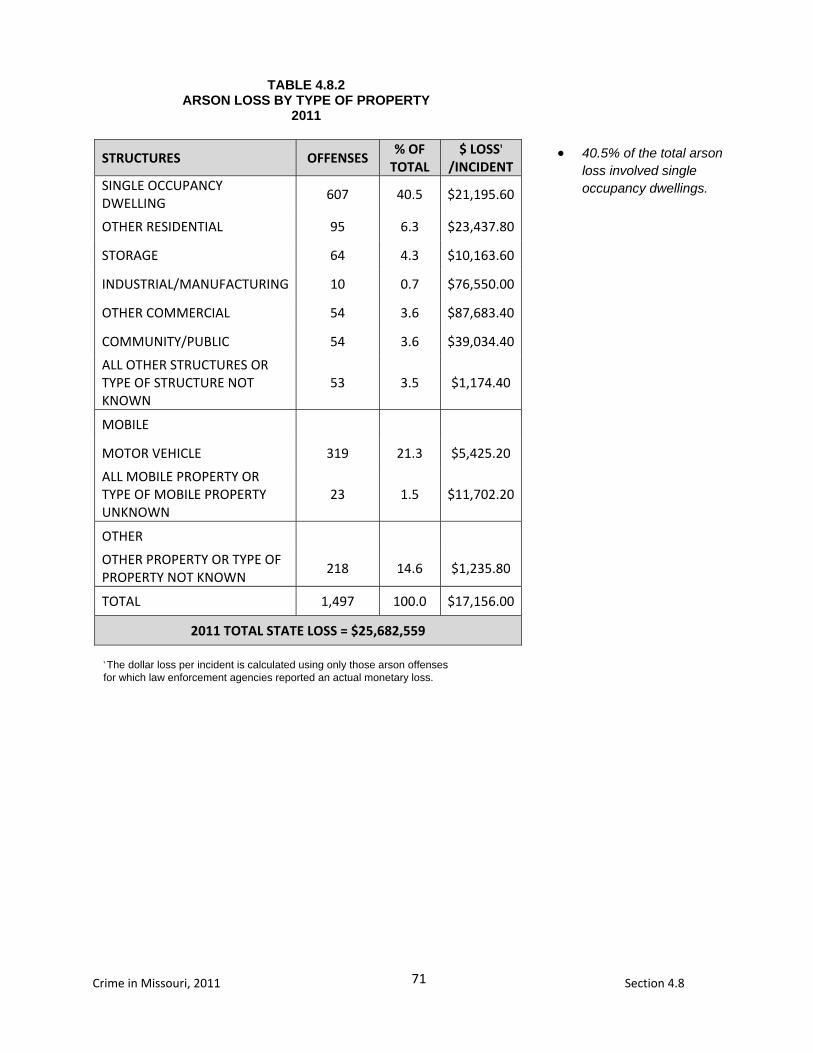
Crime in Missouri, 2011 Section 4.8
STRUCTURES OFFENSES % OF
TOTAL $ LOSS₁
/INCIDENT SINGLE OCCUPANCY DWELLING
607 40.5 $21,195.60
OTHER RESIDENTIAL 95 6.3 $23,437.80
STORAGE 64 4.3 $10,163.60
INDUSTRIAL/MANUFACTURING 10 0.7 $76,550.00
OTHER COMMERCIAL 54 3.6 $87,683.40
COMMUNITY/PUBLIC 54 3.6 $39,034.40
ALL OTHER STRUCTURES OR TYPE OF STRUCTURE NOT KNOWN
53 3.5 $1,174.40
MOBILE
MOTOR VEHICLE 319 21.3 $5,425.20
ALL MOBILE PROPERTY OR TYPE OF MOBILE PROPERTY UNKNOWN
23 1.5 $11,702.20
OTHER
OTHER PROPERTY OR TYPE OF PROPERTY NOT KNOWN
218 14.6 $1,235.80
TOTAL 1,497 100.0 $17,156.00
2011 TOTAL STATE LOSS = $25,682,559
TABLE 4.8.2 ARSON LOSS BY TYPE OF PROPERTY
2011
₁ The dollar loss per incident is calculated using only those arson offenses for which law enforcement agencies reported an actual monetary loss.
40.5% of the total arson loss involved single occupancy dwellings.
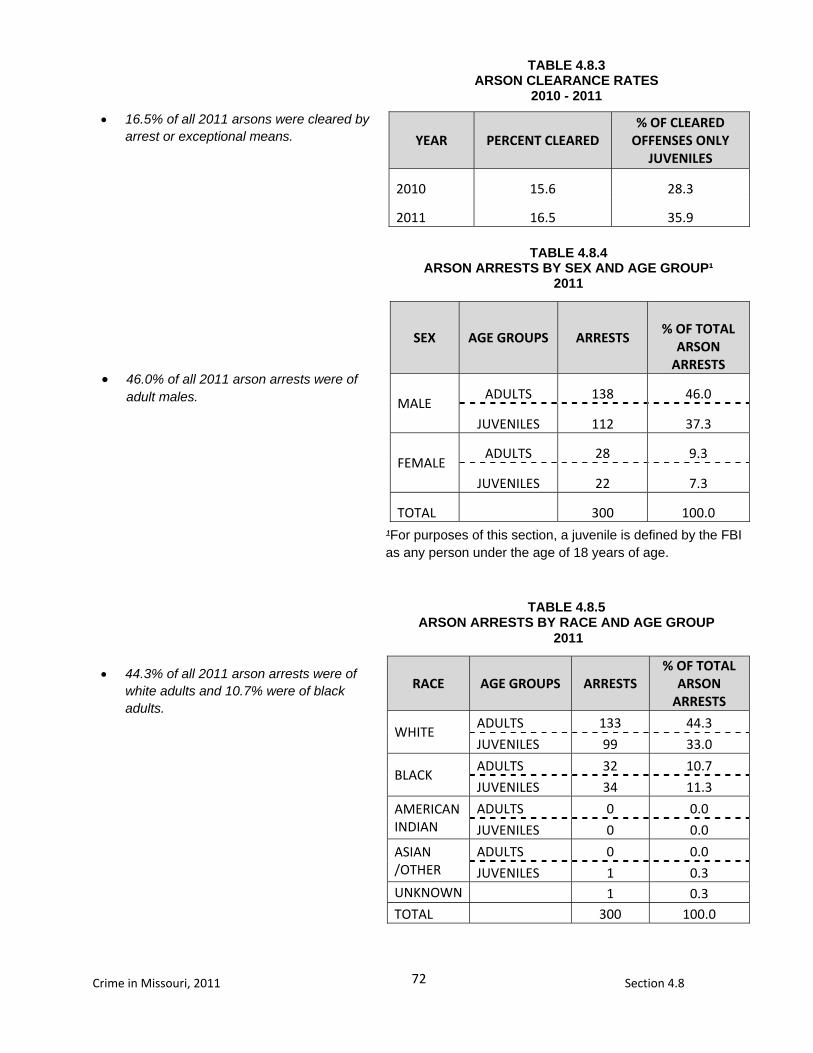
72
Crime in Missouri, 2011 Section 4.8
YEAR PERCENT CLEARED % OF CLEARED
OFFENSES ONLY JUVENILES
2010 15.6 28.3
2011 16.5 35.9
SEX AGE GROUPS ARRESTS
% OF TOTAL
ARSON ARRESTS
MALE ADULTS 138 46.0
JUVENILES 112 37.3
FEMALE ADULTS 28 9.3
JUVENILES 22 7.3
TOTAL 300 100.0
RACE AGE GROUPS ARRESTS % OF TOTAL
ARSON ARRESTS
WHITE ADULTS 133 44.3
JUVENILES 99 33.0
BLACK ADULTS 32 10.7
JUVENILES 34 11.3
AMERICAN INDIAN
ADULTS 0 0.0
JUVENILES 0 0.0
ASIAN /OTHER
ADULTS 0 0.0
JUVENILES 1 0.3 UNKNOWN 1 0.3 TOTAL 300 100.0
TABLE 4.8.3 ARSON CLEARANCE RATES
2010 - 2011
TABLE 4.8.4 ARSON ARRESTS BY SEX AND AGE GROUP¹
2011
46.0% of all 2011 arson arrests were of adult males.
16.5% of all 2011 arsons were cleared by arrest or exceptional means.
TABLE 4.8.5
ARSON ARRESTS BY RACE AND AGE GROUP 2011
44.3% of all 2011 arson arrests were of white adults and 10.7% were of black adults.
¹For purposes of this section, a juvenile is defined by the FBI as any person under the age of 18 years of age.
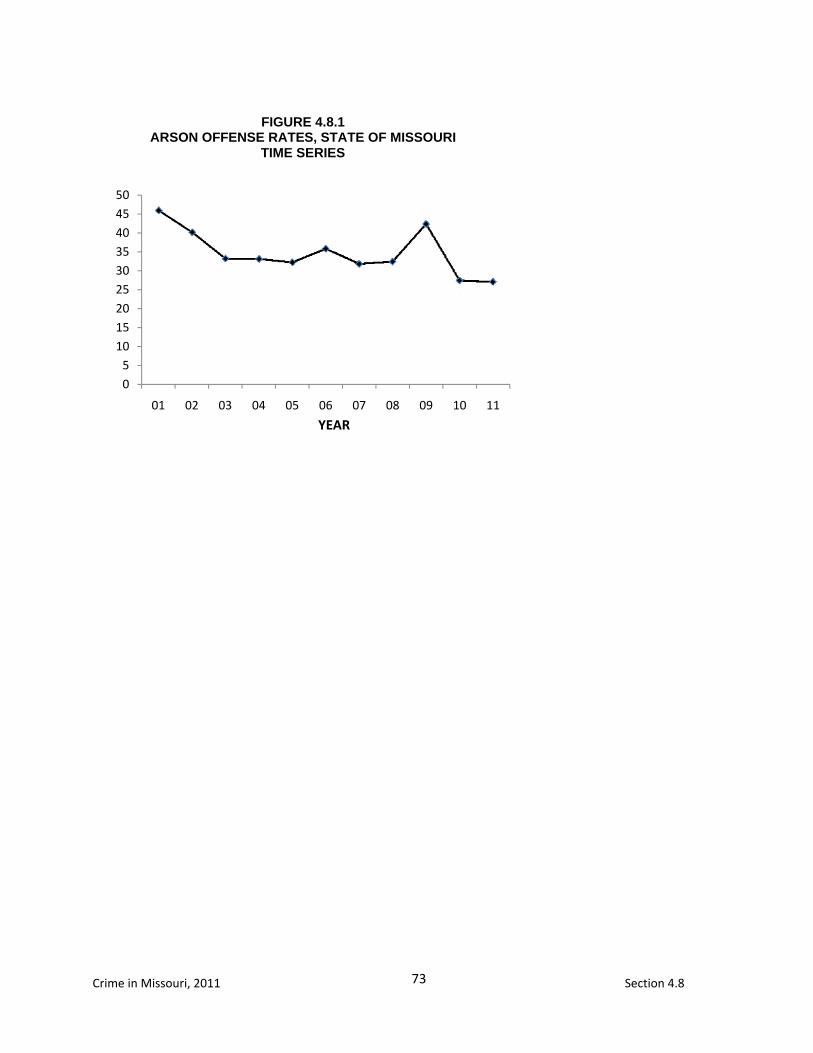
73
Crime in Missouri, 2011 Section 4.8
05
101520253035404550
01 02 03 04 05 06 07 08 09 10 11
FIGURE 4.8.1 ARSON OFFENSE RATES, STATE OF MISSOURI
TIME SERIES
YEAR

75
Crime in Missouri, 2011 Section 5.0
5.0 MISSOURI DOMESTIC VIOLENCE ANALYSIS This section presents data on Domestic Violence activity in
Missouri. Detailed analysis is provided on:
Domestic Violence Incidents
Domestic Violence Related Homicide

77
Crime in Missouri, 2011 Section 5.1
5.1 DOMESTIC VIOLENCE RELATED INCIDENTS
DEFINITION
Domestic violence incidents are reported whether or not an
arrest is made and include any dispute arising between
spouses, former spouses, persons with child(ren) in common
regardless of whether they reside together, persons related
by blood, persons related by marriage, non-married persons
currently residing together, and non-married persons who
have resided together in the past. Domestic violence
incidents are reported when an officer believes a dispute
crosses an abuse threshold as indicated by harassment,
stalking, coercion, assault, sexual assault, battery, or
unlawful imprisonment. Domestic violence incidents are
reported by the highest ranked relationship between victim
and offender, regardless of the number of persons or
potential multiple relationships present during an incident.
2011 Summary
There were 40,613 domestic violence incidents reported in 2011.
In 2011, 7,825 domestic violence incidents involving spouses were reported.
There were 10,348 domestic
violence incidents involving persons residing together in 2011.
In 2011, 7,264 domestic
violence incidents involving blood relatives were reported.
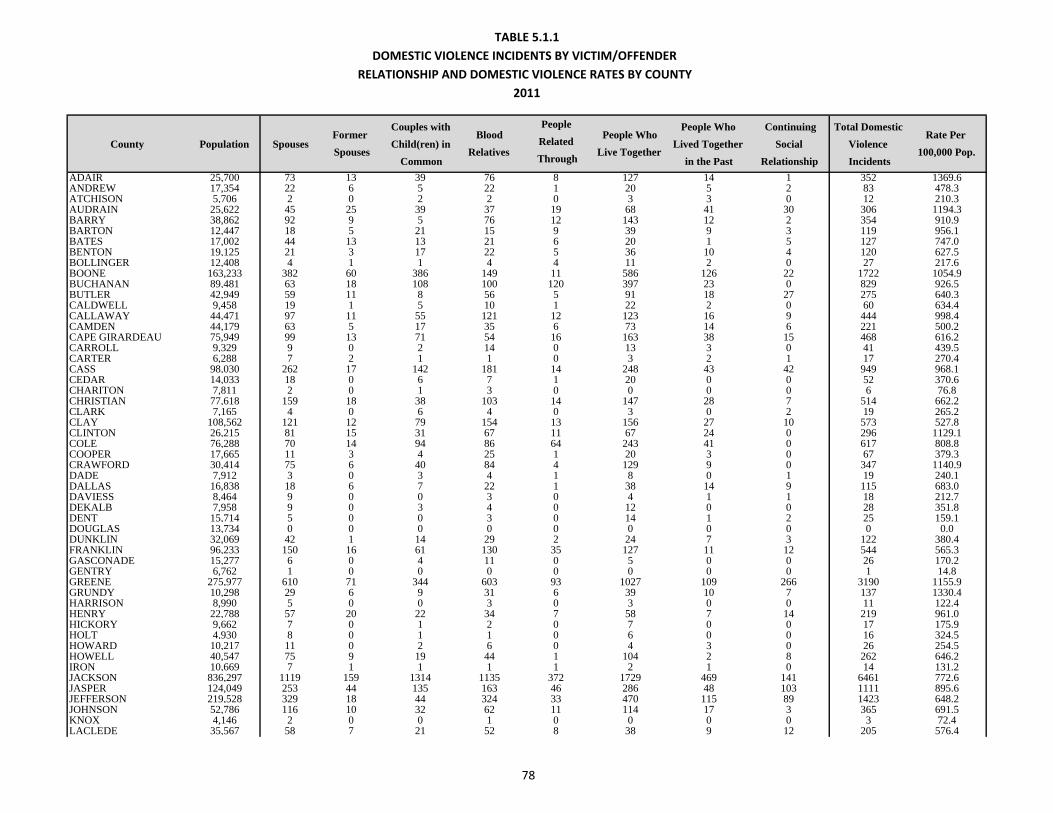
TABLE 5.1.1DOMESTIC VIOLENCE INCIDENTS BY VICTIM/OFFENDER
RELATIONSHIP AND DOMESTIC VIOLENCE RATES BY COUNTY2011
County Population SpousesFormer
Spouses
Couples with
Child(ren) in
Common
Blood
Relatives
People
Related
Through
People Who
Live Together
People Who
Lived Together
in the Past
Continuing
Social
Relationship
Total Domestic
Violence
Incidents
Rate Per
100,000 Pop.
ADAIR 25,700 73 13 39 76 8 127 14 1 352 1369.6ANDREW 17,354 22 6 5 22 1 20 5 2 83 478.3ATCHISON 5,706 2 0 2 2 0 3 3 0 12 210.3AUDRAIN 25,622 45 25 39 37 19 68 41 30 306 1194.3BARRY 38,862 92 9 5 76 12 143 12 2 354 910.9BARTON 12,447 18 5 21 15 9 39 9 3 119 956.1BATES 17,002 44 13 13 21 6 20 1 5 127 747.0BENTON 19,125 21 3 17 22 5 36 10 4 120 627.5BOLLINGER 12,408 4 1 1 4 4 11 2 0 27 217.6BOONE 163,233 382 60 386 149 11 586 126 22 1722 1054.9BUCHANAN 89,481 63 18 108 100 120 397 23 0 829 926.5BUTLER 42,949 59 11 8 56 5 91 18 27 275 640.3CALDWELL 9,458 19 1 5 10 1 22 2 0 60 634.4CALLAWAY 44,471 97 11 55 121 12 123 16 9 444 998.4CAMDEN 44,179 63 5 17 35 6 73 14 6 221 500.2CAPE GIRARDEAU 75,949 99 13 71 54 16 163 38 15 468 616.2CARROLL 9,329 9 0 2 14 0 13 3 0 41 439.5CARTER 6,288 7 2 1 1 0 3 2 1 17 270.4CASS 98,030 262 17 142 181 14 248 43 42 949 968.1CEDAR 14,033 18 0 6 7 1 20 0 0 52 370.6CHARITON 7,811 2 0 1 3 0 0 0 0 6 76.8CHRISTIAN 77,618 159 18 38 103 14 147 28 7 514 662.2CLARK 7,165 4 0 6 4 0 3 0 2 19 265.2CLAY 108,562 121 12 79 154 13 156 27 10 573 527.8CLINTON 26,215 81 15 31 67 11 67 24 0 296 1129.1COLE 76,288 70 14 94 86 64 243 41 0 617 808.8COOPER 17,665 11 3 4 25 1 20 3 0 67 379.3CRAWFORD 30,414 75 6 40 84 4 129 9 0 347 1140.9DADE 7,912 3 0 3 4 1 8 0 1 19 240.1DALLAS 16,838 18 6 7 22 1 38 14 9 115 683.0DAVIESS 8,464 9 0 0 3 0 4 1 1 18 212.7DEKALB 7,958 9 0 3 4 0 12 0 0 28 351.8DENT 15,714 5 0 0 3 0 14 1 2 25 159.1DOUGLAS 13,734 0 0 0 0 0 0 0 0 0 0.0DUNKLIN 32,069 42 1 14 29 2 24 7 3 122 380.4FRANKLIN 96,233 150 16 61 130 35 127 11 12 544 565.3GASCONADE 15,277 6 0 4 11 0 5 0 0 26 170.2GENTRY 6,762 1 0 0 0 0 0 0 0 1 14.8GREENE 275,977 610 71 344 603 93 1027 109 266 3190 1155.9GRUNDY 10,298 29 6 9 31 6 39 10 7 137 1330.4HARRISON 8,990 5 0 0 3 0 3 0 0 11 122.4HENRY 22,788 57 20 22 34 7 58 7 14 219 961.0HICKORY 9,662 7 0 1 2 0 7 0 0 17 175.9HOLT 4,930 8 0 1 1 0 6 0 0 16 324.5HOWARD 10,217 11 0 2 6 0 4 3 0 26 254.5HOWELL 40,547 75 9 19 44 1 104 2 8 262 646.2IRON 10,669 7 1 1 1 1 2 1 0 14 131.2JACKSON 836,297 1119 159 1314 1135 372 1729 469 141 6461 772.6JASPER 124,049 253 44 135 163 46 286 48 103 1111 895.6JEFFERSON 219,528 329 18 44 324 33 470 115 89 1423 648.2JOHNSON 52,786 116 10 32 62 11 114 17 3 365 691.5KNOX 4,146 2 0 0 1 0 0 0 0 3 72.4LACLEDE 35,567 58 7 21 52 8 38 9 12 205 576.4
78
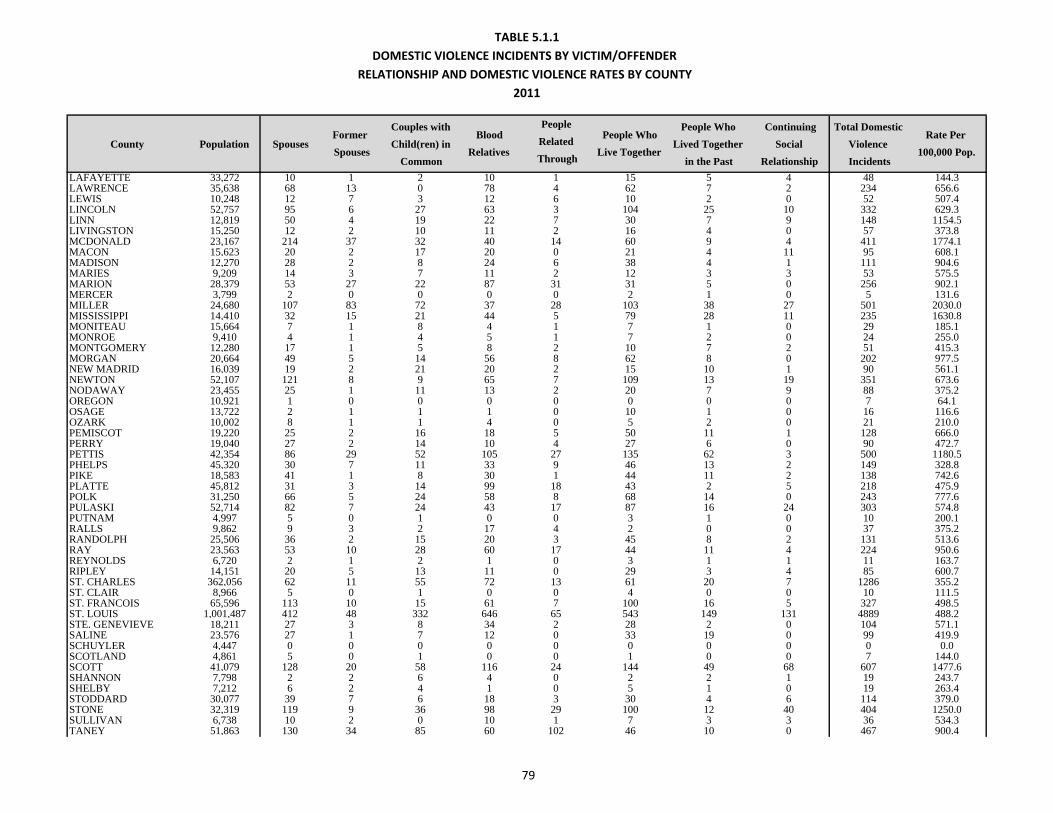
TABLE 5.1.1DOMESTIC VIOLENCE INCIDENTS BY VICTIM/OFFENDER
RELATIONSHIP AND DOMESTIC VIOLENCE RATES BY COUNTY2011
County Population SpousesFormer
Spouses
Couples with
Child(ren) in
Common
Blood
Relatives
People
Related
Through
People Who
Live Together
People Who
Lived Together
in the Past
Continuing
Social
Relationship
Total Domestic
Violence
Incidents
Rate Per
100,000 Pop.
LAFAYETTE 33,272 10 1 2 10 1 15 5 4 48 144.3LAWRENCE 35,638 68 13 0 78 4 62 7 2 234 656.6LEWIS 10,248 12 7 3 12 6 10 2 0 52 507.4LINCOLN 52,757 95 6 27 63 3 104 25 10 332 629.3LINN 12,819 50 4 19 22 7 30 7 9 148 1154.5LIVINGSTON 15,250 12 2 10 11 2 16 4 0 57 373.8MCDONALD 23,167 214 37 32 40 14 60 9 4 411 1774.1MACON 15,623 20 2 17 20 0 21 4 11 95 608.1MADISON 12,270 28 2 8 24 6 38 4 1 111 904.6MARIES 9,209 14 3 7 11 2 12 3 3 53 575.5MARION 28,379 53 27 22 87 31 31 5 0 256 902.1MERCER 3,799 2 0 0 0 0 2 1 0 5 131.6MILLER 24,680 107 83 72 37 28 103 38 27 501 2030.0MISSISSIPPI 14,410 32 15 21 44 5 79 28 11 235 1630.8MONITEAU 15,664 7 1 8 4 1 7 1 0 29 185.1MONROE 9,410 4 1 4 5 1 7 2 0 24 255.0MONTGOMERY 12,280 17 1 5 8 2 10 7 2 51 415.3MORGAN 20,664 49 5 14 56 8 62 8 0 202 977.5NEW MADRID 16,039 19 2 21 20 2 15 10 1 90 561.1NEWTON 52,107 121 8 9 65 7 109 13 19 351 673.6NODAWAY 23,455 25 1 11 13 2 20 7 9 88 375.2OREGON 10,921 1 0 0 0 0 0 0 0 7 64.1OSAGE 13,722 2 1 1 1 0 10 1 0 16 116.6OZARK 10,002 8 1 1 4 0 5 2 0 21 210.0PEMISCOT 19,220 25 2 16 18 5 50 11 1 128 666.0PERRY 19,040 27 2 14 10 4 27 6 0 90 472.7PETTIS 42,354 86 29 52 105 27 135 62 3 500 1180.5PHELPS 45,320 30 7 11 33 9 46 13 2 149 328.8PIKE 18,583 41 1 8 30 1 44 11 2 138 742.6PLATTE 45,812 31 3 14 99 18 43 2 5 218 475.9POLK 31,250 66 5 24 58 8 68 14 0 243 777.6PULASKI 52,714 82 7 24 43 17 87 16 24 303 574.8PUTNAM 4,997 5 0 1 0 0 3 1 0 10 200.1RALLS 9,862 9 3 2 17 4 2 0 0 37 375.2RANDOLPH 25,506 36 2 15 20 3 45 8 2 131 513.6RAY 23,563 53 10 28 60 17 44 11 4 224 950.6REYNOLDS 6,720 2 1 2 1 0 3 1 1 11 163.7RIPLEY 14,151 20 5 13 11 0 29 3 4 85 600.7ST. CHARLES 362,056 62 11 55 72 13 61 20 7 1286 355.2ST. CLAIR 8,966 5 0 1 0 0 4 0 0 10 111.5ST. FRANCOIS 65,596 113 10 15 61 7 100 16 5 327 498.5ST. LOUIS 1,001,487 412 48 332 646 65 543 149 131 4889 488.2STE. GENEVIEVE 18,211 27 3 8 34 2 28 2 0 104 571.1SALINE 23,576 27 1 7 12 0 33 19 0 99 419.9SCHUYLER 4,447 0 0 0 0 0 0 0 0 0 0.0SCOTLAND 4,861 5 0 1 0 0 1 0 0 7 144.0SCOTT 41,079 128 20 58 116 24 144 49 68 607 1477.6SHANNON 7,798 2 2 6 4 0 2 2 1 19 243.7SHELBY 7,212 6 2 4 1 0 5 1 0 19 263.4STODDARD 30,077 39 7 6 18 3 30 4 6 114 379.0STONE 32,319 119 9 36 98 29 100 12 40 404 1250.0SULLIVAN 6,738 10 2 0 10 1 7 3 3 36 534.3TANEY 51,863 130 34 85 60 102 46 10 0 467 900.4
79
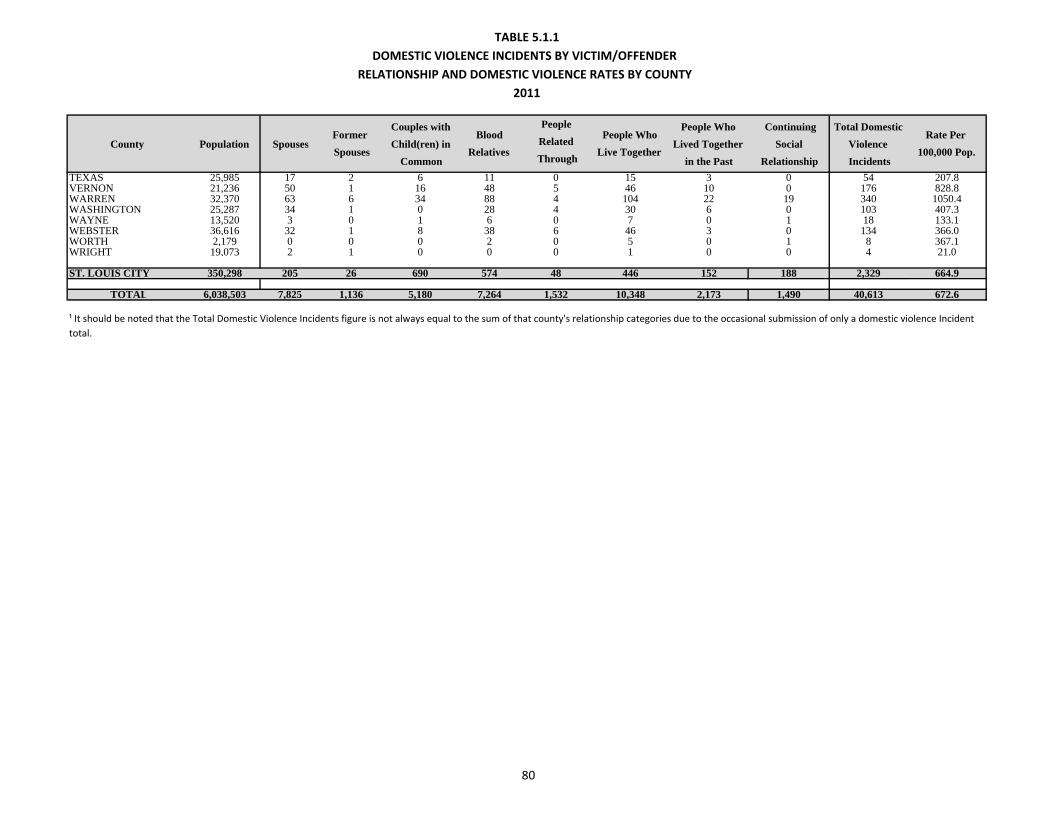
TABLE 5.1.1DOMESTIC VIOLENCE INCIDENTS BY VICTIM/OFFENDER
RELATIONSHIP AND DOMESTIC VIOLENCE RATES BY COUNTY2011
County Population SpousesFormer
Spouses
Couples with
Child(ren) in
Common
Blood
Relatives
People
Related
Through
People Who
Live Together
People Who
Lived Together
in the Past
Continuing
Social
Relationship
Total Domestic
Violence
Incidents
Rate Per
100,000 Pop.
TEXAS 25,985 17 2 6 11 0 15 3 0 54 207.8VERNON 21,236 50 1 16 48 5 46 10 0 176 828.8WARREN 32,370 63 6 34 88 4 104 22 19 340 1050.4WASHINGTON 25,287 34 1 0 28 4 30 6 0 103 407.3WAYNE 13,520 3 0 1 6 0 7 0 1 18 133.1WEBSTER 36,616 32 1 8 38 6 46 3 0 134 366.0WORTH 2,179 0 0 0 2 0 5 0 1 8 367.1WRIGHT 19,073 2 1 0 0 0 1 0 0 4 21.0
ST. LOUIS CITY 350,298 205 26 690 574 48 446 152 188 2,329 664.9
TOTAL 6,038,503 7,825 1,136 5,180 7,264 1,532 10,348 2,173 1,490 40,613 672.6
¹ It should be noted that the Total Domestic Violence Incidents figure is not always equal to the sum of that county's relationship categories due to the occasional submission of only a domestic violence Incident total.
80
81
Crime in Missouri, 2011 Section 5.2
5.2 DOMESTIC VIOLENCE RELATED HOMICIDES
DEFINITION
Domestic violence related homicides are the willful killing of
one human being by another and the victim and offender are
related by blood, related by marriage, reside together, have
resided together in the past, or are romantically involved.
Suicides following domestic violence homicides are not
included. Domestic violence related homicides are reported
on a per victim basis.
2011 Summary
There were 71 domestic violence related homicides reported during 2011.
Wives and girlfriends
were killed in 42.2% of all domestic violence related homicides.
Fathers and sons were
killed in 8.4% of all domestic violence related homicides.

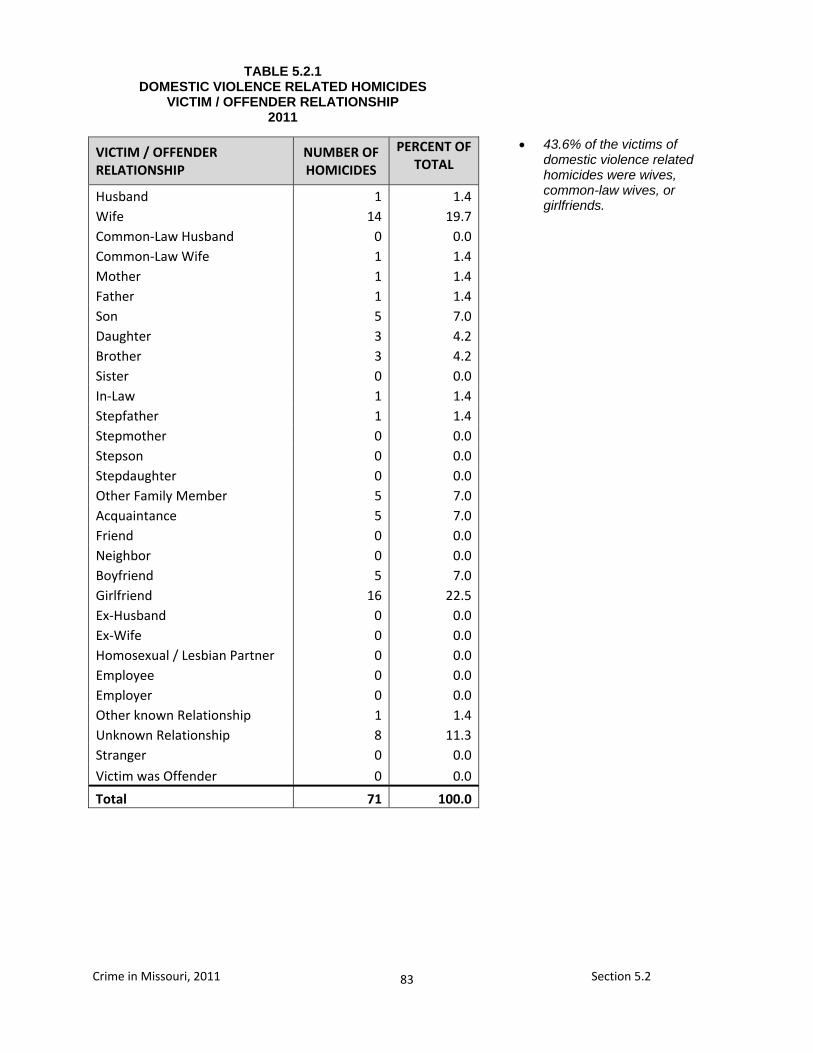
83
Crime in Missouri, 2011 Section 5.2
VICTIM / OFFENDER RELATIONSHIP
NUMBER OF HOMICIDES
PERCENT OF TOTAL
Husband 1 1.4Wife 14 19.7Common-Law Husband 0 0.0Common-Law Wife 1 1.4Mother 1 1.4Father 1 1.4Son 5 7.0Daughter 3 4.2Brother 3 4.2Sister 0 0.0In-Law 1 1.4Stepfather 1 1.4Stepmother 0 0.0Stepson 0 0.0Stepdaughter 0 0.0Other Family Member 5 7.0Acquaintance 5 7.0Friend 0 0.0Neighbor 0 0.0Boyfriend 5 7.0Girlfriend 16 22.5Ex-Husband 0 0.0Ex-Wife 0 0.0Homosexual / Lesbian Partner 0 0.0Employee 0 0.0Employer 0 0.0Other known Relationship 1 1.4Unknown Relationship 8 11.3Stranger 0 0.0
Victim was Offender 0 0.0
Total 71 100.0
TABLE 5.2.1 DOMESTIC VIOLENCE RELATED HOMICIDES
VICTIM / OFFENDER RELATIONSHIP 2011
43.6% of the victims of domestic violence related homicides were wives, common-law wives, or girlfriends.

85
Crime in Missouri, 2011 Section 6.0
6.0 MISSOURI COUNTY AND CITY CRIME AND ARREST ANALYSIS
A series of tables summarizes crime index offenses and
arrest activity associated with law enforcement jurisdictions
in the state of Missouri. These data displays provide an
overview of the extent of the crime problem within Missouri
communities.
Population figures in this section are estimates based on
the last census taken by the U.S. Census Bureau and
represent the population associated with the reporting
agency's jurisdiction. For rural counties, the figures
represent the jurisdiction normally covered by sheriff's
departments and/or county police departments. Crime and
arrest activity reported by state law enforcement agencies is
included in statistics of the jurisdiction where the crime or
arrest occurred. County population figures are computed by
subtracting the population of all incorporated municipalities
within a county having their own law enforcement agencies
from the total population of the county.

87
Crime in Missouri, 2011 Section 6.1
6.1 MISSOURI POLITICAL SUBDIVISION
INDEX CRIME ANALYSIS A series of tables summarizes 2011 crime index offenses
and arrests for all political subdivisions in Missouri. These
tables display statistics for each index crime and rates per
100,000 population. Index crime totals are also provided for
all Missouri counties.
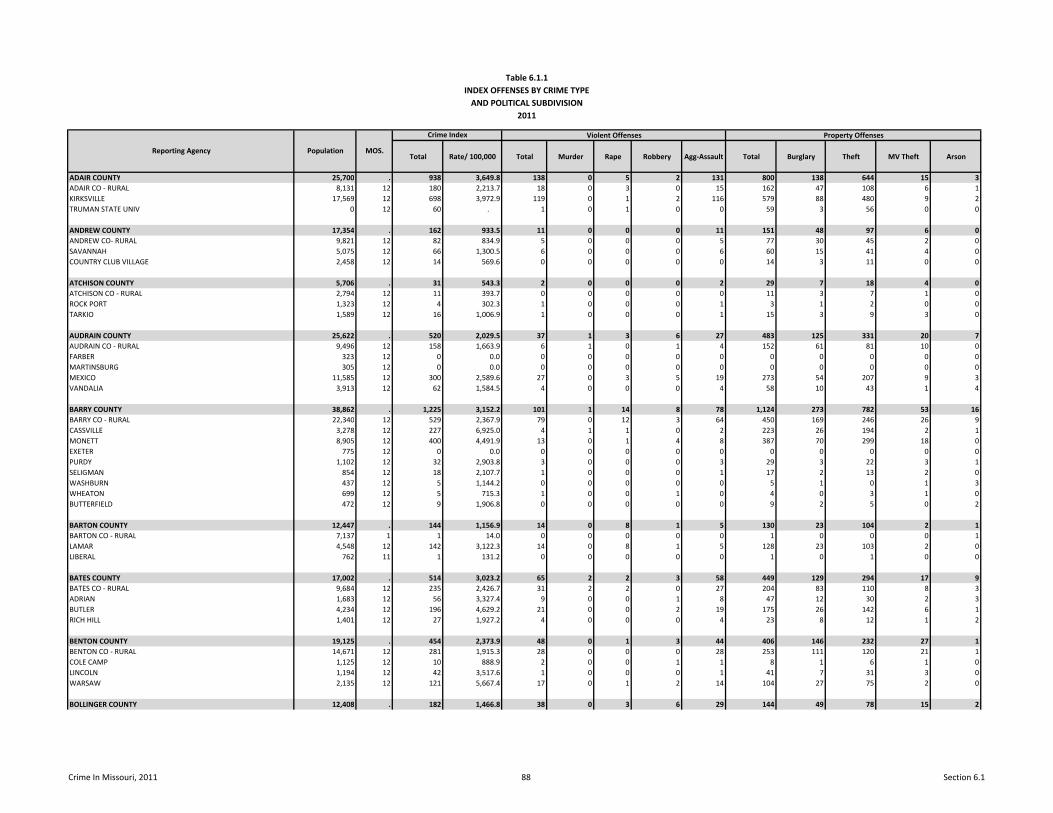
Table 6.1.1INDEX OFFENSES BY CRIME TYPE
AND POLITICAL SUBDIVISION2011
Total Rate/ 100,000 Total Murder Rape Robbery Agg-Assault Total Burglary Theft MV Theft Arson
ADAIR COUNTY 25,700 . 938 3,649.8 138 0 5 2 131 800 138 644 15 3ADAIR CO - RURAL 8,131 12 180 2,213.7 18 0 3 0 15 162 47 108 6 1KIRKSVILLE 17,569 12 698 3,972.9 119 0 1 2 116 579 88 480 9 2TRUMAN STATE UNIV 0 12 60 . 1 0 1 0 0 59 3 56 0 0
ANDREW COUNTY 17,354 . 162 933.5 11 0 0 0 11 151 48 97 6 0ANDREW CO- RURAL 9,821 12 82 834.9 5 0 0 0 5 77 30 45 2 0SAVANNAH 5,075 12 66 1,300.5 6 0 0 0 6 60 15 41 4 0COUNTRY CLUB VILLAGE 2,458 12 14 569.6 0 0 0 0 0 14 3 11 0 0
ATCHISON COUNTY 5,706 . 31 543.3 2 0 0 0 2 29 7 18 4 0ATCHISON CO - RURAL 2,794 12 11 393.7 0 0 0 0 0 11 3 7 1 0ROCK PORT 1,323 12 4 302.3 1 0 0 0 1 3 1 2 0 0TARKIO 1,589 12 16 1,006.9 1 0 0 0 1 15 3 9 3 0
AUDRAIN COUNTY 25,622 . 520 2,029.5 37 1 3 6 27 483 125 331 20 7AUDRAIN CO - RURAL 9,496 12 158 1,663.9 6 1 0 1 4 152 61 81 10 0FARBER 323 12 0 0.0 0 0 0 0 0 0 0 0 0 0MARTINSBURG 305 12 0 0.0 0 0 0 0 0 0 0 0 0 0MEXICO 11,585 12 300 2,589.6 27 0 3 5 19 273 54 207 9 3VANDALIA 3,913 12 62 1,584.5 4 0 0 0 4 58 10 43 1 4
BARRY COUNTY 38,862 . 1,225 3,152.2 101 1 14 8 78 1,124 273 782 53 16BARRY CO - RURAL 22,340 12 529 2,367.9 79 0 12 3 64 450 169 246 26 9CASSVILLE 3,278 12 227 6,925.0 4 1 1 0 2 223 26 194 2 1MONETT 8,905 12 400 4,491.9 13 0 1 4 8 387 70 299 18 0EXETER 775 12 0 0.0 0 0 0 0 0 0 0 0 0 0PURDY 1,102 12 32 2,903.8 3 0 0 0 3 29 3 22 3 1SELIGMAN 854 12 18 2,107.7 1 0 0 0 1 17 2 13 2 0WASHBURN 437 12 5 1,144.2 0 0 0 0 0 5 1 0 1 3WHEATON 699 12 5 715.3 1 0 0 1 0 4 0 3 1 0BUTTERFIELD 472 12 9 1,906.8 0 0 0 0 0 9 2 5 0 2
BARTON COUNTY 12,447 . 144 1,156.9 14 0 8 1 5 130 23 104 2 1BARTON CO - RURAL 7,137 1 1 14.0 0 0 0 0 0 1 0 0 0 1LAMAR 4,548 12 142 3,122.3 14 0 8 1 5 128 23 103 2 0LIBERAL 762 11 1 131.2 0 0 0 0 0 1 0 1 0 0
BATES COUNTY 17,002 . 514 3,023.2 65 2 2 3 58 449 129 294 17 9BATES CO - RURAL 9,684 12 235 2,426.7 31 2 2 0 27 204 83 110 8 3ADRIAN 1,683 12 56 3,327.4 9 0 0 1 8 47 12 30 2 3BUTLER 4,234 12 196 4,629.2 21 0 0 2 19 175 26 142 6 1RICH HILL 1,401 12 27 1,927.2 4 0 0 0 4 23 8 12 1 2
BENTON COUNTY 19,125 . 454 2,373.9 48 0 1 3 44 406 146 232 27 1BENTON CO - RURAL 14,671 12 281 1,915.3 28 0 0 0 28 253 111 120 21 1COLE CAMP 1,125 12 10 888.9 2 0 0 1 1 8 1 6 1 0LINCOLN 1,194 12 42 3,517.6 1 0 0 0 1 41 7 31 3 0WARSAW 2,135 12 121 5,667.4 17 0 1 2 14 104 27 75 2 0
BOLLINGER COUNTY 12,408 . 182 1,466.8 38 0 3 6 29 144 49 78 15 2
Violent Offenses Property Offenses
Reporting Agency Population MOS.
Crime Index
Crime In Missouri, 2011 88 Section 6.1
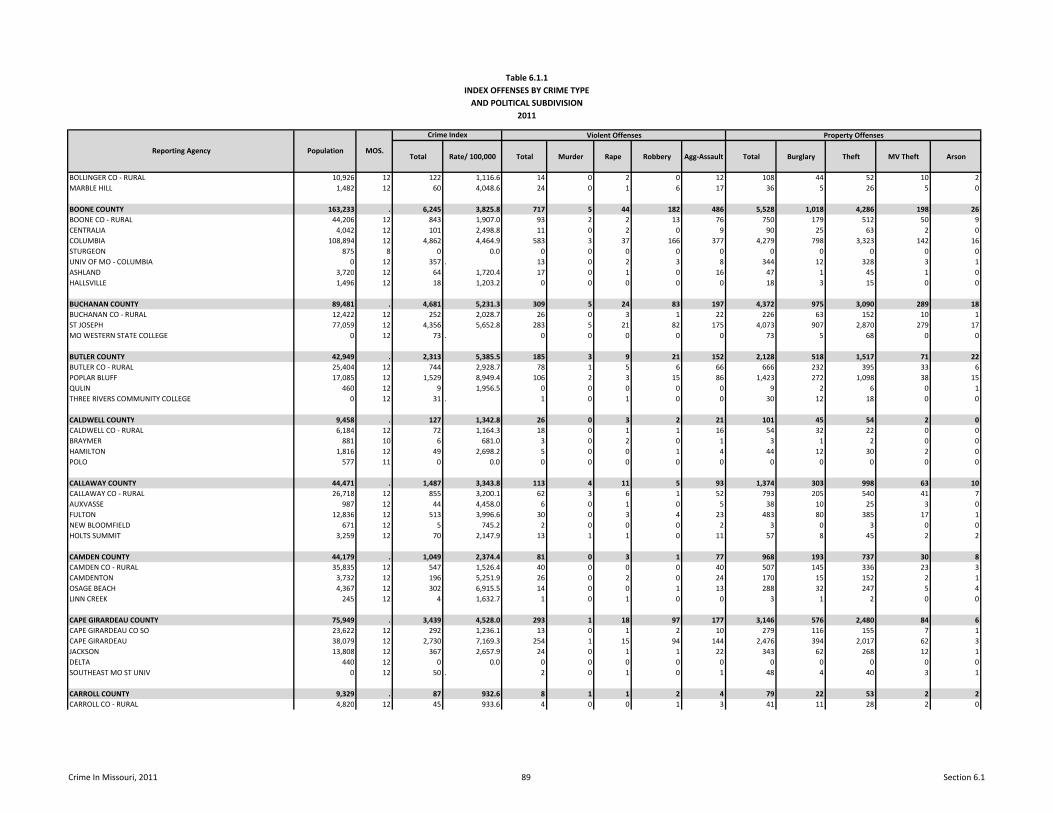
Table 6.1.1INDEX OFFENSES BY CRIME TYPE
AND POLITICAL SUBDIVISION2011
Total Rate/ 100,000 Total Murder Rape Robbery Agg-Assault Total Burglary Theft MV Theft Arson
Violent Offenses Property Offenses
Reporting Agency Population MOS.
Crime Index
BOLLINGER CO - RURAL 10,926 12 122 1,116.6 14 0 2 0 12 108 44 52 10 2MARBLE HILL 1,482 12 60 4,048.6 24 0 1 6 17 36 5 26 5 0
BOONE COUNTY 163,233 . 6,245 3,825.8 717 5 44 182 486 5,528 1,018 4,286 198 26BOONE CO - RURAL 44,206 12 843 1,907.0 93 2 2 13 76 750 179 512 50 9CENTRALIA 4,042 12 101 2,498.8 11 0 2 0 9 90 25 63 2 0COLUMBIA 108,894 12 4,862 4,464.9 583 3 37 166 377 4,279 798 3,323 142 16STURGEON 875 8 0 0.0 0 0 0 0 0 0 0 0 0 0UNIV OF MO - COLUMBIA 0 12 357 . 13 0 2 3 8 344 12 328 3 1ASHLAND 3,720 12 64 1,720.4 17 0 1 0 16 47 1 45 1 0HALLSVILLE 1,496 12 18 1,203.2 0 0 0 0 0 18 3 15 0 0
BUCHANAN COUNTY 89,481 . 4,681 5,231.3 309 5 24 83 197 4,372 975 3,090 289 18BUCHANAN CO - RURAL 12,422 12 252 2,028.7 26 0 3 1 22 226 63 152 10 1ST JOSEPH 77,059 12 4,356 5,652.8 283 5 21 82 175 4,073 907 2,870 279 17MO WESTERN STATE COLLEGE 0 12 73 . 0 0 0 0 0 73 5 68 0 0
BUTLER COUNTY 42,949 . 2,313 5,385.5 185 3 9 21 152 2,128 518 1,517 71 22BUTLER CO - RURAL 25,404 12 744 2,928.7 78 1 5 6 66 666 232 395 33 6POPLAR BLUFF 17,085 12 1,529 8,949.4 106 2 3 15 86 1,423 272 1,098 38 15QULIN 460 12 9 1,956.5 0 0 0 0 0 9 2 6 0 1THREE RIVERS COMMUNITY COLLEGE 0 12 31 . 1 0 1 0 0 30 12 18 0 0
CALDWELL COUNTY 9,458 . 127 1,342.8 26 0 3 2 21 101 45 54 2 0CALDWELL CO - RURAL 6,184 12 72 1,164.3 18 0 1 1 16 54 32 22 0 0BRAYMER 881 10 6 681.0 3 0 2 0 1 3 1 2 0 0HAMILTON 1,816 12 49 2,698.2 5 0 0 1 4 44 12 30 2 0POLO 577 11 0 0.0 0 0 0 0 0 0 0 0 0 0
CALLAWAY COUNTY 44,471 . 1,487 3,343.8 113 4 11 5 93 1,374 303 998 63 10CALLAWAY CO - RURAL 26,718 12 855 3,200.1 62 3 6 1 52 793 205 540 41 7AUXVASSE 987 12 44 4,458.0 6 0 1 0 5 38 10 25 3 0FULTON 12,836 12 513 3,996.6 30 0 3 4 23 483 80 385 17 1NEW BLOOMFIELD 671 12 5 745.2 2 0 0 0 2 3 0 3 0 0HOLTS SUMMIT 3,259 12 70 2,147.9 13 1 1 0 11 57 8 45 2 2
CAMDEN COUNTY 44,179 . 1,049 2,374.4 81 0 3 1 77 968 193 737 30 8CAMDEN CO - RURAL 35,835 12 547 1,526.4 40 0 0 0 40 507 145 336 23 3CAMDENTON 3,732 12 196 5,251.9 26 0 2 0 24 170 15 152 2 1OSAGE BEACH 4,367 12 302 6,915.5 14 0 0 1 13 288 32 247 5 4LINN CREEK 245 12 4 1,632.7 1 0 1 0 0 3 1 2 0 0
CAPE GIRARDEAU COUNTY 75,949 . 3,439 4,528.0 293 1 18 97 177 3,146 576 2,480 84 6CAPE GIRARDEAU CO SO 23,622 12 292 1,236.1 13 0 1 2 10 279 116 155 7 1CAPE GIRARDEAU 38,079 12 2,730 7,169.3 254 1 15 94 144 2,476 394 2,017 62 3JACKSON 13,808 12 367 2,657.9 24 0 1 1 22 343 62 268 12 1DELTA 440 12 0 0.0 0 0 0 0 0 0 0 0 0 0SOUTHEAST MO ST UNIV 0 12 50 . 2 0 1 0 1 48 4 40 3 1
CARROLL COUNTY 9,329 . 87 932.6 8 1 1 2 4 79 22 53 2 2CARROLL CO - RURAL 4,820 12 45 933.6 4 0 0 1 3 41 11 28 2 0
Crime In Missouri, 2011 89 Section 6.1
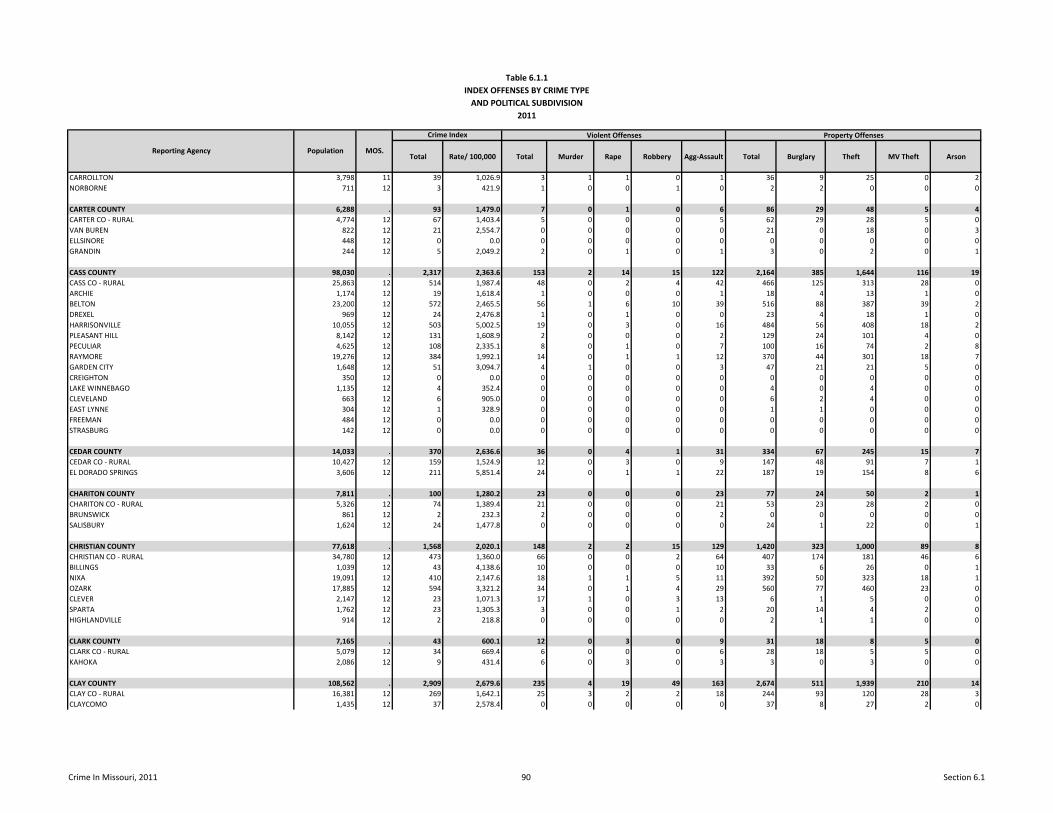
Table 6.1.1INDEX OFFENSES BY CRIME TYPE
AND POLITICAL SUBDIVISION2011
Total Rate/ 100,000 Total Murder Rape Robbery Agg-Assault Total Burglary Theft MV Theft Arson
Violent Offenses Property Offenses
Reporting Agency Population MOS.
Crime Index
CARROLLTON 3,798 11 39 1,026.9 3 1 1 0 1 36 9 25 0 2NORBORNE 711 12 3 421.9 1 0 0 1 0 2 2 0 0 0
CARTER COUNTY 6,288 . 93 1,479.0 7 0 1 0 6 86 29 48 5 4CARTER CO - RURAL 4,774 12 67 1,403.4 5 0 0 0 5 62 29 28 5 0VAN BUREN 822 12 21 2,554.7 0 0 0 0 0 21 0 18 0 3ELLSINORE 448 12 0 0.0 0 0 0 0 0 0 0 0 0 0GRANDIN 244 12 5 2,049.2 2 0 1 0 1 3 0 2 0 1
CASS COUNTY 98,030 . 2,317 2,363.6 153 2 14 15 122 2,164 385 1,644 116 19CASS CO - RURAL 25,863 12 514 1,987.4 48 0 2 4 42 466 125 313 28 0ARCHIE 1,174 12 19 1,618.4 1 0 0 0 1 18 4 13 1 0BELTON 23,200 12 572 2,465.5 56 1 6 10 39 516 88 387 39 2DREXEL 969 12 24 2,476.8 1 0 1 0 0 23 4 18 1 0HARRISONVILLE 10,055 12 503 5,002.5 19 0 3 0 16 484 56 408 18 2PLEASANT HILL 8,142 12 131 1,608.9 2 0 0 0 2 129 24 101 4 0PECULIAR 4,625 12 108 2,335.1 8 0 1 0 7 100 16 74 2 8RAYMORE 19,276 12 384 1,992.1 14 0 1 1 12 370 44 301 18 7GARDEN CITY 1,648 12 51 3,094.7 4 1 0 0 3 47 21 21 5 0CREIGHTON 350 12 0 0.0 0 0 0 0 0 0 0 0 0 0LAKE WINNEBAGO 1,135 12 4 352.4 0 0 0 0 0 4 0 4 0 0CLEVELAND 663 12 6 905.0 0 0 0 0 0 6 2 4 0 0EAST LYNNE 304 12 1 328.9 0 0 0 0 0 1 1 0 0 0FREEMAN 484 12 0 0.0 0 0 0 0 0 0 0 0 0 0STRASBURG 142 12 0 0.0 0 0 0 0 0 0 0 0 0 0
CEDAR COUNTY 14,033 . 370 2,636.6 36 0 4 1 31 334 67 245 15 7CEDAR CO - RURAL 10,427 12 159 1,524.9 12 0 3 0 9 147 48 91 7 1EL DORADO SPRINGS 3,606 12 211 5,851.4 24 0 1 1 22 187 19 154 8 6
CHARITON COUNTY 7,811 . 100 1,280.2 23 0 0 0 23 77 24 50 2 1CHARITON CO - RURAL 5,326 12 74 1,389.4 21 0 0 0 21 53 23 28 2 0BRUNSWICK 861 12 2 232.3 2 0 0 0 2 0 0 0 0 0SALISBURY 1,624 12 24 1,477.8 0 0 0 0 0 24 1 22 0 1
CHRISTIAN COUNTY 77,618 . 1,568 2,020.1 148 2 2 15 129 1,420 323 1,000 89 8CHRISTIAN CO - RURAL 34,780 12 473 1,360.0 66 0 0 2 64 407 174 181 46 6BILLINGS 1,039 12 43 4,138.6 10 0 0 0 10 33 6 26 0 1NIXA 19,091 12 410 2,147.6 18 1 1 5 11 392 50 323 18 1OZARK 17,885 12 594 3,321.2 34 0 1 4 29 560 77 460 23 0CLEVER 2,147 12 23 1,071.3 17 1 0 3 13 6 1 5 0 0SPARTA 1,762 12 23 1,305.3 3 0 0 1 2 20 14 4 2 0HIGHLANDVILLE 914 12 2 218.8 0 0 0 0 0 2 1 1 0 0
CLARK COUNTY 7,165 . 43 600.1 12 0 3 0 9 31 18 8 5 0CLARK CO - RURAL 5,079 12 34 669.4 6 0 0 0 6 28 18 5 5 0KAHOKA 2,086 12 9 431.4 6 0 3 0 3 3 0 3 0 0
CLAY COUNTY 108,562 . 2,909 2,679.6 235 4 19 49 163 2,674 511 1,939 210 14CLAY CO - RURAL 16,381 12 269 1,642.1 25 3 2 2 18 244 93 120 28 3CLAYCOMO 1,435 12 37 2,578.4 0 0 0 0 0 37 8 27 2 0
Crime In Missouri, 2011 90 Section 6.1
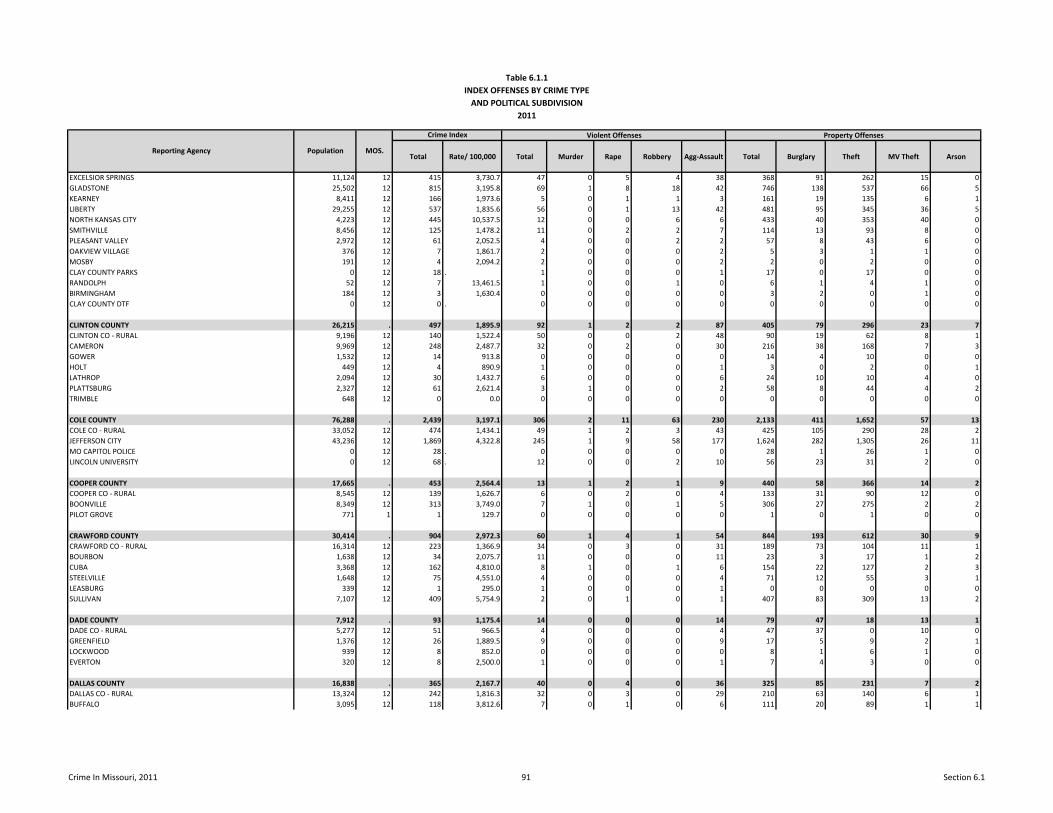
Table 6.1.1INDEX OFFENSES BY CRIME TYPE
AND POLITICAL SUBDIVISION2011
Total Rate/ 100,000 Total Murder Rape Robbery Agg-Assault Total Burglary Theft MV Theft Arson
Violent Offenses Property Offenses
Reporting Agency Population MOS.
Crime Index
EXCELSIOR SPRINGS 11,124 12 415 3,730.7 47 0 5 4 38 368 91 262 15 0GLADSTONE 25,502 12 815 3,195.8 69 1 8 18 42 746 138 537 66 5KEARNEY 8,411 12 166 1,973.6 5 0 1 1 3 161 19 135 6 1LIBERTY 29,255 12 537 1,835.6 56 0 1 13 42 481 95 345 36 5NORTH KANSAS CITY 4,223 12 445 10,537.5 12 0 0 6 6 433 40 353 40 0SMITHVILLE 8,456 12 125 1,478.2 11 0 2 2 7 114 13 93 8 0PLEASANT VALLEY 2,972 12 61 2,052.5 4 0 0 2 2 57 8 43 6 0OAKVIEW VILLAGE 376 12 7 1,861.7 2 0 0 0 2 5 3 1 1 0MOSBY 191 12 4 2,094.2 2 0 0 0 2 2 0 2 0 0CLAY COUNTY PARKS 0 12 18 . 1 0 0 0 1 17 0 17 0 0RANDOLPH 52 12 7 13,461.5 1 0 0 1 0 6 1 4 1 0BIRMINGHAM 184 12 3 1,630.4 0 0 0 0 0 3 2 0 1 0CLAY COUNTY DTF 0 12 0 . 0 0 0 0 0 0 0 0 0 0
CLINTON COUNTY 26,215 . 497 1,895.9 92 1 2 2 87 405 79 296 23 7CLINTON CO - RURAL 9,196 12 140 1,522.4 50 0 0 2 48 90 19 62 8 1CAMERON 9,969 12 248 2,487.7 32 0 2 0 30 216 38 168 7 3GOWER 1,532 12 14 913.8 0 0 0 0 0 14 4 10 0 0HOLT 449 12 4 890.9 1 0 0 0 1 3 0 2 0 1LATHROP 2,094 12 30 1,432.7 6 0 0 0 6 24 10 10 4 0PLATTSBURG 2,327 12 61 2,621.4 3 1 0 0 2 58 8 44 4 2TRIMBLE 648 12 0 0.0 0 0 0 0 0 0 0 0 0 0
COLE COUNTY 76,288 . 2,439 3,197.1 306 2 11 63 230 2,133 411 1,652 57 13COLE CO - RURAL 33,052 12 474 1,434.1 49 1 2 3 43 425 105 290 28 2JEFFERSON CITY 43,236 12 1,869 4,322.8 245 1 9 58 177 1,624 282 1,305 26 11MO CAPITOL POLICE 0 12 28 . 0 0 0 0 0 28 1 26 1 0LINCOLN UNIVERSITY 0 12 68 . 12 0 0 2 10 56 23 31 2 0
COOPER COUNTY 17,665 . 453 2,564.4 13 1 2 1 9 440 58 366 14 2COOPER CO - RURAL 8,545 12 139 1,626.7 6 0 2 0 4 133 31 90 12 0BOONVILLE 8,349 12 313 3,749.0 7 1 0 1 5 306 27 275 2 2PILOT GROVE 771 1 1 129.7 0 0 0 0 0 1 0 1 0 0
CRAWFORD COUNTY 30,414 . 904 2,972.3 60 1 4 1 54 844 193 612 30 9CRAWFORD CO - RURAL 16,314 12 223 1,366.9 34 0 3 0 31 189 73 104 11 1BOURBON 1,638 12 34 2,075.7 11 0 0 0 11 23 3 17 1 2CUBA 3,368 12 162 4,810.0 8 1 0 1 6 154 22 127 2 3STEELVILLE 1,648 12 75 4,551.0 4 0 0 0 4 71 12 55 3 1LEASBURG 339 12 1 295.0 1 0 0 0 1 0 0 0 0 0SULLIVAN 7,107 12 409 5,754.9 2 0 1 0 1 407 83 309 13 2
DADE COUNTY 7,912 . 93 1,175.4 14 0 0 0 14 79 47 18 13 1DADE CO - RURAL 5,277 12 51 966.5 4 0 0 0 4 47 37 0 10 0GREENFIELD 1,376 12 26 1,889.5 9 0 0 0 9 17 5 9 2 1LOCKWOOD 939 12 8 852.0 0 0 0 0 0 8 1 6 1 0EVERTON 320 12 8 2,500.0 1 0 0 0 1 7 4 3 0 0
DALLAS COUNTY 16,838 . 365 2,167.7 40 0 4 0 36 325 85 231 7 2DALLAS CO - RURAL 13,324 12 242 1,816.3 32 0 3 0 29 210 63 140 6 1BUFFALO 3,095 12 118 3,812.6 7 0 1 0 6 111 20 89 1 1
Crime In Missouri, 2011 91 Section 6.1
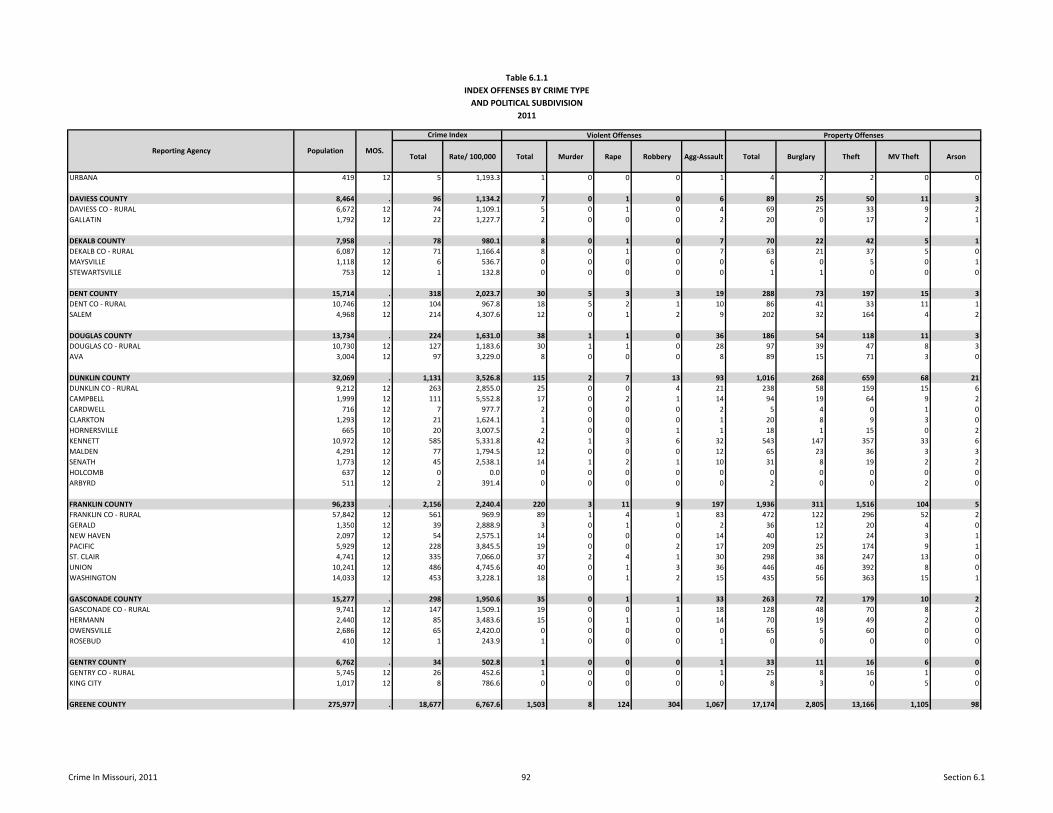
Table 6.1.1INDEX OFFENSES BY CRIME TYPE
AND POLITICAL SUBDIVISION2011
Total Rate/ 100,000 Total Murder Rape Robbery Agg-Assault Total Burglary Theft MV Theft Arson
Violent Offenses Property Offenses
Reporting Agency Population MOS.
Crime Index
URBANA 419 12 5 1,193.3 1 0 0 0 1 4 2 2 0 0
DAVIESS COUNTY 8,464 . 96 1,134.2 7 0 1 0 6 89 25 50 11 3DAVIESS CO - RURAL 6,672 12 74 1,109.1 5 0 1 0 4 69 25 33 9 2GALLATIN 1,792 12 22 1,227.7 2 0 0 0 2 20 0 17 2 1
DEKALB COUNTY 7,958 . 78 980.1 8 0 1 0 7 70 22 42 5 1DEKALB CO - RURAL 6,087 12 71 1,166.4 8 0 1 0 7 63 21 37 5 0MAYSVILLE 1,118 12 6 536.7 0 0 0 0 0 6 0 5 0 1STEWARTSVILLE 753 12 1 132.8 0 0 0 0 0 1 1 0 0 0
DENT COUNTY 15,714 . 318 2,023.7 30 5 3 3 19 288 73 197 15 3DENT CO - RURAL 10,746 12 104 967.8 18 5 2 1 10 86 41 33 11 1SALEM 4,968 12 214 4,307.6 12 0 1 2 9 202 32 164 4 2
DOUGLAS COUNTY 13,734 . 224 1,631.0 38 1 1 0 36 186 54 118 11 3DOUGLAS CO - RURAL 10,730 12 127 1,183.6 30 1 1 0 28 97 39 47 8 3AVA 3,004 12 97 3,229.0 8 0 0 0 8 89 15 71 3 0
DUNKLIN COUNTY 32,069 . 1,131 3,526.8 115 2 7 13 93 1,016 268 659 68 21DUNKLIN CO - RURAL 9,212 12 263 2,855.0 25 0 0 4 21 238 58 159 15 6CAMPBELL 1,999 12 111 5,552.8 17 0 2 1 14 94 19 64 9 2CARDWELL 716 12 7 977.7 2 0 0 0 2 5 4 0 1 0CLARKTON 1,293 12 21 1,624.1 1 0 0 0 1 20 8 9 3 0HORNERSVILLE 665 10 20 3,007.5 2 0 0 1 1 18 1 15 0 2KENNETT 10,972 12 585 5,331.8 42 1 3 6 32 543 147 357 33 6MALDEN 4,291 12 77 1,794.5 12 0 0 0 12 65 23 36 3 3SENATH 1,773 12 45 2,538.1 14 1 2 1 10 31 8 19 2 2HOLCOMB 637 12 0 0.0 0 0 0 0 0 0 0 0 0 0ARBYRD 511 12 2 391.4 0 0 0 0 0 2 0 0 2 0
FRANKLIN COUNTY 96,233 . 2,156 2,240.4 220 3 11 9 197 1,936 311 1,516 104 5FRANKLIN CO - RURAL 57,842 12 561 969.9 89 1 4 1 83 472 122 296 52 2GERALD 1,350 12 39 2,888.9 3 0 1 0 2 36 12 20 4 0NEW HAVEN 2,097 12 54 2,575.1 14 0 0 0 14 40 12 24 3 1PACIFIC 5,929 12 228 3,845.5 19 0 0 2 17 209 25 174 9 1ST. CLAIR 4,741 12 335 7,066.0 37 2 4 1 30 298 38 247 13 0UNION 10,241 12 486 4,745.6 40 0 1 3 36 446 46 392 8 0WASHINGTON 14,033 12 453 3,228.1 18 0 1 2 15 435 56 363 15 1
GASCONADE COUNTY 15,277 . 298 1,950.6 35 0 1 1 33 263 72 179 10 2GASCONADE CO - RURAL 9,741 12 147 1,509.1 19 0 0 1 18 128 48 70 8 2HERMANN 2,440 12 85 3,483.6 15 0 1 0 14 70 19 49 2 0OWENSVILLE 2,686 12 65 2,420.0 0 0 0 0 0 65 5 60 0 0ROSEBUD 410 12 1 243.9 1 0 0 0 1 0 0 0 0 0
GENTRY COUNTY 6,762 . 34 502.8 1 0 0 0 1 33 11 16 6 0GENTRY CO - RURAL 5,745 12 26 452.6 1 0 0 0 1 25 8 16 1 0KING CITY 1,017 12 8 786.6 0 0 0 0 0 8 3 0 5 0
GREENE COUNTY 275,977 . 18,677 6,767.6 1,503 8 124 304 1,067 17,174 2,805 13,166 1,105 98
Crime In Missouri, 2011 92 Section 6.1
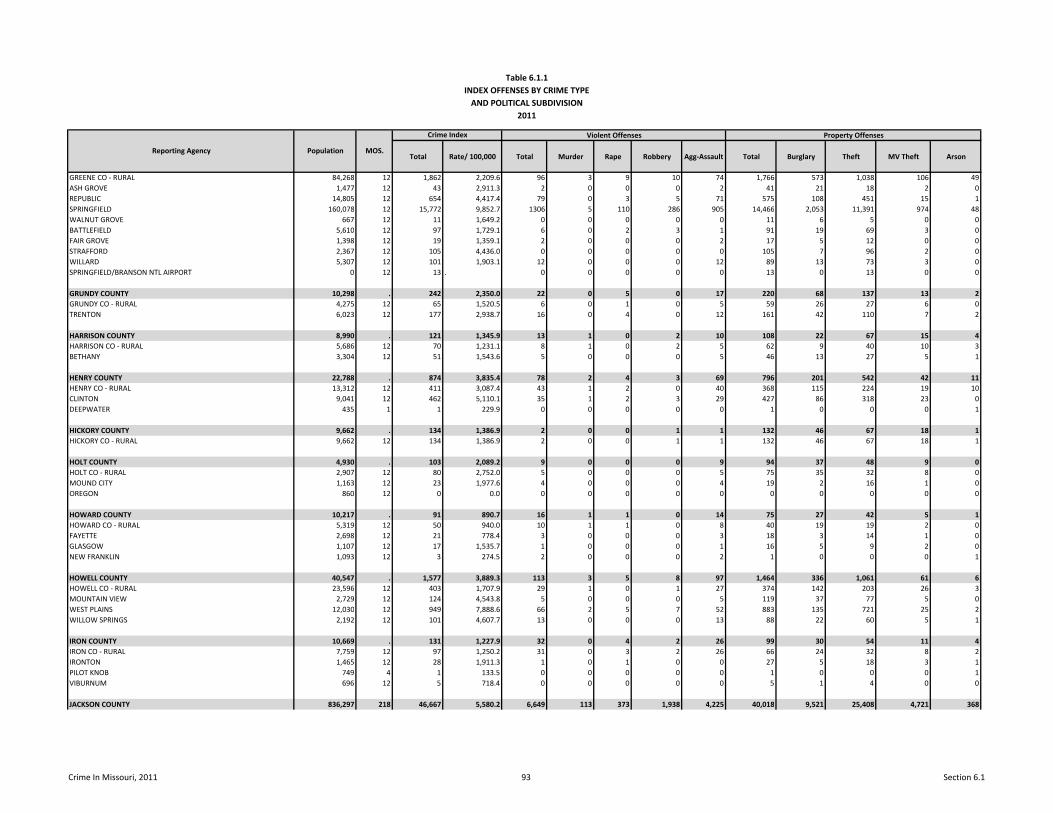
Table 6.1.1INDEX OFFENSES BY CRIME TYPE
AND POLITICAL SUBDIVISION2011
Total Rate/ 100,000 Total Murder Rape Robbery Agg-Assault Total Burglary Theft MV Theft Arson
Violent Offenses Property Offenses
Reporting Agency Population MOS.
Crime Index
GREENE CO - RURAL 84,268 12 1,862 2,209.6 96 3 9 10 74 1,766 573 1,038 106 49ASH GROVE 1,477 12 43 2,911.3 2 0 0 0 2 41 21 18 2 0REPUBLIC 14,805 12 654 4,417.4 79 0 3 5 71 575 108 451 15 1SPRINGFIELD 160,078 12 15,772 9,852.7 1306 5 110 286 905 14,466 2,053 11,391 974 48WALNUT GROVE 667 12 11 1,649.2 0 0 0 0 0 11 6 5 0 0BATTLEFIELD 5,610 12 97 1,729.1 6 0 2 3 1 91 19 69 3 0FAIR GROVE 1,398 12 19 1,359.1 2 0 0 0 2 17 5 12 0 0STRAFFORD 2,367 12 105 4,436.0 0 0 0 0 0 105 7 96 2 0WILLARD 5,307 12 101 1,903.1 12 0 0 0 12 89 13 73 3 0SPRINGFIELD/BRANSON NTL AIRPORT 0 12 13 . 0 0 0 0 0 13 0 13 0 0
GRUNDY COUNTY 10,298 . 242 2,350.0 22 0 5 0 17 220 68 137 13 2GRUNDY CO - RURAL 4,275 12 65 1,520.5 6 0 1 0 5 59 26 27 6 0TRENTON 6,023 12 177 2,938.7 16 0 4 0 12 161 42 110 7 2
HARRISON COUNTY 8,990 . 121 1,345.9 13 1 0 2 10 108 22 67 15 4HARRISON CO - RURAL 5,686 12 70 1,231.1 8 1 0 2 5 62 9 40 10 3BETHANY 3,304 12 51 1,543.6 5 0 0 0 5 46 13 27 5 1
HENRY COUNTY 22,788 . 874 3,835.4 78 2 4 3 69 796 201 542 42 11HENRY CO - RURAL 13,312 12 411 3,087.4 43 1 2 0 40 368 115 224 19 10CLINTON 9,041 12 462 5,110.1 35 1 2 3 29 427 86 318 23 0DEEPWATER 435 1 1 229.9 0 0 0 0 0 1 0 0 0 1
HICKORY COUNTY 9,662 . 134 1,386.9 2 0 0 1 1 132 46 67 18 1HICKORY CO - RURAL 9,662 12 134 1,386.9 2 0 0 1 1 132 46 67 18 1
HOLT COUNTY 4,930 . 103 2,089.2 9 0 0 0 9 94 37 48 9 0HOLT CO - RURAL 2,907 12 80 2,752.0 5 0 0 0 5 75 35 32 8 0MOUND CITY 1,163 12 23 1,977.6 4 0 0 0 4 19 2 16 1 0OREGON 860 12 0 0.0 0 0 0 0 0 0 0 0 0 0
HOWARD COUNTY 10,217 . 91 890.7 16 1 1 0 14 75 27 42 5 1HOWARD CO - RURAL 5,319 12 50 940.0 10 1 1 0 8 40 19 19 2 0FAYETTE 2,698 12 21 778.4 3 0 0 0 3 18 3 14 1 0GLASGOW 1,107 12 17 1,535.7 1 0 0 0 1 16 5 9 2 0NEW FRANKLIN 1,093 12 3 274.5 2 0 0 0 2 1 0 0 0 1
HOWELL COUNTY 40,547 . 1,577 3,889.3 113 3 5 8 97 1,464 336 1,061 61 6HOWELL CO - RURAL 23,596 12 403 1,707.9 29 1 0 1 27 374 142 203 26 3MOUNTAIN VIEW 2,729 12 124 4,543.8 5 0 0 0 5 119 37 77 5 0WEST PLAINS 12,030 12 949 7,888.6 66 2 5 7 52 883 135 721 25 2WILLOW SPRINGS 2,192 12 101 4,607.7 13 0 0 0 13 88 22 60 5 1
IRON COUNTY 10,669 . 131 1,227.9 32 0 4 2 26 99 30 54 11 4IRON CO - RURAL 7,759 12 97 1,250.2 31 0 3 2 26 66 24 32 8 2IRONTON 1,465 12 28 1,911.3 1 0 1 0 0 27 5 18 3 1PILOT KNOB 749 4 1 133.5 0 0 0 0 0 1 0 0 0 1VIBURNUM 696 12 5 718.4 0 0 0 0 0 5 1 4 0 0
JACKSON COUNTY 836,297 218 46,667 5,580.2 6,649 113 373 1,938 4,225 40,018 9,521 25,408 4,721 368
Crime In Missouri, 2011 93 Section 6.1
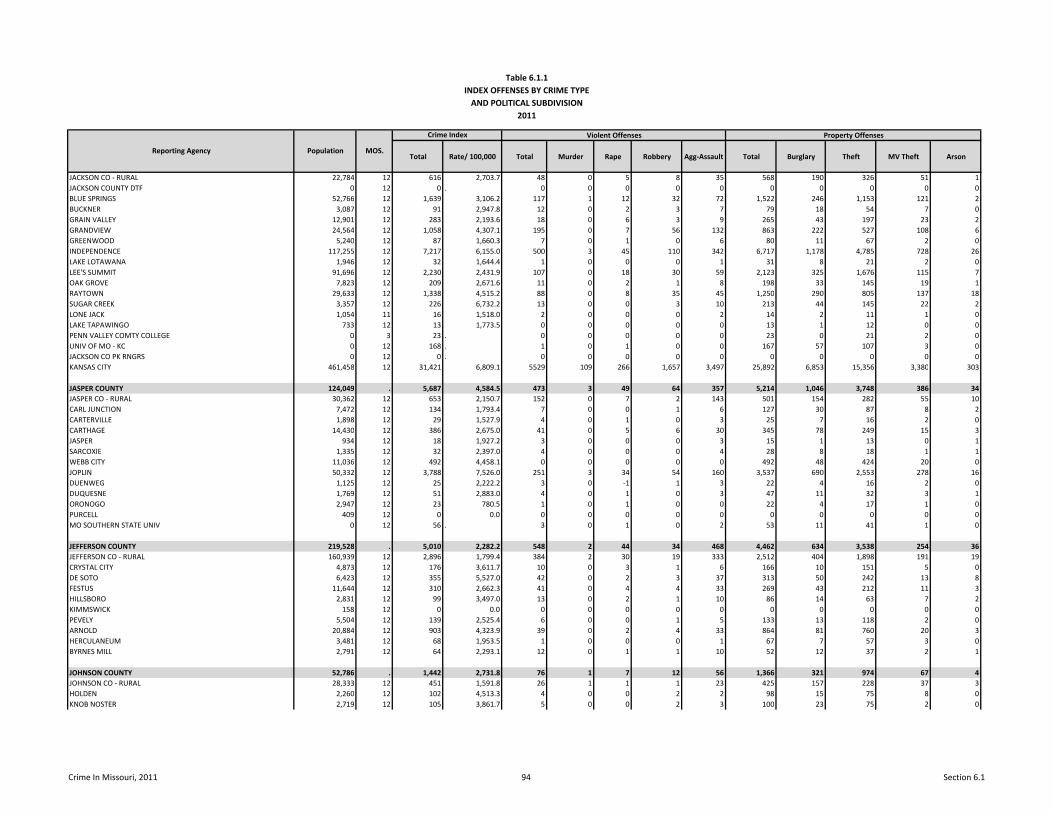
Table 6.1.1INDEX OFFENSES BY CRIME TYPE
AND POLITICAL SUBDIVISION2011
Total Rate/ 100,000 Total Murder Rape Robbery Agg-Assault Total Burglary Theft MV Theft Arson
Violent Offenses Property Offenses
Reporting Agency Population MOS.
Crime Index
JACKSON CO - RURAL 22,784 12 616 2,703.7 48 0 5 8 35 568 190 326 51 1JACKSON COUNTY DTF 0 12 0 . 0 0 0 0 0 0 0 0 0 0BLUE SPRINGS 52,766 12 1,639 3,106.2 117 1 12 32 72 1,522 246 1,153 121 2BUCKNER 3,087 12 91 2,947.8 12 0 2 3 7 79 18 54 7 0GRAIN VALLEY 12,901 12 283 2,193.6 18 0 6 3 9 265 43 197 23 2GRANDVIEW 24,564 12 1,058 4,307.1 195 0 7 56 132 863 222 527 108 6GREENWOOD 5,240 12 87 1,660.3 7 0 1 0 6 80 11 67 2 0INDEPENDENCE 117,255 12 7,217 6,155.0 500 3 45 110 342 6,717 1,178 4,785 728 26LAKE LOTAWANA 1,946 12 32 1,644.4 1 0 0 0 1 31 8 21 2 0LEE'S SUMMIT 91,696 12 2,230 2,431.9 107 0 18 30 59 2,123 325 1,676 115 7OAK GROVE 7,823 12 209 2,671.6 11 0 2 1 8 198 33 145 19 1RAYTOWN 29,633 12 1,338 4,515.2 88 0 8 35 45 1,250 290 805 137 18SUGAR CREEK 3,357 12 226 6,732.2 13 0 0 3 10 213 44 145 22 2LONE JACK 1,054 11 16 1,518.0 2 0 0 0 2 14 2 11 1 0LAKE TAPAWINGO 733 12 13 1,773.5 0 0 0 0 0 13 1 12 0 0PENN VALLEY COMTY COLLEGE 0 3 23 . 0 0 0 0 0 23 0 21 2 0UNIV OF MO - KC 0 12 168 . 1 0 1 0 0 167 57 107 3 0JACKSON CO PK RNGRS 0 12 0 . 0 0 0 0 0 0 0 0 0 0KANSAS CITY 461,458 12 31,421 6,809.1 5529 109 266 1,657 3,497 25,892 6,853 15,356 3,380 303
JASPER COUNTY 124,049 . 5,687 4,584.5 473 3 49 64 357 5,214 1,046 3,748 386 34JASPER CO - RURAL 30,362 12 653 2,150.7 152 0 7 2 143 501 154 282 55 10CARL JUNCTION 7,472 12 134 1,793.4 7 0 0 1 6 127 30 87 8 2CARTERVILLE 1,898 12 29 1,527.9 4 0 1 0 3 25 7 16 2 0CARTHAGE 14,430 12 386 2,675.0 41 0 5 6 30 345 78 249 15 3JASPER 934 12 18 1,927.2 3 0 0 0 3 15 1 13 0 1SARCOXIE 1,335 12 32 2,397.0 4 0 0 0 4 28 8 18 1 1WEBB CITY 11,036 12 492 4,458.1 0 0 0 0 0 492 48 424 20 0JOPLIN 50,332 12 3,788 7,526.0 251 3 34 54 160 3,537 690 2,553 278 16DUENWEG 1,125 12 25 2,222.2 3 0 -1 1 3 22 4 16 2 0DUQUESNE 1,769 12 51 2,883.0 4 0 1 0 3 47 11 32 3 1ORONOGO 2,947 12 23 780.5 1 0 1 0 0 22 4 17 1 0PURCELL 409 12 0 0.0 0 0 0 0 0 0 0 0 0 0MO SOUTHERN STATE UNIV 0 12 56 . 3 0 1 0 2 53 11 41 1 0
JEFFERSON COUNTY 219,528 . 5,010 2,282.2 548 2 44 34 468 4,462 634 3,538 254 36JEFFERSON CO - RURAL 160,939 12 2,896 1,799.4 384 2 30 19 333 2,512 404 1,898 191 19CRYSTAL CITY 4,873 12 176 3,611.7 10 0 3 1 6 166 10 151 5 0DE SOTO 6,423 12 355 5,527.0 42 0 2 3 37 313 50 242 13 8FESTUS 11,644 12 310 2,662.3 41 0 4 4 33 269 43 212 11 3HILLSBORO 2,831 12 99 3,497.0 13 0 2 1 10 86 14 63 7 2KIMMSWICK 158 12 0 0.0 0 0 0 0 0 0 0 0 0 0PEVELY 5,504 12 139 2,525.4 6 0 0 1 5 133 13 118 2 0ARNOLD 20,884 12 903 4,323.9 39 0 2 4 33 864 81 760 20 3HERCULANEUM 3,481 12 68 1,953.5 1 0 0 0 1 67 7 57 3 0BYRNES MILL 2,791 12 64 2,293.1 12 0 1 1 10 52 12 37 2 1
JOHNSON COUNTY 52,786 . 1,442 2,731.8 76 1 7 12 56 1,366 321 974 67 4JOHNSON CO - RURAL 28,333 12 451 1,591.8 26 1 1 1 23 425 157 228 37 3HOLDEN 2,260 12 102 4,513.3 4 0 0 2 2 98 15 75 8 0KNOB NOSTER 2,719 12 105 3,861.7 5 0 0 2 3 100 23 75 2 0
Crime In Missouri, 2011 94 Section 6.1
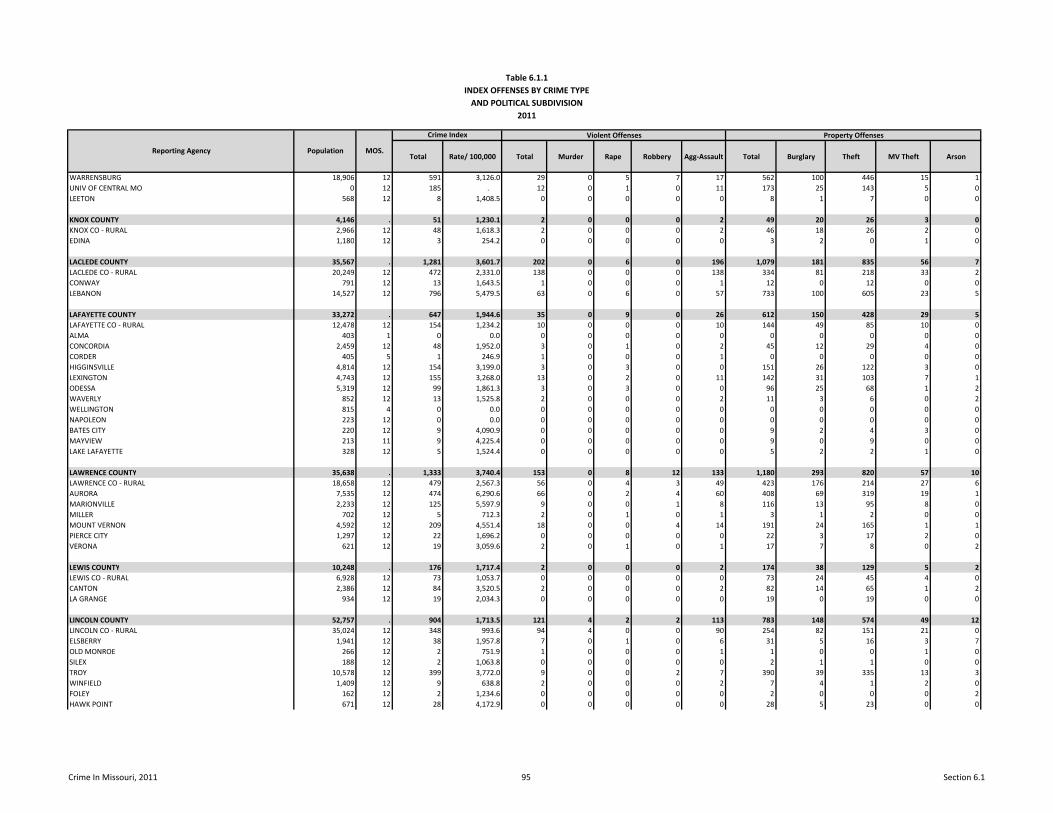
Table 6.1.1INDEX OFFENSES BY CRIME TYPE
AND POLITICAL SUBDIVISION2011
Total Rate/ 100,000 Total Murder Rape Robbery Agg-Assault Total Burglary Theft MV Theft Arson
Violent Offenses Property Offenses
Reporting Agency Population MOS.
Crime Index
WARRENSBURG 18,906 12 591 3,126.0 29 0 5 7 17 562 100 446 15 1UNIV OF CENTRAL MO 0 12 185 . 12 0 1 0 11 173 25 143 5 0LEETON 568 12 8 1,408.5 0 0 0 0 0 8 1 7 0 0
KNOX COUNTY 4,146 . 51 1,230.1 2 0 0 0 2 49 20 26 3 0KNOX CO - RURAL 2,966 12 48 1,618.3 2 0 0 0 2 46 18 26 2 0EDINA 1,180 12 3 254.2 0 0 0 0 0 3 2 0 1 0
LACLEDE COUNTY 35,567 . 1,281 3,601.7 202 0 6 0 196 1,079 181 835 56 7LACLEDE CO - RURAL 20,249 12 472 2,331.0 138 0 0 0 138 334 81 218 33 2CONWAY 791 12 13 1,643.5 1 0 0 0 1 12 0 12 0 0LEBANON 14,527 12 796 5,479.5 63 0 6 0 57 733 100 605 23 5
LAFAYETTE COUNTY 33,272 . 647 1,944.6 35 0 9 0 26 612 150 428 29 5LAFAYETTE CO - RURAL 12,478 12 154 1,234.2 10 0 0 0 10 144 49 85 10 0ALMA 403 1 0 0.0 0 0 0 0 0 0 0 0 0 0CONCORDIA 2,459 12 48 1,952.0 3 0 1 0 2 45 12 29 4 0CORDER 405 5 1 246.9 1 0 0 0 1 0 0 0 0 0HIGGINSVILLE 4,814 12 154 3,199.0 3 0 3 0 0 151 26 122 3 0LEXINGTON 4,743 12 155 3,268.0 13 0 2 0 11 142 31 103 7 1ODESSA 5,319 12 99 1,861.3 3 0 3 0 0 96 25 68 1 2WAVERLY 852 12 13 1,525.8 2 0 0 0 2 11 3 6 0 2WELLINGTON 815 4 0 0.0 0 0 0 0 0 0 0 0 0 0NAPOLEON 223 12 0 0.0 0 0 0 0 0 0 0 0 0 0BATES CITY 220 12 9 4,090.9 0 0 0 0 0 9 2 4 3 0MAYVIEW 213 11 9 4,225.4 0 0 0 0 0 9 0 9 0 0LAKE LAFAYETTE 328 12 5 1,524.4 0 0 0 0 0 5 2 2 1 0
LAWRENCE COUNTY 35,638 . 1,333 3,740.4 153 0 8 12 133 1,180 293 820 57 10LAWRENCE CO - RURAL 18,658 12 479 2,567.3 56 0 4 3 49 423 176 214 27 6AURORA 7,535 12 474 6,290.6 66 0 2 4 60 408 69 319 19 1MARIONVILLE 2,233 12 125 5,597.9 9 0 0 1 8 116 13 95 8 0MILLER 702 12 5 712.3 2 0 1 0 1 3 1 2 0 0MOUNT VERNON 4,592 12 209 4,551.4 18 0 0 4 14 191 24 165 1 1PIERCE CITY 1,297 12 22 1,696.2 0 0 0 0 0 22 3 17 2 0VERONA 621 12 19 3,059.6 2 0 1 0 1 17 7 8 0 2
LEWIS COUNTY 10,248 . 176 1,717.4 2 0 0 0 2 174 38 129 5 2LEWIS CO - RURAL 6,928 12 73 1,053.7 0 0 0 0 0 73 24 45 4 0CANTON 2,386 12 84 3,520.5 2 0 0 0 2 82 14 65 1 2LA GRANGE 934 12 19 2,034.3 0 0 0 0 0 19 0 19 0 0
LINCOLN COUNTY 52,757 . 904 1,713.5 121 4 2 2 113 783 148 574 49 12LINCOLN CO - RURAL 35,024 12 348 993.6 94 4 0 0 90 254 82 151 21 0ELSBERRY 1,941 12 38 1,957.8 7 0 1 0 6 31 5 16 3 7OLD MONROE 266 12 2 751.9 1 0 0 0 1 1 0 0 1 0SILEX 188 12 2 1,063.8 0 0 0 0 0 2 1 1 0 0TROY 10,578 12 399 3,772.0 9 0 0 2 7 390 39 335 13 3WINFIELD 1,409 12 9 638.8 2 0 0 0 2 7 4 1 2 0FOLEY 162 12 2 1,234.6 0 0 0 0 0 2 0 0 0 2HAWK POINT 671 12 28 4,172.9 0 0 0 0 0 28 5 23 0 0
Crime In Missouri, 2011 95 Section 6.1
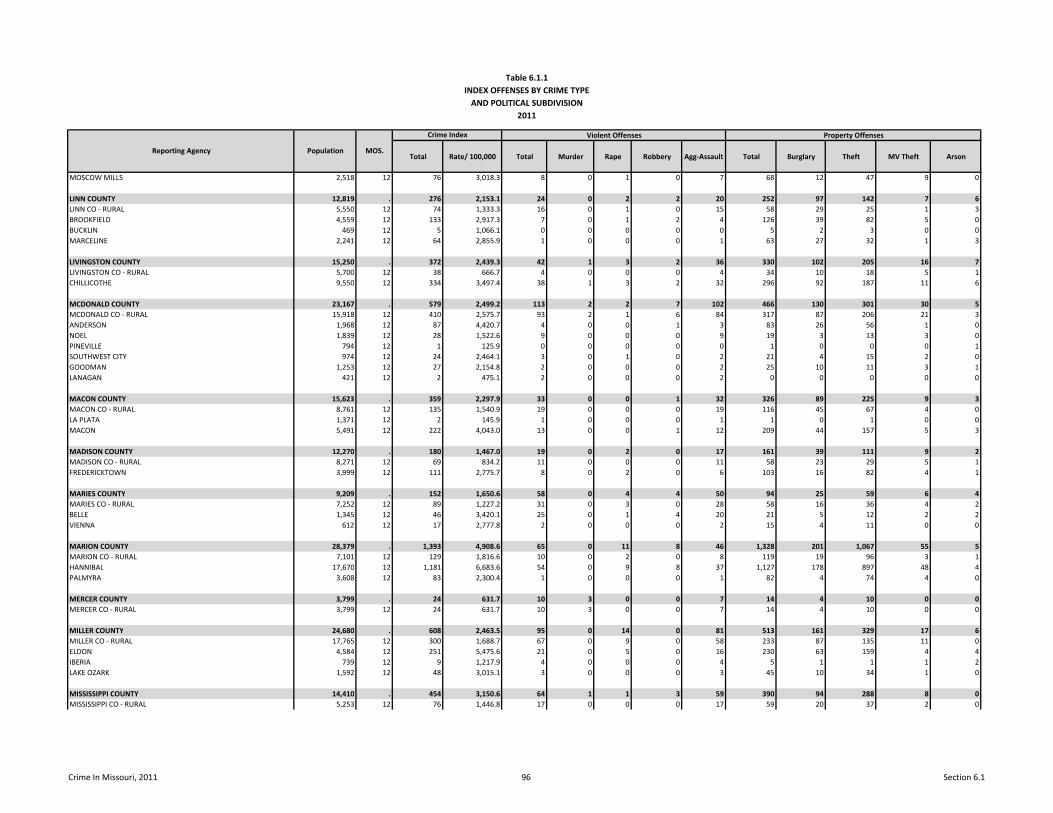
Table 6.1.1INDEX OFFENSES BY CRIME TYPE
AND POLITICAL SUBDIVISION2011
Total Rate/ 100,000 Total Murder Rape Robbery Agg-Assault Total Burglary Theft MV Theft Arson
Violent Offenses Property Offenses
Reporting Agency Population MOS.
Crime Index
MOSCOW MILLS 2,518 12 76 3,018.3 8 0 1 0 7 68 12 47 9 0
LINN COUNTY 12,819 . 276 2,153.1 24 0 2 2 20 252 97 142 7 6LINN CO - RURAL 5,550 12 74 1,333.3 16 0 1 0 15 58 29 25 1 3BROOKFIELD 4,559 12 133 2,917.3 7 0 1 2 4 126 39 82 5 0BUCKLIN 469 12 5 1,066.1 0 0 0 0 0 5 2 3 0 0MARCELINE 2,241 12 64 2,855.9 1 0 0 0 1 63 27 32 1 3
LIVINGSTON COUNTY 15,250 . 372 2,439.3 42 1 3 2 36 330 102 205 16 7LIVINGSTON CO - RURAL 5,700 12 38 666.7 4 0 0 0 4 34 10 18 5 1CHILLICOTHE 9,550 12 334 3,497.4 38 1 3 2 32 296 92 187 11 6
MCDONALD COUNTY 23,167 . 579 2,499.2 113 2 2 7 102 466 130 301 30 5MCDONALD CO - RURAL 15,918 12 410 2,575.7 93 2 1 6 84 317 87 206 21 3ANDERSON 1,968 12 87 4,420.7 4 0 0 1 3 83 26 56 1 0NOEL 1,839 12 28 1,522.6 9 0 0 0 9 19 3 13 3 0PINEVILLE 794 12 1 125.9 0 0 0 0 0 1 0 0 0 1SOUTHWEST CITY 974 12 24 2,464.1 3 0 1 0 2 21 4 15 2 0GOODMAN 1,253 12 27 2,154.8 2 0 0 0 2 25 10 11 3 1LANAGAN 421 12 2 475.1 2 0 0 0 2 0 0 0 0 0
MACON COUNTY 15,623 . 359 2,297.9 33 0 0 1 32 326 89 225 9 3MACON CO - RURAL 8,761 12 135 1,540.9 19 0 0 0 19 116 45 67 4 0LA PLATA 1,371 12 2 145.9 1 0 0 0 1 1 0 1 0 0MACON 5,491 12 222 4,043.0 13 0 0 1 12 209 44 157 5 3
MADISON COUNTY 12,270 . 180 1,467.0 19 0 2 0 17 161 39 111 9 2MADISON CO - RURAL 8,271 12 69 834.2 11 0 0 0 11 58 23 29 5 1FREDERICKTOWN 3,999 12 111 2,775.7 8 0 2 0 6 103 16 82 4 1
MARIES COUNTY 9,209 . 152 1,650.6 58 0 4 4 50 94 25 59 6 4MARIES CO - RURAL 7,252 12 89 1,227.2 31 0 3 0 28 58 16 36 4 2BELLE 1,345 12 46 3,420.1 25 0 1 4 20 21 5 12 2 2VIENNA 612 12 17 2,777.8 2 0 0 0 2 15 4 11 0 0
MARION COUNTY 28,379 . 1,393 4,908.6 65 0 11 8 46 1,328 201 1,067 55 5MARION CO - RURAL 7,101 12 129 1,816.6 10 0 2 0 8 119 19 96 3 1HANNIBAL 17,670 12 1,181 6,683.6 54 0 9 8 37 1,127 178 897 48 4PALMYRA 3,608 12 83 2,300.4 1 0 0 0 1 82 4 74 4 0
MERCER COUNTY 3,799 . 24 631.7 10 3 0 0 7 14 4 10 0 0MERCER CO - RURAL 3,799 12 24 631.7 10 3 0 0 7 14 4 10 0 0
MILLER COUNTY 24,680 . 608 2,463.5 95 0 14 0 81 513 161 329 17 6MILLER CO - RURAL 17,765 12 300 1,688.7 67 0 9 0 58 233 87 135 11 0ELDON 4,584 12 251 5,475.6 21 0 5 0 16 230 63 159 4 4IBERIA 739 12 9 1,217.9 4 0 0 0 4 5 1 1 1 2LAKE OZARK 1,592 12 48 3,015.1 3 0 0 0 3 45 10 34 1 0
MISSISSIPPI COUNTY 14,410 . 454 3,150.6 64 1 1 3 59 390 94 288 8 0MISSISSIPPI CO - RURAL 5,253 12 76 1,446.8 17 0 0 0 17 59 20 37 2 0
Crime In Missouri, 2011 96 Section 6.1
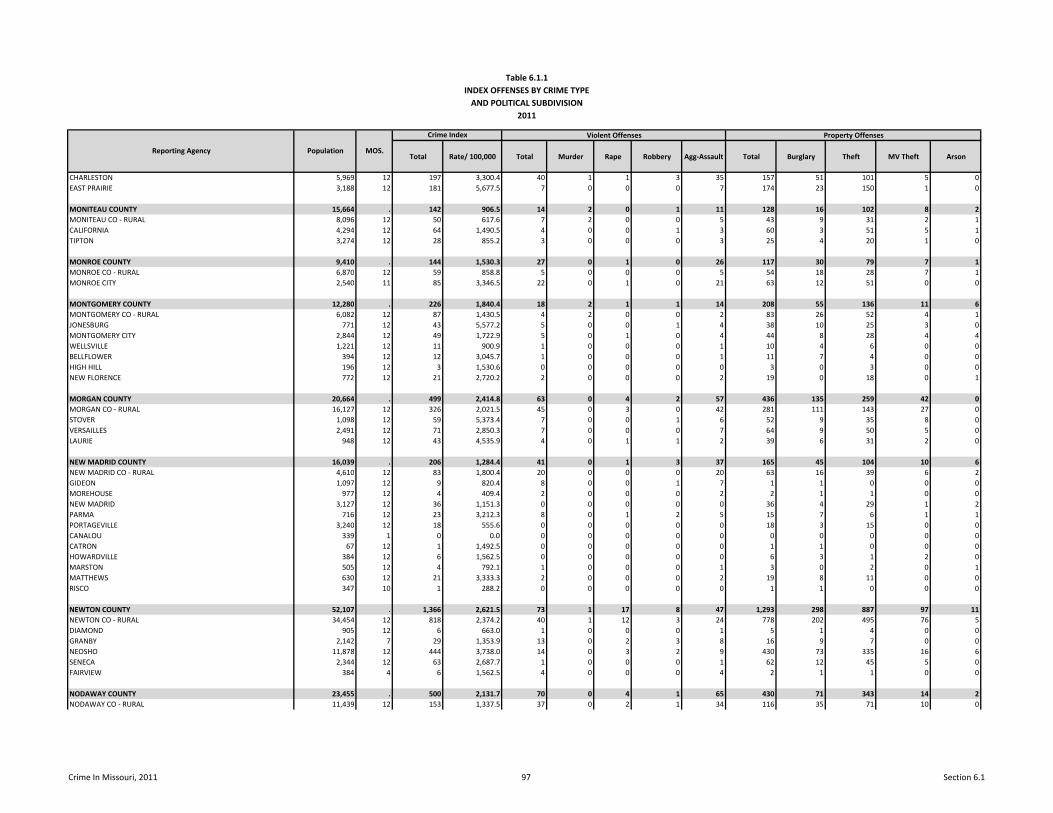
Table 6.1.1INDEX OFFENSES BY CRIME TYPE
AND POLITICAL SUBDIVISION2011
Total Rate/ 100,000 Total Murder Rape Robbery Agg-Assault Total Burglary Theft MV Theft Arson
Violent Offenses Property Offenses
Reporting Agency Population MOS.
Crime Index
CHARLESTON 5,969 12 197 3,300.4 40 1 1 3 35 157 51 101 5 0EAST PRAIRIE 3,188 12 181 5,677.5 7 0 0 0 7 174 23 150 1 0
MONITEAU COUNTY 15,664 . 142 906.5 14 2 0 1 11 128 16 102 8 2MONITEAU CO - RURAL 8,096 12 50 617.6 7 2 0 0 5 43 9 31 2 1CALIFORNIA 4,294 12 64 1,490.5 4 0 0 1 3 60 3 51 5 1TIPTON 3,274 12 28 855.2 3 0 0 0 3 25 4 20 1 0
MONROE COUNTY 9,410 . 144 1,530.3 27 0 1 0 26 117 30 79 7 1MONROE CO - RURAL 6,870 12 59 858.8 5 0 0 0 5 54 18 28 7 1MONROE CITY 2,540 11 85 3,346.5 22 0 1 0 21 63 12 51 0 0
MONTGOMERY COUNTY 12,280 . 226 1,840.4 18 2 1 1 14 208 55 136 11 6MONTGOMERY CO - RURAL 6,082 12 87 1,430.5 4 2 0 0 2 83 26 52 4 1JONESBURG 771 12 43 5,577.2 5 0 0 1 4 38 10 25 3 0MONTGOMERY CITY 2,844 12 49 1,722.9 5 0 1 0 4 44 8 28 4 4WELLSVILLE 1,221 12 11 900.9 1 0 0 0 1 10 4 6 0 0BELLFLOWER 394 12 12 3,045.7 1 0 0 0 1 11 7 4 0 0HIGH HILL 196 12 3 1,530.6 0 0 0 0 0 3 0 3 0 0NEW FLORENCE 772 12 21 2,720.2 2 0 0 0 2 19 0 18 0 1
MORGAN COUNTY 20,664 . 499 2,414.8 63 0 4 2 57 436 135 259 42 0MORGAN CO - RURAL 16,127 12 326 2,021.5 45 0 3 0 42 281 111 143 27 0STOVER 1,098 12 59 5,373.4 7 0 0 1 6 52 9 35 8 0VERSAILLES 2,491 12 71 2,850.3 7 0 0 0 7 64 9 50 5 0LAURIE 948 12 43 4,535.9 4 0 1 1 2 39 6 31 2 0
NEW MADRID COUNTY 16,039 . 206 1,284.4 41 0 1 3 37 165 45 104 10 6NEW MADRID CO - RURAL 4,610 12 83 1,800.4 20 0 0 0 20 63 16 39 6 2GIDEON 1,097 12 9 820.4 8 0 0 1 7 1 1 0 0 0MOREHOUSE 977 12 4 409.4 2 0 0 0 2 2 1 1 0 0NEW MADRID 3,127 12 36 1,151.3 0 0 0 0 0 36 4 29 1 2PARMA 716 12 23 3,212.3 8 0 1 2 5 15 7 6 1 1PORTAGEVILLE 3,240 12 18 555.6 0 0 0 0 0 18 3 15 0 0CANALOU 339 1 0 0.0 0 0 0 0 0 0 0 0 0 0CATRON 67 12 1 1,492.5 0 0 0 0 0 1 1 0 0 0HOWARDVILLE 384 12 6 1,562.5 0 0 0 0 0 6 3 1 2 0MARSTON 505 12 4 792.1 1 0 0 0 1 3 0 2 0 1MATTHEWS 630 12 21 3,333.3 2 0 0 0 2 19 8 11 0 0RISCO 347 10 1 288.2 0 0 0 0 0 1 1 0 0 0
NEWTON COUNTY 52,107 . 1,366 2,621.5 73 1 17 8 47 1,293 298 887 97 11NEWTON CO - RURAL 34,454 12 818 2,374.2 40 1 12 3 24 778 202 495 76 5DIAMOND 905 12 6 663.0 1 0 0 0 1 5 1 4 0 0GRANBY 2,142 7 29 1,353.9 13 0 2 3 8 16 9 7 0 0NEOSHO 11,878 12 444 3,738.0 14 0 3 2 9 430 73 335 16 6SENECA 2,344 12 63 2,687.7 1 0 0 0 1 62 12 45 5 0FAIRVIEW 384 4 6 1,562.5 4 0 0 0 4 2 1 1 0 0
NODAWAY COUNTY 23,455 . 500 2,131.7 70 0 4 1 65 430 71 343 14 2NODAWAY CO - RURAL 11,439 12 153 1,337.5 37 0 2 1 34 116 35 71 10 0
Crime In Missouri, 2011 97 Section 6.1
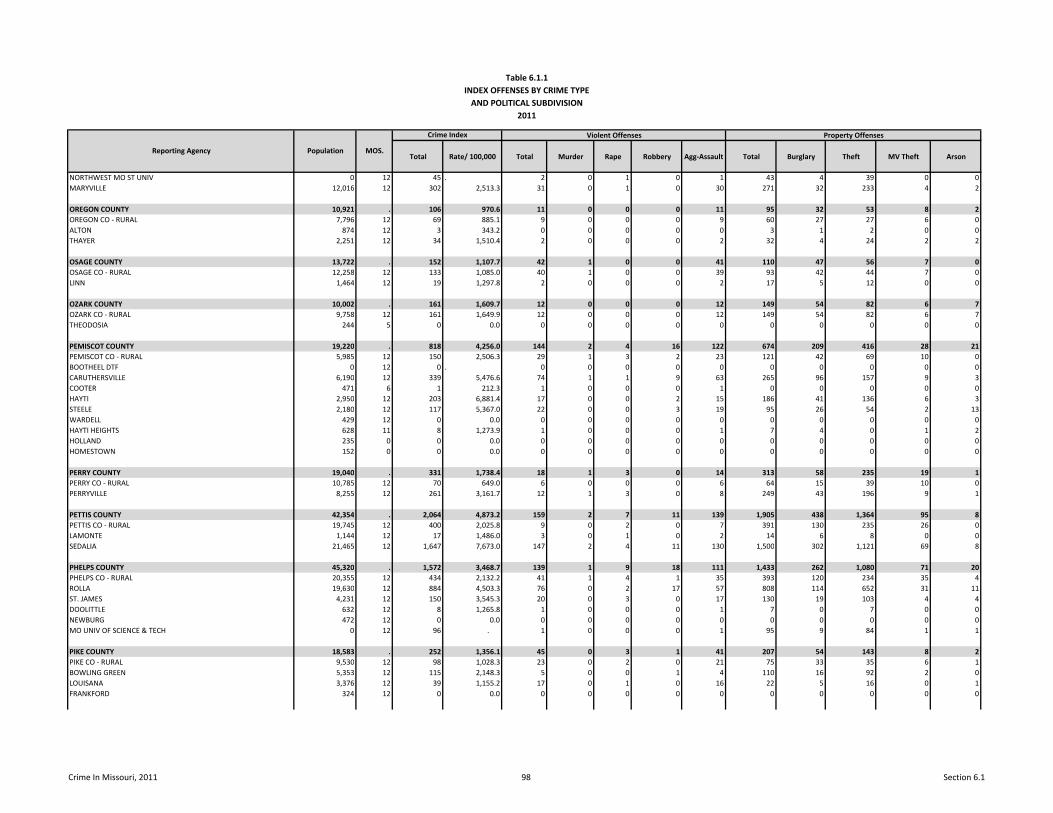
Table 6.1.1INDEX OFFENSES BY CRIME TYPE
AND POLITICAL SUBDIVISION2011
Total Rate/ 100,000 Total Murder Rape Robbery Agg-Assault Total Burglary Theft MV Theft Arson
Violent Offenses Property Offenses
Reporting Agency Population MOS.
Crime Index
NORTHWEST MO ST UNIV 0 12 45 . 2 0 1 0 1 43 4 39 0 0MARYVILLE 12,016 12 302 2,513.3 31 0 1 0 30 271 32 233 4 2
OREGON COUNTY 10,921 . 106 970.6 11 0 0 0 11 95 32 53 8 2OREGON CO - RURAL 7,796 12 69 885.1 9 0 0 0 9 60 27 27 6 0ALTON 874 12 3 343.2 0 0 0 0 0 3 1 2 0 0THAYER 2,251 12 34 1,510.4 2 0 0 0 2 32 4 24 2 2
OSAGE COUNTY 13,722 . 152 1,107.7 42 1 0 0 41 110 47 56 7 0OSAGE CO - RURAL 12,258 12 133 1,085.0 40 1 0 0 39 93 42 44 7 0LINN 1,464 12 19 1,297.8 2 0 0 0 2 17 5 12 0 0
OZARK COUNTY 10,002 . 161 1,609.7 12 0 0 0 12 149 54 82 6 7OZARK CO - RURAL 9,758 12 161 1,649.9 12 0 0 0 12 149 54 82 6 7THEODOSIA 244 5 0 0.0 0 0 0 0 0 0 0 0 0 0
PEMISCOT COUNTY 19,220 . 818 4,256.0 144 2 4 16 122 674 209 416 28 21PEMISCOT CO - RURAL 5,985 12 150 2,506.3 29 1 3 2 23 121 42 69 10 0BOOTHEEL DTF 0 12 0 . 0 0 0 0 0 0 0 0 0 0CARUTHERSVILLE 6,190 12 339 5,476.6 74 1 1 9 63 265 96 157 9 3COOTER 471 6 1 212.3 1 0 0 0 1 0 0 0 0 0HAYTI 2,950 12 203 6,881.4 17 0 0 2 15 186 41 136 6 3STEELE 2,180 12 117 5,367.0 22 0 0 3 19 95 26 54 2 13WARDELL 429 12 0 0.0 0 0 0 0 0 0 0 0 0 0HAYTI HEIGHTS 628 11 8 1,273.9 1 0 0 0 1 7 4 0 1 2HOLLAND 235 0 0 0.0 0 0 0 0 0 0 0 0 0 0HOMESTOWN 152 0 0 0.0 0 0 0 0 0 0 0 0 0 0
PERRY COUNTY 19,040 . 331 1,738.4 18 1 3 0 14 313 58 235 19 1PERRY CO - RURAL 10,785 12 70 649.0 6 0 0 0 6 64 15 39 10 0PERRYVILLE 8,255 12 261 3,161.7 12 1 3 0 8 249 43 196 9 1
PETTIS COUNTY 42,354 . 2,064 4,873.2 159 2 7 11 139 1,905 438 1,364 95 8PETTIS CO - RURAL 19,745 12 400 2,025.8 9 0 2 0 7 391 130 235 26 0LAMONTE 1,144 12 17 1,486.0 3 0 1 0 2 14 6 8 0 0SEDALIA 21,465 12 1,647 7,673.0 147 2 4 11 130 1,500 302 1,121 69 8
PHELPS COUNTY 45,320 . 1,572 3,468.7 139 1 9 18 111 1,433 262 1,080 71 20PHELPS CO - RURAL 20,355 12 434 2,132.2 41 1 4 1 35 393 120 234 35 4ROLLA 19,630 12 884 4,503.3 76 0 2 17 57 808 114 652 31 11ST. JAMES 4,231 12 150 3,545.3 20 0 3 0 17 130 19 103 4 4DOOLITTLE 632 12 8 1,265.8 1 0 0 0 1 7 0 7 0 0NEWBURG 472 12 0 0.0 0 0 0 0 0 0 0 0 0 0MO UNIV OF SCIENCE & TECH 0 12 96 . 1 0 0 0 1 95 9 84 1 1
PIKE COUNTY 18,583 . 252 1,356.1 45 0 3 1 41 207 54 143 8 2PIKE CO - RURAL 9,530 12 98 1,028.3 23 0 2 0 21 75 33 35 6 1BOWLING GREEN 5,353 12 115 2,148.3 5 0 0 1 4 110 16 92 2 0LOUISANA 3,376 12 39 1,155.2 17 0 1 0 16 22 5 16 0 1FRANKFORD 324 12 0 0.0 0 0 0 0 0 0 0 0 0 0
Crime In Missouri, 2011 98 Section 6.1
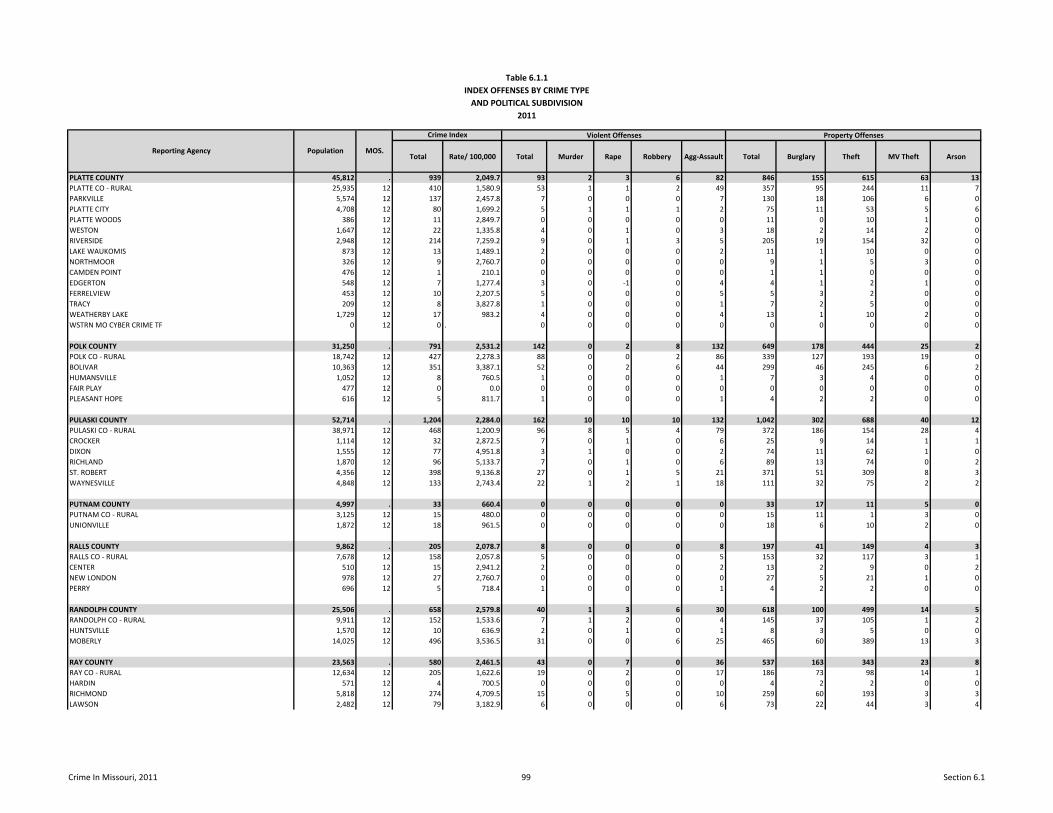
Table 6.1.1INDEX OFFENSES BY CRIME TYPE
AND POLITICAL SUBDIVISION2011
Total Rate/ 100,000 Total Murder Rape Robbery Agg-Assault Total Burglary Theft MV Theft Arson
Violent Offenses Property Offenses
Reporting Agency Population MOS.
Crime Index
PLATTE COUNTY 45,812 . 939 2,049.7 93 2 3 6 82 846 155 615 63 13PLATTE CO - RURAL 25,935 12 410 1,580.9 53 1 1 2 49 357 95 244 11 7PARKVILLE 5,574 12 137 2,457.8 7 0 0 0 7 130 18 106 6 0PLATTE CITY 4,708 12 80 1,699.2 5 1 1 1 2 75 11 53 5 6PLATTE WOODS 386 12 11 2,849.7 0 0 0 0 0 11 0 10 1 0WESTON 1,647 12 22 1,335.8 4 0 1 0 3 18 2 14 2 0RIVERSIDE 2,948 12 214 7,259.2 9 0 1 3 5 205 19 154 32 0LAKE WAUKOMIS 873 12 13 1,489.1 2 0 0 0 2 11 1 10 0 0NORTHMOOR 326 12 9 2,760.7 0 0 0 0 0 9 1 5 3 0CAMDEN POINT 476 12 1 210.1 0 0 0 0 0 1 1 0 0 0EDGERTON 548 12 7 1,277.4 3 0 -1 0 4 4 1 2 1 0FERRELVIEW 453 12 10 2,207.5 5 0 0 0 5 5 3 2 0 0TRACY 209 12 8 3,827.8 1 0 0 0 1 7 2 5 0 0WEATHERBY LAKE 1,729 12 17 983.2 4 0 0 0 4 13 1 10 2 0WSTRN MO CYBER CRIME TF 0 12 0 . 0 0 0 0 0 0 0 0 0 0
POLK COUNTY 31,250 . 791 2,531.2 142 0 2 8 132 649 178 444 25 2POLK CO - RURAL 18,742 12 427 2,278.3 88 0 0 2 86 339 127 193 19 0BOLIVAR 10,363 12 351 3,387.1 52 0 2 6 44 299 46 245 6 2HUMANSVILLE 1,052 12 8 760.5 1 0 0 0 1 7 3 4 0 0FAIR PLAY 477 12 0 0.0 0 0 0 0 0 0 0 0 0 0PLEASANT HOPE 616 12 5 811.7 1 0 0 0 1 4 2 2 0 0
PULASKI COUNTY 52,714 . 1,204 2,284.0 162 10 10 10 132 1,042 302 688 40 12PULASKI CO - RURAL 38,971 12 468 1,200.9 96 8 5 4 79 372 186 154 28 4CROCKER 1,114 12 32 2,872.5 7 0 1 0 6 25 9 14 1 1DIXON 1,555 12 77 4,951.8 3 1 0 0 2 74 11 62 1 0RICHLAND 1,870 12 96 5,133.7 7 0 1 0 6 89 13 74 0 2ST. ROBERT 4,356 12 398 9,136.8 27 0 1 5 21 371 51 309 8 3WAYNESVILLE 4,848 12 133 2,743.4 22 1 2 1 18 111 32 75 2 2
PUTNAM COUNTY 4,997 . 33 660.4 0 0 0 0 0 33 17 11 5 0PUTNAM CO - RURAL 3,125 12 15 480.0 0 0 0 0 0 15 11 1 3 0UNIONVILLE 1,872 12 18 961.5 0 0 0 0 0 18 6 10 2 0
RALLS COUNTY 9,862 . 205 2,078.7 8 0 0 0 8 197 41 149 4 3RALLS CO - RURAL 7,678 12 158 2,057.8 5 0 0 0 5 153 32 117 3 1CENTER 510 12 15 2,941.2 2 0 0 0 2 13 2 9 0 2NEW LONDON 978 12 27 2,760.7 0 0 0 0 0 27 5 21 1 0PERRY 696 12 5 718.4 1 0 0 0 1 4 2 2 0 0
RANDOLPH COUNTY 25,506 . 658 2,579.8 40 1 3 6 30 618 100 499 14 5RANDOLPH CO - RURAL 9,911 12 152 1,533.6 7 1 2 0 4 145 37 105 1 2HUNTSVILLE 1,570 12 10 636.9 2 0 1 0 1 8 3 5 0 0MOBERLY 14,025 12 496 3,536.5 31 0 0 6 25 465 60 389 13 3
RAY COUNTY 23,563 . 580 2,461.5 43 0 7 0 36 537 163 343 23 8RAY CO - RURAL 12,634 12 205 1,622.6 19 0 2 0 17 186 73 98 14 1HARDIN 571 12 4 700.5 0 0 0 0 0 4 2 2 0 0RICHMOND 5,818 12 274 4,709.5 15 0 5 0 10 259 60 193 3 3LAWSON 2,482 12 79 3,182.9 6 0 0 0 6 73 22 44 3 4
Crime In Missouri, 2011 99 Section 6.1
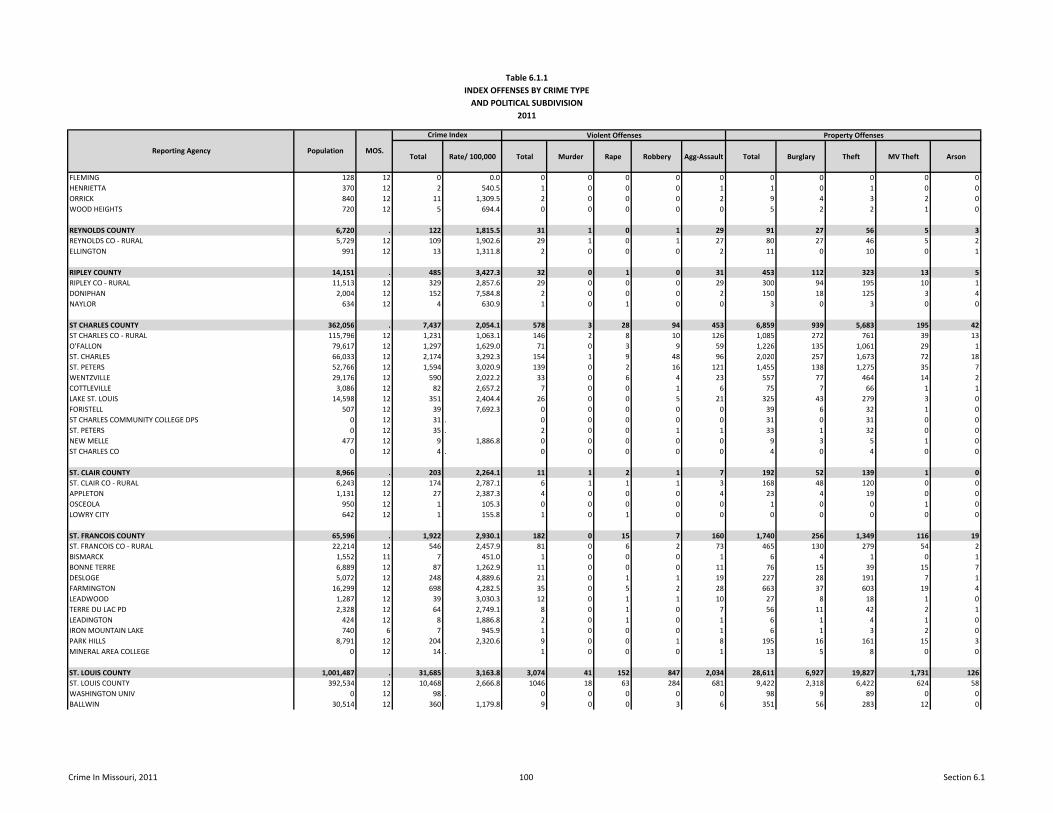
Table 6.1.1INDEX OFFENSES BY CRIME TYPE
AND POLITICAL SUBDIVISION2011
Total Rate/ 100,000 Total Murder Rape Robbery Agg-Assault Total Burglary Theft MV Theft Arson
Violent Offenses Property Offenses
Reporting Agency Population MOS.
Crime Index
FLEMING 128 12 0 0.0 0 0 0 0 0 0 0 0 0 0HENRIETTA 370 12 2 540.5 1 0 0 0 1 1 0 1 0 0ORRICK 840 12 11 1,309.5 2 0 0 0 2 9 4 3 2 0WOOD HEIGHTS 720 12 5 694.4 0 0 0 0 0 5 2 2 1 0
REYNOLDS COUNTY 6,720 . 122 1,815.5 31 1 0 1 29 91 27 56 5 3REYNOLDS CO - RURAL 5,729 12 109 1,902.6 29 1 0 1 27 80 27 46 5 2ELLINGTON 991 12 13 1,311.8 2 0 0 0 2 11 0 10 0 1
RIPLEY COUNTY 14,151 . 485 3,427.3 32 0 1 0 31 453 112 323 13 5RIPLEY CO - RURAL 11,513 12 329 2,857.6 29 0 0 0 29 300 94 195 10 1DONIPHAN 2,004 12 152 7,584.8 2 0 0 0 2 150 18 125 3 4NAYLOR 634 12 4 630.9 1 0 1 0 0 3 0 3 0 0
ST CHARLES COUNTY 362,056 . 7,437 2,054.1 578 3 28 94 453 6,859 939 5,683 195 42ST CHARLES CO - RURAL 115,796 12 1,231 1,063.1 146 2 8 10 126 1,085 272 761 39 13O'FALLON 79,617 12 1,297 1,629.0 71 0 3 9 59 1,226 135 1,061 29 1ST. CHARLES 66,033 12 2,174 3,292.3 154 1 9 48 96 2,020 257 1,673 72 18ST. PETERS 52,766 12 1,594 3,020.9 139 0 2 16 121 1,455 138 1,275 35 7WENTZVILLE 29,176 12 590 2,022.2 33 0 6 4 23 557 77 464 14 2COTTLEVILLE 3,086 12 82 2,657.2 7 0 0 1 6 75 7 66 1 1LAKE ST. LOUIS 14,598 12 351 2,404.4 26 0 0 5 21 325 43 279 3 0FORISTELL 507 12 39 7,692.3 0 0 0 0 0 39 6 32 1 0ST CHARLES COMMUNITY COLLEGE DPS 0 12 31 . 0 0 0 0 0 31 0 31 0 0ST. PETERS 0 12 35 . 2 0 0 1 1 33 1 32 0 0NEW MELLE 477 12 9 1,886.8 0 0 0 0 0 9 3 5 1 0ST CHARLES CO 0 12 4 . 0 0 0 0 0 4 0 4 0 0
ST. CLAIR COUNTY 8,966 . 203 2,264.1 11 1 2 1 7 192 52 139 1 0ST. CLAIR CO - RURAL 6,243 12 174 2,787.1 6 1 1 1 3 168 48 120 0 0APPLETON 1,131 12 27 2,387.3 4 0 0 0 4 23 4 19 0 0OSCEOLA 950 12 1 105.3 0 0 0 0 0 1 0 0 1 0LOWRY CITY 642 12 1 155.8 1 0 1 0 0 0 0 0 0 0
ST. FRANCOIS COUNTY 65,596 . 1,922 2,930.1 182 0 15 7 160 1,740 256 1,349 116 19ST. FRANCOIS CO - RURAL 22,214 12 546 2,457.9 81 0 6 2 73 465 130 279 54 2BISMARCK 1,552 11 7 451.0 1 0 0 0 1 6 4 1 0 1BONNE TERRE 6,889 12 87 1,262.9 11 0 0 0 11 76 15 39 15 7DESLOGE 5,072 12 248 4,889.6 21 0 1 1 19 227 28 191 7 1FARMINGTON 16,299 12 698 4,282.5 35 0 5 2 28 663 37 603 19 4LEADWOOD 1,287 12 39 3,030.3 12 0 1 1 10 27 8 18 1 0TERRE DU LAC PD 2,328 12 64 2,749.1 8 0 1 0 7 56 11 42 2 1LEADINGTON 424 12 8 1,886.8 2 0 1 0 1 6 1 4 1 0IRON MOUNTAIN LAKE 740 6 7 945.9 1 0 0 0 1 6 1 3 2 0PARK HILLS 8,791 12 204 2,320.6 9 0 0 1 8 195 16 161 15 3MINERAL AREA COLLEGE 0 12 14 . 1 0 0 0 1 13 5 8 0 0
ST. LOUIS COUNTY 1,001,487 . 31,685 3,163.8 3,074 41 152 847 2,034 28,611 6,927 19,827 1,731 126ST. LOUIS COUNTY 392,534 12 10,468 2,666.8 1046 18 63 284 681 9,422 2,318 6,422 624 58WASHINGTON UNIV 0 12 98 . 0 0 0 0 0 98 9 89 0 0BALLWIN 30,514 12 360 1,179.8 9 0 0 3 6 351 56 283 12 0
Crime In Missouri, 2011 100 Section 6.1
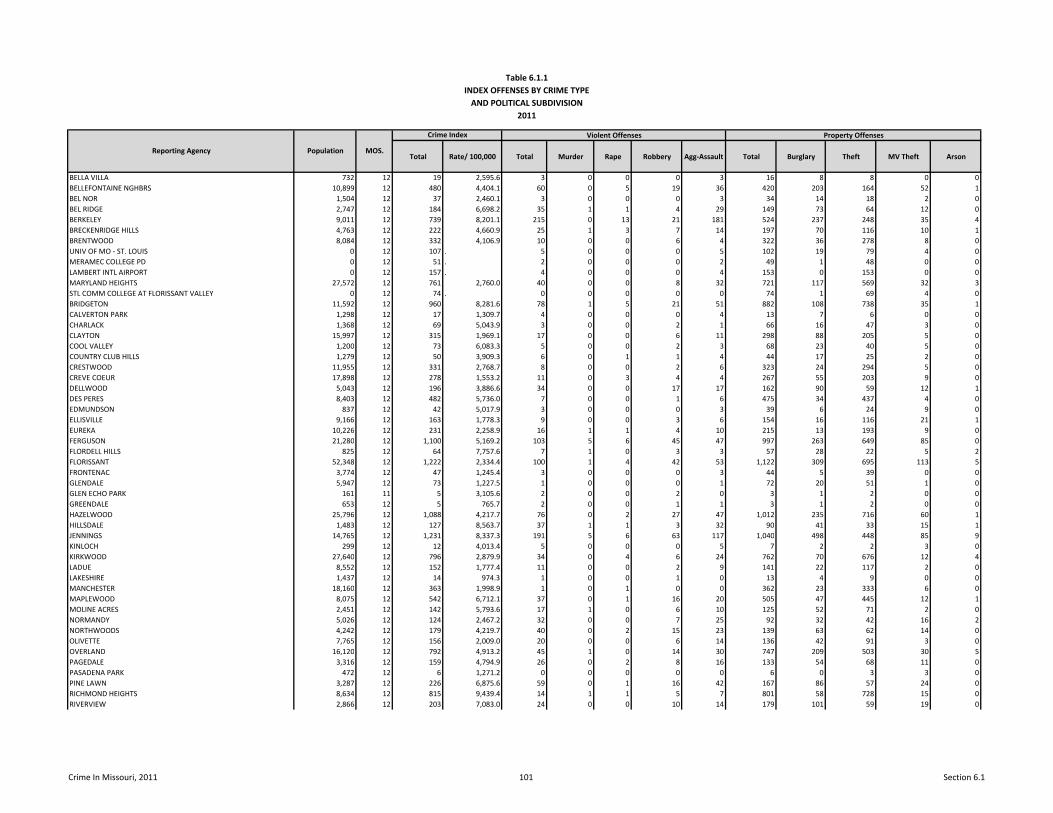
Table 6.1.1INDEX OFFENSES BY CRIME TYPE
AND POLITICAL SUBDIVISION2011
Total Rate/ 100,000 Total Murder Rape Robbery Agg-Assault Total Burglary Theft MV Theft Arson
Violent Offenses Property Offenses
Reporting Agency Population MOS.
Crime Index
BELLA VILLA 732 12 19 2,595.6 3 0 0 0 3 16 8 8 0 0BELLEFONTAINE NGHBRS 10,899 12 480 4,404.1 60 0 5 19 36 420 203 164 52 1BEL NOR 1,504 12 37 2,460.1 3 0 0 0 3 34 14 18 2 0BEL RIDGE 2,747 12 184 6,698.2 35 1 1 4 29 149 73 64 12 0BERKELEY 9,011 12 739 8,201.1 215 0 13 21 181 524 237 248 35 4BRECKENRIDGE HILLS 4,763 12 222 4,660.9 25 1 3 7 14 197 70 116 10 1BRENTWOOD 8,084 12 332 4,106.9 10 0 0 6 4 322 36 278 8 0UNIV OF MO - ST. LOUIS 0 12 107 . 5 0 0 0 5 102 19 79 4 0MERAMEC COLLEGE PD 0 12 51 . 2 0 0 0 2 49 1 48 0 0LAMBERT INTL AIRPORT 0 12 157 . 4 0 0 0 4 153 0 153 0 0MARYLAND HEIGHTS 27,572 12 761 2,760.0 40 0 0 8 32 721 117 569 32 3STL COMM COLLEGE AT FLORISSANT VALLEY 0 12 74 . 0 0 0 0 0 74 1 69 4 0BRIDGETON 11,592 12 960 8,281.6 78 1 5 21 51 882 108 738 35 1CALVERTON PARK 1,298 12 17 1,309.7 4 0 0 0 4 13 7 6 0 0CHARLACK 1,368 12 69 5,043.9 3 0 0 2 1 66 16 47 3 0CLAYTON 15,997 12 315 1,969.1 17 0 0 6 11 298 88 205 5 0COOL VALLEY 1,200 12 73 6,083.3 5 0 0 2 3 68 23 40 5 0COUNTRY CLUB HILLS 1,279 12 50 3,909.3 6 0 1 1 4 44 17 25 2 0CRESTWOOD 11,955 12 331 2,768.7 8 0 0 2 6 323 24 294 5 0CREVE COEUR 17,898 12 278 1,553.2 11 0 3 4 4 267 55 203 9 0DELLWOOD 5,043 12 196 3,886.6 34 0 0 17 17 162 90 59 12 1DES PERES 8,403 12 482 5,736.0 7 0 0 1 6 475 34 437 4 0EDMUNDSON 837 12 42 5,017.9 3 0 0 0 3 39 6 24 9 0ELLISVILLE 9,166 12 163 1,778.3 9 0 0 3 6 154 16 116 21 1EUREKA 10,226 12 231 2,258.9 16 1 1 4 10 215 13 193 9 0FERGUSON 21,280 12 1,100 5,169.2 103 5 6 45 47 997 263 649 85 0FLORDELL HILLS 825 12 64 7,757.6 7 1 0 3 3 57 28 22 5 2FLORISSANT 52,348 12 1,222 2,334.4 100 1 4 42 53 1,122 309 695 113 5FRONTENAC 3,774 12 47 1,245.4 3 0 0 0 3 44 5 39 0 0GLENDALE 5,947 12 73 1,227.5 1 0 0 0 1 72 20 51 1 0GLEN ECHO PARK 161 11 5 3,105.6 2 0 0 2 0 3 1 2 0 0GREENDALE 653 12 5 765.7 2 0 0 1 1 3 1 2 0 0HAZELWOOD 25,796 12 1,088 4,217.7 76 0 2 27 47 1,012 235 716 60 1HILLSDALE 1,483 12 127 8,563.7 37 1 1 3 32 90 41 33 15 1JENNINGS 14,765 12 1,231 8,337.3 191 5 6 63 117 1,040 498 448 85 9KINLOCH 299 12 12 4,013.4 5 0 0 0 5 7 2 2 3 0KIRKWOOD 27,640 12 796 2,879.9 34 0 4 6 24 762 70 676 12 4LADUE 8,552 12 152 1,777.4 11 0 0 2 9 141 22 117 2 0LAKESHIRE 1,437 12 14 974.3 1 0 0 1 0 13 4 9 0 0MANCHESTER 18,160 12 363 1,998.9 1 0 1 0 0 362 23 333 6 0MAPLEWOOD 8,075 12 542 6,712.1 37 0 1 16 20 505 47 445 12 1MOLINE ACRES 2,451 12 142 5,793.6 17 1 0 6 10 125 52 71 2 0NORMANDY 5,026 12 124 2,467.2 32 0 0 7 25 92 32 42 16 2NORTHWOODS 4,242 12 179 4,219.7 40 0 2 15 23 139 63 62 14 0OLIVETTE 7,765 12 156 2,009.0 20 0 0 6 14 136 42 91 3 0OVERLAND 16,120 12 792 4,913.2 45 1 0 14 30 747 209 503 30 5PAGEDALE 3,316 12 159 4,794.9 26 0 2 8 16 133 54 68 11 0PASADENA PARK 472 12 6 1,271.2 0 0 0 0 0 6 0 3 3 0PINE LAWN 3,287 12 226 6,875.6 59 0 1 16 42 167 86 57 24 0RICHMOND HEIGHTS 8,634 12 815 9,439.4 14 1 1 5 7 801 58 728 15 0RIVERVIEW 2,866 12 203 7,083.0 24 0 0 10 14 179 101 59 19 0
Crime In Missouri, 2011 101 Section 6.1
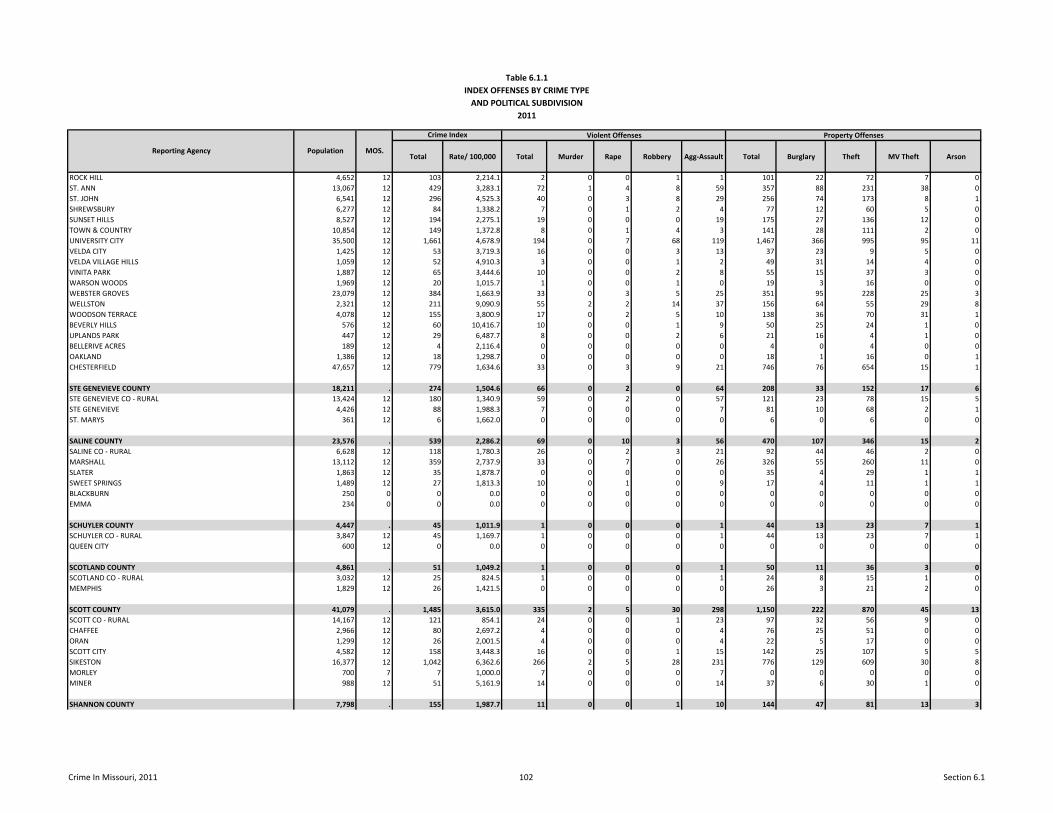
Table 6.1.1INDEX OFFENSES BY CRIME TYPE
AND POLITICAL SUBDIVISION2011
Total Rate/ 100,000 Total Murder Rape Robbery Agg-Assault Total Burglary Theft MV Theft Arson
Violent Offenses Property Offenses
Reporting Agency Population MOS.
Crime Index
ROCK HILL 4,652 12 103 2,214.1 2 0 0 1 1 101 22 72 7 0ST. ANN 13,067 12 429 3,283.1 72 1 4 8 59 357 88 231 38 0ST. JOHN 6,541 12 296 4,525.3 40 0 3 8 29 256 74 173 8 1SHREWSBURY 6,277 12 84 1,338.2 7 0 1 2 4 77 12 60 5 0SUNSET HILLS 8,527 12 194 2,275.1 19 0 0 0 19 175 27 136 12 0TOWN & COUNTRY 10,854 12 149 1,372.8 8 0 1 4 3 141 28 111 2 0UNIVERSITY CITY 35,500 12 1,661 4,678.9 194 0 7 68 119 1,467 366 995 95 11VELDA CITY 1,425 12 53 3,719.3 16 0 0 3 13 37 23 9 5 0VELDA VILLAGE HILLS 1,059 12 52 4,910.3 3 0 0 1 2 49 31 14 4 0VINITA PARK 1,887 12 65 3,444.6 10 0 0 2 8 55 15 37 3 0WARSON WOODS 1,969 12 20 1,015.7 1 0 0 1 0 19 3 16 0 0WEBSTER GROVES 23,079 12 384 1,663.9 33 0 3 5 25 351 95 228 25 3WELLSTON 2,321 12 211 9,090.9 55 2 2 14 37 156 64 55 29 8WOODSON TERRACE 4,078 12 155 3,800.9 17 0 2 5 10 138 36 70 31 1BEVERLY HILLS 576 12 60 10,416.7 10 0 0 1 9 50 25 24 1 0UPLANDS PARK 447 12 29 6,487.7 8 0 0 2 6 21 16 4 1 0BELLERIVE ACRES 189 12 4 2,116.4 0 0 0 0 0 4 0 4 0 0OAKLAND 1,386 12 18 1,298.7 0 0 0 0 0 18 1 16 0 1CHESTERFIELD 47,657 12 779 1,634.6 33 0 3 9 21 746 76 654 15 1
STE GENEVIEVE COUNTY 18,211 . 274 1,504.6 66 0 2 0 64 208 33 152 17 6STE GENEVIEVE CO - RURAL 13,424 12 180 1,340.9 59 0 2 0 57 121 23 78 15 5STE GENEVIEVE 4,426 12 88 1,988.3 7 0 0 0 7 81 10 68 2 1ST. MARYS 361 12 6 1,662.0 0 0 0 0 0 6 0 6 0 0
SALINE COUNTY 23,576 . 539 2,286.2 69 0 10 3 56 470 107 346 15 2SALINE CO - RURAL 6,628 12 118 1,780.3 26 0 2 3 21 92 44 46 2 0MARSHALL 13,112 12 359 2,737.9 33 0 7 0 26 326 55 260 11 0SLATER 1,863 12 35 1,878.7 0 0 0 0 0 35 4 29 1 1SWEET SPRINGS 1,489 12 27 1,813.3 10 0 1 0 9 17 4 11 1 1BLACKBURN 250 0 0 0.0 0 0 0 0 0 0 0 0 0 0EMMA 234 0 0 0.0 0 0 0 0 0 0 0 0 0 0
SCHUYLER COUNTY 4,447 . 45 1,011.9 1 0 0 0 1 44 13 23 7 1SCHUYLER CO - RURAL 3,847 12 45 1,169.7 1 0 0 0 1 44 13 23 7 1QUEEN CITY 600 12 0 0.0 0 0 0 0 0 0 0 0 0 0
SCOTLAND COUNTY 4,861 . 51 1,049.2 1 0 0 0 1 50 11 36 3 0SCOTLAND CO - RURAL 3,032 12 25 824.5 1 0 0 0 1 24 8 15 1 0MEMPHIS 1,829 12 26 1,421.5 0 0 0 0 0 26 3 21 2 0
SCOTT COUNTY 41,079 . 1,485 3,615.0 335 2 5 30 298 1,150 222 870 45 13SCOTT CO - RURAL 14,167 12 121 854.1 24 0 0 1 23 97 32 56 9 0CHAFFEE 2,966 12 80 2,697.2 4 0 0 0 4 76 25 51 0 0ORAN 1,299 12 26 2,001.5 4 0 0 0 4 22 5 17 0 0SCOTT CITY 4,582 12 158 3,448.3 16 0 0 1 15 142 25 107 5 5SIKESTON 16,377 12 1,042 6,362.6 266 2 5 28 231 776 129 609 30 8MORLEY 700 7 7 1,000.0 7 0 0 0 7 0 0 0 0 0MINER 988 12 51 5,161.9 14 0 0 0 14 37 6 30 1 0
SHANNON COUNTY 7,798 . 155 1,987.7 11 0 0 1 10 144 47 81 13 3
Crime In Missouri, 2011 102 Section 6.1
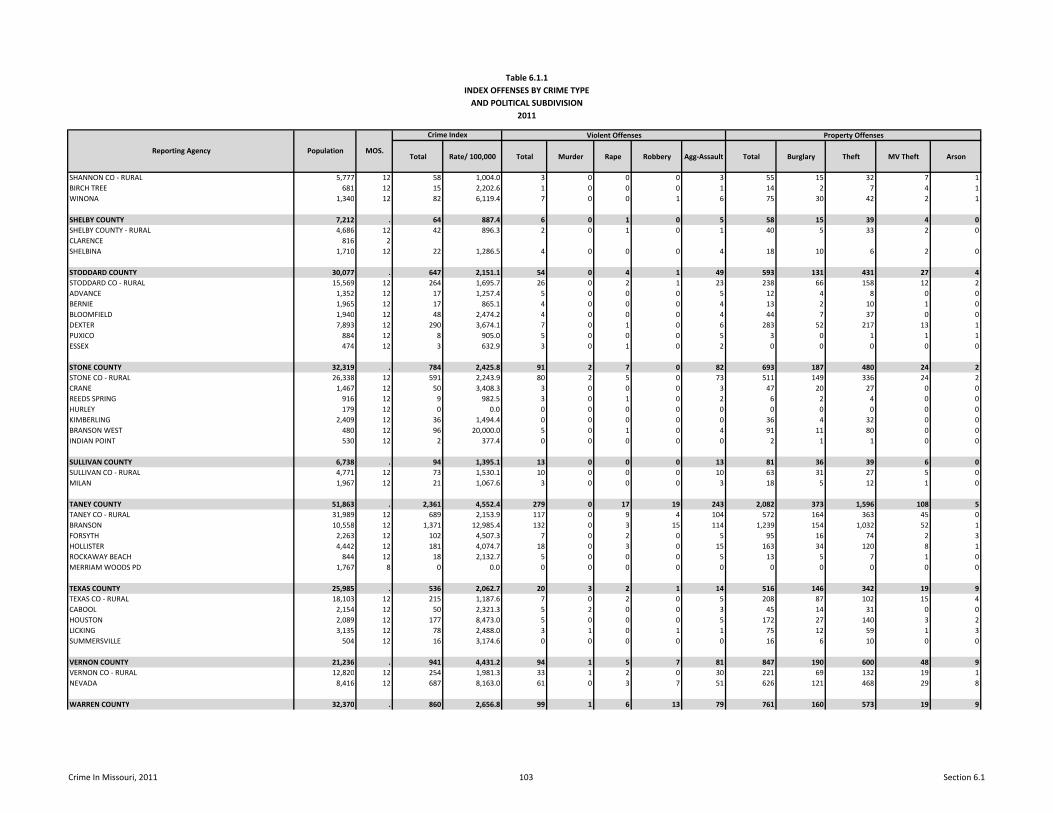
Table 6.1.1INDEX OFFENSES BY CRIME TYPE
AND POLITICAL SUBDIVISION2011
Total Rate/ 100,000 Total Murder Rape Robbery Agg-Assault Total Burglary Theft MV Theft Arson
Violent Offenses Property Offenses
Reporting Agency Population MOS.
Crime Index
SHANNON CO - RURAL 5,777 12 58 1,004.0 3 0 0 0 3 55 15 32 7 1BIRCH TREE 681 12 15 2,202.6 1 0 0 0 1 14 2 7 4 1WINONA 1,340 12 82 6,119.4 7 0 0 1 6 75 30 42 2 1
SHELBY COUNTY 7,212 . 64 887.4 6 0 1 0 5 58 15 39 4 0SHELBY COUNTY - RURAL 4,686 12 42 896.3 2 0 1 0 1 40 5 33 2 0CLARENCE 816 2SHELBINA 1,710 12 22 1,286.5 4 0 0 0 4 18 10 6 2 0
STODDARD COUNTY 30,077 . 647 2,151.1 54 0 4 1 49 593 131 431 27 4STODDARD CO - RURAL 15,569 12 264 1,695.7 26 0 2 1 23 238 66 158 12 2ADVANCE 1,352 12 17 1,257.4 5 0 0 0 5 12 4 8 0 0BERNIE 1,965 12 17 865.1 4 0 0 0 4 13 2 10 1 0BLOOMFIELD 1,940 12 48 2,474.2 4 0 0 0 4 44 7 37 0 0DEXTER 7,893 12 290 3,674.1 7 0 1 0 6 283 52 217 13 1PUXICO 884 12 8 905.0 5 0 0 0 5 3 0 1 1 1ESSEX 474 12 3 632.9 3 0 1 0 2 0 0 0 0 0
STONE COUNTY 32,319 . 784 2,425.8 91 2 7 0 82 693 187 480 24 2STONE CO - RURAL 26,338 12 591 2,243.9 80 2 5 0 73 511 149 336 24 2CRANE 1,467 12 50 3,408.3 3 0 0 0 3 47 20 27 0 0REEDS SPRING 916 12 9 982.5 3 0 1 0 2 6 2 4 0 0HURLEY 179 12 0 0.0 0 0 0 0 0 0 0 0 0 0KIMBERLING 2,409 12 36 1,494.4 0 0 0 0 0 36 4 32 0 0BRANSON WEST 480 12 96 20,000.0 5 0 1 0 4 91 11 80 0 0INDIAN POINT 530 12 2 377.4 0 0 0 0 0 2 1 1 0 0
SULLIVAN COUNTY 6,738 . 94 1,395.1 13 0 0 0 13 81 36 39 6 0SULLIVAN CO - RURAL 4,771 12 73 1,530.1 10 0 0 0 10 63 31 27 5 0MILAN 1,967 12 21 1,067.6 3 0 0 0 3 18 5 12 1 0
TANEY COUNTY 51,863 . 2,361 4,552.4 279 0 17 19 243 2,082 373 1,596 108 5TANEY CO - RURAL 31,989 12 689 2,153.9 117 0 9 4 104 572 164 363 45 0BRANSON 10,558 12 1,371 12,985.4 132 0 3 15 114 1,239 154 1,032 52 1FORSYTH 2,263 12 102 4,507.3 7 0 2 0 5 95 16 74 2 3HOLLISTER 4,442 12 181 4,074.7 18 0 3 0 15 163 34 120 8 1ROCKAWAY BEACH 844 12 18 2,132.7 5 0 0 0 5 13 5 7 1 0MERRIAM WOODS PD 1,767 8 0 0.0 0 0 0 0 0 0 0 0 0 0
TEXAS COUNTY 25,985 . 536 2,062.7 20 3 2 1 14 516 146 342 19 9TEXAS CO - RURAL 18,103 12 215 1,187.6 7 0 2 0 5 208 87 102 15 4CABOOL 2,154 12 50 2,321.3 5 2 0 0 3 45 14 31 0 0HOUSTON 2,089 12 177 8,473.0 5 0 0 0 5 172 27 140 3 2LICKING 3,135 12 78 2,488.0 3 1 0 1 1 75 12 59 1 3SUMMERSVILLE 504 12 16 3,174.6 0 0 0 0 0 16 6 10 0 0
VERNON COUNTY 21,236 . 941 4,431.2 94 1 5 7 81 847 190 600 48 9VERNON CO - RURAL 12,820 12 254 1,981.3 33 1 2 0 30 221 69 132 19 1NEVADA 8,416 12 687 8,163.0 61 0 3 7 51 626 121 468 29 8
WARREN COUNTY 32,370 . 860 2,656.8 99 1 6 13 79 761 160 573 19 9
Crime In Missouri, 2011 103 Section 6.1
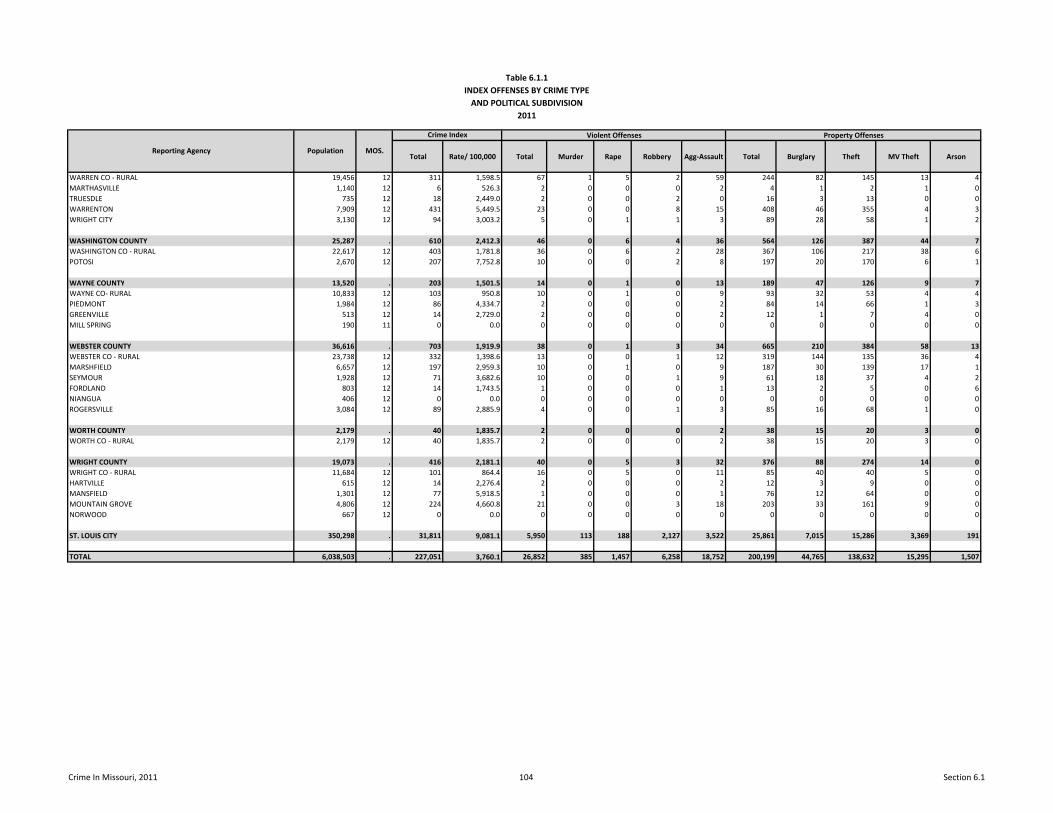
Table 6.1.1INDEX OFFENSES BY CRIME TYPE
AND POLITICAL SUBDIVISION2011
Total Rate/ 100,000 Total Murder Rape Robbery Agg-Assault Total Burglary Theft MV Theft Arson
Violent Offenses Property Offenses
Reporting Agency Population MOS.
Crime Index
WARREN CO - RURAL 19,456 12 311 1,598.5 67 1 5 2 59 244 82 145 13 4MARTHASVILLE 1,140 12 6 526.3 2 0 0 0 2 4 1 2 1 0TRUESDLE 735 12 18 2,449.0 2 0 0 2 0 16 3 13 0 0WARRENTON 7,909 12 431 5,449.5 23 0 0 8 15 408 46 355 4 3WRIGHT CITY 3,130 12 94 3,003.2 5 0 1 1 3 89 28 58 1 2
WASHINGTON COUNTY 25,287 . 610 2,412.3 46 0 6 4 36 564 126 387 44 7WASHINGTON CO - RURAL 22,617 12 403 1,781.8 36 0 6 2 28 367 106 217 38 6POTOSI 2,670 12 207 7,752.8 10 0 0 2 8 197 20 170 6 1
WAYNE COUNTY 13,520 . 203 1,501.5 14 0 1 0 13 189 47 126 9 7WAYNE CO- RURAL 10,833 12 103 950.8 10 0 1 0 9 93 32 53 4 4PIEDMONT 1,984 12 86 4,334.7 2 0 0 0 2 84 14 66 1 3GREENVILLE 513 12 14 2,729.0 2 0 0 0 2 12 1 7 4 0MILL SPRING 190 11 0 0.0 0 0 0 0 0 0 0 0 0 0
WEBSTER COUNTY 36,616 . 703 1,919.9 38 0 1 3 34 665 210 384 58 13WEBSTER CO - RURAL 23,738 12 332 1,398.6 13 0 0 1 12 319 144 135 36 4MARSHFIELD 6,657 12 197 2,959.3 10 0 1 0 9 187 30 139 17 1SEYMOUR 1,928 12 71 3,682.6 10 0 0 1 9 61 18 37 4 2FORDLAND 803 12 14 1,743.5 1 0 0 0 1 13 2 5 0 6NIANGUA 406 12 0 0.0 0 0 0 0 0 0 0 0 0 0ROGERSVILLE 3,084 12 89 2,885.9 4 0 0 1 3 85 16 68 1 0
WORTH COUNTY 2,179 . 40 1,835.7 2 0 0 0 2 38 15 20 3 0WORTH CO - RURAL 2,179 12 40 1,835.7 2 0 0 0 2 38 15 20 3 0
WRIGHT COUNTY 19,073 . 416 2,181.1 40 0 5 3 32 376 88 274 14 0WRIGHT CO - RURAL 11,684 12 101 864.4 16 0 5 0 11 85 40 40 5 0HARTVILLE 615 12 14 2,276.4 2 0 0 0 2 12 3 9 0 0MANSFIELD 1,301 12 77 5,918.5 1 0 0 0 1 76 12 64 0 0MOUNTAIN GROVE 4,806 12 224 4,660.8 21 0 0 3 18 203 33 161 9 0NORWOOD 667 12 0 0.0 0 0 0 0 0 0 0 0 0 0
ST. LOUIS CITY 350,298 . 31,811 9,081.1 5,950 113 188 2,127 3,522 25,861 7,015 15,286 3,369 191
TOTAL 6,038,503 . 227,051 3,760.1 26,852 385 1,457 6,258 18,752 200,199 44,765 138,632 15,295 1,507
Crime In Missouri, 2011 104 Section 6.1
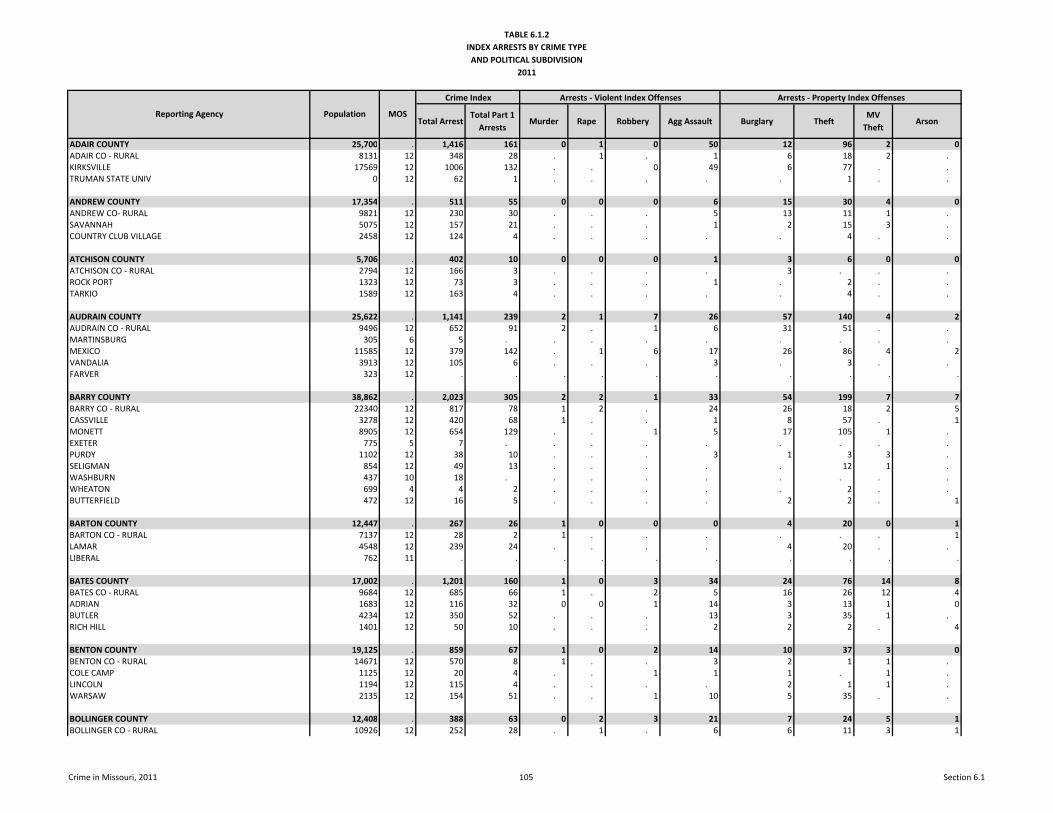
TABLE 6.1.2INDEX ARRESTS BY CRIME TYPE
AND POLITICAL SUBDIVISION2011
Total ArrestTotal Part 1
ArrestsMurder Rape Robbery Agg Assault Burglary Theft
MV Theft
Arson
ADAIR COUNTY 25,700 . 1,416 161 0 1 0 50 12 96 2 0ADAIR CO - RURAL 8131 12 348 28 . 1 . 1 6 18 2 . KIRKSVILLE 17569 12 1006 132 . . 0 49 6 77 . . TRUMAN STATE UNIV 0 12 62 1 . . . . . 1 . .
ANDREW COUNTY 17,354 . 511 55 0 0 0 6 15 30 4 0ANDREW CO- RURAL 9821 12 230 30 . . . 5 13 11 1 . SAVANNAH 5075 12 157 21 . . . 1 2 15 3 . COUNTRY CLUB VILLAGE 2458 12 124 4 . . . . . 4 . .
ATCHISON COUNTY 5,706 . 402 10 0 0 0 1 3 6 0 0ATCHISON CO - RURAL 2794 12 166 3 . . . . 3 . . . ROCK PORT 1323 12 73 3 . . . 1 . 2 . . TARKIO 1589 12 163 4 . . . . . 4 . .
AUDRAIN COUNTY 25,622 . 1,141 239 2 1 7 26 57 140 4 2AUDRAIN CO - RURAL 9496 12 652 91 2 . 1 6 31 51 . . MARTINSBURG 305 6 5 . . . . . . . . . MEXICO 11585 12 379 142 . 1 6 17 26 86 4 2VANDALIA 3913 12 105 6 . . . 3 . 3 . . FARVER 323 12 . . . . . . . . . .
BARRY COUNTY 38,862 . 2,023 305 2 2 1 33 54 199 7 7BARRY CO - RURAL 22340 12 817 78 1 2 . 24 26 18 2 5CASSVILLE 3278 12 420 68 1 . . 1 8 57 . 1MONETT 8905 12 654 129 . . 1 5 17 105 1 . EXETER 775 5 7 . . . . . . . . . PURDY 1102 12 38 10 . . . 3 1 3 3 . SELIGMAN 854 12 49 13 . . . . . 12 1 . WASHBURN 437 10 18 . . . . . . . . . WHEATON 699 4 4 2 . . . . . 2 . . BUTTERFIELD 472 12 16 5 . . . . 2 2 . 1
BARTON COUNTY 12,447 . 267 26 1 0 0 0 4 20 0 1BARTON CO - RURAL 7137 12 28 2 1 . . . . . . 1LAMAR 4548 12 239 24 . . . . 4 20 . . LIBERAL 762 11 . . . . . . . . . .
BATES COUNTY 17,002 . 1,201 160 1 0 3 34 24 76 14 8BATES CO - RURAL 9684 12 685 66 1 . 2 5 16 26 12 4ADRIAN 1683 12 116 32 0 0 1 14 3 13 1 0BUTLER 4234 12 350 52 . . . 13 3 35 1 . RICH HILL 1401 12 50 10 . . . 2 2 2 . 4
BENTON COUNTY 19,125 . 859 67 1 0 2 14 10 37 3 0BENTON CO - RURAL 14671 12 570 8 1 . . 3 2 1 1 . COLE CAMP 1125 12 20 4 . . 1 1 1 . 1 . LINCOLN 1194 12 115 4 . . . . 2 1 1 . WARSAW 2135 12 154 51 . . 1 10 5 35 . .
BOLLINGER COUNTY 12,408 . 388 63 0 2 3 21 7 24 5 1BOLLINGER CO - RURAL 10926 12 252 28 . 1 . 6 6 11 3 1
Arrests - Property Index Offenses
Reporting Agency Population MOS
Crime Index Arrests - Violent Index Offenses
Crime in Missouri, 2011 105 Section 6.1
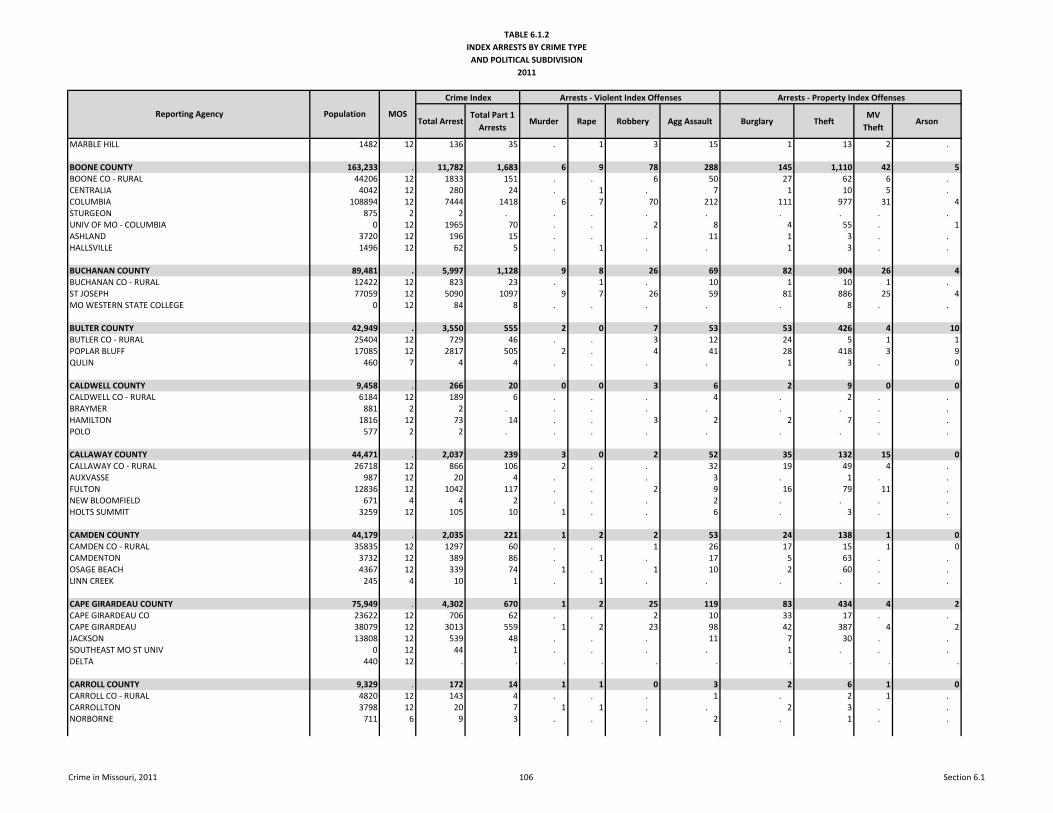
TABLE 6.1.2INDEX ARRESTS BY CRIME TYPE
AND POLITICAL SUBDIVISION2011
Total ArrestTotal Part 1
ArrestsMurder Rape Robbery Agg Assault Burglary Theft
MV Theft
Arson
Arrests - Property Index Offenses
Reporting Agency Population MOS
Crime Index Arrests - Violent Index Offenses
MARBLE HILL 1482 12 136 35 . 1 3 15 1 13 2 .
BOONE COUNTY 163,233 . 11,782 1,683 6 9 78 288 145 1,110 42 5BOONE CO - RURAL 44206 12 1833 151 . . 6 50 27 62 6 . CENTRALIA 4042 12 280 24 . 1 . 7 1 10 5 . COLUMBIA 108894 12 7444 1418 6 7 70 212 111 977 31 4STURGEON 875 2 2 . . . . . . . . . UNIV OF MO - COLUMBIA 0 12 1965 70 . . 2 8 4 55 . 1ASHLAND 3720 12 196 15 . . . 11 1 3 . . HALLSVILLE 1496 12 62 5 . 1 . . 1 3 . .
BUCHANAN COUNTY 89,481 . 5,997 1,128 9 8 26 69 82 904 26 4BUCHANAN CO - RURAL 12422 12 823 23 . 1 . 10 1 10 1 . ST JOSEPH 77059 12 5090 1097 9 7 26 59 81 886 25 4MO WESTERN STATE COLLEGE 0 12 84 8 . . . . . 8 . .
BULTER COUNTY 42,949 . 3,550 555 2 0 7 53 53 426 4 10BUTLER CO - RURAL 25404 12 729 46 . . 3 12 24 5 1 1POPLAR BLUFF 17085 12 2817 505 2 . 4 41 28 418 3 9QULIN 460 7 4 4 . . . . 1 3 . 0
CALDWELL COUNTY 9,458 . 266 20 0 0 3 6 2 9 0 0CALDWELL CO - RURAL 6184 12 189 6 . . . 4 . 2 . . BRAYMER 881 2 2 . . . . . . . . . HAMILTON 1816 12 73 14 . . 3 2 2 7 . . POLO 577 2 2 . . . . . . . . .
CALLAWAY COUNTY 44,471 . 2,037 239 3 0 2 52 35 132 15 0CALLAWAY CO - RURAL 26718 12 866 106 2 . . 32 19 49 4 . AUXVASSE 987 12 20 4 . . . 3 . 1 . . FULTON 12836 12 1042 117 . . 2 9 16 79 11 . NEW BLOOMFIELD 671 4 4 2 . . . 2 . . . . HOLTS SUMMIT 3259 12 105 10 1 . . 6 . 3 . .
CAMDEN COUNTY 44,179 . 2,035 221 1 2 2 53 24 138 1 0CAMDEN CO - RURAL 35835 12 1297 60 . . 1 26 17 15 1 0CAMDENTON 3732 12 389 86 . 1 . 17 5 63 . . OSAGE BEACH 4367 12 339 74 1 . 1 10 2 60 . . LINN CREEK 245 4 10 1 . 1 . . . . . .
CAPE GIRARDEAU COUNTY 75,949 . 4,302 670 1 2 25 119 83 434 4 2CAPE GIRARDEAU CO 23622 12 706 62 . . 2 10 33 17 . . CAPE GIRARDEAU 38079 12 3013 559 1 2 23 98 42 387 4 2JACKSON 13808 12 539 48 . . . 11 7 30 . . SOUTHEAST MO ST UNIV 0 12 44 1 . . . . 1 . . . DELTA 440 12 . . . . . . . . . .
CARROLL COUNTY 9,329 . 172 14 1 1 0 3 2 6 1 0CARROLL CO - RURAL 4820 12 143 4 . . . 1 . 2 1 . CARROLLTON 3798 12 20 7 1 1 . . 2 3 . . NORBORNE 711 6 9 3 . . . 2 . 1 . .
Crime in Missouri, 2011 106 Section 6.1
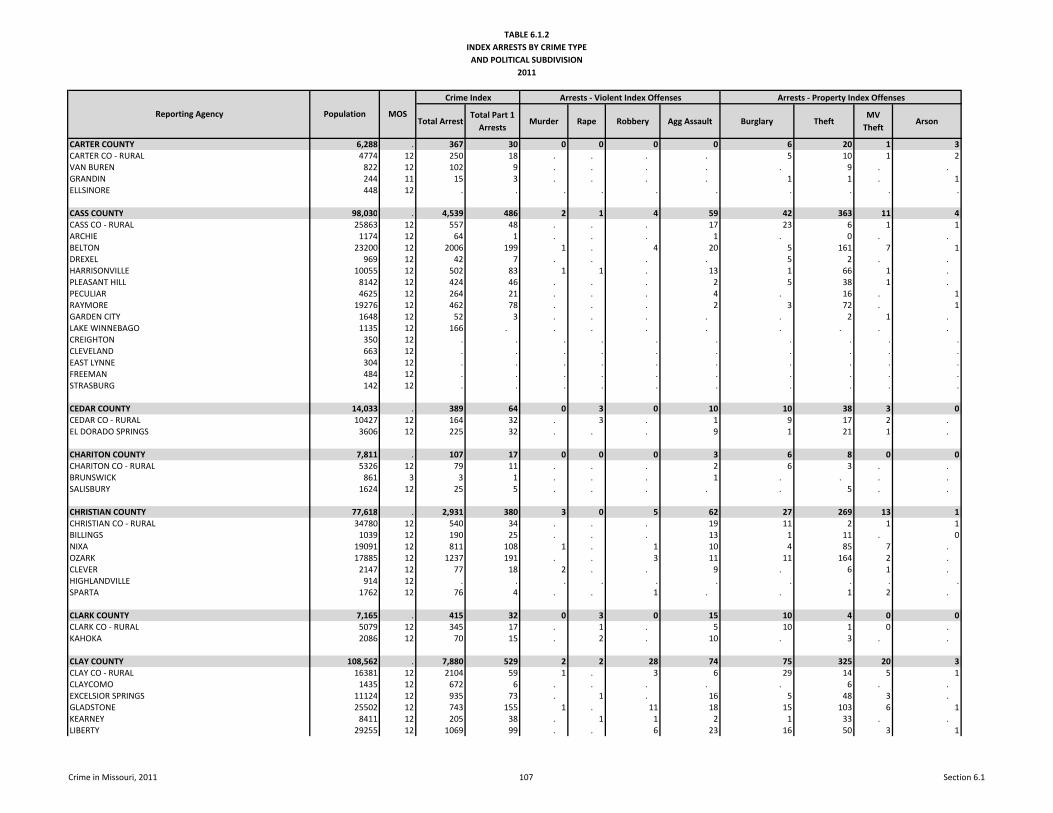
TABLE 6.1.2INDEX ARRESTS BY CRIME TYPE
AND POLITICAL SUBDIVISION2011
Total ArrestTotal Part 1
ArrestsMurder Rape Robbery Agg Assault Burglary Theft
MV Theft
Arson
Arrests - Property Index Offenses
Reporting Agency Population MOS
Crime Index Arrests - Violent Index Offenses
CARTER COUNTY 6,288 . 367 30 0 0 0 0 6 20 1 3CARTER CO - RURAL 4774 12 250 18 . . . . 5 10 1 2VAN BUREN 822 12 102 9 . . . . . 9 . . GRANDIN 244 11 15 3 . . . . 1 1 . 1ELLSINORE 448 12 . . . . . . . . . .
CASS COUNTY 98,030 . 4,539 486 2 1 4 59 42 363 11 4CASS CO - RURAL 25863 12 557 48 . . . 17 23 6 1 1ARCHIE 1174 12 64 1 . . . 1 . 0 . . BELTON 23200 12 2006 199 1 . 4 20 5 161 7 1DREXEL 969 12 42 7 . . . . 5 2 . . HARRISONVILLE 10055 12 502 83 1 1 . 13 1 66 1 . PLEASANT HILL 8142 12 424 46 . . . 2 5 38 1 . PECULIAR 4625 12 264 21 . . . 4 . 16 . 1RAYMORE 19276 12 462 78 . . . 2 3 72 . 1GARDEN CITY 1648 12 52 3 . . . . . 2 1 . LAKE WINNEBAGO 1135 12 166 . . . . . . . . . CREIGHTON 350 12 . . . . . . . . . .CLEVELAND 663 12 . . . . . . . . . .EAST LYNNE 304 12 . . . . . . . . . .FREEMAN 484 12 . . . . . . . . . .STRASBURG 142 12 . . . . . . . . . .
CEDAR COUNTY 14,033 . 389 64 0 3 0 10 10 38 3 0CEDAR CO - RURAL 10427 12 164 32 . 3 . 1 9 17 2 . EL DORADO SPRINGS 3606 12 225 32 . . . 9 1 21 1 .
CHARITON COUNTY 7,811 . 107 17 0 0 0 3 6 8 0 0CHARITON CO - RURAL 5326 12 79 11 . . . 2 6 3 . . BRUNSWICK 861 3 3 1 . . . 1 . . . . SALISBURY 1624 12 25 5 . . . . . 5 . .
CHRISTIAN COUNTY 77,618 . 2,931 380 3 0 5 62 27 269 13 1CHRISTIAN CO - RURAL 34780 12 540 34 . . . 19 11 2 1 1BILLINGS 1039 12 190 25 . . . 13 1 11 . 0NIXA 19091 12 811 108 1 . 1 10 4 85 7 . OZARK 17885 12 1237 191 . . 3 11 11 164 2 . CLEVER 2147 12 77 18 2 . . 9 . 6 1 . HIGHLANDVILLE 914 12 . . . . . . . . . .SPARTA 1762 12 76 4 . . 1 . . 1 2 .
CLARK COUNTY 7,165 . 415 32 0 3 0 15 10 4 0 0CLARK CO - RURAL 5079 12 345 17 . 1 . 5 10 1 0 . KAHOKA 2086 12 70 15 . 2 . 10 . 3 . .
CLAY COUNTY 108,562 . 7,880 529 2 2 28 74 75 325 20 3CLAY CO - RURAL 16381 12 2104 59 1 . 3 6 29 14 5 1CLAYCOMO 1435 12 672 6 . . . . . 6 . . EXCELSIOR SPRINGS 11124 12 935 73 . 1 . 16 5 48 3 . GLADSTONE 25502 12 743 155 1 . 11 18 15 103 6 1KEARNEY 8411 12 205 38 . 1 1 2 1 33 . . LIBERTY 29255 12 1069 99 . . 6 23 16 50 3 1
Crime in Missouri, 2011 107 Section 6.1
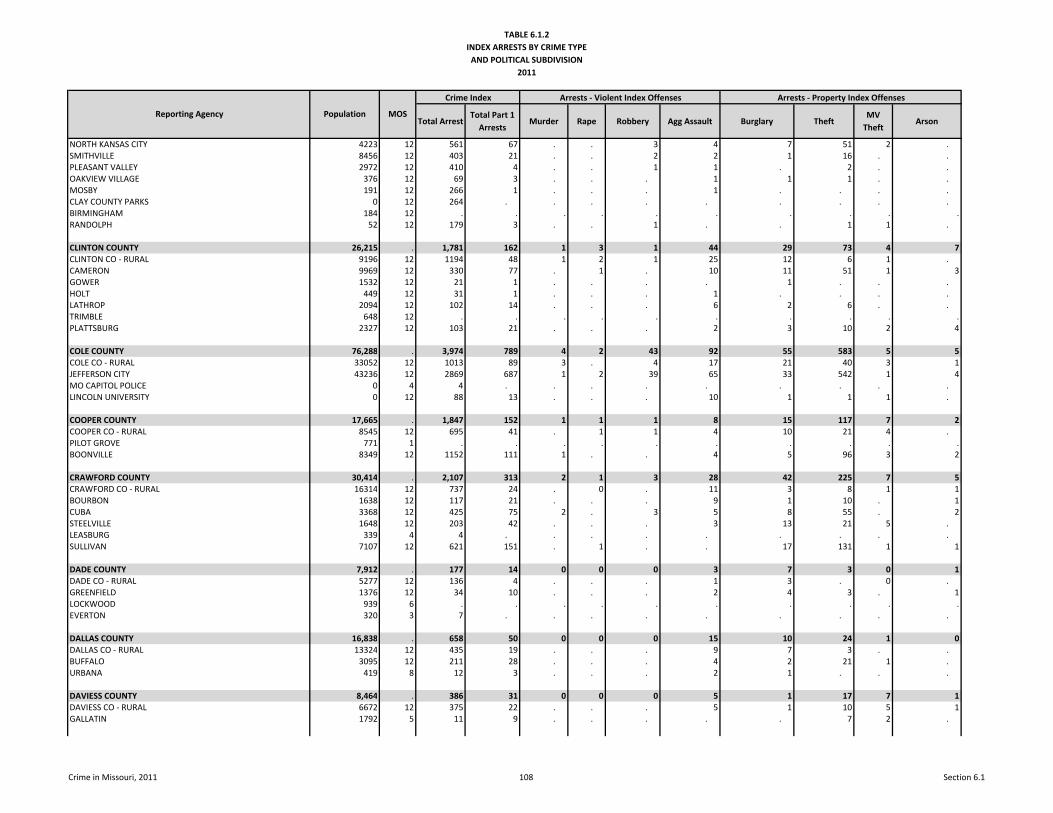
TABLE 6.1.2INDEX ARRESTS BY CRIME TYPE
AND POLITICAL SUBDIVISION2011
Total ArrestTotal Part 1
ArrestsMurder Rape Robbery Agg Assault Burglary Theft
MV Theft
Arson
Arrests - Property Index Offenses
Reporting Agency Population MOS
Crime Index Arrests - Violent Index Offenses
NORTH KANSAS CITY 4223 12 561 67 . . 3 4 7 51 2 . SMITHVILLE 8456 12 403 21 . . 2 2 1 16 . . PLEASANT VALLEY 2972 12 410 4 . . 1 1 . 2 . . OAKVIEW VILLAGE 376 12 69 3 . . . 1 1 1 . . MOSBY 191 12 266 1 . . . 1 . . . . CLAY COUNTY PARKS 0 12 264 . . . . . . . . . BIRMINGHAM 184 12 . . . . . . . . . .RANDOLPH 52 12 179 3 . . 1 . . 1 1 .
CLINTON COUNTY 26,215 . 1,781 162 1 3 1 44 29 73 4 7CLINTON CO - RURAL 9196 12 1194 48 1 2 1 25 12 6 1 . CAMERON 9969 12 330 77 . 1 . 10 11 51 1 3GOWER 1532 12 21 1 . . . . 1 . . . HOLT 449 12 31 1 . . . 1 . . . . LATHROP 2094 12 102 14 . . . 6 2 6 . . TRIMBLE 648 12 . . . . . . . . . .PLATTSBURG 2327 12 103 21 . . . 2 3 10 2 4
COLE COUNTY 76,288 . 3,974 789 4 2 43 92 55 583 5 5COLE CO - RURAL 33052 12 1013 89 3 . 4 17 21 40 3 1JEFFERSON CITY 43236 12 2869 687 1 2 39 65 33 542 1 4MO CAPITOL POLICE 0 4 4 . . . . . . . . . LINCOLN UNIVERSITY 0 12 88 13 . . . 10 1 1 1 .
COOPER COUNTY 17,665 . 1,847 152 1 1 1 8 15 117 7 2COOPER CO - RURAL 8545 12 695 41 . 1 1 4 10 21 4 . PILOT GROVE 771 1 . . . . . . . . . .BOONVILLE 8349 12 1152 111 1 . . 4 5 96 3 2
CRAWFORD COUNTY 30,414 . 2,107 313 2 1 3 28 42 225 7 5CRAWFORD CO - RURAL 16314 12 737 24 . 0 . 11 3 8 1 1BOURBON 1638 12 117 21 . . . 9 1 10 . 1CUBA 3368 12 425 75 2 . 3 5 8 55 . 2STEELVILLE 1648 12 203 42 . . . 3 13 21 5 . LEASBURG 339 4 4 . . . . . . . . . SULLIVAN 7107 12 621 151 . 1 . . 17 131 1 1
DADE COUNTY 7,912 . 177 14 0 0 0 3 7 3 0 1DADE CO - RURAL 5277 12 136 4 . . . 1 3 . 0 . GREENFIELD 1376 12 34 10 . . . 2 4 3 . 1LOCKWOOD 939 6 . . . . . . . . . .EVERTON 320 3 7 . . . . . . . . .
DALLAS COUNTY 16,838 . 658 50 0 0 0 15 10 24 1 0DALLAS CO - RURAL 13324 12 435 19 . . . 9 7 3 . . BUFFALO 3095 12 211 28 . . . 4 2 21 1 . URBANA 419 8 12 3 . . . 2 1 . . .
DAVIESS COUNTY 8,464 . 386 31 0 0 0 5 1 17 7 1DAVIESS CO - RURAL 6672 12 375 22 . . . 5 1 10 5 1GALLATIN 1792 5 11 9 . . . . . 7 2 .
Crime in Missouri, 2011 108 Section 6.1
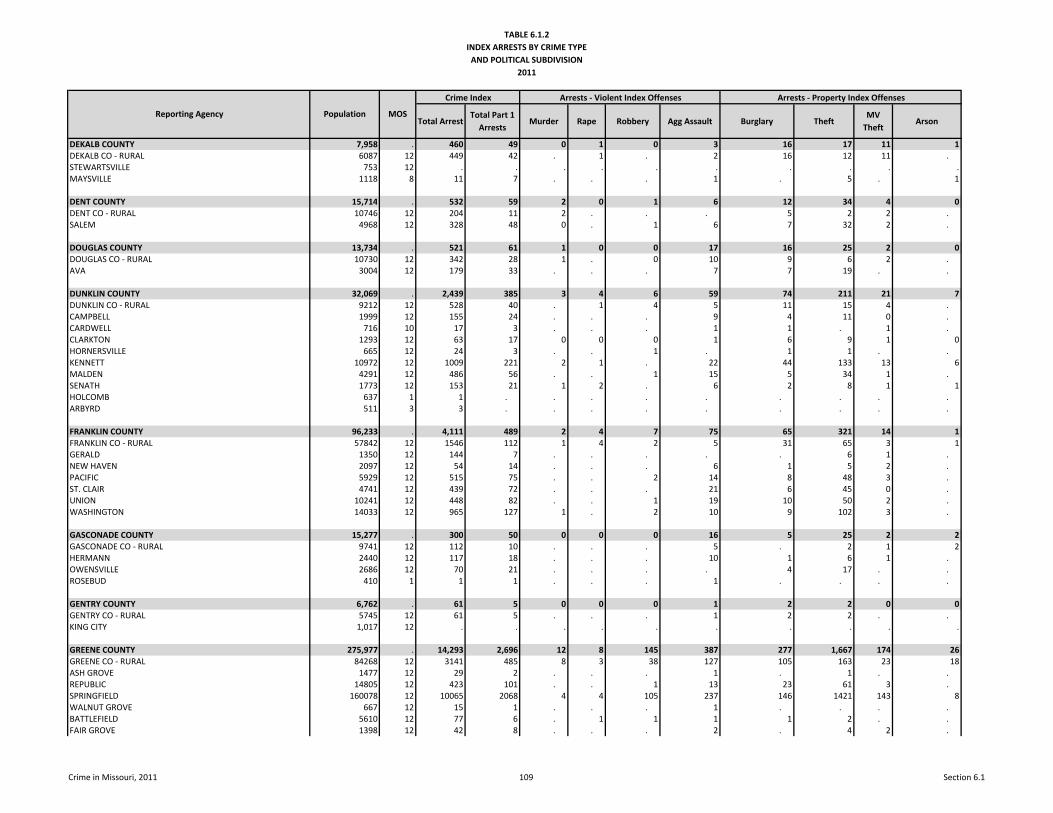
TABLE 6.1.2INDEX ARRESTS BY CRIME TYPE
AND POLITICAL SUBDIVISION2011
Total ArrestTotal Part 1
ArrestsMurder Rape Robbery Agg Assault Burglary Theft
MV Theft
Arson
Arrests - Property Index Offenses
Reporting Agency Population MOS
Crime Index Arrests - Violent Index Offenses
DEKALB COUNTY 7,958 . 460 49 0 1 0 3 16 17 11 1DEKALB CO - RURAL 6087 12 449 42 . 1 . 2 16 12 11 . STEWARTSVILLE 753 12 . . . . . . . . . .MAYSVILLE 1118 8 11 7 . . . 1 . 5 . 1
DENT COUNTY 15,714 . 532 59 2 0 1 6 12 34 4 0DENT CO - RURAL 10746 12 204 11 2 . . . 5 2 2 . SALEM 4968 12 328 48 0 . 1 6 7 32 2 .
DOUGLAS COUNTY 13,734 . 521 61 1 0 0 17 16 25 2 0DOUGLAS CO - RURAL 10730 12 342 28 1 . 0 10 9 6 2 . AVA 3004 12 179 33 . . . 7 7 19 . .
DUNKLIN COUNTY 32,069 . 2,439 385 3 4 6 59 74 211 21 7DUNKLIN CO - RURAL 9212 12 528 40 . 1 4 5 11 15 4 . CAMPBELL 1999 12 155 24 . . . 9 4 11 0 . CARDWELL 716 10 17 3 . . . 1 1 . 1 . CLARKTON 1293 12 63 17 0 0 0 1 6 9 1 0HORNERSVILLE 665 12 24 3 . . 1 . 1 1 . . KENNETT 10972 12 1009 221 2 1 . 22 44 133 13 6MALDEN 4291 12 486 56 . . 1 15 5 34 1 . SENATH 1773 12 153 21 1 2 . 6 2 8 1 1HOLCOMB 637 1 1 . . . . . . . . . ARBYRD 511 3 3 . . . . . . . . .
FRANKLIN COUNTY 96,233 . 4,111 489 2 4 7 75 65 321 14 1FRANKLIN CO - RURAL 57842 12 1546 112 1 4 2 5 31 65 3 1GERALD 1350 12 144 7 . . . . . 6 1 . NEW HAVEN 2097 12 54 14 . . . 6 1 5 2 . PACIFIC 5929 12 515 75 . . 2 14 8 48 3 . ST. CLAIR 4741 12 439 72 . . . 21 6 45 0 . UNION 10241 12 448 82 . . 1 19 10 50 2 . WASHINGTON 14033 12 965 127 1 . 2 10 9 102 3 .
GASCONADE COUNTY 15,277 . 300 50 0 0 0 16 5 25 2 2GASCONADE CO - RURAL 9741 12 112 10 . . . 5 . 2 1 2HERMANN 2440 12 117 18 . . . 10 1 6 1 . OWENSVILLE 2686 12 70 21 . . . . 4 17 . . ROSEBUD 410 1 1 1 . . . 1 . . . .
GENTRY COUNTY 6,762 . 61 5 0 0 0 1 2 2 0 0GENTRY CO - RURAL 5745 12 61 5 . . . 1 2 2 . . KING CITY 1,017 12 . . . . . . . . . .
GREENE COUNTY 275,977 . 14,293 2,696 12 8 145 387 277 1,667 174 26GREENE CO - RURAL 84268 12 3141 485 8 3 38 127 105 163 23 18ASH GROVE 1477 12 29 2 . . . 1 . 1 . . REPUBLIC 14805 12 423 101 . . 1 13 23 61 3 . SPRINGFIELD 160078 12 10065 2068 4 4 105 237 146 1421 143 8WALNUT GROVE 667 12 15 1 . . . 1 . . . . BATTLEFIELD 5610 12 77 6 . 1 1 1 1 2 . . FAIR GROVE 1398 12 42 8 . . . 2 . 4 2 .
Crime in Missouri, 2011 109 Section 6.1
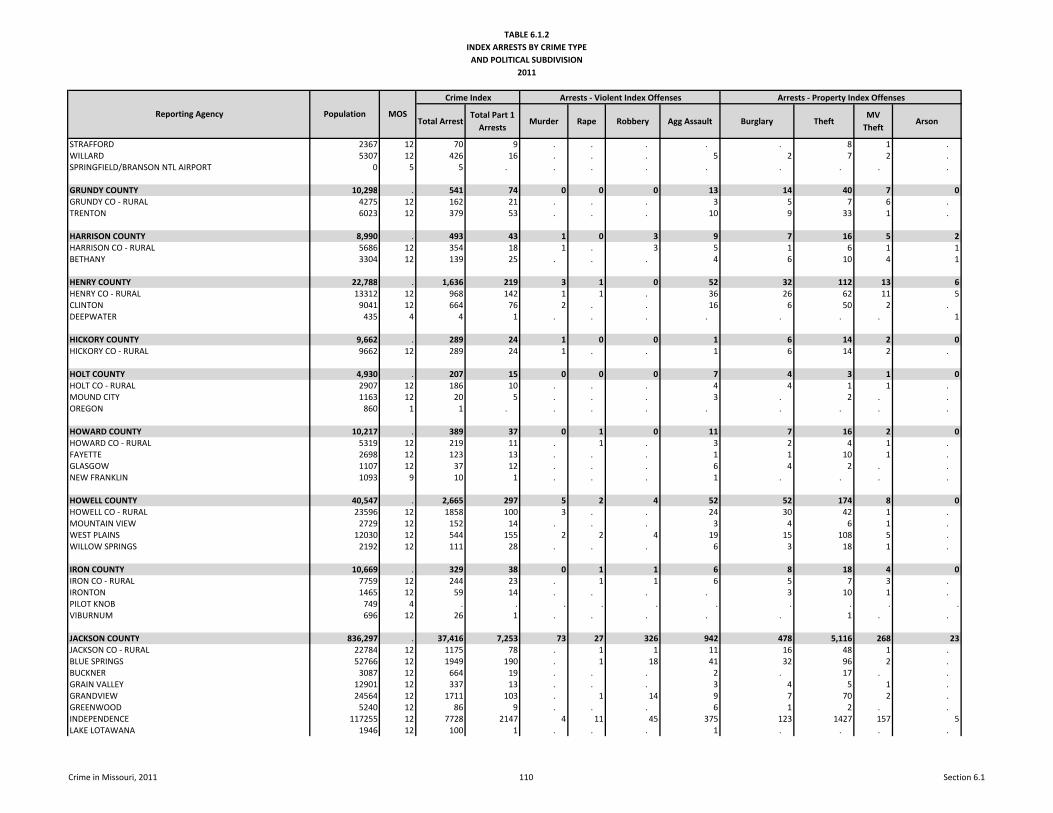
TABLE 6.1.2INDEX ARRESTS BY CRIME TYPE
AND POLITICAL SUBDIVISION2011
Total ArrestTotal Part 1
ArrestsMurder Rape Robbery Agg Assault Burglary Theft
MV Theft
Arson
Arrests - Property Index Offenses
Reporting Agency Population MOS
Crime Index Arrests - Violent Index Offenses
STRAFFORD 2367 12 70 9 . . . . . 8 1 . WILLARD 5307 12 426 16 . . . 5 2 7 2 . SPRINGFIELD/BRANSON NTL AIRPORT 0 5 5 . . . . . . . . .
GRUNDY COUNTY 10,298 . 541 74 0 0 0 13 14 40 7 0GRUNDY CO - RURAL 4275 12 162 21 . . . 3 5 7 6 . TRENTON 6023 12 379 53 . . . 10 9 33 1 .
HARRISON COUNTY 8,990 . 493 43 1 0 3 9 7 16 5 2HARRISON CO - RURAL 5686 12 354 18 1 . 3 5 1 6 1 1BETHANY 3304 12 139 25 . . . 4 6 10 4 1
HENRY COUNTY 22,788 . 1,636 219 3 1 0 52 32 112 13 6HENRY CO - RURAL 13312 12 968 142 1 1 . 36 26 62 11 5CLINTON 9041 12 664 76 2 . . 16 6 50 2 . DEEPWATER 435 4 4 1 . . . . . . . 1
HICKORY COUNTY 9,662 . 289 24 1 0 0 1 6 14 2 0HICKORY CO - RURAL 9662 12 289 24 1 . . 1 6 14 2 .
HOLT COUNTY 4,930 . 207 15 0 0 0 7 4 3 1 0HOLT CO - RURAL 2907 12 186 10 . . . 4 4 1 1 . MOUND CITY 1163 12 20 5 . . . 3 . 2 . . OREGON 860 1 1 . . . . . . . . .
HOWARD COUNTY 10,217 . 389 37 0 1 0 11 7 16 2 0HOWARD CO - RURAL 5319 12 219 11 . 1 . 3 2 4 1 . FAYETTE 2698 12 123 13 . . . 1 1 10 1 . GLASGOW 1107 12 37 12 . . . 6 4 2 . . NEW FRANKLIN 1093 9 10 1 . . . 1 . . . .
HOWELL COUNTY 40,547 . 2,665 297 5 2 4 52 52 174 8 0HOWELL CO - RURAL 23596 12 1858 100 3 . . 24 30 42 1 . MOUNTAIN VIEW 2729 12 152 14 . . . 3 4 6 1 . WEST PLAINS 12030 12 544 155 2 2 4 19 15 108 5 . WILLOW SPRINGS 2192 12 111 28 . . . 6 3 18 1 .
IRON COUNTY 10,669 . 329 38 0 1 1 6 8 18 4 0IRON CO - RURAL 7759 12 244 23 . 1 1 6 5 7 3 . IRONTON 1465 12 59 14 . . . . 3 10 1 . PILOT KNOB 749 4 . . . . . . . . . .VIBURNUM 696 12 26 1 . . . . . 1 . .
JACKSON COUNTY 836,297 . 37,416 7,253 73 27 326 942 478 5,116 268 23JACKSON CO - RURAL 22784 12 1175 78 . 1 1 11 16 48 1 . BLUE SPRINGS 52766 12 1949 190 . 1 18 41 32 96 2 . BUCKNER 3087 12 664 19 . . . 2 . 17 . . GRAIN VALLEY 12901 12 337 13 . . . 3 4 5 1 . GRANDVIEW 24564 12 1711 103 . 1 14 9 7 70 2 . GREENWOOD 5240 12 86 9 . . . 6 1 2 . . INDEPENDENCE 117255 12 7728 2147 4 11 45 375 123 1427 157 5LAKE LOTAWANA 1946 12 100 1 . . . 1 . . . .
Crime in Missouri, 2011 110 Section 6.1
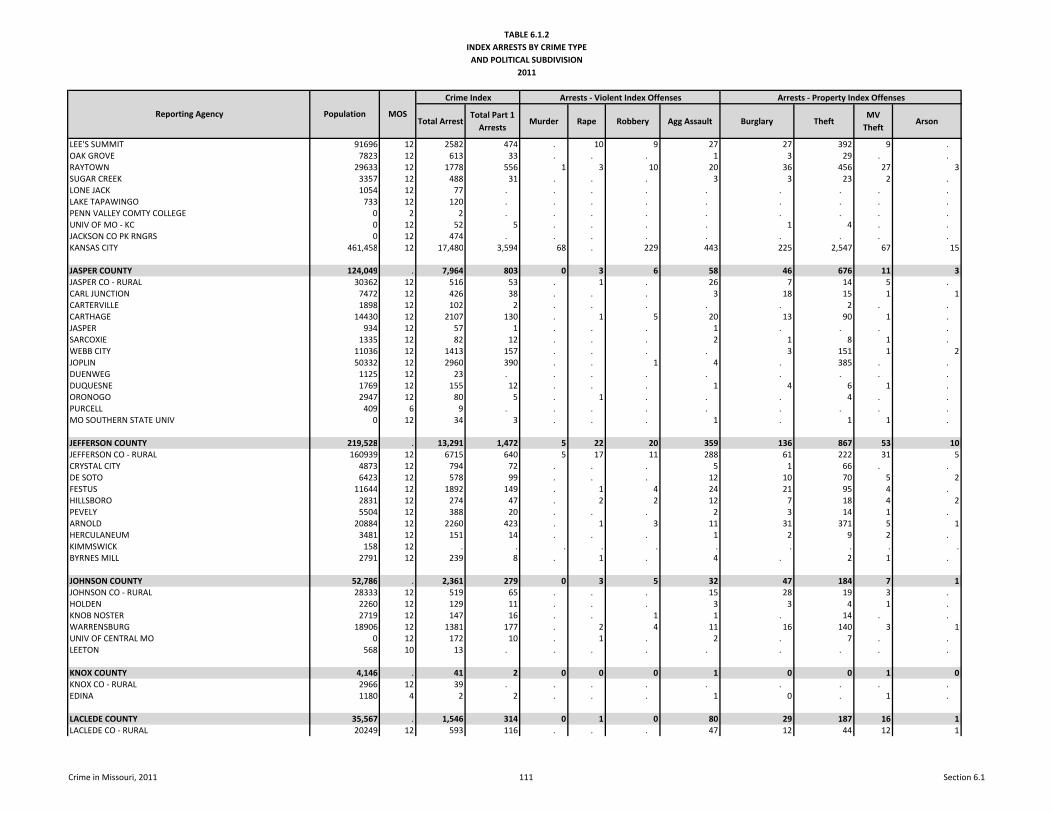
TABLE 6.1.2INDEX ARRESTS BY CRIME TYPE
AND POLITICAL SUBDIVISION2011
Total ArrestTotal Part 1
ArrestsMurder Rape Robbery Agg Assault Burglary Theft
MV Theft
Arson
Arrests - Property Index Offenses
Reporting Agency Population MOS
Crime Index Arrests - Violent Index Offenses
LEE'S SUMMIT 91696 12 2582 474 . 10 9 27 27 392 9 . OAK GROVE 7823 12 613 33 . . . 1 3 29 . . RAYTOWN 29633 12 1778 556 1 3 10 20 36 456 27 3SUGAR CREEK 3357 12 488 31 . . . 3 3 23 2 . LONE JACK 1054 12 77 . . . . . . . . . LAKE TAPAWINGO 733 12 120 . . . . . . . . . PENN VALLEY COMTY COLLEGE 0 2 2 . . . . . . . . . UNIV OF MO - KC 0 12 52 5 . . . . 1 4 . . JACKSON CO PK RNGRS 0 12 474 . . . . . . . . . KANSAS CITY 461,458 12 17,480 3,594 68 . 229 443 225 2,547 67 15
JASPER COUNTY 124,049 . 7,964 803 0 3 6 58 46 676 11 3JASPER CO - RURAL 30362 12 516 53 . 1 . 26 7 14 5 . CARL JUNCTION 7472 12 426 38 . . . 3 18 15 1 1CARTERVILLE 1898 12 102 2 . . . . . 2 . . CARTHAGE 14430 12 2107 130 . 1 5 20 13 90 1 . JASPER 934 12 57 1 . . . 1 . . . . SARCOXIE 1335 12 82 12 . . . 2 1 8 1 . WEBB CITY 11036 12 1413 157 . . . . 3 151 1 2JOPLIN 50332 12 2960 390 . . 1 4 . 385 . . DUENWEG 1125 12 23 . . . . . . . . . DUQUESNE 1769 12 155 12 . . . 1 4 6 1 . ORONOGO 2947 12 80 5 . 1 . . . 4 . . PURCELL 409 6 9 . . . . . . . . . MO SOUTHERN STATE UNIV 0 12 34 3 . . . 1 . 1 1 .
JEFFERSON COUNTY 219,528 . 13,291 1,472 5 22 20 359 136 867 53 10JEFFERSON CO - RURAL 160939 12 6715 640 5 17 11 288 61 222 31 5CRYSTAL CITY 4873 12 794 72 . . . 5 1 66 . . DE SOTO 6423 12 578 99 . . . 12 10 70 5 2FESTUS 11644 12 1892 149 . 1 4 24 21 95 4 . HILLSBORO 2831 12 274 47 . 2 2 12 7 18 4 2PEVELY 5504 12 388 20 . . . 2 3 14 1 . ARNOLD 20884 12 2260 423 . 1 3 11 31 371 5 1HERCULANEUM 3481 12 151 14 . . . 1 2 9 2 . KIMMSWICK 158 12 . . . . . . . . . .BYRNES MILL 2791 12 239 8 . 1 . 4 . 2 1 .
JOHNSON COUNTY 52,786 . 2,361 279 0 3 5 32 47 184 7 1JOHNSON CO - RURAL 28333 12 519 65 . . . 15 28 19 3 . HOLDEN 2260 12 129 11 . . . 3 3 4 1 . KNOB NOSTER 2719 12 147 16 . . 1 1 . 14 . . WARRENSBURG 18906 12 1381 177 . 2 4 11 16 140 3 1UNIV OF CENTRAL MO 0 12 172 10 . 1 . 2 . 7 . . LEETON 568 10 13 . . . . . . . . .
KNOX COUNTY 4,146 . 41 2 0 0 0 1 0 0 1 0KNOX CO - RURAL 2966 12 39 . . . . . . . . . EDINA 1180 4 2 2 . . . 1 0 . 1 .
LACLEDE COUNTY 35,567 . 1,546 314 0 1 0 80 29 187 16 1LACLEDE CO - RURAL 20249 12 593 116 . . . 47 12 44 12 1
Crime in Missouri, 2011 111 Section 6.1
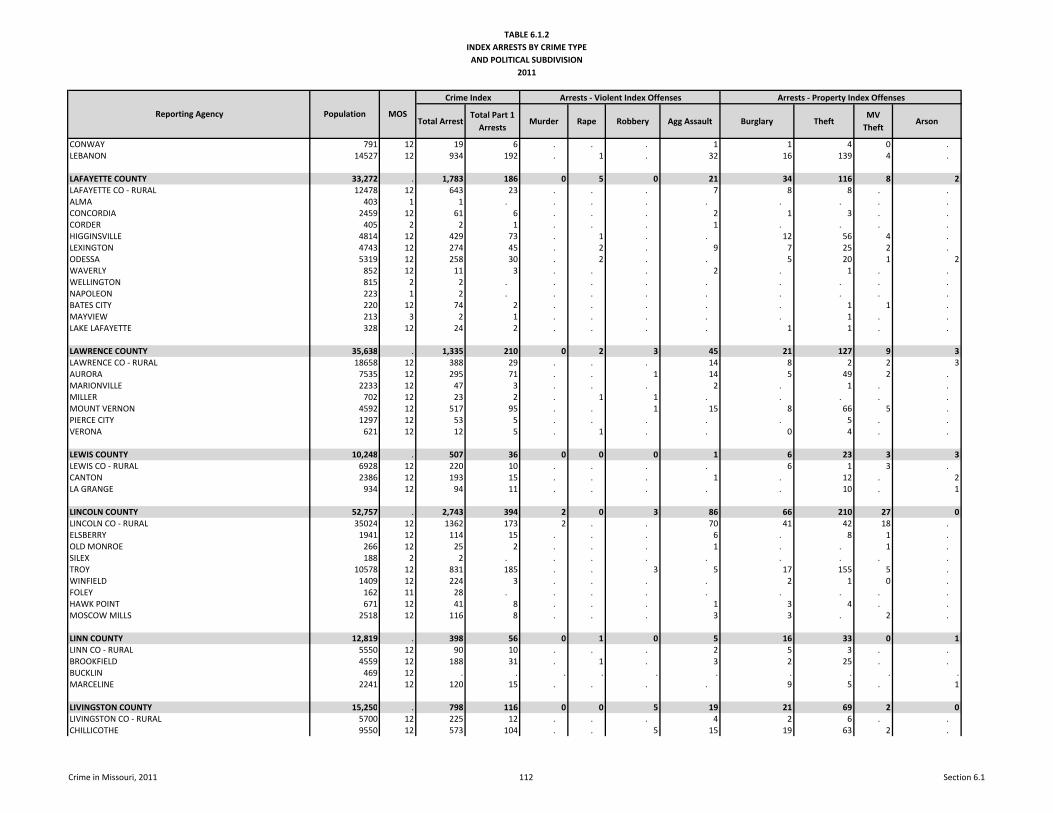
TABLE 6.1.2INDEX ARRESTS BY CRIME TYPE
AND POLITICAL SUBDIVISION2011
Total ArrestTotal Part 1
ArrestsMurder Rape Robbery Agg Assault Burglary Theft
MV Theft
Arson
Arrests - Property Index Offenses
Reporting Agency Population MOS
Crime Index Arrests - Violent Index Offenses
CONWAY 791 12 19 6 . . . 1 1 4 0 . LEBANON 14527 12 934 192 . 1 . 32 16 139 4 .
LAFAYETTE COUNTY 33,272 . 1,783 186 0 5 0 21 34 116 8 2LAFAYETTE CO - RURAL 12478 12 643 23 . . . 7 8 8 . . ALMA 403 1 1 . . . . . . . . . CONCORDIA 2459 12 61 6 . . . 2 1 3 . . CORDER 405 2 2 1 . . . 1 . . . . HIGGINSVILLE 4814 12 429 73 . 1 . . 12 56 4 . LEXINGTON 4743 12 274 45 . 2 . 9 7 25 2 . ODESSA 5319 12 258 30 . 2 . . 5 20 1 2WAVERLY 852 12 11 3 . . . 2 . 1 . . WELLINGTON 815 2 2 . . . . . . . . . NAPOLEON 223 1 2 . . . . . . . . . BATES CITY 220 12 74 2 . . . . . 1 1 . MAYVIEW 213 3 2 1 . . . . . 1 . . LAKE LAFAYETTE 328 12 24 2 . . . . 1 1 . .
LAWRENCE COUNTY 35,638 . 1,335 210 0 2 3 45 21 127 9 3LAWRENCE CO - RURAL 18658 12 388 29 . . . 14 8 2 2 3AURORA 7535 12 295 71 . . 1 14 5 49 2 . MARIONVILLE 2233 12 47 3 . . . 2 . 1 . . MILLER 702 12 23 2 . 1 1 . . . . . MOUNT VERNON 4592 12 517 95 . . 1 15 8 66 5 . PIERCE CITY 1297 12 53 5 . . . . . 5 . . VERONA 621 12 12 5 . 1 . . 0 4 . .
LEWIS COUNTY 10,248 . 507 36 0 0 0 1 6 23 3 3LEWIS CO - RURAL 6928 12 220 10 . . . . 6 1 3 . CANTON 2386 12 193 15 . . . 1 . 12 . 2LA GRANGE 934 12 94 11 . . . . . 10 . 1
LINCOLN COUNTY 52,757 . 2,743 394 2 0 3 86 66 210 27 0LINCOLN CO - RURAL 35024 12 1362 173 2 . . 70 41 42 18 . ELSBERRY 1941 12 114 15 . . . 6 . 8 1 . OLD MONROE 266 12 25 2 . . . 1 . . 1 . SILEX 188 2 2 . . . . . . . . . TROY 10578 12 831 185 . . 3 5 17 155 5 . WINFIELD 1409 12 224 3 . . . . 2 1 0 . FOLEY 162 11 28 . . . . . . . . . HAWK POINT 671 12 41 8 . . . 1 3 4 . . MOSCOW MILLS 2518 12 116 8 . . . 3 3 . 2 .
LINN COUNTY 12,819 . 398 56 0 1 0 5 16 33 0 1LINN CO - RURAL 5550 12 90 10 . . . 2 5 3 . . BROOKFIELD 4559 12 188 31 . 1 . 3 2 25 . . BUCKLIN 469 12 . . . . . . . . . .MARCELINE 2241 12 120 15 . . . . 9 5 . 1
LIVINGSTON COUNTY 15,250 . 798 116 0 0 5 19 21 69 2 0LIVINGSTON CO - RURAL 5700 12 225 12 . . . 4 2 6 . . CHILLICOTHE 9550 12 573 104 . . 5 15 19 63 2 .
Crime in Missouri, 2011 112 Section 6.1
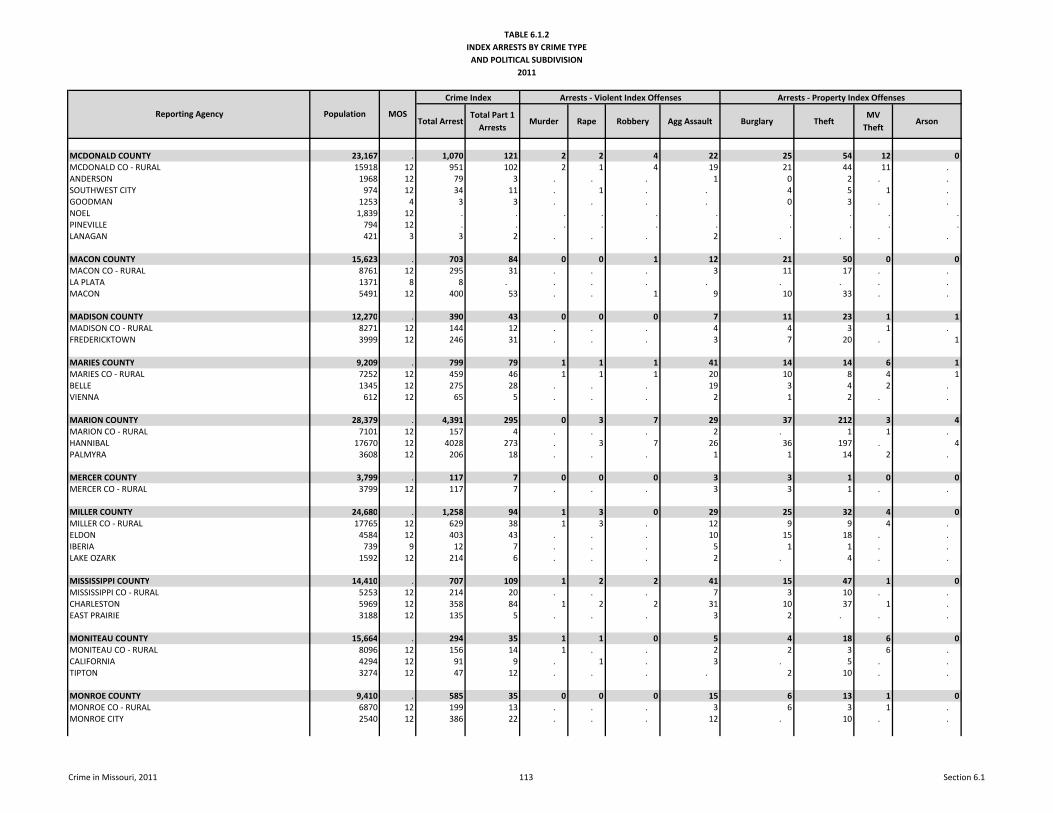
TABLE 6.1.2INDEX ARRESTS BY CRIME TYPE
AND POLITICAL SUBDIVISION2011
Total ArrestTotal Part 1
ArrestsMurder Rape Robbery Agg Assault Burglary Theft
MV Theft
Arson
Arrests - Property Index Offenses
Reporting Agency Population MOS
Crime Index Arrests - Violent Index Offenses
MCDONALD COUNTY 23,167 . 1,070 121 2 2 4 22 25 54 12 0MCDONALD CO - RURAL 15918 12 951 102 2 1 4 19 21 44 11 . ANDERSON 1968 12 79 3 . . . 1 0 2 . . SOUTHWEST CITY 974 12 34 11 . 1 . . 4 5 1 . GOODMAN 1253 4 3 3 . . . . 0 3 . . NOEL 1,839 12 . . . . . . . . . .PINEVILLE 794 12 . . . . . . . . . .LANAGAN 421 3 3 2 . . . 2 . . . .
MACON COUNTY 15,623 . 703 84 0 0 1 12 21 50 0 0MACON CO - RURAL 8761 12 295 31 . . . 3 11 17 . . LA PLATA 1371 8 8 . . . . . . . . . MACON 5491 12 400 53 . . 1 9 10 33 . .
MADISON COUNTY 12,270 . 390 43 0 0 0 7 11 23 1 1MADISON CO - RURAL 8271 12 144 12 . . . 4 4 3 1 . FREDERICKTOWN 3999 12 246 31 . . . 3 7 20 . 1
MARIES COUNTY 9,209 . 799 79 1 1 1 41 14 14 6 1MARIES CO - RURAL 7252 12 459 46 1 1 1 20 10 8 4 1BELLE 1345 12 275 28 . . . 19 3 4 2 . VIENNA 612 12 65 5 . . . 2 1 2 . .
MARION COUNTY 28,379 . 4,391 295 0 3 7 29 37 212 3 4MARION CO - RURAL 7101 12 157 4 . . . 2 . 1 1 . HANNIBAL 17670 12 4028 273 . 3 7 26 36 197 . 4PALMYRA 3608 12 206 18 . . . 1 1 14 2 .
MERCER COUNTY 3,799 . 117 7 0 0 0 3 3 1 0 0MERCER CO - RURAL 3799 12 117 7 . . . 3 3 1 . .
MILLER COUNTY 24,680 . 1,258 94 1 3 0 29 25 32 4 0MILLER CO - RURAL 17765 12 629 38 1 3 . 12 9 9 4 . ELDON 4584 12 403 43 . . . 10 15 18 . . IBERIA 739 9 12 7 . . . 5 1 1 . . LAKE OZARK 1592 12 214 6 . . . 2 . 4 . .
MISSISSIPPI COUNTY 14,410 . 707 109 1 2 2 41 15 47 1 0MISSISSIPPI CO - RURAL 5253 12 214 20 . . . 7 3 10 . . CHARLESTON 5969 12 358 84 1 2 2 31 10 37 1 . EAST PRAIRIE 3188 12 135 5 . . . 3 2 . . .
MONITEAU COUNTY 15,664 . 294 35 1 1 0 5 4 18 6 0MONITEAU CO - RURAL 8096 12 156 14 1 . . 2 2 3 6 . CALIFORNIA 4294 12 91 9 . 1 . 3 . 5 . . TIPTON 3274 12 47 12 . . . . 2 10 . .
MONROE COUNTY 9,410 . 585 35 0 0 0 15 6 13 1 0MONROE CO - RURAL 6870 12 199 13 . . . 3 6 3 1 . MONROE CITY 2540 12 386 22 . . . 12 . 10 . .
Crime in Missouri, 2011 113 Section 6.1
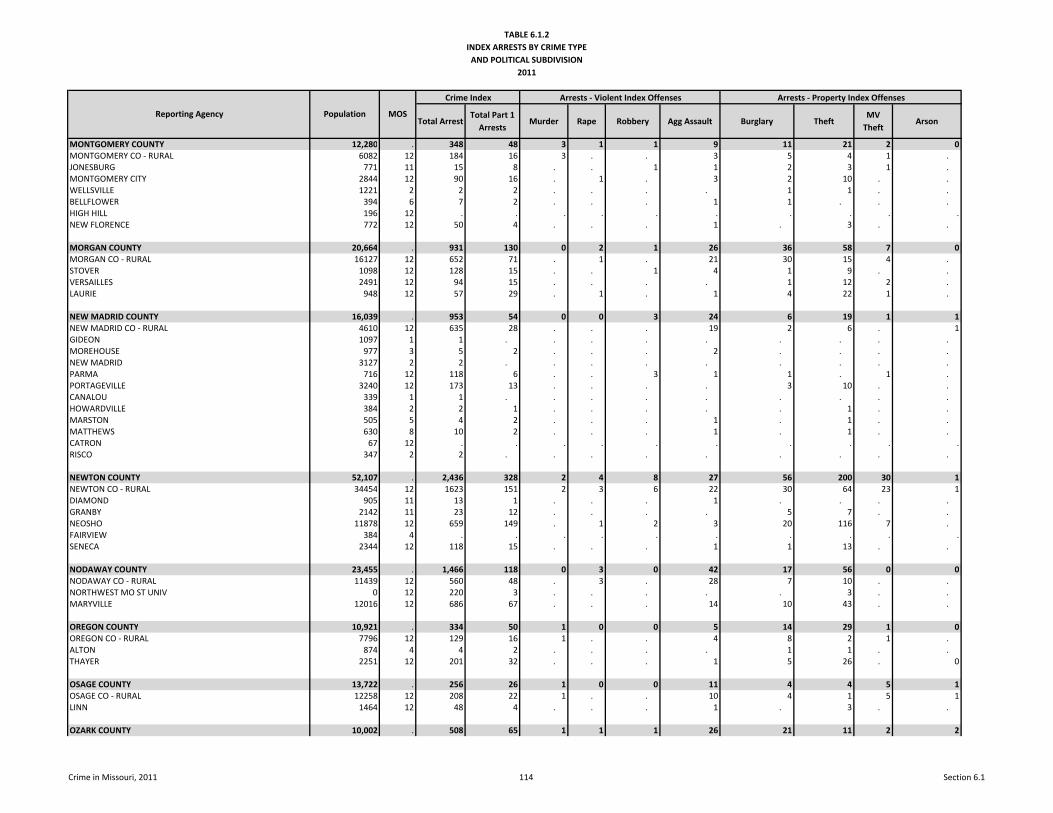
TABLE 6.1.2INDEX ARRESTS BY CRIME TYPE
AND POLITICAL SUBDIVISION2011
Total ArrestTotal Part 1
ArrestsMurder Rape Robbery Agg Assault Burglary Theft
MV Theft
Arson
Arrests - Property Index Offenses
Reporting Agency Population MOS
Crime Index Arrests - Violent Index Offenses
MONTGOMERY COUNTY 12,280 . 348 48 3 1 1 9 11 21 2 0MONTGOMERY CO - RURAL 6082 12 184 16 3 . . 3 5 4 1 . JONESBURG 771 11 15 8 . . 1 1 2 3 1 . MONTGOMERY CITY 2844 12 90 16 . 1 . 3 2 10 . . WELLSVILLE 1221 2 2 2 . . . . 1 1 . . BELLFLOWER 394 6 7 2 . . . 1 1 . . . HIGH HILL 196 12 . . . . . . . . . .NEW FLORENCE 772 12 50 4 . . . 1 . 3 . .
MORGAN COUNTY 20,664 . 931 130 0 2 1 26 36 58 7 0MORGAN CO - RURAL 16127 12 652 71 . 1 . 21 30 15 4 . STOVER 1098 12 128 15 . . 1 4 1 9 . . VERSAILLES 2491 12 94 15 . . . . 1 12 2 . LAURIE 948 12 57 29 . 1 . 1 4 22 1 .
NEW MADRID COUNTY 16,039 . 953 54 0 0 3 24 6 19 1 1NEW MADRID CO - RURAL 4610 12 635 28 . . . 19 2 6 . 1GIDEON 1097 1 1 . . . . . . . . . MOREHOUSE 977 3 5 2 . . . 2 . . . . NEW MADRID 3127 2 2 . . . . . . . . . PARMA 716 12 118 6 . . 3 1 1 . 1 . PORTAGEVILLE 3240 12 173 13 . . . . 3 10 . . CANALOU 339 1 1 . . . . . . . . . HOWARDVILLE 384 2 2 1 . . . . . 1 . . MARSTON 505 5 4 2 . . . 1 . 1 . . MATTHEWS 630 8 10 2 . . . 1 . 1 . . CATRON 67 12 . . . . . . . . . .RISCO 347 2 2 . . . . . . . . .
NEWTON COUNTY 52,107 . 2,436 328 2 4 8 27 56 200 30 1NEWTON CO - RURAL 34454 12 1623 151 2 3 6 22 30 64 23 1DIAMOND 905 11 13 1 . . . 1 . . . . GRANBY 2142 11 23 12 . . . . 5 7 . . NEOSHO 11878 12 659 149 . 1 2 3 20 116 7 . FAIRVIEW 384 4 . . . . . . . . . .SENECA 2344 12 118 15 . . . 1 1 13 . .
NODAWAY COUNTY 23,455 . 1,466 118 0 3 0 42 17 56 0 0NODAWAY CO - RURAL 11439 12 560 48 . 3 . 28 7 10 . . NORTHWEST MO ST UNIV 0 12 220 3 . . . . . 3 . . MARYVILLE 12016 12 686 67 . . . 14 10 43 . .
OREGON COUNTY 10,921 . 334 50 1 0 0 5 14 29 1 0OREGON CO - RURAL 7796 12 129 16 1 . . 4 8 2 1 . ALTON 874 4 4 2 . . . . 1 1 . . THAYER 2251 12 201 32 . . . 1 5 26 . 0
OSAGE COUNTY 13,722 . 256 26 1 0 0 11 4 4 5 1OSAGE CO - RURAL 12258 12 208 22 1 . . 10 4 1 5 1LINN 1464 12 48 4 . . . 1 . 3 . .
OZARK COUNTY 10,002 . 508 65 1 1 1 26 21 11 2 2
Crime in Missouri, 2011 114 Section 6.1
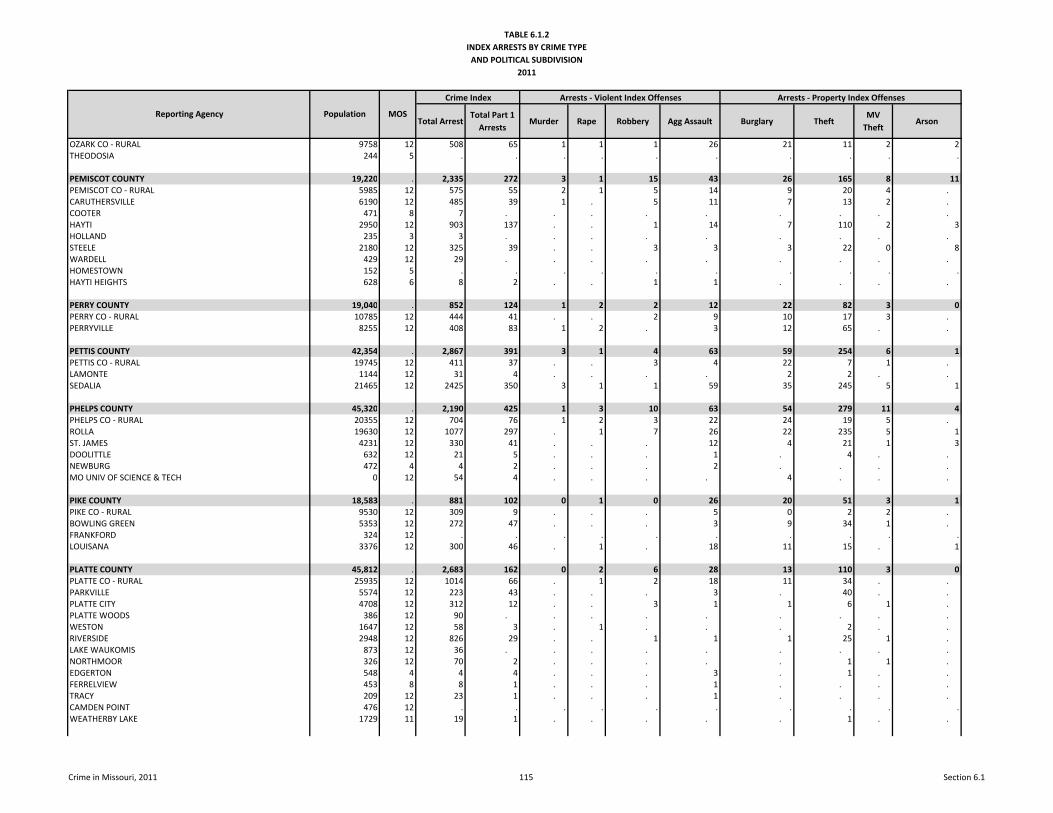
TABLE 6.1.2INDEX ARRESTS BY CRIME TYPE
AND POLITICAL SUBDIVISION2011
Total ArrestTotal Part 1
ArrestsMurder Rape Robbery Agg Assault Burglary Theft
MV Theft
Arson
Arrests - Property Index Offenses
Reporting Agency Population MOS
Crime Index Arrests - Violent Index Offenses
OZARK CO - RURAL 9758 12 508 65 1 1 1 26 21 11 2 2THEODOSIA 244 5 . . . . . . . . . .
PEMISCOT COUNTY 19,220 . 2,335 272 3 1 15 43 26 165 8 11PEMISCOT CO - RURAL 5985 12 575 55 2 1 5 14 9 20 4 . CARUTHERSVILLE 6190 12 485 39 1 . 5 11 7 13 2 . COOTER 471 8 7 . . . . . . . . . HAYTI 2950 12 903 137 . . 1 14 7 110 2 3HOLLAND 235 3 3 . . . . . . . . . STEELE 2180 12 325 39 . . 3 3 3 22 0 8WARDELL 429 12 29 . . . . . . . . . HOMESTOWN 152 5 . . . . . . . . . .HAYTI HEIGHTS 628 6 8 2 . . 1 1 . . . .
PERRY COUNTY 19,040 . 852 124 1 2 2 12 22 82 3 0PERRY CO - RURAL 10785 12 444 41 . . 2 9 10 17 3 . PERRYVILLE 8255 12 408 83 1 2 . 3 12 65 . .
PETTIS COUNTY 42,354 . 2,867 391 3 1 4 63 59 254 6 1PETTIS CO - RURAL 19745 12 411 37 . . 3 4 22 7 1 . LAMONTE 1144 12 31 4 . . . . 2 2 . . SEDALIA 21465 12 2425 350 3 1 1 59 35 245 5 1
PHELPS COUNTY 45,320 . 2,190 425 1 3 10 63 54 279 11 4PHELPS CO - RURAL 20355 12 704 76 1 2 3 22 24 19 5 . ROLLA 19630 12 1077 297 . 1 7 26 22 235 5 1ST. JAMES 4231 12 330 41 . . . 12 4 21 1 3DOOLITTLE 632 12 21 5 . . . 1 . 4 . . NEWBURG 472 4 4 2 . . . 2 . . . . MO UNIV OF SCIENCE & TECH 0 12 54 4 . . . . 4 . . .
PIKE COUNTY 18,583 . 881 102 0 1 0 26 20 51 3 1PIKE CO - RURAL 9530 12 309 9 . . . 5 0 2 2 . BOWLING GREEN 5353 12 272 47 . . . 3 9 34 1 . FRANKFORD 324 12 . . . . . . . . . .LOUISANA 3376 12 300 46 . 1 . 18 11 15 . 1
PLATTE COUNTY 45,812 . 2,683 162 0 2 6 28 13 110 3 0PLATTE CO - RURAL 25935 12 1014 66 . 1 2 18 11 34 . . PARKVILLE 5574 12 223 43 . . . 3 . 40 . . PLATTE CITY 4708 12 312 12 . . 3 1 1 6 1 . PLATTE WOODS 386 12 90 . . . . . . . . . WESTON 1647 12 58 3 . 1 . . . 2 . . RIVERSIDE 2948 12 826 29 . . 1 1 1 25 1 . LAKE WAUKOMIS 873 12 36 . . . . . . . . . NORTHMOOR 326 12 70 2 . . . . . 1 1 . EDGERTON 548 4 4 4 . . . 3 . 1 . . FERRELVIEW 453 8 8 1 . . . 1 . . . . TRACY 209 12 23 1 . . . 1 . . . . CAMDEN POINT 476 12 . . . . . . . . . .WEATHERBY LAKE 1729 11 19 1 . . . . . 1 . .
Crime in Missouri, 2011 115 Section 6.1
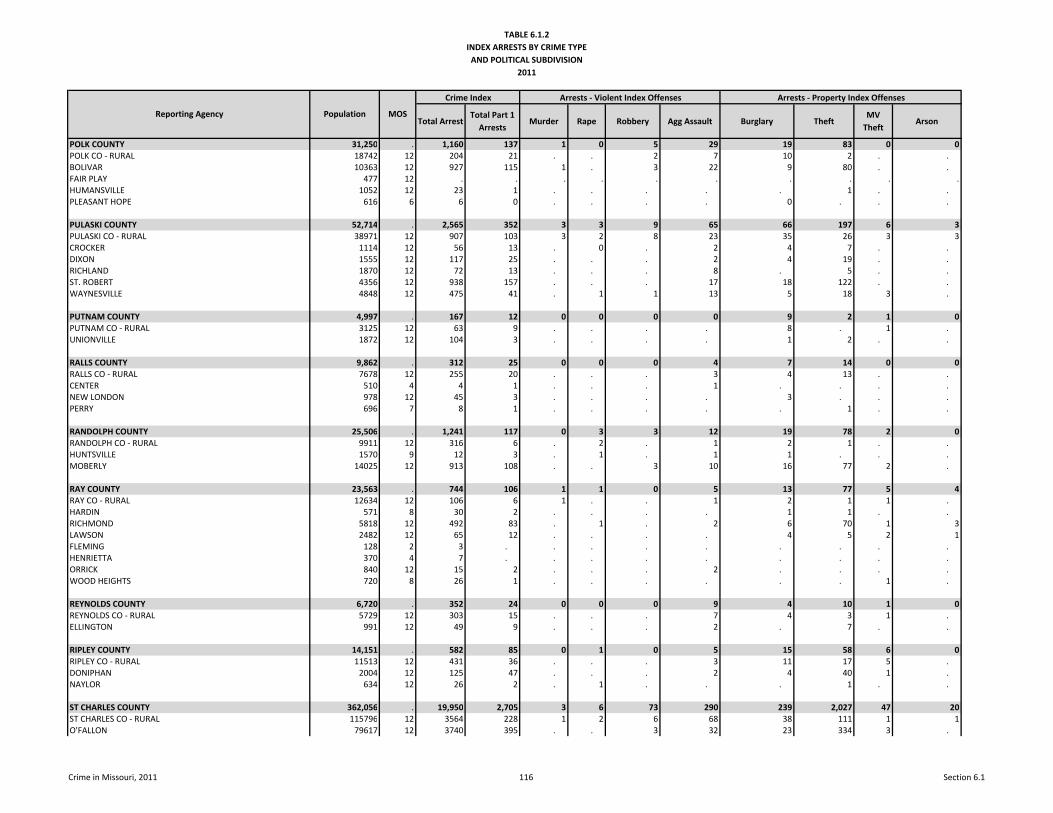
TABLE 6.1.2INDEX ARRESTS BY CRIME TYPE
AND POLITICAL SUBDIVISION2011
Total ArrestTotal Part 1
ArrestsMurder Rape Robbery Agg Assault Burglary Theft
MV Theft
Arson
Arrests - Property Index Offenses
Reporting Agency Population MOS
Crime Index Arrests - Violent Index Offenses
POLK COUNTY 31,250 . 1,160 137 1 0 5 29 19 83 0 0POLK CO - RURAL 18742 12 204 21 . . 2 7 10 2 . . BOLIVAR 10363 12 927 115 1 . 3 22 9 80 . . FAIR PLAY 477 12 . . . . . . . . . .HUMANSVILLE 1052 12 23 1 . . . . . 1 . . PLEASANT HOPE 616 6 6 0 . . . . 0 . . .
PULASKI COUNTY 52,714 . 2,565 352 3 3 9 65 66 197 6 3PULASKI CO - RURAL 38971 12 907 103 3 2 8 23 35 26 3 3CROCKER 1114 12 56 13 . 0 . 2 4 7 . . DIXON 1555 12 117 25 . . . 2 4 19 . . RICHLAND 1870 12 72 13 . . . 8 . 5 . . ST. ROBERT 4356 12 938 157 . . . 17 18 122 . . WAYNESVILLE 4848 12 475 41 . 1 1 13 5 18 3 .
PUTNAM COUNTY 4,997 . 167 12 0 0 0 0 9 2 1 0PUTNAM CO - RURAL 3125 12 63 9 . . . . 8 . 1 . UNIONVILLE 1872 12 104 3 . . . . 1 2 . .
RALLS COUNTY 9,862 . 312 25 0 0 0 4 7 14 0 0RALLS CO - RURAL 7678 12 255 20 . . . 3 4 13 . . CENTER 510 4 4 1 . . . 1 . . . . NEW LONDON 978 12 45 3 . . . . 3 . . . PERRY 696 7 8 1 . . . . . 1 . .
RANDOLPH COUNTY 25,506 . 1,241 117 0 3 3 12 19 78 2 0RANDOLPH CO - RURAL 9911 12 316 6 . 2 . 1 2 1 . . HUNTSVILLE 1570 9 12 3 . 1 . 1 1 . . . MOBERLY 14025 12 913 108 . . 3 10 16 77 2 .
RAY COUNTY 23,563 . 744 106 1 1 0 5 13 77 5 4RAY CO - RURAL 12634 12 106 6 1 . . 1 2 1 1 . HARDIN 571 8 30 2 . . . . 1 1 . . RICHMOND 5818 12 492 83 . 1 . 2 6 70 1 3LAWSON 2482 12 65 12 . . . . 4 5 2 1FLEMING 128 2 3 . . . . . . . . . HENRIETTA 370 4 7 . . . . . . . . . ORRICK 840 12 15 2 . . . 2 . . . . WOOD HEIGHTS 720 8 26 1 . . . . . . 1 .
REYNOLDS COUNTY 6,720 . 352 24 0 0 0 9 4 10 1 0REYNOLDS CO - RURAL 5729 12 303 15 . . . 7 4 3 1 . ELLINGTON 991 12 49 9 . . . 2 . 7 . .
RIPLEY COUNTY 14,151 . 582 85 0 1 0 5 15 58 6 0RIPLEY CO - RURAL 11513 12 431 36 . . . 3 11 17 5 . DONIPHAN 2004 12 125 47 . . . 2 4 40 1 . NAYLOR 634 12 26 2 . 1 . . . 1 . .
ST CHARLES COUNTY 362,056 . 19,950 2,705 3 6 73 290 239 2,027 47 20ST CHARLES CO - RURAL 115796 12 3564 228 1 2 6 68 38 111 1 1O'FALLON 79617 12 3740 395 . . 3 32 23 334 3 .
Crime in Missouri, 2011 116 Section 6.1
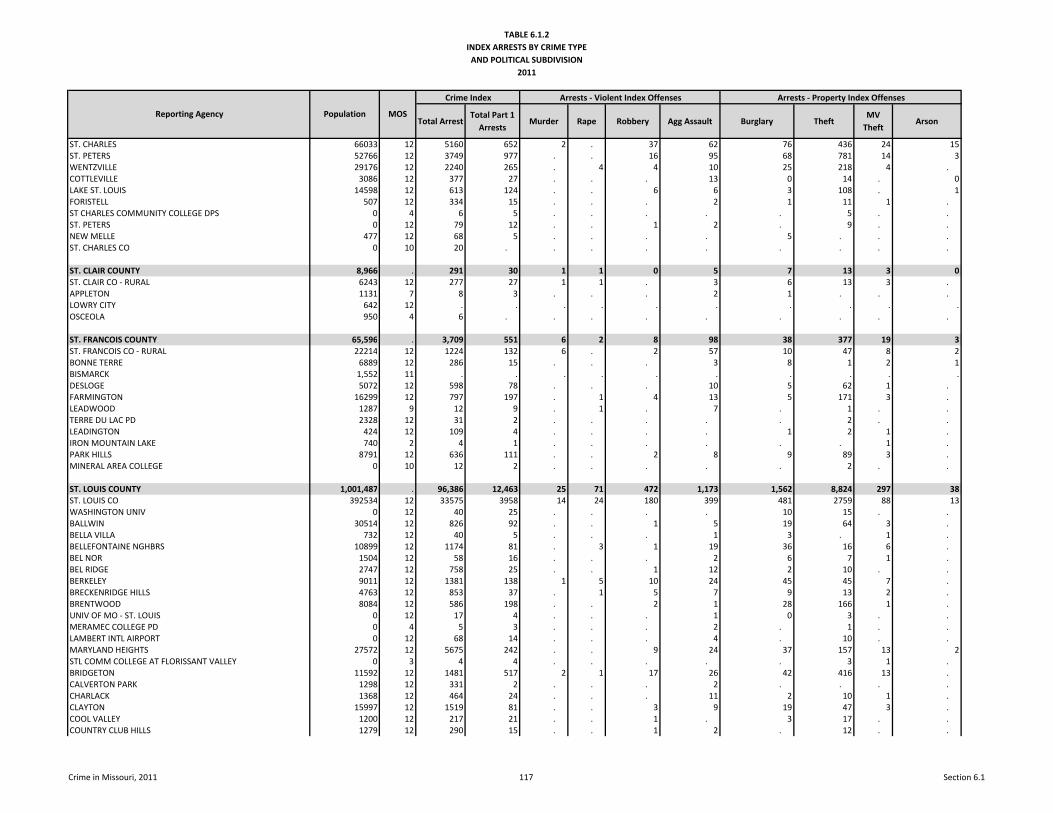
TABLE 6.1.2INDEX ARRESTS BY CRIME TYPE
AND POLITICAL SUBDIVISION2011
Total ArrestTotal Part 1
ArrestsMurder Rape Robbery Agg Assault Burglary Theft
MV Theft
Arson
Arrests - Property Index Offenses
Reporting Agency Population MOS
Crime Index Arrests - Violent Index Offenses
ST. CHARLES 66033 12 5160 652 2 . 37 62 76 436 24 15ST. PETERS 52766 12 3749 977 . . 16 95 68 781 14 3WENTZVILLE 29176 12 2240 265 . 4 4 10 25 218 4 . COTTLEVILLE 3086 12 377 27 . . . 13 0 14 . 0LAKE ST. LOUIS 14598 12 613 124 . . 6 6 3 108 . 1FORISTELL 507 12 334 15 . . . 2 1 11 1 . ST CHARLES COMMUNITY COLLEGE DPS 0 4 6 5 . . . . . 5 . . ST. PETERS 0 12 79 12 . . 1 2 . 9 . . NEW MELLE 477 12 68 5 . . . . 5 . . . ST. CHARLES CO 0 10 20 . . . . . . . . .
ST. CLAIR COUNTY 8,966 . 291 30 1 1 0 5 7 13 3 0ST. CLAIR CO - RURAL 6243 12 277 27 1 1 . 3 6 13 3 . APPLETON 1131 7 8 3 . . . 2 1 . . . LOWRY CITY 642 12 . . . . . . . . . .OSCEOLA 950 4 6 . . . . . . . . .
ST. FRANCOIS COUNTY 65,596 . 3,709 551 6 2 8 98 38 377 19 3ST. FRANCOIS CO - RURAL 22214 12 1224 132 6 . 2 57 10 47 8 2BONNE TERRE 6889 12 286 15 . . . 3 8 1 2 1BISMARCK 1,552 11 . . . . . . . . . .DESLOGE 5072 12 598 78 . . . 10 5 62 1 . FARMINGTON 16299 12 797 197 . 1 4 13 5 171 3 . LEADWOOD 1287 9 12 9 . 1 . 7 . 1 . . TERRE DU LAC PD 2328 12 31 2 . . . . . 2 . . LEADINGTON 424 12 109 4 . . . . 1 2 1 . IRON MOUNTAIN LAKE 740 2 4 1 . . . . . . 1 . PARK HILLS 8791 12 636 111 . . 2 8 9 89 3 . MINERAL AREA COLLEGE 0 10 12 2 . . . . . 2 . .
ST. LOUIS COUNTY 1,001,487 . 96,386 12,463 25 71 472 1,173 1,562 8,824 297 38ST. LOUIS CO 392534 12 33575 3958 14 24 180 399 481 2759 88 13WASHINGTON UNIV 0 12 40 25 . . . . 10 15 . . BALLWIN 30514 12 826 92 . . 1 5 19 64 3 . BELLA VILLA 732 12 40 5 . . . 1 3 . 1 . BELLEFONTAINE NGHBRS 10899 12 1174 81 . 3 1 19 36 16 6 . BEL NOR 1504 12 58 16 . . . 2 6 7 1 . BEL RIDGE 2747 12 758 25 . . 1 12 2 10 . . BERKELEY 9011 12 1381 138 1 5 10 24 45 45 7 . BRECKENRIDGE HILLS 4763 12 853 37 . 1 5 7 9 13 2 . BRENTWOOD 8084 12 586 198 . . 2 1 28 166 1 . UNIV OF MO - ST. LOUIS 0 12 17 4 . . . 1 0 3 . . MERAMEC COLLEGE PD 0 4 5 3 . . . 2 . 1 . . LAMBERT INTL AIRPORT 0 12 68 14 . . . 4 . 10 . . MARYLAND HEIGHTS 27572 12 5675 242 . . 9 24 37 157 13 2STL COMM COLLEGE AT FLORISSANT VALLEY 0 3 4 4 . . . . . 3 1 . BRIDGETON 11592 12 1481 517 2 1 17 26 42 416 13 . CALVERTON PARK 1298 12 331 2 . . . 2 . . . . CHARLACK 1368 12 464 24 . . . 11 2 10 1 . CLAYTON 15997 12 1519 81 . . 3 9 19 47 3 . COOL VALLEY 1200 12 217 21 . . 1 . 3 17 . . COUNTRY CLUB HILLS 1279 12 290 15 . . 1 2 . 12 . .
Crime in Missouri, 2011 117 Section 6.1
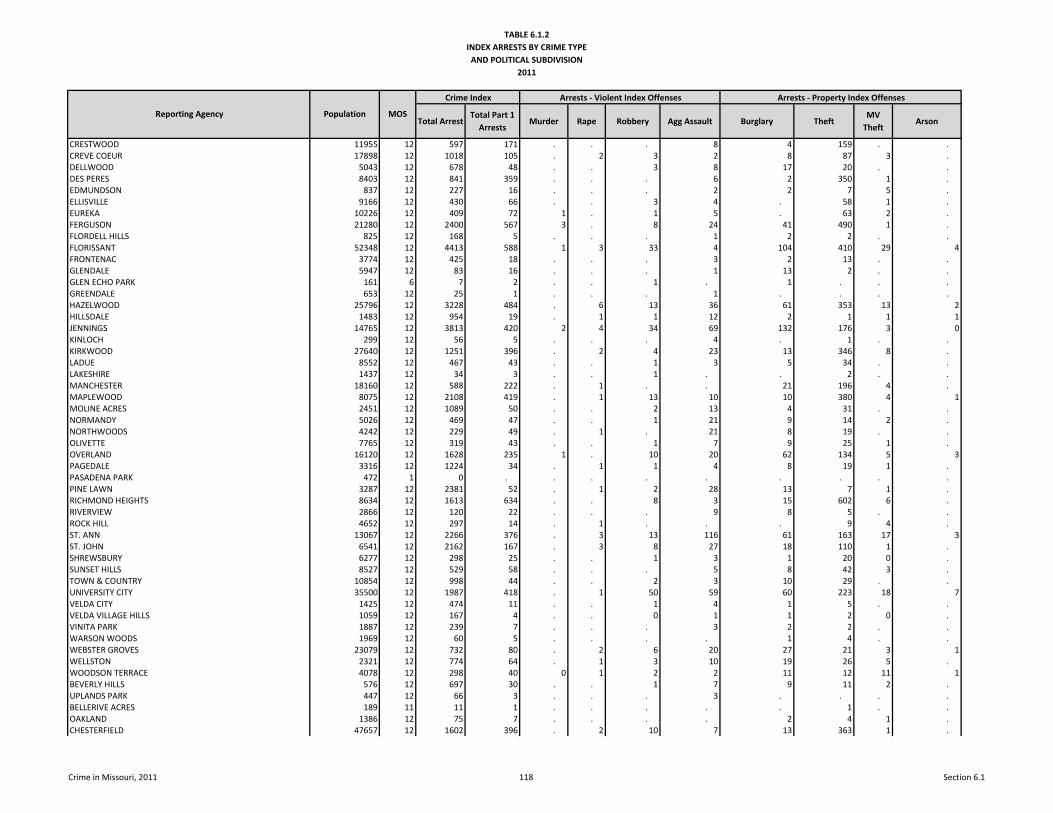
TABLE 6.1.2INDEX ARRESTS BY CRIME TYPE
AND POLITICAL SUBDIVISION2011
Total ArrestTotal Part 1
ArrestsMurder Rape Robbery Agg Assault Burglary Theft
MV Theft
Arson
Arrests - Property Index Offenses
Reporting Agency Population MOS
Crime Index Arrests - Violent Index Offenses
CRESTWOOD 11955 12 597 171 . . . 8 4 159 . . CREVE COEUR 17898 12 1018 105 . 2 3 2 8 87 3 . DELLWOOD 5043 12 678 48 . . 3 8 17 20 . . DES PERES 8403 12 841 359 . . . 6 2 350 1 . EDMUNDSON 837 12 227 16 . . . 2 2 7 5 . ELLISVILLE 9166 12 430 66 . . 3 4 . 58 1 . EUREKA 10226 12 409 72 1 . 1 5 . 63 2 . FERGUSON 21280 12 2400 567 3 . 8 24 41 490 1 . FLORDELL HILLS 825 12 168 5 . . . 1 2 2 . . FLORISSANT 52348 12 4413 588 1 3 33 4 104 410 29 4FRONTENAC 3774 12 425 18 . . . 3 2 13 . . GLENDALE 5947 12 83 16 . . . 1 13 2 . . GLEN ECHO PARK 161 6 7 2 . . 1 . 1 . . . GREENDALE 653 12 25 1 . . . 1 . . . . HAZELWOOD 25796 12 3228 484 . 6 13 36 61 353 13 2HILLSDALE 1483 12 954 19 . 1 1 12 2 1 1 1JENNINGS 14765 12 3813 420 2 4 34 69 132 176 3 0KINLOCH 299 12 56 5 . . . 4 . 1 . . KIRKWOOD 27640 12 1251 396 . 2 4 23 13 346 8 . LADUE 8552 12 467 43 . . 1 3 5 34 . . LAKESHIRE 1437 12 34 3 . . 1 . . 2 . . MANCHESTER 18160 12 588 222 . 1 . . 21 196 4 . MAPLEWOOD 8075 12 2108 419 . 1 13 10 10 380 4 1MOLINE ACRES 2451 12 1089 50 . . 2 13 4 31 . . NORMANDY 5026 12 469 47 . . 1 21 9 14 2 . NORTHWOODS 4242 12 229 49 . 1 . 21 8 19 . . OLIVETTE 7765 12 319 43 . . 1 7 9 25 1 . OVERLAND 16120 12 1628 235 1 . 10 20 62 134 5 3PAGEDALE 3316 12 1224 34 . 1 1 4 8 19 1 . PASADENA PARK 472 1 0 . . . . . . . . . PINE LAWN 3287 12 2381 52 . 1 2 28 13 7 1 . RICHMOND HEIGHTS 8634 12 1613 634 . . 8 3 15 602 6 . RIVERVIEW 2866 12 120 22 . . . 9 8 5 . . ROCK HILL 4652 12 297 14 . 1 . . . 9 4 . ST. ANN 13067 12 2266 376 . 3 13 116 61 163 17 3ST. JOHN 6541 12 2162 167 . 3 8 27 18 110 1 . SHREWSBURY 6277 12 298 25 . . 1 3 1 20 0 . SUNSET HILLS 8527 12 529 58 . . . 5 8 42 3 . TOWN & COUNTRY 10854 12 998 44 . . 2 3 10 29 . . UNIVERSITY CITY 35500 12 1987 418 . 1 50 59 60 223 18 7VELDA CITY 1425 12 474 11 . . 1 4 1 5 . . VELDA VILLAGE HILLS 1059 12 167 4 . . 0 1 1 2 0 . VINITA PARK 1887 12 239 7 . . . 3 2 2 . . WARSON WOODS 1969 12 60 5 . . . . 1 4 . . WEBSTER GROVES 23079 12 732 80 . 2 6 20 27 21 3 1WELLSTON 2321 12 774 64 . 1 3 10 19 26 5 . WOODSON TERRACE 4078 12 298 40 0 1 2 2 11 12 11 1BEVERLY HILLS 576 12 697 30 . . 1 7 9 11 2 . UPLANDS PARK 447 12 66 3 . . . 3 . . . . BELLERIVE ACRES 189 11 11 1 . . . . . 1 . . OAKLAND 1386 12 75 7 . . . . 2 4 1 . CHESTERFIELD 47657 12 1602 396 . 2 10 7 13 363 1 .
Crime in Missouri, 2011 118 Section 6.1
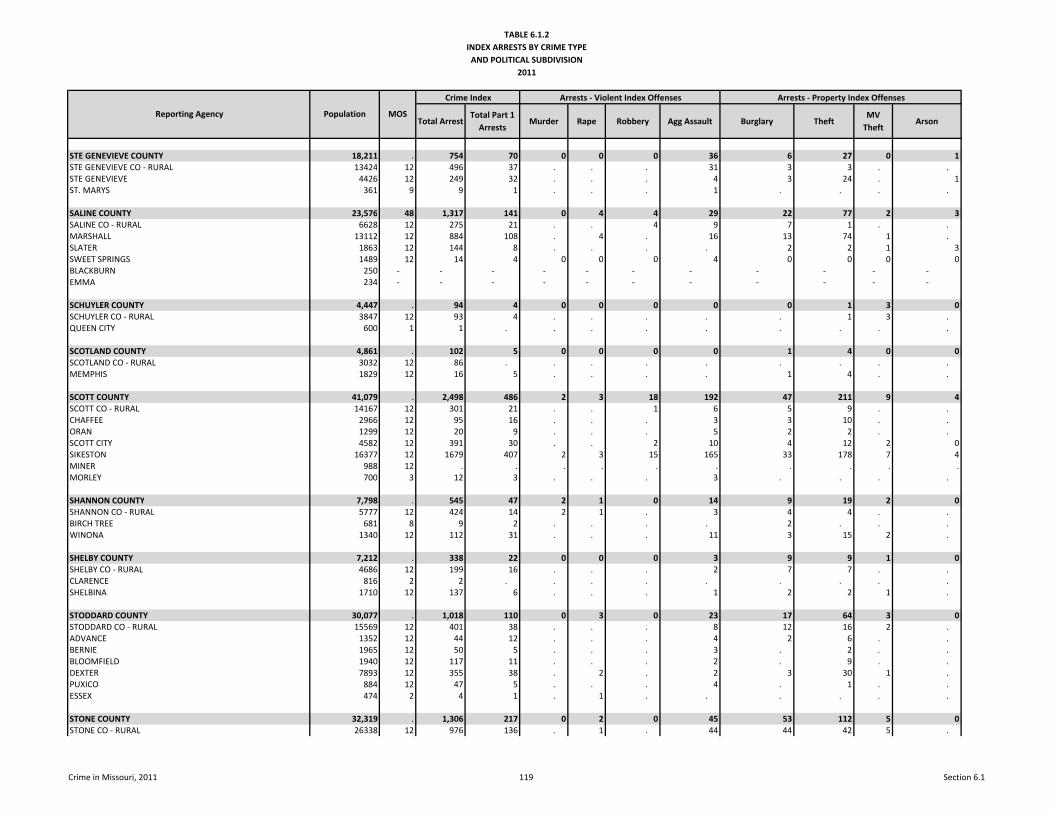
TABLE 6.1.2INDEX ARRESTS BY CRIME TYPE
AND POLITICAL SUBDIVISION2011
Total ArrestTotal Part 1
ArrestsMurder Rape Robbery Agg Assault Burglary Theft
MV Theft
Arson
Arrests - Property Index Offenses
Reporting Agency Population MOS
Crime Index Arrests - Violent Index Offenses
STE GENEVIEVE COUNTY 18,211 . 754 70 0 0 0 36 6 27 0 1STE GENEVIEVE CO - RURAL 13424 12 496 37 . . . 31 3 3 . . STE GENEVIEVE 4426 12 249 32 . . . 4 3 24 . 1ST. MARYS 361 9 9 1 . . . 1 . . . .
SALINE COUNTY 23,576 48 1,317 141 0 4 4 29 22 77 2 3SALINE CO - RURAL 6628 12 275 21 . . 4 9 7 1 . . MARSHALL 13112 12 884 108 . 4 . 16 13 74 1 . SLATER 1863 12 144 8 . . . . 2 2 1 3SWEET SPRINGS 1489 12 14 4 0 0 0 4 0 0 0 0BLACKBURN 250 - - - - - - - - - - -EMMA 234 - - - - - - - - - - -
SCHUYLER COUNTY 4,447 . 94 4 0 0 0 0 0 1 3 0SCHUYLER CO - RURAL 3847 12 93 4 . . . . . 1 3 . QUEEN CITY 600 1 1 . . . . . . . . .
SCOTLAND COUNTY 4,861 . 102 5 0 0 0 0 1 4 0 0SCOTLAND CO - RURAL 3032 12 86 . . . . . . . . . MEMPHIS 1829 12 16 5 . . . . 1 4 . .
SCOTT COUNTY 41,079 . 2,498 486 2 3 18 192 47 211 9 4SCOTT CO - RURAL 14167 12 301 21 . . 1 6 5 9 . . CHAFFEE 2966 12 95 16 . . . 3 3 10 . . ORAN 1299 12 20 9 . . . 5 2 2 . . SCOTT CITY 4582 12 391 30 . . 2 10 4 12 2 0SIKESTON 16377 12 1679 407 2 3 15 165 33 178 7 4MINER 988 12 . . . . . . . . . .MORLEY 700 3 12 3 . . . 3 . . . .
SHANNON COUNTY 7,798 . 545 47 2 1 0 14 9 19 2 0SHANNON CO - RURAL 5777 12 424 14 2 1 . 3 4 4 . . BIRCH TREE 681 8 9 2 . . . . 2 . . . WINONA 1340 12 112 31 . . . 11 3 15 2 .
SHELBY COUNTY 7,212 . 338 22 0 0 0 3 9 9 1 0SHELBY CO - RURAL 4686 12 199 16 . . . 2 7 7 . . CLARENCE 816 2 2 . . . . . . . . . SHELBINA 1710 12 137 6 . . . 1 2 2 1 .
STODDARD COUNTY 30,077 . 1,018 110 0 3 0 23 17 64 3 0STODDARD CO - RURAL 15569 12 401 38 . . . 8 12 16 2 . ADVANCE 1352 12 44 12 . . . 4 2 6 . . BERNIE 1965 12 50 5 . . . 3 . 2 . . BLOOMFIELD 1940 12 117 11 . . . 2 . 9 . . DEXTER 7893 12 355 38 . 2 . 2 3 30 1 . PUXICO 884 12 47 5 . . . 4 . 1 . . ESSEX 474 2 4 1 . 1 . . . . . .
STONE COUNTY 32,319 . 1,306 217 0 2 0 45 53 112 5 0STONE CO - RURAL 26338 12 976 136 . 1 . 44 44 42 5 .
Crime in Missouri, 2011 119 Section 6.1
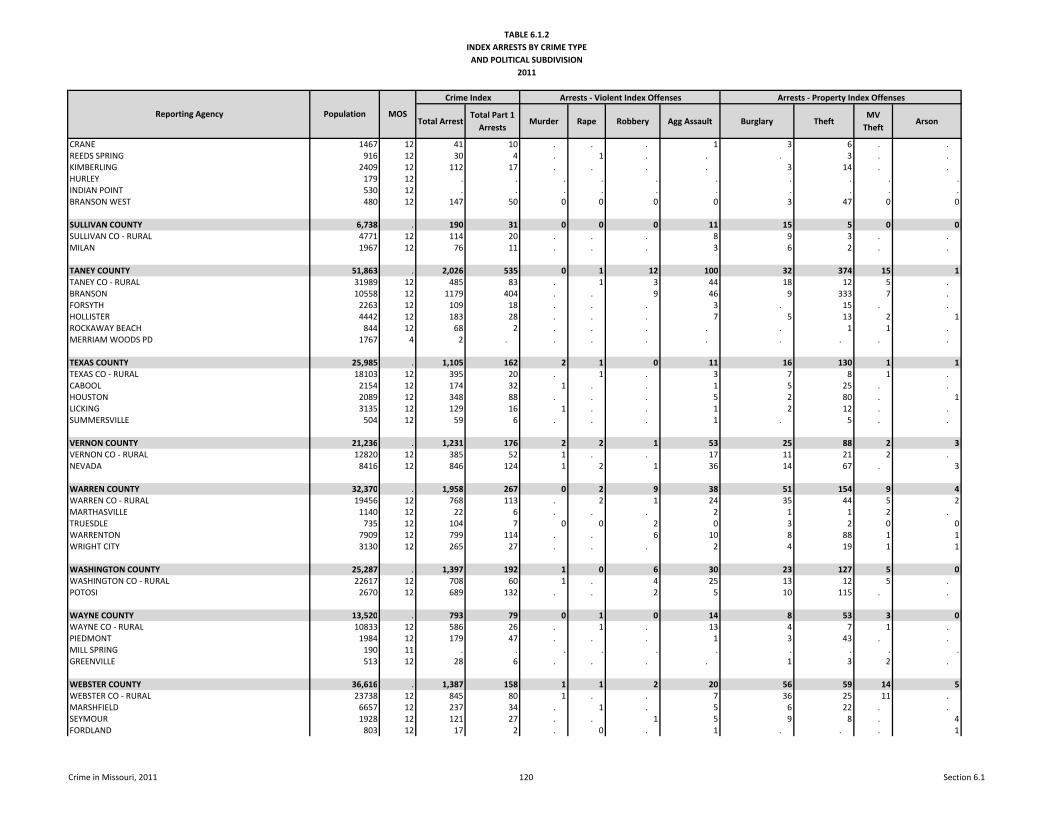
TABLE 6.1.2INDEX ARRESTS BY CRIME TYPE
AND POLITICAL SUBDIVISION2011
Total ArrestTotal Part 1
ArrestsMurder Rape Robbery Agg Assault Burglary Theft
MV Theft
Arson
Arrests - Property Index Offenses
Reporting Agency Population MOS
Crime Index Arrests - Violent Index Offenses
CRANE 1467 12 41 10 . . . 1 3 6 . . REEDS SPRING 916 12 30 4 . 1 . . . 3 . . KIMBERLING 2409 12 112 17 . . . . 3 14 . . HURLEY 179 12 . . . . . . . . . .INDIAN POINT 530 12 . . . . . . . . . .BRANSON WEST 480 12 147 50 0 0 0 0 3 47 0 0
SULLIVAN COUNTY 6,738 . 190 31 0 0 0 11 15 5 0 0SULLIVAN CO - RURAL 4771 12 114 20 . . . 8 9 3 . . MILAN 1967 12 76 11 . . . 3 6 2 . .
TANEY COUNTY 51,863 . 2,026 535 0 1 12 100 32 374 15 1TANEY CO - RURAL 31989 12 485 83 . 1 3 44 18 12 5 . BRANSON 10558 12 1179 404 . . 9 46 9 333 7 . FORSYTH 2263 12 109 18 . . . 3 . 15 . . HOLLISTER 4442 12 183 28 . . . 7 5 13 2 1ROCKAWAY BEACH 844 12 68 2 . . . . . 1 1 . MERRIAM WOODS PD 1767 4 2 . . . . . . . . .
TEXAS COUNTY 25,985 . 1,105 162 2 1 0 11 16 130 1 1TEXAS CO - RURAL 18103 12 395 20 . 1 . 3 7 8 1 . CABOOL 2154 12 174 32 1 . . 1 5 25 . . HOUSTON 2089 12 348 88 . . . 5 2 80 . 1LICKING 3135 12 129 16 1 . . 1 2 12 . . SUMMERSVILLE 504 12 59 6 . . . 1 . 5 . .
VERNON COUNTY 21,236 . 1,231 176 2 2 1 53 25 88 2 3VERNON CO - RURAL 12820 12 385 52 1 . . 17 11 21 2 . NEVADA 8416 12 846 124 1 2 1 36 14 67 . 3
WARREN COUNTY 32,370 . 1,958 267 0 2 9 38 51 154 9 4WARREN CO - RURAL 19456 12 768 113 . 2 1 24 35 44 5 2MARTHASVILLE 1140 12 22 6 . . . 2 1 1 2 . TRUESDLE 735 12 104 7 0 0 2 0 3 2 0 0WARRENTON 7909 12 799 114 . . 6 10 8 88 1 1WRIGHT CITY 3130 12 265 27 . . . 2 4 19 1 1
WASHINGTON COUNTY 25,287 . 1,397 192 1 0 6 30 23 127 5 0WASHINGTON CO - RURAL 22617 12 708 60 1 . 4 25 13 12 5 . POTOSI 2670 12 689 132 . . 2 5 10 115 . .
WAYNE COUNTY 13,520 . 793 79 0 1 0 14 8 53 3 0WAYNE CO - RURAL 10833 12 586 26 . 1 . 13 4 7 1 . PIEDMONT 1984 12 179 47 . . . 1 3 43 . . MILL SPRING 190 11 . . . . . . . . . .GREENVILLE 513 12 28 6 . . . . 1 3 2 .
WEBSTER COUNTY 36,616 . 1,387 158 1 1 2 20 56 59 14 5WEBSTER CO - RURAL 23738 12 845 80 1 . . 7 36 25 11 . MARSHFIELD 6657 12 237 34 . 1 . 5 6 22 . . SEYMOUR 1928 12 121 27 . . 1 5 9 8 . 4FORDLAND 803 12 17 2 . 0 . 1 . . . 1
Crime in Missouri, 2011 120 Section 6.1
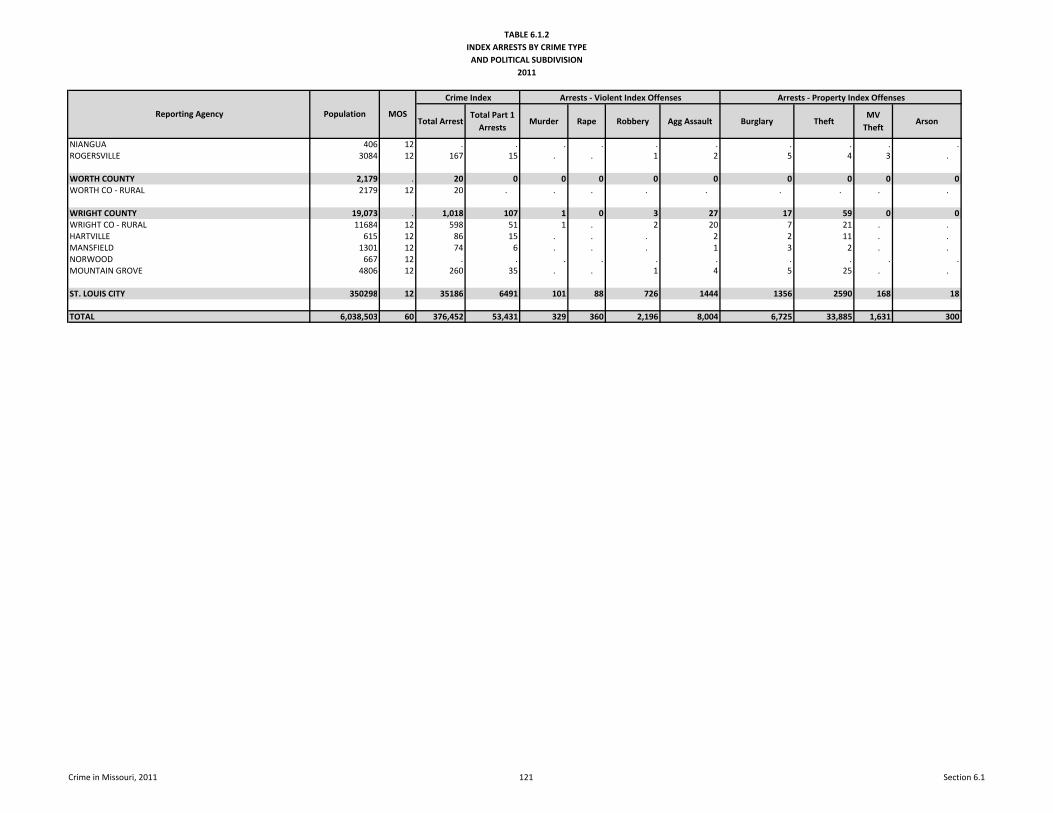
TABLE 6.1.2INDEX ARRESTS BY CRIME TYPE
AND POLITICAL SUBDIVISION2011
Total ArrestTotal Part 1
ArrestsMurder Rape Robbery Agg Assault Burglary Theft
MV Theft
Arson
Arrests - Property Index Offenses
Reporting Agency Population MOS
Crime Index Arrests - Violent Index Offenses
NIANGUA 406 12 . . . . . . . . . .ROGERSVILLE 3084 12 167 15 . . 1 2 5 4 3 .
WORTH COUNTY 2,179 . 20 0 0 0 0 0 0 0 0 0WORTH CO - RURAL 2179 12 20 . . . . . . . . .
WRIGHT COUNTY 19,073 . 1,018 107 1 0 3 27 17 59 0 0WRIGHT CO - RURAL 11684 12 598 51 1 . 2 20 7 21 . . HARTVILLE 615 12 86 15 . . . 2 2 11 . . MANSFIELD 1301 12 74 6 . . . 1 3 2 . . NORWOOD 667 12 . . . . . . . . . .MOUNTAIN GROVE 4806 12 260 35 . . 1 4 5 25 . .
ST. LOUIS CITY 350298 12 35186 6491 101 88 726 1444 1356 2590 168 18
TOTAL 6,038,503 60 376,452 53,431 329 360 2,196 8,004 6,725 33,885 1,631 300
Crime in Missouri, 2011 121 Section 6.1
122
Crime in Missouri, 2011 Section 6.2
6.2 MISSOURI POLITICAL SUBDIVISION PART II ARREST ANALYSIS
A series of tables summarizes 2011 Part II arrests for all
political subdivisions in Missouri. These arrests are also
described by age group, gender, and race. Part II arrests
include:
Simple Assault
Forgery and Counterfeiting
Fraud
Embezzlement
Stolen Property (Buying, receiving, possessing)
Vandalism
Weapons Charges (Carrying, possessing)
Prostitution or Commercialized Vice
Sex Offenses (Excluding forcible rape and
prostitution)
Drug Sale and Manufacture
Drug Possession
Gambling (Bookmaking, numbers and lottery, and
other types)
Offenses Against Family and Children
Driving Under The Influence
Boating Under the Influence
Liquor Law Violations
Drunkenness
Disorderly Conduct
Vagrancy
All Other Offenses (Except traffic)
Curfew and Loitering (Under 18)
Runaway (Under 18)

TABLE 6.2.1 PART II ARRESTS BY CRIME TYPE
AND POLITICAL SUBDIVISION2011
Agency Population Simple Assault Forgery Fraud Embezzlement Stolen Property VandalismWeapon
ChargeProstitution Vice Sex Offense Drug Sale/Manuf. Drug Possession Gambling Family Offenses DUI BUI Liquor Law Drunkenness Disorderly Conduct Vagrancy Other Offenses Curfew Runaway
ADAIR COUNTY 25,700 26 9 44 0 4 6 3 0 2 22 119 0 28 88 0 178 5 37 0 401 0 1
ADAIR CO - RURAL 8131 6 8 44 0 2 0 1 0 2 5 35 0 27 40 0 20 1 0 0 49 0 0
KIRKSVILLE 17569 20 1 0 0 2 6 2 0 0 16 75 0 1 48 0 128 4 37 0 351 0 1
TRUMAN STATE UNIV 0 0 0 0 0 0 0 0 0 0 1 9 0 0 0 0 30 0 0 0 1 0 0
ANDREW COUNTY 17,354 23 7 1 0 1 1 0 0 5 5 63 0 1 85 0 30 2 17 0 74 0 5
ANDREW CO- RURAL 9821 14 1 0 0 0 1 0 0 0 1 30 0 0 35 0 9 2 0 0 45 0 0
SAVANNAH 5075 8 5 1 0 0 0 0 0 3 1 12 0 0 15 0 21 0 12 0 27 0 5
COUNTRY CLUB VILLAGE 2458 1 1 0 0 1 0 0 0 2 3 21 0 1 35 0 0 0 5 0 2 0 0
ATCHISON COUNTY 5,706 11 0 0 0 2 2 0 0 4 8 64 0 1 44 0 35 1 26 0 49 0 1
ATCHISON CO - RURAL 2794 5 0 0 0 2 0 0 0 1 4 26 0 0 25 0 7 0 0 0 33 0 0
ROCK PORT 1323 3 0 0 0 0 2 0 0 1 0 3 0 0 11 0 20 0 20 0 4 0 0
TARKIO 1589 3 0 0 0 0 0 0 0 2 4 35 0 1 8 0 8 1 6 0 12 0 1
AUDRAIN COUNTY 25,622 164 19 33 0 4 14 2 1 16 15 64 0 25 102 0 16 0 12 7 238 10 2
AUDRAIN CO - RURAL 9496 54 9 33 0 4 8 2 1 12 15 42 0 23 52 0 4 0 0 0 188 0 0
MARTINSBURG 305 0 0 0 0 0 0 0 0 0 0 1 0 0 0 0 1 0 0 0 1 0 0
MEXICO 11585 92 10 0 0 0 5 0 0 3 0 14 0 2 37 0 11 0 2 7 14 10 2
FARBER 323 0 0 0 0 0 0 0 0 0 0 0 0 0 0 0 0 0 0 0 0 0 0
VANDALIA 3913 18 0 0 0 0 1 0 0 1 0 7 0 0 13 0 0 0 10 0 35 0 0
BARRY COUNTY 38,862 262 8 21 0 23 13 11 0 10 22 154 0 20 298 0 45 29 67 0 371 5 7
BARRY CO - RURAL 22340 107 3 1 0 12 3 7 0 5 16 87 0 10 151 0 8 28 10 0 85 0 0
CASSVILLE 3278 46 1 0 0 0 0 0 0 0 0 38 0 0 18 0 25 0 39 0 99 3 7
MONETT 8905 92 2 4 0 9 2 3 0 4 6 24 0 8 122 0 11 0 5 0 173 0 0
EXETER 775 1 0 0 0 0 0 0 0 1 0 0 0 0 2 0 0 0 0 0 3 0 0
PURDY 1102 6 1 0 0 0 5 0 0 0 0 0 0 0 2 0 0 1 9 0 2 2 0
SELIGMAN 854 2 0 16 0 2 0 0 0 0 0 4 0 0 3 0 1 0 0 0 0 0 0
WASHBURN 437 7 0 0 0 0 2 0 0 0 0 0 0 2 0 0 0 0 2 0 5 0 0
WHEATON 699 0 1 0 0 0 0 1 0 0 0 0 0 0 0 0 0 0 0 0 0 0 0
BUTTERFIELD 472 1 0 0 0 0 1 0 0 0 0 1 0 0 0 0 0 0 2 0 4 0 0
BARTON COUNTY 12,447 62 0 1 0 0 0 4 0 0 1 8 0 0 30 0 41 0 13 0 58 4 1
BARTON CO - RURAL 7137 0 0 0 0 0 0 0 0 0 0 0 0 0 13 0 0 0 0 0 13 0 0
LAMAR 4548 62 0 1 0 0 0 4 0 0 1 8 0 0 17 0 41 0 13 0 45 4 1
LIBERAL 762 0 0 0 0 0 0 0 0 0 0 0 0 0 0 0 0 0 0 0 0 0 0
BATES COUNTY 17,002 91 5 9 0 7 26 6 0 19 18 149 0 4 122 0 30 6 26 0 179 7 3
BATES CO - RURAL 9684 30 5 7 0 6 0 3 0 14 18 100 0 0 83 0 0 0 0 0 117 0 0
ADRIAN 1683 6 0 2 0 1 4 0 0 2 0 15 0 0 8 0 4 0 0 0 12 0 0
BUTLER 4234 42 0 0 0 0 17 3 0 3 0 33 0 3 29 0 23 3 22 0 48 3 3
RICH HILL 1401 13 0 0 0 0 5 0 0 0 0 1 0 1 2 0 3 3 4 0 2 4 0
BENTON COUNTY 19,125 55 1 2 0 4 4 7 0 0 9 86 0 26 156 1 9 0 13 0 225 0 2
BENTON CO - RURAL 14671 11 0 1 0 3 0 7 0 0 8 64 0 21 71 1 6 0 13 0 208 0 2
COLE CAMP 1125 6 0 0 0 0 0 0 0 0 1 1 0 0 1 0 0 0 0 0 3 0 0
LINCOLN 1194 8 0 0 0 1 0 0 0 0 0 9 0 2 71 0 0 0 0 0 2 0 0
WARSAW 2135 30 1 1 0 0 4 0 0 0 0 12 0 3 13 0 3 0 0 0 12 0 0
BOLLINGER COUNTY 12,408 26 4 4 0 4 9 7 0 4 4 44 1 7 46 0 19 0 5 0 42 0 2
BOLLINGER CO - RURAL 10926 16 1 4 0 2 4 6 0 2 3 29 1 5 34 0 8 0 4 0 38 0 2
MARBLE HILL 1482 10 3 0 0 2 5 1 0 2 1 15 0 2 12 0 11 0 1 0 4 0 0
BOONE COUNTY 163,233 1,154 40 57 3 64 204 61 3 94 151 1,028 0 49 1,006 0 895 0 688 5 2,008 6 225
BOONE CO - RURAL 44206 321 4 9 2 15 43 20 0 11 16 156 0 11 339 0 64 0 0 0 291 0 36
CENTRALIA 4042 14 1 1 0 1 2 1 0 4 21 23 0 0 17 0 9 0 7 0 63 0 4
COLUMBIA 108894 769 32 42 1 47 145 37 3 73 68 531 0 32 438 0 508 0 644 4 1272 0 182
STURGEON 875 0 0 0 0 0 0 0 0 0 0 0 0 0 0 0 0 0 0 1 1 0 0
UNIV OF MO - COLUMBIA 0 39 1 4 0 0 12 2 0 6 46 314 0 5 182 0 310 0 35 0 214 5 0
ASHLAND 3720 7 1 0 0 1 2 0 0 0 0 0 0 1 8 0 3 0 2 0 153 0 3
HALLSVILLE 1496 4 1 1 0 0 0 1 0 0 0 4 0 0 22 0 1 0 0 0 14 1 0
BUCHANAN COUNTY 89,481 658 22 27 0 42 125 69 0 14 46 573 19 49 431 0 239 0 593 33 598 4 70
BUCHANAN CO - RURAL 12422 34 0 1 0 2 3 11 0 0 14 130 19 1 97 0 9 0 12 0 160 0 0
ST JOSEPH 77059 619 22 26 0 40 120 58 0 14 32 429 0 48 334 0 216 0 575 33 431 4 70
Crime in Missouri, 2011 123 Section 6.2
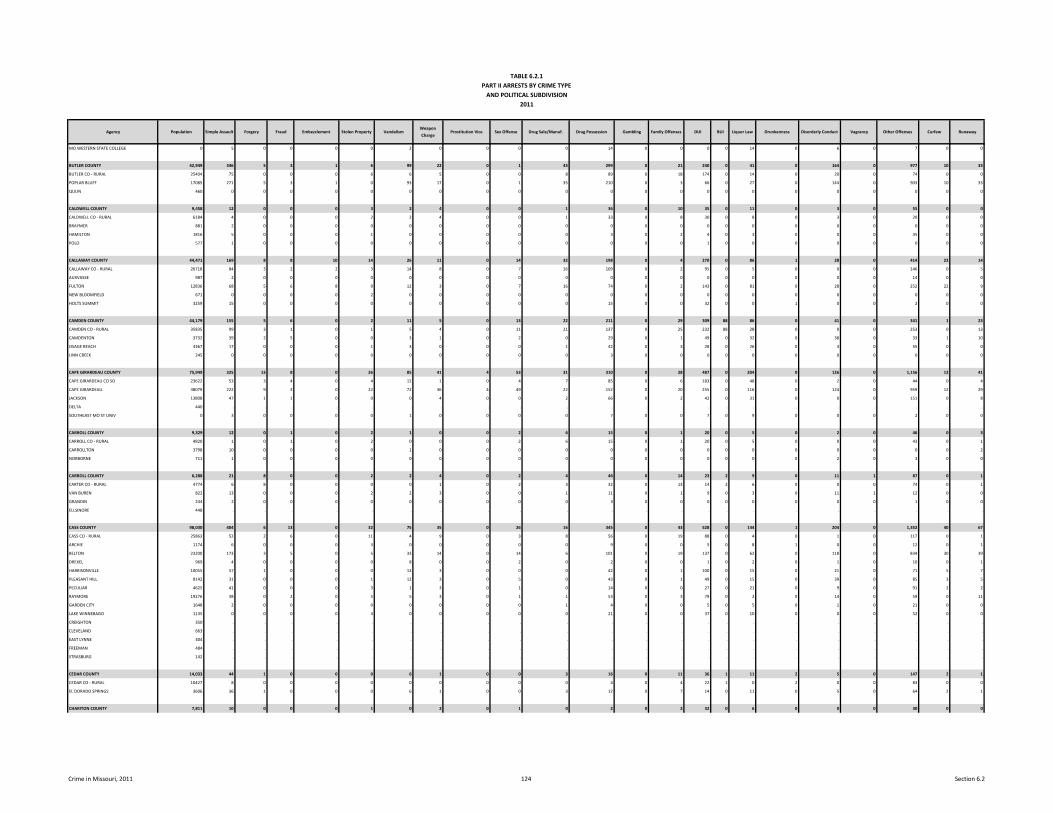
TABLE 6.2.1 PART II ARRESTS BY CRIME TYPE
AND POLITICAL SUBDIVISION2011
Agency Population Simple Assault Forgery Fraud Embezzlement Stolen Property VandalismWeapon
ChargeProstitution Vice Sex Offense Drug Sale/Manuf. Drug Possession Gambling Family Offenses DUI BUI Liquor Law Drunkenness Disorderly Conduct Vagrancy Other Offenses Curfew Runaway
MO WESTERN STATE COLLEGE 0 5 0 0 0 0 2 0 0 0 0 14 0 0 0 0 14 0 6 0 7 0 0
BUTLER COUNTY 42,949 346 5 3 1 6 99 22 0 1 43 299 0 21 240 0 41 0 164 0 977 10 33
BUTLER CO - RURAL 25404 75 0 0 0 6 6 5 0 0 8 89 0 18 174 0 14 0 20 0 74 0 0
POPLAR BLUFF 17085 271 5 3 1 0 93 17 0 1 35 210 0 3 66 0 27 0 144 0 903 10 33
QULIN 460 0 0 0 0 0 0 0 0 0 0 0 0 0 0 0 0 0 0 0 0 0 0
CALDWELL COUNTY 9,458 12 0 0 0 3 2 4 0 0 1 36 0 10 35 0 11 0 3 0 55 0 0
CALDWELL CO - RURAL 6184 4 0 0 0 2 2 4 0 0 1 33 0 8 30 0 8 0 3 0 20 0 0
BRAYMER 881 2 0 0 0 0 0 0 0 0 0 0 0 0 0 0 0 0 0 0 0 0 0
HAMILTON 1816 5 0 0 0 1 0 0 0 0 0 3 0 2 4 0 3 0 0 0 35 0 0
POLO 577 1 0 0 0 0 0 0 0 0 0 0 0 0 1 0 0 0 0 0 0 0 0
CALLAWAY COUNTY 44,471 169 8 8 10 14 26 11 0 14 32 198 0 4 270 0 86 1 28 0 414 22 14
CALLAWAY CO - RURAL 26718 84 3 2 2 3 14 8 0 7 16 109 0 2 95 0 5 0 0 0 146 0 5
AUXVASSE 987 2 0 0 0 0 0 0 0 0 0 0 0 0 0 0 0 0 0 0 14 0 0
FULTON 12836 68 5 6 8 9 12 3 0 7 16 74 0 2 143 0 81 0 28 0 252 22 9
NEW BLOOMFIELD 671 0 0 0 0 2 0 0 0 0 0 0 0 0 0 0 0 0 0 0 0 0 0
HOLTS SUMMIT 3259 15 0 0 0 0 0 0 0 0 0 15 0 0 32 0 0 1 0 0 2 0 0
CAMDEN COUNTY 44,179 155 5 6 0 2 11 5 0 13 22 211 0 29 309 88 86 0 41 0 341 1 23
CAMDEN CO - RURAL 35835 99 3 1 0 1 5 4 0 11 21 137 0 25 232 88 28 0 0 0 253 0 13
CAMDENTON 3732 39 2 5 0 0 3 1 0 2 0 29 0 1 49 0 32 0 38 0 33 1 10
OSAGE BEACH 4367 17 0 0 0 1 3 0 0 0 1 42 0 3 28 0 26 0 3 0 55 0 0
LINN CREEK 245 0 0 0 0 0 0 0 0 0 0 3 0 0 0 0 0 0 0 0 0 0 0
CAPE GIRARDEAU COUNTY 75,949 325 13 8 0 26 85 41 4 53 31 310 0 28 487 0 204 0 126 0 1,156 12 41
CAPE GIRARDEAU CO SO 23622 53 3 4 0 4 12 1 0 4 7 85 0 6 183 0 48 0 2 0 44 0 4
CAPE GIRARDEAU 38079 222 9 3 0 22 72 36 4 49 22 152 0 20 255 0 116 0 124 0 959 12 29
JACKSON 13808 47 1 1 0 0 0 4 0 0 2 66 0 2 42 0 31 0 0 0 151 0 8
DELTA 440 . . . . . . . . . . . . . . . . . . . . . .
SOUTHEAST MO ST UNIV 0 3 0 0 0 0 1 0 0 0 0 7 0 0 7 0 9 0 0 0 2 0 0
CARROLL COUNTY 9,329 12 0 1 0 2 1 0 0 2 6 15 0 1 20 0 5 0 2 0 46 0 3
CARROLL CO - RURAL 4820 1 0 1 0 2 0 0 0 2 6 15 0 1 20 0 5 0 0 0 43 0 1
CARROLLTON 3798 10 0 0 0 0 1 0 0 0 0 0 0 0 0 0 0 0 0 0 0 0 2
NORBORNE 711 1 0 0 0 0 0 0 0 0 0 0 0 0 0 0 0 0 2 0 3 0 0
CARROLL COUNTY 6,288 21 8 0 0 2 2 4 0 2 4 46 0 14 23 2 9 0 11 1 87 0 1
CARTER CO - RURAL 4774 6 8 0 0 0 0 1 0 2 3 32 0 13 14 2 6 0 0 0 74 0 1
VAN BUREN 822 13 0 0 0 2 2 3 0 0 1 11 0 1 9 0 3 0 11 1 12 0 0
GRANDIN 244 2 0 0 0 0 0 0 0 0 0 3 0 0 0 0 0 0 0 0 1 0 0
ELLSINORE 448 . . . . . . . . . . . . . . . . . . . . . .
CASS COUNTY 98,030 404 6 13 0 32 75 35 0 26 16 345 0 43 528 0 144 1 204 0 1,352 40 67
CASS CO - RURAL 25863 52 2 6 0 11 4 9 0 3 8 56 0 19 88 0 4 0 1 0 117 0 1
ARCHIE 1174 6 0 0 0 3 0 0 0 0 0 9 0 0 5 0 8 1 0 0 12 0 1
BELTON 23200 173 3 5 0 5 33 14 0 14 6 101 0 19 137 0 62 0 118 0 834 30 39
DREXEL 969 4 0 0 0 0 8 0 0 2 0 2 0 0 1 0 2 0 1 0 10 0 1
HARRISONVILLE 10055 57 1 0 0 0 12 3 0 0 0 42 0 1 100 0 15 0 21 0 71 5 7
PLEASANT HILL 8142 31 0 0 0 1 12 3 0 5 0 43 0 1 49 0 15 0 39 0 85 3 5
PECULIAR 4625 41 0 0 0 3 1 3 0 1 0 14 0 0 27 0 21 0 9 0 91 2 2
RAYMORE 19276 38 0 2 0 5 5 3 0 1 1 53 0 3 79 0 2 0 14 0 59 0 11
GARDEN CITY 1648 2 0 0 0 0 0 0 0 0 1 4 0 0 5 0 5 0 1 0 21 0 0
LAKE WINNEBAGO 1135 0 0 0 0 4 0 0 0 0 0 21 0 0 37 0 10 0 0 0 52 0 0
CREIGHTON 350 . . . . . . . . . . . . . . . . . . . . . .
CLEVELAND 663 . . . . . . . . . . . . . . . . . . . . . .
EAST LYNNE 304 . . . . . . . . . . . . . . . . . . . . . .
FREEMAN 484 . . . . . . . . . . . . . . . . . . . . . .
STRASBURG 142 . . . . . . . . . . . . . . . . . . . . . .
CEDAR COUNTY 14,033 44 1 0 0 0 6 1 0 0 3 16 0 11 36 1 11 2 5 0 147 2 1
CEDAR CO - RURAL 10427 8 0 0 0 0 0 0 0 0 0 4 0 4 22 1 0 2 0 0 83 0 0
EL DORADO SPRINGS 3606 36 1 0 0 0 6 1 0 0 3 12 0 7 14 0 11 0 5 0 64 2 1
CHARITON COUNTY 7,811 10 0 0 0 1 0 2 0 1 0 2 0 2 32 0 6 0 0 0 30 0 0
Crime in Missouri, 2011 124 Section 6.2
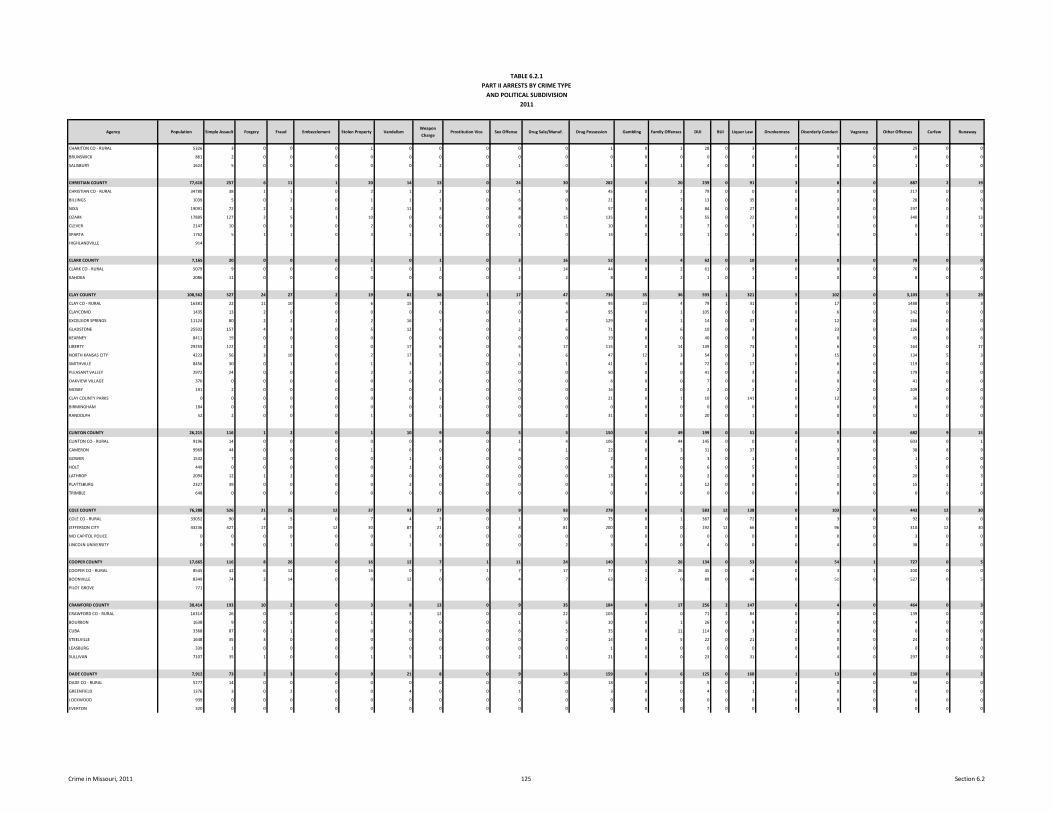
TABLE 6.2.1 PART II ARRESTS BY CRIME TYPE
AND POLITICAL SUBDIVISION2011
Agency Population Simple Assault Forgery Fraud Embezzlement Stolen Property VandalismWeapon
ChargeProstitution Vice Sex Offense Drug Sale/Manuf. Drug Possession Gambling Family Offenses DUI BUI Liquor Law Drunkenness Disorderly Conduct Vagrancy Other Offenses Curfew Runaway
CHARITON CO - RURAL 5326 3 0 0 0 1 0 0 0 0 0 1 0 1 28 0 3 0 0 0 29 0 0
BRUNSWICK 861 2 0 0 0 0 0 0 0 0 0 0 0 0 0 0 0 0 0 0 0 0 0
SALISBURY 1624 5 0 0 0 0 0 2 0 1 0 1 0 1 4 0 3 0 0 0 1 0 0
CHRISTIAN COUNTY 77,618 257 6 11 1 20 14 13 0 24 30 282 0 20 239 0 91 3 8 0 887 2 19
CHRISTIAN CO - RURAL 34780 38 1 1 0 2 1 2 0 1 9 45 0 2 79 0 0 0 0 0 217 0 0
BILLINGS 1039 5 0 2 0 1 1 1 0 6 0 21 0 7 13 0 35 0 3 0 28 0 0
NIXA 19091 72 2 2 0 2 11 3 0 8 5 57 0 4 84 0 27 0 0 0 297 0 5
OZARK 17885 127 2 5 1 10 0 6 0 8 15 135 0 5 55 0 22 0 0 0 340 2 13
CLEVER 2147 10 0 0 0 2 0 0 0 0 1 10 0 2 7 0 3 1 1 0 0 0 0
SPARTA 1762 5 1 1 0 3 1 1 0 1 0 14 0 0 1 0 4 2 4 0 5 0 1
HIGHLANDVILLE 914 . . . . . . . . . . . . . . . . . . . . . .
CLARK COUNTY 7,165 20 0 0 0 1 0 1 0 3 16 52 0 4 62 0 10 0 0 0 78 0 0
CLARK CO - RURAL 5079 9 0 0 0 1 0 1 0 1 14 44 0 2 61 0 9 0 0 0 70 0 0
KAHOKA 2086 11 0 0 0 0 0 0 0 2 2 8 0 2 1 0 1 0 0 0 8 0 0
CLAY COUNTY 108,562 527 24 27 2 19 82 38 1 17 47 736 35 36 593 1 321 5 102 0 3,103 5 29
CLAY CO - RURAL 16381 22 11 10 0 6 15 7 1 7 4 95 23 4 79 1 31 0 17 0 1488 0 3
CLAYCOMO 1435 13 2 0 0 0 0 0 0 0 4 95 0 1 105 0 0 0 6 0 242 0 0
EXCELSIOR SPRINGS 11124 80 2 2 2 2 16 7 0 1 7 129 0 1 14 0 47 0 12 0 268 0 0
GLADSTONE 25502 157 4 3 0 5 12 6 0 2 6 71 0 6 10 0 3 0 23 0 126 0 0
KEARNEY 8411 19 0 0 0 0 0 0 0 0 0 19 0 0 40 0 0 0 0 0 45 0 6
LIBERTY 29255 122 2 1 0 0 17 8 0 6 17 115 0 14 139 0 73 5 6 0 164 0 17
NORTH KANSAS CITY 4223 56 3 10 0 2 17 5 0 1 6 47 12 3 54 0 3 0 15 0 134 5 3
SMITHVILLE 8456 30 0 1 0 1 3 1 0 0 1 41 0 6 72 0 17 0 6 0 119 0 0
PLEASANT VALLEY 2972 24 0 0 0 2 2 2 0 0 0 50 0 0 41 0 3 0 3 0 179 0 0
OAKVIEW VILLAGE 376 0 0 0 0 0 0 0 0 0 0 6 0 0 7 0 0 0 0 0 41 0 0
MOSBY 191 2 0 0 0 0 0 0 0 0 0 16 0 0 2 0 2 0 2 0 209 0 0
CLAY COUNTY PARKS 0 0 0 0 0 0 0 1 0 0 0 21 0 1 10 0 141 0 12 0 36 0 0
BIRMINGHAM 184 0 0 0 0 0 0 0 0 0 0 0 0 0 0 0 0 0 0 0 0 0 0
RANDOLPH 52 2 0 0 0 1 0 1 0 0 2 31 0 0 20 0 1 0 0 0 52 0 0
CLINTON COUNTY 26,215 116 1 2 0 1 10 9 0 5 5 150 0 49 199 0 51 0 5 0 682 9 15
CLINTON CO - RURAL 9196 14 0 0 0 0 0 8 0 1 4 106 0 44 145 0 0 0 0 0 603 0 1
CAMERON 9969 44 0 0 0 1 6 0 0 4 1 22 0 3 31 0 37 0 3 0 38 8 9
GOWER 1532 7 0 0 0 0 1 1 0 0 0 2 0 0 3 0 1 0 0 0 1 0 0
HOLT 449 0 0 0 0 0 1 0 0 0 0 4 0 0 6 0 5 0 1 0 5 0 0
LATHROP 2094 12 1 2 0 0 0 0 0 0 0 13 0 0 2 0 8 0 1 0 20 0 3
PLATTSBURG 2327 39 0 0 0 0 2 0 0 0 0 3 0 2 12 0 0 0 0 0 15 1 2
TRIMBLE 648 0 0 0 0 0 0 0 0 0 0 0 0 0 0 0 0 0 0 0 0 0 0
COLE COUNTY 76,288 526 21 25 12 37 93 27 0 9 93 278 0 1 583 12 138 0 103 0 443 12 30
COLE CO - RURAL 33052 90 4 5 0 7 4 3 0 1 10 75 0 1 387 0 72 0 3 0 92 0 0
JEFFERSON CITY 43236 427 17 19 12 30 87 21 0 8 81 200 0 0 192 12 66 0 96 0 310 12 30
MO CAPITOL POLICE 0 0 0 0 0 0 1 0 0 0 0 0 0 0 0 0 0 0 0 0 3 0 0
LINCOLN UNIVERSITY 0 9 0 1 0 0 1 3 0 0 2 3 0 0 4 0 0 0 4 0 38 0 0
COOPER COUNTY 17,665 116 8 26 0 16 12 7 1 11 24 140 3 26 134 0 53 0 54 1 727 0 5
COOPER CO - RURAL 8545 42 6 12 0 16 0 7 1 7 17 77 1 26 45 0 4 0 3 1 200 0 0
BOONVILLE 8349 74 2 14 0 0 12 0 0 4 7 63 2 0 89 0 49 0 51 0 527 0 5
PILOT GROVE 771 . . . . . . . . . . . . . . . . . . . . . .
CRAWFORD COUNTY 30,414 193 10 2 0 3 8 13 0 9 35 184 0 17 256 2 147 6 4 0 464 0 3
CRAWFORD CO - RURAL 16314 26 0 0 0 1 3 12 0 0 22 103 0 0 71 2 84 0 0 0 139 0 0
BOURBON 1638 9 0 1 0 1 0 0 0 1 5 10 0 1 26 0 8 0 0 0 4 0 0
CUBA 3368 87 6 1 0 0 0 0 0 6 5 35 0 11 114 0 3 2 0 0 0 0 0
STEELVILLE 1648 35 3 0 0 0 0 0 0 0 2 14 0 5 22 0 21 0 0 0 24 0 3
LEASBURG 339 1 0 0 0 0 0 0 0 0 0 1 0 0 0 0 0 0 0 0 0 0 0
SULLIVAN 7107 35 1 0 0 1 5 1 0 2 1 21 0 0 23 0 31 4 4 0 297 0 0
DADE COUNTY 7,912 73 2 3 0 9 21 8 0 9 16 159 0 6 125 0 160 1 13 0 230 0 2
DADE CO - RURAL 5277 14 0 0 0 0 0 0 0 0 0 18 0 0 5 0 1 0 0 0 58 0 0
GREENFIELD 1376 3 0 2 0 0 4 0 0 1 0 3 0 0 4 0 1 0 0 0 0 0 0
LOCKWOOD 939 0 0 0 0 0 0 0 0 0 0 0 0 0 0 0 0 0 0 0 0 0 0
EVERTON 320 0 0 0 0 0 0 0 0 0 0 0 0 0 7 0 0 0 0 0 0 0 0
Crime in Missouri, 2011 125 Section 6.2
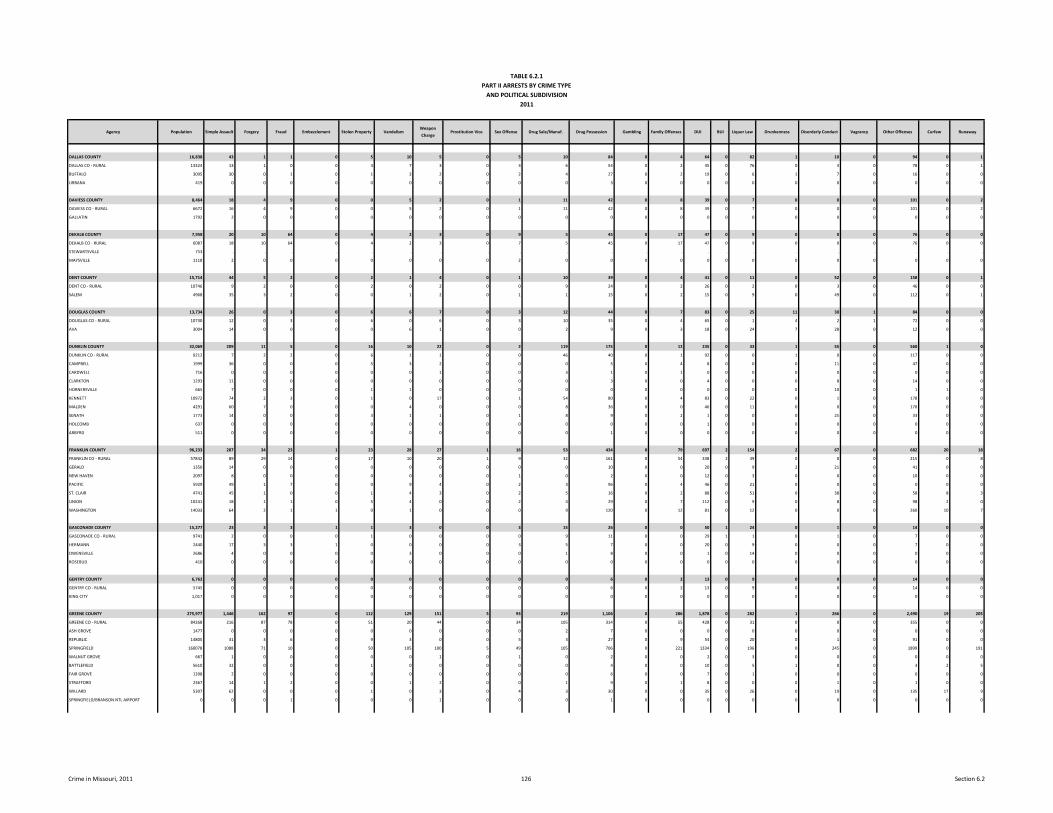
TABLE 6.2.1 PART II ARRESTS BY CRIME TYPE
AND POLITICAL SUBDIVISION2011
Agency Population Simple Assault Forgery Fraud Embezzlement Stolen Property VandalismWeapon
ChargeProstitution Vice Sex Offense Drug Sale/Manuf. Drug Possession Gambling Family Offenses DUI BUI Liquor Law Drunkenness Disorderly Conduct Vagrancy Other Offenses Curfew Runaway
DALLAS COUNTY 16,838 43 1 1 0 5 10 5 0 5 10 84 0 4 64 0 82 1 10 0 94 0 1
DALLAS CO - RURAL 13324 13 1 0 0 4 7 3 0 3 6 54 0 2 45 0 76 0 3 0 78 0 1
BUFFALO 3095 30 0 1 0 1 3 2 0 2 4 27 0 2 19 0 6 1 7 0 16 0 0
URBANA 419 0 0 0 0 0 0 0 0 0 0 3 0 0 0 0 0 0 0 0 0 0 0
DAVIESS COUNTY 8,464 18 4 9 0 0 5 2 0 1 11 42 0 8 39 0 7 0 0 0 101 0 2
DAVIESS CO - RURAL 6672 16 4 9 0 0 5 2 0 1 11 42 0 8 39 0 7 0 0 0 101 0 2
GALLATIN 1792 2 0 0 0 0 0 0 0 0 0 0 0 0 0 0 0 0 0 0 0 0 0
DEKALB COUNTY 7,958 20 10 64 0 4 2 3 0 9 5 45 0 17 47 0 9 0 0 0 76 0 0
DEKALB CO - RURAL 6087 18 10 64 0 4 2 3 0 7 5 45 0 17 47 0 9 0 0 0 76 0 0
STEWARTSVILLE 753 . . . . . . . . . . . . . . . . . . . . . .
MAYSVILLE 1118 2 0 0 0 0 0 0 0 2 0 0 0 0 0 0 0 0 0 0 0 0 0
DENT COUNTY 15,714 44 5 2 0 2 1 4 0 1 10 39 0 4 41 0 11 0 52 0 158 0 1
DENT CO - RURAL 10746 9 2 0 0 2 0 2 0 0 9 24 0 2 26 0 2 0 3 0 46 0 0
SALEM 4968 35 3 2 0 0 1 2 0 1 1 15 0 2 15 0 9 0 49 0 112 0 1
DOUGLAS COUNTY 13,734 26 0 3 0 6 6 7 0 3 12 44 0 7 83 0 25 11 30 1 84 0 0
DOUGLAS CO - RURAL 10730 12 0 3 0 6 0 6 0 3 10 35 0 4 65 0 1 4 2 1 72 0 0
AVA 3004 14 0 0 0 0 6 1 0 0 2 9 0 3 18 0 24 7 28 0 12 0 0
DUNKLIN COUNTY 32,069 209 11 5 0 16 10 22 0 2 119 175 0 12 235 0 33 1 55 0 560 1 0
DUNKLIN CO - RURAL 9212 7 2 2 0 6 1 1 0 0 46 40 0 1 92 0 0 1 0 0 117 0 0
CAMPBELL 1999 36 0 0 0 5 3 2 0 0 0 5 0 4 8 0 0 0 11 0 47 0 0
CARDWELL 716 0 0 0 0 0 0 1 0 0 3 1 0 1 0 0 0 0 0 0 0 0 0
CLARKTON 1293 11 0 0 0 0 0 0 0 0 0 3 0 0 4 0 0 0 8 0 14 0 0
HORNERSVILLE 665 7 0 0 0 1 1 0 0 0 0 0 0 0 0 0 0 0 10 0 1 1 0
KENNETT 10972 74 2 3 0 1 0 17 0 1 54 80 0 4 83 0 22 0 1 0 178 0 0
MALDEN 4291 60 7 0 0 0 4 0 0 0 8 36 0 0 46 0 11 0 0 0 170 0 0
SENATH 1773 14 0 0 0 3 1 1 0 1 8 9 0 2 1 0 0 0 25 0 33 0 0
HOLCOMB 637 0 0 0 0 0 0 0 0 0 0 0 0 0 1 0 0 0 0 0 0 0 0
ARBYRD 511 0 0 0 0 0 0 0 0 0 0 1 0 0 0 0 0 0 0 0 0 0 0
FRANKLIN COUNTY 96,233 287 34 23 1 23 28 27 1 16 53 434 0 79 697 2 154 2 67 0 682 20 18
FRANKLIN CO - RURAL 57842 89 29 14 0 17 10 20 1 9 32 161 0 54 338 2 49 0 0 0 215 0 8
GERALD 1350 14 0 0 0 0 0 0 0 0 0 10 0 0 20 0 9 2 21 0 41 0 0
NEW HAVEN 2097 8 0 0 0 0 0 0 0 1 0 2 0 0 12 0 3 0 0 0 10 0 0
PACIFIC 5929 49 1 7 0 0 9 4 0 2 3 96 0 4 46 0 21 0 0 0 0 0 0
ST. CLAIR 4741 45 1 0 0 1 4 3 0 2 5 16 0 2 88 0 51 0 38 0 58 8 3
UNION 10241 18 1 1 0 5 4 0 0 2 4 29 0 7 112 0 9 0 8 0 98 2 0
WASHINGTON 14033 64 2 1 1 0 1 0 0 0 9 120 0 12 81 0 12 0 0 0 260 10 7
GASCONADE COUNTY 15,277 23 3 3 1 1 3 0 0 3 15 26 0 0 50 1 24 0 1 0 14 0 0
GASCONADE CO - RURAL 9741 2 0 0 0 1 0 0 0 0 9 11 0 0 29 1 1 0 1 0 7 0 0
HERMANN 2440 17 3 3 1 0 0 0 0 3 5 7 0 0 20 0 9 0 0 0 7 0 0
OWENSVILLE 2686 4 0 0 0 0 3 0 0 0 1 8 0 0 1 0 14 0 0 0 0 0 0
ROSEBUD 410 0 0 0 0 0 0 0 0 0 0 0 0 0 0 0 0 0 0 0 0 0 0
GENTRY COUNTY 6,762 0 0 0 0 0 0 0 0 0 0 6 0 2 13 0 9 0 0 0 14 0 0
GENTRY CO - RURAL 5745 0 0 0 0 0 0 0 0 0 0 6 0 2 13 0 9 0 0 0 14 0 0
KING CITY 1,017 0 0 0 0 0 0 0 0 0 0 0 0 0 0 0 0 0 0 0 0 0 0
GREENE COUNTY 275,977 1,446 162 97 0 112 129 151 5 93 219 1,106 0 286 1,878 0 282 1 266 0 2,490 19 205
GREENE CO - RURAL 84268 216 87 78 0 51 20 44 0 34 105 314 0 55 428 0 31 0 0 0 355 0 0
ASH GROVE 1477 0 0 0 0 0 0 0 0 0 2 7 0 0 0 0 0 0 0 0 0 0 0
REPUBLIC 14805 31 3 6 0 9 3 0 0 5 3 27 0 9 54 0 20 0 1 0 91 0 0
SPRINGFIELD 160078 1088 71 10 0 50 105 100 5 49 105 706 0 221 1334 0 196 0 245 0 1899 0 191
WALNUT GROVE 667 1 0 0 0 0 0 1 0 1 0 2 0 0 2 0 3 0 0 0 0 0 0
BATTLEFIELD 5610 32 0 0 0 1 0 0 0 0 0 4 0 0 10 0 5 1 0 0 3 2 5
FAIR GROVE 1398 2 0 0 0 0 0 0 0 0 0 6 0 0 7 0 1 0 0 0 6 0 0
STRAFFORD 2367 14 1 2 0 0 1 2 0 0 1 9 0 1 8 0 0 0 1 0 1 0 0
WILLARD 5307 62 0 0 0 1 0 3 0 4 3 30 0 0 35 0 26 0 19 0 135 17 9
SPRINGFIELD/BRANSON NTL AIRPORT 0 0 0 1 0 0 0 1 0 0 0 1 0 0 0 0 0 0 0 0 0 0 0
Crime in Missouri, 2011 126 Section 6.2
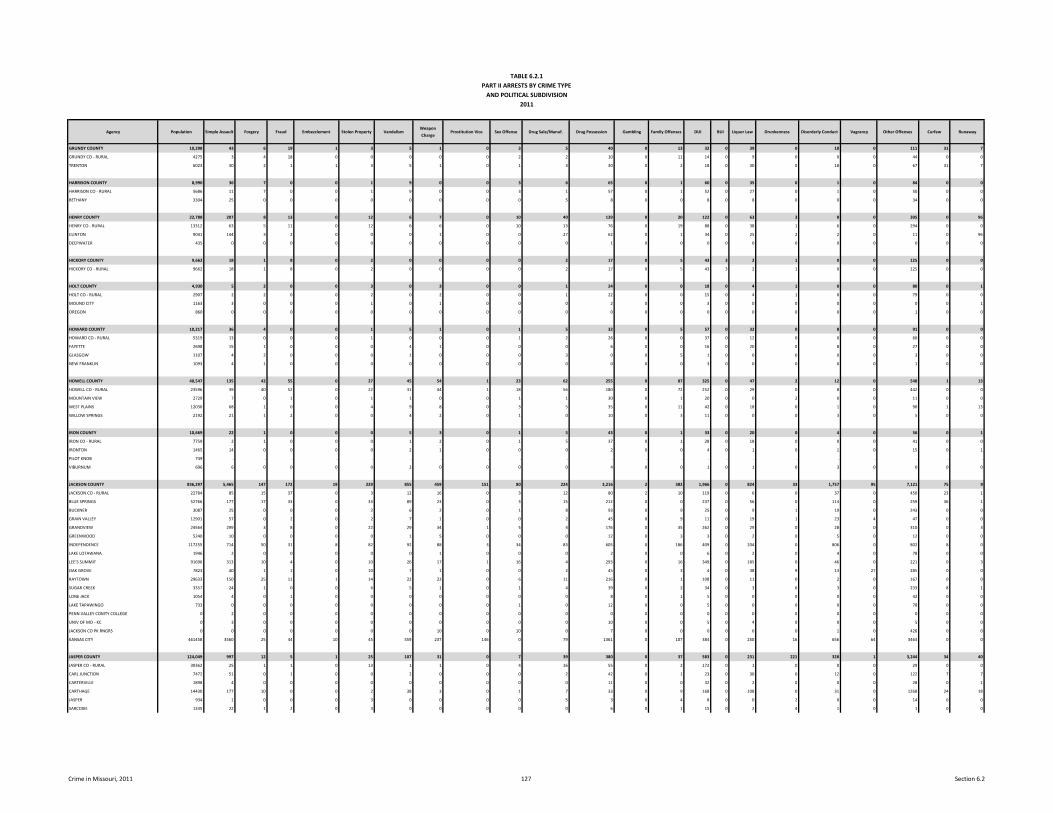
TABLE 6.2.1 PART II ARRESTS BY CRIME TYPE
AND POLITICAL SUBDIVISION2011
Agency Population Simple Assault Forgery Fraud Embezzlement Stolen Property VandalismWeapon
ChargeProstitution Vice Sex Offense Drug Sale/Manuf. Drug Possession Gambling Family Offenses DUI BUI Liquor Law Drunkenness Disorderly Conduct Vagrancy Other Offenses Curfew Runaway
GRUNDY COUNTY 10,298 43 6 19 1 3 5 1 0 3 5 40 0 13 32 0 39 0 18 0 111 31 7
GRUNDY CO - RURAL 4275 3 4 18 0 0 0 0 0 2 2 10 0 11 14 0 9 0 0 0 44 0 0
TRENTON 6023 40 2 1 1 3 5 1 0 1 3 30 0 2 18 0 30 0 18 0 67 31 7
HARRISON COUNTY 8,990 36 7 0 0 1 9 0 0 3 6 65 0 1 60 0 35 0 1 0 84 0 0
HARRISON CO - RURAL 5686 11 7 0 0 1 9 0 0 3 1 57 0 1 52 0 27 0 1 0 50 0 0
BETHANY 3304 25 0 0 0 0 0 0 0 0 5 8 0 0 8 0 8 0 0 0 34 0 0
HENRY COUNTY 22,788 207 8 13 0 12 6 7 0 10 40 139 0 20 122 0 63 3 8 0 305 0 96
HENRY CO - RURAL 13312 63 5 11 0 12 6 6 0 10 13 76 0 19 88 0 38 1 6 0 294 0 0
CLINTON 9041 144 3 2 0 0 0 1 0 0 27 62 0 1 34 0 25 2 2 0 11 0 96
DEEPWATER 435 0 0 0 0 0 0 0 0 0 0 1 0 0 0 0 0 0 0 0 0 0 0
HICKORY COUNTY 9,662 18 1 8 0 2 0 0 0 0 2 17 0 5 43 3 2 1 0 0 125 0 0
HICKORY CO - RURAL 9662 18 1 8 0 2 0 0 0 0 2 17 0 5 43 3 2 1 0 0 125 0 0
HOLT COUNTY 4,930 5 2 0 0 3 0 3 0 0 1 24 0 0 18 0 4 1 0 0 80 0 1
HOLT CO - RURAL 2907 2 2 0 0 2 0 2 0 0 1 22 0 0 15 0 4 1 0 0 79 0 0
MOUND CITY 1163 3 0 0 0 1 0 1 0 0 0 2 0 0 3 0 0 0 0 0 0 0 1
OREGON 860 0 0 0 0 0 0 0 0 0 0 0 0 0 0 0 0 0 0 0 1 0 0
HOWARD COUNTY 10,217 36 4 0 0 1 5 1 0 1 5 32 0 5 57 0 32 0 8 0 91 0 0
HOWARD CO - RURAL 5319 13 0 0 0 1 0 0 0 1 2 26 0 0 37 0 12 0 0 0 60 0 0
FAYETTE 2698 15 1 0 0 0 4 1 0 0 0 6 0 0 16 0 20 0 8 0 27 0 0
GLASGOW 1107 4 2 0 0 0 1 0 0 0 3 0 0 5 1 0 0 0 0 0 3 0 0
NEW FRANKLIN 1093 4 1 0 0 0 0 0 0 0 0 0 0 0 3 0 0 0 0 0 1 0 0
HOWELL COUNTY 40,547 135 42 55 0 27 45 54 1 23 62 255 0 87 325 0 47 2 12 0 548 1 13
HOWELL CO - RURAL 23596 39 40 52 0 22 31 44 1 18 56 180 0 72 252 0 29 0 8 0 442 0 0
MOUNTAIN VIEW 2729 7 0 1 0 1 1 0 0 1 1 30 0 1 20 0 0 2 0 0 11 0 0
WEST PLAINS 12030 68 1 0 0 4 9 8 0 3 5 35 0 11 42 0 18 0 1 0 90 1 13
WILLOW SPRINGS 2192 21 1 2 0 0 4 2 0 1 0 10 0 3 11 0 0 0 3 0 5 0 0
IRON COUNTY 10,669 22 1 0 0 0 5 3 0 1 5 43 0 1 33 0 20 0 4 0 56 0 1
IRON CO - RURAL 7759 2 1 0 0 0 1 2 0 1 5 37 0 1 28 0 18 0 0 0 41 0 0
IRONTON 1465 14 0 0 0 0 2 1 0 0 0 2 0 0 4 0 1 0 1 0 15 0 1
PILOT KNOB 749 . . . . . . . . . . . . . . . . . . . . . .
VIBURNUM 696 6 0 0 0 0 2 0 0 0 0 4 0 0 1 0 1 0 3 0 0 0 0
JACKSON COUNTY 836,297 5,465 147 172 19 229 855 459 151 80 224 3,216 2 382 1,966 0 824 33 1,757 95 7,121 75 9
JACKSON CO - RURAL 22784 85 15 37 0 3 12 16 0 3 12 80 2 10 119 0 6 0 37 0 450 23 1
BLUE SPRINGS 52766 177 17 33 0 33 89 23 0 3 15 212 0 0 237 0 56 0 114 0 259 36 1
BUCKNER 3087 25 0 0 0 2 6 2 0 1 8 93 0 9 25 0 9 1 19 0 243 0 0
GRAIN VALLEY 12901 57 0 2 0 2 7 1 0 0 2 45 0 9 11 0 19 1 23 4 47 0 0
GRANDVIEW 24564 299 3 8 0 22 29 34 1 5 4 176 0 35 262 0 29 0 28 0 310 0 3
GREENWOOD 5240 10 0 0 0 0 1 5 0 0 0 12 0 3 3 0 2 0 5 0 12 0 0
INDEPENDENCE 117255 714 50 31 8 82 92 88 3 34 83 605 0 186 409 0 204 0 806 0 802 8 0
LAKE LOTAWANA 1946 2 0 0 0 0 0 1 0 0 0 2 0 0 6 0 2 0 4 0 78 0 0
LEE'S SUMMIT 91696 313 10 4 0 10 26 17 1 16 4 293 0 16 349 0 185 0 46 0 221 0 3
OAK GROVE 7823 40 1 1 0 10 7 1 0 0 2 45 0 3 4 0 38 9 13 27 285 0 0
RAYTOWN 29633 150 25 11 1 14 22 23 0 6 11 216 0 1 108 0 11 0 2 0 167 0 0
SUGAR CREEK 3357 24 1 0 0 6 5 1 0 1 4 39 0 2 34 0 3 6 3 0 233 8 1
LONE JACK 1054 4 0 1 0 0 0 0 0 0 0 8 0 1 5 0 0 0 0 0 42 0 0
LAKE TAPAWINGO 733 0 0 0 0 0 0 0 0 1 0 12 0 0 5 0 0 0 0 0 78 0 0
PENN VALLEY COMTY COLLEGE 0 2 0 0 0 0 0 0 0 0 0 0 0 0 0 0 0 0 0 0 0 0 0
UNIV OF MO - KC 0 3 0 0 0 0 0 0 0 0 0 10 0 0 5 0 4 0 0 0 5 0 0
JACKSON CO PK RNGRS 0 0 0 0 0 0 0 10 0 10 0 7 0 0 0 0 6 0 1 0 426 0 0
KANSAS CITY 461458 3560 25 44 10 45 559 237 146 0 79 1361 0 107 384 0 250 16 656 64 3463 0 0
JASPER COUNTY 124,049 997 12 5 1 25 107 31 0 7 39 380 0 37 583 0 231 221 328 1 3,244 34 40
JASPER CO - RURAL 30362 25 1 1 0 13 1 1 0 4 16 55 0 2 172 0 1 0 0 0 29 0 0
CARL JUNCTION 7472 51 0 1 0 0 2 0 0 0 2 42 0 1 23 0 30 0 12 0 122 7 7
CARTERVILLE 1898 4 0 0 0 0 0 0 0 0 0 11 0 0 32 0 2 0 0 0 28 0 1
CARTHAGE 14430 177 10 0 0 2 38 3 0 1 7 33 0 9 168 0 108 0 31 0 1268 24 18
JASPER 934 1 0 0 0 3 0 0 0 0 5 3 0 4 8 0 0 2 0 0 14 0 0
SARCOXIE 1335 22 1 2 0 3 0 0 0 0 0 6 0 1 15 0 2 4 1 0 1 0 0
Crime in Missouri, 2011 127 Section 6.2
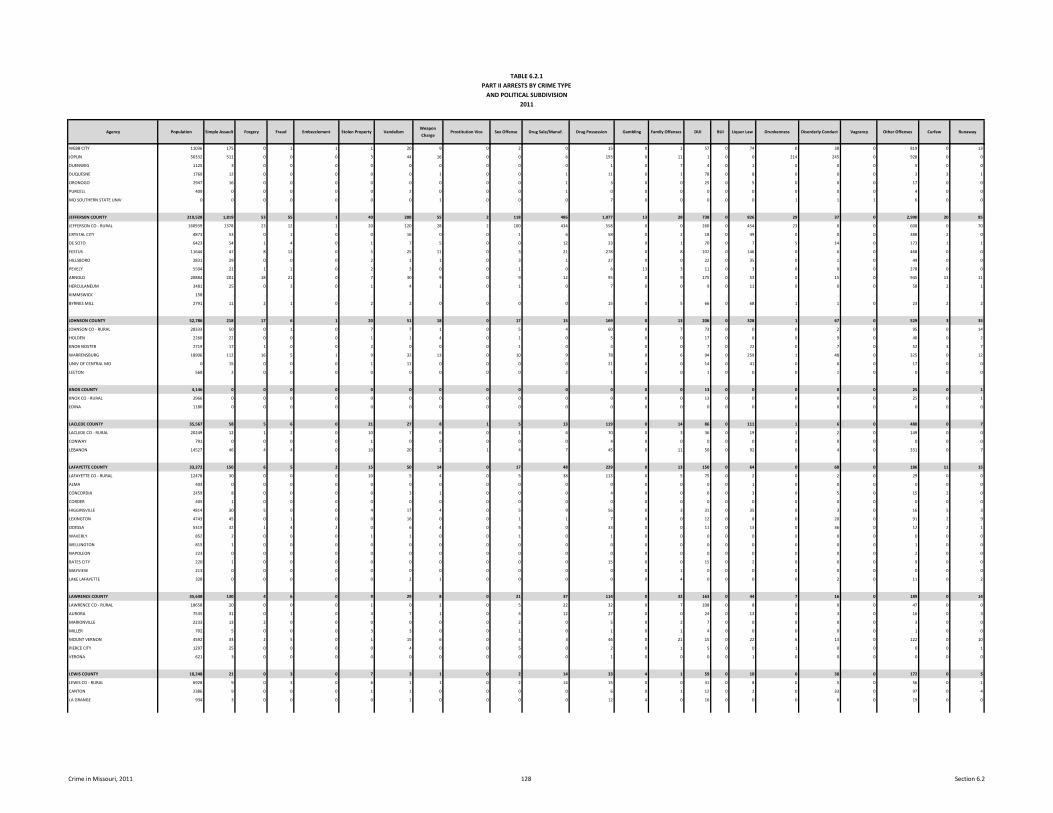
TABLE 6.2.1 PART II ARRESTS BY CRIME TYPE
AND POLITICAL SUBDIVISION2011
Agency Population Simple Assault Forgery Fraud Embezzlement Stolen Property VandalismWeapon
ChargeProstitution Vice Sex Offense Drug Sale/Manuf. Drug Possession Gambling Family Offenses DUI BUI Liquor Law Drunkenness Disorderly Conduct Vagrancy Other Offenses Curfew Runaway
WEBB CITY 11036 175 0 1 1 1 20 9 0 2 0 15 0 1 57 0 74 0 38 0 819 0 13
JOPLIN 50332 511 0 0 0 3 44 16 0 0 6 193 0 11 1 0 0 214 245 0 928 0 0
DUENWEG 1125 3 0 0 0 0 0 0 0 0 0 1 0 7 4 0 1 0 0 0 5 0 0
DUQUESNE 1769 12 0 0 0 0 0 1 0 0 1 11 0 1 78 0 8 0 0 0 3 3 1
ORONOGO 2947 16 0 0 0 0 0 0 0 0 1 3 0 0 25 0 5 0 0 0 17 0 0
PURCELL 409 0 0 0 0 0 2 0 0 0 1 0 0 0 0 0 0 0 0 0 4 0 0
MO SOUTHERN STATE UNIV 0 0 0 0 0 0 0 1 0 0 0 7 0 0 0 0 0 1 1 1 6 0 0
JEFFERS0N COUNTY 219,528 1,819 53 55 1 40 208 55 2 118 486 1,077 13 28 738 0 826 29 37 0 2,990 20 85
JEFFERSON CO - RURAL 160939 1378 23 12 1 20 120 28 2 100 434 558 0 0 260 0 454 23 0 0 608 0 70
CRYSTAL CITY 4873 53 0 1 0 0 16 0 0 1 6 58 0 2 18 0 49 0 0 0 388 2 0
DE SOTO 6423 54 1 4 0 1 7 5 0 0 12 33 0 1 70 0 7 5 14 0 173 1 1
FESTUS 11644 47 8 12 0 5 25 11 0 3 21 278 0 8 107 0 146 0 6 0 468 0 0
HILLSBORO 2831 29 0 0 0 2 1 1 0 3 1 27 0 0 22 0 35 0 1 0 49 0 0
PEVELY 5504 21 1 1 0 2 3 0 0 1 0 6 13 3 11 0 3 0 0 0 278 0 0
ARNOLD 20884 201 18 21 0 7 30 9 0 9 12 95 0 9 175 0 53 0 15 0 945 13 11
HERCULANEUM 3481 25 0 3 0 1 4 1 0 1 0 7 0 0 9 0 11 0 0 0 58 2 1
KIMMSWICK 158 . . . . . . . . . . . . . . . . . . . . . .
BYRNES MILL 2791 11 2 1 0 2 2 0 0 0 0 15 0 5 66 0 68 1 1 0 23 2 2
JOHNSON COUNTY 52,786 218 17 6 1 20 51 18 0 17 15 169 0 13 206 0 328 1 67 0 529 3 35
JOHNSON CO - RURAL 28333 50 0 1 0 7 7 1 0 5 4 60 0 7 73 0 0 0 2 0 95 0 14
HOLDEN 2260 22 0 0 0 1 1 4 0 1 0 5 0 0 17 0 6 0 9 0 40 0 2
KNOB NOSTER 2719 17 1 0 0 2 0 0 0 1 0 4 0 0 7 0 22 0 7 0 52 3 7
WARRENSBURG 18906 112 16 5 1 9 32 13 0 10 9 78 0 6 94 0 259 1 48 0 325 0 12
UNIV OF CENTRAL MO 0 15 0 0 0 1 11 0 0 0 0 21 0 0 14 0 41 0 0 0 17 0 0
LEETON 568 2 0 0 0 0 0 0 0 0 2 1 0 0 1 0 0 0 1 0 0 0 0
KNOX COUNTY 4,146 0 0 0 0 0 0 0 0 0 0 0 0 0 13 0 0 0 0 0 25 0 1
KNOX CO - RURAL 2966 0 0 0 0 0 0 0 0 0 0 0 0 0 13 0 0 0 0 0 25 0 1
EDINA 1180 0 0 0 0 0 0 0 0 0 0 0 0 0 0 0 0 0 0 0 0 0 0
LACLEDE COUNTY 35,567 58 5 6 0 21 27 8 1 5 13 119 0 14 86 0 111 1 6 0 480 0 7
LACLEDE CO - RURAL 20249 12 1 2 0 10 7 6 0 1 6 70 0 3 36 0 19 1 2 0 149 0 0
CONWAY 791 0 0 0 0 1 0 0 0 0 0 4 0 0 0 0 0 0 0 0 0 0 0
LEBANON 14527 46 4 4 0 10 20 2 1 4 7 45 0 11 50 0 92 0 4 0 331 0 7
LAFAYETTE COUNTY 33,272 150 6 5 2 15 50 14 0 17 48 229 0 13 150 0 64 0 68 0 186 11 15
LAFAYETTE CO - RURAL 12478 30 0 0 0 10 5 4 0 5 38 113 0 5 75 0 2 0 2 0 29 0 0
ALMA 403 0 0 0 0 0 0 0 0 0 0 0 0 0 0 0 1 0 0 0 0 0 0
CONCORDIA 2459 8 0 0 0 0 3 1 0 0 0 4 0 0 6 0 3 0 5 0 15 2 0
CORDER 405 1 0 0 0 0 0 0 0 0 0 0 0 0 0 0 0 0 0 0 0 0 0
HIGGINSVILLE 4814 30 5 0 0 4 17 4 0 5 9 56 0 3 31 0 35 0 3 0 16 5 3
LEXINGTON 4743 45 0 1 0 0 16 0 0 1 1 7 0 0 12 0 8 0 20 0 91 2 9
ODESSA 5319 32 1 4 2 0 6 4 0 5 0 33 0 0 11 0 13 0 36 0 12 2 1
WAVERLY 852 2 0 0 0 1 1 0 0 1 0 1 0 0 0 0 0 0 0 0 0 0 0
WELLINGTON 815 1 0 0 0 0 0 0 0 0 0 0 0 0 0 0 0 0 0 0 1 0 0
NAPOLEON 223 0 0 0 0 0 0 0 0 0 0 0 0 0 0 0 0 0 0 0 2 0 0
BATES CITY 220 1 0 0 0 0 0 0 0 0 0 15 0 0 15 0 2 0 0 0 9 0 0
MAYVIEW 213 0 0 0 0 0 0 0 0 0 0 0 0 1 0 0 0 0 0 0 0 0 0
LAKE LAFAYETTE 328 0 0 0 0 0 2 1 0 0 0 0 0 4 0 0 0 0 2 0 11 0 2
LAWRENCE COUNTY 35,638 130 4 6 0 9 29 8 0 21 37 114 0 32 163 0 44 7 16 0 189 0 14
LAWRENCE CO - RURAL 18658 20 0 0 0 1 0 1 0 5 22 32 0 7 108 0 8 0 0 0 47 0 0
AURORA 7535 31 0 1 0 4 7 1 0 4 12 27 0 0 24 0 13 0 3 0 16 0 3
MARIONVILLE 2233 13 2 0 0 0 0 0 0 2 0 5 0 2 7 0 0 0 0 0 3 0 0
MILLER 702 5 0 0 0 3 3 0 0 1 0 1 0 1 4 0 0 0 0 0 1 0 0
MOUNT VERNON 4592 33 2 5 0 1 15 6 0 4 3 46 0 21 15 0 22 6 13 0 122 0 10
PIERCE CITY 1297 25 0 0 0 0 4 0 0 5 0 2 0 1 5 0 0 1 0 0 0 0 1
VERONA 621 3 0 0 0 0 0 0 0 0 0 1 0 0 0 0 1 0 0 0 0 0 0
LEWIS COUNTY 10,248 21 0 3 0 7 3 1 0 2 14 33 4 1 59 0 10 0 38 0 172 0 5
LEWIS CO - RURAL 6928 9 0 3 0 6 1 1 0 2 14 15 0 0 31 0 8 0 5 0 56 0 1
CANTON 2386 9 0 0 0 1 1 0 0 0 0 6 0 1 12 0 2 0 33 0 97 0 4
LA GRANGE 934 3 0 0 0 0 1 0 0 0 0 12 4 0 16 0 0 0 0 0 19 0 0
Crime in Missouri, 2011 128 Section 6.2
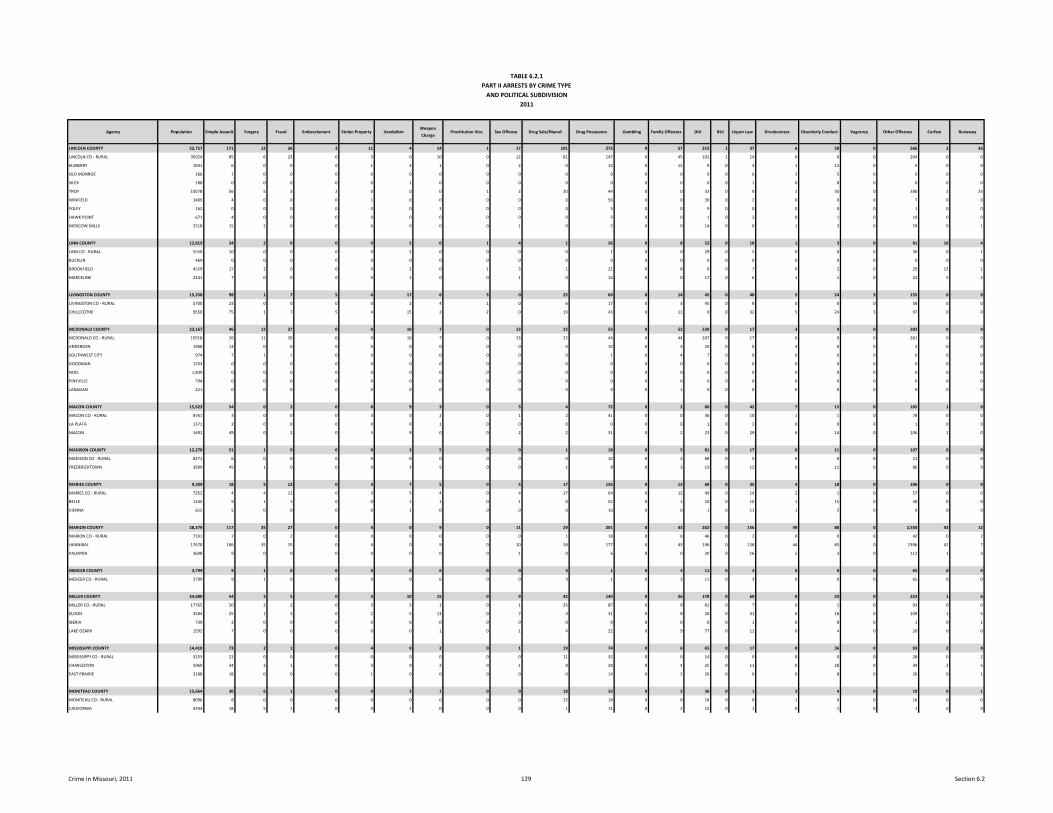
TABLE 6.2.1 PART II ARRESTS BY CRIME TYPE
AND POLITICAL SUBDIVISION2011
Agency Population Simple Assault Forgery Fraud Embezzlement Stolen Property VandalismWeapon
ChargeProstitution Vice Sex Offense Drug Sale/Manuf. Drug Possession Gambling Family Offenses DUI BUI Liquor Law Drunkenness Disorderly Conduct Vagrancy Other Offenses Curfew Runaway
LINCOLN COUNTY 52,757 171 13 26 2 11 4 14 1 17 101 273 0 57 215 1 37 6 58 0 566 2 26
LINCOLN CO - RURAL 35024 85 6 23 0 3 0 10 0 12 81 147 0 45 102 1 14 0 0 0 204 0 0
ELSBERRY 1941 6 0 0 0 1 3 1 0 2 0 14 0 12 9 0 3 1 14 0 5 0 0
OLD MONROE 266 1 0 0 0 0 0 0 0 0 0 0 0 0 9 0 6 2 5 0 0 0 0
SILEX 188 0 0 0 0 0 1 0 0 0 0 0 0 0 0 0 1 0 0 0 0 0 0
TROY 10578 56 5 3 2 0 0 0 1 2 20 44 0 0 32 0 9 2 35 0 280 2 25
WINFIELD 1409 4 0 0 0 1 0 0 0 0 0 56 0 0 39 0 2 0 0 0 7 0 0
FOLEY 162 0 0 0 0 0 0 3 0 0 0 5 0 0 9 0 0 0 0 0 1 0 0
HAWK POINT 671 4 0 0 0 0 0 0 0 0 0 5 0 0 1 0 2 0 1 0 10 0 0
MOSCOW MILLS 2518 15 2 0 0 6 0 0 0 1 0 2 0 0 14 0 0 1 3 0 59 0 1
LINN COUNTY 12,819 34 2 0 0 0 5 0 1 4 1 36 0 8 52 0 18 1 3 0 81 18 4
LINN CO - RURAL 5550 10 0 0 0 0 2 0 0 0 0 1 0 0 29 0 5 0 0 0 30 0 1
BUCKLIN 469 0 0 0 0 0 0 0 0 0 0 0 0 0 0 0 0 0 0 0 0 0 0
BROOKFIELD 4559 17 2 0 0 0 2 0 1 3 1 21 0 8 6 0 7 0 2 0 29 13 1
MARCELINE 2241 7 0 0 0 0 1 0 0 1 0 14 0 0 17 0 6 1 1 0 22 5 2
LIVINGSTON COUNTY 15,250 98 1 7 5 4 17 6 3 0 25 60 0 14 45 0 40 5 24 3 155 0 0
LIVINGSTON CO - RURAL 5700 23 0 0 0 0 2 4 1 0 6 17 0 3 45 0 8 0 0 0 58 0 0
CHILLICOTHE 9550 75 1 7 5 4 15 2 2 0 19 43 0 11 0 0 32 5 24 3 97 0 0
MCDONALD COUNTY 23,167 46 12 27 0 0 10 7 0 13 22 55 0 52 239 0 17 3 9 0 283 0 0
MCDONALD CO - RURAL 15918 26 11 26 0 0 10 7 0 13 22 44 0 44 207 0 17 0 9 0 281 0 0
ANDERSON 1968 13 0 0 0 0 0 0 0 0 0 10 0 3 25 0 0 3 0 0 2 0 0
SOUTHWEST CITY 974 7 1 1 0 0 0 0 0 0 0 1 0 4 7 0 0 0 0 0 0 0 0
GOODMAN 1253 0 0 0 0 0 0 0 0 0 0 0 0 0 0 0 0 0 0 0 0 0 0
NOEL 1,839 0 0 0 0 0 0 0 0 0 0 0 0 0 0 0 0 0 0 0 0 0 0
PINEVILLE 794 0 0 0 0 0 0 0 0 0 0 0 0 0 0 0 0 0 0 0 0 0 0
LANAGAN 421 0 0 0 0 0 0 0 0 0 0 0 0 1 0 0 0 0 0 0 0 0 0
MACON COUNTY 15,623 54 0 2 0 8 9 3 0 3 4 72 0 2 60 0 42 7 15 0 185 1 0
MACON CO - RURAL 8761 3 0 0 0 3 0 2 0 1 2 41 0 0 36 0 10 1 1 0 78 0 0
LA PLATA 1371 2 0 0 0 0 0 1 0 0 0 0 0 0 1 0 3 0 0 0 1 0 0
MACON 5491 49 0 2 0 5 9 0 0 2 2 31 0 2 23 0 29 6 14 0 106 1 0
MADISON COUNTY 12,270 51 1 0 0 0 3 5 0 0 1 18 0 5 81 0 17 0 11 0 107 0 9
MADISON CO - RURAL 8271 6 0 0 0 0 0 0 0 0 0 10 0 2 68 0 5 0 0 0 21 0 0
FREDERICKTOWN 3999 45 1 0 0 0 3 5 0 0 1 8 0 3 13 0 12 0 11 0 86 0 9
MARIES COUNTY 9,209 18 5 12 0 3 7 5 0 5 17 126 0 13 60 0 35 4 18 0 106 0 0
MARIES CO - RURAL 7252 4 4 11 0 3 5 4 0 4 17 64 0 12 49 0 14 2 1 0 57 0 0
BELLE 1345 9 1 1 0 0 1 1 0 1 0 52 0 1 10 0 10 1 15 0 40 0 0
VIENNA 612 5 0 0 0 0 1 0 0 0 0 10 0 0 1 0 11 1 2 0 9 0 0
MARION COUNTY 28,379 117 35 27 0 4 0 9 0 11 29 201 0 43 262 0 156 49 88 0 2,550 43 12
MARION CO - RURAL 7101 2 0 2 0 0 0 0 0 0 1 18 0 0 46 0 2 0 0 0 42 0 2
HANNIBAL 17670 106 35 25 0 4 0 9 0 10 28 177 0 43 196 0 138 44 85 0 2396 42 7
PALMYRA 3608 9 0 0 0 0 0 0 0 1 0 6 0 0 20 0 16 5 3 0 112 1 3
MERCER COUNTY 3,799 9 1 0 0 0 0 6 0 0 3 1 0 3 11 0 3 0 0 0 65 0 0
MERCER CO - RURAL 3799 9 1 0 0 0 0 6 0 0 3 1 0 3 11 0 3 0 0 0 65 0 0
MILLER COUNTY 24,680 54 3 5 0 5 10 15 0 9 42 140 0 26 178 0 60 0 23 0 223 1 6
MILLER CO - RURAL 17765 20 2 2 0 3 5 1 0 1 35 87 0 9 81 0 7 0 1 0 93 0 0
ELDON 4584 25 1 3 0 2 5 13 0 7 3 31 0 8 20 0 41 0 18 0 109 1 5
IBERIA 739 2 0 0 0 0 0 0 0 0 0 0 0 0 0 0 1 0 0 0 1 0 1
LAKE OZARK 1592 7 0 0 0 0 0 1 0 1 4 22 0 9 77 0 11 0 4 0 20 0 0
MISSISSIPPI COUNTY 14,410 73 2 1 0 4 9 2 0 1 19 74 0 6 65 0 17 0 36 0 93 2 8
MISSISSIPPI CO - RURAL 5253 21 0 0 0 0 0 0 0 0 11 32 0 0 14 0 0 0 0 0 28 0 2
CHARLESTON 5969 34 2 1 0 3 9 2 0 1 8 28 0 4 25 0 11 0 28 0 39 2 5
EAST PRAIRIE 3188 18 0 0 0 1 0 0 0 0 0 14 0 2 26 0 6 0 8 0 26 0 1
MONITEAU COUNTY 15,664 30 6 1 0 0 2 1 0 0 18 33 0 2 36 0 1 3 4 0 19 0 1
MONITEAU CO - RURAL 8096 8 0 0 0 0 0 0 0 0 15 18 0 0 18 0 0 1 0 0 16 0 0
CALIFORNIA 4294 18 5 1 0 0 2 0 0 0 1 11 0 2 15 0 1 0 1 0 1 0 0
Crime in Missouri, 2011 129 Section 6.2
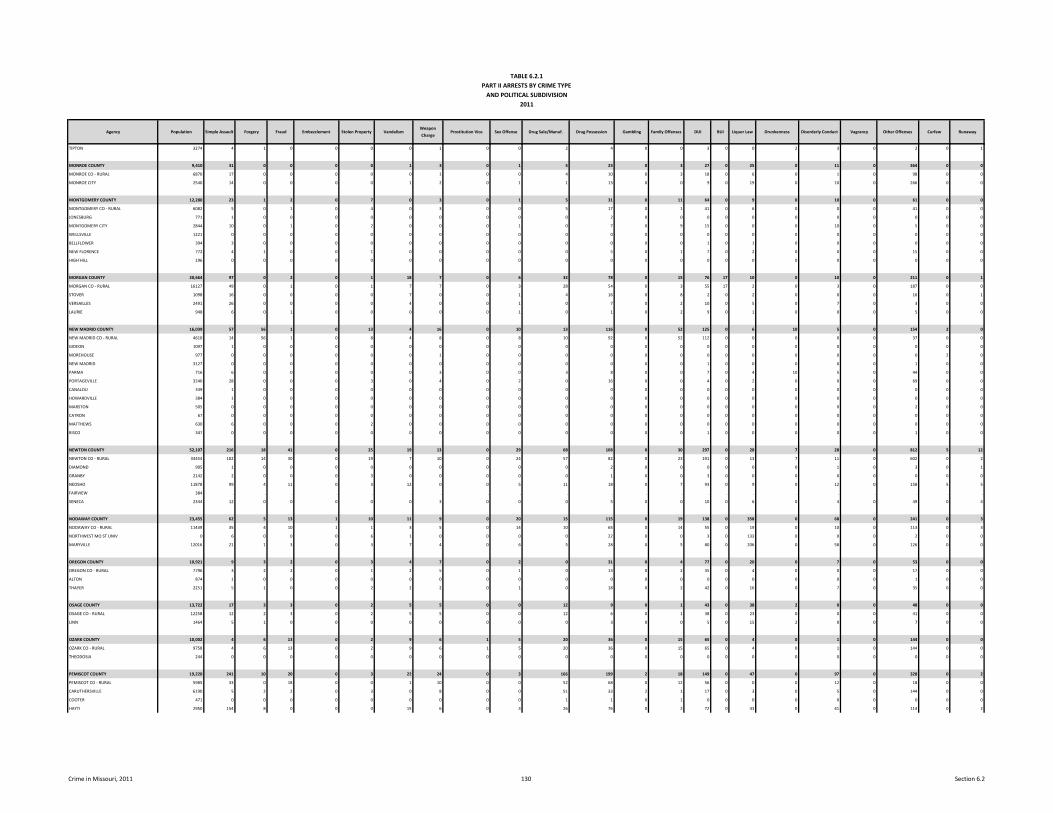
TABLE 6.2.1 PART II ARRESTS BY CRIME TYPE
AND POLITICAL SUBDIVISION2011
Agency Population Simple Assault Forgery Fraud Embezzlement Stolen Property VandalismWeapon
ChargeProstitution Vice Sex Offense Drug Sale/Manuf. Drug Possession Gambling Family Offenses DUI BUI Liquor Law Drunkenness Disorderly Conduct Vagrancy Other Offenses Curfew Runaway
TIPTON 3274 4 1 0 0 0 0 1 0 0 2 4 0 0 3 0 0 2 3 0 2 0 1
MONROE COUNTY 9,410 31 0 0 0 0 1 3 0 1 5 23 0 3 27 0 25 0 11 0 364 0 0
MONROE CO - RURAL 6870 17 0 0 0 0 0 1 0 0 4 10 0 3 18 0 6 0 1 0 98 0 0
MONROE CITY 2540 14 0 0 0 0 1 2 0 1 1 13 0 0 9 0 19 0 10 0 266 0 0
MONTGOMERY COUNTY 12,280 23 1 2 0 7 0 3 0 1 5 31 0 11 64 0 9 0 10 0 61 0 0
MONTGOMERY CO - RURAL 6082 5 0 1 0 4 0 3 0 0 5 17 0 1 41 0 6 0 0 0 41 0 0
JONESBURG 771 1 0 0 0 0 0 0 0 0 0 2 0 0 0 0 0 0 0 0 0 0 0
MONTGOMERY CITY 2844 10 0 1 0 2 0 0 0 1 0 7 0 9 15 0 0 0 10 0 5 0 0
WELLSVILLE 1221 0 0 0 0 0 0 0 0 0 0 0 0 0 0 0 0 0 0 0 0 0 0
BELLFLOWER 394 3 0 0 0 0 0 0 0 0 0 0 0 0 1 0 1 0 0 0 0 0 0
NEW FLORENCE 772 4 1 0 0 1 0 0 0 0 0 5 0 1 7 0 2 0 0 0 15 0 0
HIGH HILL 196 0 0 0 0 0 0 0 0 0 0 0 0 0 0 0 0 0 0 0 0 0 0
MORGAN COUNTY 20,664 97 0 2 0 1 18 7 0 6 32 78 0 15 76 17 10 0 10 0 211 0 1
MORGAN CO - RURAL 16127 49 0 1 0 1 7 7 0 3 28 54 0 3 55 17 2 0 3 0 187 0 0
STOVER 1098 16 0 0 0 0 7 0 0 1 4 16 0 8 2 0 2 0 0 0 16 0 1
VERSAILLES 2491 26 0 0 0 0 4 0 0 1 0 7 0 2 10 0 5 0 7 0 3 0 0
LAURIE 948 6 0 1 0 0 0 0 0 1 0 1 0 2 9 0 1 0 0 0 5 0 0
NEW MADRID COUNTY 16,039 57 56 1 0 13 4 16 0 10 13 116 0 52 125 0 6 10 5 0 154 2 0
NEW MADRID CO - RURAL 4610 14 56 1 0 8 4 8 0 8 10 92 0 52 112 0 0 0 0 0 37 0 0
GIDEON 1097 1 0 0 0 0 0 0 0 0 0 0 0 0 0 0 0 0 0 0 0 0 0
MOREHOUSE 977 0 0 0 0 0 0 1 0 0 0 0 0 0 0 0 0 0 0 0 0 2 0
NEW MADRID 3127 0 0 0 0 0 0 0 0 0 0 0 0 0 1 0 0 0 0 0 1 0 0
PARMA 716 6 0 0 0 0 0 3 0 0 3 8 0 0 7 0 4 10 5 0 44 0 0
PORTAGEVILLE 3240 28 0 0 0 3 0 4 0 2 0 16 0 0 4 0 2 0 0 0 69 0 0
CANALOU 339 1 0 0 0 0 0 0 0 0 0 0 0 0 0 0 0 0 0 0 0 0 0
HOWARDVILLE 384 1 0 0 0 0 0 0 0 0 0 0 0 0 0 0 0 0 0 0 0 0 0
MARSTON 505 0 0 0 0 0 0 0 0 0 0 0 0 0 0 0 0 0 0 0 2 0 0
CATRON 67 0 0 0 0 0 0 0 0 0 0 0 0 0 0 0 0 0 0 0 0 0 0
MATTHEWS 630 6 0 0 0 2 0 0 0 0 0 0 0 0 0 0 0 0 0 0 0 0 0
RISCO 347 0 0 0 0 0 0 0 0 0 0 0 0 0 1 0 0 0 0 0 1 0 0
NEWTON COUNTY 52,107 216 18 41 0 25 19 13 0 29 68 108 0 30 297 0 28 7 28 0 812 5 12
NEWTON CO - RURAL 34454 102 14 30 0 19 7 10 0 24 57 82 0 23 191 0 13 7 11 0 602 0 2
DIAMOND 905 1 0 0 0 0 0 0 0 0 0 2 0 0 0 0 0 0 1 0 3 0 1
GRANBY 2142 2 0 0 0 3 0 0 0 0 0 1 0 0 3 0 0 0 0 0 0 0 0
NEOSHO 11878 99 4 11 0 3 12 0 0 5 11 18 0 7 93 0 9 0 12 0 158 5 5
FAIRVIEW 384 . . . . . . . . . . . . . . . . . . . . . .
SENECA 2344 12 0 0 0 0 0 3 0 0 0 5 0 0 10 0 6 0 4 0 49 0 4
NODAWAY COUNTY 23,455 62 5 13 1 10 11 9 0 20 15 115 0 19 138 0 358 0 68 0 241 0 3
NODAWAY CO - RURAL 11439 35 4 10 1 1 3 5 0 14 10 65 0 14 55 0 19 0 10 0 113 0 3
NORTHWEST MO ST UNIV 0 6 0 0 0 6 1 0 0 0 0 22 0 0 3 0 133 0 0 0 2 0 0
MARYVILLE 12016 21 1 3 0 3 7 4 0 6 5 28 0 5 80 0 206 0 58 0 126 0 0
OREGON COUNTY 10,921 9 3 2 0 3 4 7 0 2 0 31 0 4 77 0 20 0 7 0 53 0 0
OREGON CO - RURAL 7796 3 2 2 0 1 2 5 0 1 0 13 0 2 35 0 4 0 0 0 17 0 0
ALTON 874 1 0 0 0 0 0 0 0 0 0 0 0 0 0 0 0 0 0 0 1 0 0
THAYER 2251 5 1 0 0 2 2 2 0 1 0 18 0 2 42 0 16 0 7 0 35 0 0
OSAGE COUNTY 13,722 17 3 3 0 2 5 5 0 0 12 9 0 1 43 0 38 2 0 0 48 0 0
OSAGE CO - RURAL 12258 12 2 3 0 2 5 5 0 0 12 6 0 1 38 0 23 0 0 0 41 0 0
LINN 1464 5 1 0 0 0 0 0 0 0 0 3 0 0 5 0 15 2 0 0 7 0 0
OZARK COUNTY 10,002 4 6 13 0 2 9 6 1 5 20 36 0 15 65 0 4 0 1 0 144 0 0
OZARK CO - RURAL 9758 4 6 13 0 2 9 6 1 5 20 36 0 15 65 0 4 0 1 0 144 0 0
THEODOSIA 244 0 0 0 0 0 0 0 0 0 0 0 0 0 0 0 0 0 0 0 0 0 0
PEMISCOT COUNTY 19,220 241 10 20 0 3 22 24 0 3 166 199 2 18 149 0 47 0 97 0 328 0 2
PEMISCOT CO - RURAL 5985 33 0 18 0 0 1 10 0 0 52 68 0 12 56 0 0 0 12 0 18 0 0
CARUTHERSVILLE 6190 5 2 2 0 3 0 8 0 0 51 33 2 1 17 0 3 0 5 0 144 0 0
COOTER 471 0 0 0 0 0 0 0 0 0 1 1 0 1 0 0 0 0 0 0 0 0 0
HAYTI 2950 154 8 0 0 0 15 6 0 3 26 76 0 2 72 0 43 0 41 0 114 0 2
Crime in Missouri, 2011 130 Section 6.2

TABLE 6.2.1 PART II ARRESTS BY CRIME TYPE
AND POLITICAL SUBDIVISION2011
Agency Population Simple Assault Forgery Fraud Embezzlement Stolen Property VandalismWeapon
ChargeProstitution Vice Sex Offense Drug Sale/Manuf. Drug Possession Gambling Family Offenses DUI BUI Liquor Law Drunkenness Disorderly Conduct Vagrancy Other Offenses Curfew Runaway
HOLLAND 235 0 0 0 0 0 0 0 0 0 1 0 0 0 0 0 0 0 0 0 0 0 0
STEELE 2180 45 0 0 0 0 5 0 0 0 31 16 0 2 4 0 1 0 38 0 50 0 0
HOMESTOWN 152 0 0 0 0 0 0 0 0 0 0 0 0 0 0 0 0 0 0 0 0 0 0
WARDELL 429 0 0 0 0 0 0 0 0 0 4 5 0 0 0 0 0 0 1 0 1 0 0
HAYTI HEIGHTS 628 4 0 0 0 0 1 0 0 0 0 0 0 0 0 0 0 0 0 0 1 0 0
PERRY COUNTY 19,040 105 8 24 1 2 10 13 0 13 16 62 0 10 129 0 25 2 2 3 134 5 8
PERRY CO - RURAL 10785 37 1 24 0 1 6 8 0 12 12 34 0 7 67 0 14 0 0 0 86 0 2
PERRYVILLE 8255 68 7 0 1 1 4 5 0 1 4 28 0 3 62 0 11 2 2 3 48 5 6
PETTIS COUNTY 42,354 205 13 21 0 11 43 21 0 2 35 231 0 7 121 0 66 0 97 0 1,026 35 10
PETTIS CO - RURAL 19745 12 3 4 0 8 5 0 0 1 4 46 0 3 53 0 0 0 1 0 127 0 7
LAMONTE 1144 5 0 0 0 0 0 0 0 0 0 4 0 0 4 0 0 0 0 0 5 0 1
SEDALIA 21465 188 10 17 0 3 38 21 0 1 31 181 0 4 64 0 66 0 96 0 894 35 2
PHELPS COUNTY 45,320 186 5 8 0 12 22 21 0 11 53 231 0 11 279 0 76 0 44 1 205 7 25
PHELPS CO - RURAL 20355 78 0 1 0 3 1 10 0 4 20 78 0 4 116 0 6 0 0 0 99 0 12
ROLLA 19630 76 4 3 0 8 17 8 0 5 32 93 0 7 127 0 32 0 41 0 66 3 8
ST. JAMES 4231 32 1 4 0 1 4 3 0 2 1 51 0 0 33 0 12 0 1 1 30 4 5
DOOLITTLE 632 0 0 0 0 0 0 0 0 0 0 3 0 0 0 0 0 0 2 0 5 0 0
NEWBURG 472 0 0 0 0 0 0 0 0 0 0 0 0 0 0 0 0 0 0 0 2 0 0
MO UNIV OF SCIENCE & TECH 0 0 0 0 0 0 0 0 0 0 0 6 0 0 3 0 26 0 0 0 3 0 0
PIKE COUNTY 18,583 128 3 1 0 4 10 6 0 5 5 43 0 7 59 1 17 0 48 0 338 7 1
PIKE CO - RURAL 9530 0 0 1 0 0 1 1 0 1 5 26 0 1 34 1 0 0 0 0 167 0 0
BOWLING GREEN 5353 55 0 0 0 0 8 1 0 2 0 8 0 2 16 0 13 0 41 0 56 7 0
FRANKFORD 324 0 0 0 0 0 0 0 0 0 0 0 0 0 0 0 0 0 0 0 0 0 0
LOUISANA 3376 73 3 0 0 4 1 4 0 2 0 9 0 4 9 0 4 0 7 0 115 0 1
PLATTE COUNTY 45,812 165 6 12 1 5 17 5 0 9 16 271 0 11 274 0 121 0 13 0 1,019 1 1
PLATTE CO - RURAL 25935 68 5 9 0 3 3 3 0 9 3 143 0 3 138 0 32 0 0 0 237 0 0
PARKVILLE 5574 8 0 0 0 0 3 0 0 0 2 16 0 0 31 0 1 0 0 0 83 0 0
PLATTE CITY 4708 28 1 2 1 0 1 1 0 0 6 31 0 3 36 0 7 0 9 0 99 1 0
PLATTE WOODS 386 1 0 0 0 0 1 0 0 0 0 3 0 0 3 0 0 0 0 0 76 0 0
WESTON 1647 5 0 0 0 0 0 0 0 0 2 2 0 0 4 0 0 0 0 0 34 0 0
RIVERSIDE 2948 52 0 1 0 2 5 0 0 0 2 67 0 1 56 0 81 0 0 0 391 0 1
LAKE WAUKOMIS 873 0 0 0 0 0 3 0 0 0 0 5 0 3 0 0 0 0 0 0 15 0 0
NORTHMOOR 326 2 0 0 0 0 0 1 0 0 1 0 0 0 3 0 0 0 0 0 59 0 0
EDGERTON 548 0 0 0 0 0 0 0 0 0 0 0 0 0 0 0 0 0 0 0 0 0 0
FERRELVIEW 453 1 0 0 0 0 1 0 0 0 0 1 0 0 0 0 0 0 1 0 1 0 0
TRACY 209 0 0 0 0 0 0 0 0 0 0 1 0 1 2 0 0 0 3 0 13 0 0
CAMDEN POINT 476 0 0 0 0 0 0 0 0 0 0 0 0 0 0 0 0 0 0 0 0 0 0
WEATHERBY LAKE 1729 0 0 0 0 0 0 0 0 0 0 2 0 0 1 0 0 0 0 0 11 0 0
POLK COUNTY 31,250 117 2 0 0 4 0 2 0 7 16 136 0 8 113 0 39 3 57 0 214 0 1
POLK CO - RURAL 18742 9 1 0 0 0 0 1 0 0 2 16 0 0 36 0 14 3 0 0 65 0 0
BOLIVAR 10363 104 1 0 0 4 0 1 0 7 13 115 0 8 74 0 25 0 56 0 147 0 1
HUMANSVILLE 1052 2 0 0 0 0 0 0 0 0 1 4 0 0 3 0 0 0 0 0 2 0 0
FAIR PLAY 477 0 0 0 0 0 0 0 0 0 0 0 0 0 0 0 0 0 0 0 0 0 0
PLEASANT HOPE 616 2 0 0 0 0 0 0 0 0 0 1 0 0 0 0 0 0 1 0 0 0 0
PULASKI COUNTY 52,714 144 23 86 1 16 27 27 1 23 36 270 0 40 389 0 55 17 125 0 310 0 11
PULASKI CO - RURAL 38971 36 18 75 0 13 14 17 0 14 14 86 0 32 140 0 5 0 12 0 120 0 8
CROCKER 1114 5 0 0 0 0 0 0 0 1 0 9 0 0 5 0 1 0 1 0 2 0 1
DIXON 1555 21 0 2 0 1 2 0 0 1 2 11 0 0 3 0 2 0 7 0 13 0 1
RICHLAND 1870 10 1 2 0 0 0 2 0 1 0 6 0 0 4 0 0 0 1 0 20 0 0
ST. ROBERT 4356 51 4 2 1 0 10 7 1 3 17 96 0 7 150 0 33 17 82 0 73 0 1
WAYNESVILLE 4848 21 0 5 0 2 1 1 0 3 3 62 0 1 87 0 14 0 22 0 82 0 0
PUTNAM COUNTY 4,997 5 0 0 0 0 5 1 0 1 4 23 0 2 25 0 7 0 0 0 28 0 0
PUTNAM CO - RURAL 3125 1 0 0 0 0 0 0 0 1 1 4 0 2 7 0 2 0 0 0 26 0 0
UNIONVILLE 1872 4 0 0 0 0 5 1 0 0 3 19 0 0 18 0 5 0 0 0 2 0 0
RALLS COUNTY 9,862 9 1 0 0 3 0 2 0 0 1 14 0 11 39 5 3 0 8 0 155 0 6
RALLS CO - RURAL 7678 5 1 0 0 3 0 2 0 0 1 11 0 11 35 5 2 0 3 0 127 0 5
CENTER 510 0 0 0 0 0 0 0 0 0 0 1 0 0 0 0 0 0 0 0 0 0 0
Crime in Missouri, 2011 131 Section 6.2
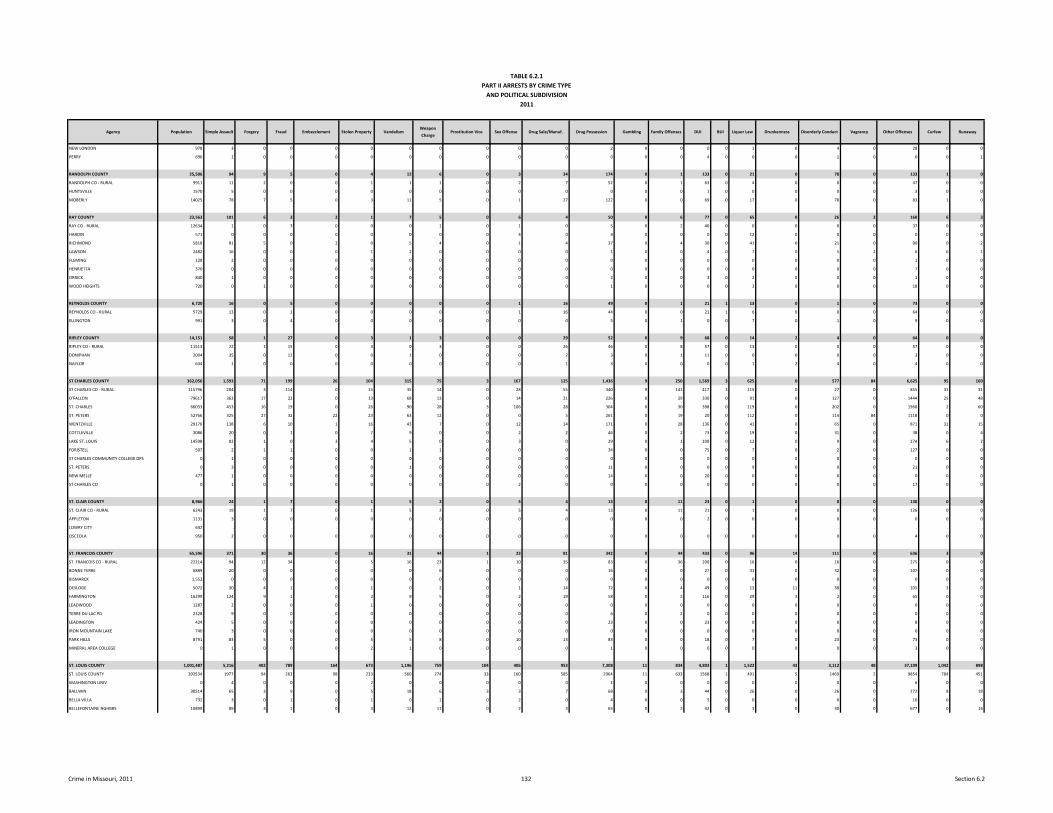
TABLE 6.2.1 PART II ARRESTS BY CRIME TYPE
AND POLITICAL SUBDIVISION2011
Agency Population Simple Assault Forgery Fraud Embezzlement Stolen Property VandalismWeapon
ChargeProstitution Vice Sex Offense Drug Sale/Manuf. Drug Possession Gambling Family Offenses DUI BUI Liquor Law Drunkenness Disorderly Conduct Vagrancy Other Offenses Curfew Runaway
NEW LONDON 978 3 0 0 0 0 0 0 0 0 0 2 0 0 0 0 1 0 4 0 28 0 0
PERRY 696 1 0 0 0 0 0 0 0 0 0 0 0 0 4 0 0 0 1 0 0 0 1
RANDOLPH COUNTY 25,506 94 9 5 0 4 12 6 0 3 34 174 0 1 133 0 21 0 78 0 133 1 0
RANDOLPH CO - RURAL 9911 11 2 0 0 1 1 1 0 2 7 52 0 1 63 0 4 0 0 0 47 0 0
HUNTSVILLE 1570 5 0 0 0 0 0 0 0 0 0 0 0 0 1 0 0 0 0 0 3 0 0
MOBERLY 14025 78 7 5 0 3 11 5 0 1 27 122 0 0 69 0 17 0 78 0 83 1 0
RAY COUNTY 23,563 101 6 3 2 1 7 5 0 6 4 50 0 6 77 0 65 0 26 2 160 6 3
RAY CO - RURAL 12634 1 0 3 0 0 0 1 0 1 0 5 0 2 40 0 0 0 0 0 37 0 0
HARDIN 571 0 0 0 0 0 0 0 0 4 0 4 0 0 0 0 12 0 0 0 0 0 0
RICHMOND 5818 81 5 0 2 0 5 4 0 1 4 37 0 4 30 0 41 0 21 0 90 0 2
LAWSON 2482 16 0 0 0 1 2 0 0 0 0 1 0 0 4 0 7 0 5 2 6 6 1
FLEMING 128 2 0 0 0 0 0 0 0 0 0 0 0 0 0 0 0 0 0 0 1 0 0
HENRIETTA 370 0 0 0 0 0 0 0 0 0 0 0 0 0 0 0 0 0 0 0 7 0 0
ORRICK 840 1 0 0 0 0 0 0 0 0 0 2 0 0 3 0 2 0 0 0 1 0 0
WOOD HEIGHTS 720 0 1 0 0 0 0 0 0 0 0 1 0 0 0 0 3 0 0 0 18 0 0
REYNOLDS COUNTY 6,720 16 0 5 0 0 0 0 0 1 16 49 0 1 21 1 13 0 1 0 73 0 0
REYNOLDS CO - RURAL 5729 13 0 1 0 0 0 0 0 1 16 44 0 0 21 1 6 0 0 0 64 0 0
ELLINGTON 991 3 0 4 0 0 0 0 0 0 0 5 0 1 0 0 7 0 1 0 9 0 0
RIPLEY COUNTY 14,151 58 1 27 0 3 1 3 0 0 29 52 0 9 68 0 14 2 4 0 64 0 0
RIPLEY CO - RURAL 11513 22 1 15 0 3 0 3 0 0 26 46 0 8 57 0 13 0 0 0 57 0 0
DONIPHAN 2004 35 0 12 0 0 1 0 0 0 2 3 0 1 11 0 0 0 0 0 3 0 0
NAYLOR 634 1 0 0 0 0 0 0 0 0 1 3 0 0 0 0 1 2 4 0 4 0 0
ST CHARLES COUNTY 362,056 1,593 71 199 26 104 315 75 3 167 125 1,436 9 250 1,569 3 625 0 577 84 6,625 95 160
ST CHARLES CO - RURAL 115796 204 3 114 0 15 35 14 0 28 55 340 9 141 417 3 215 0 27 0 855 31 31
O'FALLON 79617 363 17 22 0 13 68 13 0 14 21 226 0 29 330 0 91 0 127 0 1444 25 48
ST. CHARLES 66033 453 16 19 0 26 90 28 3 106 28 304 0 30 398 0 119 0 202 0 1960 2 60
ST. PETERS 52766 325 27 32 22 23 63 12 0 0 5 261 0 19 20 0 112 0 114 84 1118 0 0
WENTZVILLE 29176 138 6 10 1 16 43 7 0 12 14 171 0 28 136 0 41 0 65 0 871 31 15
COTTLEVILLE 3086 20 0 1 0 7 9 0 0 2 2 46 0 2 73 0 19 0 31 0 38 0 4
LAKE ST. LOUIS 14598 82 1 0 3 4 5 0 0 3 0 29 0 1 100 0 12 0 9 0 174 6 2
FORISTELL 507 2 1 1 0 0 1 1 0 0 0 34 0 0 75 0 7 0 2 0 127 0 0
ST CHARLES COMMUNITY COLLEGE DPS 0 1 0 0 0 0 0 0 0 0 0 0 0 0 0 0 0 0 0 0 0 0 0
ST. PETERS 0 3 0 0 0 0 1 0 0 0 0 11 0 0 0 0 9 0 0 0 21 0 0
NEW MELLE 477 1 0 0 0 0 0 0 0 0 0 14 0 0 20 0 0 0 0 0 0 0 0
ST CHARLES CO 0 1 0 0 0 0 0 0 0 2 0 0 0 0 0 0 0 0 0 0 17 0 0
ST. CLAIR COUNTY 8,966 24 1 7 0 1 5 2 0 5 4 13 0 11 23 0 1 0 0 0 130 0 0
ST. CLAIR CO - RURAL 6243 19 1 7 0 1 5 2 0 5 4 13 0 11 21 0 1 0 0 0 126 0 0
APPLETON 1131 3 0 0 0 0 0 0 0 0 0 0 0 0 2 0 0 0 0 0 0 0 0
LOWRY CITY 642 . . . . . . . . . . . . . . . . . . . . . .
OSCEOLA 950 2 0 0 0 0 0 0 0 0 0 0 0 0 0 0 0 0 0 0 4 0 0
ST. FRANCOIS COUNTY 65,596 371 30 36 0 16 31 44 1 23 81 342 0 44 433 0 96 14 111 0 636 3 0
ST. FRANCOIS CO - RURAL 22214 94 12 34 0 5 16 23 1 10 35 83 0 36 200 0 16 0 16 0 275 0 0
BONNE TERRE 6889 20 0 0 0 0 0 6 0 0 0 16 0 0 27 0 31 0 32 0 107 0 0
BISMARCK 1,552 0 0 0 0 0 0 0 0 0 0 0 0 0 0 0 0 0 0 0 0 0 0
DESLOGE 5072 30 4 1 0 1 0 2 0 1 14 72 0 4 49 0 13 11 38 0 105 3 0
FARMINGTON 16299 124 9 1 0 2 9 5 0 2 19 58 0 2 116 0 29 3 2 0 65 0 0
LEADWOOD 1287 2 0 0 0 1 0 0 0 0 0 0 0 0 0 0 0 0 0 0 0 0 0
TERRE DU LAC PD 2328 9 0 0 0 0 0 0 0 0 0 6 0 2 0 0 0 0 0 0 0 0 0
LEADINGTON 424 5 0 0 0 0 0 0 0 0 0 23 0 0 23 0 0 0 0 0 8 0 0
IRON MOUNTAIN LAKE 740 3 0 0 0 0 0 0 0 0 0 0 0 0 0 0 0 0 0 0 0 0 0
PARK HILLS 8791 83 5 0 0 5 5 8 0 10 13 83 0 0 18 0 7 0 23 0 73 0 0
MINERAL AREA COLLEGE 0 1 0 0 0 2 1 0 0 0 0 1 0 0 0 0 0 0 0 0 3 0 0
ST. LOUIS COUNTY 1,001,487 5,216 402 789 164 673 1,196 759 104 406 953 7,308 11 834 4,803 1 1,522 43 3,112 48 37,109 1,042 898
ST. LOUIS COUNTY 392534 1977 94 263 98 233 560 274 33 160 585 2964 11 633 1568 1 491 5 1469 2 9854 784 451
WASHINGTON UNIV 0 4 0 0 0 2 0 0 0 0 0 1 0 0 0 0 0 0 0 0 6 0 0
BALLWIN 30514 65 3 9 0 5 18 6 3 3 7 68 0 3 44 0 26 0 26 0 272 8 18
BELLA VILLA 732 3 0 1 0 1 0 1 0 2 0 4 0 0 5 0 0 0 0 0 10 0 0
BELLEFONTAINE NGHBRS 10899 89 3 1 0 3 12 11 0 2 3 65 0 2 42 0 3 0 30 0 677 0 14
Crime in Missouri, 2011 132 Section 6.2
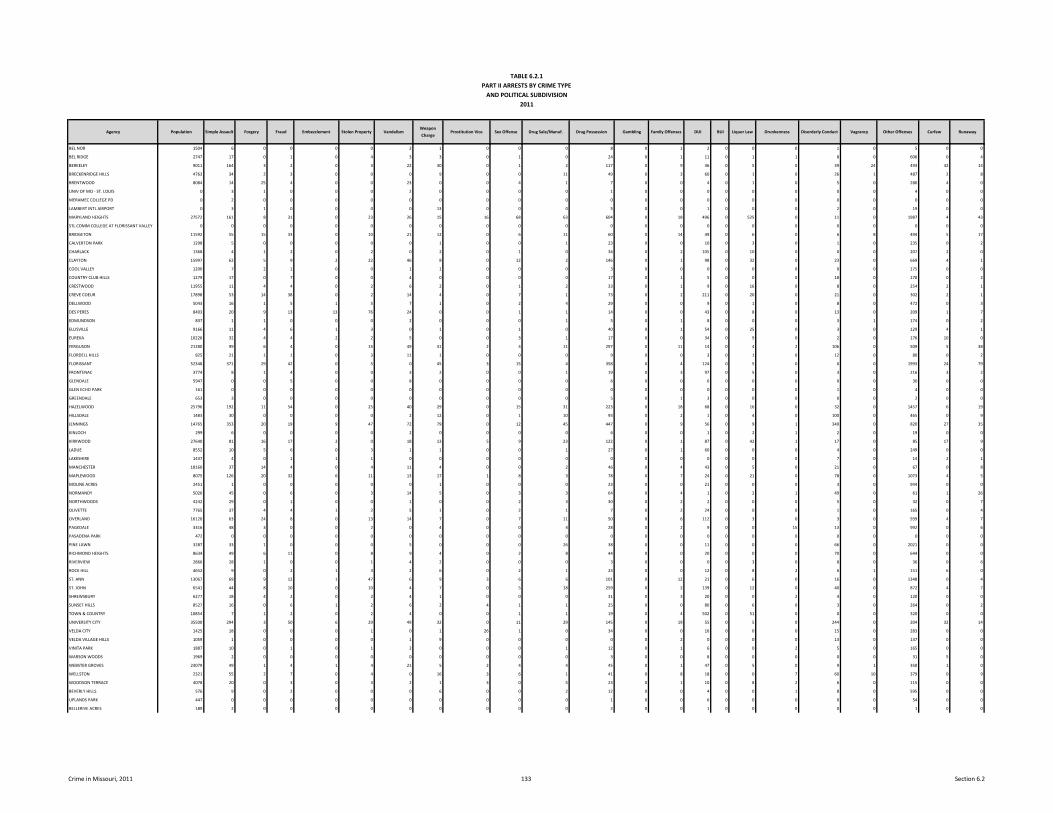
TABLE 6.2.1 PART II ARRESTS BY CRIME TYPE
AND POLITICAL SUBDIVISION2011
Agency Population Simple Assault Forgery Fraud Embezzlement Stolen Property VandalismWeapon
ChargeProstitution Vice Sex Offense Drug Sale/Manuf. Drug Possession Gambling Family Offenses DUI BUI Liquor Law Drunkenness Disorderly Conduct Vagrancy Other Offenses Curfew Runaway
BEL NOR 1504 6 0 0 0 0 2 1 0 0 0 8 0 1 2 0 0 0 1 0 5 0 0
BEL RIDGE 2747 17 0 1 0 4 3 3 0 1 0 24 0 1 11 0 1 1 8 0 606 0 4
BERKELEY 9011 164 3 2 0 3 22 30 0 1 2 117 0 9 36 0 5 0 39 24 493 42 14
BRECKENRIDGE HILLS 4763 34 2 3 0 0 0 9 0 0 11 49 0 3 60 0 1 0 26 1 487 2 8
BRENTWOOD 8084 14 25 4 0 0 23 0 0 4 1 7 0 0 4 0 1 0 5 0 280 4 0
UNIV OF MO - ST. LOUIS 0 3 1 0 0 0 2 0 0 0 0 1 0 0 0 0 0 0 0 0 4 0 0
MERAMEC COLLEGE PD 0 2 0 0 0 0 0 0 0 0 0 0 0 0 0 0 0 0 0 0 0 0 0
LAMBERT INTL AIRPORT 0 3 1 0 0 0 0 13 0 0 0 5 0 0 1 0 0 0 2 0 19 0 0
MARYLAND HEIGHTS 27572 161 8 31 0 23 26 15 16 68 63 604 0 18 496 0 525 0 11 0 1987 4 43
STL COMM COLLEGE AT FLORISSANT VALLEY 0 0 0 0 0 0 0 0 0 0 0 0 0 0 0 0 0 0 0 0 0 0 0
BRIDGETON 11592 55 15 33 0 10 21 12 0 6 11 60 0 14 49 0 6 0 6 8 494 5 17
CALVERTON PARK 1298 5 0 0 0 0 0 1 0 0 1 23 0 0 10 0 3 0 1 0 235 0 2
CHARLACK 1368 4 1 2 0 2 0 2 0 1 0 34 0 2 105 0 10 0 0 0 207 2 0
CLAYTON 15997 62 5 9 2 22 46 8 0 12 2 146 0 1 98 0 32 0 23 0 669 4 1
COOL VALLEY 1200 7 2 1 0 0 1 1 0 0 0 3 0 0 0 0 0 0 0 0 175 0 0
COUNTRY CLUB HILLS 1279 17 0 7 0 0 4 0 0 0 0 17 0 1 5 0 0 0 18 0 170 0 2
CRESTWOOD 11955 11 4 4 0 2 6 2 0 1 2 33 0 1 9 0 16 0 8 0 254 2 1
CREVE COEUR 17898 53 14 38 0 2 14 4 0 7 1 73 0 2 211 0 20 0 21 0 302 2 1
DELLWOOD 5043 16 1 5 1 5 7 1 0 2 4 29 0 0 9 0 1 0 8 0 472 0 3
DES PERES 8403 20 9 13 13 76 24 0 0 1 1 14 0 0 43 0 8 0 13 0 209 1 7
EDMUNDSON 837 1 1 0 0 0 2 0 0 0 1 5 0 1 8 0 0 0 3 1 174 0 2
ELLISVILLE 9166 11 4 6 1 3 0 1 0 1 0 40 0 1 54 0 25 0 3 0 129 4 1
EUREKA 10226 32 4 4 2 2 5 0 0 3 1 17 0 0 34 0 9 0 2 0 176 10 0
FERGUSON 21280 99 6 4 0 15 49 41 2 4 11 297 0 11 14 0 4 2 106 0 509 5 38
FLORDELL HILLS 825 21 1 1 0 3 11 1 0 0 0 9 0 0 3 0 1 0 12 0 80 0 2
FLORISSANT 52348 371 29 42 0 5 0 45 3 15 4 358 0 4 124 0 5 0 0 0 1993 24 79
FRONTENAC 3774 8 1 4 0 0 3 2 0 0 1 19 0 3 97 0 5 0 3 0 216 3 2
GLENDALE 5947 0 0 5 0 0 8 0 0 0 0 6 0 0 6 0 0 0 0 0 30 0 0
GLEN ECHO PARK 161 0 0 0 0 0 0 0 0 0 0 0 0 0 0 0 0 0 1 0 4 0 0
GREENDALE 653 3 0 0 0 0 0 0 0 0 0 5 0 1 3 0 0 0 0 0 2 0 0
HAZELWOOD 25796 192 11 54 0 25 40 29 0 15 31 223 0 18 68 0 16 0 32 0 1457 6 19
HILLSDALE 1483 30 0 0 0 0 2 12 0 1 10 93 0 2 1 0 4 0 100 0 465 0 9
JENNINGS 14765 353 20 19 9 47 72 79 0 12 45 447 0 9 56 0 9 1 349 0 820 27 35
KINLOCH 299 6 0 0 0 0 2 0 0 0 0 6 0 0 1 0 2 1 2 0 19 0 0
KIRKWOOD 27640 81 16 17 2 0 18 13 5 9 23 122 0 1 87 0 42 1 17 0 85 17 9
LADUE 8552 10 5 6 0 3 1 1 0 0 1 27 0 1 60 0 0 0 4 0 249 0 0
LAKESHIRE 1437 4 0 1 1 1 0 0 0 0 0 0 0 0 0 0 0 0 7 0 14 2 1
MANCHESTER 18160 37 14 4 0 4 11 4 0 0 2 46 0 4 43 0 5 0 21 0 67 0 8
MAPLEWOOD 8075 126 20 32 6 11 13 17 1 8 3 78 0 7 24 0 21 0 78 0 1073 4 5
MOLINE ACRES 2451 1 0 0 0 0 0 1 0 0 0 23 0 0 21 0 0 0 3 0 944 0 0
NORMANDY 5026 45 0 6 0 3 14 5 0 3 3 64 0 4 1 0 2 1 49 0 61 1 26
NORTHWOODS 4242 29 0 1 0 0 1 0 0 2 3 30 0 2 2 0 0 0 5 0 32 0 7
OLIVETTE 7765 37 4 4 1 2 5 1 0 2 1 7 0 2 24 0 0 0 1 0 165 0 4
OVERLAND 16120 63 24 8 0 13 14 7 0 7 11 50 0 6 112 0 3 0 3 0 939 4 7
PAGEDALE 3316 48 3 0 0 2 0 4 0 0 4 28 0 2 9 0 0 15 13 0 992 0 6
PASADENA PARK 472 0 0 0 0 0 0 0 0 0 0 0 0 0 0 0 0 0 0 0 0 0 0
PINE LAWN 3287 33 1 0 0 0 5 0 0 0 26 38 0 0 11 0 0 0 66 0 2021 0 0
RICHMOND HEIGHTS 8634 49 6 11 0 8 9 4 0 2 8 44 0 0 20 0 0 0 70 0 644 0 0
RIVERVIEW 2866 28 1 0 0 1 4 2 0 0 0 3 0 0 0 0 3 0 8 0 36 0 6
ROCK HILL 4652 9 0 2 1 3 2 6 0 2 1 23 0 0 12 0 8 2 6 1 151 6 0
ST. ANN 13067 69 9 12 1 47 6 9 3 6 6 101 0 12 21 0 6 0 16 0 1348 0 4
ST. JOHN 6541 44 8 10 0 10 4 7 0 5 18 259 0 2 139 0 12 0 40 0 872 4 7
SHREWSBURY 6277 18 4 2 0 2 4 1 0 0 0 31 0 3 20 0 0 2 4 0 120 0 0
SUNSET HILLS 8527 16 0 6 1 2 6 2 4 1 1 25 0 0 80 0 6 0 3 0 264 0 2
TOWN & COUNTRY 10854 7 1 2 0 2 4 0 0 1 1 19 0 4 502 0 51 0 0 0 320 0 0
UNIVERSITY CITY 35500 294 3 50 6 29 49 32 0 11 29 145 0 19 55 0 5 0 244 0 204 32 14
VELDA CITY 1425 18 0 0 0 1 0 1 26 1 0 34 0 0 16 0 0 0 15 0 283 0 0
VELDA VILLAGE HILLS 1059 1 0 0 0 0 1 9 0 0 0 0 0 2 0 0 0 0 13 0 137 0 0
VINITA PARK 1887 10 0 1 0 1 2 0 0 0 1 12 0 1 6 0 0 2 5 0 165 0 0
WARSON WOODS 1969 2 0 0 0 0 0 0 0 0 0 3 0 0 8 0 0 0 0 0 31 5 0
WEBSTER GROVES 23079 49 1 4 1 4 21 5 2 4 4 45 0 1 47 0 5 0 9 1 350 1 0
WELLSTON 2321 55 2 7 0 4 0 16 3 6 1 41 0 8 18 0 0 7 60 10 379 0 9
WOODSON TERRACE 4078 20 0 3 0 3 2 1 3 0 5 23 0 1 10 0 8 2 6 0 115 0 0
BEVERLY HILLS 576 9 0 2 0 0 0 6 0 0 2 12 0 0 4 0 0 1 8 0 595 0 0
UPLANDS PARK 447 0 0 0 0 0 0 0 0 0 0 1 0 0 6 0 0 0 0 0 54 0 0
BELLERIVE ACRES 189 2 0 0 0 0 0 0 0 0 0 2 0 0 1 0 0 0 0 0 1 0 0
Crime in Missouri, 2011 133 Section 6.2
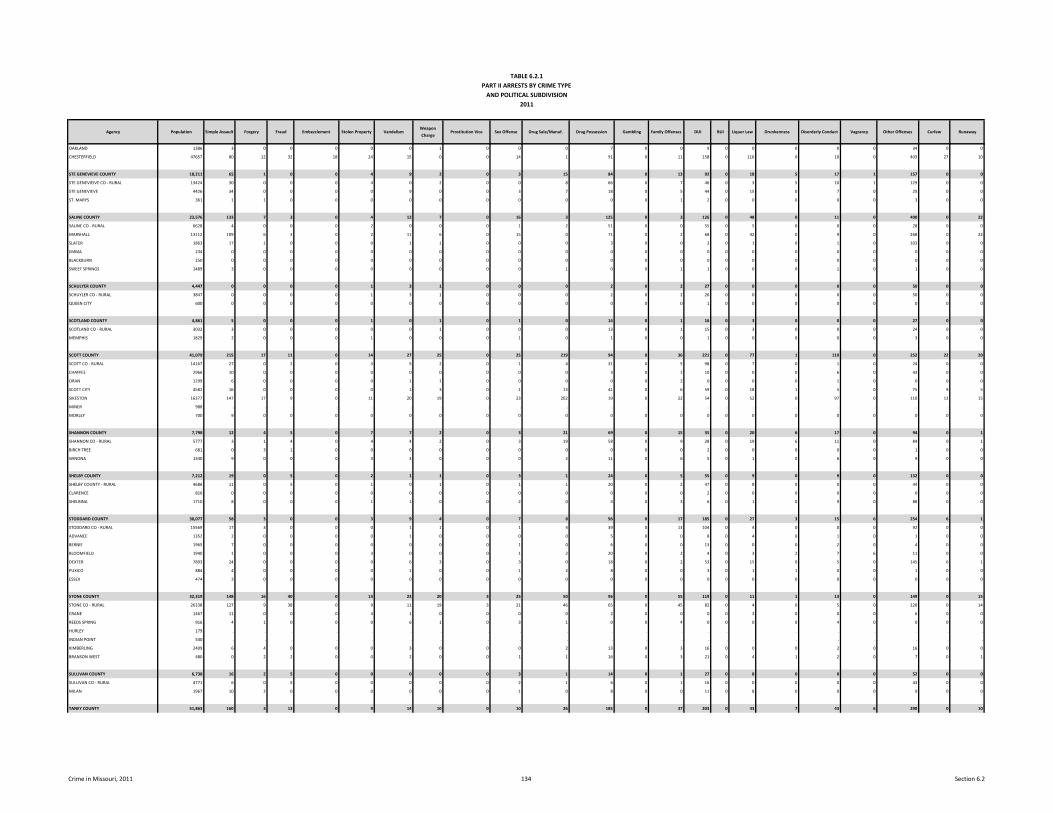
TABLE 6.2.1 PART II ARRESTS BY CRIME TYPE
AND POLITICAL SUBDIVISION2011
Agency Population Simple Assault Forgery Fraud Embezzlement Stolen Property VandalismWeapon
ChargeProstitution Vice Sex Offense Drug Sale/Manuf. Drug Possession Gambling Family Offenses DUI BUI Liquor Law Drunkenness Disorderly Conduct Vagrancy Other Offenses Curfew Runaway
OAKLAND 1386 3 0 0 0 0 0 1 0 0 0 7 0 0 9 0 0 0 0 0 34 0 0
CHESTERFIELD 47657 80 12 32 18 24 15 0 0 14 1 91 0 11 158 0 116 0 10 0 403 27 10
STE GENEVIEVE COUNTY 18,211 65 1 0 0 4 9 2 0 3 15 84 0 13 92 0 18 5 17 1 157 0 0
STE GENEVIEIVE CO - RURAL 13424 30 0 0 0 4 0 2 0 0 8 66 0 7 46 0 3 5 10 1 129 0 0
STE GENEVIEVE 4426 34 0 0 0 0 9 0 0 3 7 18 0 5 44 0 15 0 7 0 25 0 0
ST. MARYS 361 1 1 0 0 0 0 0 0 0 0 0 0 1 2 0 0 0 0 0 3 0 0
SALINE COUNTY 23,576 133 7 3 0 4 12 7 0 16 3 125 0 3 126 0 48 0 11 0 400 0 22
SALINE CO - RURAL 6628 4 0 0 0 2 0 0 0 1 2 51 0 0 55 0 5 0 0 0 28 0 0
MARSHALL 13112 109 6 3 0 2 11 6 0 15 0 71 0 2 68 0 42 0 9 0 268 0 22
SLATER 1863 17 1 0 0 0 1 1 0 0 0 3 0 0 2 0 1 0 1 0 103 0 0
EMMA 234 0 0 0 0 0 0 0 0 0 0 0 0 0 0 0 0 0 0 0 0 0 0
BLACKBURN 250 0 0 0 0 0 0 0 0 0 0 0 0 0 0 0 0 0 0 0 0 0 0
SWEET SPRINGS 1489 3 0 0 0 0 0 0 0 0 1 0 0 1 1 0 0 0 1 0 1 0 0
SCHULYER COUNTY 4,447 0 0 0 0 1 3 1 0 0 0 2 0 2 27 0 0 0 0 0 50 0 0
SCHUYLER CO - RURAL 3847 0 0 0 0 1 3 1 0 0 0 2 0 2 26 0 0 0 0 0 50 0 0
QUEEN CITY 600 0 0 0 0 0 0 0 0 0 0 0 0 0 1 0 0 0 0 0 0 0 0
SCOTLAND COUNTY 4,861 5 0 0 0 1 0 1 0 1 0 14 0 1 16 0 3 0 0 0 27 0 0
SCOTLAND CO - RURAL 3032 3 0 0 0 0 0 1 0 0 0 13 0 1 15 0 3 0 0 0 24 0 0
MEMPHIS 1829 2 0 0 0 1 0 0 0 1 0 1 0 0 1 0 0 0 0 0 3 0 0
SCOTT COUNTY 41,079 215 17 11 0 14 27 25 0 25 219 94 0 36 221 0 77 1 110 0 252 22 20
SCOTT CO - RURAL 14167 27 0 2 0 3 5 2 0 1 4 31 0 5 98 0 7 0 1 0 24 0 0
CHAFFEE 2966 10 0 0 0 0 0 0 0 0 0 3 0 1 10 0 0 0 6 0 43 0 0
ORAN 1299 6 0 0 0 0 1 1 0 0 0 0 0 2 0 0 0 0 1 0 0 0 0
SCOTT CITY 4582 16 0 0 0 0 1 3 0 1 13 41 0 6 59 0 18 1 5 0 75 9 5
SIKESTON 16377 147 17 9 0 11 20 19 0 23 202 19 0 22 54 0 52 0 97 0 110 13 15
MINER 988 . . . . . . . . . . . . . . . . . . . . . .
MORLEY 700 9 0 0 0 0 0 0 0 0 0 0 0 0 0 0 0 0 0 0 0 0 0
SHANNON COUNTY 7,798 12 4 5 0 7 7 2 0 3 21 69 0 15 35 0 20 6 17 0 94 0 1
SHANNON CO - RURAL 5777 3 1 4 0 4 4 2 0 3 19 58 0 9 28 0 19 6 11 0 84 0 1
BIRCH TREE 681 0 3 1 0 0 0 0 0 0 0 0 0 0 2 0 0 0 0 0 1 0 0
WINONA 1340 9 0 0 0 3 3 0 0 0 2 11 0 6 5 0 1 0 6 0 9 0 0
SHELBY COUNTY 7,212 19 0 5 0 2 1 1 0 3 1 24 0 5 55 0 9 0 9 0 132 0 0
SHELBY COUNTY - RURAL 4686 11 0 5 0 1 0 1 0 1 1 20 0 2 47 0 8 0 0 0 44 0 0
CLARENCE 816 0 0 0 0 0 0 0 0 0 0 0 0 0 2 0 0 0 0 0 0 0 0
SHELBINA 1710 8 0 0 0 1 1 0 0 2 0 4 0 3 6 0 1 0 9 0 88 0 0
STODDARD COUNTY 30,077 58 3 0 0 3 9 4 0 7 8 96 0 17 185 0 27 3 15 6 254 6 1
STODDARD CO - RURAL 15569 17 3 0 0 0 1 1 0 1 4 39 0 13 104 0 4 0 0 0 92 0 0
ADVANCE 1352 2 0 0 0 0 1 0 0 0 0 5 0 0 8 0 4 0 1 0 1 0 0
BERNIE 1965 7 0 0 0 0 0 0 0 1 0 6 0 0 13 0 0 0 2 0 4 0 0
BLOOMFIELD 1940 1 0 0 0 3 0 0 0 1 2 20 0 2 4 0 3 2 7 6 11 0 0
DEXTER 7893 24 0 0 0 0 6 3 0 3 0 18 0 2 53 0 15 0 5 0 145 6 1
PUXICO 884 4 0 0 0 0 1 0 0 1 2 8 0 0 3 0 1 1 0 0 1 0 0
ESSEX 474 3 0 0 0 0 0 0 0 0 0 0 0 0 0 0 0 0 0 0 0 0 0
STONE COUNTY 32,319 148 16 40 0 13 23 20 3 25 50 96 0 55 119 0 11 1 13 0 149 0 15
STONE CO - RURAL 26338 127 9 38 0 9 11 19 3 21 46 65 0 45 82 0 4 0 5 0 120 0 14
CRANE 1467 11 0 0 0 4 1 0 0 0 0 2 0 0 0 0 3 0 0 0 6 0 0
REEDS SPRING 916 4 1 0 0 0 6 1 0 3 1 0 0 4 0 0 0 0 4 0 0 0 0
HURLEY 179 . . . . . . . . . . . . . . . . . . . . .
INDIAN POINT 530 . . . . . . . . . . . . . . . . . . . . . .
KIMBERLING 2409 6 4 0 0 0 3 0 0 0 2 13 0 3 16 0 0 0 2 0 16 0 0
BRANSON WEST 480 0 2 2 0 0 2 0 0 1 1 16 0 3 21 0 4 1 2 0 7 0 1
SULLIVAN COUNTY 6,738 16 2 5 0 0 0 0 0 3 1 14 0 1 27 0 8 0 0 0 52 0 0
SULLIVAN CO - RURAL 4771 6 0 5 0 0 0 0 0 2 1 6 0 1 16 0 0 0 0 0 43 0 0
MILAN 1967 10 2 0 0 0 0 0 0 1 0 8 0 0 11 0 8 0 0 0 9 0 0
TANEY COUNTY 51,863 160 3 13 0 9 14 10 0 10 26 185 0 37 203 0 43 7 43 6 290 0 10
Crime in Missouri, 2011 134 Section 6.2
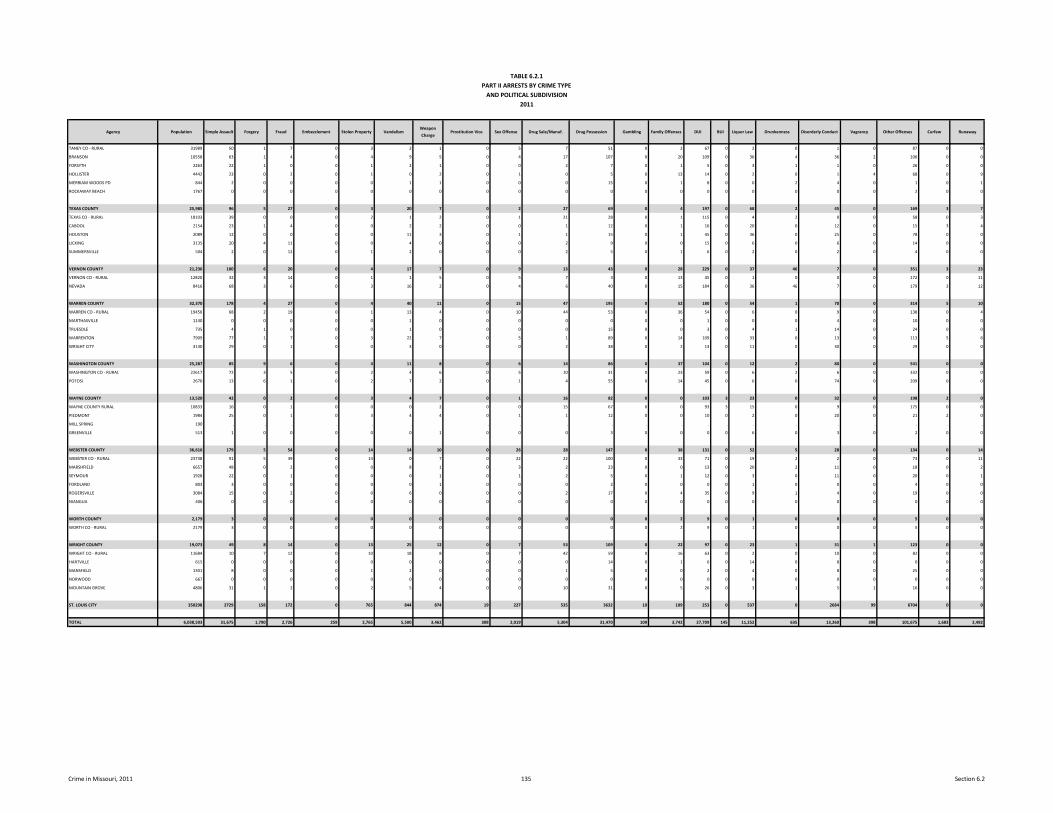
TABLE 6.2.1 PART II ARRESTS BY CRIME TYPE
AND POLITICAL SUBDIVISION2011
Agency Population Simple Assault Forgery Fraud Embezzlement Stolen Property VandalismWeapon
ChargeProstitution Vice Sex Offense Drug Sale/Manuf. Drug Possession Gambling Family Offenses DUI BUI Liquor Law Drunkenness Disorderly Conduct Vagrancy Other Offenses Curfew Runaway
TANEY CO - RURAL 31989 50 1 7 0 3 2 1 0 5 7 51 0 2 67 0 2 0 1 0 87 0 0
BRANSON 10558 63 1 4 0 4 9 5 0 4 17 107 0 20 109 0 36 4 36 2 106 0 0
FORSYTH 2263 22 1 0 0 1 2 1 0 0 2 7 0 1 5 0 3 1 1 0 26 0 0
HOLLISTER 4442 23 0 2 0 1 0 2 0 1 0 5 0 13 14 0 2 0 1 4 68 0 9
MERRIAM WOODS PD 844 2 0 0 0 0 1 1 0 0 0 15 0 1 8 0 0 2 4 0 1 0 1
ROCKAWAY BEACH 1767 0 0 0 0 0 0 0 0 0 0 0 0 0 0 0 0 0 0 0 2 0 0
TEXAS COUNTY 25,985 96 5 27 0 3 20 7 0 2 27 69 0 4 197 0 68 2 45 0 169 3 7
TEXAS CO - RURAL 18103 39 0 0 0 2 1 2 0 1 21 28 0 1 115 0 4 2 0 0 58 0 3
CABOOL 2154 23 1 4 0 0 2 2 0 0 1 12 0 1 16 0 20 0 12 0 15 3 4
HOUSTON 2089 12 0 0 0 0 11 3 0 1 1 15 0 1 45 0 36 0 25 0 78 0 0
LICKING 3135 20 4 11 0 0 4 0 0 0 2 9 0 0 15 0 6 0 6 0 14 0 0
SUMMERSVILLE 504 2 0 12 0 1 2 0 0 0 2 5 0 1 6 0 2 0 2 0 4 0 0
VERNON COUNTY 21,236 100 6 20 0 4 17 7 0 9 13 43 0 28 229 0 37 46 7 0 351 3 23
VERNON CO - RURAL 12820 32 3 14 0 1 1 5 0 5 7 3 0 13 45 0 1 0 0 0 172 0 11
NEVADA 8416 68 3 6 0 3 16 2 0 4 6 40 0 15 184 0 36 46 7 0 179 3 12
WARREN COUNTY 32,370 178 4 27 0 4 40 11 0 15 47 195 0 52 180 0 54 1 70 0 314 5 10
WARREN CO - RURAL 19456 68 2 19 0 1 13 4 0 10 44 53 0 36 54 0 6 0 9 0 138 0 4
MARTHASVILLE 1140 0 0 0 0 0 1 0 0 0 0 0 0 0 1 0 0 0 4 0 10 0 0
TRUESDLE 735 4 1 0 0 0 1 0 0 0 0 15 0 0 3 0 4 1 14 0 24 0 0
WARRENTON 7909 77 1 7 0 3 22 7 0 5 1 89 0 14 109 0 33 0 13 0 113 5 6
WRIGHT CITY 3130 29 0 1 0 0 3 0 0 0 2 38 0 2 13 0 11 0 30 0 29 0 0
WASHINGTON COUNTY 25,287 85 9 6 0 4 11 8 0 6 14 86 0 37 104 0 12 2 80 0 541 0 0
WASHINGTON CO - RURAL 22617 72 3 5 0 2 4 6 0 5 10 31 0 23 59 0 6 2 6 0 332 0 0
POTOSI 2670 13 6 1 0 2 7 2 0 1 4 55 0 14 45 0 6 0 74 0 209 0 0
WAYNE COUNTY 13,520 42 0 2 0 3 4 7 0 1 16 82 0 0 103 3 23 0 32 0 198 2 0
WAYNE COUNTY RURAL 10833 16 0 1 0 0 0 2 0 0 15 67 0 0 93 3 15 0 9 0 175 0 0
PIEDMONT 1984 25 0 1 0 3 4 4 0 1 1 12 0 0 10 0 2 0 20 0 21 2 0
MILL SPRING 190 . . . . . . . . . . . . . . . . . . . . .
GREENVILLE 513 1 0 0 0 0 0 1 0 0 0 3 0 0 0 0 6 0 3 0 2 0 0
WEBSTER COUNTY 36,616 179 5 54 0 14 14 10 0 26 28 147 0 38 131 0 52 5 28 0 134 0 14
WEBSTER CO - RURAL 23738 91 5 49 0 14 0 7 0 22 22 100 0 33 71 0 19 2 2 0 73 0 11
MARSHFIELD 6657 48 0 2 0 0 8 1 0 3 2 23 0 0 13 0 20 2 11 0 18 0 2
SEYMOUR 1928 22 0 1 0 0 0 1 0 1 2 5 0 1 12 0 3 0 11 0 20 0 1
FORDLAND 803 3 0 0 0 0 0 1 0 0 0 2 0 0 0 0 1 0 0 0 4 0 0
ROGERSVILLE 3084 15 0 2 0 0 6 0 0 0 2 17 0 4 35 0 9 1 4 0 19 0 0
NIANGUA 406 0 0 0 0 0 0 0 0 0 0 0 0 0 0 0 0 0 0 0 0 0 0
WORTH COUNTY 2,179 3 0 0 0 0 0 0 0 0 0 0 0 2 9 0 1 0 0 0 5 0 0
WORTH CO - RURAL 2179 3 0 0 0 0 0 0 0 0 0 0 0 2 9 0 1 0 0 0 5 0 0
WRIGHT COUNTY 19,073 49 8 14 0 13 25 12 0 7 53 109 0 22 97 0 23 1 31 1 123 0 0
WRIGHT CO - RURAL 11684 10 7 12 0 10 18 8 0 7 42 59 0 16 63 0 2 0 10 0 82 0 0
HARTVILLE 615 0 0 0 0 0 0 0 0 0 0 14 0 1 6 0 14 0 8 0 0 0 0
MANSFIELD 1301 8 0 0 0 1 2 0 0 0 1 5 0 0 2 0 4 0 8 0 25 0 0
NORWOOD 667 0 0 0 0 0 0 0 0 0 0 0 0 0 0 0 0 0 0 0 0 0 0
MOUNTAIN GROVE 4806 31 1 2 0 2 5 4 0 0 10 31 0 5 26 0 3 1 5 1 16 0 0
ST. LOUIS CITY 350298 2729 158 172 0 765 844 874 19 227 535 3632 10 109 253 0 537 0 2684 99 6704 0 0
TOTAL 6,038,503 31,675 1,790 2,726 259 2,765 5,500 3,462 308 2,019 5,304 31,470 109 3,742 27,709 145 11,252 635 13,260 398 101,675 1,683 2,492
Crime in Missouri, 2011 135 Section 6.2
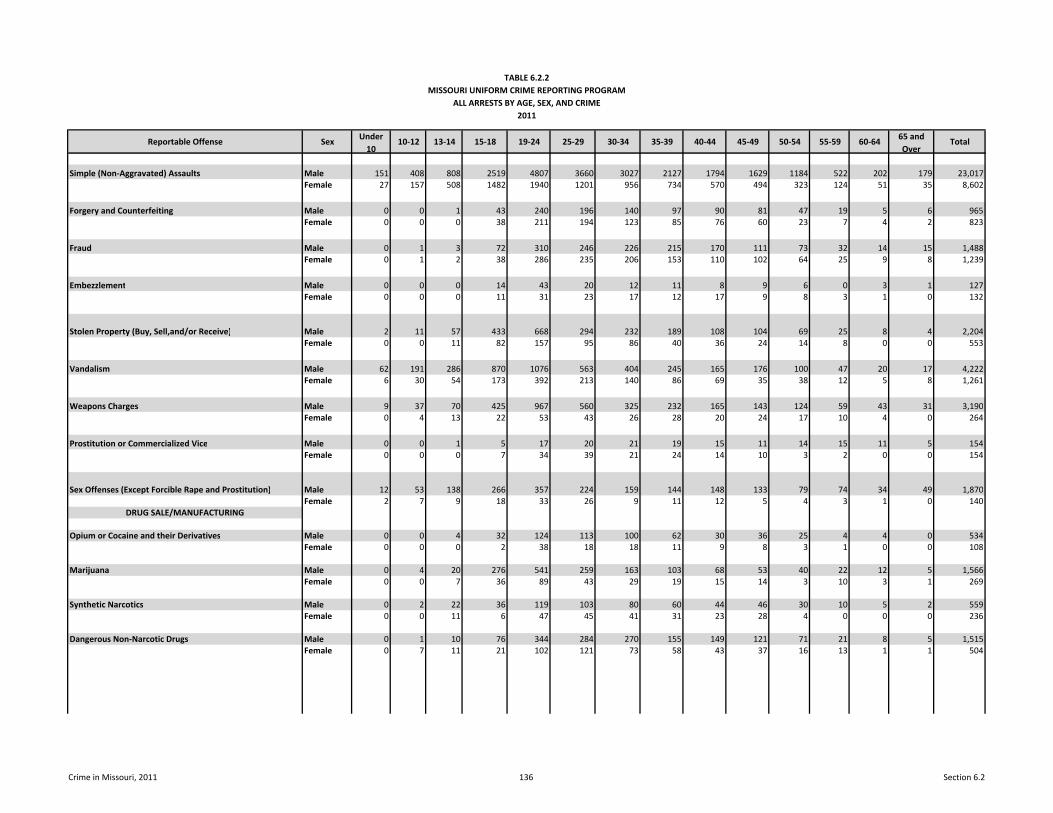
TABLE 6.2.2MISSOURI UNIFORM CRIME REPORTING PROGRAM
ALL ARRESTS BY AGE, SEX, AND CRIME2011
Reportable Offense Sex Under 10
10-12 13-14 15-18 19-24 25-29 30-34 35-39 40-44 45-49 50-54 55-59 60-64 65 and Over
Total
Simple (Non-Aggravated) Assaults Male 151 408 808 2519 4807 3660 3027 2127 1794 1629 1184 522 202 179 23,017Female 27 157 508 1482 1940 1201 956 734 570 494 323 124 51 35 8,602
Forgery and Counterfeiting Male 0 0 1 43 240 196 140 97 90 81 47 19 5 6 965Female 0 0 0 38 211 194 123 85 76 60 23 7 4 2 823
Fraud Male 0 1 3 72 310 246 226 215 170 111 73 32 14 15 1,488Female 0 1 2 38 286 235 206 153 110 102 64 25 9 8 1,239
Embezzlement Male 0 0 0 14 43 20 12 11 8 9 6 0 3 1 127Female 0 0 0 11 31 23 17 12 17 9 8 3 1 0 132
Stolen Property (Buy, Sell,and/or Receive) Male 2 11 57 433 668 294 232 189 108 104 69 25 8 4 2,204Female 0 0 11 82 157 95 86 40 36 24 14 8 0 0 553
Vandalism Male 62 191 286 870 1076 563 404 245 165 176 100 47 20 17 4,222Female 6 30 54 173 392 213 140 86 69 35 38 12 5 8 1,261
Weapons Charges Male 9 37 70 425 967 560 325 232 165 143 124 59 43 31 3,190Female 0 4 13 22 53 43 26 28 20 24 17 10 4 0 264
Prostitution or Commercialized Vice Male 0 0 1 5 17 20 21 19 15 11 14 15 11 5 154Female 0 0 0 7 34 39 21 24 14 10 3 2 0 0 154
Sex Offenses (Except Forcible Rape and Prostitution) Male 12 53 138 266 357 224 159 144 148 133 79 74 34 49 1,870Female 2 7 9 18 33 26 9 11 12 5 4 3 1 0 140
DRUG SALE/MANUFACTURING
Opium or Cocaine and their Derivatives Male 0 0 4 32 124 113 100 62 30 36 25 4 4 0 534Female 0 0 0 2 38 18 18 11 9 8 3 1 0 0 108
Marijuana Male 0 4 20 276 541 259 163 103 68 53 40 22 12 5 1,566Female 0 0 7 36 89 43 29 19 15 14 3 10 3 1 269
Synthetic Narcotics Male 0 2 22 36 119 103 80 60 44 46 30 10 5 2 559Female 0 0 11 6 47 45 41 31 23 28 4 0 0 0 236
Dangerous Non-Narcotic Drugs Male 0 1 10 76 344 284 270 155 149 121 71 21 8 5 1,515Female 0 7 11 21 102 121 73 58 43 37 16 13 1 1 504
Crime in Missouri, 2011 136 Section 6.2
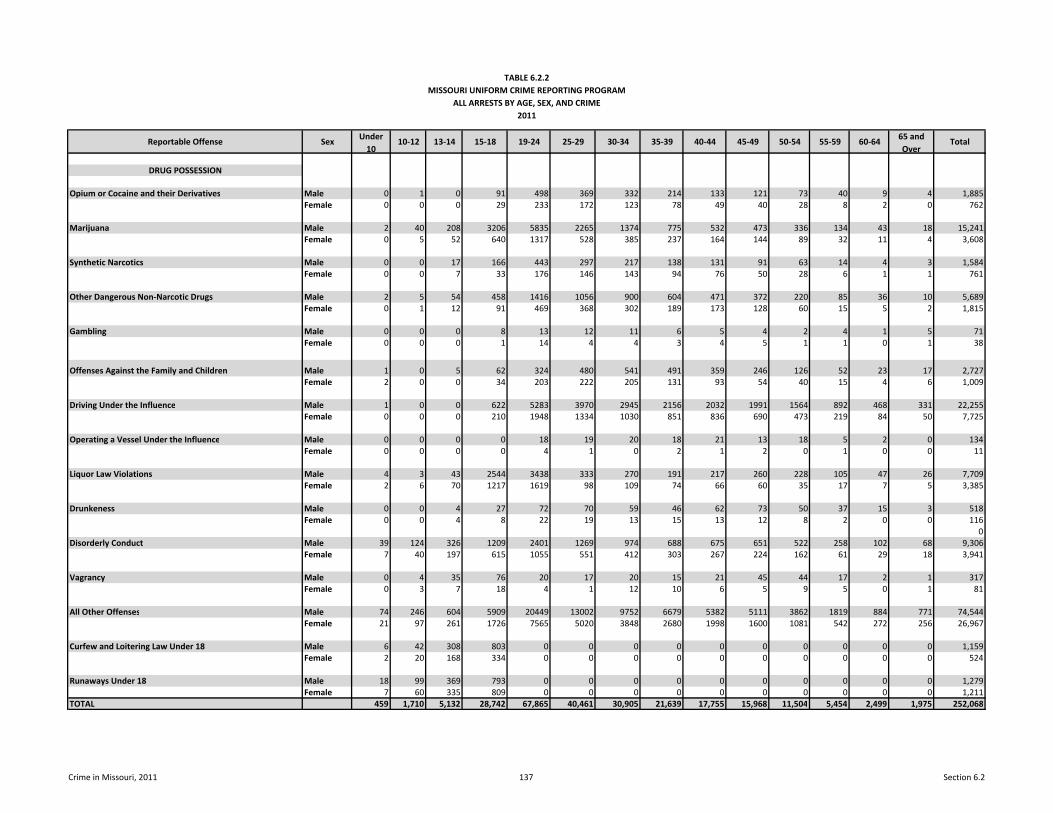
TABLE 6.2.2MISSOURI UNIFORM CRIME REPORTING PROGRAM
ALL ARRESTS BY AGE, SEX, AND CRIME2011
Reportable Offense Sex Under 10
10-12 13-14 15-18 19-24 25-29 30-34 35-39 40-44 45-49 50-54 55-59 60-64 65 and Over
Total
DRUG POSSESSION
Opium or Cocaine and their Derivatives Male 0 1 0 91 498 369 332 214 133 121 73 40 9 4 1,885Female 0 0 0 29 233 172 123 78 49 40 28 8 2 0 762
Marijuana Male 2 40 208 3206 5835 2265 1374 775 532 473 336 134 43 18 15,241Female 0 5 52 640 1317 528 385 237 164 144 89 32 11 4 3,608
Synthetic Narcotics Male 0 0 17 166 443 297 217 138 131 91 63 14 4 3 1,584Female 0 0 7 33 176 146 143 94 76 50 28 6 1 1 761
Other Dangerous Non-Narcotic Drugs Male 2 5 54 458 1416 1056 900 604 471 372 220 85 36 10 5,689Female 0 1 12 91 469 368 302 189 173 128 60 15 5 2 1,815
Gambling Male 0 0 0 8 13 12 11 6 5 4 2 4 1 5 71Female 0 0 0 1 14 4 4 3 4 5 1 1 0 1 38
Offenses Against the Family and Children Male 1 0 5 62 324 480 541 491 359 246 126 52 23 17 2,727Female 2 0 0 34 203 222 205 131 93 54 40 15 4 6 1,009
Driving Under the Influence Male 1 0 0 622 5283 3970 2945 2156 2032 1991 1564 892 468 331 22,255Female 0 0 0 210 1948 1334 1030 851 836 690 473 219 84 50 7,725
Operating a Vessel Under the Influence Male 0 0 0 0 18 19 20 18 21 13 18 5 2 0 134Female 0 0 0 0 4 1 0 2 1 2 0 1 0 0 11
Liquor Law Violations Male 4 3 43 2544 3438 333 270 191 217 260 228 105 47 26 7,709Female 2 6 70 1217 1619 98 109 74 66 60 35 17 7 5 3,385
Drunkeness Male 0 0 4 27 72 70 59 46 62 73 50 37 15 3 518Female 0 0 4 8 22 19 13 15 13 12 8 2 0 0 116
0Disorderly Conduct Male 39 124 326 1209 2401 1269 974 688 675 651 522 258 102 68 9,306
Female 7 40 197 615 1055 551 412 303 267 224 162 61 29 18 3,941
Vagrancy Male 0 4 35 76 20 17 20 15 21 45 44 17 2 1 317Female 0 3 7 18 4 1 12 10 6 5 9 5 0 1 81
All Other Offenses Male 74 246 604 5909 20449 13002 9752 6679 5382 5111 3862 1819 884 771 74,544Female 21 97 261 1726 7565 5020 3848 2680 1998 1600 1081 542 272 256 26,967
Curfew and Loitering Law Under 18 Male 6 42 308 803 0 0 0 0 0 0 0 0 0 0 1,159Female 2 20 168 334 0 0 0 0 0 0 0 0 0 0 524
Runaways Under 18 Male 18 99 369 793 0 0 0 0 0 0 0 0 0 0 1,279Female 7 60 335 809 0 0 0 0 0 0 0 0 0 0 1,211
TOTAL 459 1,710 5,132 28,742 67,865 40,461 30,905 21,639 17,755 15,968 11,504 5,454 2,499 1,975 252,068
Crime in Missouri, 2011 137 Section 6.2
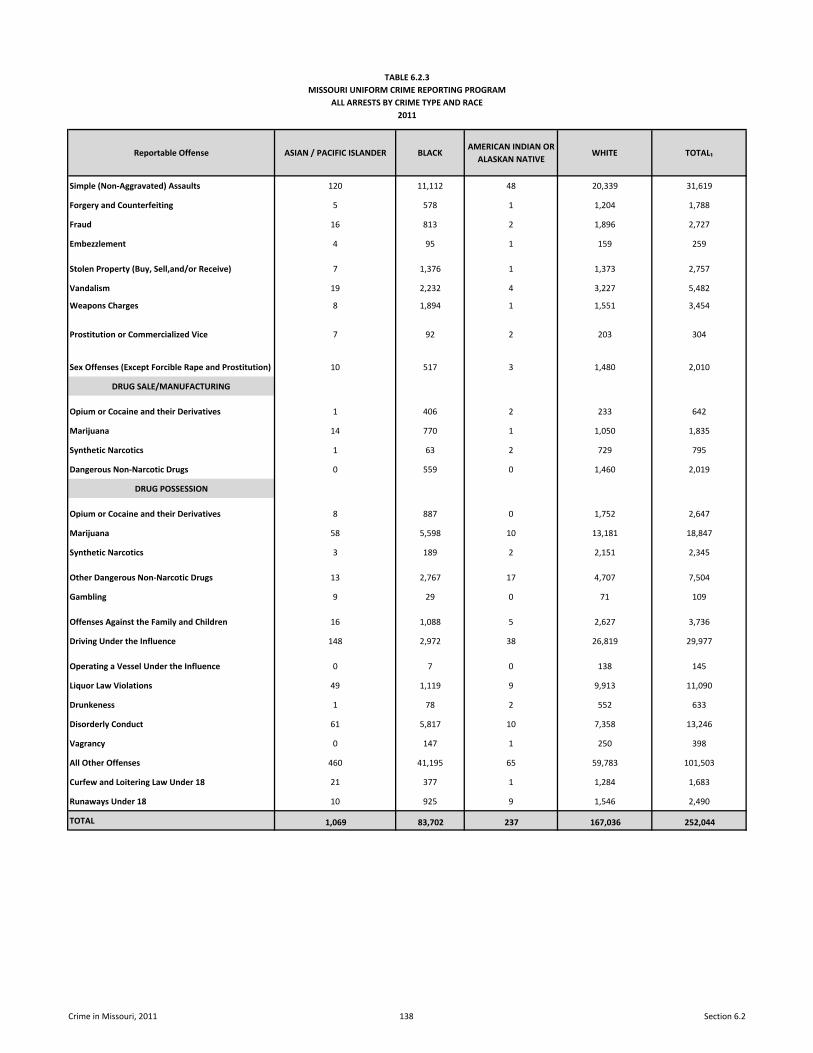
TABLE 6.2.3MISSOURI UNIFORM CRIME REPORTING PROGRAM
ALL ARRESTS BY CRIME TYPE AND RACE2011
Reportable Offense ASIAN / PACIFIC ISLANDER BLACKAMERICAN INDIAN OR
ALASKAN NATIVEWHITE TOTAL₁
Simple (Non-Aggravated) Assaults 120 11,112 48 20,339 31,619
Forgery and Counterfeiting 5 578 1 1,204 1,788
Fraud 16 813 2 1,896 2,727
Embezzlement 4 95 1 159 259
Stolen Property (Buy, Sell,and/or Receive) 7 1,376 1 1,373 2,757
Vandalism 19 2,232 4 3,227 5,482
Weapons Charges 8 1,894 1 1,551 3,454
Prostitution or Commercialized Vice 7 92 2 203 304
Sex Offenses (Except Forcible Rape and Prostitution) 10 517 3 1,480 2,010
DRUG SALE/MANUFACTURING
Opium or Cocaine and their Derivatives 1 406 2 233 642
Marijuana 14 770 1 1,050 1,835
Synthetic Narcotics 1 63 2 729 795
Dangerous Non-Narcotic Drugs 0 559 0 1,460 2,019
DRUG POSSESSION
Opium or Cocaine and their Derivatives 8 887 0 1,752 2,647
Marijuana 58 5,598 10 13,181 18,847
Synthetic Narcotics 3 189 2 2,151 2,345
Other Dangerous Non-Narcotic Drugs 13 2,767 17 4,707 7,504
Gambling 9 29 0 71 109
Offenses Against the Family and Children 16 1,088 5 2,627 3,736
Driving Under the Influence 148 2,972 38 26,819 29,977
Operating a Vessel Under the Influence 0 7 0 138 145
Liquor Law Violations 49 1,119 9 9,913 11,090
Drunkeness 1 78 2 552 633
Disorderly Conduct 61 5,817 10 7,358 13,246
Vagrancy 0 147 1 250 398
All Other Offenses 460 41,195 65 59,783 101,503
Curfew and Loitering Law Under 18 21 377 1 1,284 1,683
Runaways Under 18 10 925 9 1,546 2,490
TOTAL 1,069 83,702 237 167,036 252,044
Crime in Missouri, 2011 138 Section 6.2
139
Crime in Missouri, 2011 Section 7.0
7.0 MISSOURI LAW ENFORCEMENT OFFICERS KILLED
A series of tables and figures are presented related to the
number of sworn law enforcement officers killed in the line of
duty in the state of Missouri. The purpose of these displays
is to provide an appreciation of the extent and nature of this
serious problem and to increase the awareness of the
sacrifice made by the law enforcement community in
protecting the lives, rights, and property of Missouri citizens.

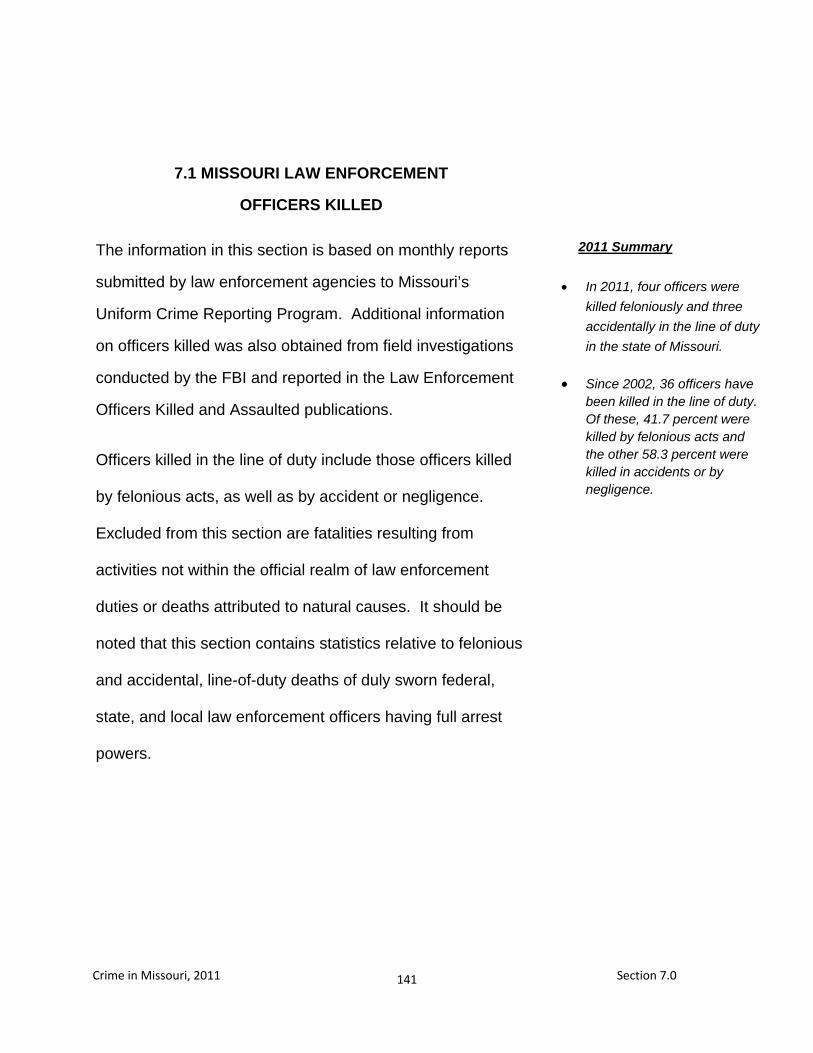
141
Crime in Missouri, 2011 Section 7.0
7.1 MISSOURI LAW ENFORCEMENT
OFFICERS KILLED
The information in this section is based on monthly reports
submitted by law enforcement agencies to Missouri’s
Uniform Crime Reporting Program. Additional information
on officers killed was also obtained from field investigations
conducted by the FBI and reported in the Law Enforcement
Officers Killed and Assaulted publications.
Officers killed in the line of duty include those officers killed
by felonious acts, as well as by accident or negligence.
Excluded from this section are fatalities resulting from
activities not within the official realm of law enforcement
duties or deaths attributed to natural causes. It should be
noted that this section contains statistics relative to felonious
and accidental, line-of-duty deaths of duly sworn federal,
state, and local law enforcement officers having full arrest
powers.
2011 Summary
In 2011, four officers were
killed feloniously and three
accidentally in the line of duty
in the state of Missouri.
Since 2002, 36 officers have
been killed in the line of duty. Of these, 41.7 percent were killed by felonious acts and the other 58.3 percent were killed in accidents or by negligence.
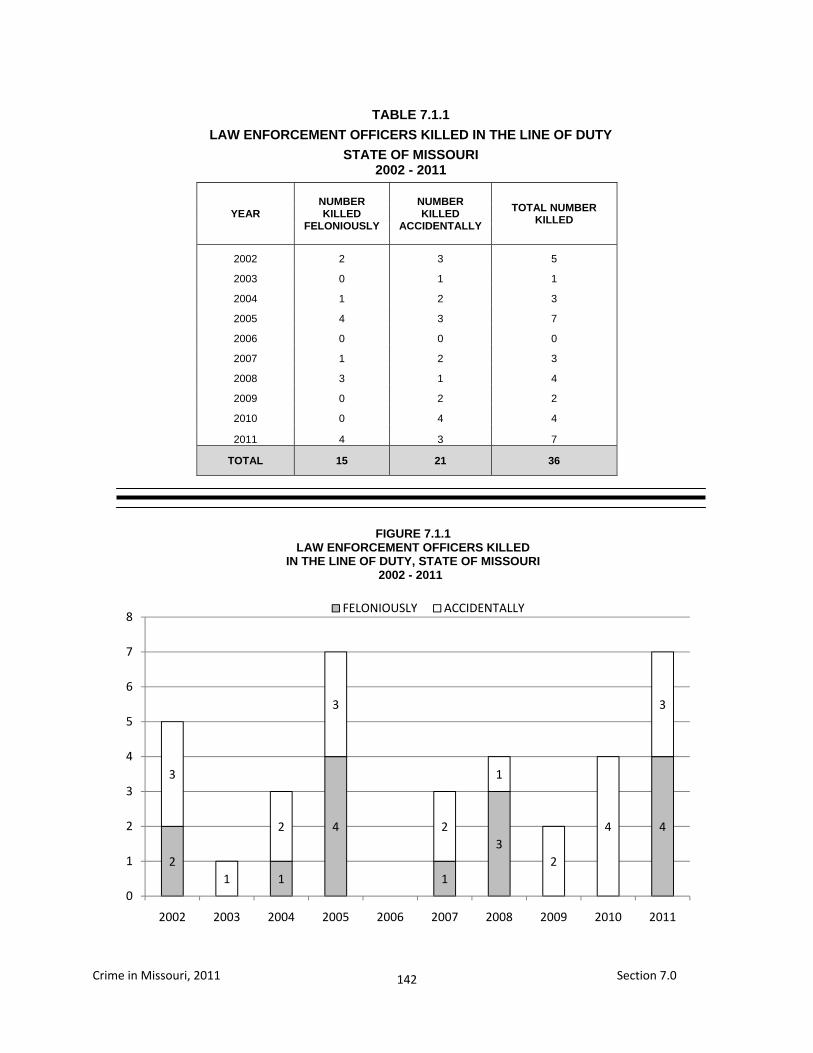
142
Crime in Missouri, 2011 Section 7.0
21
4
1
34
3
1
2
3
2
1
2
4
3
0
1
2
3
4
5
6
7
8
2002 2003 2004 2005 2006 2007 2008 2009 2010 2011
FELONIOUSLY ACCIDENTALLY
YEAR NUMBER KILLED
FELONIOUSLY
NUMBER KILLED
ACCIDENTALLY
TOTAL NUMBER KILLED
2002 2 3 5
2003 0 1 1
2004 1 2 3
2005 4 3 7
2006 0 0 0
2007 1 2 3
2008 3 1 4
2009 0 2 2
2010 0 4 4
2011 4 3 7
TOTAL 15 21 36
TABLE 7.1.1
LAW ENFORCEMENT OFFICERS KILLED IN THE LINE OF DUTY
STATE OF MISSOURI 2002 - 2011
FIGURE 7.1.1LAW ENFORCEMENT OFFICERS KILLED
IN THE LINE OF DUTY, STATE OF MISSOURI
2002 - 2011
143
Crime in Missouri, 2011 Section 8.0
8.0 MISSOURI LAW ENFORCEMENT OFFICERS ASSAULTED
A series of tables and figures are presented on sworn law
enforcement officers assaulted in the line of duty in the State
of Missouri. These displays have been included to provide a
better perspective of the risks law enforcement officers face
in performing their duties and to assist in formulating policies
and procedures which may reduce these risks in the future.

145
Crime in Missouri, 2011 Section 8.0
8.1 MISSOURI LAW ENFORCEMENT OFFICERS ASSAULTED
Data in this section are based on monthly reports of
officer assaults submitted by law enforcement agencies to
Missouri's Uniform Crime Reporting Program. Officer
assaults are defined as any unlawful attack by a person on a
law enforcement officer in the performance of their duty.
Officer assaults include those assaults which result in
serious injury to the officer, all assaults in which the assailant
used a weapon which could have caused serious injury or
death, and assaults on officers beyond mere verbal abuse or
minor resistance to an arrest. Assaults resulting in the death
of a law enforcement officer are not included in this section,
but can be found in Section 7.0 of this report. Assaults
committed on federal law enforcement officers in the state of
Missouri are not included in this section.
2011 SUMMARY ANALYSIS
There were 2,428 officer
assaults reported during 2011.
For every 100 officers in
the state of Missouri, there were16.6 percent assaults in 2011.
Of the 2,428 officer
assaults in 2011, 507 or 20.9 percent resulted in injury to an officer.
One officer was assaulted
in the state every 3.6 hours in 2011. In addition, one assault resulting in the injury of an officer occurred every 17.3 hours.
In 2011, the clearance rate
for officer assaults in the state was 85.5 compared to 79.8 in 2010.
In 2011, 82.0 percent of all
assaults on officers involved physical force and 18.0 percent involved a weapon.
Of all officer assaults in
2011, 50.9 percent occurred from 8:00 p.m. through 3:59 a.m.
The situation resulting in
the greatest number of officer assaults in 2011 was disturbance calls accounting for 29.6 percent of the total.
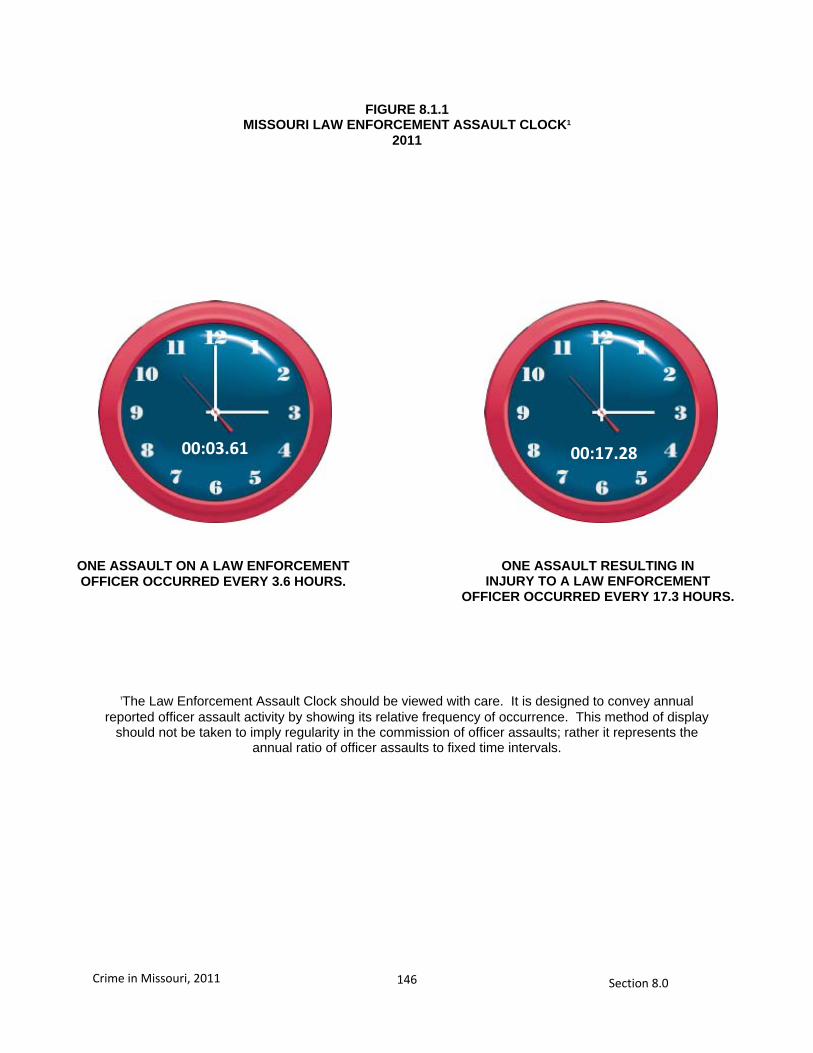
146
Crime in Missouri, 2011 Section 8.0
00:03:70
₁The Law Enforcement Assault Clock should be viewed with care. It is designed to convey annual reported officer assault activity by showing its relative frequency of occurrence. This method of display
should not be taken to imply regularity in the commission of officer assaults; rather it represents the annual ratio of officer assaults to fixed time intervals.
FIGURE 8.1.1 MISSOURI LAW ENFORCEMENT ASSAULT CLOCK1
2011
ONE ASSAULT ON A LAW ENFORCEMENT OFFICER OCCURRED EVERY 3.6 HOURS.
ONE ASSAULT RESULTING IN INJURY TO A LAW ENFORCEMENT
OFFICER OCCURRED EVERY 17.3 HOURS.
00:03.61 00:17.28
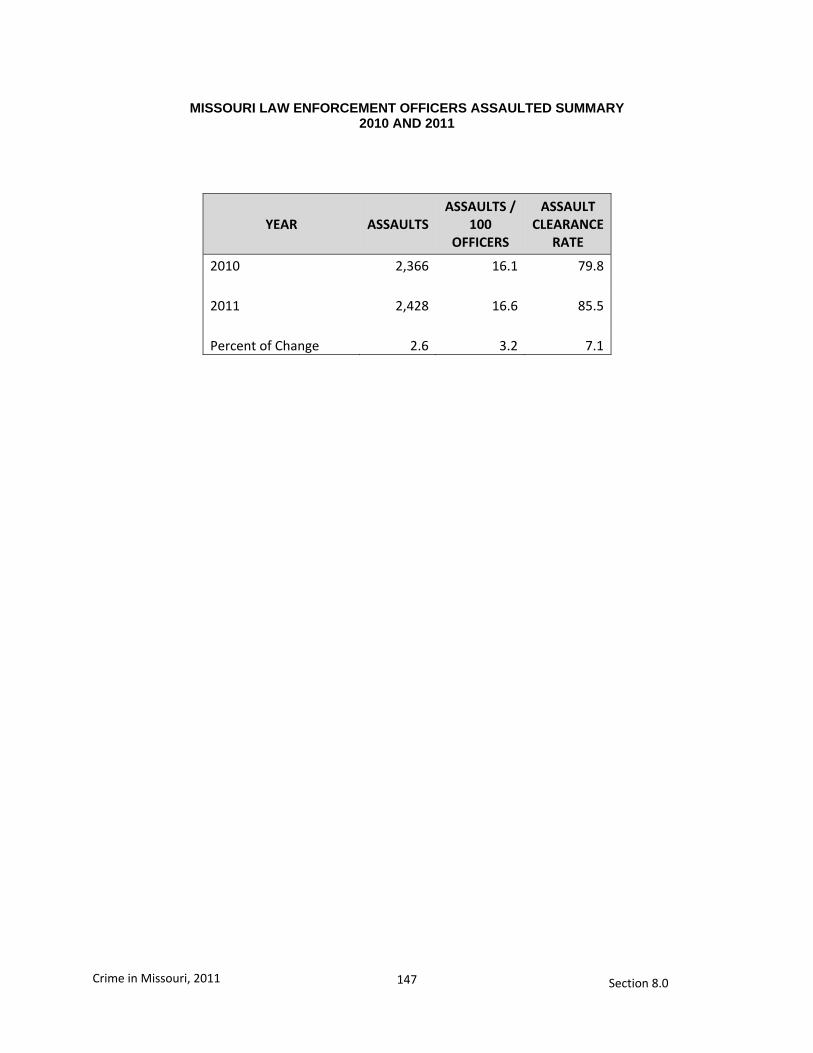
147
Crime in Missouri, 2011 Section 8.0
MISSOURI LAW ENFORCEMENT OFFICERS ASSAULTED SUMMARY 2010 AND 2011
YEAR ASSAULTS ASSAULTS /
100 OFFICERS
ASSAULT CLEARANCE
RATE
2010 2,366 16.1 79.8 2011 2,428 16.6 85.5 Percent of Change 2.6 3.2 7.1
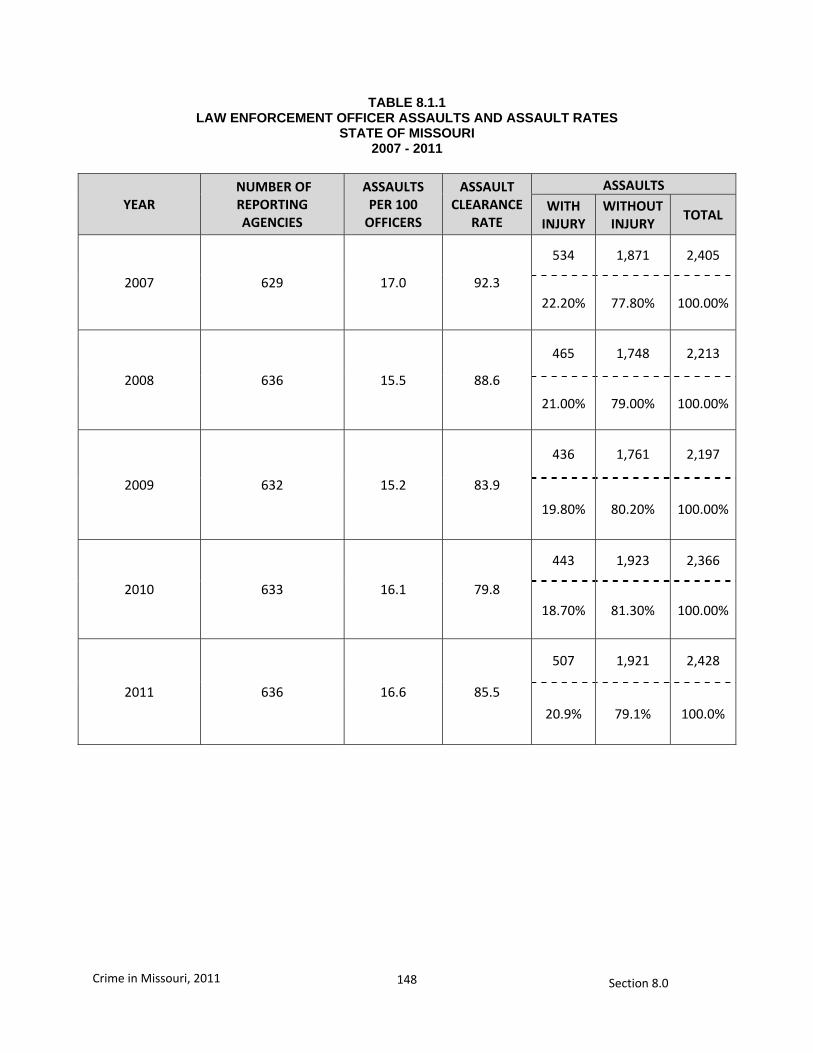
148
Crime in Missouri, 2011 Section 8.0
YEAR NUMBER OF REPORTING AGENCIES
ASSAULTS PER 100
OFFICERS
ASSAULT CLEARANCE
RATE
ASSAULTS WITH
INJURY WITHOUT
INJURY TOTAL
2007 629 17.0 92.3
534 1,871 2,405
22.20% 77.80% 100.00%
2008 636 15.5 88.6
465 1,748 2,213
21.00% 79.00% 100.00%
2009 632 15.2 83.9
436 1,761 2,197
19.80% 80.20% 100.00%
2010 633 16.1 79.8
443 1,923 2,366
18.70% 81.30% 100.00%
2011 636 16.6 85.5
507 1,921 2,428
20.9% 79.1% 100.0%
TABLE 8.1.1 LAW ENFORCEMENT OFFICER ASSAULTS AND ASSAULT RATES
STATE OF MISSOURI 2007 - 2011
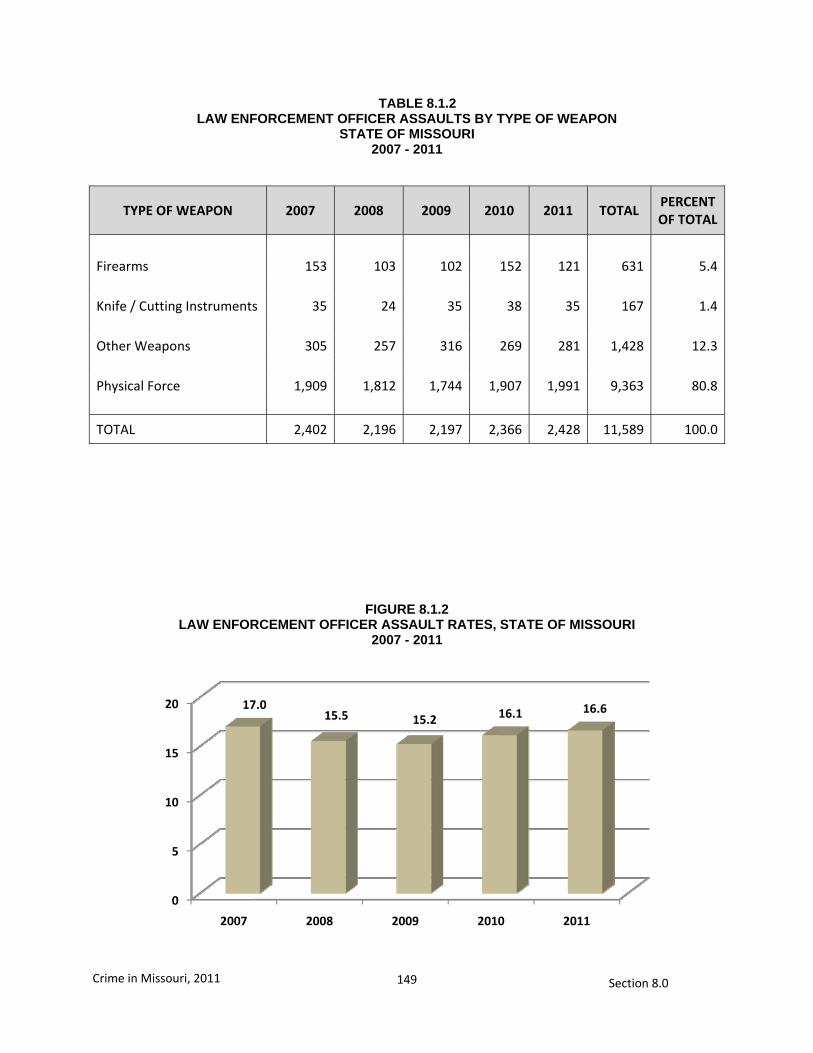
149
Crime in Missouri, 2011 Section 8.0
TABLE 8.1.2 LAW ENFORCEMENT OFFICER ASSAULTS BY TYPE OF WEAPON
STATE OF MISSOURI 2007 - 2011
FIGURE 8.1.2 LAW ENFORCEMENT OFFICER ASSAULT RATES, STATE OF MISSOURI
2007 - 2011
0
5
10
15
20
2007 2008 2009 2010 2011
17.015.5 15.2 16.1 16.6
TYPE OF WEAPON 2007 2008 2009 2010 2011 TOTAL PERCENT OF TOTAL
Firearms 153 103 102 152 121 631 5.4 Knife / Cutting Instruments 35 24 35 38 35 167 1.4 Other Weapons 305 257 316 269 281 1,428 12.3 Physical Force 1,909 1,812 1,744 1,907 1,991 9,363 80.8
TOTAL 2,402 2,196 2,197 2,366 2,428 11,589 100.0
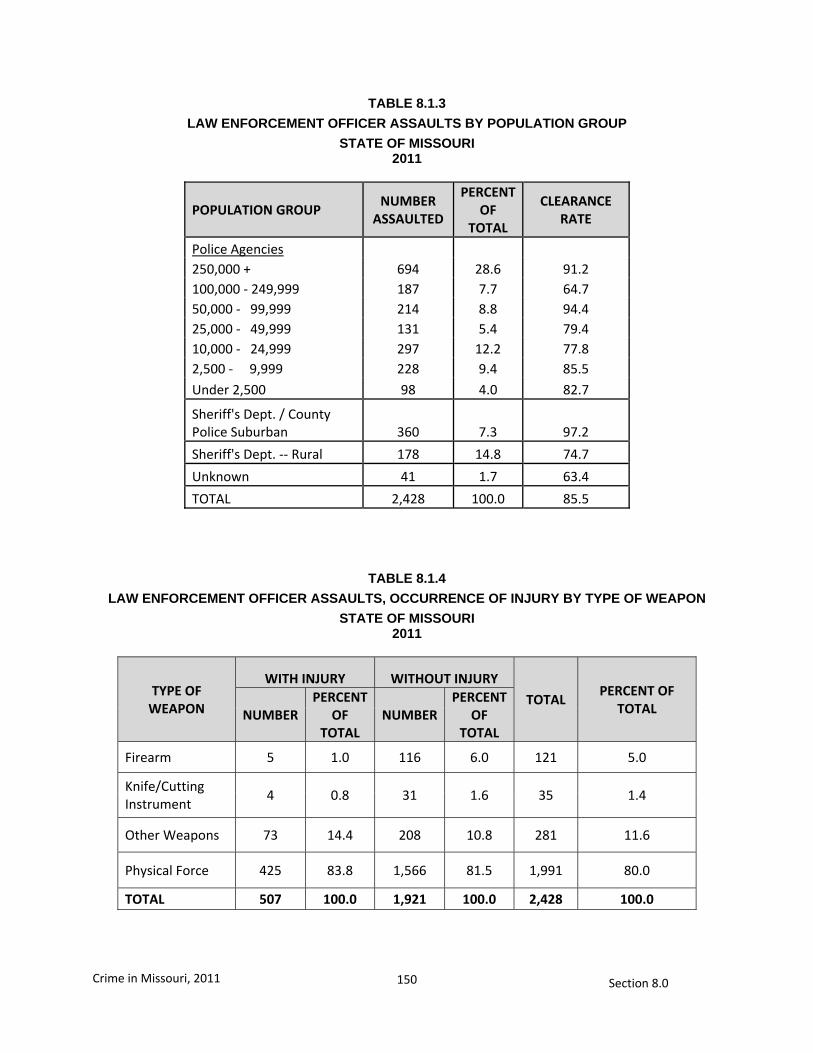
150
Crime in Missouri, 2011 Section 8.0
TABLE 8.1.3
LAW ENFORCEMENT OFFICER ASSAULTS BY POPULATION GROUP
STATE OF MISSOURI 2011
POPULATION GROUP NUMBER
ASSAULTED
PERCENT OF
TOTAL
CLEARANCE RATE
Police Agencies 250,000 + 694 28.6 91.2 100,000 - 249,999 187 7.7 64.7 50,000 - 99,999 214 8.8 94.4 25,000 - 49,999 131 5.4 79.4 10,000 - 24,999 297 12.2 77.8 2,500 - 9,999 228 9.4 85.5 Under 2,500 98 4.0 82.7
Sheriff's Dept. / County Police Suburban 360 7.3 97.2
Sheriff's Dept. -- Rural 178 14.8 74.7
Unknown 41 1.7 63.4
TOTAL 2,428 100.0 85.5
TABLE 8.1.4
LAW ENFORCEMENT OFFICER ASSAULTS, OCCURRENCE OF INJURY BY TYPE OF WEAPON
STATE OF MISSOURI 2011
TYPE OF WEAPON
WITH INJURY WITHOUT INJURY
TOTAL PERCENT OF
TOTAL NUMBER PERCENT
OF TOTAL
NUMBERPERCENT
OF TOTAL
Firearm 5 1.0 116 6.0 121 5.0
Knife/Cutting Instrument
4 0.8 31 1.6 35 1.4
Other Weapons 73 14.4 208 10.8 281 11.6
Physical Force 425 83.8 1,566 81.5 1,991 80.0
TOTAL 507 100.0 1,921 100.0 2,428 100.0
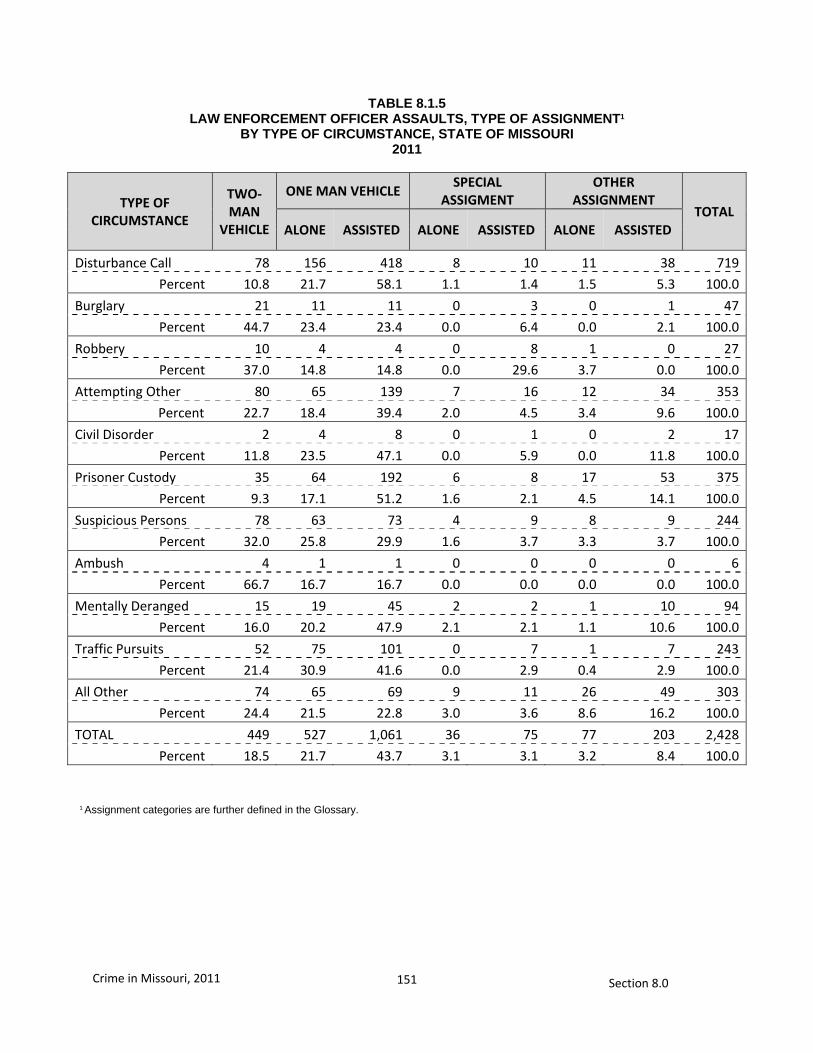
151
Crime in Missouri, 2011 Section 8.0
TABLE 8.1.5 LAW ENFORCEMENT OFFICER ASSAULTS, TYPE OF ASSIGNMENT1
BY TYPE OF CIRCUMSTANCE, STATE OF MISSOURI 2011
TYPE OF CIRCUMSTANCE
TWO-MAN
VEHICLE
ONE MAN VEHICLE SPECIAL
ASSIGMENT OTHER
ASSIGNMENT TOTAL
ALONE ASSISTED ALONE ASSISTED ALONE ASSISTED
Disturbance Call 78 156 418 8 10 11 38 719
Percent 10.8 21.7 58.1 1.1 1.4 1.5 5.3 100.0
Burglary 21 11 11 0 3 0 1 47
Percent 44.7 23.4 23.4 0.0 6.4 0.0 2.1 100.0
Robbery 10 4 4 0 8 1 0 27
Percent 37.0 14.8 14.8 0.0 29.6 3.7 0.0 100.0
Attempting Other 80 65 139 7 16 12 34 353
Percent 22.7 18.4 39.4 2.0 4.5 3.4 9.6 100.0
Civil Disorder 2 4 8 0 1 0 2 17
Percent 11.8 23.5 47.1 0.0 5.9 0.0 11.8 100.0
Prisoner Custody 35 64 192 6 8 17 53 375
Percent 9.3 17.1 51.2 1.6 2.1 4.5 14.1 100.0
Suspicious Persons 78 63 73 4 9 8 9 244
Percent 32.0 25.8 29.9 1.6 3.7 3.3 3.7 100.0
Ambush 4 1 1 0 0 0 0 6
Percent 66.7 16.7 16.7 0.0 0.0 0.0 0.0 100.0
Mentally Deranged 15 19 45 2 2 1 10 94
Percent 16.0 20.2 47.9 2.1 2.1 1.1 10.6 100.0
Traffic Pursuits 52 75 101 0 7 1 7 243
Percent 21.4 30.9 41.6 0.0 2.9 0.4 2.9 100.0
All Other 74 65 69 9 11 26 49 303
Percent 24.4 21.5 22.8 3.0 3.6 8.6 16.2 100.0
TOTAL 449 527 1,061 36 75 77 203 2,428
Percent 18.5 21.7 43.7 3.1 3.1 3.2 8.4 100.0
1 Assignment categories are further defined in the Glossary.
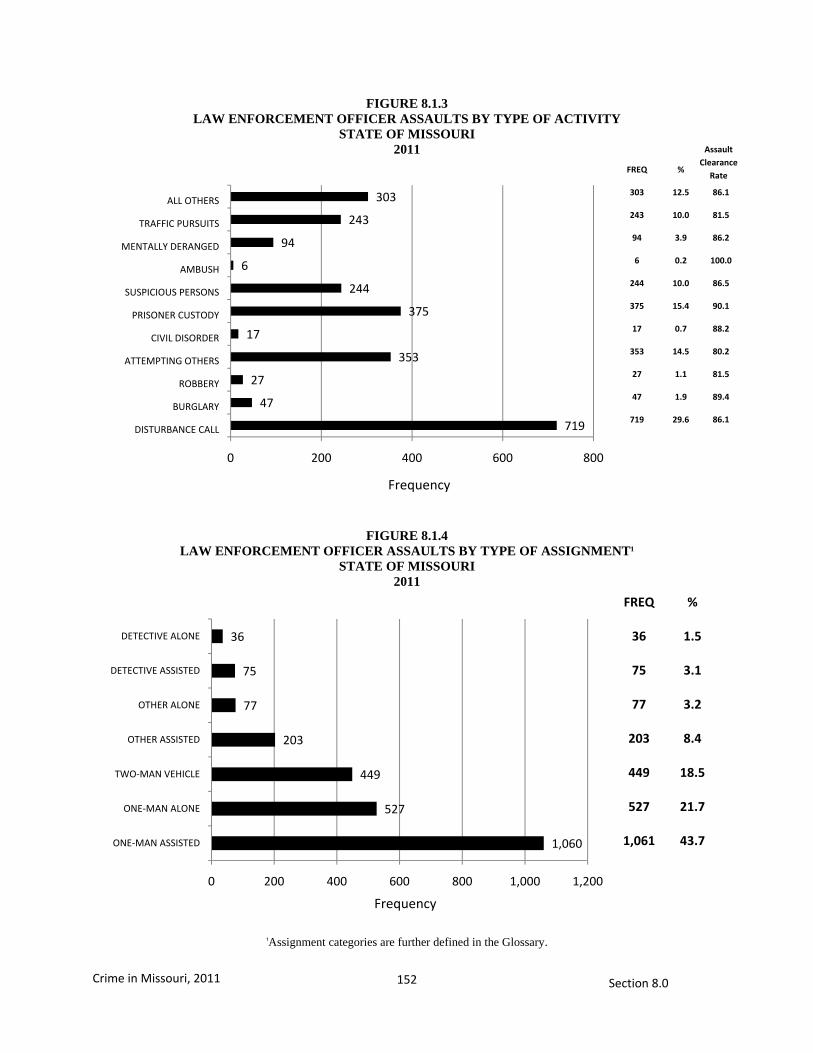
152
Crime in Missouri, 2011 Section 8.0
FIGURE 8.1.3 LAW ENFORCEMENT OFFICER ASSAULTS BY TYPE OF ACTIVITY
STATE OF MISSOURI 2011
FIGURE 8.1.4 LAW ENFORCEMENT OFFICER ASSAULTS BY TYPE OF ASSIGNMENT1
STATE OF MISSOURI 2011
₁Assignment categories are further defined in the Glossary.
719
47
27
353
17
375
244
6
94
243
303
0 200 400 600 800
DISTURBANCE CALL
BURGLARY
ROBBERY
ATTEMPTING OTHERS
CIVIL DISORDER
PRISONER CUSTODY
SUSPICIOUS PERSONS
AMBUSH
MENTALLY DERANGED
TRAFFIC PURSUITS
ALL OTHERS
1,060
527
449
203
77
75
36
0 200 400 600 800 1,000 1,200
ONE-MAN ASSISTED
ONE-MAN ALONE
TWO-MAN VEHICLE
OTHER ASSISTED
OTHER ALONE
DETECTIVE ASSISTED
DETECTIVE ALONE
Frequency
FREQ
303
243
94
6
244
375
17
353
27
47
719
%
12.5
10.0
3.9
0.2
10.0
15.4
0.7
14.5
1.1
1.9
29.6
86.1
81.5
86.2
100.0
86.5
90.1
88.2
80.2
81.5
89.4
86.1
Assault Clearance
Rate
FREQ
36
75
77
203
449
527
1,061
%
1.5
3.1
3.2
8.4
18.5
21.7
43.7
Frequency
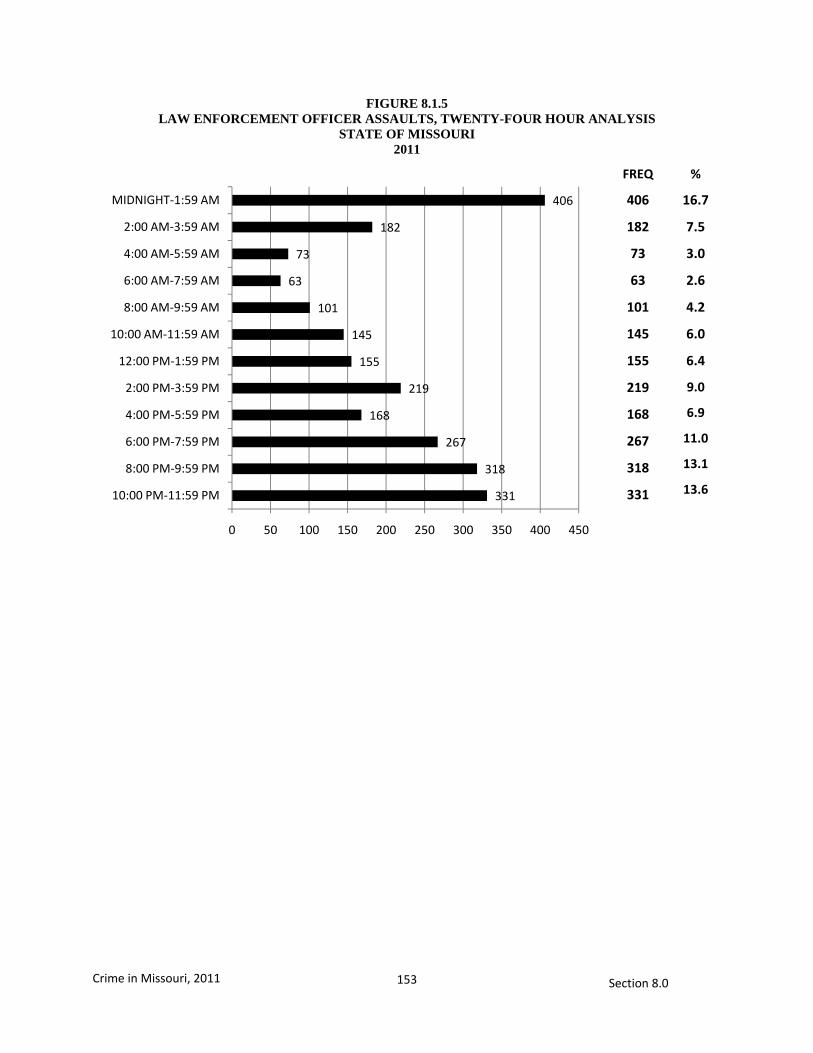
153
Crime in Missouri, 2011 Section 8.0
FIGURE 8.1.5 LAW ENFORCEMENT OFFICER ASSAULTS, TWENTY-FOUR HOUR ANALYSIS
STATE OF MISSOURI 2011
331
318
267
168
219
155
145
101
63
73
182
406
0 50 100 150 200 250 300 350 400 450
10:00 PM-11:59 PM
8:00 PM-9:59 PM
6:00 PM-7:59 PM
4:00 PM-5:59 PM
2:00 PM-3:59 PM
12:00 PM-1:59 PM
10:00 AM-11:59 AM
8:00 AM-9:59 AM
6:00 AM-7:59 AM
4:00 AM-5:59 AM
2:00 AM-3:59 AM
MIDNIGHT-1:59 AM
FREQ
406
182
73
63
101
145
155
219
168
267
318
331
%
16.7
7.5
3.0
2.6
4.2
6.0
6.4
9.0
6.9
11.0
13.1
13.6

155
Crime in Missouri, 2011 Section 9.0
9.0 MISSOURI LAW ENFORCEMENT EMPLOYMENT
A series of tables presents data on law enforcement
personnel resources in the state of Missouri. The purpose of
these displays is to provide an assessment of the amount
and general composition of law enforcement resources
available in the state.

157
Crime in Missouri, 2011 Section 9.0
9.1 MISSOURI LAW ENFORCEMENT
EMPLOYMENT
Data in this section are drawn from annual reports on
employment submitted by law enforcement agencies to
Missouri’s UCR Program. Employment figures include full-
time sworn officers with full arrest powers, and civilian
employees an agency has on its payroll as of October 31 of
each year. They do not include part-time or auxiliary
officers. This section does not include employment data for
federal law enforcement agencies whose jurisdictional
responsibilities encompass the state of Missouri.
2011 Summary
Of the 20,363 full-time employees of Missouri law enforcement agencies, 71.8 percent were sworn officers and 28.2 percent were civilians.
63.7% of the full-time
officers work for municipal police departments, 24.0% work for county sheriff departments, 10.5% work for state agencies, and 1.8% work for colleges /universities police departments.
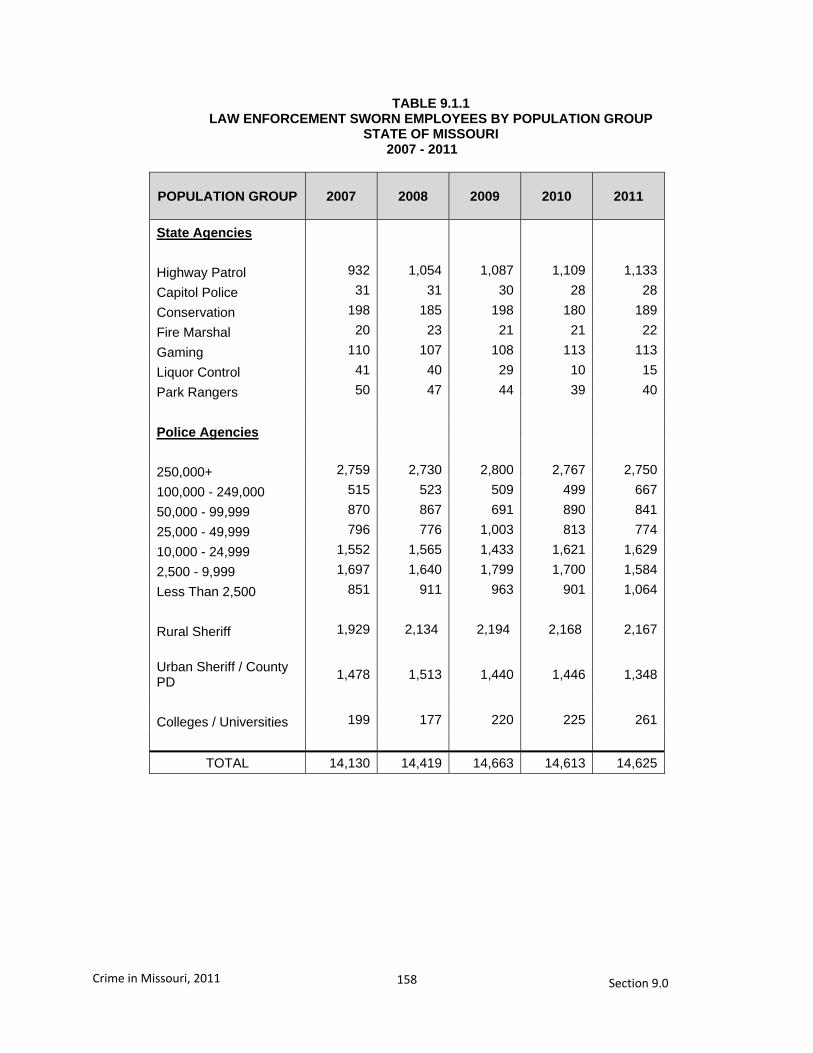
158
Crime in Missouri, 2011 Section 9.0
TABLE 9.1.1 LAW ENFORCEMENT SWORN EMPLOYEES BY POPULATION GROUP
STATE OF MISSOURI 2007 - 2011
POPULATION GROUP 2007 2008 2009 2010 2011
State Agencies
Highway Patrol 932 1,054 1,087 1,109 1,133
Capitol Police 31 31 30 28 28
Conservation 198 185 198 180 189
Fire Marshal 20 23 21 21 22
Gaming 110 107 108 113 113
Liquor Control 41 40 29 10 15
Park Rangers 50 47 44 39 40
Police Agencies
250,000+ 2,759 2,730 2,800 2,767 2,750
100,000 - 249,000 515 523 509 499 667
50,000 - 99,999 870 867 691 890 841
25,000 - 49,999 796 776 1,003 813 774
10,000 - 24,999 1,552 1,565 1,433 1,621 1,629
2,500 - 9,999 1,697 1,640 1,799 1,700 1,584
Less Than 2,500 851 911 963 901 1,064
Rural Sheriff 1,929 2,134 2,194 2,168 2,167
Urban Sheriff / County PD
1,478 1,513 1,440 1,446 1,348
Colleges / Universities 199 177 220 225 261
TOTAL 14,130 14,419 14,663 14,613 14,625
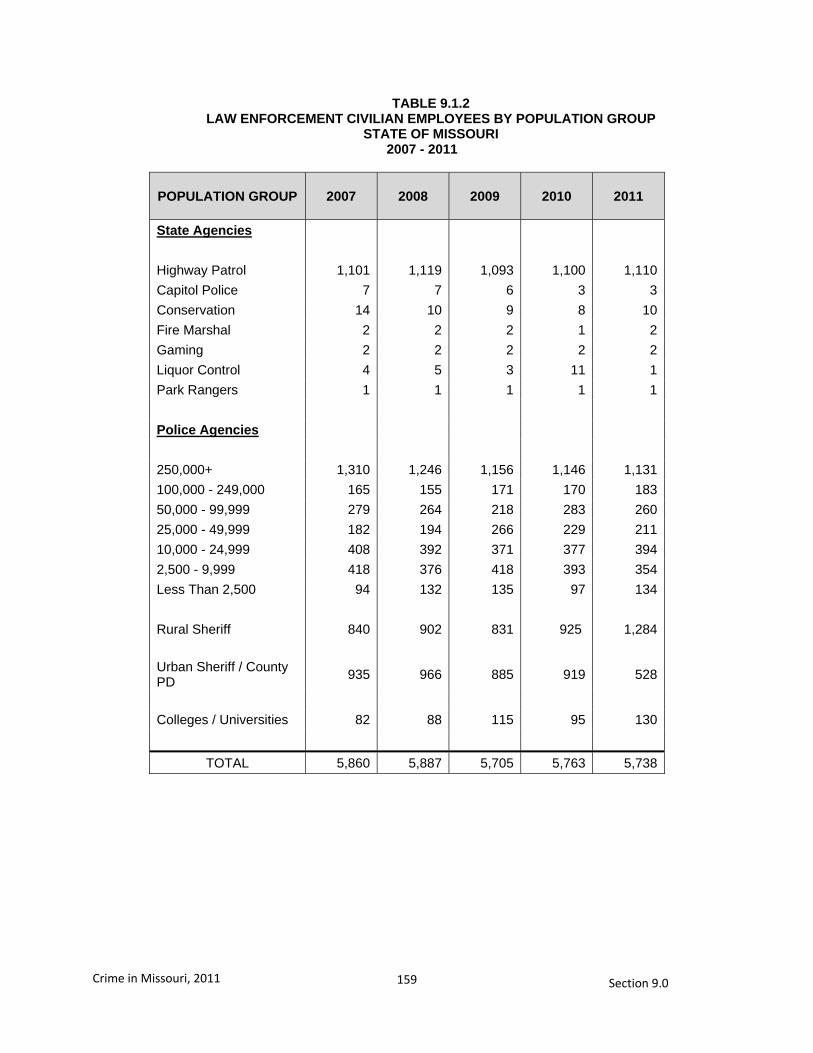
159
Crime in Missouri, 2011 Section 9.0
TABLE 9.1.2 LAW ENFORCEMENT CIVILIAN EMPLOYEES BY POPULATION GROUP
STATE OF MISSOURI 2007 - 2011
POPULATION GROUP 2007 2008 2009 2010 2011
State Agencies
Highway Patrol 1,101 1,119 1,093 1,100 1,110
Capitol Police 7 7 6 3 3
Conservation 14 10 9 8 10
Fire Marshal 2 2 2 1 2
Gaming 2 2 2 2 2
Liquor Control 4 5 3 11 1
Park Rangers 1 1 1 1 1
Police Agencies
250,000+ 1,310 1,246 1,156 1,146 1,131
100,000 - 249,000 165 155 171 170 183
50,000 - 99,999 279 264 218 283 260
25,000 - 49,999 182 194 266 229 211
10,000 - 24,999 408 392 371 377 394
2,500 - 9,999 418 376 418 393 354
Less Than 2,500 94 132 135 97 134
Rural Sheriff 840 902 831 925 1,284
Urban Sheriff / County PD
935 966 885 919 528
Colleges / Universities 82 88 115 95 130
TOTAL 5,860 5,887 5,705 5,763 5,738
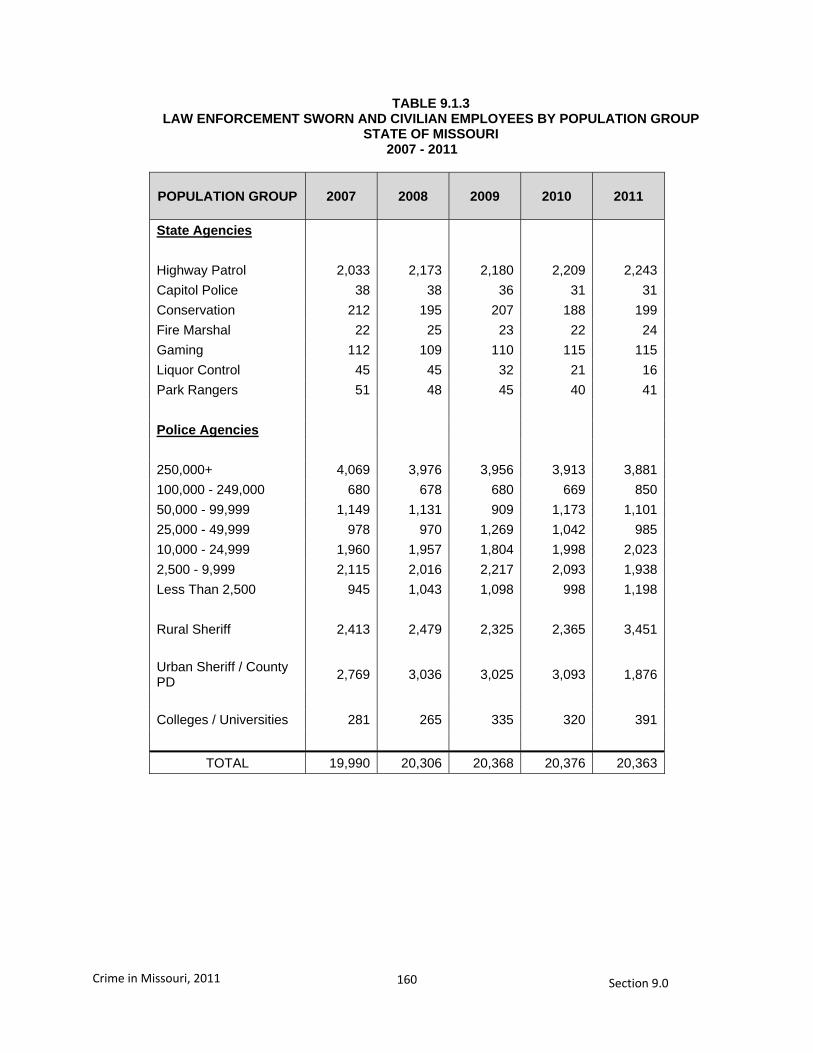
160
Crime in Missouri, 2011 Section 9.0
TABLE 9.1.3 LAW ENFORCEMENT SWORN AND CIVILIAN EMPLOYEES BY POPULATION GROUP
STATE OF MISSOURI 2007 - 2011
POPULATION GROUP 2007 2008 2009 2010 2011
State Agencies
Highway Patrol 2,033 2,173 2,180 2,209 2,243
Capitol Police 38 38 36 31 31
Conservation 212 195 207 188 199
Fire Marshal 22 25 23 22 24
Gaming 112 109 110 115 115
Liquor Control 45 45 32 21 16
Park Rangers 51 48 45 40 41
Police Agencies
250,000+ 4,069 3,976 3,956 3,913 3,881
100,000 - 249,000 680 678 680 669 850
50,000 - 99,999 1,149 1,131 909 1,173 1,101
25,000 - 49,999 978 970 1,269 1,042 985
10,000 - 24,999 1,960 1,957 1,804 1,998 2,023
2,500 - 9,999 2,115 2,016 2,217 2,093 1,938
Less Than 2,500 945 1,043 1,098 998 1,198
Rural Sheriff 2,413 2,479 2,325 2,365 3,451
Urban Sheriff / County PD
2,769 3,036 3,025 3,093 1,876
Colleges / Universities 281 265 335 320 391
TOTAL 19,990 20,306 20,368 20,376 20,363
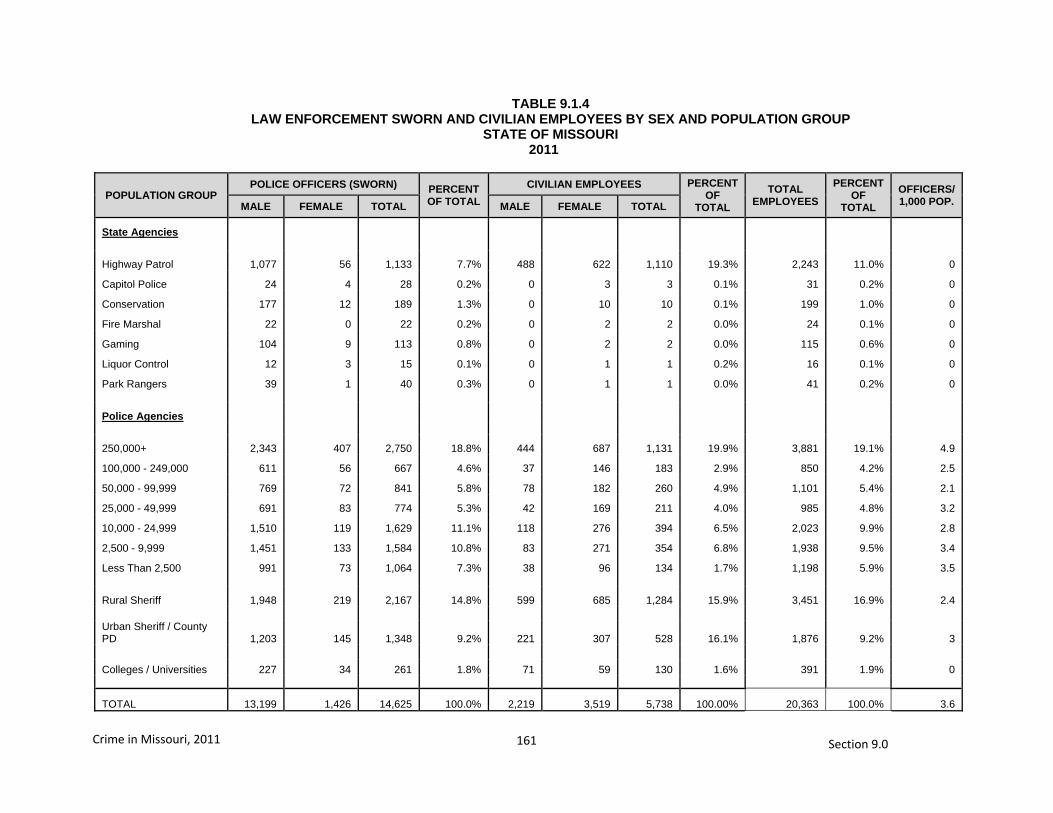
161
Crime in Missouri, 2011 Section 9.0
TABLE 9.1.4 LAW ENFORCEMENT SWORN AND CIVILIAN EMPLOYEES BY SEX AND POPULATION GROUP
STATE OF MISSOURI 2011
POPULATION GROUP POLICE OFFICERS (SWORN) PERCENT
OF TOTAL
CIVILIAN EMPLOYEES PERCENT OF
TOTAL
TOTAL EMPLOYEES
PERCENT OF
TOTAL
OFFICERS/ 1,000 POP. MALE FEMALE TOTAL MALE FEMALE TOTAL
State Agencies
Highway Patrol 1,077 56 1,133 7.7% 488 622 1,110 19.3% 2,243 11.0% 0
Capitol Police 24 4 28 0.2% 0 3 3 0.1% 31 0.2% 0
Conservation 177 12 189 1.3% 0 10 10 0.1% 199 1.0% 0
Fire Marshal 22 0 22 0.2% 0 2 2 0.0% 24 0.1% 0
Gaming 104 9 113 0.8% 0 2 2 0.0% 115 0.6% 0
Liquor Control 12 3 15 0.1% 0 1 1 0.2% 16 0.1% 0
Park Rangers 39 1 40 0.3% 0 1 1 0.0% 41 0.2% 0
Police Agencies
250,000+ 2,343 407 2,750 18.8% 444 687 1,131 19.9% 3,881 19.1% 4.9
100,000 - 249,000 611 56 667 4.6% 37 146 183 2.9% 850 4.2% 2.5
50,000 - 99,999 769 72 841 5.8% 78 182 260 4.9% 1,101 5.4% 2.1
25,000 - 49,999 691 83 774 5.3% 42 169 211 4.0% 985 4.8% 3.2
10,000 - 24,999 1,510 119 1,629 11.1% 118 276 394 6.5% 2,023 9.9% 2.8
2,500 - 9,999 1,451 133 1,584 10.8% 83 271 354 6.8% 1,938 9.5% 3.4
Less Than 2,500 991 73 1,064 7.3% 38 96 134 1.7% 1,198 5.9% 3.5
Rural Sheriff 1,948 219 2,167 14.8% 599 685 1,284 15.9% 3,451 16.9% 2.4 Urban Sheriff / County PD 1,203 145 1,348 9.2% 221 307 528 16.1% 1,876 9.2% 3
Colleges / Universities 227 34 261 1.8% 71 59 130 1.6% 391 1.9% 0
TOTAL 13,199 1,426 14,625 100.0% 2,219 3,519 5,738 100.00% 20,363 100.0% 3.6

163
Crime in Missouri, 2011 Section 10.0
10.0 MISSOURI LAW ENFORCEMENT AGENCY
EMPLOYMENT / ASSAULT ANALYSIS
A series of tables summarizes the number of law
enforcement employees, as well as assaults on sworn
personnel associated with law enforcement jurisdictions
reporting to Missouri’s Uniform Crime Reporting Program.
Data displays provide an overview of law enforcement
personnel resources and the problem of officer assaults
within Missouri communitie

165
Crime in Missouri, 2011 Section 10.0
10.1 MISSOURI LAW ENFORCEMENT AGENCY
EMPLOYMENT / ASSAULT ANALYSIS
Officer assaults are defined as the unlawful attack by a
person on a law enforcement officer in the performance of
their duty. Officer assaults include those which result in
serious injury to the sworn officer, all assaults in which the
assailant used a weapon which could have caused serious
injury or death, and assaults on officers beyond mere verbal
abuse or minor resistance to an arrest. Assaults resulting in
the death of a law enforcement officer are not included, but
can be found in Section 8.0 of this report.
Employment information reflects a count of full-time sworn
officers with full arrest powers and civilian employees the
agency has on its payroll as of October 31 of each reporting
year. It does not include part-time employees or auxiliary
officers.
Population figures in this section are estimates based on the
last census taken by the U.S. Census Bureau and represent
the population associated with the reporting agency's
jurisdiction. For rural counties, the figures represent the
jurisdiction normally covered by sheriff's departments and/or
county police departments. These population figures are
computed by subtracting the population of all incorporated
municipalities within a county having their own law
enforcement agencies from the total population of the
county.
2011 Summary
Law enforcement agencies reported 20,376 persons employed on a full-time basis in 2011.
In 2011, there were
14,613 full-time officers in Missouri.
There were 2.6 sworn
officers per 1,000 population in the State in 2011.

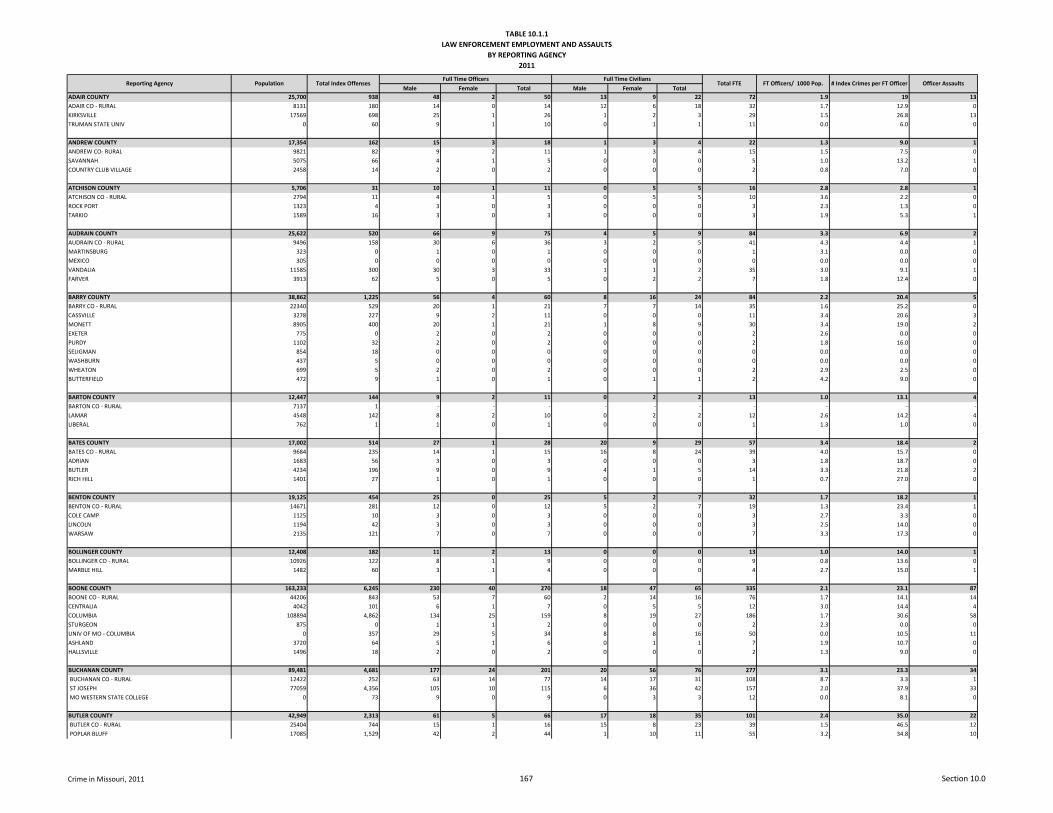
TABLE 10.1.1LAW ENFORCEMENT EMPLOYMENT AND ASSAULTS
BY REPORTING AGENCY2011
Male Female Total Male Female TotalADAIR COUNTY 25,700 938 48 2 50 13 9 22 72 1.9 19 13ADAIR CO - RURAL 8131 180 14 0 14 12 6 18 32 1.7 12.9 0KIRKSVILLE 17569 698 25 1 26 1 2 3 29 1.5 26.8 13TRUMAN STATE UNIV 0 60 9 1 10 0 1 1 11 0.0 6.0 0
ANDREW COUNTY 17,354 162 15 3 18 1 3 4 22 1.3 9.0 1ANDREW CO- RURAL 9821 82 9 2 11 1 3 4 15 1.5 7.5 0SAVANNAH 5075 66 4 1 5 0 0 0 5 1.0 13.2 1COUNTRY CLUB VILLAGE 2458 14 2 0 2 0 0 0 2 0.8 7.0 0
ATCHISON COUNTY 5,706 31 10 1 11 0 5 5 16 2.8 2.8 1ATCHISON CO - RURAL 2794 11 4 1 5 0 5 5 10 3.6 2.2 0ROCK PORT 1323 4 3 0 3 0 0 0 3 2.3 1.3 0TARKIO 1589 16 3 0 3 0 0 0 3 1.9 5.3 1
AUDRAIN COUNTY 25,622 520 66 9 75 4 5 9 84 3.3 6.9 2AUDRAIN CO - RURAL 9496 158 30 6 36 3 2 5 41 4.3 4.4 1MARTINSBURG 323 0 1 0 1 0 0 0 1 3.1 0.0 0MEXICO 305 0 0 0 0 0 0 0 0 0.0 0.0 0VANDALIA 11585 300 30 3 33 1 1 2 35 3.0 9.1 1FARVER 3913 62 5 0 5 0 2 2 7 1.8 12.4 0
BARRY COUNTY 38,862 1,225 56 4 60 8 16 24 84 2.2 20.4 5BARRY CO - RURAL 22340 529 20 1 21 7 7 14 35 1.6 25.2 0CASSVILLE 3278 227 9 2 11 0 0 0 11 3.4 20.6 3MONETT 8905 400 20 1 21 1 8 9 30 3.4 19.0 2EXETER 775 0 2 0 2 0 0 0 2 2.6 0.0 0PURDY 1102 32 2 0 2 0 0 0 2 1.8 16.0 0SELIGMAN 854 18 0 0 0 0 0 0 0 0.0 0.0 0WASHBURN 437 5 0 0 0 0 0 0 0 0.0 0.0 0WHEATON 699 5 2 0 2 0 0 0 2 2.9 2.5 0BUTTERFIELD 472 9 1 0 1 0 1 1 2 4.2 9.0 0
BARTON COUNTY 12,447 144 9 2 11 0 2 2 13 1.0 13.1 4BARTON CO - RURAL 7137 1 - - - - - - - - - -LAMAR 4548 142 8 2 10 0 2 2 12 2.6 14.2 4LIBERAL 762 1 1 0 1 0 0 0 1 1.3 1.0 0
BATES COUNTY 17,002 514 27 1 28 20 9 29 57 3.4 18.4 2BATES CO - RURAL 9684 235 14 1 15 16 8 24 39 4.0 15.7 0ADRIAN 1683 56 3 0 3 0 0 0 3 1.8 18.7 0BUTLER 4234 196 9 0 9 4 1 5 14 3.3 21.8 2RICH HILL 1401 27 1 0 1 0 0 0 1 0.7 27.0 0
BENTON COUNTY 19,125 454 25 0 25 5 2 7 32 1.7 18.2 1BENTON CO - RURAL 14671 281 12 0 12 5 2 7 19 1.3 23.4 1COLE CAMP 1125 10 3 0 3 0 0 0 3 2.7 3.3 0LINCOLN 1194 42 3 0 3 0 0 0 3 2.5 14.0 0WARSAW 2135 121 7 0 7 0 0 0 7 3.3 17.3 0
BOLLINGER COUNTY 12,408 182 11 2 13 0 0 0 13 1.0 14.0 1BOLLINGER CO - RURAL 10926 122 8 1 9 0 0 0 9 0.8 13.6 0MARBLE HILL 1482 60 3 1 4 0 0 0 4 2.7 15.0 1
BOONE COUNTY 163,233 6,245 230 40 270 18 47 65 335 2.1 23.1 87BOONE CO - RURAL 44206 843 53 7 60 2 14 16 76 1.7 14.1 14CENTRALIA 4042 101 6 1 7 0 5 5 12 3.0 14.4 4COLUMBIA 108894 4,862 134 25 159 8 19 27 186 1.7 30.6 58STURGEON 875 0 1 1 2 0 0 0 2 2.3 0.0 0UNIV OF MO - COLUMBIA 0 357 29 5 34 8 8 16 50 0.0 10.5 11ASHLAND 3720 64 5 1 6 0 1 1 7 1.9 10.7 0HALLSVILLE 1496 18 2 0 2 0 0 0 2 1.3 9.0 0
BUCHANAN COUNTY 89,481 4,681 177 24 201 20 56 76 277 3.1 23.3 34 BUCHANAN CO - RURAL 12422 252 63 14 77 14 17 31 108 8.7 3.3 1 ST JOSEPH 77059 4,356 105 10 115 6 36 42 157 2.0 37.9 33 MO WESTERN STATE COLLEGE 0 73 9 0 9 0 3 3 12 0.0 8.1 0
BUTLER COUNTY 42,949 2,313 61 5 66 17 18 35 101 2.4 35.0 22 BUTLER CO - RURAL 25404 744 15 1 16 15 8 23 39 1.5 46.5 12 POPLAR BLUFF 17085 1,529 42 2 44 1 10 11 55 3.2 34.8 10
FT Officers/ 1000 Pop. # Index Crimes per FT Officer Officer AssaultsReporting Agency Population Total Index OffensesFull Time Officers Full Time Civilians
Total FTE
Crime in Missouri, 2011 167 Section 10.0
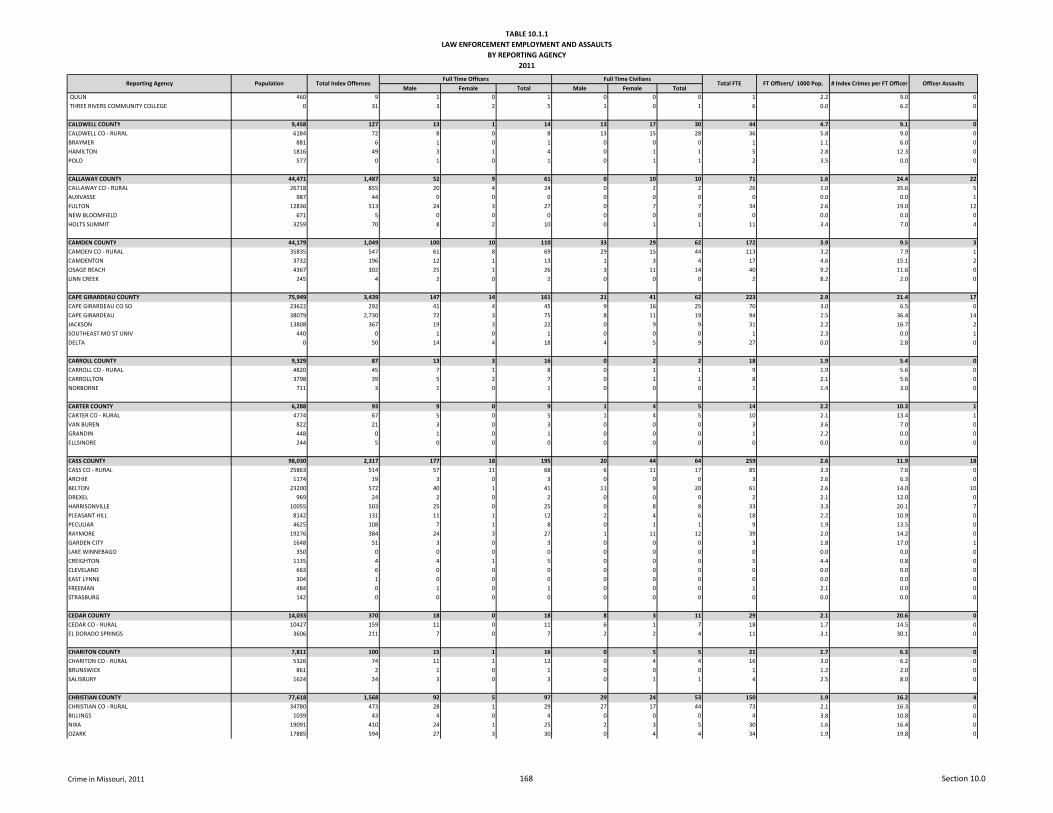
TABLE 10.1.1LAW ENFORCEMENT EMPLOYMENT AND ASSAULTS
BY REPORTING AGENCY2011
Male Female Total Male Female TotalFT Officers/ 1000 Pop. # Index Crimes per FT Officer Officer AssaultsReporting Agency Population Total Index Offenses
Full Time Officers Full Time CiviliansTotal FTE
QULIN 460 9 1 0 1 0 0 0 1 2.2 9.0 0 THREE RIVERS COMMUNITY COLLEGE 0 31 3 2 5 1 0 1 6 0.0 6.2 0
CALDWELL COUNTY 9,458 127 13 1 14 13 17 30 44 4.7 9.1 0CALDWELL CO - RURAL 6184 72 8 0 8 13 15 28 36 5.8 9.0 0BRAYMER 881 6 1 0 1 0 0 0 1 1.1 6.0 0HAMILTON 1816 49 3 1 4 0 1 1 5 2.8 12.3 0POLO 577 0 1 0 1 0 1 1 2 3.5 0.0 0
CALLAWAY COUNTY 44,471 1,487 52 9 61 0 10 10 71 1.6 24.4 22CALLAWAY CO - RURAL 26718 855 20 4 24 0 2 2 26 1.0 35.6 5AUXVASSE 987 44 0 0 0 0 0 0 0 0.0 0.0 1FULTON 12836 513 24 3 27 0 7 7 34 2.6 19.0 12NEW BLOOMFIELD 671 5 0 0 0 0 0 0 0 0.0 0.0 0HOLTS SUMMIT 3259 70 8 2 10 0 1 1 11 3.4 7.0 4
CAMDEN COUNTY 44,179 1,049 100 10 110 33 29 62 172 3.9 9.5 3CAMDEN CO - RURAL 35835 547 61 8 69 29 15 44 113 3.2 7.9 1CAMDENTON 3732 196 12 1 13 1 3 4 17 4.6 15.1 2OSAGE BEACH 4367 302 25 1 26 3 11 14 40 9.2 11.6 0LINN CREEK 245 4 2 0 2 0 0 0 2 8.2 2.0 0
CAPE GIRARDEAU COUNTY 75,949 3,439 147 14 161 21 41 62 223 2.9 21.4 17CAPE GIRARDEAU CO SO 23622 292 41 4 45 9 16 25 70 3.0 6.5 0CAPE GIRARDEAU 38079 2,730 72 3 75 8 11 19 94 2.5 36.4 14JACKSON 13808 367 19 3 22 0 9 9 31 2.2 16.7 2SOUTHEAST MO ST UNIV 440 0 1 0 1 0 0 0 1 2.3 0.0 1DELTA 0 50 14 4 18 4 5 9 27 0.0 2.8 0
CARROLL COUNTY 9,329 87 13 3 16 0 2 2 18 1.9 5.4 0CARROLL CO - RURAL 4820 45 7 1 8 0 1 1 9 1.9 5.6 0CARROLLTON 3798 39 5 2 7 0 1 1 8 2.1 5.6 0NORBORNE 711 3 1 0 1 0 0 0 1 1.4 3.0 0
CARTER COUNTY 6,288 93 9 0 9 1 4 5 14 2.2 10.3 1CARTER CO - RURAL 4774 67 5 0 5 1 4 5 10 2.1 13.4 1VAN BUREN 822 21 3 0 3 0 0 0 3 3.6 7.0 0GRANDIN 448 0 1 0 1 0 0 0 1 2.2 0.0 0ELLSINORE 244 5 0 0 0 0 0 0 0 0.0 0.0 0
CASS COUNTY 98,030 2,317 177 18 195 20 44 64 259 2.6 11.9 18CASS CO - RURAL 25863 514 57 11 68 6 11 17 85 3.3 7.6 0ARCHIE 1174 19 3 0 3 0 0 0 3 2.6 6.3 0BELTON 23200 572 40 1 41 11 9 20 61 2.6 14.0 10DREXEL 969 24 2 0 2 0 0 0 2 2.1 12.0 0HARRISONVILLE 10055 503 25 0 25 0 8 8 33 3.3 20.1 7PLEASANT HILL 8142 131 11 1 12 2 4 6 18 2.2 10.9 0PECULIAR 4625 108 7 1 8 0 1 1 9 1.9 13.5 0RAYMORE 19276 384 24 3 27 1 11 12 39 2.0 14.2 0GARDEN CITY 1648 51 3 0 3 0 0 0 3 1.8 17.0 1LAKE WINNEBAGO 350 0 0 0 0 0 0 0 0 0.0 0.0 0CREIGHTON 1135 4 4 1 5 0 0 0 5 4.4 0.8 0CLEVELAND 663 6 0 0 0 0 0 0 0 0.0 0.0 0EAST LYNNE 304 1 0 0 0 0 0 0 0 0.0 0.0 0FREEMAN 484 0 1 0 1 0 0 0 1 2.1 0.0 0STRASBURG 142 0 0 0 0 0 0 0 0 0.0 0.0 0
CEDAR COUNTY 14,033 370 18 0 18 8 3 11 29 2.1 20.6 0CEDAR CO - RURAL 10427 159 11 0 11 6 1 7 18 1.7 14.5 0EL DORADO SPRINGS 3606 211 7 0 7 2 2 4 11 3.1 30.1 0
CHARITON COUNTY 7,811 100 15 1 16 0 5 5 21 2.7 6.3 0CHARITON CO - RURAL 5326 74 11 1 12 0 4 4 16 3.0 6.2 0BRUNSWICK 861 2 1 0 1 0 0 0 1 1.2 2.0 0SALISBURY 1624 24 3 0 3 0 1 1 4 2.5 8.0 0
CHRISTIAN COUNTY 77,618 1,568 92 5 97 29 24 53 150 1.9 16.2 4CHRISTIAN CO - RURAL 34780 473 28 1 29 27 17 44 73 2.1 16.3 0BILLINGS 1039 43 4 0 4 0 0 0 4 3.8 10.8 0NIXA 19091 410 24 1 25 2 3 5 30 1.6 16.4 0OZARK 17885 594 27 3 30 0 4 4 34 1.9 19.8 0
Crime in Missouri, 2011 168 Section 10.0
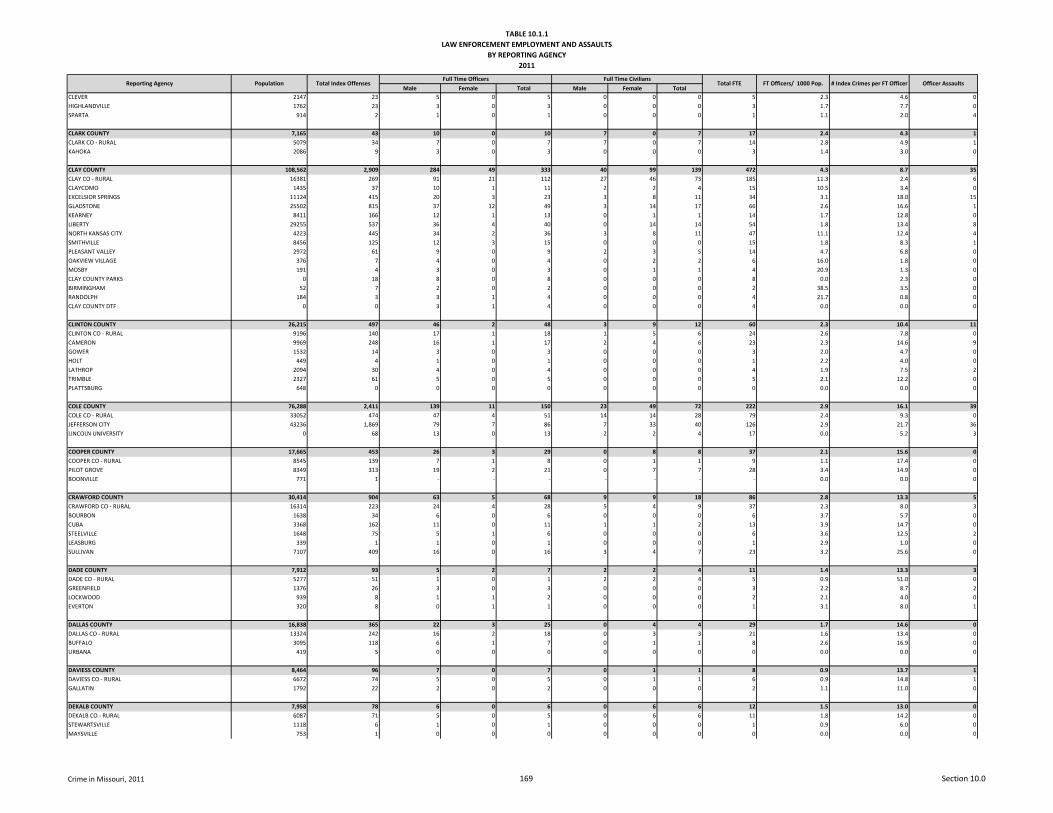
TABLE 10.1.1LAW ENFORCEMENT EMPLOYMENT AND ASSAULTS
BY REPORTING AGENCY2011
Male Female Total Male Female TotalFT Officers/ 1000 Pop. # Index Crimes per FT Officer Officer AssaultsReporting Agency Population Total Index Offenses
Full Time Officers Full Time CiviliansTotal FTE
CLEVER 2147 23 5 0 5 0 0 0 5 2.3 4.6 0HIGHLANDVILLE 1762 23 3 0 3 0 0 0 3 1.7 7.7 0SPARTA 914 2 1 0 1 0 0 0 1 1.1 2.0 4
CLARK COUNTY 7,165 43 10 0 10 7 0 7 17 2.4 4.3 1CLARK CO - RURAL 5079 34 7 0 7 7 0 7 14 2.8 4.9 1KAHOKA 2086 9 3 0 3 0 0 0 3 1.4 3.0 0
CLAY COUNTY 108,562 2,909 284 49 333 40 99 139 472 4.3 8.7 35CLAY CO - RURAL 16381 269 91 21 112 27 46 73 185 11.3 2.4 6CLAYCOMO 1435 37 10 1 11 2 2 4 15 10.5 3.4 0EXCELSIOR SPRINGS 11124 415 20 3 23 3 8 11 34 3.1 18.0 15GLADSTONE 25502 815 37 12 49 3 14 17 66 2.6 16.6 1KEARNEY 8411 166 12 1 13 0 1 1 14 1.7 12.8 0LIBERTY 29255 537 36 4 40 0 14 14 54 1.8 13.4 8NORTH KANSAS CITY 4223 445 34 2 36 3 8 11 47 11.1 12.4 4SMITHVILLE 8456 125 12 3 15 0 0 0 15 1.8 8.3 1PLEASANT VALLEY 2972 61 9 0 9 2 3 5 14 4.7 6.8 0OAKVIEW VILLAGE 376 7 4 0 4 0 2 2 6 16.0 1.8 0MOSBY 191 4 3 0 3 0 1 1 4 20.9 1.3 0CLAY COUNTY PARKS 0 18 8 0 8 0 0 0 8 0.0 2.3 0BIRMINGHAM 52 7 2 0 2 0 0 0 2 38.5 3.5 0RANDOLPH 184 3 3 1 4 0 0 0 4 21.7 0.8 0CLAY COUNTY DTF 0 0 3 1 4 0 0 0 4 0.0 0.0 0
CLINTON COUNTY 26,215 497 46 2 48 3 9 12 60 2.3 10.4 11CLINTON CO - RURAL 9196 140 17 1 18 1 5 6 24 2.6 7.8 0CAMERON 9969 248 16 1 17 2 4 6 23 2.3 14.6 9GOWER 1532 14 3 0 3 0 0 0 3 2.0 4.7 0HOLT 449 4 1 0 1 0 0 0 1 2.2 4.0 0LATHROP 2094 30 4 0 4 0 0 0 4 1.9 7.5 2TRIMBLE 2327 61 5 0 5 0 0 0 5 2.1 12.2 0PLATTSBURG 648 0 0 0 0 0 0 0 0 0.0 0.0 0
COLE COUNTY 76,288 2,411 139 11 150 23 49 72 222 2.9 16.1 39COLE CO - RURAL 33052 474 47 4 51 14 14 28 79 2.4 9.3 0JEFFERSON CITY 43236 1,869 79 7 86 7 33 40 126 2.9 21.7 36LINCOLN UNIVERSITY 0 68 13 0 13 2 2 4 17 0.0 5.2 3
COOPER COUNTY 17,665 453 26 3 29 0 8 8 37 2.1 15.6 0COOPER CO - RURAL 8545 139 7 1 8 0 1 1 9 1.1 17.4 0PILOT GROVE 8349 313 19 2 21 0 7 7 28 3.4 14.9 0BOONVILLE 771 1 - - - - - - - 0.0 0.0 0
CRAWFORD COUNTY 30,414 904 63 5 68 9 9 18 86 2.8 13.3 5CRAWFORD CO - RURAL 16314 223 24 4 28 5 4 9 37 2.3 8.0 3BOURBON 1638 34 6 0 6 0 0 0 6 3.7 5.7 0CUBA 3368 162 11 0 11 1 1 2 13 3.9 14.7 0STEELVILLE 1648 75 5 1 6 0 0 0 6 3.6 12.5 2LEASBURG 339 1 1 0 1 0 0 0 1 2.9 1.0 0SULLIVAN 7107 409 16 0 16 3 4 7 23 3.2 25.6 0
DADE COUNTY 7,912 93 5 2 7 2 2 4 11 1.4 13.3 3DADE CO - RURAL 5277 51 1 0 1 2 2 4 5 0.9 51.0 0GREENFIELD 1376 26 3 0 3 0 0 0 3 2.2 8.7 2LOCKWOOD 939 8 1 1 2 0 0 0 2 2.1 4.0 0EVERTON 320 8 0 1 1 0 0 0 1 3.1 8.0 1
DALLAS COUNTY 16,838 365 22 3 25 0 4 4 29 1.7 14.6 0DALLAS CO - RURAL 13324 242 16 2 18 0 3 3 21 1.6 13.4 0BUFFALO 3095 118 6 1 7 0 1 1 8 2.6 16.9 0URBANA 419 5 0 0 0 0 0 0 0 0.0 0.0 0
DAVIESS COUNTY 8,464 96 7 0 7 0 1 1 8 0.9 13.7 1DAVIESS CO - RURAL 6672 74 5 0 5 0 1 1 6 0.9 14.8 1GALLATIN 1792 22 2 0 2 0 0 0 2 1.1 11.0 0
DEKALB COUNTY 7,958 78 6 0 6 0 6 6 12 1.5 13.0 0DEKALB CO - RURAL 6087 71 5 0 5 0 6 6 11 1.8 14.2 0STEWARTSVILLE 1118 6 1 0 1 0 0 0 1 0.9 6.0 0MAYSVILLE 753 1 0 0 0 0 0 0 0 0.0 0.0 0
Crime in Missouri, 2011 169 Section 10.0
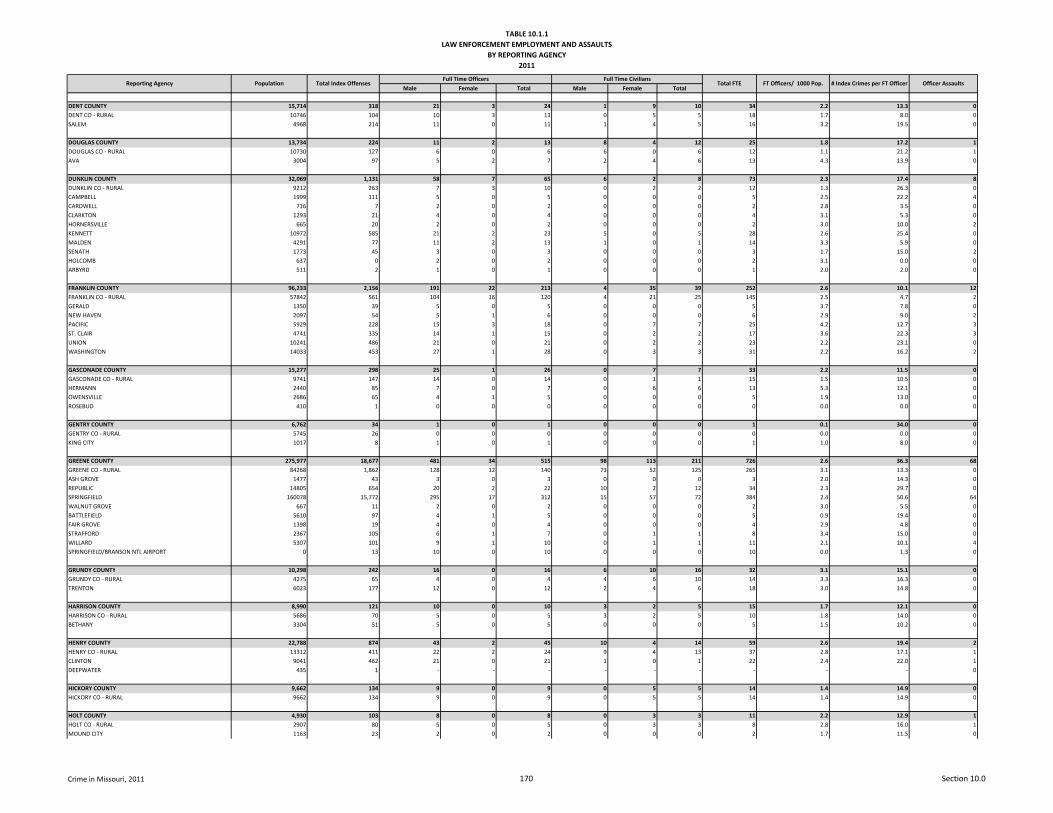
TABLE 10.1.1LAW ENFORCEMENT EMPLOYMENT AND ASSAULTS
BY REPORTING AGENCY2011
Male Female Total Male Female TotalFT Officers/ 1000 Pop. # Index Crimes per FT Officer Officer AssaultsReporting Agency Population Total Index Offenses
Full Time Officers Full Time CiviliansTotal FTE
DENT COUNTY 15,714 318 21 3 24 1 9 10 34 2.2 13.3 0DENT CO - RURAL 10746 104 10 3 13 0 5 5 18 1.7 8.0 0SALEM 4968 214 11 0 11 1 4 5 16 3.2 19.5 0
DOUGLAS COUNTY 13,734 224 11 2 13 8 4 12 25 1.8 17.2 1DOUGLAS CO - RURAL 10730 127 6 0 6 6 0 6 12 1.1 21.2 1AVA 3004 97 5 2 7 2 4 6 13 4.3 13.9 0
DUNKLIN COUNTY 32,069 1,131 58 7 65 6 2 8 73 2.3 17.4 8DUNKLIN CO - RURAL 9212 263 7 3 10 0 2 2 12 1.3 26.3 0CAMPBELL 1999 111 5 0 5 0 0 0 5 2.5 22.2 4CARDWELL 716 7 2 0 2 0 0 0 2 2.8 3.5 0CLARKTON 1293 21 4 0 4 0 0 0 4 3.1 5.3 0HORNERSVILLE 665 20 2 0 2 0 0 0 2 3.0 10.0 2KENNETT 10972 585 21 2 23 5 0 5 28 2.6 25.4 0MALDEN 4291 77 11 2 13 1 0 1 14 3.3 5.9 0SENATH 1773 45 3 0 3 0 0 0 3 1.7 15.0 2HOLCOMB 637 0 2 0 2 0 0 0 2 3.1 0.0 0ARBYRD 511 2 1 0 1 0 0 0 1 2.0 2.0 0
FRANKLIN COUNTY 96,233 2,156 191 22 213 4 35 39 252 2.6 10.1 12FRANKLIN CO - RURAL 57842 561 104 16 120 4 21 25 145 2.5 4.7 2GERALD 1350 39 5 0 5 0 0 0 5 3.7 7.8 0NEW HAVEN 2097 54 5 1 6 0 0 0 6 2.9 9.0 2PACIFIC 5929 228 15 3 18 0 7 7 25 4.2 12.7 3ST. CLAIR 4741 335 14 1 15 0 2 2 17 3.6 22.3 3UNION 10241 486 21 0 21 0 2 2 23 2.2 23.1 0WASHINGTON 14033 453 27 1 28 0 3 3 31 2.2 16.2 2
GASCONADE COUNTY 15,277 298 25 1 26 0 7 7 33 2.2 11.5 0GASCONADE CO - RURAL 9741 147 14 0 14 0 1 1 15 1.5 10.5 0HERMANN 2440 85 7 0 7 0 6 6 13 5.3 12.1 0OWENSVILLE 2686 65 4 1 5 0 0 0 5 1.9 13.0 0ROSEBUD 410 1 0 0 0 0 0 0 0 0.0 0.0 0
GENTRY COUNTY 6,762 34 1 0 1 0 0 0 1 0.1 34.0 0GENTRY CO - RURAL 5745 26 0 0 0 0 0 0 0 0.0 0.0 0KING CITY 1017 8 1 0 1 0 0 0 1 1.0 8.0 0
GREENE COUNTY 275,977 18,677 481 34 515 98 113 211 726 2.6 36.3 68GREENE CO - RURAL 84268 1,862 128 12 140 73 52 125 265 3.1 13.3 0ASH GROVE 1477 43 3 0 3 0 0 0 3 2.0 14.3 0REPUBLIC 14805 654 20 2 22 10 2 12 34 2.3 29.7 0SPRINGFIELD 160078 15,772 295 17 312 15 57 72 384 2.4 50.6 64WALNUT GROVE 667 11 2 0 2 0 0 0 2 3.0 5.5 0BATTLEFIELD 5610 97 4 1 5 0 0 0 5 0.9 19.4 0FAIR GROVE 1398 19 4 0 4 0 0 0 4 2.9 4.8 0STRAFFORD 2367 105 6 1 7 0 1 1 8 3.4 15.0 0WILLARD 5307 101 9 1 10 0 1 1 11 2.1 10.1 4SPRINGFIELD/BRANSON NTL AIRPORT 0 13 10 0 10 0 0 0 10 0.0 1.3 0
GRUNDY COUNTY 10,298 242 16 0 16 6 10 16 32 3.1 15.1 0GRUNDY CO - RURAL 4275 65 4 0 4 4 6 10 14 3.3 16.3 0TRENTON 6023 177 12 0 12 2 4 6 18 3.0 14.8 0
HARRISON COUNTY 8,990 121 10 0 10 3 2 5 15 1.7 12.1 0HARRISON CO - RURAL 5686 70 5 0 5 3 2 5 10 1.8 14.0 0BETHANY 3304 51 5 0 5 0 0 0 5 1.5 10.2 0
HENRY COUNTY 22,788 874 43 2 45 10 4 14 59 2.6 19.4 2HENRY CO - RURAL 13312 411 22 2 24 9 4 13 37 2.8 17.1 1CLINTON 9041 462 21 0 21 1 0 1 22 2.4 22.0 1DEEPWATER 435 1 - - - - - - - - - 0
HICKORY COUNTY 9,662 134 9 0 9 0 5 5 14 1.4 14.9 0HICKORY CO - RURAL 9662 134 9 0 9 0 5 5 14 1.4 14.9 0
HOLT COUNTY 4,930 103 8 0 8 0 3 3 11 2.2 12.9 1HOLT CO - RURAL 2907 80 5 0 5 0 3 3 8 2.8 16.0 1MOUND CITY 1163 23 2 0 2 0 0 0 2 1.7 11.5 0
Crime in Missouri, 2011 170 Section 10.0

TABLE 10.1.1LAW ENFORCEMENT EMPLOYMENT AND ASSAULTS
BY REPORTING AGENCY2011
Male Female Total Male Female TotalFT Officers/ 1000 Pop. # Index Crimes per FT Officer Officer AssaultsReporting Agency Population Total Index Offenses
Full Time Officers Full Time CiviliansTotal FTE
OREGON 860 0 1 0 1 0 0 0 1 1.2 0.0 0
HOWARD COUNTY 10,217 91 21 0 21 1 2 3 24 2.3 4.3 1HOWARD CO - RURAL 5319 50 8 0 8 1 2 3 11 2.1 6.3 0FAYETTE 2698 21 7 0 7 0 0 0 7 2.6 3.0 0GLASGOW 1107 17 4 0 4 0 0 0 4 3.6 4.3 0NEW FRANKLIN 1093 3 2 0 2 0 0 0 2 1.8 1.5 1
HOWELL COUNTY 40,547 1,577 61 0 61 8 7 15 76 1.9 25.9 17HOWELL CO - RURAL 23596 403 22 0 22 4 5 9 31 1.3 18.3 3MOUNTAIN VIEW 2729 124 7 0 7 0 1 1 8 2.9 17.7 0WEST PLAINS 12030 949 26 0 26 4 0 4 30 2.5 36.5 14WILLOW SPRINGS 2192 101 6 0 6 0 1 1 7 3.2 16.8 0
IRON COUNTY 10,669 131 16 0 16 1 4 5 21 2.0 8.2 2IRON CO - RURAL 7759 97 10 0 10 1 4 5 15 1.9 9.7 0IRONTON 1465 28 3 0 3 0 0 0 3 2.0 9.3 2PILOT KNOB 749 1 1 0 1 0 0 0 1 1.3 1.0 0VIBURNUM 696 5 2 0 2 0 0 0 2 2.9 2.5 0
JACKSON COUNTY 836,297 46,667 1,894 265 2,159 300 571 871 3,030 3.6 21.6 413JACKSON CO - RURAL 22784 616 86 9 95 7 27 34 129 5.7 6.5 23JACKSON COUNTY DTF 0 0 14 3 17 0 2 2 19 0.0 0.0 0BLUE SPRINGS 52766 1,639 70 15 85 9 23 32 117 2.2 19.3 14BUCKNER 3087 91 6 3 9 0 0 0 9 2.9 10.1 3GRAIN VALLEY 12901 283 16 3 19 1 5 6 25 1.9 14.9 1GRANDVIEW 24564 1,058 48 3 51 3 11 14 65 2.6 20.7 35GREENWOOD 5240 87 6 0 6 0 1 1 7 1.3 14.5 1INDEPENDENCE 117255 7,217 182 14 196 14 70 84 280 2.4 36.8 65KANSAS CITY 461458 31,421 1198 189 1387 214 360 574 1961 4.2 22.7 246LAKE LOTAWANA 1946 32 6 0 6 0 1 1 7 3.6 5.3 0LEE'S SUMMIT 91696 2,230 114 13 127 16 39 55 182 2.0 17.6 14OAK GROVE 7823 209 14 0 14 0 1 1 15 1.9 14.9 6RAYTOWN 29633 1,338 47 6 53 6 15 21 74 2.5 25.2 2SUGAR CREEK 3357 226 15 2 17 0 5 5 22 6.6 13.3 3LONE JACK 1054 16 5 0 5 0 0 0 5 4.7 3.2 0LAKE TAPAWINGO 733 13 3 0 3 0 0 0 3 4.1 4.3 0PENN VALLEY COMTY COLLEGE 0 23 24 0 24 20 3 23 47 0.0 1.0 0UNIV OF MO - KC 0 168 24 4 28 8 8 16 44 0.0 6.0 0JACKSON CO PK RNGRS 0 0 16 1 17 2 0 2 19 0.0 0.0 0
JASPER COUNTY 124,049 5,687 296 19 315 36 40 76 391 3.2 18.1 15JASPER CO - RURAL 30362 653 93 7 100 23 22 45 145 4.8 6.5 4CARL JUNCTION 7472 134 11 1 12 2 3 5 17 2.3 11.2 0CARTERVILLE 1898 29 7 0 7 0 0 0 7 3.7 4.1 1CARTHAGE 14430 386 27 1 28 4 3 7 35 2.4 13.8 3JASPER 934 18 1 0 1 0 0 0 1 1.1 18.0 0SARCOXIE 1335 32 2 1 3 0 0 0 3 2.2 10.7 0WEBB CITY 11036 492 19 3 22 1 4 5 27 2.4 22.4 0JOPLIN 50332 3,788 117 5 122 4 7 11 133 2.6 31.0 6DUENWEG 1125 25 2 0 2 0 0 0 2 1.8 12.5 1DUQUESNE 1769 51 6 0 6 0 0 0 6 3.4 8.5 0ORONOGO 2947 23 4 0 4 0 0 0 4 1.4 5.8 0PURCELL 409 0 2 0 2 0 0 0 2 4.9 0.0 0MO SOUTHERN STATE UNIV 0 56 5 1 6 2 1 3 9 0.0 9.3 0
JEFFERSON COUNTY 219,528 5,010 265 18 283 47 56 103 386 1.8 17.7 75JEFFERSON CO - RURAL 160939 2,896 133 11 144 27 36 63 207 1.3 20.1 52CRYSTAL CITY 4873 176 14 1 15 2 4 6 21 4.3 11.7 6DE SOTO 6423 355 15 0 15 2 3 5 20 3.1 23.7 4FESTUS 11644 310 27 1 28 5 6 11 39 3.3 11.1 7HILLSBORO 2831 99 6 0 6 0 0 0 6 2.1 16.5 5PEVELY 158 0 0 0 0 0 0 0 0 0.0 0.0 0ARNOLD 5504 139 13 1 14 1 5 6 20 3.6 9.9 0HERCULANEUM 20884 903 44 1 45 10 1 11 56 2.7 20.1 0KIMMSWICK 3481 68 8 3 11 0 1 1 12 3.4 6.2 0BYRNES MILL 2791 64 5 0 5 0 0 0 5 1.8 12.8 1
JOHNSON COUNTY 52,786 1,442 88 10 98 11 23 34 132 2.5 14.7 3JOHNSON CO - RURAL 28333 451 33 2 35 9 11 20 55 1.9 12.9 0HOLDEN 2260 102 6 0 6 1 0 1 7 3.1 17.0 0
Crime in Missouri, 2011 171 Section 10.0
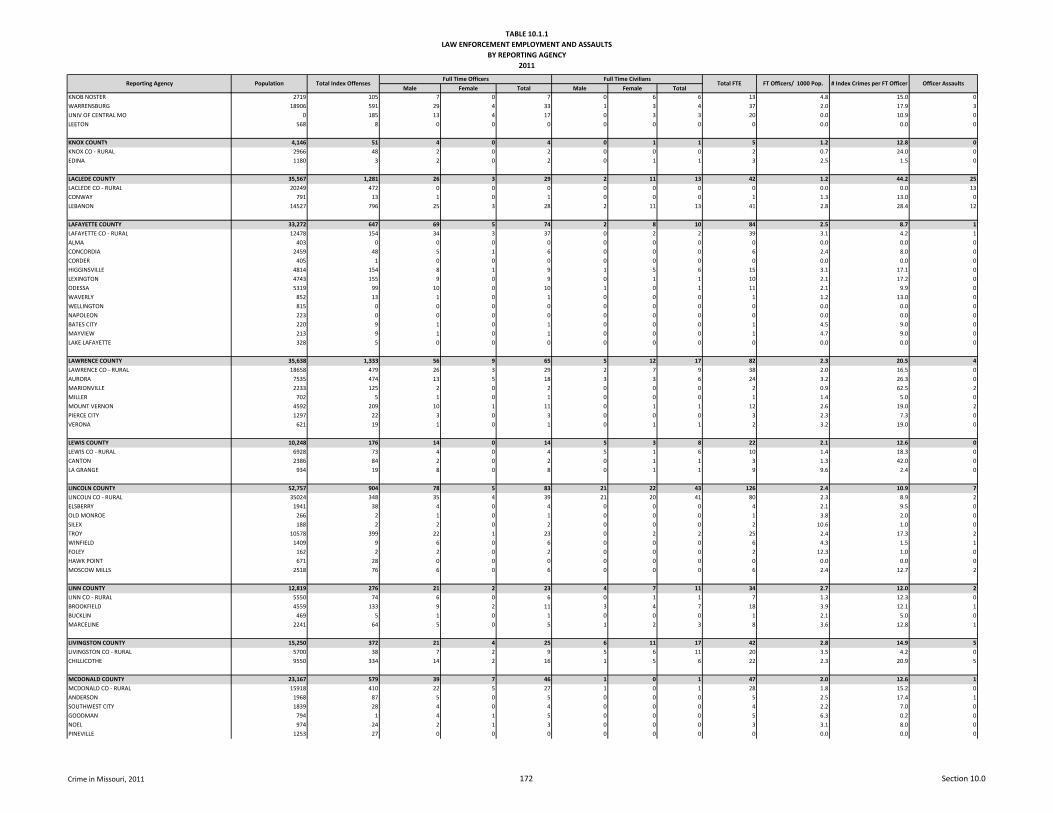
TABLE 10.1.1LAW ENFORCEMENT EMPLOYMENT AND ASSAULTS
BY REPORTING AGENCY2011
Male Female Total Male Female TotalFT Officers/ 1000 Pop. # Index Crimes per FT Officer Officer AssaultsReporting Agency Population Total Index Offenses
Full Time Officers Full Time CiviliansTotal FTE
KNOB NOSTER 2719 105 7 0 7 0 6 6 13 4.8 15.0 0WARRENSBURG 18906 591 29 4 33 1 3 4 37 2.0 17.9 3UNIV OF CENTRAL MO 0 185 13 4 17 0 3 3 20 0.0 10.9 0LEETON 568 8 0 0 0 0 0 0 0 0.0 0.0 0
KNOX COUNTY 4,146 51 4 0 4 0 1 1 5 1.2 12.8 0KNOX CO - RURAL 2966 48 2 0 2 0 0 0 2 0.7 24.0 0EDINA 1180 3 2 0 2 0 1 1 3 2.5 1.5 0
LACLEDE COUNTY 35,567 1,281 26 3 29 2 11 13 42 1.2 44.2 25LACLEDE CO - RURAL 20249 472 0 0 0 0 0 0 0 0.0 0.0 13CONWAY 791 13 1 0 1 0 0 0 1 1.3 13.0 0LEBANON 14527 796 25 3 28 2 11 13 41 2.8 28.4 12
LAFAYETTE COUNTY 33,272 647 69 5 74 2 8 10 84 2.5 8.7 1LAFAYETTE CO - RURAL 12478 154 34 3 37 0 2 2 39 3.1 4.2 1ALMA 403 0 0 0 0 0 0 0 0 0.0 0.0 0CONCORDIA 2459 48 5 1 6 0 0 0 6 2.4 8.0 0CORDER 405 1 0 0 0 0 0 0 0 0.0 0.0 0HIGGINSVILLE 4814 154 8 1 9 1 5 6 15 3.1 17.1 0LEXINGTON 4743 155 9 0 9 0 1 1 10 2.1 17.2 0ODESSA 5319 99 10 0 10 1 0 1 11 2.1 9.9 0WAVERLY 852 13 1 0 1 0 0 0 1 1.2 13.0 0WELLINGTON 815 0 0 0 0 0 0 0 0 0.0 0.0 0NAPOLEON 223 0 0 0 0 0 0 0 0 0.0 0.0 0BATES CITY 220 9 1 0 1 0 0 0 1 4.5 9.0 0MAYVIEW 213 9 1 0 1 0 0 0 1 4.7 9.0 0LAKE LAFAYETTE 328 5 0 0 0 0 0 0 0 0.0 0.0 0
LAWRENCE COUNTY 35,638 1,333 56 9 65 5 12 17 82 2.3 20.5 4LAWRENCE CO - RURAL 18658 479 26 3 29 2 7 9 38 2.0 16.5 0AURORA 7535 474 13 5 18 3 3 6 24 3.2 26.3 0MARIONVILLE 2233 125 2 0 2 0 0 0 2 0.9 62.5 2MILLER 702 5 1 0 1 0 0 0 1 1.4 5.0 0MOUNT VERNON 4592 209 10 1 11 0 1 1 12 2.6 19.0 2PIERCE CITY 1297 22 3 0 3 0 0 0 3 2.3 7.3 0VERONA 621 19 1 0 1 0 1 1 2 3.2 19.0 0
LEWIS COUNTY 10,248 176 14 0 14 5 3 8 22 2.1 12.6 0LEWIS CO - RURAL 6928 73 4 0 4 5 1 6 10 1.4 18.3 0CANTON 2386 84 2 0 2 0 1 1 3 1.3 42.0 0LA GRANGE 934 19 8 0 8 0 1 1 9 9.6 2.4 0
LINCOLN COUNTY 52,757 904 78 5 83 21 22 43 126 2.4 10.9 7LINCOLN CO - RURAL 35024 348 35 4 39 21 20 41 80 2.3 8.9 2ELSBERRY 1941 38 4 0 4 0 0 0 4 2.1 9.5 0OLD MONROE 266 2 1 0 1 0 0 0 1 3.8 2.0 0SILEX 188 2 2 0 2 0 0 0 2 10.6 1.0 0TROY 10578 399 22 1 23 0 2 2 25 2.4 17.3 2WINFIELD 1409 9 6 0 6 0 0 0 6 4.3 1.5 1FOLEY 162 2 2 0 2 0 0 0 2 12.3 1.0 0HAWK POINT 671 28 0 0 0 0 0 0 0 0.0 0.0 0MOSCOW MILLS 2518 76 6 0 6 0 0 0 6 2.4 12.7 2
LINN COUNTY 12,819 276 21 2 23 4 7 11 34 2.7 12.0 2LINN CO - RURAL 5550 74 6 0 6 0 1 1 7 1.3 12.3 0BROOKFIELD 4559 133 9 2 11 3 4 7 18 3.9 12.1 1BUCKLIN 469 5 1 0 1 0 0 0 1 2.1 5.0 0MARCELINE 2241 64 5 0 5 1 2 3 8 3.6 12.8 1
LIVINGSTON COUNTY 15,250 372 21 4 25 6 11 17 42 2.8 14.9 5LIVINGSTON CO - RURAL 5700 38 7 2 9 5 6 11 20 3.5 4.2 0CHILLICOTHE 9550 334 14 2 16 1 5 6 22 2.3 20.9 5
MCDONALD COUNTY 23,167 579 39 7 46 1 0 1 47 2.0 12.6 1MCDONALD CO - RURAL 15918 410 22 5 27 1 0 1 28 1.8 15.2 0ANDERSON 1968 87 5 0 5 0 0 0 5 2.5 17.4 1SOUTHWEST CITY 1839 28 4 0 4 0 0 0 4 2.2 7.0 0GOODMAN 794 1 4 1 5 0 0 0 5 6.3 0.2 0NOEL 974 24 2 1 3 0 0 0 3 3.1 8.0 0PINEVILLE 1253 27 0 0 0 0 0 0 0 0.0 0.0 0
Crime in Missouri, 2011 172 Section 10.0
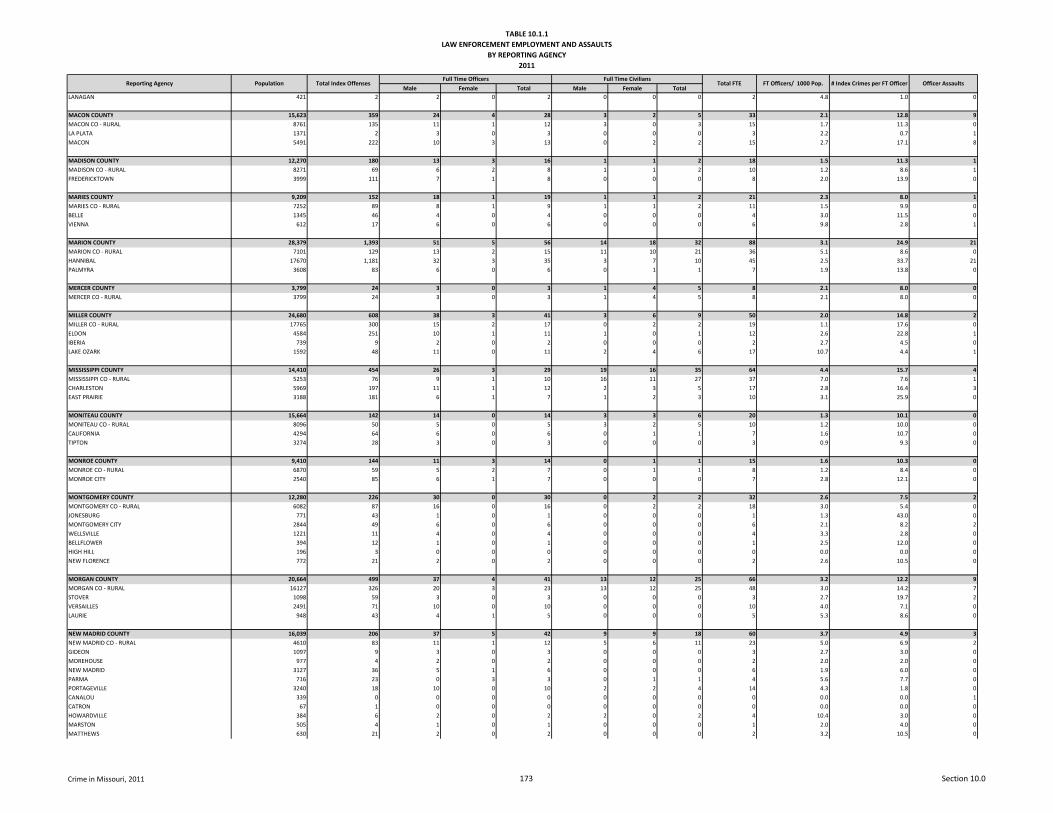
TABLE 10.1.1LAW ENFORCEMENT EMPLOYMENT AND ASSAULTS
BY REPORTING AGENCY2011
Male Female Total Male Female TotalFT Officers/ 1000 Pop. # Index Crimes per FT Officer Officer AssaultsReporting Agency Population Total Index Offenses
Full Time Officers Full Time CiviliansTotal FTE
LANAGAN 421 2 2 0 2 0 0 0 2 4.8 1.0 0
MACON COUNTY 15,623 359 24 4 28 3 2 5 33 2.1 12.8 9MACON CO - RURAL 8761 135 11 1 12 3 0 3 15 1.7 11.3 0LA PLATA 1371 2 3 0 3 0 0 0 3 2.2 0.7 1MACON 5491 222 10 3 13 0 2 2 15 2.7 17.1 8
MADISON COUNTY 12,270 180 13 3 16 1 1 2 18 1.5 11.3 1MADISON CO - RURAL 8271 69 6 2 8 1 1 2 10 1.2 8.6 1FREDERICKTOWN 3999 111 7 1 8 0 0 0 8 2.0 13.9 0
MARIES COUNTY 9,209 152 18 1 19 1 1 2 21 2.3 8.0 1MARIES CO - RURAL 7252 89 8 1 9 1 1 2 11 1.5 9.9 0BELLE 1345 46 4 0 4 0 0 0 4 3.0 11.5 0VIENNA 612 17 6 0 6 0 0 0 6 9.8 2.8 1
MARION COUNTY 28,379 1,393 51 5 56 14 18 32 88 3.1 24.9 21MARION CO - RURAL 7101 129 13 2 15 11 10 21 36 5.1 8.6 0HANNIBAL 17670 1,181 32 3 35 3 7 10 45 2.5 33.7 21PALMYRA 3608 83 6 0 6 0 1 1 7 1.9 13.8 0
MERCER COUNTY 3,799 24 3 0 3 1 4 5 8 2.1 8.0 0MERCER CO - RURAL 3799 24 3 0 3 1 4 5 8 2.1 8.0 0
MILLER COUNTY 24,680 608 38 3 41 3 6 9 50 2.0 14.8 2MILLER CO - RURAL 17765 300 15 2 17 0 2 2 19 1.1 17.6 0ELDON 4584 251 10 1 11 1 0 1 12 2.6 22.8 1IBERIA 739 9 2 0 2 0 0 0 2 2.7 4.5 0LAKE OZARK 1592 48 11 0 11 2 4 6 17 10.7 4.4 1
MISSISSIPPI COUNTY 14,410 454 26 3 29 19 16 35 64 4.4 15.7 4MISSISSIPPI CO - RURAL 5253 76 9 1 10 16 11 27 37 7.0 7.6 1CHARLESTON 5969 197 11 1 12 2 3 5 17 2.8 16.4 3EAST PRAIRIE 3188 181 6 1 7 1 2 3 10 3.1 25.9 0
MONITEAU COUNTY 15,664 142 14 0 14 3 3 6 20 1.3 10.1 0MONITEAU CO - RURAL 8096 50 5 0 5 3 2 5 10 1.2 10.0 0CALIFORNIA 4294 64 6 0 6 0 1 1 7 1.6 10.7 0TIPTON 3274 28 3 0 3 0 0 0 3 0.9 9.3 0
MONROE COUNTY 9,410 144 11 3 14 0 1 1 15 1.6 10.3 0MONROE CO - RURAL 6870 59 5 2 7 0 1 1 8 1.2 8.4 0MONROE CITY 2540 85 6 1 7 0 0 0 7 2.8 12.1 0
MONTGOMERY COUNTY 12,280 226 30 0 30 0 2 2 32 2.6 7.5 2MONTGOMERY CO - RURAL 6082 87 16 0 16 0 2 2 18 3.0 5.4 0JONESBURG 771 43 1 0 1 0 0 0 1 1.3 43.0 0MONTGOMERY CITY 2844 49 6 0 6 0 0 0 6 2.1 8.2 2WELLSVILLE 1221 11 4 0 4 0 0 0 4 3.3 2.8 0BELLFLOWER 394 12 1 0 1 0 0 0 1 2.5 12.0 0HIGH HILL 196 3 0 0 0 0 0 0 0 0.0 0.0 0NEW FLORENCE 772 21 2 0 2 0 0 0 2 2.6 10.5 0
MORGAN COUNTY 20,664 499 37 4 41 13 12 25 66 3.2 12.2 9MORGAN CO - RURAL 16127 326 20 3 23 13 12 25 48 3.0 14.2 7STOVER 1098 59 3 0 3 0 0 0 3 2.7 19.7 2VERSAILLES 2491 71 10 0 10 0 0 0 10 4.0 7.1 0LAURIE 948 43 4 1 5 0 0 0 5 5.3 8.6 0
NEW MADRID COUNTY 16,039 206 37 5 42 9 9 18 60 3.7 4.9 3NEW MADRID CO - RURAL 4610 83 11 1 12 5 6 11 23 5.0 6.9 2GIDEON 1097 9 3 0 3 0 0 0 3 2.7 3.0 0MOREHOUSE 977 4 2 0 2 0 0 0 2 2.0 2.0 0NEW MADRID 3127 36 5 1 6 0 0 0 6 1.9 6.0 0PARMA 716 23 0 3 3 0 1 1 4 5.6 7.7 0PORTAGEVILLE 3240 18 10 0 10 2 2 4 14 4.3 1.8 0CANALOU 339 0 0 0 0 0 0 0 0 0.0 0.0 1CATRON 67 1 0 0 0 0 0 0 0 0.0 0.0 0HOWARDVILLE 384 6 2 0 2 2 0 2 4 10.4 3.0 0MARSTON 505 4 1 0 1 0 0 0 1 2.0 4.0 0MATTHEWS 630 21 2 0 2 0 0 0 2 3.2 10.5 0
Crime in Missouri, 2011 173 Section 10.0
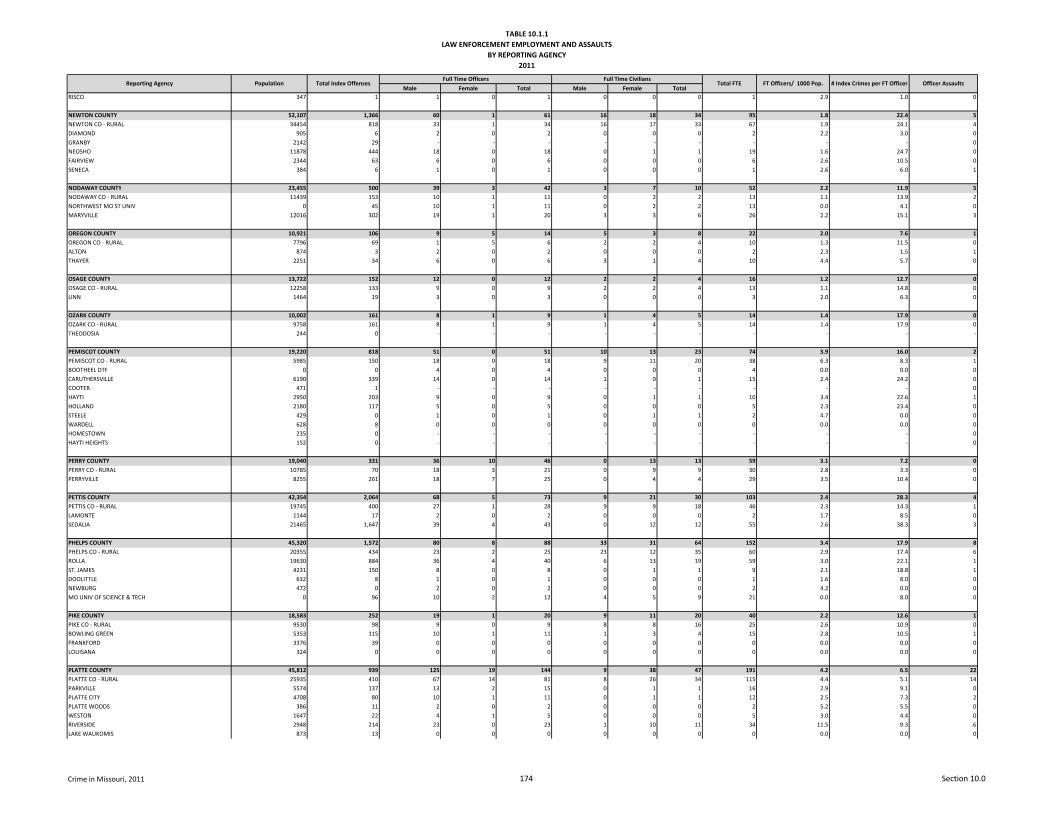
TABLE 10.1.1LAW ENFORCEMENT EMPLOYMENT AND ASSAULTS
BY REPORTING AGENCY2011
Male Female Total Male Female TotalFT Officers/ 1000 Pop. # Index Crimes per FT Officer Officer AssaultsReporting Agency Population Total Index Offenses
Full Time Officers Full Time CiviliansTotal FTE
RISCO 347 1 1 0 1 0 0 0 1 2.9 1.0 0
NEWTON COUNTY 52,107 1,366 60 1 61 16 18 34 95 1.8 22.4 5NEWTON CO - RURAL 34454 818 33 1 34 16 17 33 67 1.9 24.1 4DIAMOND 905 6 2 0 2 0 0 0 2 2.2 3.0 0GRANBY 2142 29 - - - - - - - - - 0NEOSHO 11878 444 18 0 18 0 1 1 19 1.6 24.7 0FAIRVIEW 2344 63 6 0 6 0 0 0 6 2.6 10.5 0SENECA 384 6 1 0 1 0 0 0 1 2.6 6.0 1
NODAWAY COUNTY 23,455 500 39 3 42 3 7 10 52 2.2 11.9 5NODAWAY CO - RURAL 11439 153 10 1 11 0 2 2 13 1.1 13.9 2NORTHWEST MO ST UNIV 0 45 10 1 11 0 2 2 13 0.0 4.1 0MARYVILLE 12016 302 19 1 20 3 3 6 26 2.2 15.1 3
OREGON COUNTY 10,921 106 9 5 14 5 3 8 22 2.0 7.6 1OREGON CO - RURAL 7796 69 1 5 6 2 2 4 10 1.3 11.5 0ALTON 874 3 2 0 2 0 0 0 2 2.3 1.5 1THAYER 2251 34 6 0 6 3 1 4 10 4.4 5.7 0
OSAGE COUNTY 13,722 152 12 0 12 2 2 4 16 1.2 12.7 0OSAGE CO - RURAL 12258 133 9 0 9 2 2 4 13 1.1 14.8 0LINN 1464 19 3 0 3 0 0 0 3 2.0 6.3 0
OZARK COUNTY 10,002 161 8 1 9 1 4 5 14 1.4 17.9 0OZARK CO - RURAL 9758 161 8 1 9 1 4 5 14 1.4 17.9 0THEODOSIA 244 0 - - - - - - - - - -
PEMISCOT COUNTY 19,220 818 51 0 51 10 13 23 74 3.9 16.0 2PEMISCOT CO - RURAL 5985 150 18 0 18 9 11 20 38 6.3 8.3 1BOOTHEEL DTF 0 0 4 0 4 0 0 0 4 0.0 0.0 0CARUTHERSVILLE 6190 339 14 0 14 1 0 1 15 2.4 24.2 0COOTER 471 1 - - - - - - - - - 0HAYTI 2950 203 9 0 9 0 1 1 10 3.4 22.6 1HOLLAND 2180 117 5 0 5 0 0 0 5 2.3 23.4 0STEELE 429 0 1 0 1 0 1 1 2 4.7 0.0 0WARDELL 628 8 0 0 0 0 0 0 0 0.0 0.0 0HOMESTOWN 235 0 - - - - - - - - - 0HAYTI HEIGHTS 152 0 - - - - - - - - - 0
PERRY COUNTY 19,040 331 36 10 46 0 13 13 59 3.1 7.2 0PERRY CO - RURAL 10785 70 18 3 21 0 9 9 30 2.8 3.3 0PERRYVILLE 8255 261 18 7 25 0 4 4 29 3.5 10.4 0
PETTIS COUNTY 42,354 2,064 68 5 73 9 21 30 103 2.4 28.3 4PETTIS CO - RURAL 19745 400 27 1 28 9 9 18 46 2.3 14.3 1LAMONTE 1144 17 2 0 2 0 0 0 2 1.7 8.5 0SEDALIA 21465 1,647 39 4 43 0 12 12 55 2.6 38.3 3
PHELPS COUNTY 45,320 1,572 80 8 88 33 31 64 152 3.4 17.9 8PHELPS CO - RURAL 20355 434 23 2 25 23 12 35 60 2.9 17.4 6ROLLA 19630 884 36 4 40 6 13 19 59 3.0 22.1 1ST. JAMES 4231 150 8 0 8 0 1 1 9 2.1 18.8 1DOOLITTLE 632 8 1 0 1 0 0 0 1 1.6 8.0 0NEWBURG 472 0 2 0 2 0 0 0 2 4.2 0.0 0MO UNIV OF SCIENCE & TECH 0 96 10 2 12 4 5 9 21 0.0 8.0 0
PIKE COUNTY 18,583 252 19 1 20 9 11 20 40 2.2 12.6 1PIKE CO - RURAL 9530 98 9 0 9 8 8 16 25 2.6 10.9 0BOWLING GREEN 5353 115 10 1 11 1 3 4 15 2.8 10.5 1FRANKFORD 3376 39 0 0 0 0 0 0 0 0.0 0.0 0LOUISANA 324 0 0 0 0 0 0 0 0 0.0 0.0 0
PLATTE COUNTY 45,812 939 125 19 144 9 38 47 191 4.2 6.5 22PLATTE CO - RURAL 25935 410 67 14 81 8 26 34 115 4.4 5.1 14PARKVILLE 5574 137 13 2 15 0 1 1 16 2.9 9.1 0PLATTE CITY 4708 80 10 1 11 0 1 1 12 2.5 7.3 2PLATTE WOODS 386 11 2 0 2 0 0 0 2 5.2 5.5 0WESTON 1647 22 4 1 5 0 0 0 5 3.0 4.4 0RIVERSIDE 2948 214 23 0 23 1 10 11 34 11.5 9.3 6LAKE WAUKOMIS 873 13 0 0 0 0 0 0 0 0.0 0.0 0
Crime in Missouri, 2011 174 Section 10.0
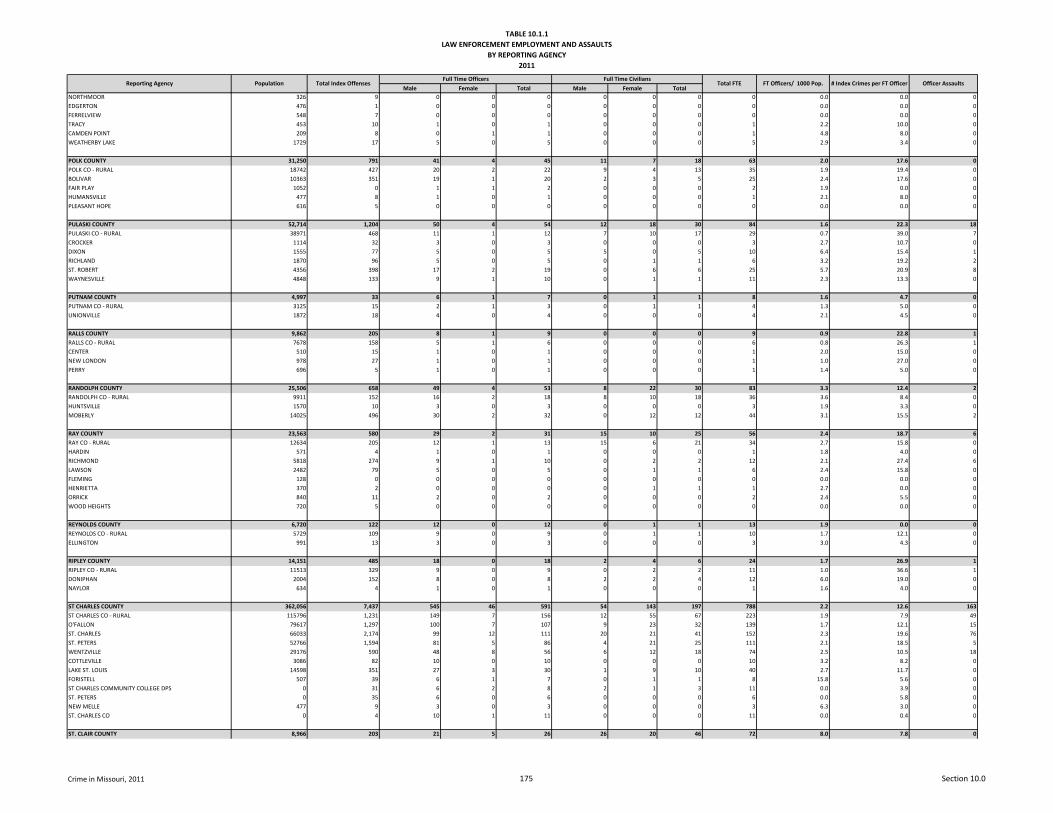
TABLE 10.1.1LAW ENFORCEMENT EMPLOYMENT AND ASSAULTS
BY REPORTING AGENCY2011
Male Female Total Male Female TotalFT Officers/ 1000 Pop. # Index Crimes per FT Officer Officer AssaultsReporting Agency Population Total Index Offenses
Full Time Officers Full Time CiviliansTotal FTE
NORTHMOOR 326 9 0 0 0 0 0 0 0 0.0 0.0 0EDGERTON 476 1 0 0 0 0 0 0 0 0.0 0.0 0FERRELVIEW 548 7 0 0 0 0 0 0 0 0.0 0.0 0TRACY 453 10 1 0 1 0 0 0 1 2.2 10.0 0CAMDEN POINT 209 8 0 1 1 0 0 0 1 4.8 8.0 0WEATHERBY LAKE 1729 17 5 0 5 0 0 0 5 2.9 3.4 0
POLK COUNTY 31,250 791 41 4 45 11 7 18 63 2.0 17.6 0POLK CO - RURAL 18742 427 20 2 22 9 4 13 35 1.9 19.4 0BOLIVAR 10363 351 19 1 20 2 3 5 25 2.4 17.6 0FAIR PLAY 1052 0 1 1 2 0 0 0 2 1.9 0.0 0HUMANSVILLE 477 8 1 0 1 0 0 0 1 2.1 8.0 0PLEASANT HOPE 616 5 0 0 0 0 0 0 0 0.0 0.0 0
PULASKI COUNTY 52,714 1,204 50 4 54 12 18 30 84 1.6 22.3 18PULASKI CO - RURAL 38971 468 11 1 12 7 10 17 29 0.7 39.0 7CROCKER 1114 32 3 0 3 0 0 0 3 2.7 10.7 0DIXON 1555 77 5 0 5 5 0 5 10 6.4 15.4 1RICHLAND 1870 96 5 0 5 0 1 1 6 3.2 19.2 2ST. ROBERT 4356 398 17 2 19 0 6 6 25 5.7 20.9 8WAYNESVILLE 4848 133 9 1 10 0 1 1 11 2.3 13.3 0
PUTNAM COUNTY 4,997 33 6 1 7 0 1 1 8 1.6 4.7 0PUTNAM CO - RURAL 3125 15 2 1 3 0 1 1 4 1.3 5.0 0UNIONVILLE 1872 18 4 0 4 0 0 0 4 2.1 4.5 0
RALLS COUNTY 9,862 205 8 1 9 0 0 0 9 0.9 22.8 1RALLS CO - RURAL 7678 158 5 1 6 0 0 0 6 0.8 26.3 1CENTER 510 15 1 0 1 0 0 0 1 2.0 15.0 0NEW LONDON 978 27 1 0 1 0 0 0 1 1.0 27.0 0PERRY 696 5 1 0 1 0 0 0 1 1.4 5.0 0
RANDOLPH COUNTY 25,506 658 49 4 53 8 22 30 83 3.3 12.4 2RANDOLPH CO - RURAL 9911 152 16 2 18 8 10 18 36 3.6 8.4 0HUNTSVILLE 1570 10 3 0 3 0 0 0 3 1.9 3.3 0MOBERLY 14025 496 30 2 32 0 12 12 44 3.1 15.5 2
RAY COUNTY 23,563 580 29 2 31 15 10 25 56 2.4 18.7 6RAY CO - RURAL 12634 205 12 1 13 15 6 21 34 2.7 15.8 0HARDIN 571 4 1 0 1 0 0 0 1 1.8 4.0 0RICHMOND 5818 274 9 1 10 0 2 2 12 2.1 27.4 6LAWSON 2482 79 5 0 5 0 1 1 6 2.4 15.8 0FLEMING 128 0 0 0 0 0 0 0 0 0.0 0.0 0HENRIETTA 370 2 0 0 0 0 1 1 1 2.7 0.0 0ORRICK 840 11 2 0 2 0 0 0 2 2.4 5.5 0WOOD HEIGHTS 720 5 0 0 0 0 0 0 0 0.0 0.0 0
REYNOLDS COUNTY 6,720 122 12 0 12 0 1 1 13 1.9 0.0 0REYNOLDS CO - RURAL 5729 109 9 0 9 0 1 1 10 1.7 12.1 0ELLINGTON 991 13 3 0 3 0 0 0 3 3.0 4.3 0
RIPLEY COUNTY 14,151 485 18 0 18 2 4 6 24 1.7 26.9 1RIPLEY CO - RURAL 11513 329 9 0 9 0 2 2 11 1.0 36.6 1DONIPHAN 2004 152 8 0 8 2 2 4 12 6.0 19.0 0NAYLOR 634 4 1 0 1 0 0 0 1 1.6 4.0 0
ST CHARLES COUNTY 362,056 7,437 545 46 591 54 143 197 788 2.2 12.6 163ST CHARLES CO - RURAL 115796 1,231 149 7 156 12 55 67 223 1.9 7.9 49O'FALLON 79617 1,297 100 7 107 9 23 32 139 1.7 12.1 15ST. CHARLES 66033 2,174 99 12 111 20 21 41 152 2.3 19.6 76ST. PETERS 52766 1,594 81 5 86 4 21 25 111 2.1 18.5 5WENTZVILLE 29176 590 48 8 56 6 12 18 74 2.5 10.5 18COTTLEVILLE 3086 82 10 0 10 0 0 0 10 3.2 8.2 0LAKE ST. LOUIS 14598 351 27 3 30 1 9 10 40 2.7 11.7 0FORISTELL 507 39 6 1 7 0 1 1 8 15.8 5.6 0ST CHARLES COMMUNITY COLLEGE DPS 0 31 6 2 8 2 1 3 11 0.0 3.9 0ST. PETERS 0 35 6 0 6 0 0 0 6 0.0 5.8 0NEW MELLE 477 9 3 0 3 0 0 0 3 6.3 3.0 0ST. CHARLES CO 0 4 10 1 11 0 0 0 11 0.0 0.4 0
ST. CLAIR COUNTY 8,966 203 21 5 26 26 20 46 72 8.0 7.8 0
Crime in Missouri, 2011 175 Section 10.0
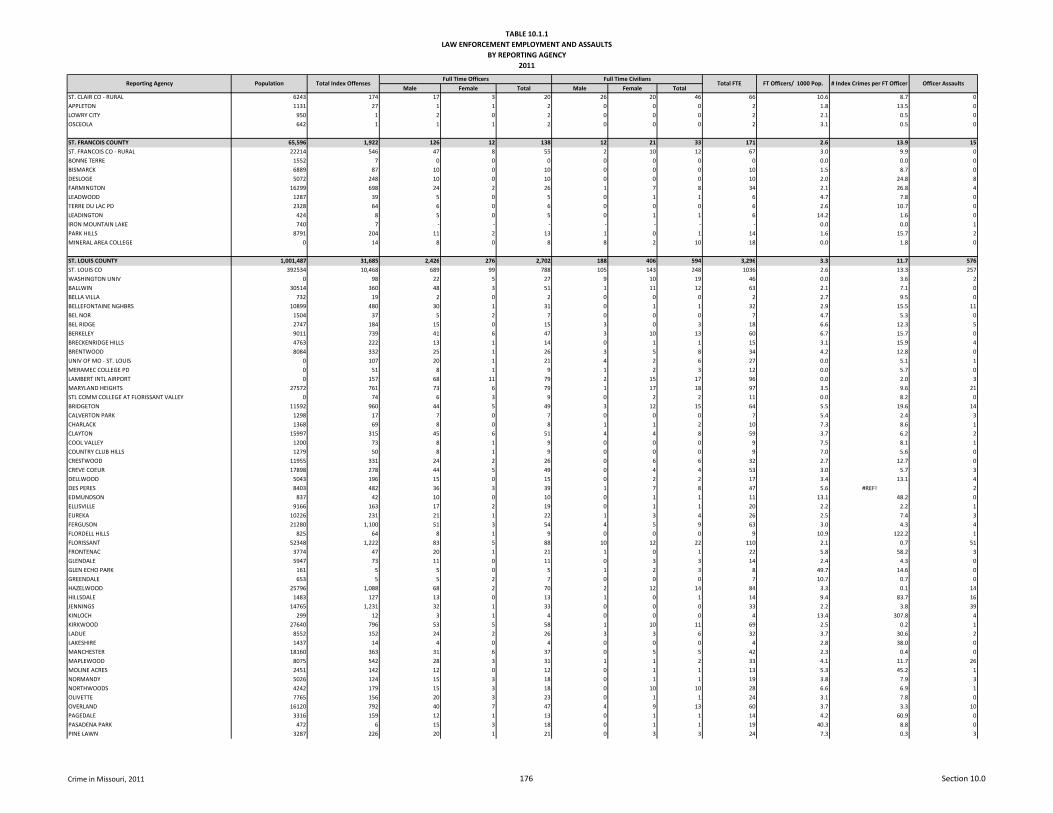
TABLE 10.1.1LAW ENFORCEMENT EMPLOYMENT AND ASSAULTS
BY REPORTING AGENCY2011
Male Female Total Male Female TotalFT Officers/ 1000 Pop. # Index Crimes per FT Officer Officer AssaultsReporting Agency Population Total Index Offenses
Full Time Officers Full Time CiviliansTotal FTE
ST. CLAIR CO - RURAL 6243 174 17 3 20 26 20 46 66 10.6 8.7 0APPLETON 1131 27 1 1 2 0 0 0 2 1.8 13.5 0LOWRY CITY 950 1 2 0 2 0 0 0 2 2.1 0.5 0OSCEOLA 642 1 1 1 2 0 0 0 2 3.1 0.5 0
ST. FRANCOIS COUNTY 65,596 1,922 126 12 138 12 21 33 171 2.6 13.9 15ST. FRANCOIS CO - RURAL 22214 546 47 8 55 2 10 12 67 3.0 9.9 0BONNE TERRE 1552 7 0 0 0 0 0 0 0 0.0 0.0 0BISMARCK 6889 87 10 0 10 0 0 0 10 1.5 8.7 0DESLOGE 5072 248 10 0 10 0 0 0 10 2.0 24.8 8FARMINGTON 16299 698 24 2 26 1 7 8 34 2.1 26.8 4LEADWOOD 1287 39 5 0 5 0 1 1 6 4.7 7.8 0TERRE DU LAC PD 2328 64 6 0 6 0 0 0 6 2.6 10.7 0LEADINGTON 424 8 5 0 5 0 1 1 6 14.2 1.6 0IRON MOUNTAIN LAKE 740 7 - - - - - - - 0.0 0.0 1PARK HILLS 8791 204 11 2 13 1 0 1 14 1.6 15.7 2MINERAL AREA COLLEGE 0 14 8 0 8 8 2 10 18 0.0 1.8 0
ST. LOUIS COUNTY 1,001,487 31,685 2,426 276 2,702 188 406 594 3,296 3.3 11.7 576ST. LOUIS CO 392534 10,468 689 99 788 105 143 248 1036 2.6 13.3 257WASHINGTON UNIV 0 98 22 5 27 9 10 19 46 0.0 3.6 2BALLWIN 30514 360 48 3 51 1 11 12 63 2.1 7.1 0BELLA VILLA 732 19 2 0 2 0 0 0 2 2.7 9.5 0BELLEFONTAINE NGHBRS 10899 480 30 1 31 0 1 1 32 2.9 15.5 11BEL NOR 1504 37 5 2 7 0 0 0 7 4.7 5.3 0BEL RIDGE 2747 184 15 0 15 3 0 3 18 6.6 12.3 5BERKELEY 9011 739 41 6 47 3 10 13 60 6.7 15.7 0BRECKENRIDGE HILLS 4763 222 13 1 14 0 1 1 15 3.1 15.9 4BRENTWOOD 8084 332 25 1 26 3 5 8 34 4.2 12.8 0UNIV OF MO - ST. LOUIS 0 107 20 1 21 4 2 6 27 0.0 5.1 1MERAMEC COLLEGE PD 0 51 8 1 9 1 2 3 12 0.0 5.7 0LAMBERT INTL AIRPORT 0 157 68 11 79 2 15 17 96 0.0 2.0 3MARYLAND HEIGHTS 27572 761 73 6 79 1 17 18 97 3.5 9.6 21STL COMM COLLEGE AT FLORISSANT VALLEY 0 74 6 3 9 0 2 2 11 0.0 8.2 0BRIDGETON 11592 960 44 5 49 3 12 15 64 5.5 19.6 14CALVERTON PARK 1298 17 7 0 7 0 0 0 7 5.4 2.4 3CHARLACK 1368 69 8 0 8 1 1 2 10 7.3 8.6 1CLAYTON 15997 315 45 6 51 4 4 8 59 3.7 6.2 2COOL VALLEY 1200 73 8 1 9 0 0 0 9 7.5 8.1 1COUNTRY CLUB HILLS 1279 50 8 1 9 0 0 0 9 7.0 5.6 0CRESTWOOD 11955 331 24 2 26 0 6 6 32 2.7 12.7 0CREVE COEUR 17898 278 44 5 49 0 4 4 53 3.0 5.7 3DELLWOOD 5043 196 15 0 15 0 2 2 17 3.4 13.1 4DES PERES 8403 482 36 3 39 1 7 8 47 5.6 #REF! 2EDMUNDSON 837 42 10 0 10 0 1 1 11 13.1 48.2 0ELLISVILLE 9166 163 17 2 19 0 1 1 20 2.2 2.2 1EUREKA 10226 231 21 1 22 1 3 4 26 2.5 7.4 3FERGUSON 21280 1,100 51 3 54 4 5 9 63 3.0 4.3 4FLORDELL HILLS 825 64 8 1 9 0 0 0 9 10.9 122.2 1FLORISSANT 52348 1,222 83 5 88 10 12 22 110 2.1 0.7 51FRONTENAC 3774 47 20 1 21 1 0 1 22 5.8 58.2 3GLENDALE 5947 73 11 0 11 0 3 3 14 2.4 4.3 0GLEN ECHO PARK 161 5 5 0 5 1 2 3 8 49.7 14.6 0GREENDALE 653 5 5 2 7 0 0 0 7 10.7 0.7 0HAZELWOOD 25796 1,088 68 2 70 2 12 14 84 3.3 0.1 14HILLSDALE 1483 127 13 0 13 1 0 1 14 9.4 83.7 16JENNINGS 14765 1,231 32 1 33 0 0 0 33 2.2 3.8 39KINLOCH 299 12 3 1 4 0 0 0 4 13.4 307.8 4KIRKWOOD 27640 796 53 5 58 1 10 11 69 2.5 0.2 1LADUE 8552 152 24 2 26 3 3 6 32 3.7 30.6 2LAKESHIRE 1437 14 4 0 4 0 0 0 4 2.8 38.0 0MANCHESTER 18160 363 31 6 37 0 5 5 42 2.3 0.4 0MAPLEWOOD 8075 542 28 3 31 1 1 2 33 4.1 11.7 26MOLINE ACRES 2451 142 12 0 12 0 1 1 13 5.3 45.2 1NORMANDY 5026 124 15 3 18 0 1 1 19 3.8 7.9 3NORTHWOODS 4242 179 15 3 18 0 10 10 28 6.6 6.9 1OLIVETTE 7765 156 20 3 23 0 1 1 24 3.1 7.8 0OVERLAND 16120 792 40 7 47 4 9 13 60 3.7 3.3 10PAGEDALE 3316 159 12 1 13 0 1 1 14 4.2 60.9 0PASADENA PARK 472 6 15 3 18 0 1 1 19 40.3 8.8 0PINE LAWN 3287 226 20 1 21 0 3 3 24 7.3 0.3 3
Crime in Missouri, 2011 176 Section 10.0
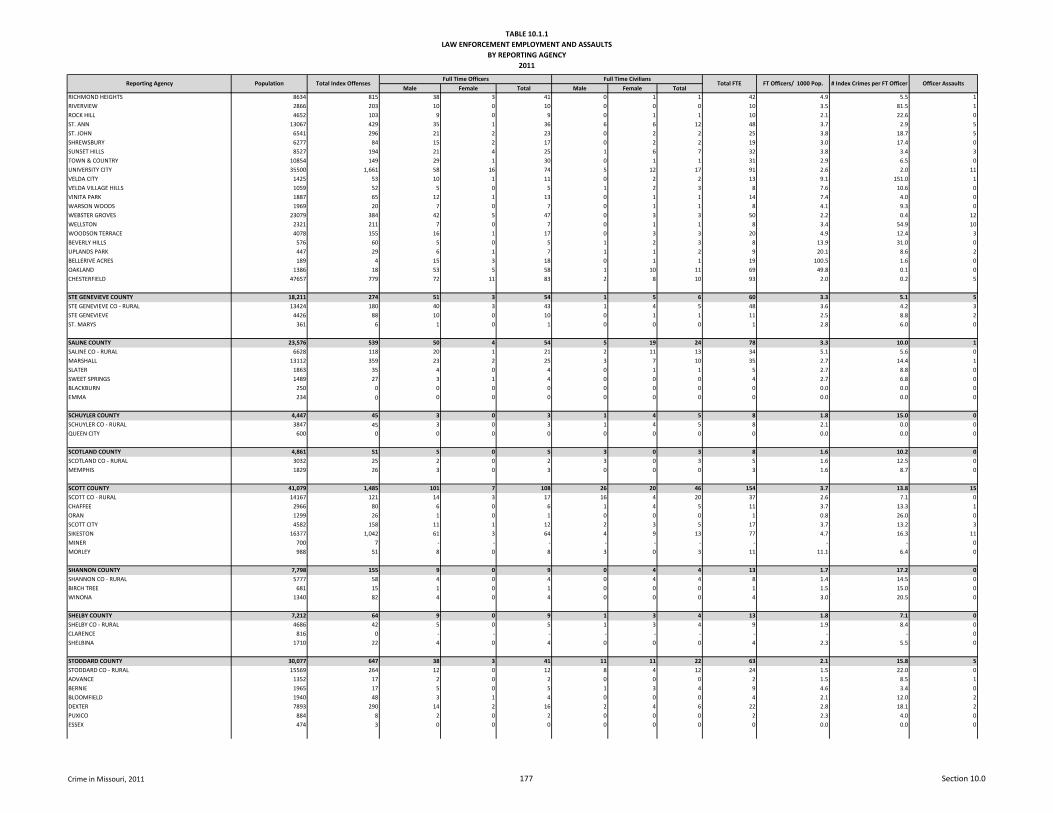
TABLE 10.1.1LAW ENFORCEMENT EMPLOYMENT AND ASSAULTS
BY REPORTING AGENCY2011
Male Female Total Male Female TotalFT Officers/ 1000 Pop. # Index Crimes per FT Officer Officer AssaultsReporting Agency Population Total Index Offenses
Full Time Officers Full Time CiviliansTotal FTE
RICHMOND HEIGHTS 8634 815 38 3 41 0 1 1 42 4.9 5.5 1RIVERVIEW 2866 203 10 0 10 0 0 0 10 3.5 81.5 1ROCK HILL 4652 103 9 0 9 0 1 1 10 2.1 22.6 0ST. ANN 13067 429 35 1 36 6 6 12 48 3.7 2.9 5ST. JOHN 6541 296 21 2 23 0 2 2 25 3.8 18.7 5SHREWSBURY 6277 84 15 2 17 0 2 2 19 3.0 17.4 0SUNSET HILLS 8527 194 21 4 25 1 6 7 32 3.8 3.4 3TOWN & COUNTRY 10854 149 29 1 30 0 1 1 31 2.9 6.5 0UNIVERSITY CITY 35500 1,661 58 16 74 5 12 17 91 2.6 2.0 11VELDA CITY 1425 53 10 1 11 0 2 2 13 9.1 151.0 1VELDA VILLAGE HILLS 1059 52 5 0 5 1 2 3 8 7.6 10.6 0VINITA PARK 1887 65 12 1 13 0 1 1 14 7.4 4.0 0WARSON WOODS 1969 20 7 0 7 0 1 1 8 4.1 9.3 0WEBSTER GROVES 23079 384 42 5 47 0 3 3 50 2.2 0.4 12WELLSTON 2321 211 7 0 7 0 1 1 8 3.4 54.9 10WOODSON TERRACE 4078 155 16 1 17 0 3 3 20 4.9 12.4 3BEVERLY HILLS 576 60 5 0 5 1 2 3 8 13.9 31.0 0UPLANDS PARK 447 29 6 1 7 1 1 2 9 20.1 8.6 2BELLERIVE ACRES 189 4 15 3 18 0 1 1 19 100.5 1.6 0OAKLAND 1386 18 53 5 58 1 10 11 69 49.8 0.1 0CHESTERFIELD 47657 779 72 11 83 2 8 10 93 2.0 0.2 5
STE GENEVIEVE COUNTY 18,211 274 51 3 54 1 5 6 60 3.3 5.1 5STE GENEVIEVE CO - RURAL 13424 180 40 3 43 1 4 5 48 3.6 4.2 3STE GENEVIEVE 4426 88 10 0 10 0 1 1 11 2.5 8.8 2ST. MARYS 361 6 1 0 1 0 0 0 1 2.8 6.0 0
SALINE COUNTY 23,576 539 50 4 54 5 19 24 78 3.3 10.0 1SALINE CO - RURAL 6628 118 20 1 21 2 11 13 34 5.1 5.6 0MARSHALL 13112 359 23 2 25 3 7 10 35 2.7 14.4 1SLATER 1863 35 4 0 4 0 1 1 5 2.7 8.8 0SWEET SPRINGS 1489 27 3 1 4 0 0 0 4 2.7 6.8 0BLACKBURN 250 0 0 0 0 0 0 0 0 0.0 0.0 0EMMA 234 0 0 0 0 0 0 0 0 0.0 0.0 0
SCHUYLER COUNTY 4,447 45 3 0 3 1 4 5 8 1.8 15.0 0SCHUYLER CO - RURAL 3847 45 3 0 3 1 4 5 8 2.1 0.0 0QUEEN CITY 600 0 0 0 0 0 0 0 0 0.0 0.0 0
SCOTLAND COUNTY 4,861 51 5 0 5 3 0 3 8 1.6 10.2 0SCOTLAND CO - RURAL 3032 25 2 0 2 3 0 3 5 1.6 12.5 0MEMPHIS 1829 26 3 0 3 0 0 0 3 1.6 8.7 0
SCOTT COUNTY 41,079 1,485 101 7 108 26 20 46 154 3.7 13.8 15SCOTT CO - RURAL 14167 121 14 3 17 16 4 20 37 2.6 7.1 0CHAFFEE 2966 80 6 0 6 1 4 5 11 3.7 13.3 1ORAN 1299 26 1 0 1 0 0 0 1 0.8 26.0 0SCOTT CITY 4582 158 11 1 12 2 3 5 17 3.7 13.2 3SIKESTON 16377 1,042 61 3 64 4 9 13 77 4.7 16.3 11MINER 700 7 - - - - - - - - - 0MORLEY 988 51 8 0 8 3 0 3 11 11.1 6.4 0
SHANNON COUNTY 7,798 155 9 0 9 0 4 4 13 1.7 17.2 0SHANNON CO - RURAL 5777 58 4 0 4 0 4 4 8 1.4 14.5 0BIRCH TREE 681 15 1 0 1 0 0 0 1 1.5 15.0 0WINONA 1340 82 4 0 4 0 0 0 4 3.0 20.5 0
SHELBY COUNTY 7,212 64 9 0 9 1 3 4 13 1.8 7.1 0SHELBY CO - RURAL 4686 42 5 0 5 1 3 4 9 1.9 8.4 0CLARENCE 816 0 - - - - - - - - - 0SHELBINA 1710 22 4 0 4 0 0 0 4 2.3 5.5 0
STODDARD COUNTY 30,077 647 38 3 41 11 11 22 63 2.1 15.8 5STODDARD CO - RURAL 15569 264 12 0 12 8 4 12 24 1.5 22.0 0ADVANCE 1352 17 2 0 2 0 0 0 2 1.5 8.5 1BERNIE 1965 17 5 0 5 1 3 4 9 4.6 3.4 0BLOOMFIELD 1940 48 3 1 4 0 0 0 4 2.1 12.0 2DEXTER 7893 290 14 2 16 2 4 6 22 2.8 18.1 2PUXICO 884 8 2 0 2 0 0 0 2 2.3 4.0 0ESSEX 474 3 0 0 0 0 0 0 0 0.0 0.0 0
Crime in Missouri, 2011 177 Section 10.0
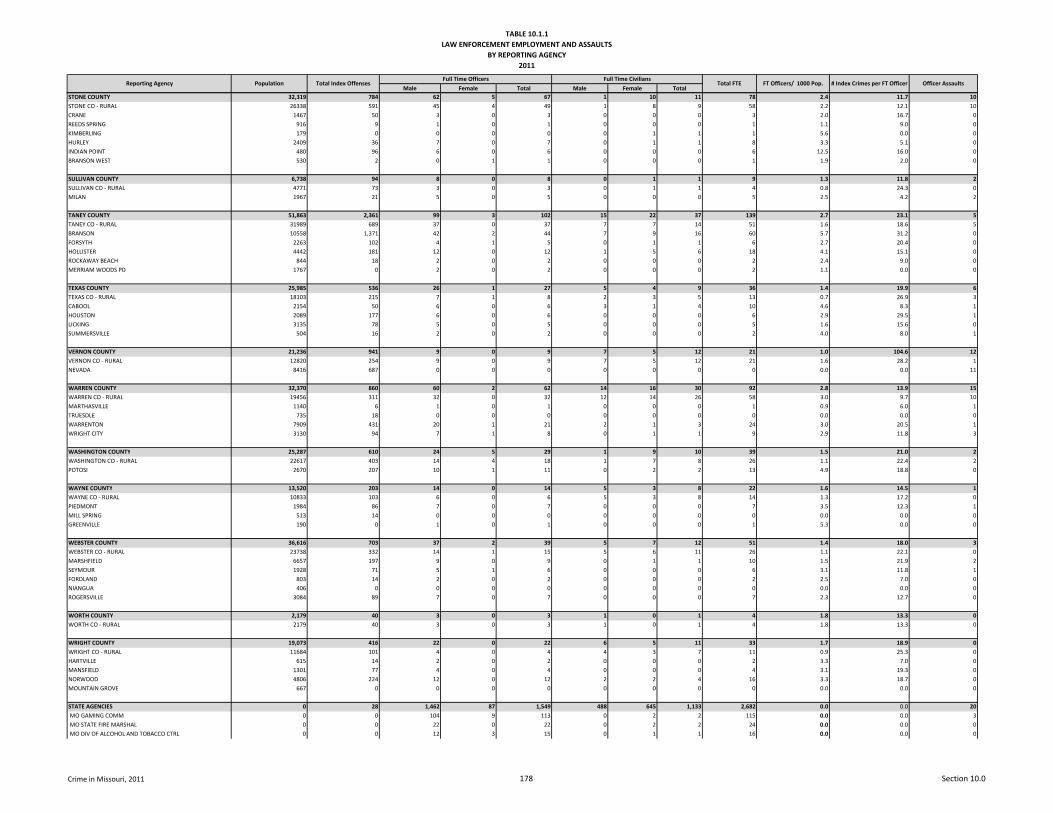
TABLE 10.1.1LAW ENFORCEMENT EMPLOYMENT AND ASSAULTS
BY REPORTING AGENCY2011
Male Female Total Male Female TotalFT Officers/ 1000 Pop. # Index Crimes per FT Officer Officer AssaultsReporting Agency Population Total Index Offenses
Full Time Officers Full Time CiviliansTotal FTE
STONE COUNTY 32,319 784 62 5 67 1 10 11 78 2.4 11.7 10STONE CO - RURAL 26338 591 45 4 49 1 8 9 58 2.2 12.1 10CRANE 1467 50 3 0 3 0 0 0 3 2.0 16.7 0REEDS SPRING 916 9 1 0 1 0 0 0 1 1.1 9.0 0KIMBERLING 179 0 0 0 0 0 1 1 1 5.6 0.0 0HURLEY 2409 36 7 0 7 0 1 1 8 3.3 5.1 0INDIAN POINT 480 96 6 0 6 0 0 0 6 12.5 16.0 0BRANSON WEST 530 2 0 1 1 0 0 0 1 1.9 2.0 0
SULLIVAN COUNTY 6,738 94 8 0 8 0 1 1 9 1.3 11.8 2SULLIVAN CO - RURAL 4771 73 3 0 3 0 1 1 4 0.8 24.3 0MILAN 1967 21 5 0 5 0 0 0 5 2.5 4.2 2
TANEY COUNTY 51,863 2,361 99 3 102 15 22 37 139 2.7 23.1 5TANEY CO - RURAL 31989 689 37 0 37 7 7 14 51 1.6 18.6 5BRANSON 10558 1,371 42 2 44 7 9 16 60 5.7 31.2 0FORSYTH 2263 102 4 1 5 0 1 1 6 2.7 20.4 0HOLLISTER 4442 181 12 0 12 1 5 6 18 4.1 15.1 0ROCKAWAY BEACH 844 18 2 0 2 0 0 0 2 2.4 9.0 0MERRIAM WOODS PD 1767 0 2 0 2 0 0 0 2 1.1 0.0 0
TEXAS COUNTY 25,985 536 26 1 27 5 4 9 36 1.4 19.9 6TEXAS CO - RURAL 18103 215 7 1 8 2 3 5 13 0.7 26.9 3CABOOL 2154 50 6 0 6 3 1 4 10 4.6 8.3 1HOUSTON 2089 177 6 0 6 0 0 0 6 2.9 29.5 1LICKING 3135 78 5 0 5 0 0 0 5 1.6 15.6 0SUMMERSVILLE 504 16 2 0 2 0 0 0 2 4.0 8.0 1
VERNON COUNTY 21,236 941 9 0 9 7 5 12 21 1.0 104.6 12VERNON CO - RURAL 12820 254 9 0 9 7 5 12 21 1.6 28.2 1NEVADA 8416 687 0 0 0 0 0 0 0 0.0 0.0 11
WARREN COUNTY 32,370 860 60 2 62 14 16 30 92 2.8 13.9 15WARREN CO - RURAL 19456 311 32 0 32 12 14 26 58 3.0 9.7 10MARTHASVILLE 1140 6 1 0 1 0 0 0 1 0.9 6.0 1TRUESDLE 735 18 0 0 0 0 0 0 0 0.0 0.0 0WARRENTON 7909 431 20 1 21 2 1 3 24 3.0 20.5 1WRIGHT CITY 3130 94 7 1 8 0 1 1 9 2.9 11.8 3
WASHINGTON COUNTY 25,287 610 24 5 29 1 9 10 39 1.5 21.0 2WASHINGTON CO - RURAL 22617 403 14 4 18 1 7 8 26 1.1 22.4 2POTOSI 2670 207 10 1 11 0 2 2 13 4.9 18.8 0
WAYNE COUNTY 13,520 203 14 0 14 5 3 8 22 1.6 14.5 1WAYNE CO - RURAL 10833 103 6 0 6 5 3 8 14 1.3 17.2 0PIEDMONT 1984 86 7 0 7 0 0 0 7 3.5 12.3 1MILL SPRING 513 14 0 0 0 0 0 0 0 0.0 0.0 0GREENVILLE 190 0 1 0 1 0 0 0 1 5.3 0.0 0
WEBSTER COUNTY 36,616 703 37 2 39 5 7 12 51 1.4 18.0 3WEBSTER CO - RURAL 23738 332 14 1 15 5 6 11 26 1.1 22.1 0MARSHFIELD 6657 197 9 0 9 0 1 1 10 1.5 21.9 2SEYMOUR 1928 71 5 1 6 0 0 0 6 3.1 11.8 1FORDLAND 803 14 2 0 2 0 0 0 2 2.5 7.0 0NIANGUA 406 0 0 0 0 0 0 0 0 0.0 0.0 0ROGERSVILLE 3084 89 7 0 7 0 0 0 7 2.3 12.7 0
WORTH COUNTY 2,179 40 3 0 3 1 0 1 4 1.8 13.3 0WORTH CO - RURAL 2179 40 3 0 3 1 0 1 4 1.8 13.3 0
WRIGHT COUNTY 19,073 416 22 0 22 6 5 11 33 1.7 18.9 0WRIGHT CO - RURAL 11684 101 4 0 4 4 3 7 11 0.9 25.3 0HARTVILLE 615 14 2 0 2 0 0 0 2 3.3 7.0 0MANSFIELD 1301 77 4 0 4 0 0 0 4 3.1 19.3 0NORWOOD 4806 224 12 0 12 2 2 4 16 3.3 18.7 0MOUNTAIN GROVE 667 0 0 0 0 0 0 0 0 0.0 0.0 0
STATE AGENCIES 0 28 1,462 87 1,549 488 645 1,133 2,682 0.0 0.0 20 MO GAMING COMM 0 0 104 9 113 0 2 2 115 0.0 0.0 3 MO STATE FIRE MARSHAL 0 0 22 0 22 0 2 2 24 0.0 0.0 0 MO DIV OF ALCOHOL AND TOBACCO CTRL 0 0 12 3 15 0 1 1 16 0.0 0.0 0
Crime in Missouri, 2011 178 Section 10.0
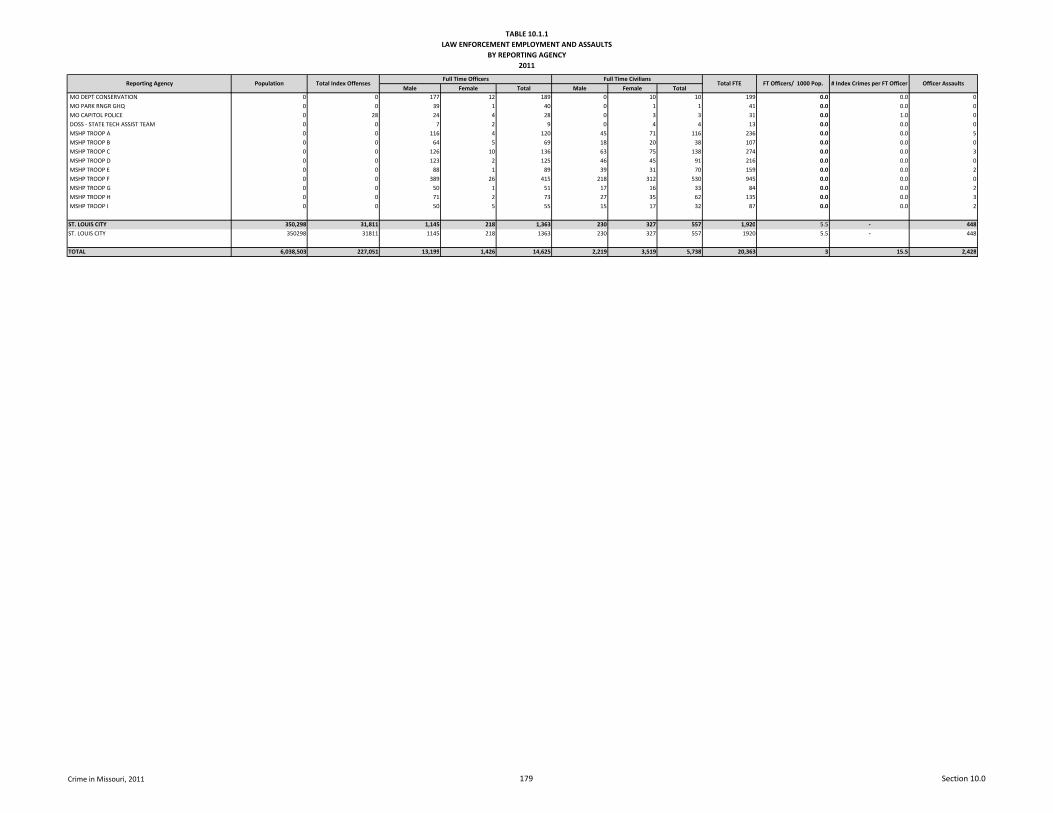
TABLE 10.1.1LAW ENFORCEMENT EMPLOYMENT AND ASSAULTS
BY REPORTING AGENCY2011
Male Female Total Male Female TotalFT Officers/ 1000 Pop. # Index Crimes per FT Officer Officer AssaultsReporting Agency Population Total Index Offenses
Full Time Officers Full Time CiviliansTotal FTE
MO DEPT CONSERVATION 0 0 177 12 189 0 10 10 199 0.0 0.0 0 MO PARK RNGR GHQ 0 0 39 1 40 0 1 1 41 0.0 0.0 0 MO CAPITOL POLICE 0 28 24 4 28 0 3 3 31 0.0 1.0 0 DOSS - STATE TECH ASSIST TEAM 0 0 7 2 9 0 4 4 13 0.0 0.0 0 MSHP TROOP A 0 0 116 4 120 45 71 116 236 0.0 0.0 5 MSHP TROOP B 0 0 64 5 69 18 20 38 107 0.0 0.0 0 MSHP TROOP C 0 0 126 10 136 63 75 138 274 0.0 0.0 3 MSHP TROOP D 0 0 123 2 125 46 45 91 216 0.0 0.0 0 MSHP TROOP E 0 0 88 1 89 39 31 70 159 0.0 0.0 2 MSHP TROOP F 0 0 389 26 415 218 312 530 945 0.0 0.0 0 MSHP TROOP G 0 0 50 1 51 17 16 33 84 0.0 0.0 2 MSHP TROOP H 0 0 71 2 73 27 35 62 135 0.0 0.0 3 MSHP TROOP I 0 0 50 5 55 15 17 32 87 0.0 0.0 2
ST. LOUIS CITY 350,298 31,811 1,145 218 1,363 230 327 557 1,920 5.5 - 448ST. LOUIS CITY 350298 31811 1145 218 1363 230 327 557 1920 5.5 - 448
TOTAL 6,038,503 227,051 13,199 1,426 14,625 2,219 3,519 5,738 20,363 3 15.5 2,428
Crime in Missouri, 2011 179 Section 10.0

181
Crime in Missouri, 2011 Section 11.0
11.0 MISSOURI HATE CRIME ANALYSIS
This section presents data on hate crime activity
in Missouri. Detailed analysis is provided on:
Hate Crime Incidents
Hate Crime Offenses

183
Crime in Missouri, 2011 Section 11.0
11.1 HATE CRIME INCIDENTS
DEFINITION
Hate crime incidents are defined as criminal offenses
committed against persons, property, or society that are
motivated, in whole or in part, by the offender’s bias against
a race, religion, disability, sexual orientation, or ethnicity /
national origin. Victims of hate crimes can be an individual,
business, institution, or society as a whole that are affected
by an offender’s illegal behavior and bias motivation. Eleven
crimes can be affiliated with hate crime: murder, forcible
rape, simple assault, aggravated assault, intimidation,
robbery, burglary, larceny/theft, motor vehicle theft, arson,
and vandalism.
2011 Summary
There were 121 hate crime incidents reported in 2011.
In 2011, 62.8% of all hate crime incidents involved bias motivation aimed towards the victims’ race.
Of all 2011 hate crime
incidents, 66.1% involved crimes against persons. Of these, 22.5% were intimidation offenses.
Of the 137 hate crime
offenders where race was identified that committed hate crimes, 58.9% were white and 24.7% were black.

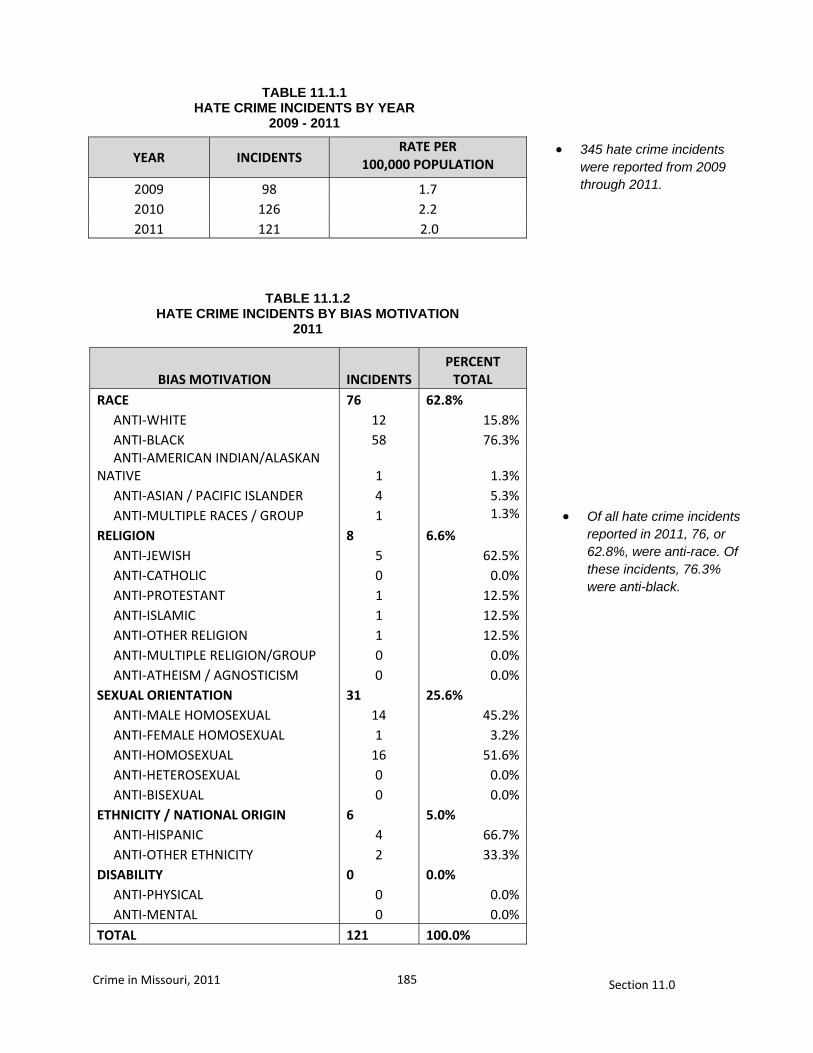
185
Crime in Missouri, 2011 Section 11.0
BIAS MOTIVATION INCIDENTSPERCENT
TOTAL RACE 76 62.8% ANTI-WHITE 12 15.8% ANTI-BLACK 58 76.3% ANTI-AMERICAN INDIAN/ALASKAN NATIVE 1 1.3% ANTI-ASIAN / PACIFIC ISLANDER 4 5.3% ANTI-MULTIPLE RACES / GROUP 1 1.3%
RELIGION 8 6.6% ANTI-JEWISH 5 62.5% ANTI-CATHOLIC 0 0.0% ANTI-PROTESTANT 1 12.5% ANTI-ISLAMIC 1 12.5% ANTI-OTHER RELIGION 1 12.5% ANTI-MULTIPLE RELIGION/GROUP 0 0.0% ANTI-ATHEISM / AGNOSTICISM 0 0.0%SEXUAL ORIENTATION 31 25.6% ANTI-MALE HOMOSEXUAL 14 45.2% ANTI-FEMALE HOMOSEXUAL 1 3.2% ANTI-HOMOSEXUAL 16 51.6% ANTI-HETEROSEXUAL 0 0.0% ANTI-BISEXUAL 0 0.0%ETHNICITY / NATIONAL ORIGIN 6 5.0% ANTI-HISPANIC 4 66.7% ANTI-OTHER ETHNICITY 2 33.3%DISABILITY 0 0.0% ANTI-PHYSICAL 0 0.0% ANTI-MENTAL 0 0.0%TOTAL 121 100.0%
YEAR INCIDENTS RATE PER
100,000 POPULATION
2009 98 1.7 2010 126 2.2 2011 121 2.0
TABLE 11.1.2 HATE CRIME INCIDENTS BY BIAS MOTIVATION
2011
TABLE 11.1.1 HATE CRIME INCIDENTS BY YEAR
2009 - 2011
345 hate crime incidents were reported from 2009 through 2011.
Of all hate crime incidents reported in 2011, 76, or 62.8%, were anti-race. Of these incidents, 76.3% were anti-black.
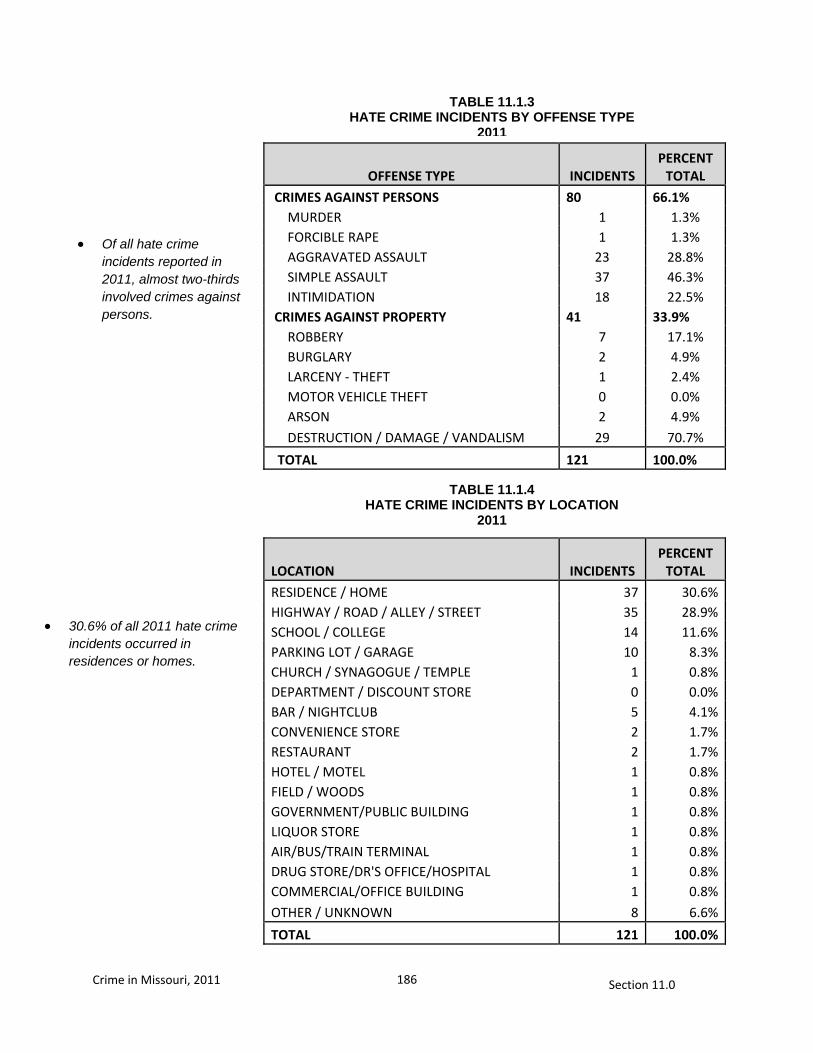
186
Crime in Missouri, 2011 Section 11.0
OFFENSE TYPE INCIDENTS PERCENT
TOTAL
CRIMES AGAINST PERSONS 80 66.1% MURDER 1 1.3% FORCIBLE RAPE 1 1.3% AGGRAVATED ASSAULT 23 28.8% SIMPLE ASSAULT 37 46.3% INTIMIDATION 18 22.5% CRIMES AGAINST PROPERTY 41 33.9% ROBBERY 7 17.1% BURGLARY 2 4.9% LARCENY - THEFT 1 2.4% MOTOR VEHICLE THEFT 0 0.0% ARSON 2 4.9% DESTRUCTION / DAMAGE / VANDALISM 29 70.7%
TOTAL 121 100.0%
LOCATION INCIDENTS PERCENT
TOTAL
RESIDENCE / HOME 37 30.6%HIGHWAY / ROAD / ALLEY / STREET 35 28.9%SCHOOL / COLLEGE 14 11.6%PARKING LOT / GARAGE 10 8.3%CHURCH / SYNAGOGUE / TEMPLE 1 0.8%DEPARTMENT / DISCOUNT STORE 0 0.0%BAR / NIGHTCLUB 5 4.1%CONVENIENCE STORE 2 1.7%RESTAURANT 2 1.7%HOTEL / MOTEL 1 0.8%FIELD / WOODS 1 0.8%GOVERNMENT/PUBLIC BUILDING 1 0.8%LIQUOR STORE 1 0.8%AIR/BUS/TRAIN TERMINAL 1 0.8%DRUG STORE/DR'S OFFICE/HOSPITAL 1 0.8%COMMERCIAL/OFFICE BUILDING 1 0.8%
OTHER / UNKNOWN 8 6.6%
TOTAL 121 100.0%
TABLE 11.1.3 HATE CRIME INCIDENTS BY OFFENSE TYPE
2011
Of all hate crime incidents reported in 2011, almost two-thirds involved crimes against persons.
TABLE 11.1.4 HATE CRIME INCIDENTS BY LOCATION
2011
30.6% of all 2011 hate crime incidents occurred in residences or homes.
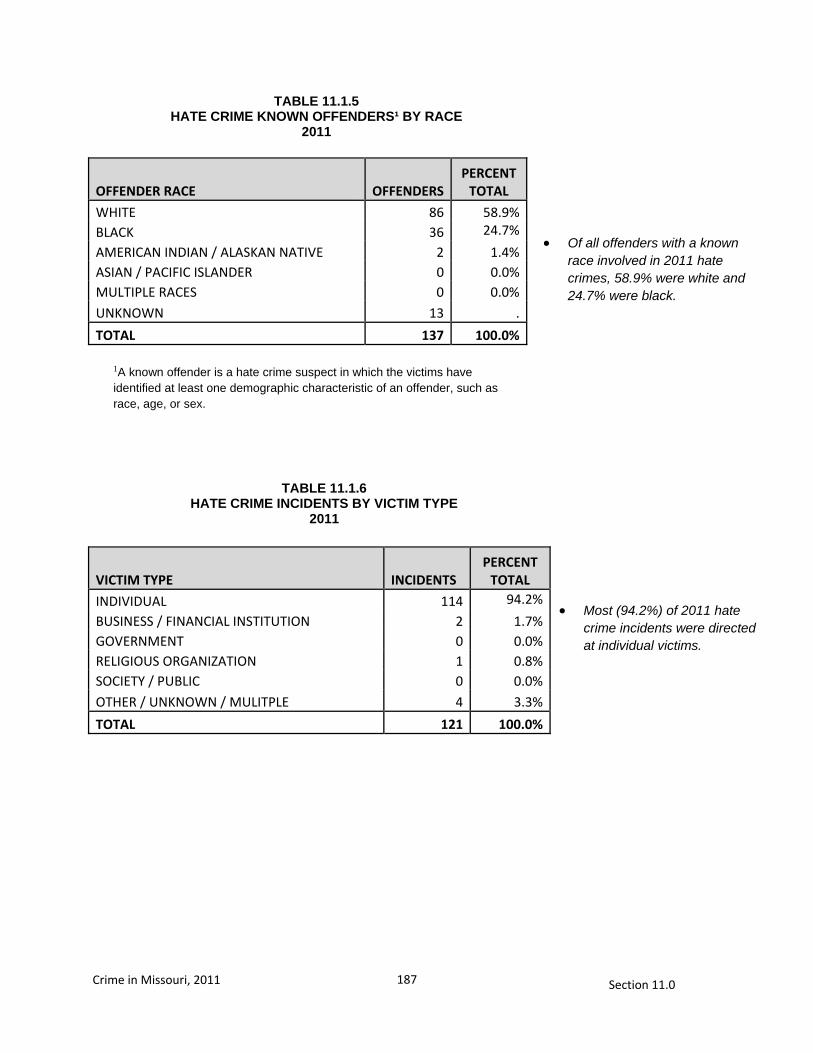
187
Crime in Missouri, 2011 Section 11.0
OFFENDER RACE OFFENDERSPERCENT
TOTAL
WHITE 86 58.9%BLACK 36 24.7%
AMERICAN INDIAN / ALASKAN NATIVE 2 1.4%ASIAN / PACIFIC ISLANDER 0 0.0%MULTIPLE RACES 0 0.0%UNKNOWN 13 .
TOTAL 137 100.0%
VICTIM TYPE INCIDENTS PERCENT
TOTAL
INDIVIDUAL 114 94.2%
BUSINESS / FINANCIAL INSTITUTION 2 1.7%GOVERNMENT 0 0.0%RELIGIOUS ORGANIZATION 1 0.8%SOCIETY / PUBLIC 0 0.0%OTHER / UNKNOWN / MULITPLE 4 3.3%
TOTAL 121 100.0%
1A known offender is a hate crime suspect in which the victims have identified at least one demographic characteristic of an offender, such as race, age, or sex.
TABLE 11.1.5 HATE CRIME KNOWN OFFENDERS¹ BY RACE
2011
TABLE 11.1.6 HATE CRIME INCIDENTS BY VICTIM TYPE
2011
Of all offenders with a known race involved in 2011 hate crimes, 58.9% were white and 24.7% were black.
Most (94.2%) of 2011 hate crime incidents were directed at individual victims.


189
Crime in Missouri, 2011 Glossary
GLOSSARY

191
Crime in Missouri, 2011 Glossary
GLOSSARY
ADULT: A person 18 years of age or older. ARREST: Taking into physical or other legal custody for committing an offense in the local reporting jurisdiction. Arrests for all criminal offenses are scored. Arrests for ordinance violations are included. Arrests for traffic offenses, with the exception of driving under the influence of intoxicants and arrests in connection with negligent manslaughter in traffic accidents, are not scored. Included are those persons arrested but released without being formally charged. ASSAULT: Officer assaults are defined as any unlawful attack by a person on a law enforcement officer who is in the performance of their duty. Officer assaults include those which result in serious injury to the sworn officer, all assaults in which the assailant used a weapon which could have caused serious injury or death, and assaults on officers that were beyond mere verbal abuse or minor resistance to an arrest. ASSAULTS PER 100 OFFICERS RATE: This rate is an indicator of reported officer assault activity standardized by the number of officers employed by the agencies reporting the activity. The officer assault rate formula is: Number of Officer Assaults X 100 Number of Law Enforcement Officers Employed Prior to 2001, assaults per 100 officers were based on estimates from data of agencies reporting a full 12 months of officer assault activity. Since 2001, this rate is based on officer assault activity reported to the Missouri UCR Program. ASSIGNMENT: These categories identify the specific assignment of an officer at the time of the assault. Two-Man Vehicle and One-Man Vehicle pertain to uniformed officers on patrol. Special assignment pertains to those non-uniformed officers functioning as detectives or on special assignment. Other Assignment pertains to those officers assaulted while functioning in some other capacity, such as foot patrol, off-duty, etc. The term "assisted" refers to law enforcement assistance only. CLEARANCE: The resolution of a criminal offense or an assault on an officer by the arrest, charging, and turning over to the court for prosecution one or more persons alleged to have committed a crime or assault on an officer. An offense can also be cleared by exceptional means when the law enforcement agency has: 1) established the identity of the offender, 2) has enough information to support an arrest, charge, and prosecution in court, 3) the exact location of the offender is known so that they could be taken into custody, and 4) there is some reason outside law enforcement control that precludes arresting, charging, and prosecuting the offender, (ex., offender dies).
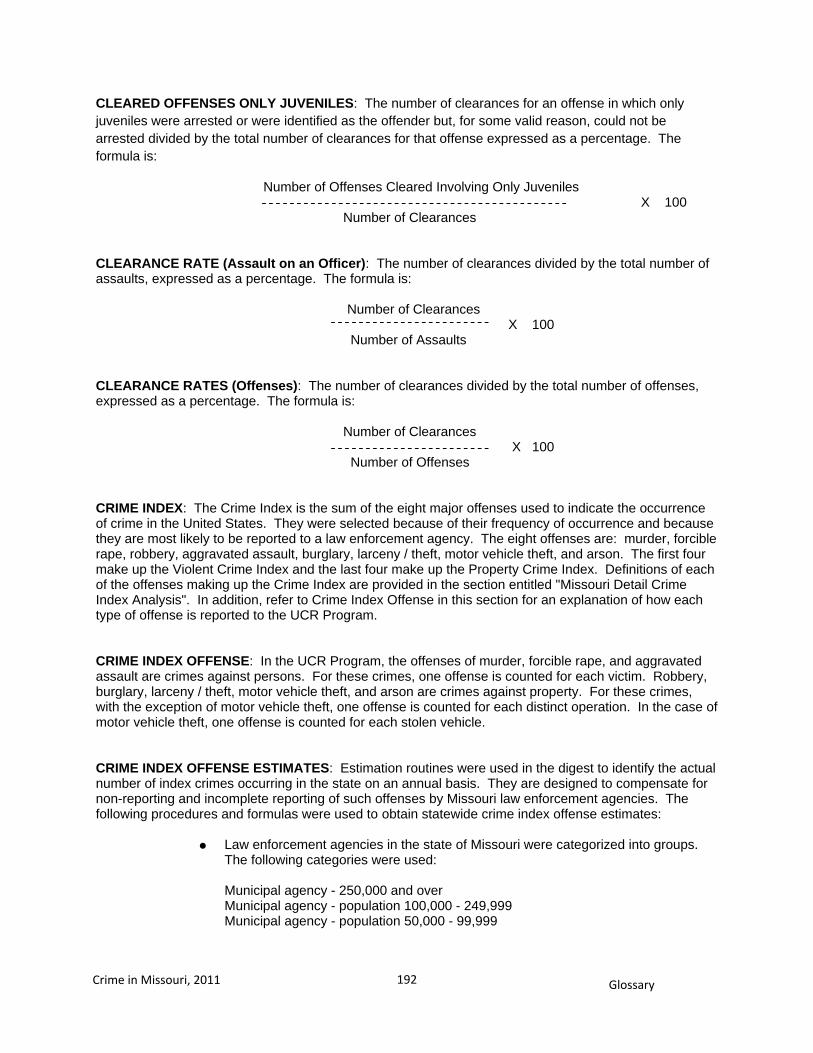
192
Crime in Missouri, 2011 Glossary
CLEARED OFFENSES ONLY JUVENILES: The number of clearances for an offense in which only juveniles were arrested or were identified as the offender but, for some valid reason, could not be arrested divided by the total number of clearances for that offense expressed as a percentage. The formula is:
Number of Offenses Cleared Involving Only Juveniles X 100 Number of Clearances CLEARANCE RATE (Assault on an Officer): The number of clearances divided by the total number of assaults, expressed as a percentage. The formula is: Number of Clearances X 100 Number of Assaults CLEARANCE RATES (Offenses): The number of clearances divided by the total number of offenses, expressed as a percentage. The formula is: Number of Clearances X 100 Number of Offenses
CRIME INDEX: The Crime Index is the sum of the eight major offenses used to indicate the occurrence of crime in the United States. They were selected because of their frequency of occurrence and because they are most likely to be reported to a law enforcement agency. The eight offenses are: murder, forcible rape, robbery, aggravated assault, burglary, larceny / theft, motor vehicle theft, and arson. The first four make up the Violent Crime Index and the last four make up the Property Crime Index. Definitions of each of the offenses making up the Crime Index are provided in the section entitled "Missouri Detail Crime Index Analysis". In addition, refer to Crime Index Offense in this section for an explanation of how each type of offense is reported to the UCR Program. CRIME INDEX OFFENSE: In the UCR Program, the offenses of murder, forcible rape, and aggravated assault are crimes against persons. For these crimes, one offense is counted for each victim. Robbery, burglary, larceny / theft, motor vehicle theft, and arson are crimes against property. For these crimes, with the exception of motor vehicle theft, one offense is counted for each distinct operation. In the case of motor vehicle theft, one offense is counted for each stolen vehicle. CRIME INDEX OFFENSE ESTIMATES: Estimation routines were used in the digest to identify the actual number of index crimes occurring in the state on an annual basis. They are designed to compensate for non-reporting and incomplete reporting of such offenses by Missouri law enforcement agencies. The following procedures and formulas were used to obtain statewide crime index offense estimates: Law enforcement agencies in the state of Missouri were categorized into groups. The following categories were used: Municipal agency - 250,000 and over Municipal agency - population 100,000 - 249,999 Municipal agency - population 50,000 - 99,999
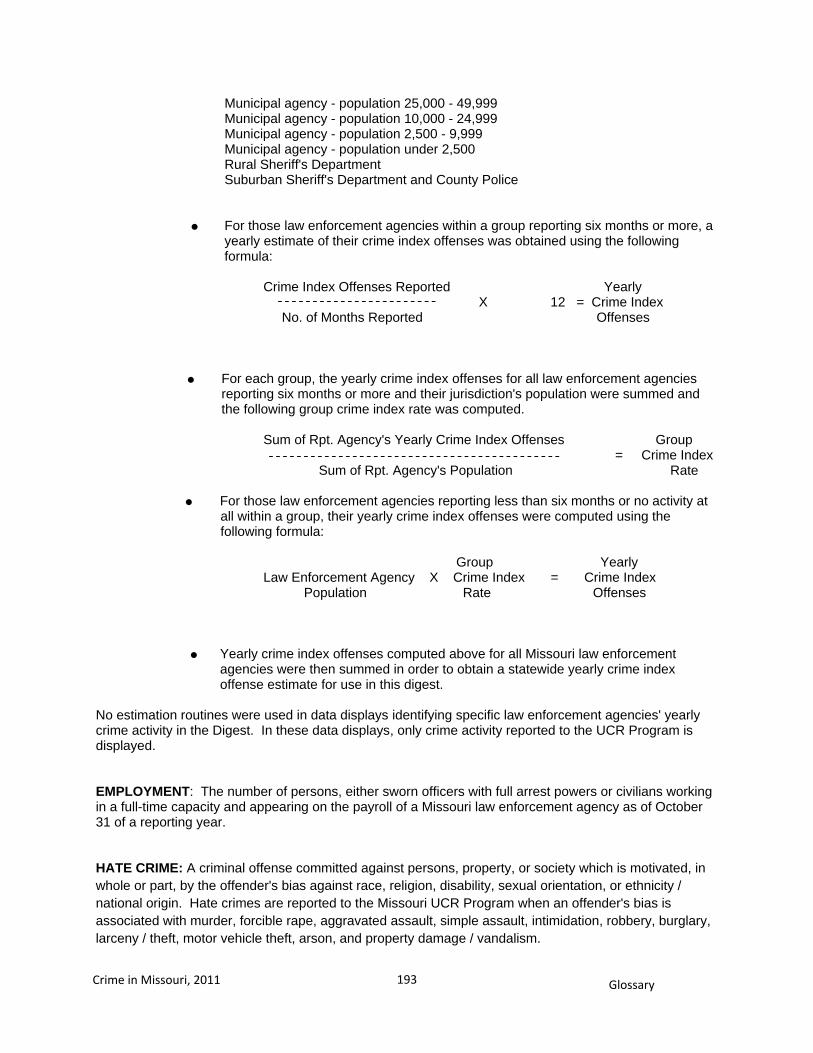
193
Crime in Missouri, 2011 Glossary
Municipal agency - population 25,000 - 49,999 Municipal agency - population 10,000 - 24,999 Municipal agency - population 2,500 - 9,999 Municipal agency - population under 2,500 Rural Sheriff's Department Suburban Sheriff's Department and County Police For those law enforcement agencies within a group reporting six months or more, a yearly estimate of their crime index offenses was obtained using the following formula: Crime Index Offenses Reported Yearly X 12 = Crime Index No. of Months Reported Offenses For each group, the yearly crime index offenses for all law enforcement agencies reporting six months or more and their jurisdiction's population were summed and the following group crime index rate was computed. Sum of Rpt. Agency's Yearly Crime Index Offenses Group = Crime Index Sum of Rpt. Agency's Population Rate For those law enforcement agencies reporting less than six months or no activity at all within a group, their yearly crime index offenses were computed using the following formula: Group Yearly Law Enforcement Agency X Crime Index = Crime Index Population Rate Offenses Yearly crime index offenses computed above for all Missouri law enforcement agencies were then summed in order to obtain a statewide yearly crime index offense estimate for use in this digest. No estimation routines were used in data displays identifying specific law enforcement agencies' yearly crime activity in the Digest. In these data displays, only crime activity reported to the UCR Program is displayed. EMPLOYMENT: The number of persons, either sworn officers with full arrest powers or civilians working in a full-time capacity and appearing on the payroll of a Missouri law enforcement agency as of October 31 of a reporting year. HATE CRIME: A criminal offense committed against persons, property, or society which is motivated, in whole or part, by the offender's bias against race, religion, disability, sexual orientation, or ethnicity / national origin. Hate crimes are reported to the Missouri UCR Program when an offender's bias is associated with murder, forcible rape, aggravated assault, simple assault, intimidation, robbery, burglary, larceny / theft, motor vehicle theft, arson, and property damage / vandalism.
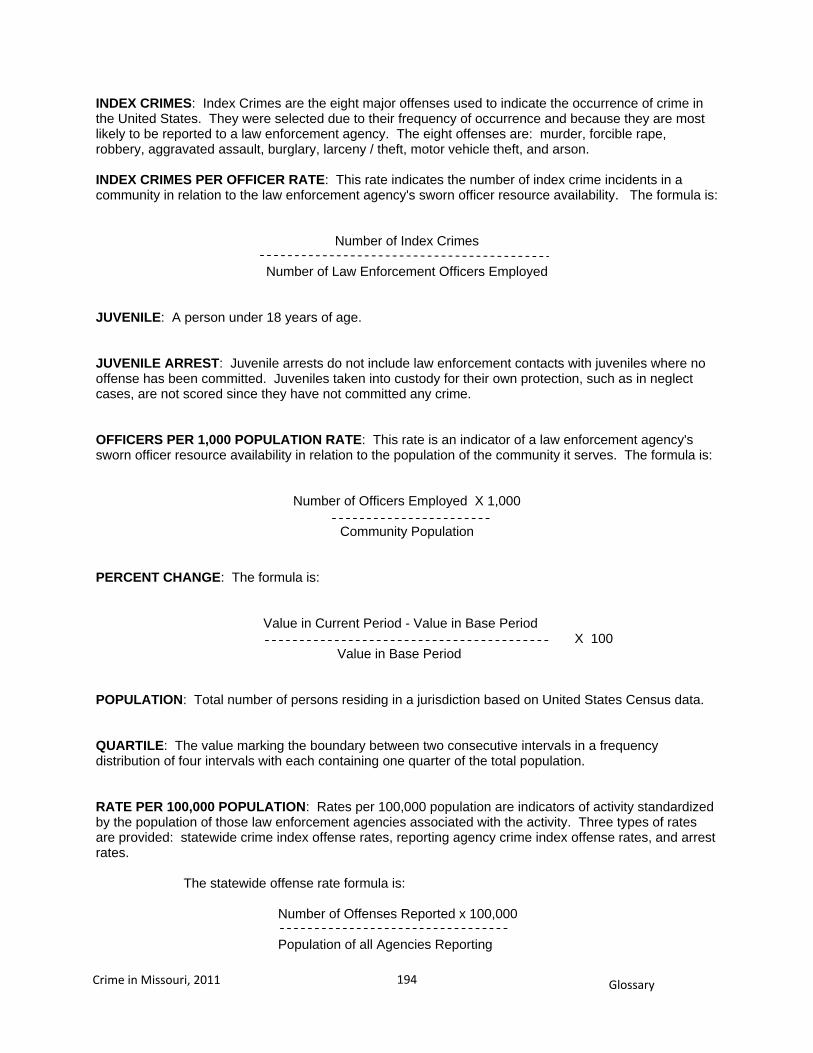
194
Crime in Missouri, 2011 Glossary
INDEX CRIMES: Index Crimes are the eight major offenses used to indicate the occurrence of crime in the United States. They were selected due to their frequency of occurrence and because they are most likely to be reported to a law enforcement agency. The eight offenses are: murder, forcible rape, robbery, aggravated assault, burglary, larceny / theft, motor vehicle theft, and arson. INDEX CRIMES PER OFFICER RATE: This rate indicates the number of index crime incidents in a community in relation to the law enforcement agency's sworn officer resource availability. The formula is:
Number of Index Crimes
Number of Law Enforcement Officers Employed
JUVENILE: A person under 18 years of age. JUVENILE ARREST: Juvenile arrests do not include law enforcement contacts with juveniles where no offense has been committed. Juveniles taken into custody for their own protection, such as in neglect cases, are not scored since they have not committed any crime. OFFICERS PER 1,000 POPULATION RATE: This rate is an indicator of a law enforcement agency's sworn officer resource availability in relation to the population of the community it serves. The formula is:
Number of Officers Employed X 1,000
Community Population
PERCENT CHANGE: The formula is: Value in Current Period - Value in Base Period X 100 Value in Base Period POPULATION: Total number of persons residing in a jurisdiction based on United States Census data. QUARTILE: The value marking the boundary between two consecutive intervals in a frequency distribution of four intervals with each containing one quarter of the total population. RATE PER 100,000 POPULATION: Rates per 100,000 population are indicators of activity standardized by the population of those law enforcement agencies associated with the activity. Three types of rates are provided: statewide crime index offense rates, reporting agency crime index offense rates, and arrest rates. The statewide offense rate formula is: Number of Offenses Reported x 100,000 Population of all Agencies Reporting
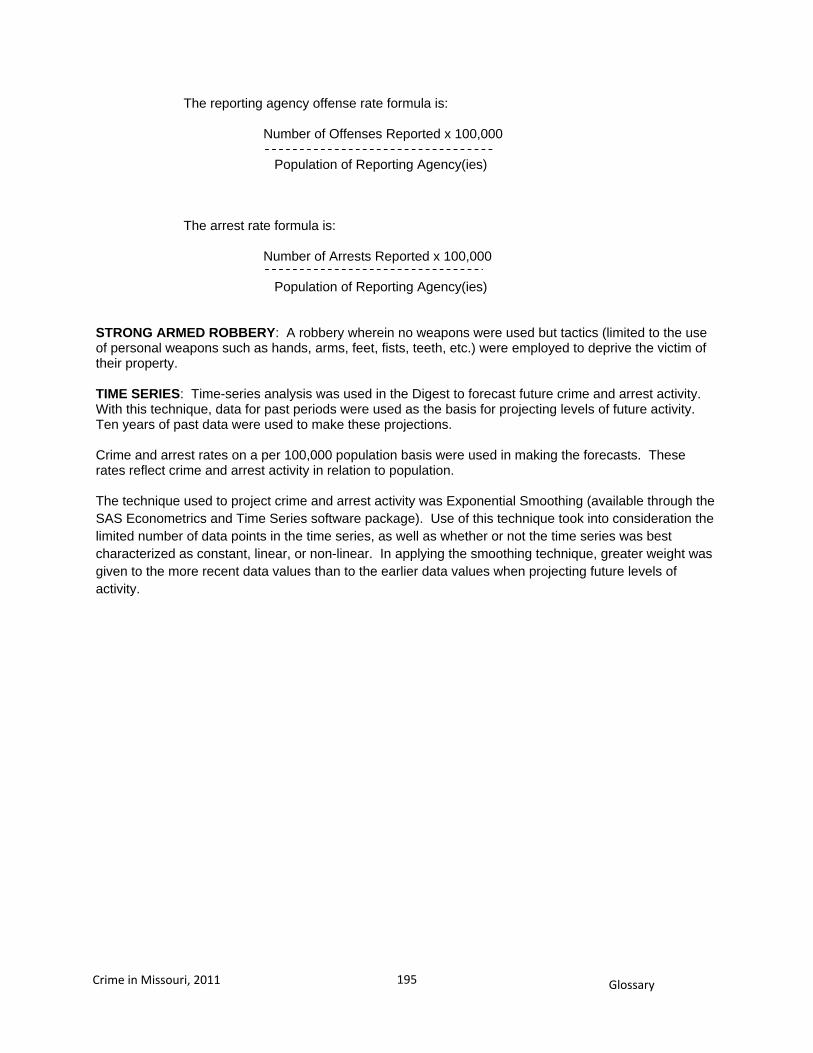
195
Crime in Missouri, 2011 Glossary
The reporting agency offense rate formula is: Number of Offenses Reported x 100,000 Population of Reporting Agency(ies) The arrest rate formula is: Number of Arrests Reported x 100,000 Population of Reporting Agency(ies) STRONG ARMED ROBBERY: A robbery wherein no weapons were used but tactics (limited to the use of personal weapons such as hands, arms, feet, fists, teeth, etc.) were employed to deprive the victim of their property. TIME SERIES: Time-series analysis was used in the Digest to forecast future crime and arrest activity. With this technique, data for past periods were used as the basis for projecting levels of future activity. Ten years of past data were used to make these projections. Crime and arrest rates on a per 100,000 population basis were used in making the forecasts. These rates reflect crime and arrest activity in relation to population. The technique used to project crime and arrest activity was Exponential Smoothing (available through the SAS Econometrics and Time Series software package). Use of this technique took into consideration the limited number of data points in the time series, as well as whether or not the time series was best characterized as constant, linear, or non-linear. In applying the smoothing technique, greater weight was given to the more recent data values than to the earlier data values when projecting future levels of activity.