Embed Size (px)
Citation preview

“The information contained in this report was compiled for the use of the Vermont Agency of
Transportation. Conclusions and recommendations contained herein are based upon the research data
obtained and the expertise of the researchers, and are not necessarily to be construed as Agency policy.
This report does not constitute a standard, specification, or regulation. The Vermont Agency of
Transportation assumes no liability for its contents or the use thereof.”
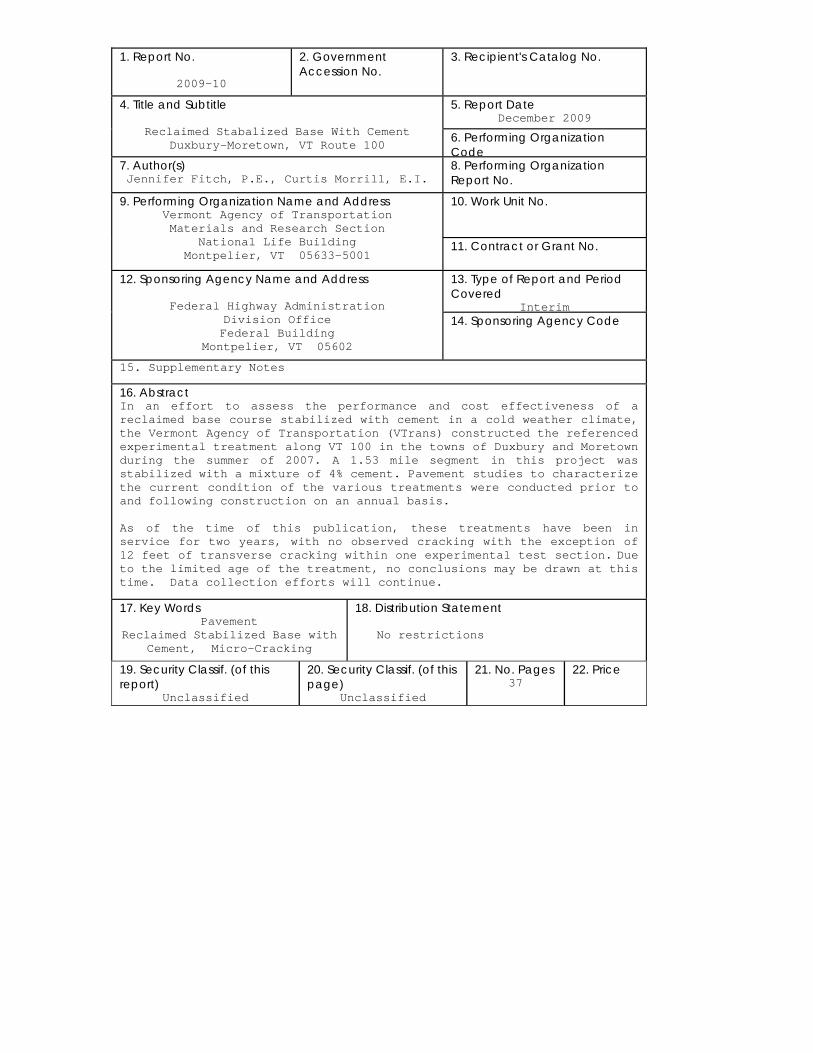
1. Report No.
2009-10
2. Government Accession No.
3. Recipient's Catalog No.
5. Report Date December 2009
4. Title and Subtitle
Reclaimed Stabalized Base With Cement Duxbury-Moretown, VT Route 100
6. Performing Organization Code
7. Author(s) Jennifer Fitch, P.E., Curtis Morrill, E.I.
8. Performing Organization Report No.
10. Work Unit No.
9. Performing Organization Name and Address Vermont Agency of Transportation Materials and Research Section
National Life Building Montpelier, VT 05633-5001
11. Contract or Grant No.
13. Type of Report and Period Covered
Interim
12. Sponsoring Agency Name and Address
Federal Highway Administration Division Office Federal Building
Montpelier, VT 05602
14. Sponsoring Agency Code
15. Supplementary Notes
16. Abstract In an effort to assess the performance and cost effectiveness of a reclaimed base course stabilized with cement in a cold weather climate, the Vermont Agency of Transportation (VTrans) constructed the referenced experimental treatment along VT 100 in the towns of Duxbury and Moretown during the summer of 2007. A 1.53 mile segment in this project was stabilized with a mixture of 4% cement. Pavement studies to characterize the current condition of the various treatments were conducted prior to and following construction on an annual basis. As of the time of this publication, these treatments have been in service for two years, with no observed cracking with the exception of 12 feet of transverse cracking within one experimental test section. Due to the limited age of the treatment, no conclusions may be drawn at this time. Data collection efforts will continue.
17. Key Words Pavement
Reclaimed Stabilized Base with Cement, Micro-Cracking
18. Distribution Statement No restrictions
19. Security Classif. (of this report)
Unclassified
20. Security Classif. (of this page)
Unclassified
21. No. Pages 37
22. Price
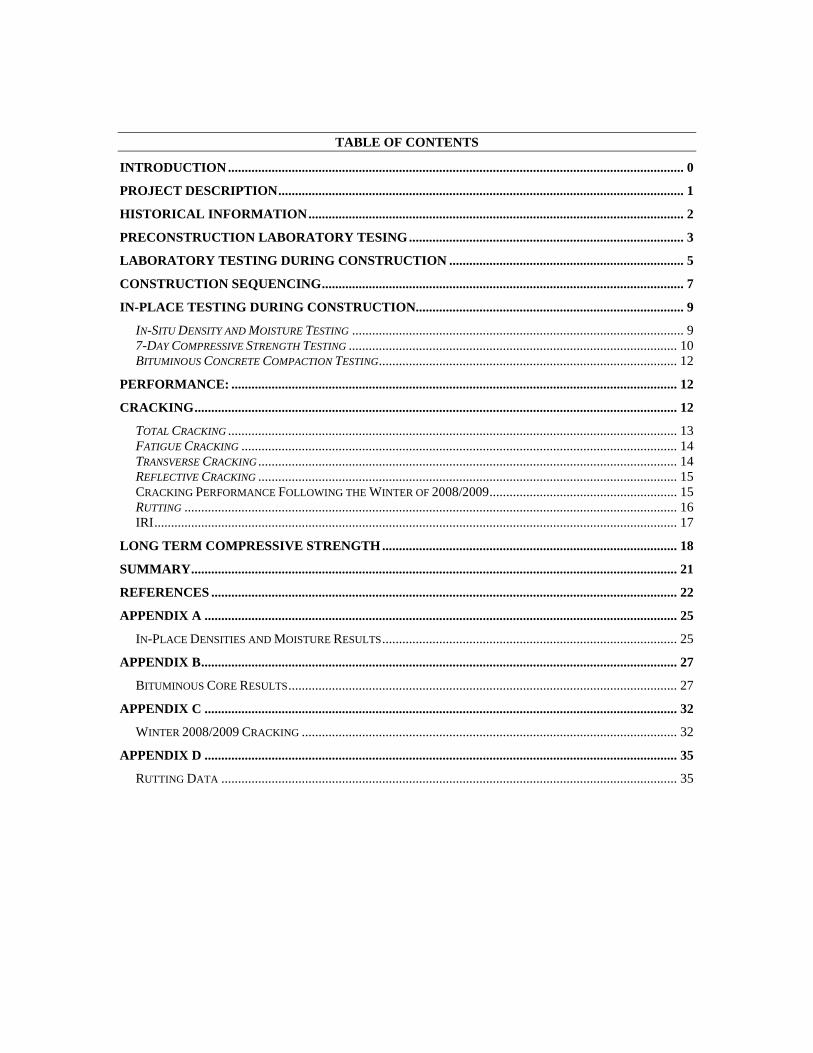
TABLE OF CONTENTS
INTRODUCTION ........................................................................................................................................ 0
PROJECT DESCRIPTION......................................................................................................................... 1
HISTORICAL INFORMATION................................................................................................................ 2
PRECONSTRUCTION LABORATORY TESING.................................................................................. 3
LABORATORY TESTING DURING CONSTRUCTION ...................................................................... 5
CONSTRUCTION SEQUENCING............................................................................................................ 7
IN-PLACE TESTING DURING CONSTRUCTION................................................................................ 9
IN-SITU DENSITY AND MOISTURE TESTING ................................................................................................... 9 7-DAY COMPRESSIVE STRENGTH TESTING .................................................................................................. 10 BITUMINOUS CONCRETE COMPACTION TESTING......................................................................................... 12
PERFORMANCE: ..................................................................................................................................... 12
CRACKING................................................................................................................................................ 12
TOTAL CRACKING ...................................................................................................................................... 13 FATIGUE CRACKING .................................................................................................................................. 14 TRANSVERSE CRACKING ............................................................................................................................. 14 REFLECTIVE CRACKING ............................................................................................................................. 15 CRACKING PERFORMANCE FOLLOWING THE WINTER OF 2008/2009........................................................ 15 RUTTING ................................................................................................................................................... 16 IRI............................................................................................................................................................ 17
LONG TERM COMPRESSIVE STRENGTH ........................................................................................ 18
SUMMARY................................................................................................................................................. 21
REFERENCES ........................................................................................................................................... 22
APPENDIX A ............................................................................................................................................. 25
IN-PLACE DENSITIES AND MOISTURE RESULTS........................................................................................ 25
APPENDIX B.............................................................................................................................................. 27
BITUMINOUS CORE RESULTS.................................................................................................................... 27
APPENDIX C ............................................................................................................................................. 32
WINTER 2008/2009 CRACKING ................................................................................................................ 32
APPENDIX D ............................................................................................................................................. 35
RUTTING DATA ........................................................................................................................................ 35
INTRODUCTION With a growing number of pavements in need of reconstruction or rehabilitation and ever increasing construction costs, State Transportation Agencies are seeking out cost effective long-lasting treatments. Typically, overlays of existing pavements are intended to increase load carrying capacity or to correct surface defects such as cracking. While effective, overlays are unable to address inadequate roadbase strength. An alternate method, known as full depth reclamation (FDR), produces a new base by pulverizing the existing asphalt pavement and mixing it with some underlying subbase materials. This varies from full reconstruction methods which typically involve complete removal and replacement of the existing pavement layer(s) and base course. The use of in-place materials reduces the overall cost of pavement rehabilitation by the preservation of aggregates. Additionally, FDR reduces the impact on the environment and preserves energy in comparison to traditional methods.
In accordance with the Vermont Agency of Transportation’s “2006 Standard Specifications for Construction” the standard FDR process, otherwise known as reclaimed stabilized base (RSB), consists of a series of steps that include pulverizing the existing pavement layers together with the underlying base course material to a standard depth of 6 to 12 inches. Water and additives are blended with the pulverized section, which is then graded and compacted to a specified density. Pulverizing and mixing operations are typically achieved through the use of a road reclaiming machine. Additional structural strength may be achieved by incorporating mechanical, chemical or bituminous stabilizers. This method is used to correct structural deficiencies. In an effort to assess the performance and cost effectiveness of a reclaimed base course stabilized with Portland cement in a cold climate, the Vermont Agency of Transportation (VTrans) constructed the referenced experimental treatment along VT 100 in the towns of Duxbury and Moretown. The section of road was rehabilitated using a full depth reclamation technique during the summer of 2007. This included cold planing to a depth of 3” to 5”, reclaiming the underlying remaining pavement structure and subbase, and the application of a binder and wearing course. Typically, the full depth reclamation, otherwise known as a reclaimed base, is stabilized with water although other stabilizers may be incorporated, including lime and asphalt emulsion. A 1.53 mile segment in this project was stabilized with a mixture of 4% cement. Specifically cement stabilization is intended to increase the stiffness and strength of base thereby reducing pavement deflection, reducing stresses applied to the subbase and form a moisture-resistant base. In addition, the majority of this roadway segment was micro-cracked, a construction practice intended to reduce the severity of shrinkage cracking. Pavement studies to characterize the current condition of the various treatments were conducted prior to and following construction on an annual basis. The following report summarizes the findings from annual data collection efforts and subsequent recommendations.
0
PROJECT DESCRIPTION The reconstruction project occurred along a 6.981 mile segment of VT Route 100 in the towns of Moretown and Duxbury, project STP 2507 (1) S. The project limits began in the town of Moretown at mile marker (MM) 0.472 and extended northerly through Duxbury to MM 1.231 in the town of Moretown. According to the construction plans, the work consisted of cold planing and reclaiming sections and resurfacing of existing highway with a combination of leveling, base, and wearing courses, new pavement markings, guardrail installation, drainage improvements and other incidental items. In an effort to maintain consistency in the ratios of the pulverized subbase and existing pavement layers, cold plane depths varied from MM 0.47 in Moretown through MM 5.53 in Duxbury. All other aspects of the rehabilitation treatment remained the same including the depth of the reclaim, thickness of the binder and wearing courses, and lane and shoulder widths of 11 and 3 feet, respectively. Reclaiming consisted of pulverizing and mixing 4” of existing pavement and 4” of subbase. The reclaimed layer in the experimental section from MM 4.00 to MM 5.53 in Duxbury was stabilized with cement and micro-cracked prior to the application of the binder course. A small portion of the project from MM 5.53 in Duxbury through MM 1.23 in Moretown only received a leveling course, binder and wearing course. A summary of the treatments is provided in Table 1:
Moretown-Duxbury-Moretown Roadway Reconstruction Treatment Summary Mile Marker
Town To From Treatment Moretown 0.47 1.15 cold plane 5", reclaim 8", 2 1/2" Type IIS, 3 1/2" Type IIIS Duxbury 0.00 0.14 cold plane 5", reclaim 8", 2 1/2" Type IIS, 3 1/2" Type IIIS Duxbury 0.17 4.00 cold plane 3", reclaim 8", 2 1/2" Type IIS, 3 1/2" Type IIIS Duxbury 4.00 5.53 cold plane 4", reclaim 8" w Cement, Micro-crack, 2 1/2" Type IIS, 3 1/2" Type IIIS Duxbury 5.53 6.22 Level, 3 1/2" Type IIIS
Moretown 1.15 1.23 Level, 3 1/2" Type IIIS
Table 1 – Treatment Summary A total of six test sites (TSs) were established throughout the length of the project including two within the control section, a reclaimed section stabilized with water only, and four within the experimental section consisting of the reclaimed section stabilized with both cement and water. Test sites were identified for an annual examination of rutting and cracking prior to and following construction.
Test Section
ID Treatment Type Town Begin MM
End MM
TS1 RSB Duxbury 1.80 1.81 TS2 RSB Duxbury 3.17 3.18 TS3 RSB With Cement Duxbury 4.39 4.40 TS4 RSB With Cement Duxbury 4.68 4.69 TS5 RSB With Cement Duxbury 4.96 4.97 TS6 RSB With Cement Duxbury 5.36 5.37
1
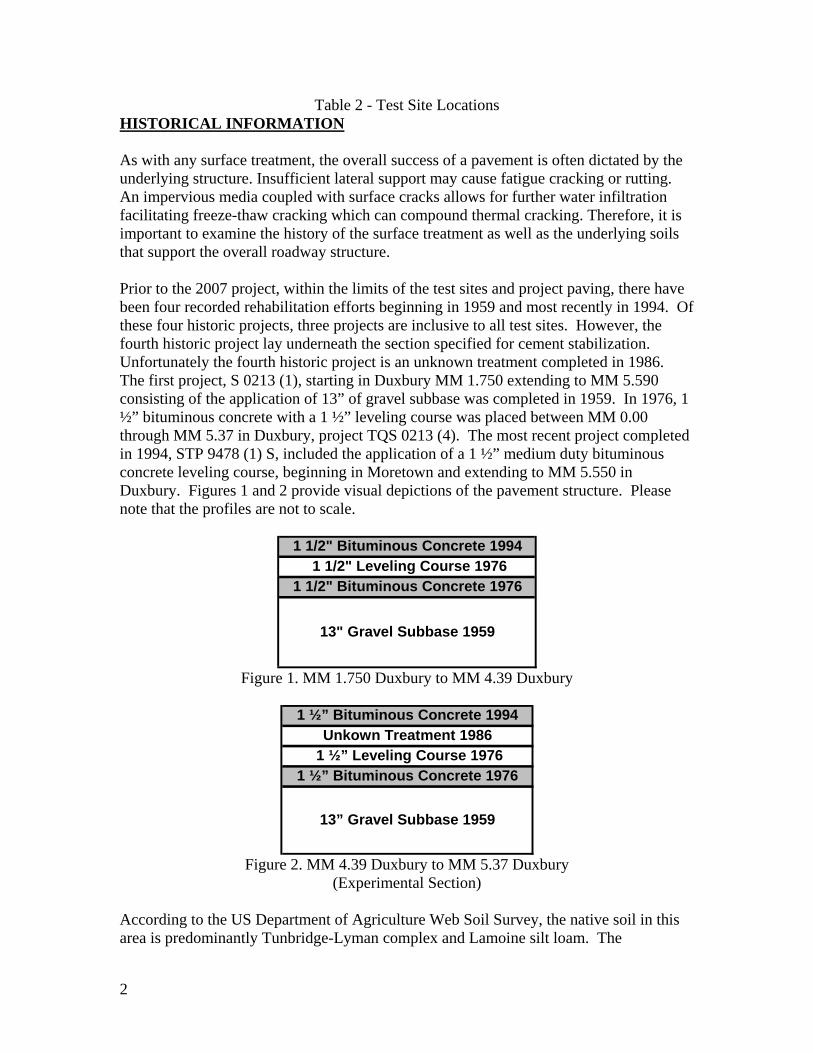
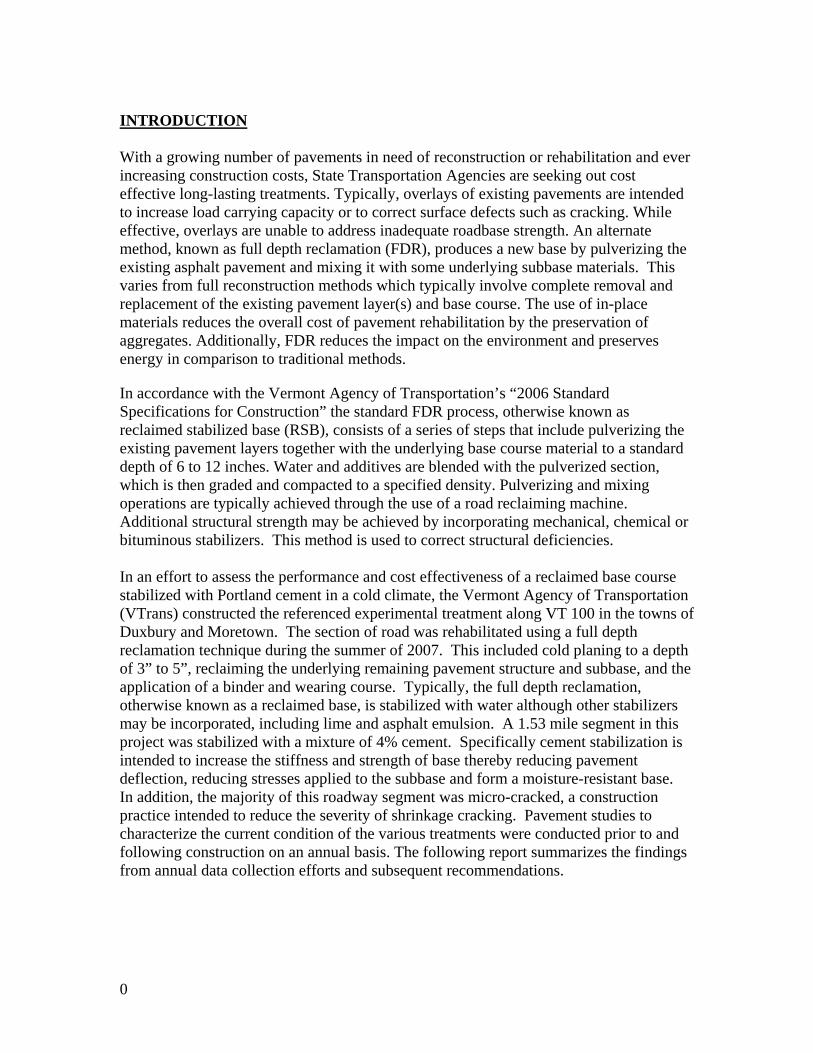
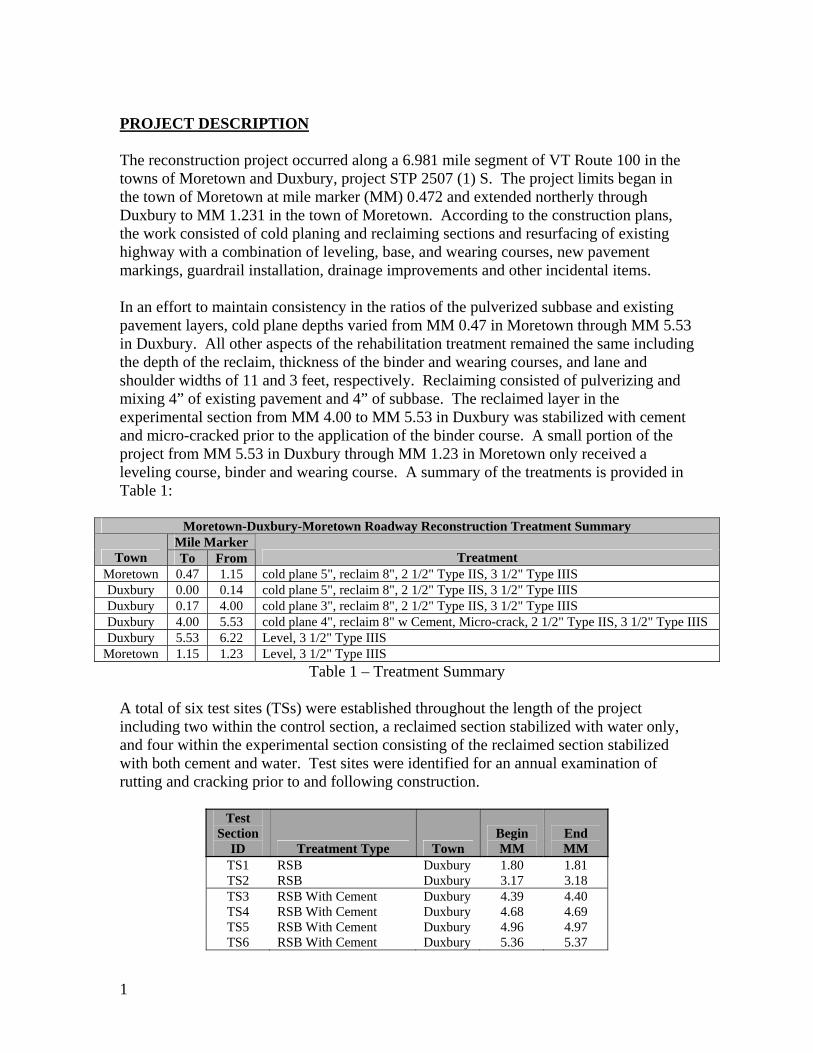
Table 2 - Test Site Locations HISTORICAL INFORMATION As with any surface treatment, the overall success of a pavement is often dictated by the underlying structure. Insufficient lateral support may cause fatigue cracking or rutting. An impervious media coupled with surface cracks allows for further water infiltration facilitating freeze-thaw cracking which can compound thermal cracking. Therefore, it is important to examine the history of the surface treatment as well as the underlying soils that support the overall roadway structure. Prior to the 2007 project, within the limits of the test sites and project paving, there have been four recorded rehabilitation efforts beginning in 1959 and most recently in 1994. Of these four historic projects, three projects are inclusive to all test sites. However, the fourth historic project lay underneath the section specified for cement stabilization. Unfortunately the fourth historic project is an unknown treatment completed in 1986. The first project, S 0213 (1), starting in Duxbury MM 1.750 extending to MM 5.590 consisting of the application of 13” of gravel subbase was completed in 1959. In 1976, 1 ½” bituminous concrete with a 1 ½” leveling course was placed between MM 0.00 through MM 5.37 in Duxbury, project TQS 0213 (4). The most recent project completed in 1994, STP 9478 (1) S, included the application of a 1 ½” medium duty bituminous concrete leveling course, beginning in Moretown and extending to MM 5.550 in Duxbury. Figures 1 and 2 provide visual depictions of the pavement structure. Please note that the profiles are not to scale.
1 1/2" Bituminous Concrete 1994 1 1/2" Leveling Course 1976
1 1/2" Bituminous Concrete 1976
13" Gravel Subbase 1959
Figure 1. MM 1.750 Duxbury to MM 4.39 Duxbury
1 ½” Bituminous Concrete 1994
Unkown Treatment 1986 1 ½” Leveling Course 1976
1 ½” Bituminous Concrete 1976
13” Gravel Subbase 1959
Figure 2. MM 4.39 Duxbury to MM 5.37 Duxbury
(Experimental Section) According to the US Department of Agriculture Web Soil Survey, the native soil in this area is predominantly Tunbridge-Lyman complex and Lamoine silt loam. The
2
Tunbridge-Lyman complex is very rocky and well drained while the Lamoine silt loam is poorly drained. The Lamoine silt loam begins at test site 4, MM 4.680 in Duxbury, and continues through the remainder of the experimental roadway segment, while the Tunbridge-Lyman complex encompasses test sites 1 through 3. Table 3 shows the soil types per test site.
Overlay Soil Type Soil Number Frost Action
TS1 Tunbridge-Lyman Complex 72D Moderate RSB
TS2 Tunbridge-Lyman Complex 72E Moderate TS3 Tunbridge-Lyman Complex 72D Moderate TS4 Lamoine Silt Loam 44C High TS5 Lamoine Silt Loam 44C High
RSB w/ cement
TS6 Lamoine Silt Loam 44C High Table 3. Soil Types
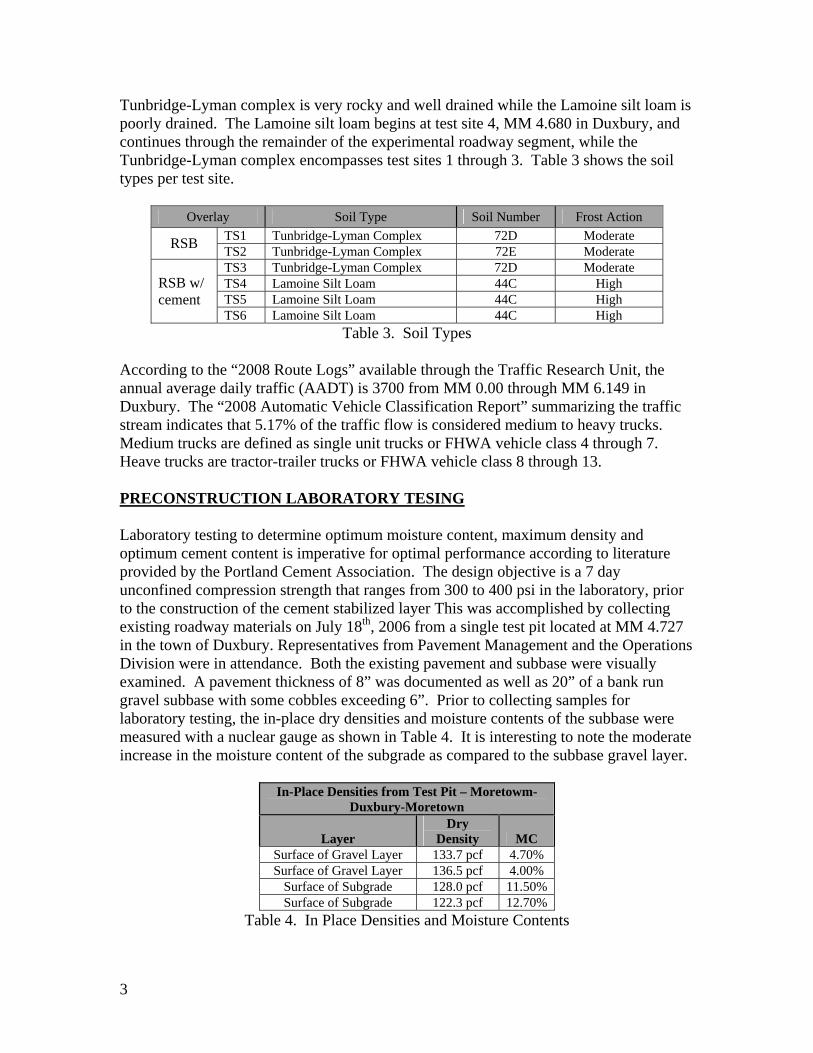
According to the “2008 Route Logs” available through the Traffic Research Unit, the annual average daily traffic (AADT) is 3700 from MM 0.00 through MM 6.149 in Duxbury. The “2008 Automatic Vehicle Classification Report” summarizing the traffic stream indicates that 5.17% of the traffic flow is considered medium to heavy trucks. Medium trucks are defined as single unit trucks or FHWA vehicle class 4 through 7. Heave trucks are tractor-trailer trucks or FHWA vehicle class 8 through 13. PRECONSTRUCTION LABORATORY TESING Laboratory testing to determine optimum moisture content, maximum density and optimum cement content is imperative for optimal performance according to literature provided by the Portland Cement Association. The design objective is a 7 day unconfined compression strength that ranges from 300 to 400 psi in the laboratory, prior to the construction of the cement stabilized layer This was accomplished by collecting existing roadway materials on July 18th, 2006 from a single test pit located at MM 4.727 in the town of Duxbury. Representatives from Pavement Management and the Operations Division were in attendance. Both the existing pavement and subbase were visually examined. A pavement thickness of 8” was documented as well as 20” of a bank run gravel subbase with some cobbles exceeding 6”. Prior to collecting samples for laboratory testing, the in-place dry densities and moisture contents of the subbase were measured with a nuclear gauge as shown in Table 4. It is interesting to note the moderate increase in the moisture content of the subgrade as compared to the subbase gravel layer.
In-Place Densities from Test Pit – Moretowm- Duxbury-Moretown
Layer Dry
Density MC Surface of Gravel Layer 133.7 pcf 4.70% Surface of Gravel Layer 136.5 pcf 4.00%
Surface of Subgrade 128.0 pcf 11.50% Surface of Subgrade 122.3 pcf 12.70%
Table 4. In Place Densities and Moisture Contents
3
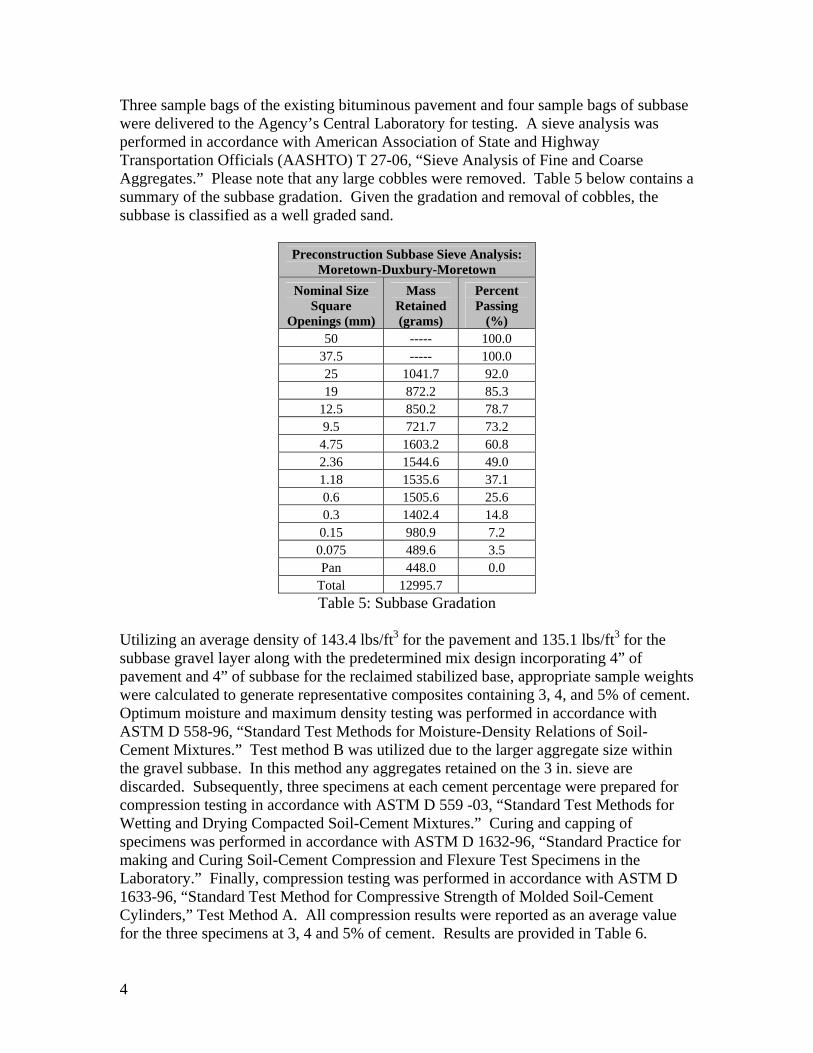
Three sample bags of the existing bituminous pavement and four sample bags of subbase were delivered to the Agency’s Central Laboratory for testing. A sieve analysis was performed in accordance with American Association of State and Highway Transportation Officials (AASHTO) T 27-06, “Sieve Analysis of Fine and Coarse Aggregates.” Please note that any large cobbles were removed. Table 5 below contains a summary of the subbase gradation. Given the gradation and removal of cobbles, the subbase is classified as a well graded sand.
Preconstruction Subbase Sieve Analysis: Moretown-Duxbury-Moretown
Nominal Size Square
Openings (mm)
Mass Retained (grams)
Percent Passing
(%) 50 ----- 100.0
37.5 ----- 100.0 25 1041.7 92.0 19 872.2 85.3
12.5 850.2 78.7 9.5 721.7 73.2
4.75 1603.2 60.8 2.36 1544.6 49.0 1.18 1535.6 37.1 0.6 1505.6 25.6 0.3 1402.4 14.8
0.15 980.9 7.2 0.075 489.6 3.5 Pan 448.0 0.0
Total 12995.7 Table 5: Subbase Gradation
Utilizing an average density of 143.4 lbs/ft3 for the pavement and 135.1 lbs/ft3 for the subbase gravel layer along with the predetermined mix design incorporating 4” of pavement and 4” of subbase for the reclaimed stabilized base, appropriate sample weights were calculated to generate representative composites containing 3, 4, and 5% of cement. Optimum moisture and maximum density testing was performed in accordance with ASTM D 558-96, “Standard Test Methods for Moisture-Density Relations of Soil-Cement Mixtures.” Test method B was utilized due to the larger aggregate size within the gravel subbase. In this method any aggregates retained on the 3 in. sieve are discarded. Subsequently, three specimens at each cement percentage were prepared for compression testing in accordance with ASTM D 559 -03, “Standard Test Methods for Wetting and Drying Compacted Soil-Cement Mixtures.” Curing and capping of specimens was performed in accordance with ASTM D 1632-96, “Standard Practice for making and Curing Soil-Cement Compression and Flexure Test Specimens in the Laboratory.” Finally, compression testing was performed in accordance with ASTM D 1633-96, “Standard Test Method for Compressive Strength of Molded Soil-Cement Cylinders,” Test Method A. All compression results were reported as an average value for the three specimens at 3, 4 and 5% of cement. Results are provided in Table 6.
4
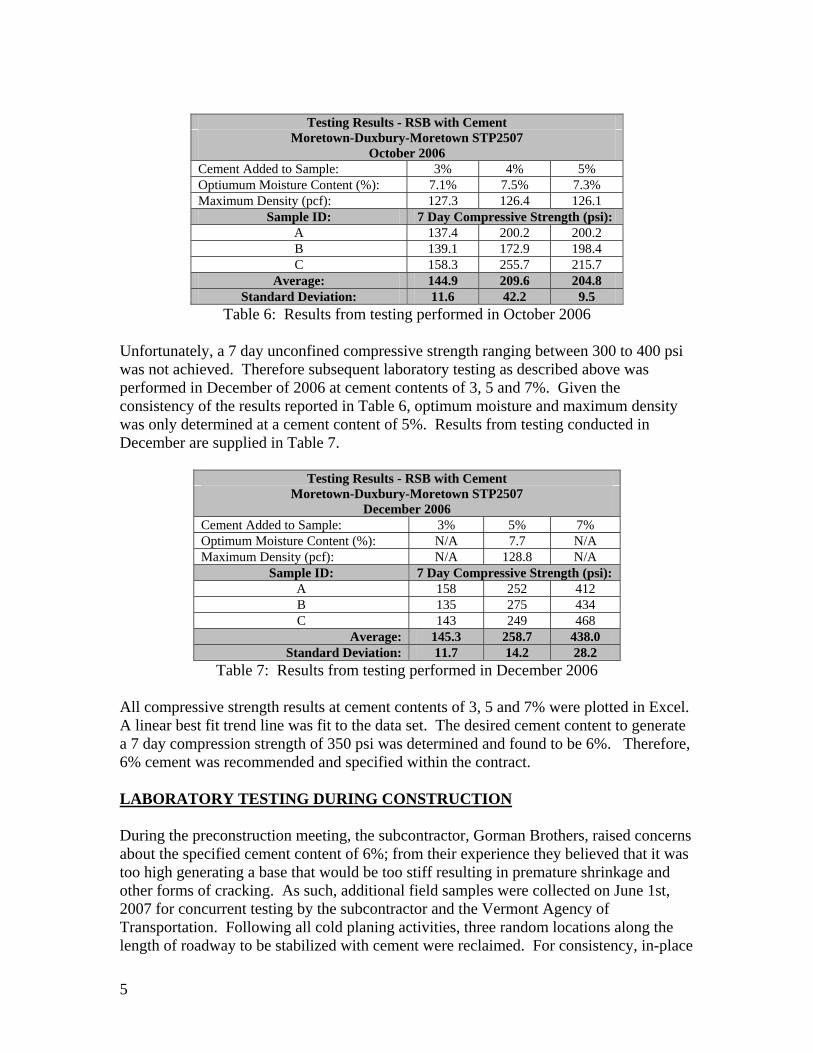
Testing Results - RSB with Cement
Moretown-Duxbury-Moretown STP2507 October 2006
Cement Added to Sample: 3% 4% 5% Optiumum Moisture Content (%): 7.1% 7.5% 7.3% Maximum Density (pcf): 127.3 126.4 126.1
Sample ID: 7 Day Compressive Strength (psi): A 137.4 200.2 200.2 B 139.1 172.9 198.4 C 158.3 255.7 215.7
Average: 144.9 209.6 204.8 Standard Deviation: 11.6 42.2 9.5
Table 6: Results from testing performed in October 2006
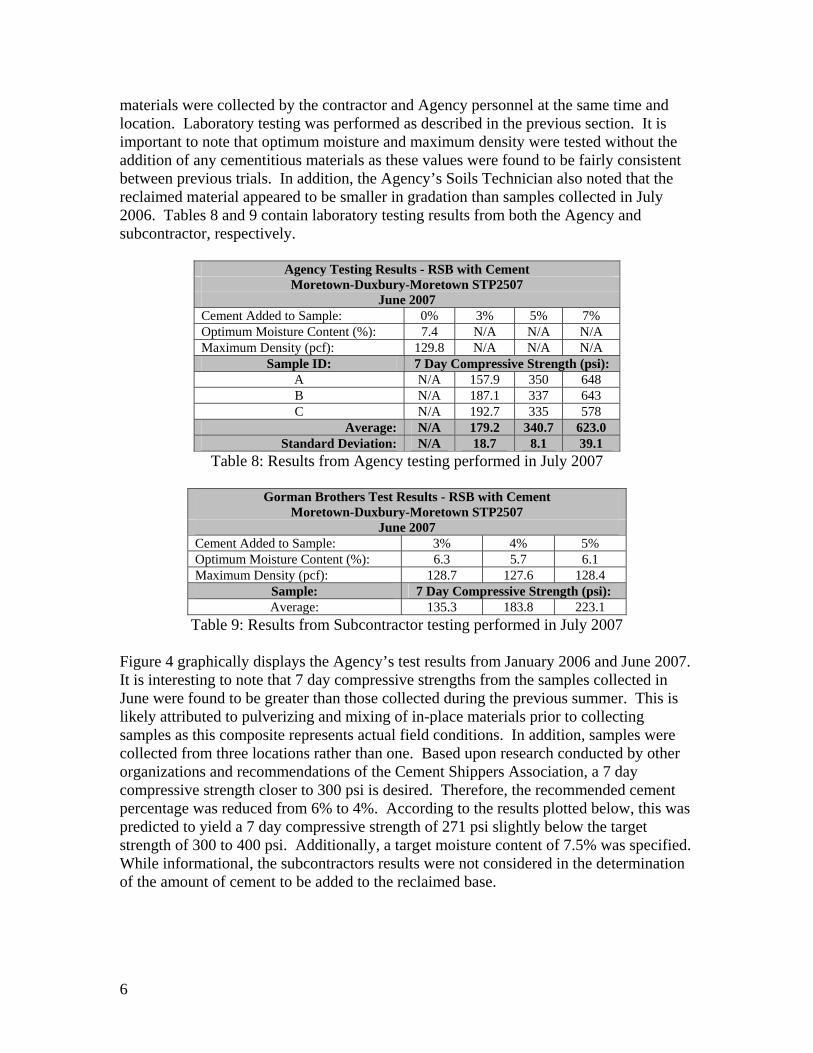
Unfortunately, a 7 day unconfined compressive strength ranging between 300 to 400 psi was not achieved. Therefore subsequent laboratory testing as described above was performed in December of 2006 at cement contents of 3, 5 and 7%. Given the consistency of the results reported in Table 6, optimum moisture and maximum density was only determined at a cement content of 5%. Results from testing conducted in December are supplied in Table 7.
Testing Results - RSB with Cement Moretown-Duxbury-Moretown STP2507
December 2006 Cement Added to Sample: 3% 5% 7% Optimum Moisture Content (%): N/A 7.7 N/A Maximum Density (pcf): N/A 128.8 N/A
Sample ID: 7 Day Compressive Strength (psi): A 158 252 412 B 135 275 434 C 143 249 468
Average: 145.3 258.7 438.0 Standard Deviation: 11.7 14.2 28.2
Table 7: Results from testing performed in December 2006
All compressive strength results at cement contents of 3, 5 and 7% were plotted in Excel. A linear best fit trend line was fit to the data set. The desired cement content to generate a 7 day compression strength of 350 psi was determined and found to be 6%. Therefore, 6% cement was recommended and specified within the contract. LABORATORY TESTING DURING CONSTRUCTION During the preconstruction meeting, the subcontractor, Gorman Brothers, raised concerns about the specified cement content of 6%; from their experience they believed that it was too high generating a base that would be too stiff resulting in premature shrinkage and other forms of cracking. As such, additional field samples were collected on June 1st, 2007 for concurrent testing by the subcontractor and the Vermont Agency of Transportation. Following all cold planing activities, three random locations along the length of roadway to be stabilized with cement were reclaimed. For consistency, in-place
5
materials were collected by the contractor and Agency personnel at the same time and location. Laboratory testing was performed as described in the previous section. It is important to note that optimum moisture and maximum density were tested without the addition of any cementitious materials as these values were found to be fairly consistent between previous trials. In addition, the Agency’s Soils Technician also noted that the reclaimed material appeared to be smaller in gradation than samples collected in July 2006. Tables 8 and 9 contain laboratory testing results from both the Agency and subcontractor, respectively.
Agency Testing Results - RSB with Cement Moretown-Duxbury-Moretown STP2507
June 2007 Cement Added to Sample: 0% 3% 5% 7% Optimum Moisture Content (%): 7.4 N/A N/A N/A Maximum Density (pcf): 129.8 N/A N/A N/A
Sample ID: 7 Day Compressive Strength (psi): A N/A 157.9 350 648 B N/A 187.1 337 643 C N/A 192.7 335 578
Average: N/A 179.2 340.7 623.0 Standard Deviation: N/A 18.7 8.1 39.1
Table 8: Results from Agency testing performed in July 2007
Gorman Brothers Test Results - RSB with Cement Moretown-Duxbury-Moretown STP2507
June 2007 Cement Added to Sample: 3% 4% 5% Optimum Moisture Content (%): 6.3 5.7 6.1 Maximum Density (pcf): 128.7 127.6 128.4
Sample: 7 Day Compressive Strength (psi): Average: 135.3 183.8 223.1
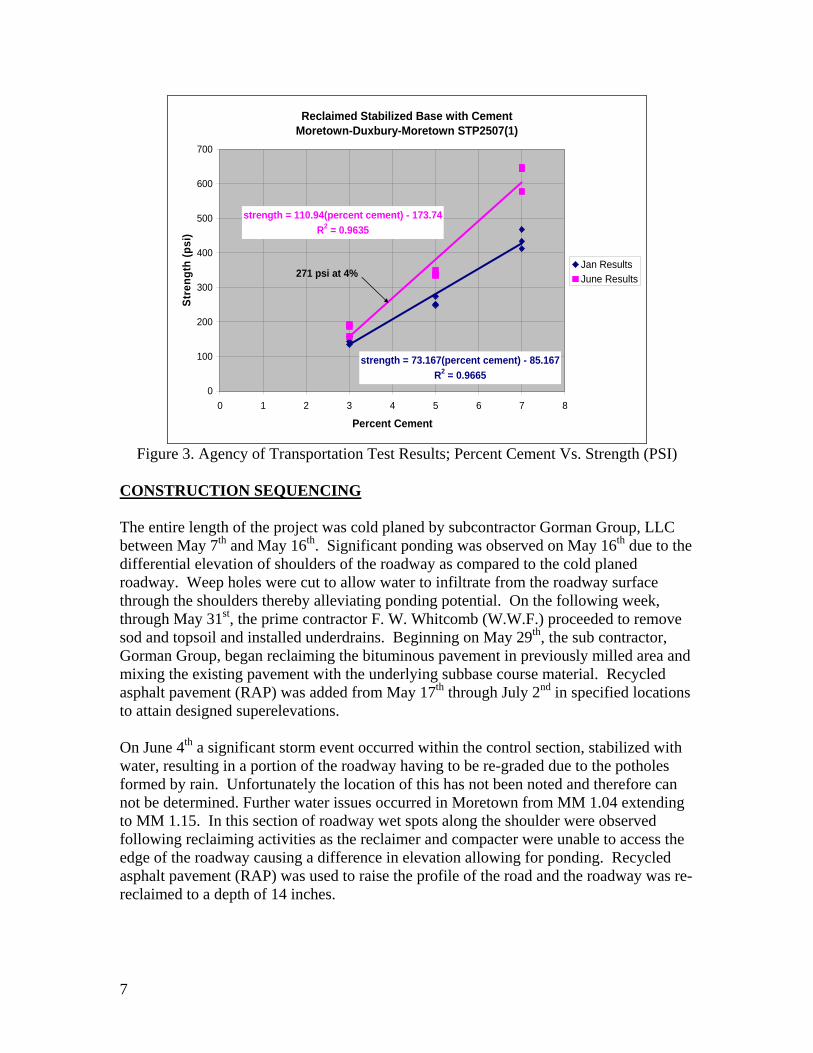
Table 9: Results from Subcontractor testing performed in July 2007 Figure 4 graphically displays the Agency’s test results from January 2006 and June 2007. It is interesting to note that 7 day compressive strengths from the samples collected in June were found to be greater than those collected during the previous summer. This is likely attributed to pulverizing and mixing of in-place materials prior to collecting samples as this composite represents actual field conditions. In addition, samples were collected from three locations rather than one. Based upon research conducted by other organizations and recommendations of the Cement Shippers Association, a 7 day compressive strength closer to 300 psi is desired. Therefore, the recommended cement percentage was reduced from 6% to 4%. According to the results plotted below, this was predicted to yield a 7 day compressive strength of 271 psi slightly below the target strength of 300 to 400 psi. Additionally, a target moisture content of 7.5% was specified. While informational, the subcontractors results were not considered in the determination of the amount of cement to be added to the reclaimed base.
6
Reclaimed Stabilized Base with Cement Moretown-Duxbury-Moretown STP2507(1)
strength = 73.167(percent cement) - 85.167
R2 = 0.9665
strength = 110.94(percent cement) - 173.74
R2 = 0.9635
0
100
200
300
400
500
600
700
0 1 2 3 4 5 6 7 8
Percent Cement
Str
en
gth
(p
si)
Jan ResultsJune Results271 psi at 4%
Figure 3. Agency of Transportation Test Results; Percent Cement Vs. Strength (PSI)
CONSTRUCTION SEQUENCING The entire length of the project was cold planed by subcontractor Gorman Group, LLC between May 7th and May 16th. Significant ponding was observed on May 16th due to the differential elevation of shoulders of the roadway as compared to the cold planed roadway. Weep holes were cut to allow water to infiltrate from the roadway surface through the shoulders thereby alleviating ponding potential. On the following week, through May 31st, the prime contractor F. W. Whitcomb (W.W.F.) proceeded to remove sod and topsoil and installed underdrains. Beginning on May 29th, the sub contractor, Gorman Group, began reclaiming the bituminous pavement in previously milled area and mixing the existing pavement with the underlying subbase course material. Recycled asphalt pavement (RAP) was added from May 17th through July 2nd in specified locations to attain designed superelevations. On June 4th a significant storm event occurred within the control section, stabilized with water, resulting in a portion of the roadway having to be re-graded due to the potholes formed by rain. Unfortunately the location of this has not been noted and therefore can not be determined. Further water issues occurred in Moretown from MM 1.04 extending to MM 1.15. In this section of roadway wet spots along the shoulder were observed following reclaiming activities as the reclaimer and compacter were unable to access the edge of the roadway causing a difference in elevation allowing for ponding. Recycled asphalt pavement (RAP) was used to raise the profile of the road and the roadway was re-reclaimed to a depth of 14 inches.
7
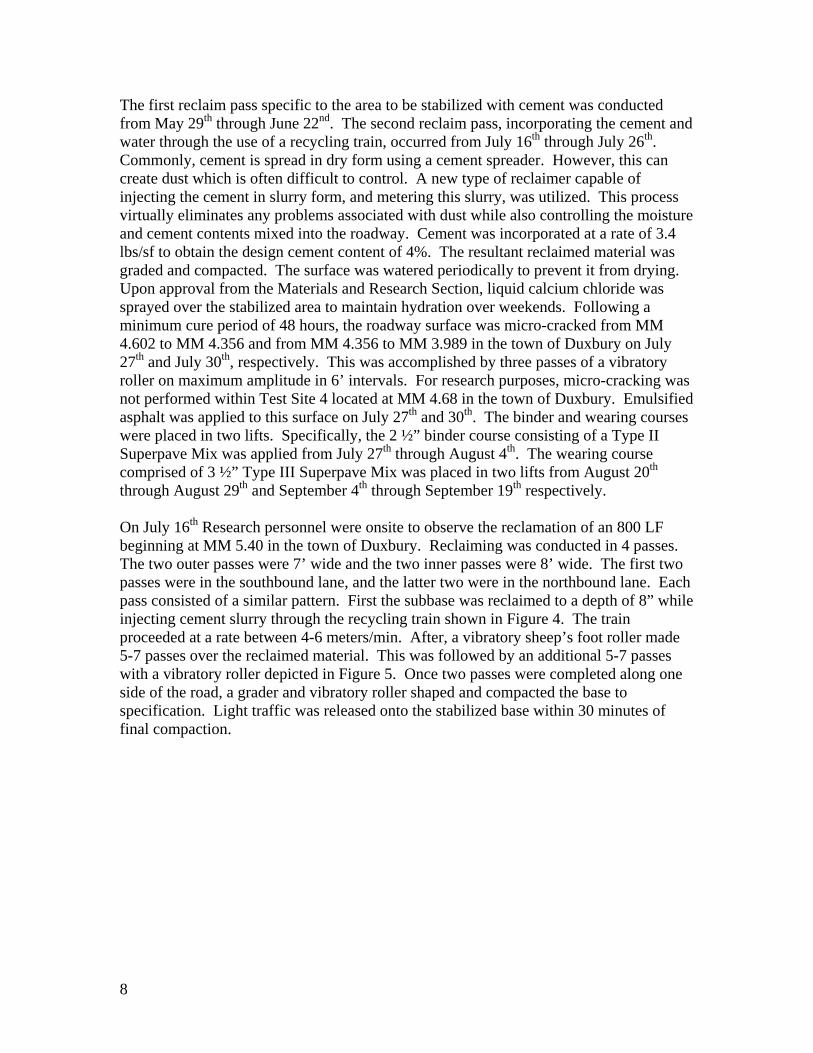
The first reclaim pass specific to the area to be stabilized with cement was conducted from May 29th through June 22nd. The second reclaim pass, incorporating the cement and water through the use of a recycling train, occurred from July 16th through July 26th. Commonly, cement is spread in dry form using a cement spreader. However, this can create dust which is often difficult to control. A new type of reclaimer capable of injecting the cement in slurry form, and metering this slurry, was utilized. This process virtually eliminates any problems associated with dust while also controlling the moisture and cement contents mixed into the roadway. Cement was incorporated at a rate of 3.4 lbs/sf to obtain the design cement content of 4%. The resultant reclaimed material was graded and compacted. The surface was watered periodically to prevent it from drying. Upon approval from the Materials and Research Section, liquid calcium chloride was sprayed over the stabilized area to maintain hydration over weekends. Following a minimum cure period of 48 hours, the roadway surface was micro-cracked from MM 4.602 to MM 4.356 and from MM 4.356 to MM 3.989 in the town of Duxbury on July 27th and July 30th, respectively. This was accomplished by three passes of a vibratory roller on maximum amplitude in 6’ intervals. For research purposes, micro-cracking was not performed within Test Site 4 located at MM 4.68 in the town of Duxbury. Emulsified asphalt was applied to this surface on July 27th and 30th. The binder and wearing courses were placed in two lifts. Specifically, the 2 ½” binder course consisting of a Type II Superpave Mix was applied from July 27th through August 4th. The wearing course comprised of 3 ½” Type III Superpave Mix was placed in two lifts from August 20th through August 29th and September 4th through September 19th respectively. On July 16th Research personnel were onsite to observe the reclamation of an 800 LF beginning at MM 5.40 in the town of Duxbury. Reclaiming was conducted in 4 passes. The two outer passes were 7’ wide and the two inner passes were 8’ wide. The first two passes were in the southbound lane, and the latter two were in the northbound lane. Each pass consisted of a similar pattern. First the subbase was reclaimed to a depth of 8” while injecting cement slurry through the recycling train shown in Figure 4. The train proceeded at a rate between 4-6 meters/min. After, a vibratory sheep’s foot roller made 5-7 passes over the reclaimed material. This was followed by an additional 5-7 passes with a vibratory roller depicted in Figure 5. Once two passes were completed along one side of the road, a grader and vibratory roller shaped and compacted the base to specification. Light traffic was released onto the stabilized base within 30 minutes of final compaction.
8
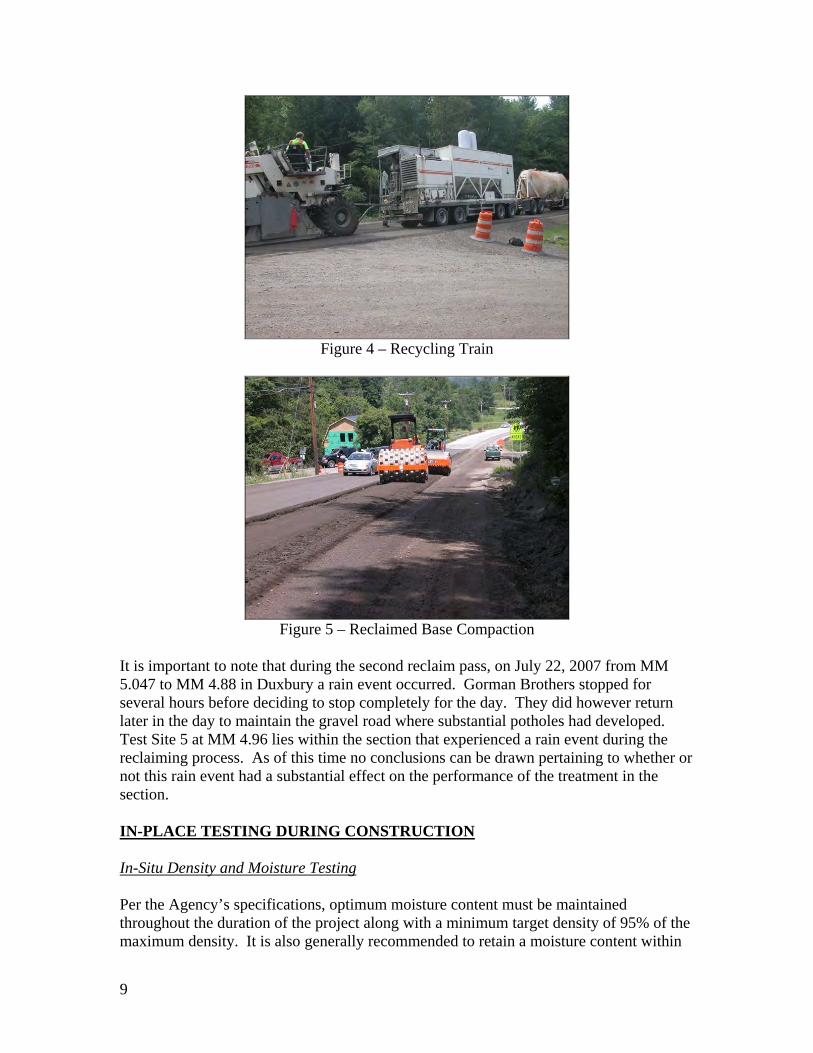
Figure 4 – Recycling Train
Figure 5 – Reclaimed Base Compaction
It is important to note that during the second reclaim pass, on July 22, 2007 from MM 5.047 to MM 4.88 in Duxbury a rain event occurred. Gorman Brothers stopped for several hours before deciding to stop completely for the day. They did however return later in the day to maintain the gravel road where substantial potholes had developed. Test Site 5 at MM 4.96 lies within the section that experienced a rain event during the reclaiming process. As of this time no conclusions can be drawn pertaining to whether or not this rain event had a substantial effect on the performance of the treatment in the section. IN-PLACE TESTING DURING CONSTRUCTION In-Situ Density and Moisture Testing Per the Agency’s specifications, optimum moisture content must be maintained throughout the duration of the project along with a minimum target density of 95% of the maximum density. It is also generally recommended to retain a moisture content within
9
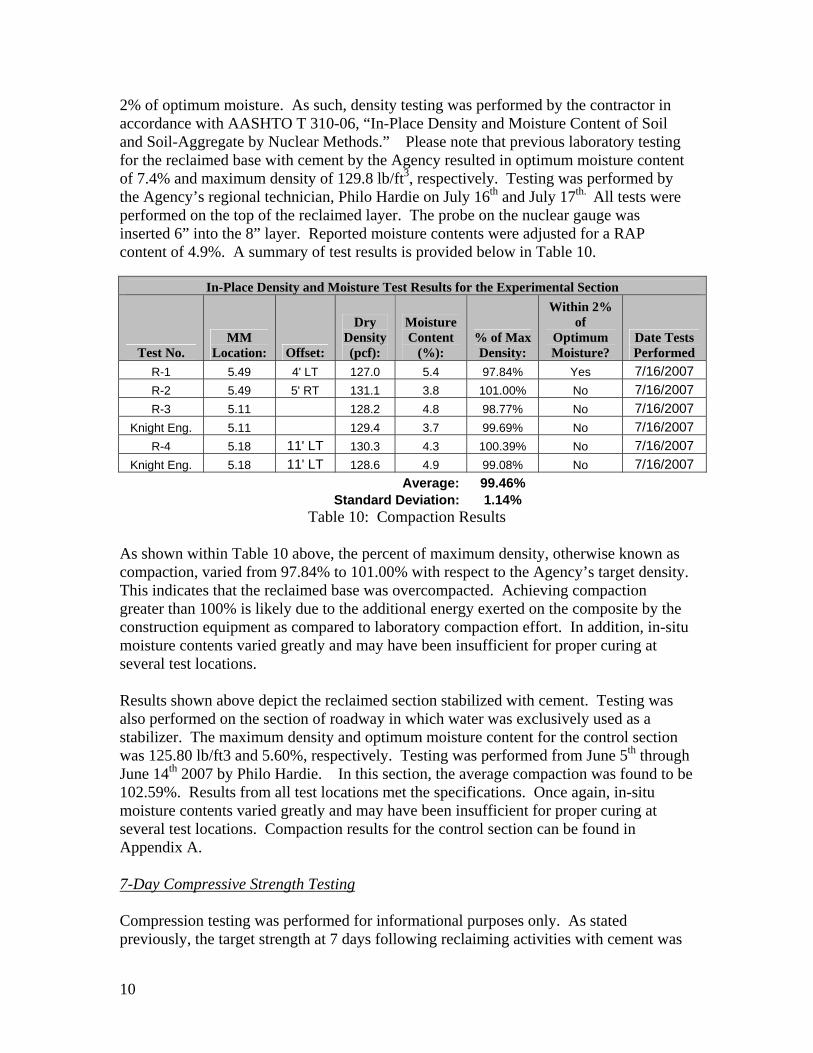
2% of optimum moisture. As such, density testing was performed by the contractor in accordance with AASHTO T 310-06, “In-Place Density and Moisture Content of Soil and Soil-Aggregate by Nuclear Methods.” Please note that previous laboratory testing for the reclaimed base with cement by the Agency resulted in optimum moisture content of 7.4% and maximum density of 129.8 lb/ft3, respectively. Testing was performed by the Agency’s regional technician, Philo Hardie on July 16th and July 17th. All tests were performed on the top of the reclaimed layer. The probe on the nuclear gauge was inserted 6” into the 8” layer. Reported moisture contents were adjusted for a RAP content of 4.9%. A summary of test results is provided below in Table 10.
In-Place Density and Moisture Test Results for the Experimental Section
Test No. MM
Location: Offset:
Dry Density (pcf):
Moisture Content
(%): % of Max Density:
Within 2% of
Optimum Moisture?
Date Tests Performed
R-1 5.49 4' LT 127.0 5.4 97.84% Yes 7/16/2007
R-2 5.49 5' RT 131.1 3.8 101.00% No 7/16/2007
R-3 5.11 128.2 4.8 98.77% No 7/16/2007
Knight Eng. 5.11 129.4 3.7 99.69% No 7/16/2007
R-4 5.18 11' LT 130.3 4.3 100.39% No 7/16/2007
Knight Eng. 5.18 11' LT 128.6 4.9 99.08% No 7/16/2007
Average: 99.46% Standard Deviation: 1.14%
Table 10: Compaction Results As shown within Table 10 above, the percent of maximum density, otherwise known as compaction, varied from 97.84% to 101.00% with respect to the Agency’s target density. This indicates that the reclaimed base was overcompacted. Achieving compaction greater than 100% is likely due to the additional energy exerted on the composite by the construction equipment as compared to laboratory compaction effort. In addition, in-situ moisture contents varied greatly and may have been insufficient for proper curing at several test locations. Results shown above depict the reclaimed section stabilized with cement. Testing was also performed on the section of roadway in which water was exclusively used as a stabilizer. The maximum density and optimum moisture content for the control section was 125.80 lb/ft3 and 5.60%, respectively. Testing was performed from June 5th through June 14th 2007 by Philo Hardie. In this section, the average compaction was found to be 102.59%. Results from all test locations met the specifications. Once again, in-situ moisture contents varied greatly and may have been insufficient for proper curing at several test locations. Compaction results for the control section can be found in Appendix A. 7-Day Compressive Strength Testing Compression testing was performed for informational purposes only. As stated previously, the target strength at 7 days following reclaiming activities with cement was
10
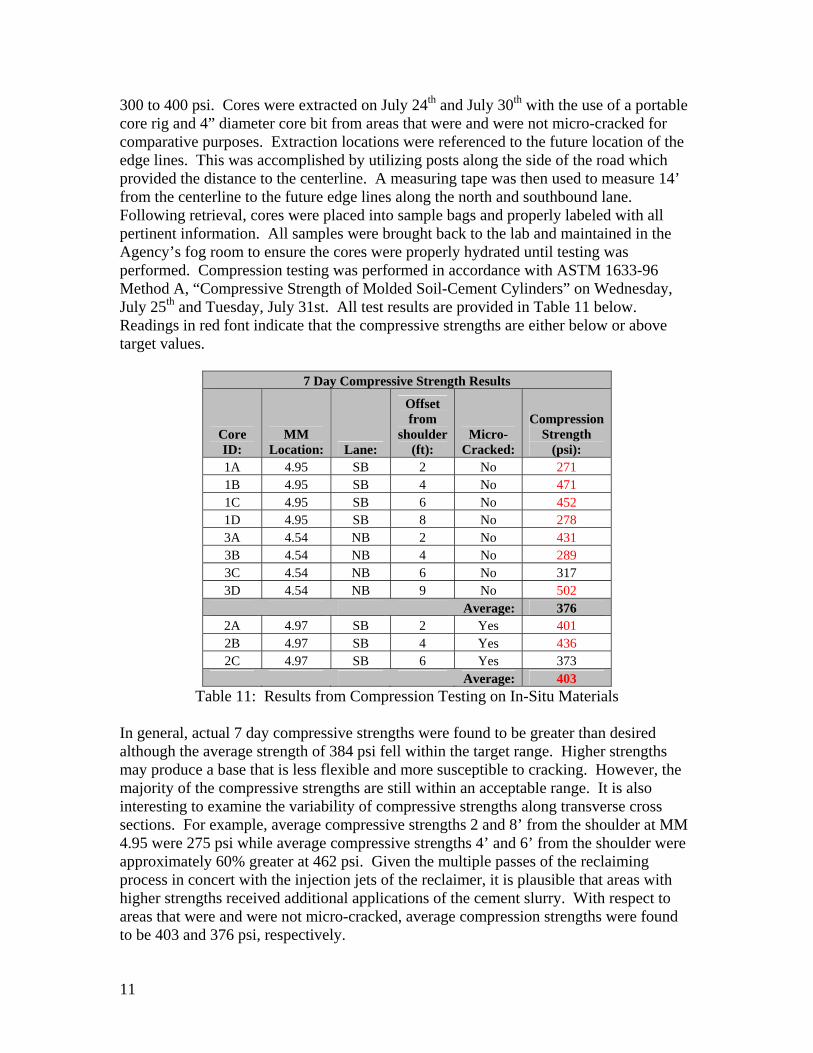
300 to 400 psi. Cores were extracted on July 24th and July 30th with the use of a portable core rig and 4” diameter core bit from areas that were and were not micro-cracked for comparative purposes. Extraction locations were referenced to the future location of the edge lines. This was accomplished by utilizing posts along the side of the road which provided the distance to the centerline. A measuring tape was then used to measure 14’ from the centerline to the future edge lines along the north and southbound lane. Following retrieval, cores were placed into sample bags and properly labeled with all pertinent information. All samples were brought back to the lab and maintained in the Agency’s fog room to ensure the cores were properly hydrated until testing was performed. Compression testing was performed in accordance with ASTM 1633-96 Method A, “Compressive Strength of Molded Soil-Cement Cylinders” on Wednesday, July 25th and Tuesday, July 31st. All test results are provided in Table 11 below. Readings in red font indicate that the compressive strengths are either below or above target values.
7 Day Compressive Strength Results
Core ID:
MM Location: Lane:
Offset from
shoulder (ft):
Micro-Cracked:
Compression Strength
(psi): 1A 4.95 SB 2 No 271 1B 4.95 SB 4 No 471 1C 4.95 SB 6 No 452 1D 4.95 SB 8 No 278 3A 4.54 NB 2 No 431 3B 4.54 NB 4 No 289 3C 4.54 NB 6 No 317 3D 4.54 NB 9 No 502 Average: 376
2A 4.97 SB 2 Yes 401 2B 4.97 SB 4 Yes 436 2C 4.97 SB 6 Yes 373 Average: 403
Table 11: Results from Compression Testing on In-Situ Materials In general, actual 7 day compressive strengths were found to be greater than desired although the average strength of 384 psi fell within the target range. Higher strengths may produce a base that is less flexible and more susceptible to cracking. However, the majority of the compressive strengths are still within an acceptable range. It is also interesting to examine the variability of compressive strengths along transverse cross sections. For example, average compressive strengths 2 and 8’ from the shoulder at MM 4.95 were 275 psi while average compressive strengths 4’ and 6’ from the shoulder were approximately 60% greater at 462 psi. Given the multiple passes of the reclaiming process in concert with the injection jets of the reclaimer, it is plausible that areas with higher strengths received additional applications of the cement slurry. With respect to areas that were and were not micro-cracked, average compression strengths were found to be 403 and 376 psi, respectively.
11
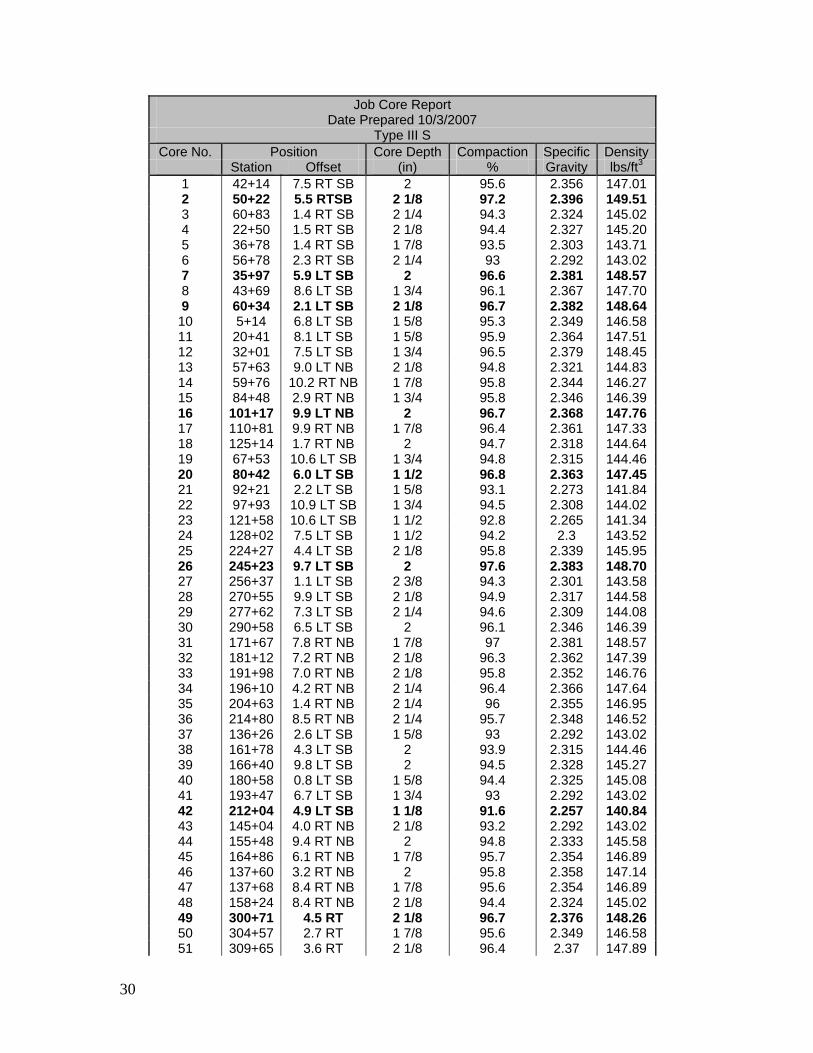
Bituminous Concrete Compaction Testing In accordance with the Agency’s specifications, “the density of the compacted pavement shall be at least 92.5% but not more than 96.5%, of the corresponding daily average maximum specific gravity for each mix type of bituminous mix placed during each day.” In addition, all testing is to be performed per AASHTO T 130, Method B, “Standard Test Method for Determining Degree of Pavement Compaction of Bituminous Aggregate Mixtures,” on a minimum of six cores per day of production. All three lifts, the binder and wearing courses, were tested accordingly. With respect to the binder course within the control and experimental sections a total of 36 and 12 cores were extracted with average densities of 94.3% and 94.4% of the target density, respectively. Only two compaction results were outside of the specified range, both of which were within the control section. For the 1st lift of the wearing course, 24 cores were removed from the control section with an average density of 95.1%. 12 cores were extracted from the experimental section resulting in an average density of 95.7% of the target density. A total of 10 cores, 6 from the control section and 4 from the experimental section were not within specification. Finally, for the 2nd lift of the wearing course, a total of 41 and 25 cores were removed from the control and experimental sections, respectively. Once again, the average density within the control section was found to be 95.1%, and 95.7% of the target density within the experimental roadway sections. Five and seven cores were found to be outside of the specified range for the control and experimental sections, respectively. Typically, when cores were outside of the specifications, they were greater than 96.5% of the target density. None were less than 90.5% or in excess of 98.5% of the target density. All compaction results are provided in Appendix B. PERFORMANCE: Cracking, rutting, and IRI values are often utilized to assess the performance and service life of pavement treatments or in this case differing rehabilitation efforts. It has been shown that the surface condition of a pavement is directly correlated to its structural condition. Surface condition is non-linear, characterized by different rates of deterioration. The following is an examination of the surface condition of both the experimental and control pavements. Cracking There are several causations for cracking in flexible pavements, including inadequate structural support such as the loss of base, subbase or subgrade support, and increase in loading, inadequate design, poor construction, poor choice of materials, or thermal or seasonal movement. For this analysis, longitudinal, transverse, and reflective cracking were examined. Longitudinal cracks run parallel to the lay down direction and are usually a type of fatigue or load associated failure. Transverse cracks run perpendicular to the pavement’s centerline and are usually a type of critical-temperature failure of thermal fatigue that may be induced by multiple freeze-thaw cycles. Reflection cracks
12
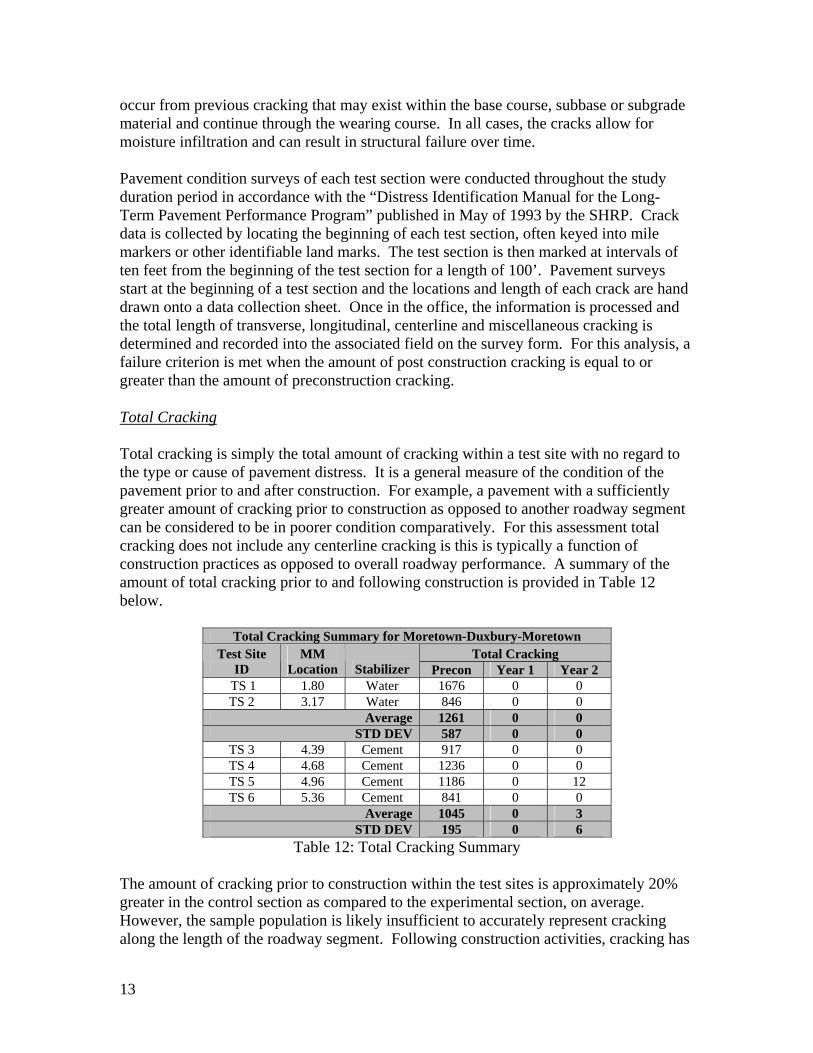
occur from previous cracking that may exist within the base course, subbase or subgrade material and continue through the wearing course. In all cases, the cracks allow for moisture infiltration and can result in structural failure over time. Pavement condition surveys of each test section were conducted throughout the study duration period in accordance with the “Distress Identification Manual for the Long-Term Pavement Performance Program” published in May of 1993 by the SHRP. Crack data is collected by locating the beginning of each test section, often keyed into mile markers or other identifiable land marks. The test section is then marked at intervals of ten feet from the beginning of the test section for a length of 100’. Pavement surveys start at the beginning of a test section and the locations and length of each crack are hand drawn onto a data collection sheet. Once in the office, the information is processed and the total length of transverse, longitudinal, centerline and miscellaneous cracking is determined and recorded into the associated field on the survey form. For this analysis, a failure criterion is met when the amount of post construction cracking is equal to or greater than the amount of preconstruction cracking. Total Cracking Total cracking is simply the total amount of cracking within a test site with no regard to the type or cause of pavement distress. It is a general measure of the condition of the pavement prior to and after construction. For example, a pavement with a sufficiently greater amount of cracking prior to construction as opposed to another roadway segment can be considered to be in poorer condition comparatively. For this assessment total cracking does not include any centerline cracking is this is typically a function of construction practices as opposed to overall roadway performance. A summary of the amount of total cracking prior to and following construction is provided in Table 12 below.
Total Cracking Summary for Moretown-Duxbury-Moretown Total Cracking Test Site
ID MM
Location Stabilizer Precon Year 1 Year 2 TS 1 1.80 Water 1676 0 0 TS 2 3.17 Water 846 0 0
Average 1261 0 0 STD DEV 587 0 0
TS 3 4.39 Cement 917 0 0 TS 4 4.68 Cement 1236 0 0 TS 5 4.96 Cement 1186 0 12 TS 6 5.36 Cement 841 0 0
Average 1045 0 3 STD DEV 195 0 6
Table 12: Total Cracking Summary
The amount of cracking prior to construction within the test sites is approximately 20% greater in the control section as compared to the experimental section, on average. However, the sample population is likely insufficient to accurately represent cracking along the length of the roadway segment. Following construction activities, cracking has
13
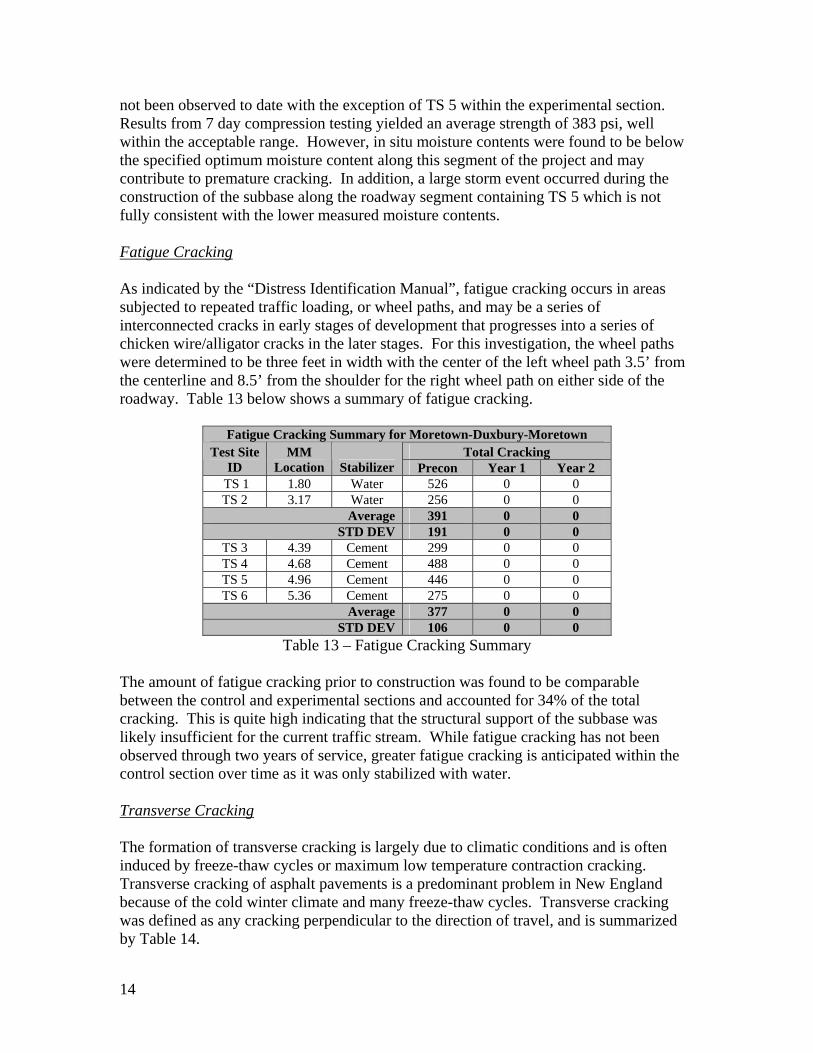
not been observed to date with the exception of TS 5 within the experimental section. Results from 7 day compression testing yielded an average strength of 383 psi, well within the acceptable range. However, in situ moisture contents were found to be below the specified optimum moisture content along this segment of the project and may contribute to premature cracking. In addition, a large storm event occurred during the construction of the subbase along the roadway segment containing TS 5 which is not fully consistent with the lower measured moisture contents. Fatigue Cracking As indicated by the “Distress Identification Manual”, fatigue cracking occurs in areas subjected to repeated traffic loading, or wheel paths, and may be a series of interconnected cracks in early stages of development that progresses into a series of chicken wire/alligator cracks in the later stages. For this investigation, the wheel paths were determined to be three feet in width with the center of the left wheel path 3.5’ from the centerline and 8.5’ from the shoulder for the right wheel path on either side of the roadway. Table 13 below shows a summary of fatigue cracking.
Fatigue Cracking Summary for Moretown-Duxbury-Moretown Total Cracking Test Site
ID MM
Location Stabilizer Precon Year 1 Year 2 TS 1 1.80 Water 526 0 0 TS 2 3.17 Water 256 0 0
Average 391 0 0 STD DEV 191 0 0
TS 3 4.39 Cement 299 0 0 TS 4 4.68 Cement 488 0 0 TS 5 4.96 Cement 446 0 0 TS 6 5.36 Cement 275 0 0
Average 377 0 0 STD DEV 106 0 0
Table 13 – Fatigue Cracking Summary
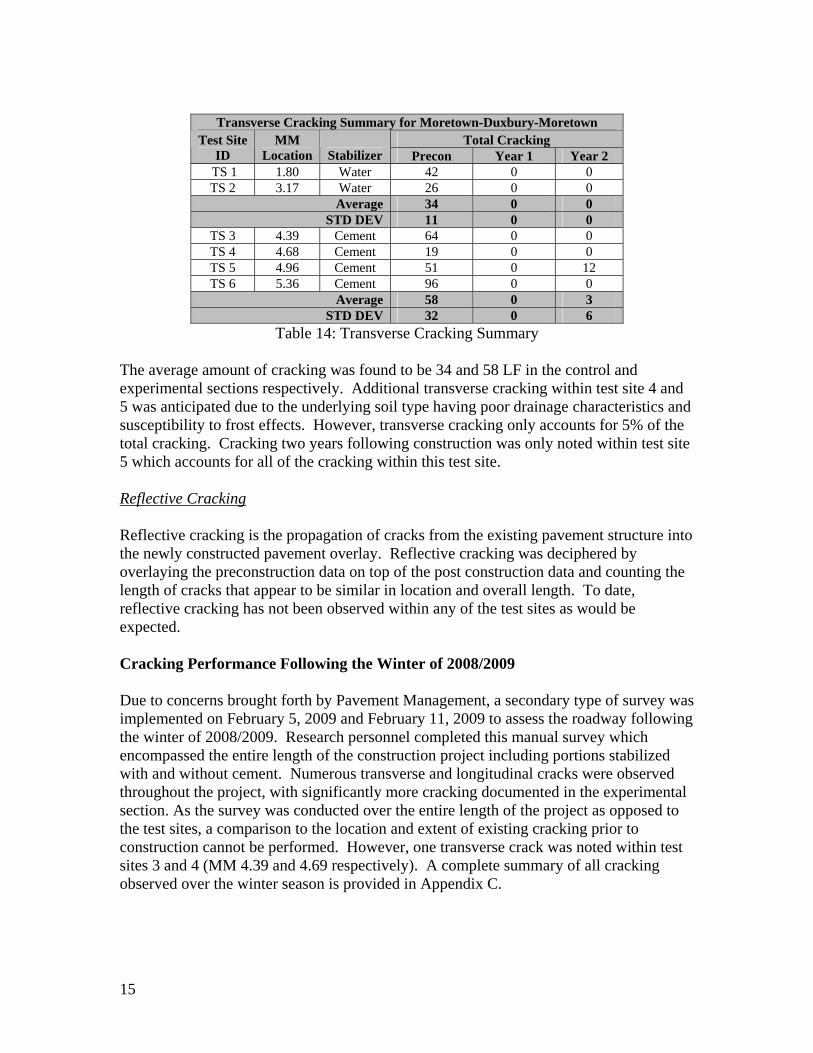
The amount of fatigue cracking prior to construction was found to be comparable between the control and experimental sections and accounted for 34% of the total cracking. This is quite high indicating that the structural support of the subbase was likely insufficient for the current traffic stream. While fatigue cracking has not been observed through two years of service, greater fatigue cracking is anticipated within the control section over time as it was only stabilized with water. Transverse Cracking The formation of transverse cracking is largely due to climatic conditions and is often induced by freeze-thaw cycles or maximum low temperature contraction cracking. Transverse cracking of asphalt pavements is a predominant problem in New England because of the cold winter climate and many freeze-thaw cycles. Transverse cracking was defined as any cracking perpendicular to the direction of travel, and is summarized by Table 14.
14
Transverse Cracking Summary for Moretown-Duxbury-Moretown
Total Cracking Test Site ID
MM Location Stabilizer Precon Year 1 Year 2
TS 1 1.80 Water 42 0 0 TS 2 3.17 Water 26 0 0
Average 34 0 0 STD DEV 11 0 0
TS 3 4.39 Cement 64 0 0 TS 4 4.68 Cement 19 0 0 TS 5 4.96 Cement 51 0 12 TS 6 5.36 Cement 96 0 0
Average 58 0 3 STD DEV 32 0 6
Table 14: Transverse Cracking Summary The average amount of cracking was found to be 34 and 58 LF in the control and experimental sections respectively. Additional transverse cracking within test site 4 and 5 was anticipated due to the underlying soil type having poor drainage characteristics and susceptibility to frost effects. However, transverse cracking only accounts for 5% of the total cracking. Cracking two years following construction was only noted within test site 5 which accounts for all of the cracking within this test site. Reflective Cracking Reflective cracking is the propagation of cracks from the existing pavement structure into the newly constructed pavement overlay. Reflective cracking was deciphered by overlaying the preconstruction data on top of the post construction data and counting the length of cracks that appear to be similar in location and overall length. To date, reflective cracking has not been observed within any of the test sites as would be expected. Cracking Performance Following the Winter of 2008/2009 Due to concerns brought forth by Pavement Management, a secondary type of survey was implemented on February 5, 2009 and February 11, 2009 to assess the roadway following the winter of 2008/2009. Research personnel completed this manual survey which encompassed the entire length of the construction project including portions stabilized with and without cement. Numerous transverse and longitudinal cracks were observed throughout the project, with significantly more cracking documented in the experimental section. As the survey was conducted over the entire length of the project as opposed to the test sites, a comparison to the location and extent of existing cracking prior to construction cannot be performed. However, one transverse crack was noted within test sites 3 and 4 (MM 4.39 and 4.69 respectively). A complete summary of all cracking observed over the winter season is provided in Appendix C.
15
Winter 08/09 Cracking Summary for Moretown-Duxbury-Moretown Transverse Longitudinal
Section
Average Length
(ft)
Average Width (mm)
Average Density (ft/mile)
Average Length
(ft)
Average Width (mm)
Average Density (ft/mile)
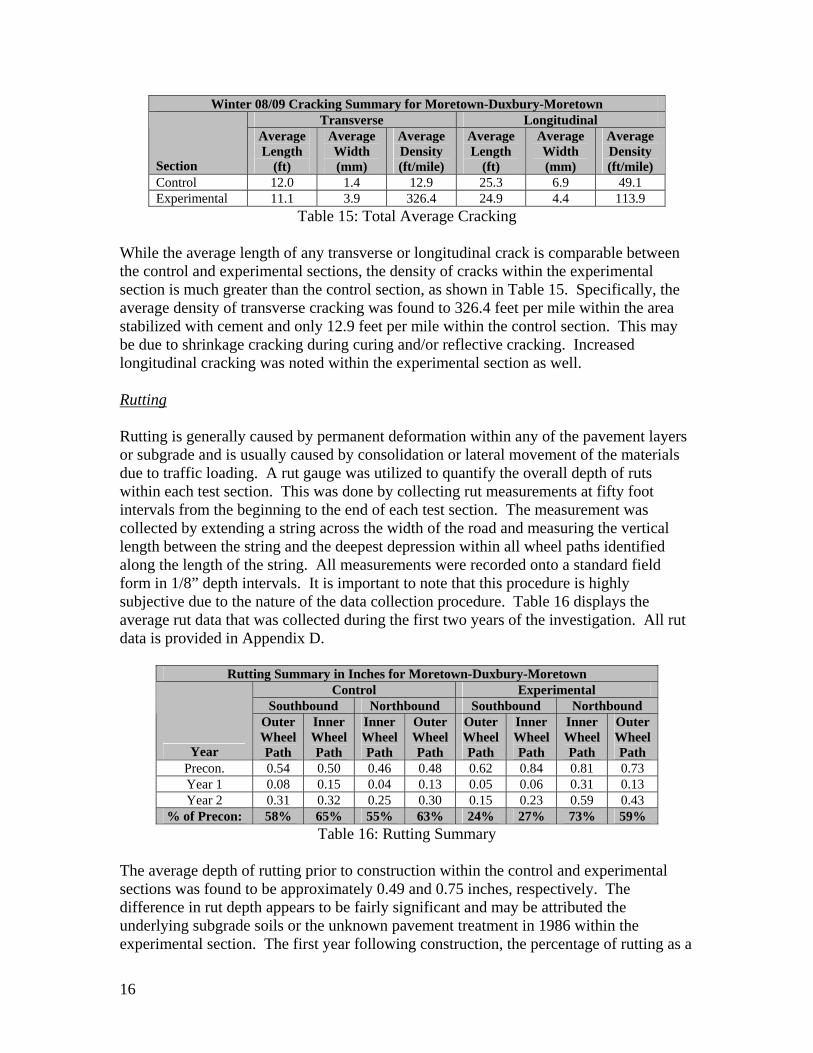
Control 12.0 1.4 12.9 25.3 6.9 49.1 Experimental 11.1 3.9 326.4 24.9 4.4 113.9
Table 15: Total Average Cracking While the average length of any transverse or longitudinal crack is comparable between the control and experimental sections, the density of cracks within the experimental section is much greater than the control section, as shown in Table 15. Specifically, the average density of transverse cracking was found to 326.4 feet per mile within the area stabilized with cement and only 12.9 feet per mile within the control section. This may be due to shrinkage cracking during curing and/or reflective cracking. Increased longitudinal cracking was noted within the experimental section as well. Rutting Rutting is generally caused by permanent deformation within any of the pavement layers or subgrade and is usually caused by consolidation or lateral movement of the materials due to traffic loading. A rut gauge was utilized to quantify the overall depth of ruts within each test section. This was done by collecting rut measurements at fifty foot intervals from the beginning to the end of each test section. The measurement was collected by extending a string across the width of the road and measuring the vertical length between the string and the deepest depression within all wheel paths identified along the length of the string. All measurements were recorded onto a standard field form in 1/8” depth intervals. It is important to note that this procedure is highly subjective due to the nature of the data collection procedure. Table 16 displays the average rut data that was collected during the first two years of the investigation. All rut data is provided in Appendix D.
Rutting Summary in Inches for Moretown-Duxbury-Moretown Control Experimental
Southbound Northbound Southbound Northbound
Year
Outer Wheel Path
Inner Wheel Path
Inner Wheel Path
Outer Wheel Path
Outer Wheel Path
Inner Wheel Path
Inner Wheel Path
Outer Wheel Path
Precon. 0.54 0.50 0.46 0.48 0.62 0.84 0.81 0.73 Year 1 0.08 0.15 0.04 0.13 0.05 0.06 0.31 0.13 Year 2 0.31 0.32 0.25 0.30 0.15 0.23 0.59 0.43
% of Precon: 58% 65% 55% 63% 24% 27% 73% 59% Table 16: Rutting Summary
The average depth of rutting prior to construction within the control and experimental sections was found to be approximately 0.49 and 0.75 inches, respectively. The difference in rut depth appears to be fairly significant and may be attributed the underlying subgrade soils or the unknown pavement treatment in 1986 within the experimental section. The first year following construction, the percentage of rutting as a
16
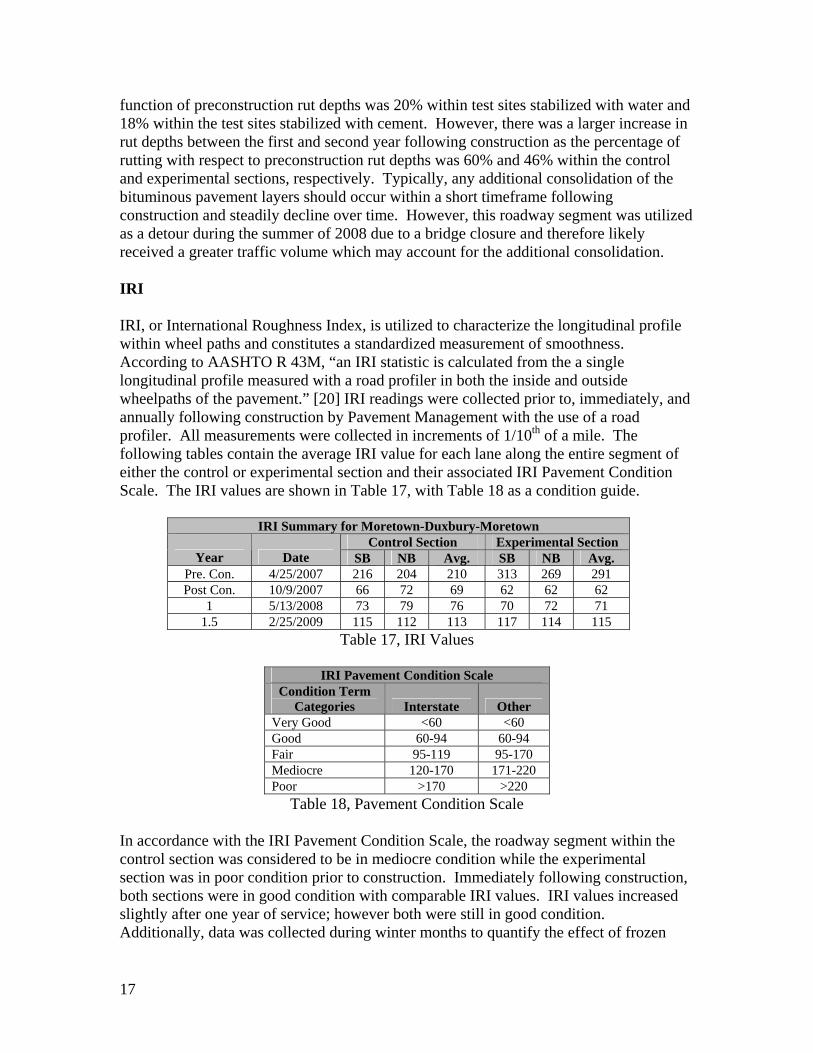
function of preconstruction rut depths was 20% within test sites stabilized with water and 18% within the test sites stabilized with cement. However, there was a larger increase in rut depths between the first and second year following construction as the percentage of rutting with respect to preconstruction rut depths was 60% and 46% within the control and experimental sections, respectively. Typically, any additional consolidation of the bituminous pavement layers should occur within a short timeframe following construction and steadily decline over time. However, this roadway segment was utilized as a detour during the summer of 2008 due to a bridge closure and therefore likely received a greater traffic volume which may account for the additional consolidation. IRI IRI, or International Roughness Index, is utilized to characterize the longitudinal profile within wheel paths and constitutes a standardized measurement of smoothness. According to AASHTO R 43M, “an IRI statistic is calculated from the a single longitudinal profile measured with a road profiler in both the inside and outside wheelpaths of the pavement.” [20] IRI readings were collected prior to, immediately, and annually following construction by Pavement Management with the use of a road profiler. All measurements were collected in increments of 1/10th of a mile. The following tables contain the average IRI value for each lane along the entire segment of either the control or experimental section and their associated IRI Pavement Condition Scale. The IRI values are shown in Table 17, with Table 18 as a condition guide.
IRI Summary for Moretown-Duxbury-Moretown Control Section Experimental Section
Year Date SB NB Avg. SB NB Avg. Pre. Con. 4/25/2007 216 204 210 313 269 291 Post Con. 10/9/2007 66 72 69 62 62 62
1 5/13/2008 73 79 76 70 72 71 1.5 2/25/2009 115 112 113 117 114 115
Table 17, IRI Values
IRI Pavement Condition Scale Condition Term
Categories Interstate Other Very Good <60 <60 Good 60-94 60-94 Fair 95-119 95-170 Mediocre 120-170 171-220 Poor >170 >220
Table 18, Pavement Condition Scale
In accordance with the IRI Pavement Condition Scale, the roadway segment within the control section was considered to be in mediocre condition while the experimental section was in poor condition prior to construction. Immediately following construction, both sections were in good condition with comparable IRI values. IRI values increased slightly after one year of service; however both were still in good condition. Additionally, data was collected during winter months to quantify the effect of frozen
17
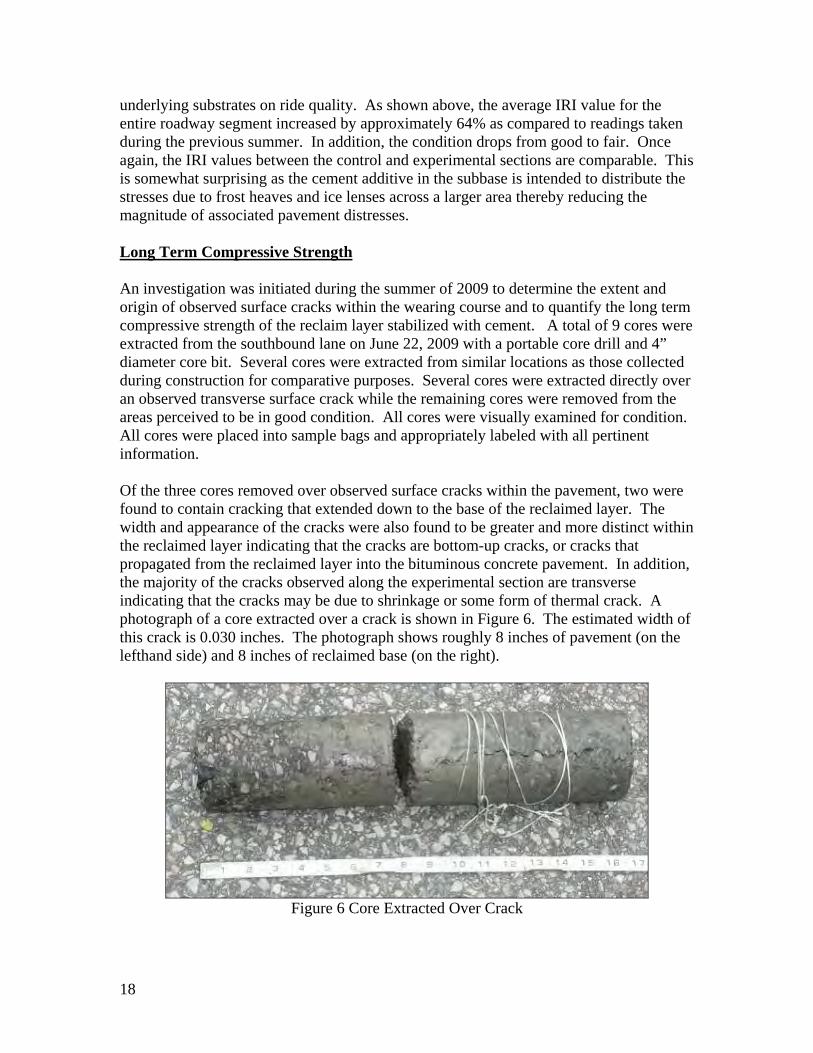
underlying substrates on ride quality. As shown above, the average IRI value for the entire roadway segment increased by approximately 64% as compared to readings taken during the previous summer. In addition, the condition drops from good to fair. Once again, the IRI values between the control and experimental sections are comparable. This is somewhat surprising as the cement additive in the subbase is intended to distribute the stresses due to frost heaves and ice lenses across a larger area thereby reducing the magnitude of associated pavement distresses. Long Term Compressive Strength An investigation was initiated during the summer of 2009 to determine the extent and origin of observed surface cracks within the wearing course and to quantify the long term compressive strength of the reclaim layer stabilized with cement. A total of 9 cores were extracted from the southbound lane on June 22, 2009 with a portable core drill and 4” diameter core bit. Several cores were extracted from similar locations as those collected during construction for comparative purposes. Several cores were extracted directly over an observed transverse surface crack while the remaining cores were removed from the areas perceived to be in good condition. All cores were visually examined for condition. All cores were placed into sample bags and appropriately labeled with all pertinent information. Of the three cores removed over observed surface cracks within the pavement, two were found to contain cracking that extended down to the base of the reclaimed layer. The width and appearance of the cracks were also found to be greater and more distinct within the reclaimed layer indicating that the cracks are bottom-up cracks, or cracks that propagated from the reclaimed layer into the bituminous concrete pavement. In addition, the majority of the cracks observed along the experimental section are transverse indicating that the cracks may be due to shrinkage or some form of thermal crack. A photograph of a core extracted over a crack is shown in Figure 6. The estimated width of this crack is 0.030 inches. The photograph shows roughly 8 inches of pavement (on the lefthand side) and 8 inches of reclaimed base (on the right).
Figure 6 Core Extracted Over Crack
18
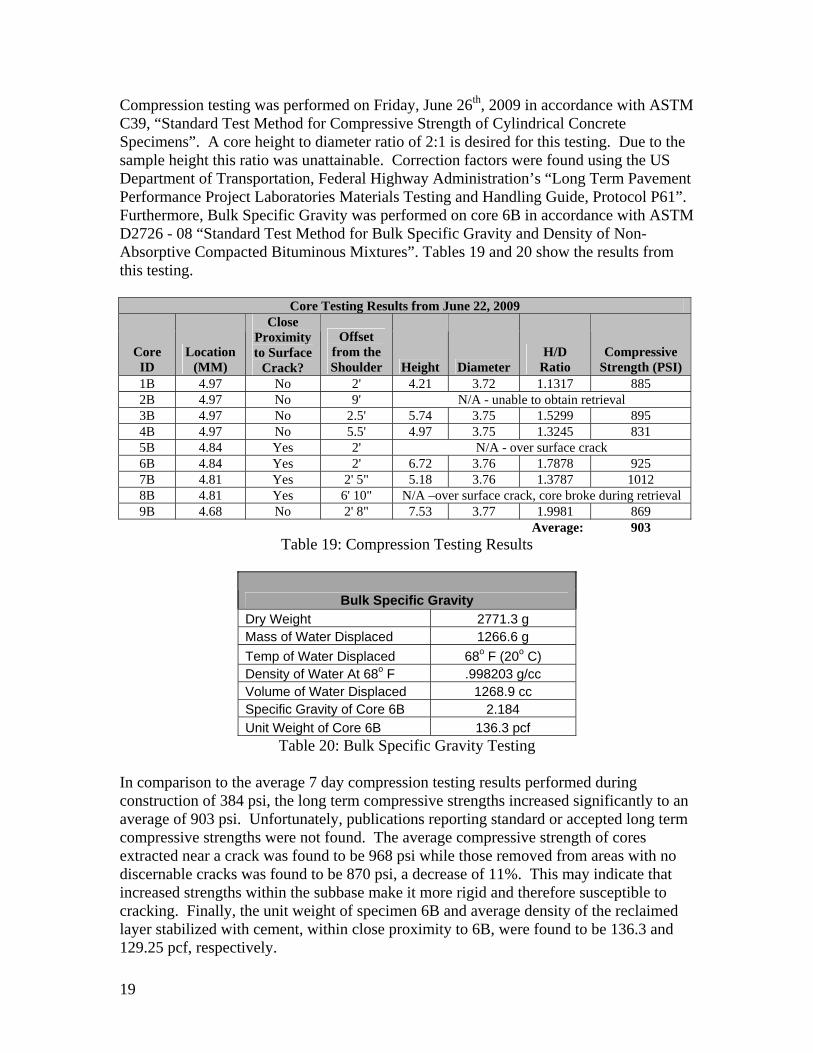
Compression testing was performed on Friday, June 26th, 2009 in accordance with ASTM C39, “Standard Test Method for Compressive Strength of Cylindrical Concrete Specimens”. A core height to diameter ratio of 2:1 is desired for this testing. Due to the sample height this ratio was unattainable. Correction factors were found using the US Department of Transportation, Federal Highway Administration’s “Long Term Pavement Performance Project Laboratories Materials Testing and Handling Guide, Protocol P61”. Furthermore, Bulk Specific Gravity was performed on core 6B in accordance with ASTM D2726 - 08 “Standard Test Method for Bulk Specific Gravity and Density of Non-Absorptive Compacted Bituminous Mixtures”. Tables 19 and 20 show the results from this testing.
Core Testing Results from June 22, 2009
Core ID
Location (MM)
Close Proximity to Surface
Crack?
Offset from the Shoulder Height Diameter
H/D Ratio
Compressive Strength (PSI)
1B 4.97 No 2' 4.21 3.72 1.1317 885 2B 4.97 No 9' N/A - unable to obtain retrieval 3B 4.97 No 2.5' 5.74 3.75 1.5299 895 4B 4.97 No 5.5' 4.97 3.75 1.3245 831 5B 4.84 Yes 2' N/A - over surface crack 6B 4.84 Yes 2' 6.72 3.76 1.7878 925 7B 4.81 Yes 2' 5" 5.18 3.76 1.3787 1012 8B 4.81 Yes 6' 10" N/A –over surface crack, core broke during retrieval 9B 4.68 No 2' 8" 7.53 3.77 1.9981 869
Average: 903 Table 19: Compression Testing Results
Bulk Specific Gravity
Dry Weight 2771.3 g Mass of Water Displaced 1266.6 g
Temp of Water Displaced 68o F (20o C) Density of Water At 68o F .998203 g/cc Volume of Water Displaced 1268.9 cc Specific Gravity of Core 6B 2.184
Unit Weight of Core 6B 136.3 pcf Table 20: Bulk Specific Gravity Testing
In comparison to the average 7 day compression testing results performed during construction of 384 psi, the long term compressive strengths increased significantly to an average of 903 psi. Unfortunately, publications reporting standard or accepted long term compressive strengths were not found. The average compressive strength of cores extracted near a crack was found to be 968 psi while those removed from areas with no discernable cracks was found to be 870 psi, a decrease of 11%. This may indicate that increased strengths within the subbase make it more rigid and therefore susceptible to cracking. Finally, the unit weight of specimen 6B and average density of the reclaimed layer stabilized with cement, within close proximity to 6B, were found to be 136.3 and 129.25 pcf, respectively.
19
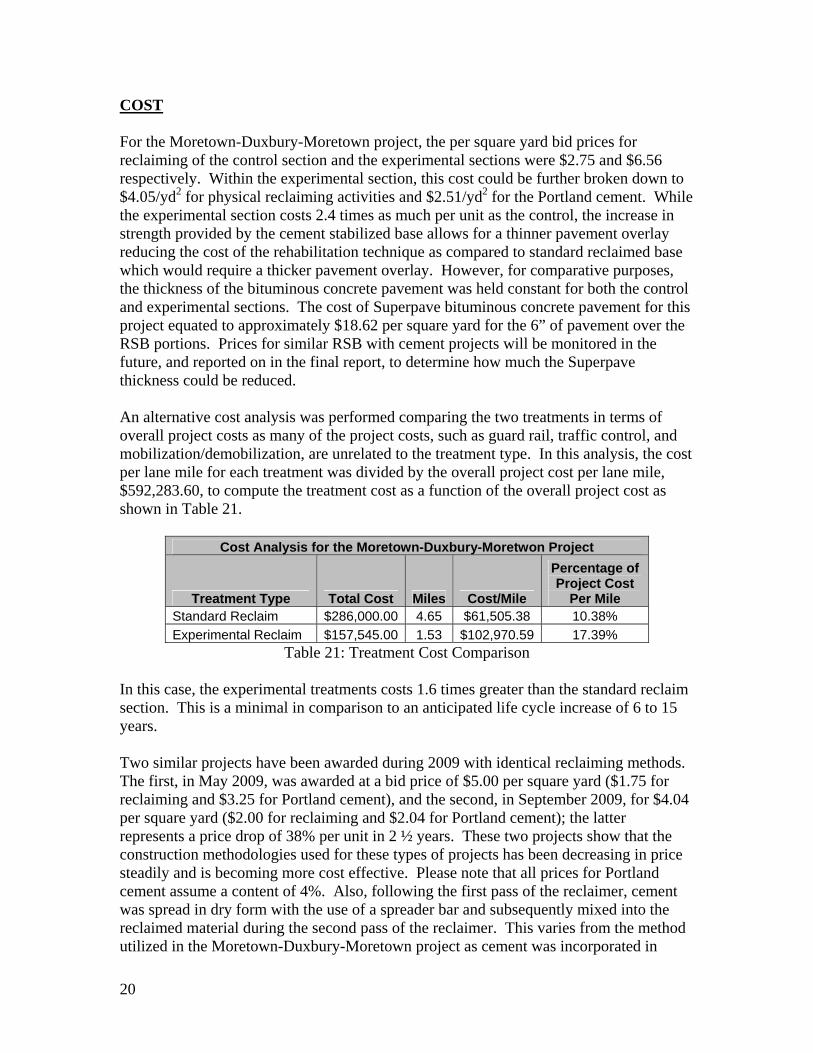
COST For the Moretown-Duxbury-Moretown project, the per square yard bid prices for reclaiming of the control section and the experimental sections were $2.75 and $6.56 respectively. Within the experimental section, this cost could be further broken down to $4.05/yd2 for physical reclaiming activities and $2.51/yd2 for the Portland cement. While the experimental section costs 2.4 times as much per unit as the control, the increase in strength provided by the cement stabilized base allows for a thinner pavement overlay reducing the cost of the rehabilitation technique as compared to standard reclaimed base which would require a thicker pavement overlay. However, for comparative purposes, the thickness of the bituminous concrete pavement was held constant for both the control and experimental sections. The cost of Superpave bituminous concrete pavement for this project equated to approximately $18.62 per square yard for the 6” of pavement over the RSB portions. Prices for similar RSB with cement projects will be monitored in the future, and reported on in the final report, to determine how much the Superpave thickness could be reduced. An alternative cost analysis was performed comparing the two treatments in terms of overall project costs as many of the project costs, such as guard rail, traffic control, and mobilization/demobilization, are unrelated to the treatment type. In this analysis, the cost per lane mile for each treatment was divided by the overall project cost per lane mile, $592,283.60, to compute the treatment cost as a function of the overall project cost as shown in Table 21.
Cost Analysis for the Moretown-Duxbury-Moretwon Project
Treatment Type Total Cost Miles Cost/Mile
Percentage of Project Cost
Per Mile Standard Reclaim $286,000.00 4.65 $61,505.38 10.38%
Experimental Reclaim $157,545.00 1.53 $102,970.59 17.39% Table 21: Treatment Cost Comparison
In this case, the experimental treatments costs 1.6 times greater than the standard reclaim section. This is a minimal in comparison to an anticipated life cycle increase of 6 to 15 years. Two similar projects have been awarded during 2009 with identical reclaiming methods. The first, in May 2009, was awarded at a bid price of $5.00 per square yard ($1.75 for reclaiming and $3.25 for Portland cement), and the second, in September 2009, for $4.04 per square yard ($2.00 for reclaiming and $2.04 for Portland cement); the latter represents a price drop of 38% per unit in 2 ½ years. These two projects show that the construction methodologies used for these types of projects has been decreasing in price steadily and is becoming more cost effective. Please note that all prices for Portland cement assume a content of 4%. Also, following the first pass of the reclaimer, cement was spread in dry form with the use of a spreader bar and subsequently mixed into the reclaimed material during the second pass of the reclaimer. This varies from the method utilized in the Moretown-Duxbury-Moretown project as cement was incorporated in
20
slurry form. Placement methods may have an impact on cost as well as long term performance. SUMMARY In an effort to assess the performance and cost effectiveness of a reclaimed base course stabilized with cement in a cold weather climate, the Vermont Agency of Transportation (VTrans) constructed a 1.54 mile section the referenced experimental treatment along VT 100 in the towns of Duxbury and Moretown. The control section consisted of a 4.69 mile segment of reclaimed base stabilized with water only. The method produces a new base by pulverizing the existing asphalt pavement and mixing it with some underlying subbase materials and is intended to correct structural deficiencies. Additional structural strength may be achieved by incorporating mechanical, bituminous or chemical stabilizers such as cement. Prior to construction, a test pit was excavated to obtain samples of the roadway material to determine the optimum cement content to be incorporated into the reclaimed base. Laboratory testing included an examination of the moisture-density relationship of the bituminous pavement, subbase, and cement mixtures and compression testing to determine the proper cement content in order to provide a 7 day target compressive strength between 300 to 400 psi. Initially, a cement content of 6% was specified. However, based upon results from samples gathered after portions of the roadway were reclaimed, this was reduced from 6% to 4%. Additional testing during construction included in-situ density and moisture content to ensure attaining associated specifications. Cores were also collected to determine the actual 7 day compressive strength of the newly constructed base. The average compaction, moisture content, and compressive strength was found to be 99.46%, 4.48% and 384 psi, respectively. A list of testing procedures can be found in the References section. Cracking, in the form of total, fatigue, transverse, and reflective, along with rutting, and IRI values were collected prior to and following construction on an annual basis from both the experimental and control sections. A total of six test sites, 2 within the control and 4 within the experimental sections, were established throughout the length of the project. Each test site consists of 100’ lengths incorporating the entire roadway width. Cracking and rutting were examined and recorded onto the appropriate field forms. IRI was collected by Pavement Management with the road profiler in 1/10 mile increments for the entire length of the project. As of the time of this publication, these treatments have been in service for two years, with no observed cracking with the exception of 12 feet of transverse cracking within TS5 located in the experimental section. The first year following construction, the percentage of rutting as a function of preconstruction rut depths was 20% within test sites stabilized with water and 18% within the test sites stabilized with cement. However, there was a larger increase in rut depths between the first and second year following construction as the percentage of rutting with respect to preconstruction rut depths was 60% and 46% within the control and experimental sections, respectively based on
21
midwinter measurements. IRI values indicate that both the experimental and control section are in good condition. IRI values were also collected over the 2008/2009 winter season to ascertain seasonal affects on readability. The average IRI value for the entire roadway segment increased by approximately 64% as compared to readings taken during the previous summer. In addition, the condition rating dropped from good to fair. Due to concerns brought forth by Pavement Management pertaining to an observed increase in transverse cracks within the experimental section, nine cores were collected during the summer of 2009 to determine the extent and origin of the observed surface cracks within the wearing course and to quantify the long term compressive strength of the reclaim layer stabilized with cement. Of the three cores removed over observed surface cracks within the pavement, two were found to contain cracking that extended down to the base of the reclaim layer. These cracks are apparently bottom-up cracks. In comparison to the average 7 day compression test results performed during construction of 384 psi, the long term compressive strengths increased significantly to an average of 903 psi. Unfortunately, publications reporting standard or accepted long term compressive strengths were not found. The average compressive strength of cores extracted near a crack was found to be 968 psi while those removed from areas with no discernable cracks was found to be 870 psi, a difference of 11%. Due to the limited age of the treatment, no conclusions may be drawn at this time. Data collection efforts will continue until the current amount of cracking at each test site meets or exceeds that of preconstruction conditions. Testing of representative roadway materials prior to construction to determine the maximum density, optimum moisture, and optimum cement content is highly recommended for the most favorable results as well as characterizing the subbase and/or subgrade materials through dynamic cone penetrometer testing and gradations. REFERENCES 1. Vermont Agency of Transportation. Standard Specifications for Construction. 2006. 2. Portland Cement Association “Soil Cement Information, Suggested Specifications
for Soil-Cement Base Course Construction”. ©2001. Portland Cement Association. Skokie, Illinois 60077-1083. IS008.12
3. Holtz, Robert and Kovacs, William. “An Introduction to Geotechnical Engineering”
Prentice-Hall Civil Engineering and Engineering Mechanics Series.. © 1981. Pages 58-60
4. Portland Cement Association. Soil-Cement Technology for Pavements: Different Products for Different Applications. © 2005 5. AASHTO T 27-06, “Sieve Analysis of Fine and Coarse Aggregates” Standard
Specifications for Transportation Materials and Methods of Sampling and Testing, 27th Edition 2007.
22
6. ASTM D 558-96, “Standard Test Methods for Moisture-Density Relations of Soil-
Cement Mixtures.” ASTM International, West Conshohocken, PA, www.astm.org.
7. ASTM D 559 -03, “Standard Test Methods for Wetting and Drying Compacted Soil-
Cement Mixtures.” ASTM International, West Conshohocken, PA, www.astm.org.
8. ASTM 1633-96 Method A, “Compressive Strength of Molded Soil-Cement Cylinders ASTM International, West Conshohocken, PA, www.astm.org.
9. ASTM D 1632-96, “Standard Practice for making and Curing Soil-Cement
Compression and Flexure Test Specimens in the Laboratory.” ASTM International, West Conshohocken, PA, www.astm.org.
10. ASTM D 1633-96, “Standard Test Method for Compressive Strength of Molded
Soil-Cement Cylinders,” Test Method A, ASTM International, West Conshohocken, PA, www.astm.org.
11. ASTM C617, “Standard Practice for Capping Cylindrical Concrete Specimens”
ASTM International, West Conshohocken, PA, www.astm.org. 12. American Association of State Highway and Transportation Official. “Standard
Specifications for Transportation Materials and Methods of Sampling and Testing, Part 1B: Specifications”, 29th Edition, 2009.
13. AASHTO T 310-06, “In-Place Density and Moisture Content of Soil and Soil-
Aggregate by Nuclear Methods” Standard Specifications for Transportation Materials and Methods of Sampling and Testing, 27th Edition 2007.
14. AASHTO T 130, Method B, “Standard Test Method for Determining Degree of
Pavement Compaction of Bituminous Aggregate Mixtures,” Standard Specifications for Transportation Materials and Methods of Sampling and Testing, 27th Edition 2007.
15. AASHTO T-231, “Standard Practice for Capping Cylindrical Concrete Specimens”,
Standard Specifications for Transportation Materials and Methods of Sampling and Testing, 27th Edition 2007.
16. Distress Identification Manual for the Long-Term Pavement Performance Program.
Washington, DC: Strategic Highway Research Program, 1993. 17. US Department of Transportation, Federal Highway Administration. “Long Term
Performance Project Laboratories Materials Testing and Handling Guide, Protocol P61” http://www.fhwa.dot.gov/pavement/ltpp/pubs/07052/pro61.cfm
23
18. ASTM D2726 - 08 “Standard Test Method for Bulk Specific Gravity and Density of
Non-Absorptive Compacted Bituminous Mixtures”. ASTM International, West Conshohocken, PA, www.astm.org.
19. Portland Cement Association. The Right Choice For Rebuilding Roads. © 2002. 20. AASHTO R 43M, “Standard Practice for Quantifying Roughness of Pavements.”
Standard Specifications for Transportation Materials and Methods of Sampling and Testing, 27th Edition 2007.
24

APPENDIX A In-Place Densities and Moisture Results
25
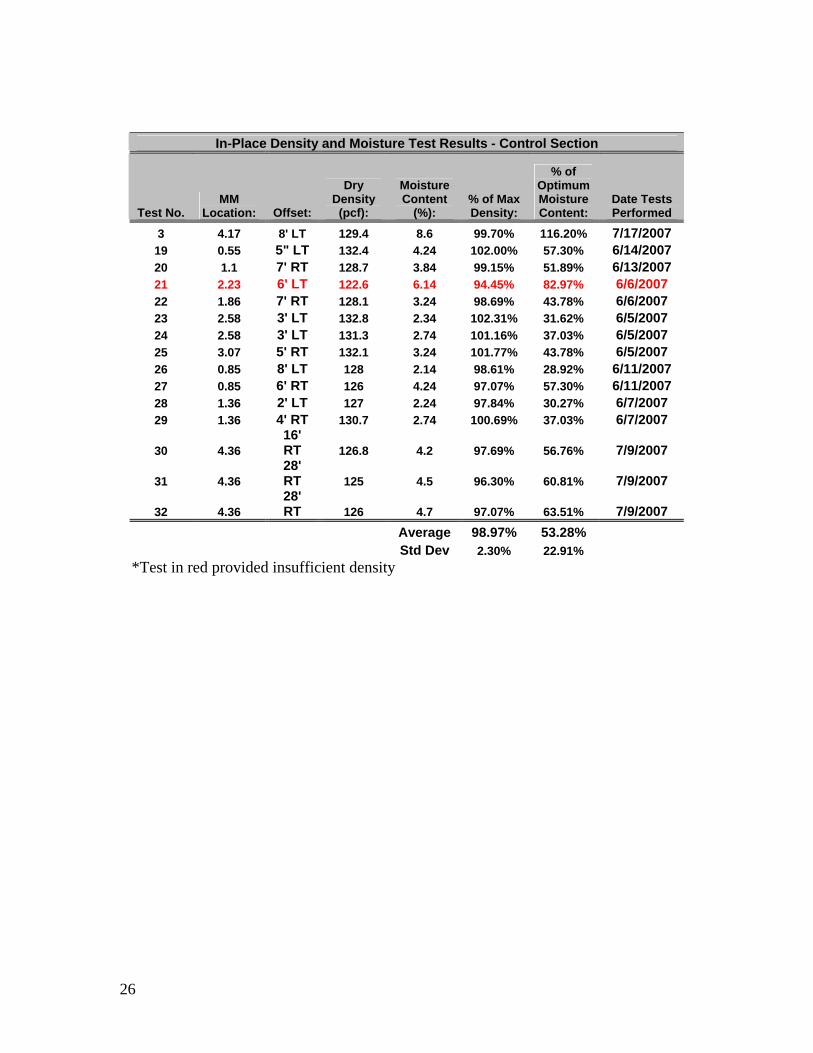
In-Place Density and Moisture Test Results - Control Section
Test No. MM
Location: Offset:
Dry Density (pcf):
Moisture Content
(%): % of Max Density:
% of Optimum Moisture Content:
Date Tests Performed
3 4.17 8' LT 129.4 8.6 99.70% 116.20% 7/17/2007 19 0.55 5" LT 132.4 4.24 102.00% 57.30% 6/14/2007 20 1.1 7' RT 128.7 3.84 99.15% 51.89% 6/13/2007 21 2.23 6' LT 122.6 6.14 94.45% 82.97% 6/6/2007 22 1.86 7' RT 128.1 3.24 98.69% 43.78% 6/6/2007 23 2.58 3' LT 132.8 2.34 102.31% 31.62% 6/5/2007 24 2.58 3' LT 131.3 2.74 101.16% 37.03% 6/5/2007 25 3.07 5' RT 132.1 3.24 101.77% 43.78% 6/5/2007 26 0.85 8' LT 128 2.14 98.61% 28.92% 6/11/2007 27 0.85 6' RT 126 4.24 97.07% 57.30% 6/11/2007 28 1.36 2' LT 127 2.24 97.84% 30.27% 6/7/2007 29 1.36 4' RT 130.7 2.74 100.69% 37.03% 6/7/2007
30 4.36 16' RT 126.8 4.2 97.69% 56.76% 7/9/2007
31 4.36 28' RT 125 4.5 96.30% 60.81% 7/9/2007
32 4.36 28' RT 126 4.7 97.07% 63.51% 7/9/2007
Average 98.97% 53.28% Std Dev 2.30% 22.91%
*Test in red provided insufficient density
26

Appendix B Bituminous Core Results
27
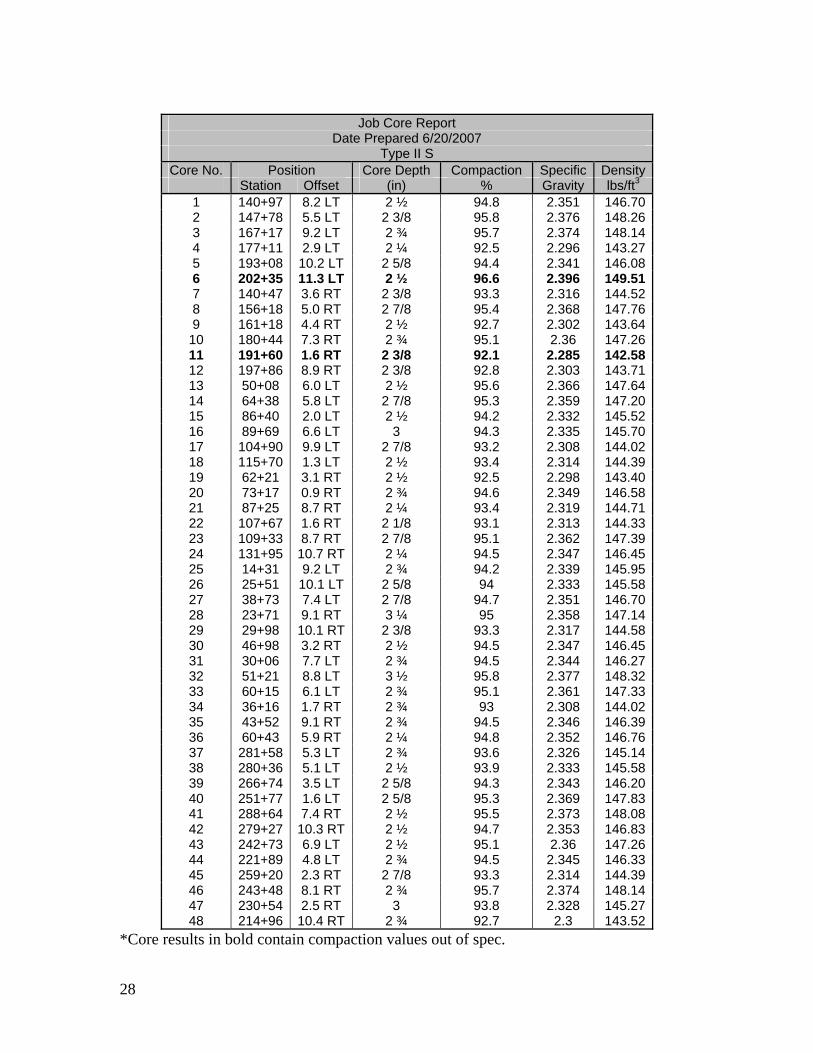
Job Core Report
Date Prepared 6/20/2007 Type II S
Core No. Position Core Depth Compaction Specific Density Station Offset (in) % Gravity lbs/ft3 1 140+97 8.2 LT 2 ½ 94.8 2.351 146.70 2 147+78 5.5 LT 2 3/8 95.8 2.376 148.26 3 167+17 9.2 LT 2 ¾ 95.7 2.374 148.14 4 177+11 2.9 LT 2 ¼ 92.5 2.296 143.27 5 193+08 10.2 LT 2 5/8 94.4 2.341 146.08 6 202+35 11.3 LT 2 ½ 96.6 2.396 149.51 7 140+47 3.6 RT 2 3/8 93.3 2.316 144.52 8 156+18 5.0 RT 2 7/8 95.4 2.368 147.76 9 161+18 4.4 RT 2 ½ 92.7 2.302 143.64
10 180+44 7.3 RT 2 ¾ 95.1 2.36 147.26 11 191+60 1.6 RT 2 3/8 92.1 2.285 142.58 12 197+86 8.9 RT 2 3/8 92.8 2.303 143.71 13 50+08 6.0 LT 2 ½ 95.6 2.366 147.64 14 64+38 5.8 LT 2 7/8 95.3 2.359 147.20 15 86+40 2.0 LT 2 ½ 94.2 2.332 145.52 16 89+69 6.6 LT 3 94.3 2.335 145.70 17 104+90 9.9 LT 2 7/8 93.2 2.308 144.02 18 115+70 1.3 LT 2 ½ 93.4 2.314 144.39 19 62+21 3.1 RT 2 ½ 92.5 2.298 143.40 20 73+17 0.9 RT 2 ¾ 94.6 2.349 146.58 21 87+25 8.7 RT 2 ¼ 93.4 2.319 144.71 22 107+67 1.6 RT 2 1/8 93.1 2.313 144.33 23 109+33 8.7 RT 2 7/8 95.1 2.362 147.39 24 131+95 10.7 RT 2 ¼ 94.5 2.347 146.45 25 14+31 9.2 LT 2 ¾ 94.2 2.339 145.95 26 25+51 10.1 LT 2 5/8 94 2.333 145.58 27 38+73 7.4 LT 2 7/8 94.7 2.351 146.70 28 23+71 9.1 RT 3 ¼ 95 2.358 147.14 29 29+98 10.1 RT 2 3/8 93.3 2.317 144.58 30 46+98 3.2 RT 2 ½ 94.5 2.347 146.45 31 30+06 7.7 LT 2 ¾ 94.5 2.344 146.27 32 51+21 8.8 LT 3 ½ 95.8 2.377 148.32 33 60+15 6.1 LT 2 ¾ 95.1 2.361 147.33 34 36+16 1.7 RT 2 ¾ 93 2.308 144.02 35 43+52 9.1 RT 2 ¾ 94.5 2.346 146.39 36 60+43 5.9 RT 2 ¼ 94.8 2.352 146.76 37 281+58 5.3 LT 2 ¾ 93.6 2.326 145.14 38 280+36 5.1 LT 2 ½ 93.9 2.333 145.58 39 266+74 3.5 LT 2 5/8 94.3 2.343 146.20 40 251+77 1.6 LT 2 5/8 95.3 2.369 147.83 41 288+64 7.4 RT 2 ½ 95.5 2.373 148.08 42 279+27 10.3 RT 2 ½ 94.7 2.353 146.83 43 242+73 6.9 LT 2 ½ 95.1 2.36 147.26 44 221+89 4.8 LT 2 ¾ 94.5 2.345 146.33 45 259+20 2.3 RT 2 7/8 93.3 2.314 144.39 46 243+48 8.1 RT 2 ¾ 95.7 2.374 148.14 47 230+54 2.5 RT 3 93.8 2.328 145.27 48 214+96 10.4 RT 2 ¾ 92.7 2.3 143.52
*Core results in bold contain compaction values out of spec.
28
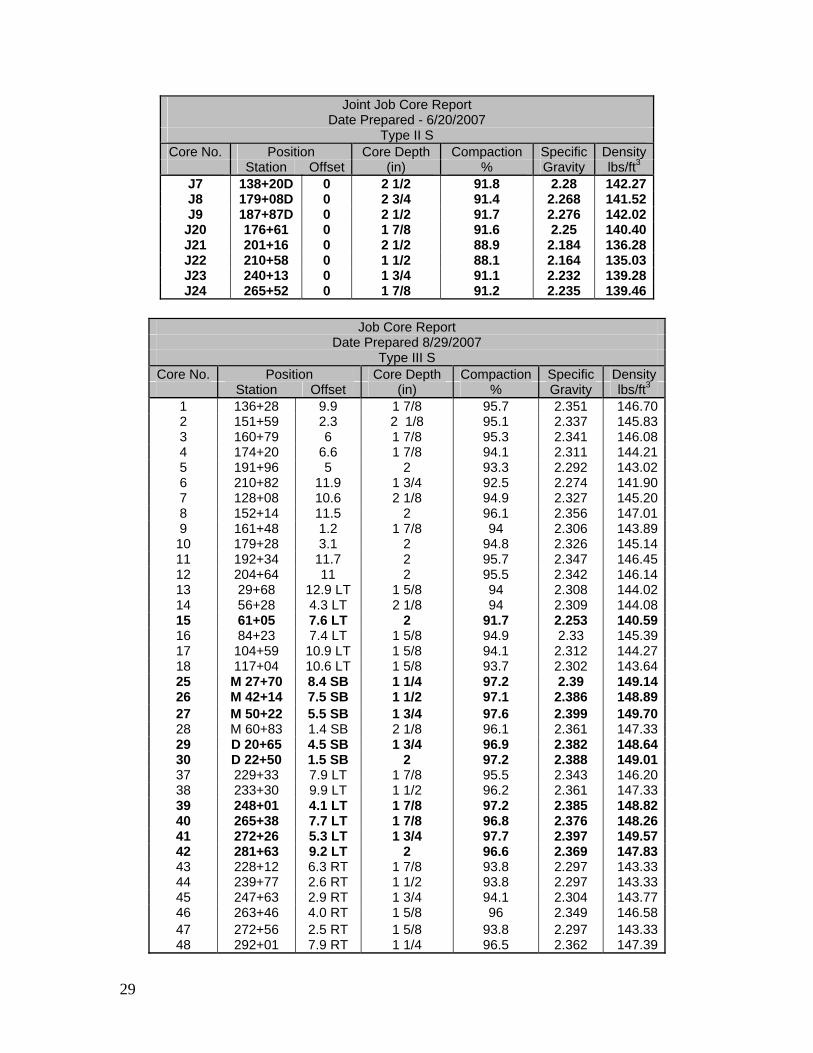
Joint Job Core Report Date Prepared - 6/20/2007
Type II S Core No. Position Core Depth Compaction Specific Density
Station Offset (in) % Gravity lbs/ft3 J7 138+20D 0 2 1/2 91.8 2.28 142.27 J8 179+08D 0 2 3/4 91.4 2.268 141.52 J9 187+87D 0 2 1/2 91.7 2.276 142.02
J20 176+61 0 1 7/8 91.6 2.25 140.40 J21 201+16 0 2 1/2 88.9 2.184 136.28 J22 210+58 0 1 1/2 88.1 2.164 135.03 J23 240+13 0 1 3/4 91.1 2.232 139.28 J24 265+52 0 1 7/8 91.2 2.235 139.46
Job Core Report
Date Prepared 8/29/2007 Type III S
Core No. Position Core Depth Compaction Specific Density Station Offset (in) % Gravity lbs/ft3 1 136+28 9.9 1 7/8 95.7 2.351 146.702 151+59 2.3 2 1/8 95.1 2.337 145.833 160+79 6 1 7/8 95.3 2.341 146.084 174+20 6.6 1 7/8 94.1 2.311 144.215 191+96 5 2 93.3 2.292 143.026 210+82 11.9 1 3/4 92.5 2.274 141.907 128+08 10.6 2 1/8 94.9 2.327 145.208 152+14 11.5 2 96.1 2.356 147.019 161+48 1.2 1 7/8 94 2.306 143.8910 179+28 3.1 2 94.8 2.326 145.1411 192+34 11.7 2 95.7 2.347 146.4512 204+64 11 2 95.5 2.342 146.1413 29+68 12.9 LT 1 5/8 94 2.308 144.0214 56+28 4.3 LT 2 1/8 94 2.309 144.0815 61+05 7.6 LT 2 91.7 2.253 140.5916 84+23 7.4 LT 1 5/8 94.9 2.33 145.3917 104+59 10.9 LT 1 5/8 94.1 2.312 144.2718 117+04 10.6 LT 1 5/8 93.7 2.302 143.6425 M 27+70 8.4 SB 1 1/4 97.2 2.39 149.1426 M 42+14 7.5 SB 1 1/2 97.1 2.386 148.8927 M 50+22 5.5 SB 1 3/4 97.6 2.399 149.7028 M 60+83 1.4 SB 2 1/8 96.1 2.361 147.3329 D 20+65 4.5 SB 1 3/4 96.9 2.382 148.6430 D 22+50 1.5 SB 2 97.2 2.388 149.0137 229+33 7.9 LT 1 7/8 95.5 2.343 146.2038 233+30 9.9 LT 1 1/2 96.2 2.361 147.3339 248+01 4.1 LT 1 7/8 97.2 2.385 148.8240 265+38 7.7 LT 1 7/8 96.8 2.376 148.2641 272+26 5.3 LT 1 3/4 97.7 2.397 149.5742 281+63 9.2 LT 2 96.6 2.369 147.8343 228+12 6.3 RT 1 7/8 93.8 2.297 143.3344 239+77 2.6 RT 1 1/2 93.8 2.297 143.3345 247+63 2.9 RT 1 3/4 94.1 2.304 143.7746 263+46 4.0 RT 1 5/8 96 2.349 146.5847 272+56 2.5 RT 1 5/8 93.8 2.297 143.3348 292+01 7.9 RT 1 1/4 96.5 2.362 147.39
29
Job Core Report Date Prepared 10/3/2007
Type III S Core No. Position Core Depth Compaction Specific Density
Station Offset (in) % Gravity lbs/ft3 1 42+14 7.5 RT SB 2 95.6 2.356 147.01 2 50+22 5.5 RTSB 2 1/8 97.2 2.396 149.51 3 60+83 1.4 RT SB 2 1/4 94.3 2.324 145.02 4 22+50 1.5 RT SB 2 1/8 94.4 2.327 145.20 5 36+78 1.4 RT SB 1 7/8 93.5 2.303 143.71 6 56+78 2.3 RT SB 2 1/4 93 2.292 143.02 7 35+97 5.9 LT SB 2 96.6 2.381 148.57 8 43+69 8.6 LT SB 1 3/4 96.1 2.367 147.70 9 60+34 2.1 LT SB 2 1/8 96.7 2.382 148.64 10 5+14 6.8 LT SB 1 5/8 95.3 2.349 146.58 11 20+41 8.1 LT SB 1 5/8 95.9 2.364 147.51 12 32+01 7.5 LT SB 1 3/4 96.5 2.379 148.45 13 57+63 9.0 LT NB 2 1/8 94.8 2.321 144.83 14 59+76 10.2 RT NB 1 7/8 95.8 2.344 146.27 15 84+48 2.9 RT NB 1 3/4 95.8 2.346 146.39 16 101+17 9.9 LT NB 2 96.7 2.368 147.76 17 110+81 9.9 RT NB 1 7/8 96.4 2.361 147.33 18 125+14 1.7 RT NB 2 94.7 2.318 144.64 19 67+53 10.6 LT SB 1 3/4 94.8 2.315 144.46 20 80+42 6.0 LT SB 1 1/2 96.8 2.363 147.45 21 92+21 2.2 LT SB 1 5/8 93.1 2.273 141.84 22 97+93 10.9 LT SB 1 3/4 94.5 2.308 144.02 23 121+58 10.6 LT SB 1 1/2 92.8 2.265 141.34 24 128+02 7.5 LT SB 1 1/2 94.2 2.3 143.52 25 224+27 4.4 LT SB 2 1/8 95.8 2.339 145.95 26 245+23 9.7 LT SB 2 97.6 2.383 148.70 27 256+37 1.1 LT SB 2 3/8 94.3 2.301 143.58 28 270+55 9.9 LT SB 2 1/8 94.9 2.317 144.58 29 277+62 7.3 LT SB 2 1/4 94.6 2.309 144.08 30 290+58 6.5 LT SB 2 96.1 2.346 146.39 31 171+67 7.8 RT NB 1 7/8 97 2.381 148.57 32 181+12 7.2 RT NB 2 1/8 96.3 2.362 147.39 33 191+98 7.0 RT NB 2 1/8 95.8 2.352 146.76 34 196+10 4.2 RT NB 2 1/4 96.4 2.366 147.64 35 204+63 1.4 RT NB 2 1/4 96 2.355 146.95 36 214+80 8.5 RT NB 2 1/4 95.7 2.348 146.52 37 136+26 2.6 LT SB 1 5/8 93 2.292 143.02 38 161+78 4.3 LT SB 2 93.9 2.315 144.46 39 166+40 9.8 LT SB 2 94.5 2.328 145.27 40 180+58 0.8 LT SB 1 5/8 94.4 2.325 145.08 41 193+47 6.7 LT SB 1 3/4 93 2.292 143.02 42 212+04 4.9 LT SB 1 1/8 91.6 2.257 140.84 43 145+04 4.0 RT NB 2 1/8 93.2 2.292 143.02 44 155+48 9.4 RT NB 2 94.8 2.333 145.58 45 164+86 6.1 RT NB 1 7/8 95.7 2.354 146.89 46 137+60 3.2 RT NB 2 95.8 2.358 147.14 47 137+68 8.4 RT NB 1 7/8 95.6 2.354 146.89 48 158+24 8.4 RT NB 2 1/8 94.4 2.324 145.02 49 300+71 4.5 RT 2 1/8 96.7 2.376 148.26 50 304+57 2.7 RT 1 7/8 95.6 2.349 146.58 51 309+65 3.6 RT 2 1/8 96.4 2.37 147.89
30
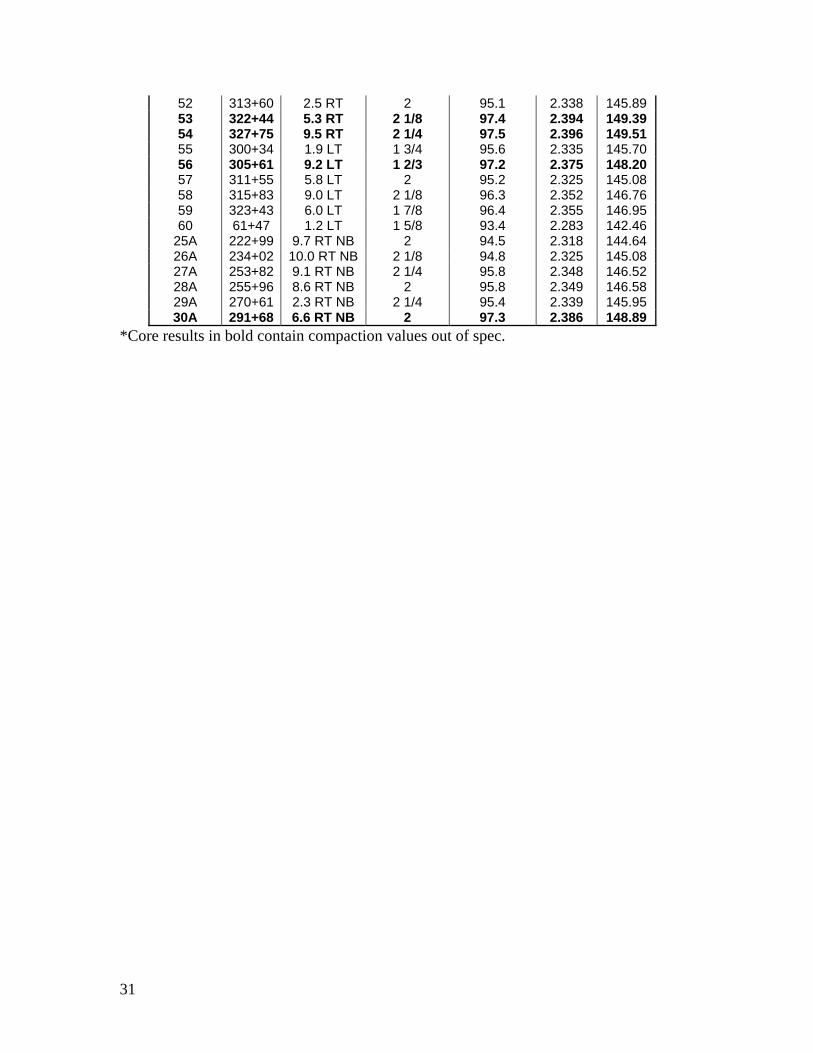
52 313+60 2.5 RT 2 95.1 2.338 145.89 53 322+44 5.3 RT 2 1/8 97.4 2.394 149.39 54 327+75 9.5 RT 2 1/4 97.5 2.396 149.51 55 300+34 1.9 LT 1 3/4 95.6 2.335 145.70 56 305+61 9.2 LT 1 2/3 97.2 2.375 148.20 57 311+55 5.8 LT 2 95.2 2.325 145.08 58 315+83 9.0 LT 2 1/8 96.3 2.352 146.76 59 323+43 6.0 LT 1 7/8 96.4 2.355 146.95 60 61+47 1.2 LT 1 5/8 93.4 2.283 142.46
25A 222+99 9.7 RT NB 2 94.5 2.318 144.64 26A 234+02 10.0 RT NB 2 1/8 94.8 2.325 145.08 27A 253+82 9.1 RT NB 2 1/4 95.8 2.348 146.52 28A 255+96 8.6 RT NB 2 95.8 2.349 146.58 29A 270+61 2.3 RT NB 2 1/4 95.4 2.339 145.95 30A 291+68 6.6 RT NB 2 97.3 2.386 148.89
*Core results in bold contain compaction values out of spec.
31
Appendix C Winter 2008/2009 Cracking
32
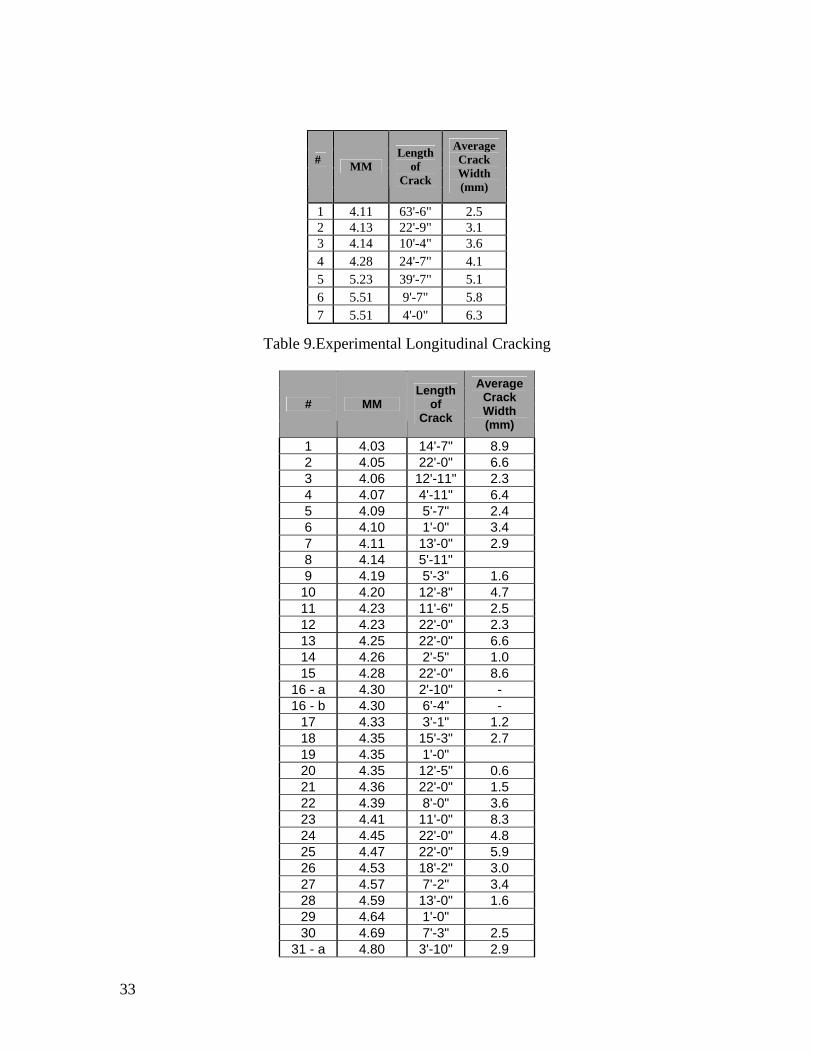
Table 9.Experimental Longitudinal Cracking
# MM Length
of Crack
Average Crack Width (mm)
1 4.03 14'-7" 8.9 2 4.05 22'-0" 6.6 3 4.06 12'-11" 2.3 4 4.07 4'-11" 6.4 5 4.09 5'-7" 2.4 6 4.10 1'-0" 3.4 7 4.11 13'-0" 2.9 8 4.14 5'-11" 9 4.19 5'-3" 1.6
10 4.20 12'-8" 4.7 11 4.23 11'-6" 2.5 12 4.23 22'-0" 2.3 13 4.25 22'-0" 6.6 14 4.26 2'-5" 1.0 15 4.28 22'-0" 8.6
16 - a 4.30 2'-10" - 16 - b 4.30 6'-4" -
17 4.33 3'-1" 1.2 18 4.35 15'-3" 2.7 19 4.35 1'-0" 20 4.35 12'-5" 0.6 21 4.36 22'-0" 1.5 22 4.39 8'-0" 3.6 23 4.41 11'-0" 8.3 24 4.45 22'-0" 4.8 25 4.47 22'-0" 5.9 26 4.53 18'-2" 3.0 27 4.57 7'-2" 3.4 28 4.59 13'-0" 1.6 29 4.64 1'-0" 30 4.69 7'-3" 2.5
31 - a 4.80 3'-10" 2.9
#
MM Length
of Crack
Average Crack Width (mm)
1 4.11 63'-6" 2.5 2 4.13 22'-9" 3.1 3 4.14 10'-4" 3.6 4 4.28 24'-7" 4.1 5 5.23 39'-7" 5.1 6 5.51 9'-7" 5.8 7 5.51 4'-0" 6.3
33
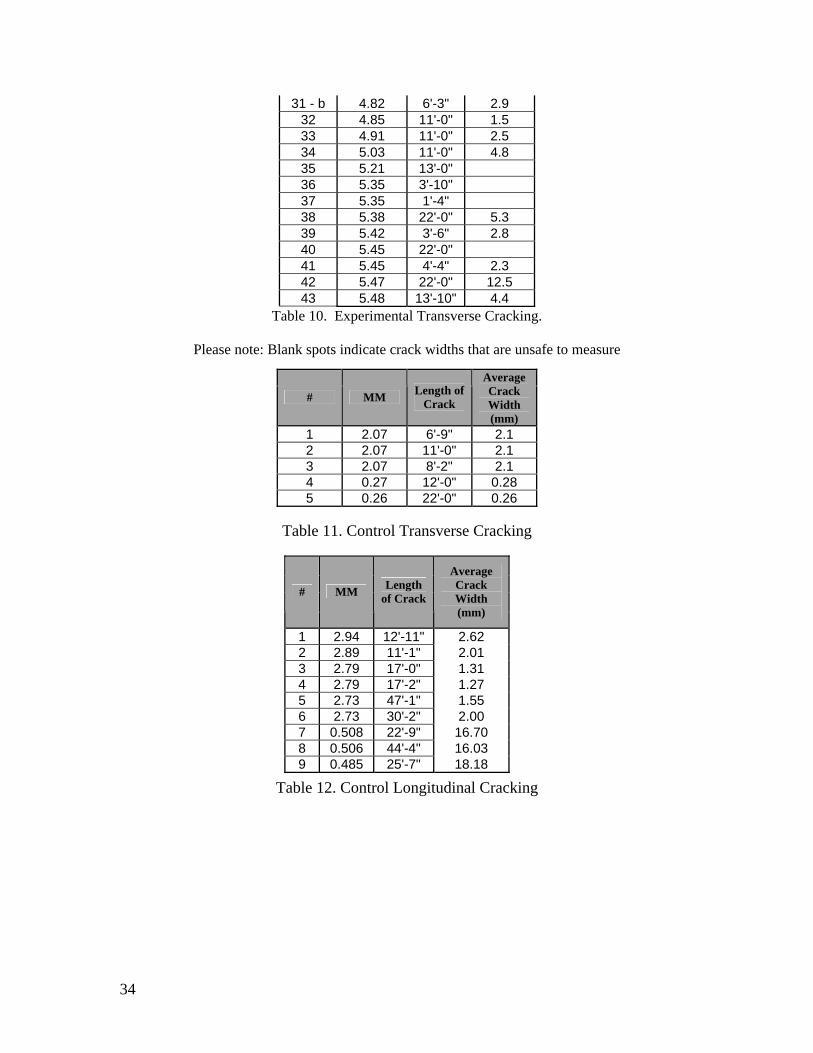
31 - b 4.82 6'-3" 2.9 32 4.85 11'-0" 1.5 33 4.91 11'-0" 2.5 34 5.03 11'-0" 4.8 35 5.21 13'-0" 36 5.35 3'-10" 37 5.35 1'-4" 38 5.38 22'-0" 5.3 39 5.42 3'-6" 2.8 40 5.45 22'-0" 41 5.45 4'-4" 2.3 42 5.47 22'-0" 12.5 43 5.48 13'-10" 4.4
Table 10. Experimental Transverse Cracking.
Please note: Blank spots indicate crack widths that are unsafe to measure
# MM Length of
Crack
Average Crack Width (mm)
1 2.07 6'-9" 2.1 2 2.07 11'-0" 2.1 3 2.07 8'-2" 2.1 4 0.27 12'-0" 0.28 5 0.26 22'-0" 0.26
Table 11. Control Transverse Cracking
# MM Length
of Crack
Average Crack Width (mm)
1 2.94 12'-11" 2.62 2 2.89 11'-1" 2.01 3 2.79 17'-0" 1.31 4 2.79 17'-2" 1.27 5 2.73 47'-1" 1.55 6 2.73 30'-2" 2.00 7 0.508 22'-9" 16.70 8 0.506 44'-4" 16.03 9 0.485 25'-7" 18.18
Table 12. Control Longitudinal Cracking
34

Appendix D Rutting Data
35
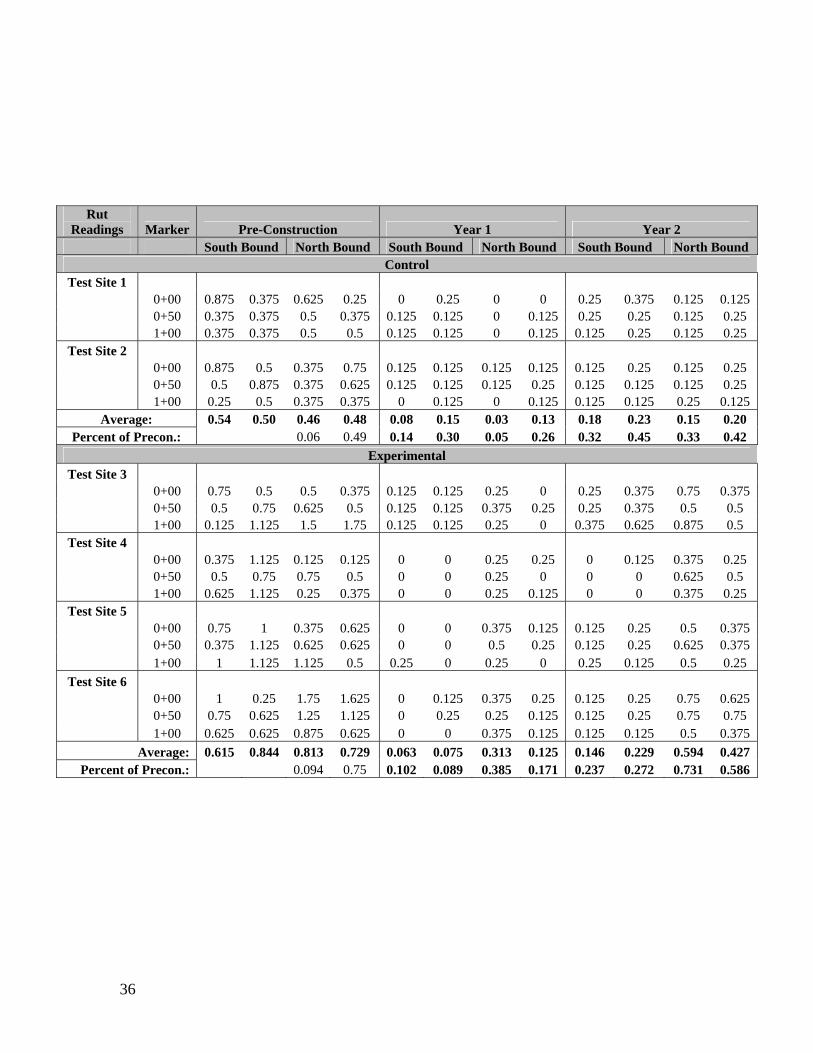
36
Rut Readings Marker Pre-Construction Year 1 Year 2
South Bound North Bound South Bound North Bound South Bound North Bound Control
Test Site 1 0+00 0.875 0.375 0.625 0.25 0 0.25 0 0 0.25 0.375 0.125 0.125 0+50 0.375 0.375 0.5 0.375 0.125 0.125 0 0.125 0.25 0.25 0.125 0.25
1+00 0.375 0.375 0.5 0.5 0.125 0.125 0 0.125 0.125 0.25 0.125 0.25 Test Site 2
0+00 0.875 0.5 0.375 0.75 0.125 0.125 0.125 0.125 0.125 0.25 0.125 0.25 0+50 0.5 0.875 0.375 0.625 0.125 0.125 0.125 0.25 0.125 0.125 0.125 0.25 1+00 0.25 0.5 0.375 0.375 0 0.125 0 0.125 0.125 0.125 0.25 0.125
Average: 0.54 0.50 0.46 0.48 0.08 0.15 0.03 0.13 0.18 0.23 0.15 0.20 Percent of Precon.: 0.06 0.49 0.14 0.30 0.05 0.26 0.32 0.45 0.33 0.42
Experimental
Test Site 3 0+00 0.75 0.5 0.5 0.375 0.125 0.125 0.25 0 0.25 0.375 0.75 0.375 0+50 0.5 0.75 0.625 0.5 0.125 0.125 0.375 0.25 0.25 0.375 0.5 0.5
1+00 0.125 1.125 1.5 1.75 0.125 0.125 0.25 0 0.375 0.625 0.875 0.5 Test Site 4
0+00 0.375 1.125 0.125 0.125 0 0 0.25 0.25 0 0.125 0.375 0.25 0+50 0.5 0.75 0.75 0.5 0 0 0.25 0 0 0 0.625 0.5 1+00 0.625 1.125 0.25 0.375 0 0 0.25 0.125 0 0 0.375 0.25 Test Site 5
0+00 0.75 1 0.375 0.625 0 0 0.375 0.125 0.125 0.25 0.5 0.375 0+50 0.375 1.125 0.625 0.625 0 0 0.5 0.25 0.125 0.25 0.625 0.375
1+00 1 1.125 1.125 0.5 0.25 0 0.25 0 0.25 0.125 0.5 0.25
Test Site 6 0+00 1 0.25 1.75 1.625 0 0.125 0.375 0.25 0.125 0.25 0.75 0.625 0+50 0.75 0.625 1.25 1.125 0 0.25 0.25 0.125 0.125 0.25 0.75 0.75 1+00 0.625 0.625 0.875 0.625 0 0 0.375 0.125 0.125 0.125 0.5 0.375
Average: 0.615 0.844 0.813 0.729 0.063 0.075 0.313 0.125 0.146 0.229 0.594 0.427 Percent of Precon.: 0.094 0.75 0.102 0.089 0.385 0.171 0.237 0.272 0.731 0.586