Embed Size (px)
Citation preview

Departamento de Ciências e Engenharia do Ambiente
The influence of sludge characteristics from full-
scale MBR in membrane filterability
Francisco Miguel Martins Correia da Piedade
Dissertação apresentada na Faculdade de Ciências e Tecnologia da Universidade
Nova de Lisboa para a obtenção do grau de Mestre em Engenharia do Ambiente,
perfil Sanitária
Orientador científico: Professora Doutora Leonor Amaral
Lisboa, 2009


I dedicate this thesis to my parents


v
ACKNOWLEDGEMENTS
The research project took place at the Sanitary Department in the Civil Engineering
Faculty at TU Delft University from September 2008 till February 2009. Through this
University it was possible to visit and apply practical work in MBR systems in The
Netherlands and Germany.
This thesis was mostly written in Portugal at the Faculty of Science and Technology of the
New University of Lisbon.
I would like to thank my supervisor Leonor Amaral for all her support throughout this
entire project, for her trust in me and for being fully available to answer any of my doubts.
Maria Lousada Ferreira, I´m deeply thankful for your encouragement during the research
period, and for sharing your knowledge which enriched the core of this thesis. I would also
like to express my appreciation for making me feel welcomed at TU Delft since the day I
arrived and for your daily support. Not only are you a friend, you are also my mentor.
I would like to express my appreciation to everyone in the Sanitary Department of TU
Delft for their friendship and support.
I would also like to thank Tony Schuit for his help and good advices during practical work
in the laboratory. Patrick Andeweg, it was great to meet you. Not only were you always
there for me but you also made the laboratory a fun place to work. Thanks for the
wonderful conversations and I believe someday we´ll be talking in Portuguese.
Patrícia Palma helped me improve the english of this thesis. Thank you so much for your
effort and advice, which resulted in a better thesis.
I am very grateful to my parents for giving me this opportunity and for their support during
this period. Special thanks to my brother and sister for their support.
I would also like to thank Inês and all my friends in The Netherlands and in Portugal.


vii
RESUMO
No tratamento de águas residuais, o uso de bioreactores de membranas (MBR), oferece
várias vantagens quando comparado com sistemas de tratamento convencionais. A
possibilidade de necessitar apenas de uma reduzida área em planta, a produção de um
efluente final de elevada qualidade e uma baixa produção de lamas são algumas dessas
vantagens. No entanto, o fenómeno fouling ao nível da membrana constitui a principal
limitação desta nova tecnologia, aumentando os custos operacionais associados ao
arejamento intensivo e à limpeza física e química.
Esta tese tem como objectivo o estudo de características presentes nas lamas e a forma
como estas contribuem para a filterabilidade da mesma.
No âmbito, mais alargado, deste projecto de investigação, entre Setembro de 2008 a
Fevereiro de 2009, foram visitados cinco sistemas de MBR à escala real. Foram efectuadas
três tipos de experiências: a Caracterização de Amostras de diferentes sistemas MBR; uma
experiência com base em Diluições para obter diferentes concentrações de sólidos; e ainda
a experiência Concentração de Sólidos também para estudar o impacto de diferentes
concentrações de sólidos através da alteração do tempo de retenção hidráulico (TRH) num
sistema MBR.
Em todas as experiências a filterabilidade das amostras de lamas foi medida através do
método de caracterização de filtração (DFCm) desenvolvido pela Universidade de
Tecnologia de Delft (Evenblij et.al,., 2005). Este método permite medir a resistência
adicional na membrana, ∆R20, durante um ensaio de filtração. Para além da filterabilidade
das amostras, foi medido, sempre que possível, a concentração de sólidos, as partículas nos
intervalos 2-100 µm e 0.4-5.0 µm, produtos microbianos solúveis e viscosidade. Para cada
amostra correlacionou-se filterabilidade com os restantes parâmetros medidos, com vista à
explicação para o desempenho observado no processo de filtração.
Nos resultados obtidos não foi encontrada nenhuma relação entre a filterabilidade e a
concentração de sólidos. Na experiência Caracterização de Amostras foi encontrada uma
relação tripla entre filterabilidade, produtos microbianos solúveis e temperatura. Nas

viii
temperaturas mais baixas foram registadas elevadas concentrações destas substâncias, que
coincidiram com as piores filterabilidades observadas. Esta relação também foi observada
na experiência das Diluições, embora a nível inferior.
As partículas no intervalo 0.4-1.0 µm revelaram uma relação significativa com os produtos
microbianos solúveis. Embora se considere que as partículas destes produtos se encontrem
em intervalos de menores dimensões, a contagem de partículas no intervalo 0.4-1.0 µm
parece ser uma boa ferramenta indicativa das concentrações de produtos microbianos
solúveis existentes em lamas activadas.
Na experiência de Concentração de Sólidos uma melhoria na filterabilidade foi observada
quando o TRH variou de 17 para 30.8-40.8 horas, período durante o qual a concentração de
sólidos se alterou de 14.3 para 18.2 g/L. No entanto, não é possível assegurar se a
concentração de sólidos teve um papel fundamental na filterabilidade.

ix
ABSTRACT
In wastewater treatment, membrane bioreactor systems (MBR) offer several advantages
when compared with conventional treatment processes. A small footprint, the production
of a high quality effluent, and low sludge production are some of the advantages of this
“recent” technology. However, membrane fouling is still a major drawback, increasing the
operational costs since intensive aeration and physical/chemical cleaning are required.
This thesis aims to study which characteristics/components present in the sludge constitute
an influence in the filterability of activated sludge, which is a measure of fouling
propensity.
A research was conducted between September 2008 and February 2009, in which five full-
scale MBR were visited. Three different experiments occurred during this period: the
Blank Characterization experiment to study the characteristics of sludge from MBR; the
Dilutions experiment to see the effect of different MLSS in membrane filterability, using
sludge dilutions with permeate; and the Solids Concentration experiment to study the
impact of MLSS in filterability through manipulating hydraulic retention time (HRT) in a
full-scale MBR. In all experiments the filterability of the sludge was measured through the
Delft Filtration Characterization method developed by TUDelft (Evenblij et. al., 2005).
This method allows measuring the additional resistance in the membrane during membrane
filtration. Also, when possible, other parameters were measured in the sludge such as
MLSS, particles in the ranges 2-100 µm and 0.4-5.0 µm, soluble microbial products
(SMP), and viscosity. A relationship between filterability and each one of the other
parameters was tried to explain the membrane performance.
The results showed that no single or direct correlation between filterability and MLSS
existed. From the analysis of sludge from a full-scale MBR, a three-way relationship was
observed between filterability, SMP and temperature. Higher concentrations of SMP were
observed at lower temperatures, while at the same time filterability showed worst results.
This was also confirmed by the analysis of the diluted samples, though at a lower level.
The particles in the range 0.4-1.0 µm demonstrated a significant relationship with SMP.
Although SMP particles are considered to be smaller than the observed range, particle

x
counting in the range 0.4-1.0 µm seems to be a good indicative of SMP levels in the
activated sludge. The Solids Concentration experiment showed that an improvement in
membrane filtration occurred when hydraulic retention time (HRT) was changed from 17
hours to 30.8-40.8 hours at the same time that MLSS varied between approximately 14.3
and 18.2 g/L. However, it cannot be assured that MLSS by itself played a major role in
filterability.

xi
ABBREVIATIONS
ASP – Activated Sludge Process
BOD - Biological oxygen demand
COD – Chemical oxygen demand
D10p – dilution with 10L of permeate + 20L of sludge
D20p - dilution with 20L of permeate + 10L of sludge
∆R20- Added resistance when 20 L/m2 of permeate have been extracted
DFCi - Delft filtration characterization installation
DFCm - Delft filtration characterization method
DWF – Dry weather flow
EPS - Extracellular polymeric substances
F/M - Food to microorganism ratio
MBR – Membrane Bioreactor
MF - Microfiltration
MLSS - Mixed liquor suspended solids
MLVSS - Mixed liquor volatile suspended solids
MT – Membrane Tank
MWCO – Molecular weight cut-off
NF - Nanofiltration
RO - Reverse osmosis
SMP - Soluble microbial products
SRT - Solids retention time
SVI – Sludge volume index
TMP – Trans membrane pressure
TSS – Total suspended solids
xii
UF - Ultrafiltration
WWTP – Wastewater treatment plant

xiii
CONTENTS
1 INTRODUCTION .............................................................................................................. 1
1.1 Membrane Bioreactors, technology of the future? ...................................................... 1
1.2 Goals of this Thesis ...................................................................................................... 2
1.3 Structure of the Thesis ................................................................................................. 2
2 FUNDAMENTALS ........................................................................................................... 3
2.1 Introduction .................................................................................................................. 3
2.2 Activated Sludge Process ............................................................................................. 3
2.3 Membrane filtration ..................................................................................................... 6
2.3.1 Membrane filtration process ................................................................................. 6
2.3.2 Membrane materials ............................................................................................. 7
2.3.3 Membrane configurations ..................................................................................... 8
2.3.4 Membrane process operation ................................................................................ 9
2.3.5 Membrane fouling .............................................................................................. 11
2.4 Membrane bioreactor technology .............................................................................. 14
2.4.1 MBR configurations ........................................................................................... 14
2.4.2 MBR history ....................................................................................................... 15
2.4.3 MBR operating conditions ................................................................................. 16
2.4.4 Fouling control and mitigation ........................................................................... 19
2.4.5 Comparison between MBR and Conventional Activated Sludge (CAS) ........... 22
3 LITERATURE REVIEW ON MEMBRANE FOULING ............................................... 25
3.1 Mixed liquor suspended solids (MLSS) .................................................................... 25
3.2 Particle size ................................................................................................................ 26
3.2.1 Characterization of the wastewaster ................................................................... 26
3.2.2 Particle size distribution (PSD) in MBR ............................................................ 27
3.3 Extracellular Polymeric Substances (EPS) ................................................................ 29
3.3.1 EPS background ................................................................................................. 29
3.3.2 EPS and membrane fouling ................................................................................ 31
3.4 Viscosity .................................................................................................................... 32
3.4.1 Rheology theory ................................................................................................. 32
xiv
3.4.2 Viscosity and membrane fouling ........................................................................ 35
4 METHODOLOGY ........................................................................................................... 37
4.1 Three different experiments ....................................................................................... 37
4.1.1 Blanks Characterization experiment ................................................................... 38
4.1.2 Dilutions experiment .......................................................................................... 38
4.1.3 Solids Concentration Experiment ....................................................................... 38
4.2 General measuring protocol ....................................................................................... 39
4.3 Delft Filtration Characterization installation (DFCi) ................................................. 41
4.3.1 Membrane ........................................................................................................... 43
4.3.2 Pumps ................................................................................................................. 43
4.3.3 Online measuring instruments ............................................................................ 44
4.3.4 Mass balance....................................................................................................... 45
4.3.5 Pressure transmitters ........................................................................................... 46
4.3.6 Programmable Logic Controller (PLC) .............................................................. 46
4.3.7 Measuring Protocol - DFCm .............................................................................. 46
4.3.8 Data acquisition and output ................................................................................ 47
4.4 Particle counting in range 2-100 µm.......................................................................... 49
4.4.1 Materials ............................................................................................................. 49
4.4.2 Measuring protocol ............................................................................................. 51
4.4.3 Data acquisition .................................................................................................. 53
4.5 Particle counting in range 0.4 - 5 µm......................................................................... 55
4.5.1 Materials ............................................................................................................. 55
4.5.2 Measuring protocol ............................................................................................. 56
4.5.3 Data acquisition .................................................................................................. 57
4.6 Soluble Microbial Products (SMP) ............................................................................ 58
4.6.1 Materials ............................................................................................................. 58
4.6.2 Measuring protocol for Proteins ......................................................................... 58
4.6.3 Measuring protocol for Polysaccharides ............................................................ 59
4.7 Viscosity .................................................................................................................... 60
4.7.1 Materials ............................................................................................................. 60
4.7.2 Measuring protocol ............................................................................................. 61
4.8 Mixed Liquor Suspend Solids (MLSS) ..................................................................... 62

xv
5 BLANKS CHARACTERIZATION EXPERIMENT ...................................................... 63
5.1 Characterization of five MBR systems ...................................................................... 63
5.2 Filtration characteristics - ∆R20, MLSS and Temperature ....................................... 65
5.2.1 Results ................................................................................................................ 65
5.2.2 Correlating filterability with MLSS and Temperature ....................................... 68
5.3 Particle counting in the range size of 2-100 µm ........................................................ 70
5.3.1 Characterization of the particle size and volume distributions........................... 70
5.3.2 Correlation between filterability with particle counting in range 2-87 µm ........ 75
5.4 Particle counting in the range size of 0.4-5 µm ......................................................... 78
5.4.1 Characterization of the particle size and volume distributions........................... 78
5.4.2 Correlation between filterability and particle counting in range 0.4-1.0 µm ..... 81
5.5 Soluble Microbial Products ....................................................................................... 83
5.5.1 SMP results ......................................................................................................... 83
5.5.2 Correlating filterability with SMP ...................................................................... 85
5.6 Viscosity .................................................................................................................... 87
5.6.1 Results ................................................................................................................ 88
5.6.2 Correlating viscosity ........................................................................................... 89
5.7 Conclusions ................................................................................................................ 91
6 DILUTIONS EXPERIMENT........................................................................................... 95
6.1 Filtration characteristics - MLSS and ∆R20 ............................................................... 95
6.1.1 Results and Discussion ....................................................................................... 95
6.2 Particle counting in the range size 2-100 µm ............................................................ 98
6.2.1 Particle counting characterization ...................................................................... 98
6.2.2 Correlation between filterability with particle counting in range 2-87 µm ...... 100
6.3 Particle counting in the range size of 0.4-5.0 µm .................................................... 101
6.3.1 Characterization of the particle size and volume distributions......................... 101
6.3.2 Correlation between filterability and particle counting in range 0.4-1.0 µm ... 102
6.4 Soluble Microbial Products ..................................................................................... 105
6.4.1 Results .............................................................................................................. 105
6.4.2 Correlating filterability with SMP .................................................................... 107
6.5 Viscosity .................................................................................................................. 109
6.5.1 Results .............................................................................................................. 109
xvi
6.5.2 Correlating viscosity ......................................................................................... 111
6.6 Conclusions .............................................................................................................. 113
7 SOLIDS CONCENTRATION EXPERIMENT ............................................................. 117
7.1 Filterability ............................................................................................................... 118
7.1.1 Results .............................................................................................................. 118
7.1.2 Correlating filterability ..................................................................................... 120
7.2 Particle counting in the range size of 2-100 µm ...................................................... 121
7.2.1 Results and Discussion ..................................................................................... 121
7.3 Viscosity .................................................................................................................. 123
7.3.1 Results and discussion ...................................................................................... 123
7.4 Conclusions .............................................................................................................. 126
8 GENERAL CONCLUSIONS AND RECOMMENDATIONS FOR FURTHER
RESEARCH ........................................................................................................................... 129
8.1 General conclusions ................................................................................................. 129
8.2 Recommendations for further research .................................................................... 131
9 REFERENCES ............................................................................................................... 132
APPENDIX I - MBR market in Europe .................................................................................. 143
APPENDIX II – Product details ultrafiltration membrane ...................................................... 145
APPENDIX III – Product details particle counter in range 2-100 µm .................................... 147
APPENDIX IV – Product details particle counter in range 0.4-5.0 µm .................................. 149
APPENDIX V – Product details Anton Paar rheometer ......................................................... 151
APPENDIX VI – Standard Methods for MLSS ...................................................................... 153
APPENDIX VII – Blanks Characterization experiment results .............................................. 157
APPENDIX VIII – MBR systems configurations ................................................................... 163
APPENDIX IX – Dilutions experiment results. ...................................................................... 165
APPENDIX X – Solids Concentration experiment results. .................................................... 175

xvii
LIST OF FIGURES
Figure 2-1 - Schematic representation of membrane filtration process ................................ 7
Figure 2-3 – Membrane types .............................................................................................. 8
Figure 2-4 –Dead-end and cross-flow filtration ................................................................ 11
Figure 2-5 – Fouling mechanisms in cross-flow filtration ................................................ 13
Figure 2-7 – Evolution of municipal and industrial MBR applications in Europe along the
period 1990-2005 ........................................................................................................ 16
Figure 3-1 –Relative contributions (%) of the different biomass fractions to MBR fouling
..................................................................................................................................... 27
Figure 3-2 –Schematic of EPS and SMP ............................................................................ 30
Figure 3-3 – Schematic flow curves for model time-independent materials ..................... 33
Figure 4-1– Schematic overview of the DFCm ................................................................. 42
Figure 4-2 – DFCi during filtration campaign at Monheim .............................................. 43
Figure 4-3 - Additional resistance and TMP alongside permeate volume extraction ........ 47
Figure 4-4 – Overview of resistance, flux, and TMP while extracting permeate ............... 48
Figure 4-5 – Overview of CFV, pH, oxygen content, and temperature, during a filtration
test ................................................................................................................................ 49
Figure 4-7 – Particle counting installation at TUDelft laboratory ...................................... 51
Figure 4-8 – Schematic overview of the particle counting installation in range 0.4-5.0 µm
..................................................................................................................................... 56
Figure 4-9 – Particle counting installation at TUDelft laboratory ...................................... 56
Figure 4-10 – Viscosity installation at TUDelft laboratory ................................................ 61
Figure 5-1 –Filterability plotted against MLSS according to each WWTP ....................... 67
Figure 5-2 – Temperature and ∆R20 by experiment date .................................................... 68
Figure 5-3 –Filterability plotted against MLSS according to sludge quality ..................... 69
Figure 5-4 – Temperature “in situ” vs. ∆R20 ...................................................................... 69
Figure 5-5 – Particle number distribution representative of different full-scale MBR ...... 71
Figure 5-6 –Cumulative particle number of different WWTP ........................................... 72
Figure 5-7 - Mean particle size of maximum particle number per WWTP ........................ 73
Figure 5-8 – Particle volume distribution representative of different full-scale MBR....... 74
Figure 5-9 – Cumulative particle volume per WWTP........................................................ 74

xviii
Figure 5-10 – Mean particle size of maximum particle volume ......................................... 75
Figure 5-11 – Cumulative particle number and ∆R20 by group quality.............................. 76
Figure 5-12 – Mean particle size of maximum particle volume per group quality ............ 77
Figure 5-13 – Mean particle size of maximum particle volume vs. filterability ................ 77
Figure 5-14 – Particle number distribution in the range 0.4-5 µm .................................... 79
Figure 5-15 – Cumulative particle number in the range 0.4-1.0 µm .................................. 80
Figure 5-16 - Particle volume distribution in the range 0.45-1.0 µm ................................. 80
Figure 5-17 Cumulative particle number and ∆R20 by group quality................................. 81
Figure 5-18 - Proteins and polysaccharides by WWTP with respective temperature ........ 84
Figure 5-19 – Protein concentrations plotted against ∆R20 ................................................ 85
Figure 5-20 – Polysaccharide concentrations plotted against ∆R20 .................................... 85
Figure 5-21 – Proteins and polysaccharides plotted against temperature........................... 86
Figure 5-22 – Rheogram for all blanks with the respective MLSS concentration ............. 88
Figure 5-23 – Apparent viscosity per blank samples.......................................................... 89
Figure 5-24 – Apparent viscosity from the rheometer measurements and Rosenberger´s
and Laera´s formulas ................................................................................................... 90
Figure 5-25 – Apparent viscosity (100 s-1) and filterability ............................................... 91
Figure 6-1 – MLSS plotted against ∆R20 by set ................................................................. 96
Figure 6-2 MLSS plotted against ∆R20 – Group A and Group B ...................................... 97
Figure 6-4 – Mean particle size of maximum particle number (all sets) .......................... 100
Figure 6-5– Particle volume distribution (Set 8) .............................................................. 100
Figure 6-6– Particle number distribution (Set 1) .............................................................. 102
Figure 6-7 – Cumulative particle number in the range 0.4-1.0µm vs. ∆R20, by set and
group .......................................................................................................................... 103
Figure 6-8 – Cumulative particle number in the range 0.4-1.0µm vs. ∆R20..................... 104
Figure 6-9 – Variation of protein and polysaccharide concentrations compared to blank
initial concentration (%) ............................................................................................ 106
Figure 6-11 – Protein concentration and ∆R20 by set ....................................................... 108
Figure 6-12 – Shear rate vs. apparent viscosity for Set 3 (T=20 ±1oC)............................ 110
Figure 6-13 – Shear rate vs. apparent viscosity for D10p (T=20 ±1oC) ........................... 110
Figure 6-14 – Shear rate vs. apparent viscosity for D20p (T=20 ±1oC) ........................... 111
Figure 6-15 - Apparent viscosity (100 s-1) and filterability – D10p and D20p ............... 113
Figure 7-1 – ∆R20 and MLSS in January 20th ................................................................... 119

xix
Figure 7-2 – MLSS and ∆R20 in January 22nd .................................................................. 119
Figure 7-3 – Correlation between ∆R20 and MLSS in January 20th and 22nd ................... 120
Figure 7-4 – Cumulative particle number and ∆R20 on January 20th and 22nd ................. 122
Figure 7-5 – Shear rate vs. apparent viscosity for day 20th .............................................. 123
Figure 7-6 – Shear rate vs. apparent viscosity for day 22nd .............................................. 124
Figure 7-7 – Filterability and apparent viscosity (100 s-1) – January 20th ........................ 125

xx

xxi
LIST OF TABLES
Table 2-1 – Membrane processes overview.......................................................................... 7
Table 2-3 – Cost comparison study between MBR and CAS ............................................ 23
Table 2-4– Main advantages and disadvantages of MBR ................................................. 24
Table 4-1 – Overview of all experiments between September 08 and February 09 ........... 41
Table 4-2 – Sludge quality according to ∆R20 values ......................................................... 48
Table 5-1 – Overview of the main differences in the five WWTP ..................................... 65
Table 5-2 - Experiments carried out in the period of September 08 – February 09 ........... 66
Table 5-3 – Results from particle counting analysis in the range 2-100 µm ...................... 70
Table 5-4 – Results from particle counting analysis in the range 0.4-5 µm ....................... 78
Table 5-6 – SMP results: protein and polysaccharide concentrations ................................ 83
Table 5-7 – Correlation factors between SMP and particle counting parameters in range
0.4-1.0 µm ................................................................................................................... 87
Table 6-1 – Filtration characteristics from Dilutions experiment ....................................... 95
Table 6-2 – Correlations between filterability and particle counting parameters ............. 104
Table 6-3 – Protein and polysaccharide concentrations in mg/L by set ........................... 105
Table 6-4 – Proteins and polysaccharides retained in the membrane .............................. 107
Table 6-6– Correlation factors between MLSS and apparent viscosity, according to
dilution type ............................................................................................................... 112
Table 7-1 – Main results from the filterability tests performed (January 20th and 22nd) .. 118

The influence of sludge characteristics from full-scale MBR in membrane filterability
1
1 INTRODUCTION
1.1 Membrane Bioreactors, technology for the future?
The Membrane Bioreactor (MBR) process is a combination of the activated sludge process
with a membrane separation step. This recent technology is currently experiencing
accelerated growth, and this growth is expected to be sustained over the next decade (Judd,
2006).
One of the major advantages of this technology is the replacement of the secondary
sedimentation tank by a membrane, allowing a smaller footprint. Besides reducing the size
of the treatment plant, other advantages are inherent to an MBR: a high quality effluent,
which can be reused, is achieved as a result of the selectivity of the membrane; higher rates
can be reached for removal of biological oxygen demand (BOD) and chemical oxygen
demand (COD); a lower excess sludge production takes place.
However, the MBR technology is not yet optimized with membrane fouling being the main
drawback. Fouling leads to a decrease of the filtration flux and subsequently of the effluent
production. In order to minimize fouling, several procedures are applied such as physical
and chemical cleaning, intensive aeration, and pre-treatment of the biomass suspension.
These reasons, and also the membrane prices, make MBR an expensive technology.
Membrane fouling can be mainly influenced by three factors: operating conditions, nature
of the membrane, and the biomass which is mainly influenced by the nature of the feed
solution (Lojkine et.al,., 1992).
This thesis focuses on the influence of biomass in membrane fouling.

The influence of sludge characteristics from full-scale MBR in membrane filterability
2
1.2 Goals of this Thesis
This thesis aims to study which characteristics/components present in the sludge constitute
an influence to the filterability of activated sludge, which is a measure of fouling
propensity.
In order to obtain results for the proposed objective a careful protocol was defined. Five
key parameters for the sludge analysis were chosen: filterability, mixed liquor suspended
solids (MLSS), particles in ranges 2-100 µm and 0.4-5.0 µm, soluble microbial products
(SMP), and viscosity. Three different experiments were applied with different objectives.
The experiments carried out were always performed with sludge from a full-scale MBR so
that the conclusions drawn were closer to “reality”. For this reason, sludge samples were
collected from five different MBR located both in The Netherlands and Germany.
1.3 Structure of the Thesis
In Chapter 2 Fundamentals the general terms and concepts associated to wastewater
treatment, membrane filtration and membrane technology are addressed.
Next, a literature review is given in Chapter 3 concerning four main topics related to
membrane fouling: mixed liquor suspended solids (MLSS), particle size, extracellular
polymeric substances (EPS), and viscosity.
The methodology followed on this thesis is presented in Chapter 4, where the general
measuring protocol is described as well as the materials and methods for each test applied
in this research.
The results and discussion from the three experiments realized are presented in Chapters 5,
6 and 7. At the end of each chapter the conclusions drawn are shown.
In Chapter 8, the general conclusions obtained are demonstrated, and recommendations for
further research are given.

The influence of sludge characteristics from full-scale MBR in membrane filterability
3
2 FUNDAMENTALS
2.1 Introduction
In this chapter, background information is given for this thesis. The Chapter is divided in
three parts, firstly focusing on the main characteristics and parameters inherent to the
activated sludge process; secondly, membrane filtration is addressed regarding the
filtration process, membrane materials and configurations, and also a short overview of
membrane fouling; thirdly, membrane bioreactor technology is discussed considering
background history, materials and operation process.
In the first part of this chapter, the 4th edition of the handbook on Wastewater engineering:
treatment and reuse (Metcalf & Eddy, 2003) is used. The second and third parts are a
combination of several sources and, especially in the third part, the publications The MBR
book: Principles and Applications of Membrane Bioreactors in Water and Wastewater
Treatment (Judd, 2006) and Filtration Characteristics in Membrane Bioreactors (Evenblij,
2006) are used.
2.2 Activated Sludge Process
The activated sludge process (ASP) dates back to 1914 when Ardern and Lockett
discovered that sludge could be “active” when intensively aerated. Then, the biomass
would be able to achieve an aerobic stabilization of organic material which would have an
important role in the treatment of wastewater.
The process was developed all over the world and many configurations have been applied
since then. Nevertheless, there are three main basic components inherent to this process:
• Bioreactor, where the biomass is kept in suspension and aerated
• Liquid-solids separation, commonly in a sedimentation tank
• Recycle system, to bring back to the bioreactor part of the solids removed in the
sedimentation tank

The influence of sludge characteristics from full-scale MBR in membrane filterability
4
A major feature in the ASP is the formation of floc particles (flocculent settleable solids),
between the range size of 50 µm and 200 µm, that can be removed by gravity in
sedimentation tanks. The resulting clarified liquid can be discharged and part of the settled
sludge can now return to the bioreactor.
In the wastewater treatment two important processes precede the ASP. The first is a
preliminary treatment consisting in the removal of coarse solids, grit and grease that may
cause maintenance or operational problems in the following processes. Next, a primary
treatment is frequently applied to remove part of the suspended solids and organic matter
from the wastewater.
Generally, activated sludge aims to remove biodegradable organics, nutrients (nitrogen and
phosphorous), and pathogens. The biodegradable organics are principally composed of
proteins, carbohydrates and fats, most commonly measured in terms of biochemical
oxygen demand (BOD) and chemical oxygen demand (COD). The wide range of
microorganisms in activated sludge, principally bacteria, has an essential role in the
removal of dissolved and particulate carbonaceous BOD and in the stabilization of organic
matter in wastewater.
Nitrogen and phosphorous are also removed by microorganisms. Nitrogen removal
consists first in a nitrification reaction where ammonia is oxidized to nitrite and nitrate by
specific bacteria, and subsequently in a denitrification process in which oxidized nitrogen
is converted into gaseous nitrogen by other bacteria. For phosphorous removal, the growth
of bacteria is encouraged, through specific biological processes, with the ability to take up
and store large amounts of inorganic phosphorous.
In the bioreactor, or aeration tank, adequate mixing is provided between the influent and
the returned sludge from the sedimentation tank, with a biomass concentration. This
mixture is usually mentioned as mixed liquor suspended solids (MLSS) and mixed liquor
volatile suspended solids (MLVSS).
The design of ASP has to be adequate to the characteristics of the wastewater in order to
achieve a good quality effluent. Solids retention time (SRT), food to microorganisms

The influence of sludge characteristics from full-scale MBR in membrane filterability
5
(F/M), volumetric organic loading rate and hydraulic retention time (HRT) are the most
common design parameters.
SRT is in fact the most critical parameter for activated sludge design since it affects the
treatment process performance, aeration tank volume, sludge production and oxygen
requirements. It represents the period of time in which activated sludge remains in the
system and can be calculated with the following Equation 2-1.
(2-1)
where
SRT = solids retention time [d]
V = volume [m3]
Q = flow rate [m3d-1]
Qw = waste sludge flow rate [m3d-1]
X = biomass concentration [m3d-1]
Xe = concentration of biomass in the effluent [m3d-1]
XR = concentration of biomass in the return line from sedimentation tank [m3d-1]
µ = specific grow rate [d-1]
Depending on the goal treatment, SRT values can vary from 1 day till 50 days. In the
Netherlands the wastewater treatment plants (WWTP) were operated with SRT ranging
from 14 days to 36 days during the year 2002 (Evenblij, 2006).
The BOD F/M ratio represents the amount of substrate available for the biomass, and
according to reported literature values are between 0.04 g substrate/ (g biomass *d) for
extended aeration processes and 1.0 g substrate/ (g biomass *d) for high rate processes.
The volumetric organic loading rate is defined as the amount of BOD or COD applied to
the aeration tank volume per day. Values, expressed in kg BOD or COD/ (m3*d), may vary
from 0.3 to more than 3.0 (Metcalf & Eddy, 2003).

The influence of sludge characteristics from full-scale MBR in membrane filterability
6
The ASP ends in the sedimentation tank where the liquid-solids separation takes place. The
settling characteristics of the MLSS must be considered when designing the sedimentation
tank to provide adequate clarification of the effluent and solids thickening for the
activated-sludge solids. To quantify the settling characteristics of activated sludge, two
tests are ordinarily used: the sludge volume index (SVI) and the zone settling rate. For
further reading see Metcalf & Eddy (2003), pp. 684-686.
To maintain a given SRT, the excess activated sludge produced each day must be wasted.
Usually part of the return sludge from the sedimentation tank is wasted since it is more
concentrated and requires smaller waste sludge pumps.
The following processes involving sludge (solids and biosolids) are treatment, reuse and
disposal. These are considered the most complex problem in the wastewater field due to
the fact that solids and biosolids are by far the largest in volume. The principal methods
used are thickening, conditioning, dewatering, and drying, to remove moisture from solids;
digestion, composting, and incineration, to treat or stabilize the organic material in the
solids.
2.3 Membrane filtration
2.3.1 Membrane filtration process
In wastewater treatment, membrane filtration is a separation process between two phases -
solid and liquid. The membrane is the selective barrier that allows the passage of certain
constituents and retains other constituents present in the liquid (Cheryan, 1998).
The constituents retained by the membrane form the retentate and those capable of passing
through become permeate, see Figure 2-1. The selectivity of a membrane is determined by
its pore size, that can be defined in terms of equivalent diameter, commonly in µm (10-6
m), or by molecular weight cut-off (MWCO) expressed in Daltons. Koros et.al,. (1996)
defined MWCO as the “molecular weight of a solute corresponding to a 90% rejection
coefficient for a given membrane”.

The influence of sludge characteristics from full-scale MBR in membrane filterability
7
Figure 2-1 - Schematic representation of membrane filtration process
There are four main membrane separation processes: microfiltration (MF), ultrafiltration
(UF), nanofiltration (NF) and reverse osmosis (RO), see Table 2.1.
Table 2-1 – Membrane processes overview (Metcalf & Eddy, 2003; Judd, 2006)
Membrane
process
Pore size range
(µm)
MWCO
(Da)
Permeate description Removed
constituents
Microfiltration 0.1-1 500,000 Water + dissolved solutes
TSS, turbidity,
protozoan oocysts
and cysts, some
bacteria and viruses
Ultrafiltration 0.01-0.1 1,000 Water + small molecules
Macromolecules,
colloids, most
bacteria, some
viruses, proteins
Nanofiltration 0.001 – 0.01 100 Water + very small
molecules, ionic solutes
Small molecules,
some hardness,
viruses
Reverse
osmosis 0.0001 – 0.001 100
Water + very small
molecules, ionic solutes
Very small
molecules, color,
hardness, sulfates,
nitrate, sodium,
other ions
2.3.2 Membrane materials
The membranes are required to have certain characteristics in order to guarantee highly
efficient filtration, low operational and maintenance costs, and a long-term life. The
membrane should provide a high surface porosity, narrow pore size distribution,
mechanical strong structure, and a high resistance to thermal and chemical attack (Judd,
2006).

The influence of sludge characteristics from full-scale MBR in membrane filterability
8
In MBR technology two different materials are used for membrane manufacture –
polymeric and ceramic. The most applied in water treatment applications are hydrophilic
polymer membranes because of their good wettability and the lesser tendency of
hydrophobic components to foul the membrane (Mulder, 1996). Besides that, they are less
expensive than ceramic membranes. The most common materials for polymeric
membranes are:
• Polyvinylidene difluoride (PVDF)
• Polyethylsulphone (PES)
• Polyethylene (PE)
• Polypropylene (PP)
2.3.3 Membrane configurations
When designing MBRs, three essential membrane configurations can be employed
(Mudler, 1996): plate-and-frame/flat sheet, hollow-fiber and (multi)tubular, see Figure 2-2.
Figure 2-2 – Membrane types: (a) tubular membranes (Berghof); (b) module of flat sheet
membranes (Kubota); (c) module of hollow-fiber membranes (Zenon); (d) hollow-fiber
membranes(Mitsubishi)
The influence of sludge characteristics from full-scale MBR in membrane filterability
9
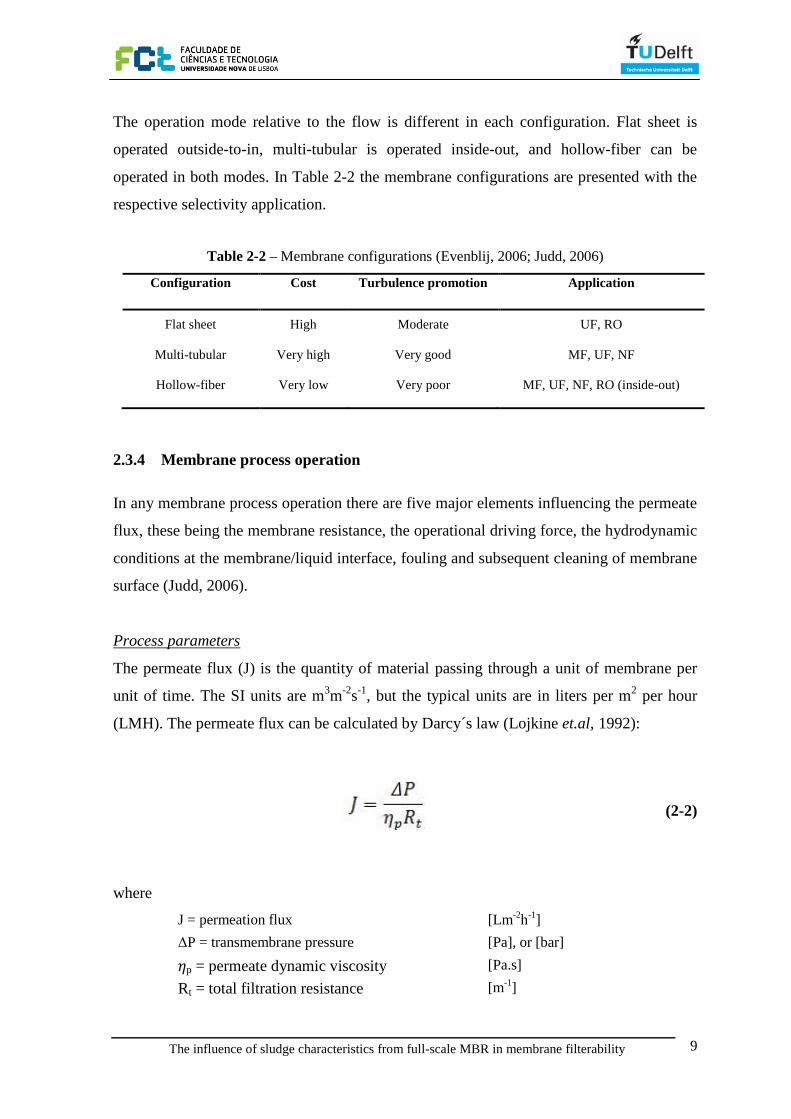
The operation mode relative to the flow is different in each configuration. Flat sheet is
operated outside-to-in, multi-tubular is operated inside-out, and hollow-fiber can be
operated in both modes. In Table 2-2 the membrane configurations are presented with the
respective selectivity application.
Table 2-2 – Membrane configurations (Evenblij, 2006; Judd, 2006)
Configuration Cost Turbulence promotion Application
Flat sheet High Moderate UF, RO
Multi-tubular Very high Very good MF, UF, NF
Hollow-fiber Very low Very poor MF, UF, NF, RO (inside-out)
2.3.4 Membrane process operation
In any membrane process operation there are five major elements influencing the permeate
flux, these being the membrane resistance, the operational driving force, the hydrodynamic
conditions at the membrane/liquid interface, fouling and subsequent cleaning of membrane
surface (Judd, 2006).
Process parameters
The permeate flux (J) is the quantity of material passing through a unit of membrane per
unit of time. The SI units are m3m-2s-1, but the typical units are in liters per m2 per hour
(LMH). The permeate flux can be calculated by Darcy´s law (Lojkine et.al, 1992):
(2-2)
where
J = permeation flux [Lm-2h-1]
∆P = transmembrane pressure [Pa], or [bar]
�p = permeate dynamic viscosity [Pa.s]
Rt = total filtration resistance [m-1]

The influence of sludge characteristics from full-scale MBR in membrane filterability
10
In most water treatment membrane processes the driving force for permeation is trans
membrane pressure (TMP). TMP consists in the difference between feedstream pressure
and permeate pressure.
The total filtration resistance (Rt) is the sum of the clean membrane resistance (Rm) and a
fouling resistance (Rf):
(2-3)
The permeability, which is inversely proportional to total filtration resistance, is a common
parameter to characterize the MBR performance. It can be calculated through equation 2-4.
(2-4)
where
P = permeability [Lm-2h-1bar-1]
J = permeation flux [Lm-2h-1]
TMP = transmembrane pressure [Pa], or [bar]
Dead-end and cross-flow operation
Basically two modes of membrane filtration exist: dead-end and cross-flow filtration, see
Figure 2-3.
In dead-end filtration all feed water is filtered through the membrane resulting in an
accumulation of retained components at the membrane surface (retentate). For cross-flow
filtration only a fraction of the feed water that flows along the membrane surface is
converted to permeate.

The influence of sludge characteristics from full-scale MBR in membrane filterability
11
Figure 2-3 –Dead-end and cross-flow filtration (Evenblij, 2006)
Inevitably both operation modes lead to an increase in resistance, though in different ways.
In dead-end the resistance increases according to the thickness of the cake formed on the
membrane. Consequently, permeability decays rapidly and frequent cleaning is required. In
cross-flow operation the deposition in the membrane only remains until the adhesive forces
in the cake are disrupted by the continuous cross flow stream and force it to move along
the membrane.
When comparing both filtration modes, cross-flow operation can treat water with higher
solids content and achieve higher fluxes (since the cross-flow stream minimizes the
buildup of constituents in the membrane surface). On the other hand, the circulation of feed
water in cross-flow filtration requires higher energy thus raising the operational costs.
2.3.5 Membrane fouling
The increase in filtration resistance over time is caused by membrane fouling and is a
natural consequence of the membrane separation process. Membrane fouling has been
reported with several definitions.
Van den Berg and Smolders (1990) stated that fouling consists in a long-term process that
could be more or less irreversible, in which a flux decline is observed. Also, Cheryan
(1998) described the membrane fouling as the decline of flux and emphasizing that all
operating parameters are kept constant.

The influence of sludge characteristics from full-scale MBR in membrane filterability
12
The International Union of Pure and Applied Chemistry (IUPAC) also defined membrane
fouling as: “Process resulting in loss of performance of a membrane due to deposition of
suspended or dissolved substances on its external surfaces, at its pore openings, or within
its pores”. (Koros et.al, 1996)
However, membrane fouling is widely referred to as a decrease of performance in the
separation process, i.e. a flux decline at constant TMP or an increase on TMP for a
constant flux (reducing permeability) (Judd, 2006).
Membrane fouling is the main limitation of MBR technology, increasing the operational
costs and keeping MBRs less competitive in comparison to conventional wastewater
treatment plants. There are three main factors that influence fouling: operating conditions,
nature of the membrane, and biomass (Lojkine et.al, 1992).
Fouling mechanisms
There are two different components in membrane fouling: reversible and irreversible
fouling. Reversible fouling is considered as the loosely bound fouling part in which
concentration polarization and cake layer formation are often considered as important
reversible fouling mechanisms. Reversible fouling is mainly removed by physical cleaning.
On the contrary, irreversible fouling is caused by strong adherence to the membrane such
as pore blocking and gel layer formation. Irreversible fouling can be partially removed by
chemical cleaning.
During cross-flow filtration different fouling mechanisms may occur (Van den Berg and
Smolders, 1990), (Figure 2-4).

The influence of sludge characteristics from full-scale MBR in membrane filterability
13
Figure 2-4 – Fouling mechanisms in cross-flow filtration (Evenblij, 2006)
• Pore blocking
The pore of the membrane is blocked by particles that were not able to pass through due to
particle size or MWCO. The number of pore channels for permeation decreases.
• Pore narrowing (adsorption)
Particles and/or substances enter the pore and are absorbed by the pore wall reducing the
pore size; as a result, permeability becomes lower.
• Cake or Gel layer formation
A layer is formed near the membrane surface with an accumulation of particles and
macromolecules. If the constituents are non-interacting, the layer is more permeable –cake
layer- and may be removed by increasing TMP or the cross-flow. The cake layer can be
removed by physical means such as relaxation of the membrane and back-wash. When an
interaction between the particles and the membrane takes place, a cohesive gel layer is
formed which is less permeable and more difficult to remove (only by chemical cleaning).
Both types of layers will lead to an increase in the total filtration resistance.
• Concentration polarization
IUPAC defined concentration polarization (CP) as “a concentration profile that has a
higher level of solute nearest to the upstream membrane surface compared with the more
or less wellmixed bulk fluid far from the membrane surface”.

The influence of sludge characteristics from full-scale MBR in membrane filterability
14
The origin of the term CP is related to RO applications. Since the pore size is extremely
small, there is a back transport of solvent from the permeate side to the feed side leading to
an increase in the osmostic pressure. CP promotes the increasing of overall resistance at
the membrane/solution interface during membrane filtration.
2.4 Membrane bioreactor technology
2.4.1 MBR configurations
There are two possible configurations relative to the position of the membranes in the
MBR process: submerged and sidestream, (Figure 2-5).
In a submerged mode, as the name describes, the membranes are submerged in the aeration
tank and the permeate extraction occurs under vaccum to the inside of the membrane. In
the sidestream, the membranes are apart from the reactor and sludge is recirculated through
the membrane, where permeate extraction takes place from the inside-out. Generally,
hollow-fiber and plate and frame modules are use for a submerged MBR and tubular
membranes for a sidestream operation.
Figure 2-5 – Schematic of sidestream and submerged configurations
The sidestream configuration requires more energy than the submerged configuration since
in sidestream high pressures and volumetric flows are imposed when pumping the feed
water to the membrane modules. On the other hand, although submerged MBRs have a
lesser energy demand, they have an inherently higher fouling propensity compared to
sidestream MBRs, since they are operated at higher fluxes (which will lead to lower
permeabilities) [Judd, 2006].

The influence of sludge characteristics from full-scale MBR in membrane filterability
15
2.4.2 MBR history
The first MBR process was introduced in the late sixties, immediately after UF and MF
membranes were commercially available. Even though the idea of replacing the
sedimentation tank of the conventional activated sludge process (CASP) was attractive, the
membrane costs were too high and the filtration performance was compromised due to
fouling phenomena.
Only in 1989 the MBR breakthrough happens when Yammoto et.al,. (1989) had the idea to
submerge the membranes in the bioreactor, instead of the external (sidestream)
configuration used until then. Moreover, the design and operation parameters in MBR were
improving with time. In the beginning, MBRs were operated with SRTs that could go up to
100 days and MLSS concentrations above 30 g/L. Nowadays, a lower SRT is applied (10-
20 d) with MLSS around 10-15 g/L. Since the operational conditions started to change,
better results were achieved in the MBR process, lowering the fouling propensity and
decreasing the costs of membrane maintenance (Le-Clech et.al, 2006).
In geographical terms, the MBR technology entered the Japanese market in the 1970s. In
1980 the Japanese government invested in the development of a low footprint, high
product quality process that would be suitable for water recycling. For this purpose, the
Kubota plate and frame membrane was developed. Essentially, the spread of this
technology was for small-scale applications (Evenblij, 2006). In the American continent, a
hollow-fiber submerged membrane was created by Zenon. In the 1990s the process was
extended for WWTP at a larger scale and the USA and Europe registered numerous
developments.
Lesjean and Huisjes (2008) reported the existence of about 100 MBRs for municipal
WWTP and about 300 for industrial applications in Europe, (Figure 2-6).

The influence of sludge characteristics from full-scale MBR in membrane filterability
16
Figure 2-6 – Evolution of municipal and industrial MBR applications in Europe along the period
1990-2005 (Lesjean and Huisjes, 2008)
Naturally, with the market development, new suppliers of MBR filtration systems emerged
such as Toray, Mitsubishi, Norit, Kms, etc. See Appendix I for further information.
2.4.3 MBR operating conditions
In a membrane separation process there are three possible ways to operate: at constant
TMP, with constant permeate flux or a combination of these two (Evenblij, 2006). At
constant TMP, flux will decline over time; with constant flux, higher TMP will be required
as the process continues; when a combination of both these processes is applied, good
results are obtained diminishing membrane fouling ( (Vyas et.al, 2002) cited in Evenblij,
2006)).
Aeration (aerobic systems), cross-flow velocity
Most likely, aeration is the most important parameter for MBR design and operation (Judd,
2006). Aeration is necessary for biotreatment, for keeping the mixed-liquor in suspension,
and for membrane scouring. A cross flow stream over the membrane surface produced by
air bubbling induces a tangential shear stress, which prevents large deposition of particles
and increases back transport phenomena. This results in a higher transference rate of liquid
through the membrane. Nevertheless, the lateral migration velocity for smaller particles is

The influence of sludge characteristics from full-scale MBR in membrane filterability
17
much less given that it is proportional to the cube of particle diameter. This implies a
stricter fouling caused by fine materials.
Several authors have reported a nearly linear relationship between permeate flux and
aeration rate up to threshold value in which no increase in permeability occurs. On the
other hand, it has also been reported that intensive aeration may damage the floc structure,
reducing floc size and releasing EPS in the mixed-liquor.
Since cross-flow velocity (CFV) is also a function of aeration intensity, a critical value was
reported. Liu et.al, (2000) stated that when CFV is lower than 0.3 ms-1, the TMP increased
sharply, suggesting that sufficient cross flow velocity should be induced to retard
membrane fouling.
Solids Retention Time (SRT)
SRT is an important operating parameter impacting on fouling propensity in MBRs. The
increase of SRT, and consequent reduction of F/M ratio, leads to an increase of MLSS
concentration and a change in biomass characteristics. Extremely low SRTs (down to 2
days) have been tested to evaluate fouling predisposition. The results have shown that the
fouling rate increased nearly 10 times when the SRT was lowered from 10 days to 2 days
(corresponding to F/M ratio from to 0.5 to 2.4 gCOD gMLVSS-1 day-1 and MLSS of 7.8–
6.9 g/l). In practice, the F/M ratio is generally maintained below 0.2 gCOD gMLVSS-1 day-
1 (Le-Clech, 2006).
Long SRTs minimize the excess sludge production but increase MLSS concentration. This
has been reported as a main cause for membrane clogging, particularly due to the
progressive accumulation in the MBR tank of non-biodegradable materials (like hair and
lint), which are not completely removed by the MBR pre-treatment processes. On the other
hand, most of the substrate is consumed at higher SRTs to ensure the maintenance needs
and the synthesis of storage products. The very low apparent net biomass generation
observed can explain the low fouling observed in higher SRT operation [Le-Clech, 2005].
Cho et.al, (2005) observed temporal changes of the bound EPS levels when tested in MBR
different SRTs - 8, 20 and 80 days. The results showed that the concentration of extracted

The influence of sludge characteristics from full-scale MBR in membrane filterability
18
EPS was lower for the longer SRT (83–26 mgTOC/gSS for SRT of 8 up to 80 days
respectively).
Although considered a key parameter in determining fouling propensity through MLSS
and EPS fractions, SRT has most likely less impact on fouling than feedwater quality
(Judd, 2006).
Unsteady state operation
Unsteady state can be characterized by variations in the flow input, in the hydraulic
retention time (HRT), in the organic loading rates and shifts in the oxygen supply. In MBR
operation, unsteady conditions can occur regularly and cause impact on fouling propensity.
From experiment work it was concluded that unsteady operation changed the nature and/or
structure (and fouling propensity) of the polysaccharides rather than the overall EPS
formation, and therefore could worsen the fouling propensity ((Drews et.al, 2005) cited in
Judd, 2006)).
Critical Flux (Jc)
There are several definitions for critical flux (Jc). However, this concept was first
introduced with the following definition: “The critical flux hypothesis for MF/UF
processes is that on start-up there exists a flux below which a decline of flux with time does
not occur; above it, fouling is observed” (Field et.al, 1995).
For real application in MBR the “secondary critical flux”, or “sustainable flux”, is used.
Basically, in a “sustainable” flux TMP increases gradually at an acceptable rate until the
critical value is reached. What is problematic in MBR operation is to define at which flux
should the membrane filtration be operated. To achieve a higher critical flux, a higher
shear stress is required, therefore increasing the costs for aeration. On the other hand,
lower fluxes require a lower production rate of effluent which reduces its applicability for
reuse. Thus, it is important to study the relationship energy costs vs. permeate flux.

The influence of sludge characteristics from full-scale MBR in membrane filterability
19
2.4.4 Fouling control and mitigation
In MBR operation, in order to achieve a better performance in the membrane separation
process, fouling must be controlled and mitigated. Basically, the main strategies used in
practice are (Le-Clech, 2006):
a) Physical cleaning
b) Chemical cleaning
c) Optimization of membrane characteristics
d) Optimization of operating conditions
e) Pre-treatment of the biomass suspension
a) Physical cleaning
The techniques employed in MBRs for physical cleaning include membrane relaxation
while filtration is paused and backwashing (or back flush) in which permeate is pumped in
the reversed direction through the membrane. Backwashing is a successful operation to
remove most of the reversible fouling caused by pore blocking. The constituents blocking
the pore are removed back into the mixed-liquor and clogging near the membrane surface
may also be partially loosened or removed by this technique.
When designing backwashing, key parameters such as frequency, duration, the ratio
between these two and intensity have to be taken into consideration. The increase of
frequency and duration is expected to remove more fouling. However, an optimum relation
between these two parameters has to be accomplished. Jiang et.al, (2005) stated that less
frequent, but longer backwashing (600 s filtration/45 s backwashing) was found to be more
efficient than more frequent backwashing (200 s filtration/15 s backwashing).
Membrane relaxation considerably improves the membrane productivity. Under relaxation,
back transport of foulants is naturally enhanced. When relaxation is conjugated with air
scouring, higher removal efficiencies are obtained.
Depending on the membrane type, different physical cleaning protocols are applied.

The influence of sludge characteristics from full-scale MBR in membrane filterability
20
b) Chemical cleaning
Chemical cleaning is required since physical cleaning only removes reversible fouling.
Different types can be applied such as chemically enhanced backwash (on a daily basis),
maintenance cleaning with a higher chemical concentration (weekly), and intensive (or
recovery) chemical cleaning (once or twice a year).
The most common cleaning agents are sodium hypochlorite, NaOCl, (for organic foulants)
and citric acid (for inorganics). Sodium hypochlorite hydrolyzes the organic molecules,
and therefore loosens the particles and biofilm attached to the membrane. For maintenance
cleaning, a cycle of 30 min or more is usually carried out every 3-7 days with a moderate
reagent concentration of 0.01 wt.% NaOCl (wt. denotes total weight). In recovery
cleaning, much more concentrated reagents are employed such as 0.2–0.5 wt. % NaOCl
coupled with 0.2–0.3 wt. % citric acid or 0.5–1 wt. % oxalic acid (Le-Clech, 2005).
As well as for the physical cleaning, the chemical cleaning procedure varies according to
the membrane type.
c) Optimization of membrane characteristics
Because of the hydrophobic interactions occurring between solutes, microbial cells and
membrane material, membrane fouling is expected to be more severe with hydrophobic
rather than with hydrophilic membranes. Efforts have been made in trying to increase the
hydrophilic properties of a membrane, particularly through chemical modifications. With
the introduction of polar groups (from oxygen and nitrogen) on the membrane surface, the
membrane hydrophilicity extensively enlarged and better filtration performances and flux
recovery were observed.
d) Optimization of operating conditions
Aeration is one of the major factors for energy consumption in MBR operation. Many
attempts have been made to optimize designing of airflow rate. The airflow patterns and
location of the aerators have been defined as crucial parameters. Besides that, the aeration
system has to be designed according to each membrane configuration since the effect of
aeration varies according to membrane type.

The influence of sludge characteristics from full-scale MBR in membrane filterability
21
To guarantee a lower demand of energy, the MBR process should be conducted at a
sustainable flux, i.e. a flux at which the TMP increases gradually at an acceptable rate, so
that chemical cleaning is not necessary. In this way the operation can have lower costs.
Also, different strategies should be studied to find practical solutions in order to maintain
the desirable flux.
e) Pre-treatment of the biomass suspension
The addition of coagulants such as ferric chloride and aluminum sulfate (alum) is a
common practice used in MBRs to reduce membrane fouling. The alum, when dissolved
in water, forms hydroxide precipitates which adsorb suspended particles, colloids and
soluble organics. Experiments have shown that the addition of alum resulted in a
significant decrease of the carbohydrate fraction of SMP along the filtration process. A
lower impact on membrane fouling was observed, probably due to the formation of larger
microbial flocs. Although more expensive, ferric chloride showed higher efficiencies when
compared to alum. Other coagulant currently used is zeolite which allows the creation of
rigid flocs that have lower specific fouling resistance.
Other technique used is the pre-treatment of the feed which is a fundamental step for
optimum MBR performance. Different types of sieving can be applied permitting that the
influent in the MBR is less compromising to the membrane filtration.
The use of powdered activated carbon (PAC) into biological treatment decreases the level
of pollutant, particularly organic compounds. The mixture of PAC with biological
suspension in an MBR results in a gradual incorporation of the activated carbon into the
biofloc. This way EPS is absorbed into PAC reducing its impact on membrane process.
However, additions of PAC should be done carefully to avoid damage to the membranes.

The influence of sludge characteristics from full-scale MBR in membrane filterability
22
2.4.5 Comparison between MBR and Conventional Activated Sludge (CAS)
Activated sludge
In activated sludge biological treatment, one of the most notable differences between MBR
and CAS operation is the MLSS concentration. While in the CAS aeration tank the solids
content can vary in the range 2 to 5 g/L, in MBR it can be up to 15 g/L (Seyssiecq, 2008).
When considering an MBR for industrial wastewater treatment, MLSS can go up to 40 g/L
(Rosenberger and Kraume, 2002),
Due to this significant difference, the sludge rheological properties will differ. Sludge with
higher MLSS is expected to be more viscous. However, in MBR the sludge viscosity is
lower than in CAS (Defrance et.al, 2000). Since sludge viscosity decreases with increasing
shear rate (Rosenberger et.al, 2002), this is explained by the higher shear rates applied in
MBR (see Section 3.4). Also, lower oxygen transfer efficiencies are a consequence of
increasing MLSS.
Treatment efficiency
Since in MBR applications the activated sludge principle is used, the removal efficiencies
do not differ substantially when comparing to those of CAS. The removal efficiencies for
COD, BOD and SS are high and the effluent is particle free.
In experiments with synthetic feedwater Cicek et.al, (2000) found efficiency removals of
98% for COD and for Kjeldahl nitrogen. Adam et.al, (2002) stated that in MBR the total
phosphorous in the effluent was always lower than 0.2 mg/L for an SRT of 16 to 25 days.
Sludge production
The SRT is a factor that influences the production of sludge. Longer SRTs result in lower
sludge production, (Equation 2-1). In MBR the secondary sludge production is lower than
in CAS since a higher SRT is applied. However, the primary sludge production is higher
due to a higher degree of pre-treatment.

The influence of sludge characteristics from full-scale MBR in membrane filterability
23
The dewaterability of waste activated sludge from MBRs is much higher when compared
to aerobic waste sludge from CAS systems ((Kraume and Bracklow, 2003) cited in
Evenblij, 2006).
System footprint
One of the major advantages of an MBR is its reduced system footprint. The substitution of
a second clarifier with membranes enables the total rejection of suspended solids without a
settling process (Bae and Tak, 2005). This means that an MBR can be operated at higher
volumetric loading rates by retaining a high concentration of sludge. Thus, the required
space for the aeration tank can be reduced.
Membranes
The most visible difference between CAS and MBR are the membranes. In spite of the
many advantages provided by membrane filtration (reduced footprint, higher loading rates,
high-quality effluent free of pathogens and most bacteria), the costs for the membranes and
for operation and maintenance are still a drawback.
A study made by Davies et.al, (1998) compared the costs between two different WWTPs,
MBR and CAS, for two different capacities of 2,350 p.e. and 35,500 p.e. (p.e. denotes
population equivalent), (Table 2-3).
Table 2-3 – Cost comparison study between MBR and CAS (Davies et.al, 1998) Capital Costs * Operating Costs /year *
MBR (Kubota) 2,350 p.e.
613,000 75,373 CAS 980,204 56,200 MBR (Kubota) 37,500 p.e.
7,292,524 602,101 CAS 3,642,259 264,730 * Currency not specified
For the purposes of this study, a lifetime of 7 years for the membrane and a total capacity
of 2 times Dry Weather Flow (DWF)1 were defined. The authors concluded that MBR can
compete with CAS when the population equivalent is 2,350. For 37,500 p.e. MBR was 2
times more expensive than CAS, in terms of capital and operating costs.
1 DWF – the average effluent flow during a 7-day period of dry weather, as defined by stringent rainfall
limits

The influence of sludge characteristics from full-scale MBR in membrane filterability
24
However, it is important to remark that the effluent quality obtained in an MBR system is
much higher than the one from a CAS, besides the fact that MBR effluent can be reused.
This topic was not included in the cost comparison.
Summing up, the main advantages and disadvantages inherent to MBR applications are
presented in Table 2-4.
Table 2-4– Main advantages and disadvantages of MBR (adapted from Stephenson et.al, 2000)
Advantages Disadvantages
Small footprint Membrane fouling Complete solids removal from effluent Aeration limitations Reuse of a high quality effluent Membrane costs High loading rate capability High costs for operation and maintenance Low sludge production Process complexity Rapid start up Sludge bulking not a problem

The influence of sludge characteristics from full-scale MBR in membrane filterability
25
3 LITERATURE REVIEW ON MEMBRANE FOULING
This chapter aims to review the current literature on membrane fouling in MBRs with
particular reference to the effects of mixed liquor suspended solids (MLSS), particle size,
extracellular polymeric substances (EPS), and viscosity.
3.1 Mixed liquor suspended solids (MLSS)
Since one of the major features in MBR systems is the possibility to operate at higher
MLSS concentrations, this is one of the most investigated parameters. The general trend
found in literature is for membrane fouling to increase with increasing MLSS
concentrations. Since a higher solids content leads to a higher viscosity, higher shear rates
are required to maintain a turbulent regime during membrane filtration. Given that shear
stress is fundamental to decrease the fouling propensity in MBR, the MLSS should be a
parameter to take into account.
However, no consensus exists (yet) about the influence of solids content in membrane
filterability since many different experiments have shown contradictory results. Most
likely, the main reason for this is the complexity and variability of the biomass
components.
The impact of MLSS concentration was studied by Meng et.al,. (2007a). Artificial sludge
was used and shifted from 2 g/L till 20 g/L to observe the impact on membrane fouling. In
addition, aeration was also investigated with three different intensities (200, 400 and 600
L/h) for each MLSS concentration. The major role played by MLSS concentration on
membrane fouling resistance was conclusive. The aeration had small impact on membrane
fouling when MLSS was lower than 10 g/L. Thus, in order to operate an MBR, MLSS
should be maintained at lower values. Deffrance and Jaffrin (1999), and Bae and Tak
(2005) also stated that MLSS was a main contributor for membrane fouling.
Le-Clech et.al, (2003) also studied the effect of MLSS through the flux-step method,
which comprehends the concept of critic flux, Jc (Section 2.4.3). In this method the Jc is
The influence of sludge characteristics from full-scale MBR in membrane filterability
26
defined as the highest flux at which TMP stays steady. In this experiment the flux-step
height ranged from 8 to 12 LMH with a 15 min step, and three different MLSS
concentrations were investigated: 4, 8 and 12 g/L. The results showed no significant
difference when MLSS shifted from 4 g/L to 8 g/L, however, for a MLSS of 12 g/L, Jc
showed greater values. Inherent to this study is the fact that an increase in MLSS leads to
lower fouling rates resulting in a better filtration performance. Also, the same relationship
was observed by Madaeni et.al, (1999) (cited in Lousada-Ferreira et.al, (2008)).
Other researchers attributed to MLSS a negligible role in membrane fouling. No effect was
observed from 3.6 g/L till 8.4 g/L (Harada et.al, 1994), from 7.1 g/L till 14.1 g/L (Lesjean
et.al, 2005) and from 30 g/L till 40 g/L (Yamamoto et.al, 1999).
3.2 Particle size
3.2.1 Characterization of the wastewaster
In order to have a better understanding of the impact of particle size on membrane fouling,
it is primary to characterize the different constituents present in the wastewater according
to its particle size.
Several classifications are applied to different fractions in wastewater. In this thesis the
classification from Metcalf & Eddy (2003) is used. The category of contaminants is
divided in: dissolved (< 0.001 µm), colloidal (0.001 - 1 µm), supracolloidal (1 – 100 µm)
and settleable (>100 µm).
The role of each fraction in membrane fouling has several interpretations. Bouhabila et.al,.
(2001) stated that the contribution of colloids and solutes to membrane fouling is 75%
whilst Bae and Tak (2005) reported 17%, (Figure 3-1).

The influence of sludge characteristics from full-scale MBR in membrane filterability
27
Figure 3-1 –Relative contributions (%) of the different biomass fractions to MBR fouling
(adapted from Judd, 2006)
Such variation is probably caused by the operating conditions and biological state of the
biomass, and the different fractionation methods.
Despite the divergence of results, the main trend is that the colloidal and soluble fractions are
highly important in influencing membrane fouling.
3.2.2 Particle size distribution (PSD) in MBR
Wisniewski and Grasmick (1998) found that 15% of the particles in a biological
suspension have a size lower than 100 µm. Also, without recirculation, the size of the
flocs varies between 20 µm and up to 500 µm. Moreover, a clear reduction of the particle
size was observed when sludge was recirculated. The reducing of the particle size showed
a relationship directly proportional to the magnitude of the shear stress and time
experiment. Therefore it was concluded that intensive recirculation leads to a floc breakage
and subsequently to a modification in the particle distribution. This leads to a decrease of
0%
20%
40%
60%
80%
100%F
oulin
g re
lativ
e di
strib
utio
n (%
)
Soluble Colloid Suspended solids Colloid + Soluble

The influence of sludge characteristics from full-scale MBR in membrane filterability
28
the settleable fraction and consequently to an increase of the non-settleable fraction, or
soluble fraction (polysaccharides, phospolipid, proteins, etc.). Half of the total resistance
was due to soluble compounds. Meng et.al,. (2006) also stated that the membrane fouling
resistance increased as the particle size decreased, mainly due to the deposition of small
particles and colloids on the membrane surface.
Leet et.al, (2003) studied the effect of SRT on PSD. SRTs in the range of 20-60 days were
applied showing similar floc sizes. Although a slight increase of the floc from 5.2 to 6.6
µm was observed when SRT increased from 20 to 60 days.
As result of a study for particle characterization in MBR, Bae and Tak (2005) reported that
in a MBR mixed-liquor most particles existed in a size range between 10 µm and 40 µm,
and the mean particle size was 25 µm. The particle size range of the supernatant (or free
water) showed a mean diameter of 9 µm. The shear stress was found to be a factor in
increasing both the concentration and mean particle diameter of supernatant by breakage of
larger particles. A significant role was also attributed to solutes in membrane fouling.
Ivanovic and Leiknes (2008) studied the impact of aeration rates on particle colloidal
fraction in the biofilm membrane bioreactor. Results showed a clear increase of particles in
the colloidal fraction, particularly below 0.1 µm, with increasing aeration rates. The author
outlined the importance of finding the right balance between the sufficient aeration to
minimize membrane fouling, while preventing the formation of colloidal particles due to
excessive shear forces caused by aeration. Åhl et.al, (2006) also reported a major role of
aeration in the formation of more colloidal particles through particle breakage, resulting in
an important component of membrane fouling.
Geilvoet et.al, (2007) carried out an experiment aiming at the analysis of the SMP in
different fractions and particle counting in the size range 0.4-5.0 µm. The filterability of
the sludge was measured according to the DFCm (Section 5.1.7). Results showed a
decrease of filterability while an increase of SMP concentrations in the free water was
registered. All SMP were found smaller than 0.2µm and SMP particles in the range 0.2 µm
to 1.2 µm were absent. Therefore, the particle distribution in the range size 0.4-5.0 µm was
not correspondent to the SMP analyses.

The influence of sludge characteristics from full-scale MBR in membrane filterability
29
3.3 Extracellular Polymeric Substances (EPS)
3.3.1 EPS background
Extracellular polymeric substances (EPS) are largely appointed as one of the most crucial
contributors for membrane fouling (Nagaoka et.al, 1996; Rosenberger an Kraume, 2002;
Cho and Fane, 2003; Rojas et.al, 2005; Al-Halbouni et.al, 2008).
EPS is used as a general term which includes all classes of macromolecules such as
carbohydrates, proteins, nucleic acids, lipids and other polymeric compounds found at the
cell surface or in the intercellular space of microbial aggregates. However, the main
components of EPS are proteins (up to 60 %) and polysaccharides (40-95 %) (Flemming
and Wingeder, 2001), and both have a natural tendency to form a gel layer which is highly
structured (Poele, 2005).
EPS is responsible for the aggregation of bacterial cells in flocs and biofilms, the formation
of a protective barrier around the bacteria, retention of water and adhesion to surfaces
(Laspidou and Rittman, 2002). EPS also has an important function in microbial survival
since it facilitates the interactions between cells and their environment. Due to its
heterogeneous and changing nature, EPS can form a highly hydrated gel matrix in which
microbial cells are embedded and can therefore create a significant barrier to permeate
flow in membrane filtration (Judd, 2006).
EPS in activated sludge can be found in two different ways: cell-associated EPS in which it
is closely bound to cells and, dissolved EPS into water phase (free water) which is
detached from bacterial cells (Nagaoka and Akoh, 2008). Cell-associated EPS accumulates
on the membrane surface as strongly bound EPS, whilst dissolved EPS accumulates as
loosely bound EPS.
The dissolved EPS is commonly termed as Soluble Microbial Products (SMP) since
Laspidou and Rittman (2002) compared both concepts and concluded that they were
indeed identical. SMP are substances produced by micro-organisms that are released into
the water phase by cell lysis or excretion. They can also be introduced by the influent,
(Figure 3-2).

The influence of sludge characteristics from full-scale MBR in membrane filterability
30
Figure 3-2 –Schematic of EPS and SMP
The conditions that influence the production of EPS and their release into the water phase
are still not clear. Some authors have reported the influence of SRT and F/M, the influent
C:N:P ratio, insufficient oxygen content, shear stress, temperature, etc. Kuo (1993) listed
the main factors that cause SMP production, cited in Evenblij (2006):
- Concentration equilibrium: organisms excrete soluble organic material to establish
concentration equilibrium across the cell membrane.
- During starvation bacteria excrete organic material (this could be interpreted as operating
MBR for longer SRT and thus lower F/M).
- Increased presence of energy source
- Sudden addition of carbon source and energy source to bacteria starved for carbon and
energy may accelerate death to some bacteria, which may result in production of SMP
- If essential nutrients are available in low concentrations, SMP may be produced to
scavenge the required nutrients
- To relieve environmental stress, such as temperature changes, osmotic shocks and maybe
in response to toxic substances
- During normal bacterial growth and metabolism SMP are produced.
In EPS analysis no standard method exists yet, either for cell-associated EPS or dissolved
EPS. This leads to different results and makes the comparison between experiments truly
complicated. For a better understanding of the role of EPS on membrane fouling it is
urgent to uniform the method of analysis , so that research can progress rapidly.

The influence of sludge characteristics from full-scale MBR in membrane filterability
31
3.3.2 EPS and membrane fouling
Nagaoka et.al,. (1996) studied the influence of EPS in the permeability of the membrane.
Three different reactors were used with different composition synthetic feedwater. EPS
was measured each 20 days and when the permeate flow had considerably decreased,
membrane modules were pulled out of the reactors for cleaning and the amount of EPS
attached to the membrane was then measured. They concluded that EPS accumulated both
in the mixed-liquor and on the membrane, which might have caused an increase in the
viscosity of the mixed-liquor and an increase on the filtration resistance on the membrane.
A study aiming at the comparison of sludge samples from eight different MBR and one
conventional WWTP was conducted by Rosenberger and Kraume (2002). No influence of
the cell-associated EPS concentrations on the filterability was found. Instead, the
composition of the water phase was found to affect mostly the filterability of activated
sludge, particularly the dissolved EPS. Also, the high mechanical stress in the MBR and
high F/M ratios were found to increase the dissolved EPS concentration. Furthermore,
Rojas et.al, (2005) found that only the dissolved EPS had an impact on membrane fouling
and not the cell-associated EPS. A different perspective was shown by Al-Halbouni et.al,
(2008) which considers that both cell-associated and dissolved EPS have a negative impact
on the sludge properties.
Many researchers are trying to evaluate the contribution to membrane fouling of the
specific components present in EPS; however, no agreement has been established. The
importance of different components was attributed to: polysaccharides (Rosenberger et.al,.,
2006; Nataraj et.al, 2008), proteins (Rojas et.al, 2005), and fatty acids from
lipopolysaccharides (Al -Halbouni et.al, 2009).
Regarding operating conditions, contradictory results are shown about the influence of
SRT in the EPS concentrations and its impact on fouling. Al-Halbouni et.al,. (2008)
studied the impact of SRT in the EPS content and in the membrane performance. Two
pilot-scale MBRs with SRTs of 23 and 40 days, and one full-scale MBR were investigated.
The results showed that higher amounts of floc-bound and soluble EPS have a negative
impact on sludge properties (settling behavior, dewaterbility). The excess production of
EPS can be related to season variations in the full-scale MBR and to a low SRT in the pilot

The influence of sludge characteristics from full-scale MBR in membrane filterability
32
plants. In the pilots, at lower SRT, a high MW fraction of EPS, containing polysaccharides
and proteins, was involved in membrane fouling. Despite the different SRT in the pilots,
the membrane permeability was found to be similar.
On the other hand, Lee et.al. (2003), cited in Rosenberger et.al, (2006), found that when
SRT shifted from 20 to 60 days the contribution of the supernatant to overall membrane
fouling decreased, while Rojas et.al, (2005) reported the greatest production of EPS at an
SRT of 20 days when the SRT was alternated between 10 and 30 days.
Rosenberger et.al,. (2006) demonstrated that the non-settleable of the sludge (soluble and
colloidal material, i.e. polysaccharides, proteins and organic colloids) was found to impact
fouling. It was also found that the SMP concentration was influenced by temperature and
stress situations for the microorganisms. This was confirmed by Al-Halbouni et.al,. (2008)
when they reported that the excess production of EPS could be related to season variations.
Also, Lyko et.al, (2008) observed that low temperatures reduced the membrane
performance by two mechanisms: increasing permeate viscosity and increasing
carbohydrate concentration.
3.4 Viscosity
In wastewater, rheology has been a subject of interest since it is an interesting tool to
characterize the hydrodynamics of sludge suspensions, essential for optimization of the
different processes in which sludge is operated. Activated sludge viscosity has a major
impact on oxygen mass transfer, pressure loss in pipes, transport phenomena near the
membrane, as well as, in a further step, sludge conditioning (Roseberger et.al,., 2002).
3.4.1 Rheology theory
Rheology is the science describing the deformation of a body under the influence of
stresses. A Newtonian fluid is characterized for the shear stress (stress applied to a surface
of a material in a parallel or tangential plan) being linearly related to the shear rate
(velocity gradient perpendicular to the direction of shear) according to the Newton
equation 3-1 (Seyssiecq et.al, 2003):

The influence of sludge characteristics from full-scale MBR in membrane filterability
33
τ = µ ẏ (3-1)
where,
τ – shear stress [Pa]
µ - apparent viscosity [Pa.s]
ẏ - shear rate [s-1]
The apparent viscosity in a fluid is defined by the nature and solid concentration, the
temperature and the pressure to which it is submitted.
However, sludge suspensions are considered non-Newtonian fluids, i.e. the shear rate
being non-linearly related to shear stress. There are two types of models used to describe
the behavior of activated sludge:
- shear-thinning model in which a decrease in the material apparent viscosity occurs
when shear rate is increased
- plastic model where a yield stress must be reached before flow starts. The value of
yield stress corresponds to the stress needed to be applied to overcome the cohesion
Van-Der-Walls forces and induce the flow of the suspension
There are several equations to express the behavior of a sludge suspension. However, the
most commonly used are the Ostwald and the Sisko for shear-thinning model; the
Bingham, the Herschel-Buckley, and the Casson for plastic model (Seyssiecq et.al, 2003),
(Figure 3-3).
Figure 3-3 – Schematic flow curves for model time-independent materials: (a) Newtonian;
(b) Shear thinning; (c) ideal Bingham plastic; (d) actual plastic

The influence of sludge characteristics from full-scale MBR in membrane filterability
34
Rheometric methods
The apparatus that measures the rheological properties of a fluid is called a rheometer. For
sludge, three different categories of rheometers can be used: capillary rheometers,
rotational rheometers equipped with concentric cylinders and systemic rheometers
(Seyssiecq et.al, 2003). In this thesis the sludge measurements were achieved through a
rotational rheometer equipped with a concentric cylinder. The advantages of this apparatus
are mainly that small sample volumes are required and also their compactness. On the
other hand, centrifuge forces and also sedimentation can cause a particle size distribution
thus affecting the measurement.
Since for sludge suspensions different rheometers can be used for rheological
measurements and also different equations, the comparison of the results between different
experiments turns out to be a difficult task. Besides, the sludge is a complex biological
system already difficult to categorize.
The rheological behavior of a fluid is usually demonstrated through a rheogram, i.e. the
shear stress plotted against shear rate

The influence of sludge characteristics from full-scale MBR in membrane filterability
35
3.4.2 Viscosity and membrane fouling
Despite the many studies concerning rheology and its impact on membrane performance
and membrane fouling, there is still a lack of information, partially due to synthetic
wastewater being used in many previous studies and to the complexity of MBR systems
(Wu et.al, 2007).
It is widely accepted that MLSS is one of the major parameters influencing apparent
viscosity in activated sludge, since the increase in solid content leads to an increase in
apparent viscosity (Rosenberger et.al, 2002; Hasar et.al, 2004; Wu et.al, 2007; Seyssiecq
et.al, 2008).
Besides MLSS, temperature has also been reported has an important parameter having an
effect on apparent viscosity (Hasar et.al, 2004; Wu et.al, 2007). Apparent viscosity showed
higher values for lower temperatures. Not only the temperature influenced the apparent
viscosity but also the shear stress decreased when an increase in temperature was
registered (Hasar et.al, 2004)
Seyssiecq et.al, (2008) developed a study to characterize the rheological properties of an
activated sludge with total suspended solids (TSS) ranging from 10 to 35 g/L, and operated
in a bioreactor under different stirring and aeration rates. It was concluded that, due to the
shearing of air bubbles, apparent viscosities are strongly lowered by the injection of air but
almost independent of the quantity of air (in the range 2–6 L/min). However, under high
mechanical shear rates (above 100 s−1) the configuration of structural units (i.e. flocs in the
case of activated sludge) is only dependent on the mechanical shearing and totally
independent of the presence or absence of air. Also, the effect of TSS at constant air flow
rate shows that an increase in TSS induces an increase not only in apparent viscosities but
also in shear-thinning properties.
It has also been reported that EPS and SMP are responsible for increasing the apparent
viscosity (Nagaoka et.al, 1996; Rosenberger et.al, 2002; Wu et.al, 2007)

The influence of sludge characteristics from full-scale MBR in membrane filterability
36

The influence of sludge characteristics from full-scale MBR in membrane filterability
37
4 METHODOLOGY
This chapter consists in a description of materials and methods applied to measure the
characteristics in the activated sludge such as filterability characterization, particle
counting in ranges 2-100 µm and 0.4-5.0 µm, SMP, viscosity and MLSS. The first Sub-
chapter 4.1 explains the three different experiments done along the research period. The
following Sub-chapter 4.2 is a general approach to the measuring protocol. The next Sub-
chapters from 4.3 till 4.8 consist in the description of materials and methods for each
applied test.
4.1 Three different experiments
In this thesis, between September 2008 and February 2009, sludge samples from the
membrane tank (commonly named blank samples) were collected from five full-scale
MBRs: Monheim, Heenvliet, Nordkanal, Ootmarsum and Varsseveld. To study the
characteristics of the sludge, several analyses were performed such as filterability, MLSS,
particle counting in the ranges 2-100 µm and 0.4-5.0 µm, soluble microbial products
(SMP), and viscosity. The most important analysis is the filterability (indicated by ∆R20),
measured through the Delft Filtration Characterization method (DFCm) developed by
TUDelft (Evenblij et.al, 2005).
In order to deepen the study conducted in this thesis, three different experiments were
made:
- Blanks Characterization experiment
- Dilutions experiment
- Solids Concentration experiment
In the following Sections the goals of each experiment and the applied methods are
described.

The influence of sludge characteristics from full-scale MBR in membrane filterability
38
4.1.1 Blanks Characterization experiment
The purpose of this experiment is to characterize sludge from full-scale MBRs through the
previously referred analyses, and relate the similarities and discrepancies between different
treatment plants. In order to understand how the sludge properties can affect the
filterability, the correlation between filterability and each analyzed parameter is applied
through a regression coefficient.
This was the experiment with the highest number of tests.
4.1.2 Dilutions experiment
The MLSS is one of the most controversial parameters in how it affects filterability and
membrane fouling. The goal of this experiment is to study the effect of different solids
contents in filterability.
The way to obtain different MLSS was through dilutions with permeate collected in the
respective treatment plant. After the measurement of the blank sample (for the Blanks
Characterization experiment) two dilutions were made:
- D10p, 10 L of permeate + 20 L of sludge
- D20p, 20 L of permeate + 10 L of sludge
After preparing each dilution, the new “artificial sludge” was submitted to a 30 minute
period of aeration to ensure a complete mixture and enough oxygen content for aerobic
conditions. Only then were all the analyses performed.
The organization of this experiment is made by sets. A set comprehends the blank, D10p
and D20p. It is important to emphasize that the two dilutions cannot be considered as real
sludge, so that further conclusions have to be carefully drawn.
4.1.3 Solids Concentration Experiment
The goal of this experiment was to modify the sludge solids concentration by manipulating
the operating conditions in a full-scale plant and measuring the filterability for the different

The influence of sludge characteristics from full-scale MBR in membrane filterability
39
MLSS obtained. By increasing the hydraulic retention time (HRT), and maintaining the
permeate flow constant, it was possible to increase the solids content in the membrane
tanks.
This experiment only took place at Heenvliet where, for a short period of time, the HRT
was able to vary from the normal value. During this period, several sludge blanks were
collected and the filterability measured to study the effect of MLSS in filterability.
4.2 General measuring protocol
The majority of the experiments done in this thesis took place at the laboratory of TUDelft.
The analyses applied such as particle counting in range 0.4-5.0 µm, SMP, viscosity, and
MLSS could not be accomplished outside the laboratory. The only portable apparatus were
the Delft Filtration Characterization installation (DFCi) for the filterability test, and the
particle counter in range 2 – 100 µm. Therefore, it was necessary to adapt the general
measuring protocol to these conditions.
Of all the WWTPs visited, Heenvliet was the nearest one, located approximately 40 km
from TUDelft. Since the distance was short and the transport of the sludge from the
treatment plant to TUDelft would take around 30 minutes, and the quantity of sample was
considerable (40 L), it was assumed that no significant changes in the sludge would take
place. For that reason, all experiments with Heenvliet sludge were feasible to do at the
laboratory, i.e. “ex situ”. However, to restore the level of oxygen content, the sludge would
be aerated for one hour before any experiment.
All the other WWTPs (Monheim, Nordkanal, Ootmarsum and Varsseveld) were, at least, 3
hours from TUDelft which was compromising to the original structure and nature of the
sludge, and thus could not be representative of a full-scale MBR. In these cases the DFCi
was set up at the treatment plant, “in situ”, as well as the particle counter in range 2 – 100
µm when possible.
For the other tests (particle counting in range 0.4-5.0 µm, SMP, viscosity, and MLSS)
sludge samples were collected from the sludge in the bioreactor of the DFCi immediately
before the start of the filterability test. For the particle counting 0.4-5.0 µm and SMP, since

The influence of sludge characteristics from full-scale MBR in membrane filterability
40
free water (defined as water obtained after filtrating through a 7-12 µm pore size paper
filter) is required for these measurements, the fractionation test was done “in situ” using a
portable vaccum system. The viscosity and MLSS were only possible to measure on the
next day. For that reason, the free water samples and sludge samples were saved and stored
in a refrigerator in order to reduce the microorganism activity and preserve the original
characteristics.
To see the difference between the measurements made “on day” and on the next day, a
couple of trials were done where all tests, except the filterability test, were performed on
the day of the sludge collection and on the following day. The results were compared and
the differences obtained were insignificant, showing that this protocol could be applied
conducting to reliable results.
In Monheim and in Nordkanal the DFCi stayed for a week in the treatment plant. Thus, the
particles in range 0.4-5.0 µm, SMP and viscosity were not able to be measured and after
one week the sludge and free water had a different composition leading to unrepresentative
results. Nevertheless, MLSS was obtained through the online sensors in the treatment
plant. For Ootmarsum and Varsseveld, since there was only one day of measurements, all
the tests were possible.
It was not only in Monheim and Nordkanal that some measurements were not done.
Unfortunately, all the apparatus for the different measurements weren’t always available
due to utilization by other researchers or due to maintenance reasons.
An overview of the type of experiments done and the tests applied can be seen in Table 4-
1. In all experiments, the filterability test was done and MLSS was measured, which is why
they are not shown.

The influence of sludge characteristics from full-scale MBR in membrane filterability
41
Table 4-1 – Overview of all experiments between September 08 and February 09
Name WWTP
Particle
counting
2 – 100 µm
Particle
counting
0.4 – 5µm
SMP Viscosity Purpose *
Blank 1 Monheim � _ -_ _ -_ _ -_ B.C Blank 2 Monheim � _ -_ - - B.C Blank 3 Monheim � - _ -_ _ -_ B.C Blank 4 Monheim � - _ -_ _ -_ B.C Blank 5 Heenvliet � � - - B.C + Dil. Blank 6 Heenvliet � � - - B.C + Dil. Blank 7 Heenvliet � � � � B.C + Dil. Blank 8 Heenvliet � _ -_ _ -_ � B.C Blank 9 Heenvliet _ -_ � � � B.C + Dil. Blank 10 Nordkanal - _ -_ _ -_ _ -_ B.C Blank 11 Nordkanal - - - _ -_ B.C Blank 12 Nordkanal � _ -_ - - B.C Blank 13 Nordkanal � - _ -_ _ -_ B.C Blank 14 Nordkanal � _ -_ - - B.C Blank 15 Nordkanal � _ -_ _ -_ _ -_ B.C Blank 16 Nordkanal � _ -_ _ -_ _ -_ B.C Blank 17 Nordkanal � - - - B.C Blank 18 Nordkanal � - - - B.C Blank 19 Heenvliet � � � � B.C + Dil. Blank 20 Heenvliet _ -_ � � � B.C + Dil. Blank 21 Heenvliet � � � - B.C + Dil. Blank 22 Heenvliet � _ -_ _ -_ � B.C + Dil. Blank 23 Heenvliet � _ -_ _ -_ � B.C + Dil. Blank 24 Ootmarsum _ -_ � � � B.C + Dil. Blank 25 Ootmarsum _ -_ � _ -_ � B.C Blank 26 Varsseveld - � � � B.C + Dil. Blank 27 Varsseveld - � � � B.C + Dil.
Blanks 1a-5a Heenvliet � _ -_ _ -_ � S.C Blanks 1b-5b Heenvliet � _ -_ _ -_ � S.C
*B.C – Blanks Characterization; Dil. – Dilutions; S.C – Solids Concentration
4.3 Delft Filtration Characterization installation (DFCi)
The Delft Filtration Characterization installation (DFCi) was developed by Delft
University Technology (TUDelft) to study the filtration performance of MBR activated
sludge. In order to analyze different activated sludge and obtain comparable data, the Delft
Filtration Characterization method (DFCm) was developed as described in Evenblij et.al,
(2005). This protocol gives the possibility to filtrate sludge samples always under equal
hydraulic conditions and link the results only to the characteristics of the sludge.
The most representative element of the DFCi is the membrane that together with
- sludge pump, damper and permeate pump,

The influence of sludge characteristics from full-scale MBR in membrane filterability
42
- online measuring instruments for pH, temperature, oxygen content, mass balance, pressure and flow
- programmable logic controller (PLC), - computer to collect the data
are the principal constituents of this installation.
In Figures 4-1 and 4-2 a schematic overview and a picture from the DFCi are respectively
represented.
Figure 4-1– Schematic overview of the DFCm (Evenblij, 2006)

The influence of sludge characteristics from full-scale MBR in membrane filterability
43
Figure 4-2 – DFCi during filtration campaign at Monheim, 2008: front view (left-side) and back
view (right-side)
4.3.1 Membrane
The filtration unit has a single tubular X-Flow UF membrane built in Polyvinylidene
Fluoride (PVDF) material. The membrane presents the following characteristics: nominal
pore size of 0.03 µm, length of 95 cm, diameter of 8 mm, and a surface area of 240 cm2.
The membrane is placed vertically and operated in upflow side stream configuration. The
extraction of permeate is done inside-out. For more details see Appendix II.
4.3.2 Pumps
The installation requires four pumps: sludge pump, permeate pump, water pump and
chemical cleaning pump.
Sludge pump - a peristaltic pump is used for the circulation of the sludge with the purpose
of not breaking the floc structure of the sludge. Since the pump creates turbulence while

The influence of sludge characteristics from full-scale MBR in membrane filterability
44
working, and a constant flow is necessary to assure that a crossflow velocity (CFV) of 1
m/s is maintained, a damper was added to the filtration unit to absorb the fluctuations
produced.
Permeate pump - the permeate pump, which is connected to the outlet of the membrane
module, is also peristaltic to avoid disrupting the structure of permeate when extracted. By
controlling the rotational velocity of the pump, it is possible to regulate the desired
permeate flux.
Water pump - the water pump is used for a clean forward flush and backflush. In the
forward flush, a CFV up to 4 m/s is obtained for a more efficient cleaning. The goal of
backflush is to reverse the TMP that results from the filtration test to values near zero. This
way each new test is started under the same conditions.
Chemical pump – in order to re-establish the initial resistance of the membrane a chemical
cleaning is necessary and is made trough a peristaltic pump.
4.3.3 Online measuring instruments
Since the purpose of this installation is to measure sludge filterability, several parameters
have to be continually analyzed during the test. The sensors are an important part of the
DFCi since they are responsible for measuring several parameters which are fundamental
to the membrane filtration. It is important that all the sensors are suitable and accurate
otherwise the results could not be entirely representative of the membrane´s behavior.
Sludge sensors
During the filtration test there are three parameters being measured online: pH,
temperature and oxygen content.
The pH is measured as a reference parameter to compare with other sludge samples.
The temperature is directly related with the formula to calculate the total resistance in the
membrane. Total resistance depends on the permeate viscosity, that varies according to
temperature. The calculation of the resistance is automatically done by the software for a

The influence of sludge characteristics from full-scale MBR in membrane filterability
45
temperature of 15oC, and then a subsequent correction is applied to the measured
temperature during the filterability test. Equation 4-1 shows how total resistance is
calculated.
(4-1)
where,
Rt – total resistance [m-1]
TMP – transmembrane pressure [Pa]
J - flux [Lm-2h-1]
�ref – permeate dynamic viscosity at 15oC [Pa.s]
�act – permeate dynamic viscosity for the actual temperature [Pa.s]
The oxygen content is measured to guarantee that the sludge is in aerobic conditions (> 2
mg/l).
4.3.4 Mass balance
The mass balance consists in monitoring the permeate production online, which is
fundamental to calculate the permeate flux. It is assumed that the mass of permeate has the
same specific weight of water. Through Equation 4-2 it is possible to calculate the flux, J.
(4-2)
where,
M – mass of permeate [g]
t– time [s]
Am = membrane area [m2]
� = permeate density [kg/m3]

The influence of sludge characteristics from full-scale MBR in membrane filterability
46
4.3.5 Pressure transmitters
The TMP is one of the inherent parameters during the filterability test. The measuring of
TMP is done through three pressure transmitters: one on the feed side of the membrane,
immediately before the inlet to the membrane tube; one on the outlet of the membrane
tube; one in the permeate stream.
The TMP is calculated through Equation 4-3.
��� = ��� � ����
�− P�������� (4-3)
4.3.6 Programmable Logic Controller (PLC)
The PLC is the controller of the installation allowing different operation modes such as
sludge filtration, water cleaning (forward flush and backflush), recirculation, etc. All the
electricity connections from the installation are plugged to the PLC.
4.3.7 Measuring Protocol - DFCm
The filtration characterization test relies on four steps:
1 – Cleaning the membrane with a forward flush with demineralised water (demi-water)
to remove the cake layer and the cleaning chemicals that remained after the last filtration
test. Now the membrane presents the “initial” conditions desired for each test.
2 – Filtration of activated sludge: before starting the test, a forward flush is performed to
ensure that only sludge runs in the installation. Then recirculation of activated sludge is
turned “on” to the sludge vessel (bioreactor). After this, the permeate pump is turned “on”
and the test started. The test is performed at least until 20 L/m2 of permeate is produced.
The main reason for this is that the additional resistance obtained after filtrating 20 L/m2 of
permeate was previously defined as a comparison point between different activated sludge

The influence of sludge characteristics from full-scale MBR in membrane filterability
47
samples. The test is performed with a constant flux of 80 Lm-2h-1 and a CFV of 1 m/s.
Eventually, if the TMP reaches a value of 0.70 bar the test is stopped, even if the permeate
production is less than 20 L/m2.
3 – Forward flush: when the test ends a forward flush with demi-water is applied to clean
the membrane. Afterwards, in order to restore the “standard” pressure values in the system,
a backflush is executed. The vessel in which the activated sludge remains after the
filtration test is cleaned properly for the next sludge filtration test.
4- Chemical cleaning: After the test is finished a chemical cleaning is carried out with
sodium hypochlorite (NaOCl, 500 ppm active chlorine) until the membrane is clean.
4.3.8 Data acquisition and output
The Testpoint software allows the monitoring on the computer of all the data that is being
measured online: membrane resistance, TMP, flux, CFV, oxygen content, temperature, and
pH. This way, it is possible to have an overview of the filtration test. All the information
will be gathered in a single data file for consequent treatment on Microsoft Office Excel.
The filtration test output consists in three figures assembling different information. In
Figure 4-3 it is possible to see the additional resistance along the flux extraction, and also
the variations of TMP.
Figure 4-3 - Additional resistance and TMP alongside permeate volume extraction
y = 0,0037x2 + 0,0597x + 0,0118R² = 0,9906
0
0,2
0,4
0,6
0,8
1
0,00
0,20
0,40
0,60
0,80
1,00
1,20
1,40
0 2 4 6 8 10 12
TMP [bar]
Add. Resistance [*1012m
-1]
volume [l/m2]
Radd TMP Poly. (Radd)

The influence of sludge characteristics from full-scale MBR in membrane filterability
48
The output data only presents the evolution of additional resistance, which is the
subtraction between total resistance and membrane resistance, along the filtration process.
A trendline is applied to the additional resistance data points to characterize the behavior of
the sludge filterability through the equation that fits better, usually a second order
polynomial equation. Then the calculation of ∆R20 is made.
The ∆R20 is the parameter used in this work to characterize the filterability of sludge. It is
the additional resistance (m-1) after filtration of 20 L/m2 of a sludge sample, using a flux of
80 Lm-2h-1 and a cross-flow velocity of 1 m/s. This way, all sludge samples are compared
under the same membrane and operational conditions. Geilvoet (2009) created a scale to
characterize the sludge quality based on parameter ∆R20. According to this scale, sludge
can be divided into five different quality groups, see Table 4-2.
Table 4-2 – Sludge quality according to ∆R20 values
Excellent 0<∆R20<0.05
Good 0.05<∆R20<0.2
Moderate 0.2<∆R20<0.5
Mediocre 0.5<∆R20<1
Poor ∆R20>1
In Figure 4-4, resistance (black line), TMP (blue line) and Flux (red line) are plotted
alongside the permeate volume production. It demonstrates the increasing of resistance
along the volume production whilst flux is maintained at a constant rate. Although it’s not
clear, TMP is also increasing.
Figure 4-4 – Overview of resistance, flux, and TMP while extracting permeate
0
1
2
3
4
5
0 5 10 15 20 25 30 35 40 45 50
volume [l/m2]
Resistance [*1012 m
-1]
TMP (bar)
0
25
50
75
100
125
Flux (lm
-2 h
-1)
R TMP J

The influence of sludge characteristics from full-scale MBR in membrane filterability
49
The following Figure 4-5 shows the CFV, oxygen content, temperature and pH in the
elapsed experience.
Figure 4-5 – Overview of CFV, pH, oxygen content, and temperature, during a filtration test
4.4 Particle counting in range 2-100 µm
Particle counting aims to characterize the sludge by a particle number distribution, in this
case ranging from 2 till 100 µm.
4.4.1 Materials
Particle counting is made using a particle counter Met One PCX.
The particle counter Met One PCX was specifically designed for drinking water
applications. It is a pore blocking instrument in which the water is directed into the sensor
and funneled through an optical flow cell measuring 750 x 750 microns. Its range
comprises from 2 till 100 µm. For calibration, different NIST traceable spheres of known
size are used; this information is stored in the memory of the sensor and is used to separate
the particle counts into the proper size category (for technical specifications see Appendix
III).
The installation, besides particle counting, is composed by the following materials and
accessories:
Materials
- Flow controller Krohne DK 47N
- Stirrer and agitator board Protherm pt 100
0
5
10
15
20
25
0 5 10 15 20 25 30 35 40 45 50
volume [l/m2]
pH, O2 (mgl-1)
Temperature (oC)
0
1
2
3
4
5
CFV (ms-1)
pH O2 Temp ucr

The influence of sludge characteristics from full-scale MBR in membrane filterability
50
- Pump Monacor – Netzgerat
- Data Acquisition system: WGS software, computer
Accessories
- Sieve Retsch DIN-150 3310/1 with 100 µm pore size
- Test tube
- Erlenmeyer
- Funnel
- 2 litter bucket
In Figure 4-6 a schematic overview of the particle counting installation is illustrated, and in
Figure 4-7 a picture of the installation at laboratory.

The influence of sludge characteristics from full-scale MBR in membrane filterability
51
Figure 4-6 – Schematic overview of the particle counting installation 2-100 µm
Figure 4-7 – Particle counting installation at TUDelft laboratory
4.4.2 Measuring protocol
In the particle counting analysis, sludge samples cannot be used directly into the particle
counter, otherwise it would contaminate the particle counter due to the high number of
particles existing in sludge. Also, the sensor measures up to a maximum particle number of
18 000 particles. Samples with a higher number of particles will provide coincidence
errors. Therefore, diluted samples are necessary to perform the test.
Preparation of diluted sludge samples
1 - A sample of sludge is collected from the container where the sludge is being mixed and
aerated in the DFC installation, immediately before the filterability test starts.
The influence of sludge characteristics from full-scale MBR in membrane filterability
52
2 - The sludge is diluted with permeate (collected in the WWTP) in the relation of 1:100
(10 ml of sludge: 1000 ml of permeate).
3 – Subsequently, the solution is sieved using a 100 µm sieve to an Erlenmeyer.
Procedure of Particle counting
1 – The particle counter is turned on as well as the computer
2 – A sample of demi-water is measured according to steps 2a till 2d.
a) a plastic bucket is filled with 2 L of sample and placed in the agitator board with the
electromagnetic stirrer. The rotational speed of the stirrer is adjusted to ensure a
homogeneous solution and avoid sedimentation.
b) the pump is turned on and the flow is regulated to 6 L/h on the flow meter. Usually
there are some air bubbles in the system and so the bucket should be lifted in the air to
help release them.
c) when the flow is constant the measurement can start. The software is started and the
test begins. For each test the solution is measured twice and the average is then used as
final result.
d) after the test is finished the pump can be turned off.
3 – a permeate sample is measured according to step nº 2. After the test, the permeate that
remains in the bucket has to be equal or superior to 1000 mL in order to guarantee a
dilution in a relation of 10 mL sludge/ 1000 mL permeate.
4 – a sludge dilution 1:100 is measured according to step nº 2
5 – a sample of demi-water is measured to clean the particle counter according to step nº 2.

The influence of sludge characteristics from full-scale MBR in membrane filterability
53
4.4.3 Data acquisition
The particle counter measures particles trough 198 channels with different pore sizes
ranging from 2.0 to 100.0 µm. The first channel comprehends particles in a range size of
2.0 µm, the second in a range size of 2.5 µm, and the following ones with 0.5 µm intervals
till the range size of 100.5 µm is reached. The particles are measured twice for each test
and the average of both countings is the result used.
The particle counting only provides results relative to the number of particles. In addition
to the particle number analysis, a particle volume analysis is also calculated. Since it is
impossible to predict the real volume of a particle, due to the complex structure of sludge,
some assumptions are considered:
- The particle diameter corresponds to the range size channel in which the particle is
detected
- The volume of a particle is assumed to be identical to a sphere
In the particle volume analysis the volume of a particle is calculated according to
Equations 4-4.
� = �
�∙ ∅� ∙ (4-4)
where,
V – volume of a particle [m3]
Ø – diameter of particle = particle size range [m]
The particle volume of a specific size range is given by the volume of a particle at a certain
size range times the number of particles found in that size range.

The influence of sludge characteristics from full-scale MBR in membrane filterability
54
Calculation of the real number of particles in a sludge sample
Considering that a sludge sample is diluted with permeate in a relation of 1:100, the real
number of particles is given by:
!"#$%&' = (!"#$%&' )�:�++, − !-'./'01' ∙ 0.995 ∙ 100 (4-5)
where
�sludge – number of particles in a sludge sample �dilution (1:100) – number of particles in a diluted sludge sample �permeate – number of particles in a permeate sample
The acquired data is then used for correlating filterability, ∆R20, with different particle
counting parameters. The parameters defined are:
- cumulative particle number
- maximum particle number
- mean particle size of maximum particle number
- cumulative particle volume
- maximum particle volume
- mean particle size of maximum particle volume
The influence of sludge characteristics from full-scale MBR in membrane filterability
55
4.5 Particle counting in range 0.4 - 5 µm
Particle counting in range 0.4-5.0 µm is applied to the free water of the sludge.
4.5.1 Materials
Particle counting is accomplished using a particle counter HIAC MicroCount 100 series.
The particle counter has a pore blocking sensor appropriate for high purity solutions with
sensitivity from 0.4 to 5 µm. The typical flow rate of this apparatus is 100 ml/min and its
concentration limit is up to 100,000 particles/mL (for technical specifications see
Appendix IV). The installation, in addition to the particle counting, is composed by the
following materials and accessories:
Materials
- Flow controller - Stirrer and agitator board Pump Monacor – Netzgerat
- Peristaltic pump Watson Marlow 205 U
- Data Acquisition system: Particle Vision Online SE, computer
Accessories
- Vacuum filtration unit - Paper filter Schleicher & Schuell 589/2 with pore size 7-12 µm
- Beaker
In Figures 4-8 and 4-9 an overview and a picture of the particle counting installation are
represented respectively.

The influence of sludge characteristics from full-scale MBR in membrane filterability
56
Figure 4-8 – Schematic overview of the particle counting installation in range 0.4-5.0 µm
(Geilvoet et.al,., 2007)
Figure 4-9 – Particle counting installation at TUDelft laboratory
4.5.2 Measuring protocol
Fractionation
The free water from the sludge is obtained through fractionation, which consists in the
separation of the activated sludge by filtration over a paper filter Schleicher & Schuell
589/2 with pore size 7-12 µm. This process takes place in a vacuum filtration unit.
Procedure of Particle counting
The free water of the sludge sample contains a number of particles higher than the limit
imposed by the particle counter. Thus, a dilution sample is prepared with demi-water in a
relation of 1:100 (1 sludge/100 demi-water). The demi-water runs by gravity to the
installation and, just before entering the particle counter, the free water is added through a

The influence of sludge characteristics from full-scale MBR in membrane filterability
57
peristaltic pump. The flow controller allows regulating a flow of 100 ml/min. In order to
clean and maintain the durability of the installation, a sample of demineralised water is
measured before each free water sample.
The particle counting of a sample consists in the following steps:
1 – The sludge sample is submitted to vacuum filtration through a Schleicher & Schuell 589/2 paper filter. The filtration is stopped when the free water volume is at least 50 ml, ensuring enough volume for the measurement.
2 – The computer is switched on.
3 – The valve of the demi-water water network is opened and it starts to run into the installation. The flow is adjusted to 100 ml/min in the flow controller.
4 - A sample of demi-water is placed in the agitator board with a stirrer.
5 – The pump is switched on and the sample starts running into the particle counter.
6 – The software Particle Vision Online SE is started and the particle counting measurement starts. The sample is measured for about 30 minutes.
7 – The demi-water sample is replaced with the free water sample and measured for about 30 minutes.
8 – If there are more free water samples to measure, a demi-water sample always precedes
each new free water analysis.
4.5.3 Data acquisition
The results of the particle counting measurements are expressed as the number of particle
countings per ml along different size ranges from 0.4 to 5.0 µm within intervals of 0.1 µm
resolution.
For the particle volume analysis, the assumptions made for particle counting in range 2-
100 µm referred in Section 4.3.2 are made as well for the particle counting in range 0.4 to
5.0 µm. Also, the same particle counting parameters will be used to observe the

The influence of sludge characteristics from full-scale MBR in membrane filterability
58
relationship between filterability and particle counting in range 0.4 to 5.0 µm (see Section
4.3.3).
4.6 Soluble Microbial Products (SMP)
The analysis of the SMP is made through photometric methods. The free water from the
activated sludge is required, and the analysis is divided in two measurements: proteins and
polysaccharides.
4.6.1 Materials
In the SMP analysis the following materials are used:
- Thermo Electron genesys 6 UV-Visible spectrophotometer
- Vortex mixer Genie 2 G-5680
- Cuvetts of 4 cm
4.6.2 Measuring protocol for Proteins
For protein analysis the modified method of Frølund et.al,. (1996), based on the method of
Lowry et.al,. (1951), by Rosenberger (2003), is applied. For the calibration Albumine
bovie (BSA), (Acros) fraction V, in a concentration range between 0 – 25 mg/l is used.
Afterwards the concentration can be calculated using the BSA calibration curve and the
measured difference between the sample and the blank (demi-water).
Reagents
A: 143 mM NaOH and 270 mM Na2CO3 in demi-water
B: 57 mM CuSO4 in demi-water
C: 124 mM Na2-tartrate, C4H4Na2O6, or Na-k-tartrate, C4H4NaKO6, in demi-water
D: mixture of reagents A, B and C in the relation of 100:1:1
E: Folin-Ciocalteu phenol reagent I in the relation of 1:1
The influence of sludge characteristics from full-scale MBR in membrane filterability
59
It is important to state that reagent D has to be prepared on the day of SMP analysis in
opposition of reagents A, B, C and E that can be stored for an unlimited period of time.
Method
A sample of 2.5 ml is poured into a round tube together with 3.5 ml of reagent D and
mixed in a tube mixer. Afterwards the mixture is stored for 10 minutes in a room at a
controlled temperature. Then 0.5 ml of reagent E is immediately added and the mixture has
to be mixed fast and powerfully due to the fact that the Folin-Ciocalteu phenol reagent is
only stable for a short time in the alkaline environment. The sample-mixtures should then
be incubated for 45 minutes at room temperature to make sure that the color complex will
be finished before the start of the measurement.
The adsorption is now measured in a 4 cm cuvette at wavelength of 750 nm with a UV-
VIS spectrophotometer against a reference sample of demi-water. The formed color
complex will be stable for about 45-60 minutes. Each sample is measured twice, and then
an average will be used to calculate the concentration in the free water through the
calibration curve.
4.6.3 Measuring protocol for Polysaccharides
The polysaccharides analysis is made through Rosenberger (2003) modified method of
Dubois et.al,. (1956). For the calibration, D(+)-glucose (J.T.Baker), in a concentration
range between 0.5-10 mg/l, is used. It will then be possible to calculate the concentration
using the polysaccharides calibration curve and the measured difference between the
sample and the blank – demi-water.
Reagents
A: 5 % Phenol solution in demi-water
B: 95 – 97 % sulphuric acid

The influence of sludge characteristics from full-scale MBR in membrane filterability
60
Method
A sample of 4 ml is poured into a round tube and 2 ml reagent A is then added. After
mixing properly, 10 ml of reagent B is added and it is again well mixed. After 10 minutes
of storing at room temperature a new mixing is required. Subsequently, the mixture is
incubated for 30 minutes at room temperature. Then the adsorption is measured in a 4 cm
cuvett at a wavelength of 487 nm with a UV-VIS spectrophotometer against a reference
sample of demi-water. The formed colour complex will be stable for a long time. Each
sample is measured twice, and then an average will be used to calculate the concentration
in the free water through the calibration curve.
4.7 Viscosity
The viscosity of the sludge is measured, when possible, for each filtration test. A sludge
sample is collected immediately before the start of the filterability test, as it happens for the
particle counting 2 – 100 µm and MLSS, see Sub-chapters 5.2 and 5.6 respectively.
The viscosity measurements are always performed at 20±1oC in order to compare different
sludge samples. This way it is assumed that the rheological properties of the sludge are due
to the solids content and to the pressure forces submitted, see Section 3.4.1.
4.7.1 Materials
The apparatus used for viscosity measurements is a rotational rheometer Anton Paar
Physica UDS 200. It allows performing tests with both Newtonian and viscoelastic fluids
under controlled “shear rate” (.0001 to 5,000 s-1, geometry dependent) or controlled
"stress" (0.002 mNm - 150 mNm), for technical specifications see Appendix V.
In addition to the rheometer, the installation is composed of:
- Air pressure system
- Thermo heater Jeio Tech RW-0525 G
- Data Acquisition system: US 200/32 v 2.30 software, computer.

The influence of sludge characteristics from full-scale MBR in membrane filterability
61
In Figure 4-10 a picture of the viscosity installation is illustrated.
Figure 4-10 – Viscosity installation at TUDelft laboratory
4.7.2 Measuring protocol
For a viscosity measurement the following steps are given:
1 – Air pressure input: the pressure hose is connected to the wall socket and then a 5 bar pressure is regulated using the pressure adjuster.
2 – The power of the rheometer can now be switched on as well as the computer.
3 – The protections of the rheometer are removed and the geometry, container and cylinder, are installed. Before installing, the container is filled with a 100 ml sludge sample previously mixed.
4 – The thermo heater is turned on and adjusted to 20 oC.
5 – The USD 200 software is started and the calibration of the rheometer is done. Now the viscosity test can be carried out. For each test the following shear rates are applied:
Shear rate (s-1) 5 10 20 30 50 100 250 500 700 1000

The influence of sludge characteristics from full-scale MBR in membrane filterability
62
For each shear rate 10 points are measured within a 5 second interval. Then a higher torque
is applied to the cylinder in order to achieve the next pre-defined shear rate.
6 – When the test is finished data is collected as a text document for subsequent treatment
in Microsoft Office Excel. The results of the tests allow us to know the temperature, shear
rate, shear stress, apparent viscosity, speed and torque of each measuring point. Since there
are 10 measuring points for each different shear rate, the final value is the average value.
4.8 Mixed Liquor Suspend Solids (MLSS)
The MLSS were measured according to the Standard Methods, see Appendix VI.

The influence of sludge characteristics from full-scale MBR in membrane filterability
63
5 BLANKS CHARACTERIZATION EXPERIMENT
This chapter describes the Blanks Characterization experiment in which filterability of
activated sludge from five MBR systems was measured: Monheim, Heenvliet, Nordkanal,
Ootmarsum and Varsseveld. In sub-chapter 5-1 a characterization of the five MBRs is
made with specific information relative to the operating conditions of each treatment plant.
The following sub-chapters present the results and discussion of each analysis, namely
filterability, particle counting in ranges 2-100 µm and 0.4-5.0 µm, SMP, and viscosity. In
Sub-chapter 5-7 the conclusions drawn are presented. All results are shown in Appendix
VII.
5.1 Characterization of five MBR systems
In this sub-chapter, a briefly description of the five MBR systems where sludge was
collected for this thesis can be found together with, in Table 5-1, the main differences
between the WWTP. The diagrams for each treatment plant are presented in Appendix
VIII.
Monheim
The Monheim WWTP is located in Bavaria, Germany. The main treatment process of the
plant is an MBR that includes a nitrifying-denitrifying tank and the membrane tanks where
the extraction of permeate occurs. The MBR was installed due to the restricted effluent
target values, since the effluent is discharged in sensitive surface water.
Heenvliet
This WWTP is situated in Heenvliet, South of Holland. The plant includes a conventional
activated sludge system and an MBR that can be operated in series or in parallel. When
operating in parallel, the MBR only receives 25% of the influent, whereas the other 75%
are received in the conventional system.
Nordkanal
Located in Kaarst, Germany, it is the largest municipal MBR treatment plant in Europe,
with treatment capacity of 80,000 p.e (1 p.e. = 54g BOD/d). The biological treatment

The influence of sludge characteristics from full-scale MBR in membrane filterability
64
consists in aerobic sludge stabilization and a four-channel biological reactor with upstream
denitrification for nitrogen removal as well as chemical precipitation for phosphorous
removal. The membranes are located in the nitrification tanks.
Ootmarsum
Situated in The Netherlands, this WWTP has a conventional activated sludge system and a
sidestream MBR that work in parallel. The effluent is discharged into sensitive surface
water.
Varsseveld
This WWTP was the first full-scale MBR in The Netherlands, commissioned at the end of
2004. The volume of water entering in the plant varies hugely: after heavy rainfall, the
influent is 3 times more when compared to dry weather conditions.

The influence of sludge characteristics from full-scale MBR in membrane filterability
65
Table 5-1 – Overview of the main differences in the five WWTP
5.2 Filtration characteristics - ∆R20, MLSS and Temperature
5.2.1 Results
In the Blanks Characterization experiment sludge from five MBR systems was collected
and different analyses were applied in order to compare different characteristics in the
Parameter Unit Monheim Heenvliet Noordkanal Ootmarsum Varsseveld
WWTP type … Full-scale Full-scale Full-scale Full-scale Full-scale
Location … Germany The Netherlands Germany The Netherlands The Netherlands
Wastewater … municipal municipal municipal municipal municipal
Biological Capacity p.e. * 9,7003,333(MBR) + 9,664(CAS) ≈
13,00080,000
WWF: 7,000 (MBR) + 7,000
(CAS) = 14,000 / DWF: 9,250
(MBR) + 9,250 (Conv.) = 18,500
23,150
Hydraulic capacity (Average) m3/d 1,820 2,400
WWF: 45,000 / DWF: 16,000
WWF: 1,400 / DWF: 3,600
5,000
Permeate production m3/h up to 96 100 n.a **WWF: 150 /
DWF: 75275
Process Configuration
… Submerged Submerged Submerged Sidestream Submerged
Membrane type … Hollow fibre Flat sheet Hollow fibre Tubular Hollow fibre
Membrane supplier … Zenon Toray ZenonNorit X-Flow
AirLiftZenon
Product name … ZeeWeed 500c Unibrane ZeeWeed 500c LPCF ZeeWeed 500d
Number of lanes m2 4 parallel tanks 2 parallel tanks 4 parallel tanks 6 stacks 4 parallel tanks
Total membrane area m2 12,320 4,115 84,480 2,784 20,160
Membrane pore size µm 0.04 0.08 0.04 0.03 0.035
Design Flux (netto/brutto)
LMH 12.0-23 24.3 12.0-23 54 37.5 - 45
MLSS (values from experiments)
g/l 6.9-7.6 (Sept 08)13-17.7 (Oct 08 -
Jan 09)10.7-11.8 (Nov
08)7.5-8.9 (Feb 09) 7.6-7.8 (Feb 09)
SRT days 30 20 25-29 >60 35
Cleaning -Mechanical and
chemicalMechanical and
chemicalMechanical and
chemical
Drainage stage & Mechanical and
chemical
Mechanical and chemical
* 1 p.e. = 54 g BOD/d** n.a. - not available
WWF - wet weather flowDWF - dry weather flow

The influence of sludge characteristics from full-scale MBR in membrane filterability
66
sludge and link them to filterability when possible. In order to have a clear and well-
defined structure, data is organized by chronological event as Table 5-2 shows. This
structure will be also used in the Dilutions experiments since the dilutions are originated
from a blank sample.
Table 5-2 - Experiments carried out in the period of September 08 – February 09
All MBRs, except Heenvliet, were located at a considerable distance from TUDelft, thus
not all the analysis were feasible since most of them had to be performed at the laboratory
in TUDelft.
During the experiments period, the MLSS concentrations from sludge blanks ranged
between 6.9 g/L and 17.7 g/L. Heenvliet presents the higher MLSS concentrations, 13.0 -
17.7 g/L, followed by Nordkanal, with values around 11.0 g/L. Ootmarsum and Varsseveld
showed lower values of around 8.0 g/L, as well as Monheim where the lowest MLSS
concentration was observed with more or less 7.0 g/L
Name WWTP Sample Date T oC MLSS (g/L) Sludge age (d) ∆R20 (x1012m-1) R2
blank 1 Monheim MT 08-09-08 19.0 * 7.6 30 0.067 0.86blank 2 Monheim MT 09-09-08 19.0 * 7.1 30 0.092 0.98blank 3 Monheim MT 10-09-08 20.1 * 6.9 30 0.094 0.95blank 4 Monheim MT 11-09-08 19.9 * 7.0 30 0.098 0.93blank 5 Heenvliet MT 22-10-08 19.8 17.7 20 0.025 0.63blank 6 Heenvliet MT 29-10-08 19.5 14.3 20 0.047 0.24blank 7 Heenvliet MT 05-11-08 19.5 14.1 20 0.036 0.85blank 8 Heenvliet MT 10-11-08 19.5 15.1 20 0.042 0.37blank 9 Heenvliet MT 20-11-08 20.2 13.0 20 0.066 0.47
blank 10 Nordkanal MT 26-11-08 15.0 * 11.0 25-29 0.234 0.74blank 11 Nordkanal MT 26-11-08 16.2 * 11.8 25-29 0.418 0.92blank 12 Nordkanal MT 26-11-08 15.4 * 11.7 25-29 0.391 0.87blank 13 Nordkanal MT 27-11-08 15.5 * 10.7 25-29 0.278 0.90blank 14 Nordkanal MT 27-11-08 17.2 * 11.1 25-29 0.398 0.95blank 15 Nordkanal MT 27-11-08 16.7 * 11.0 25-29 0.382 0.86blank 16 Nordkanal MT 28-11-08 15.2 * 10.7 25-29 0.320 0.83blank 17 Nordkanal MT 28-11-08 17.5 * 10.7 25-29 0.266 0.89blank 18 Nordkanal MT 28-11-08 17.5 * 11.0 25-29 0.389 0.80blank 19 Heenvliet MT 17-12-08 23.7 15.1 20 0.096 0.92blank 20 Heenvliet MT 18-12-08 22.9 15.1 20 0.070 0.91blank 21 Heenvliet MT 07-01-09 14.5 16.4 20 0.221 0.99blank 22 Heenvliet MT 21-01-09 12.1 * 17.0 20 0.183 0.95blank 23 Heenvliet MT 23-01-09 12.3 * 16.1 20 0.246 0.88blank 24 Ootmarsum MT 05-02-09 8.2 * 8.9 > 60 2.674 0.99blank 25 Ootmarsum MT 05-02-09 8.2 * 7.5 > 60 2.258 1.00blank 26 Varsseveld MT 12-02-09 10.8 * 7.8 35 4.248 0.99blank 27 Varsseveld MT 12-02-09 10.8 * 7.6 35 4.104 0.98
Max 23.7 17.7 > 60 4.248 1.00Min 8.2 6.9 20 0.025 0.24
Blank samples
* Temperature "in situ"
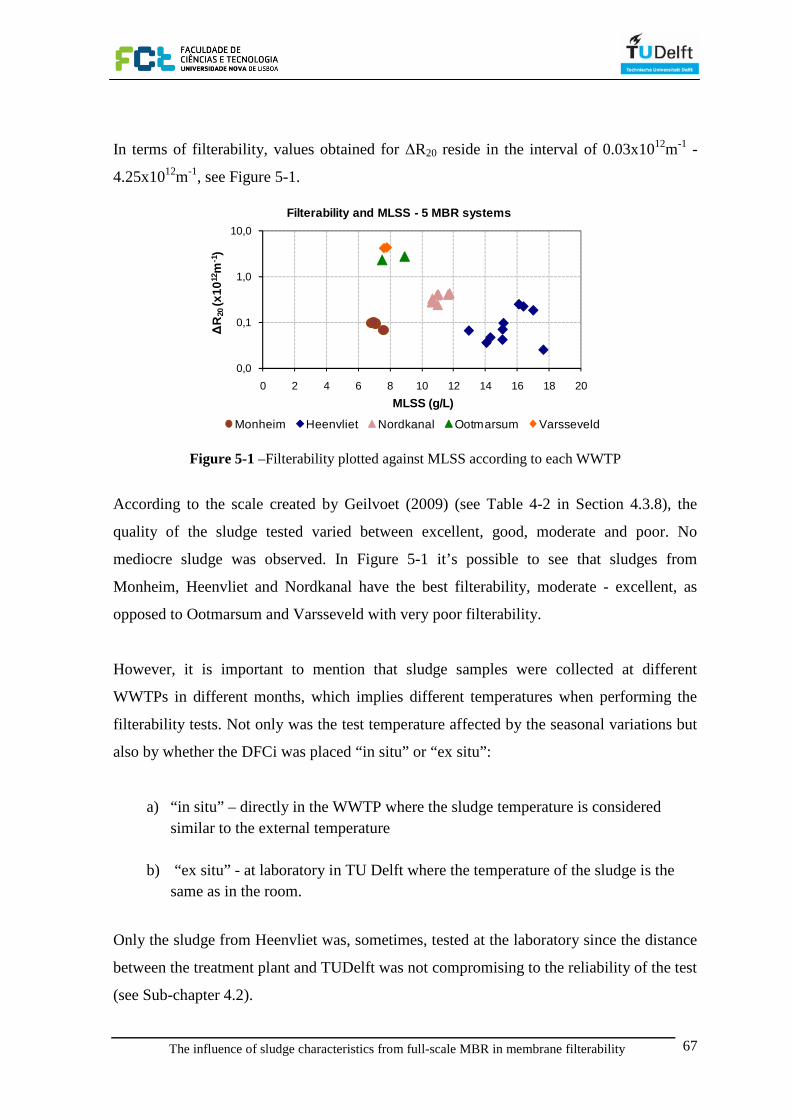
The influence of sludge characteristics from full-scale MBR in membrane filterability
67
In terms of filterability, values obtained for ∆R20 reside in the interval of 0.03x10¹²m-1 -
4.25x10¹²m-1, see Figure 5-1.
Figure 5-1 –Filterability plotted against MLSS according to each WWTP
According to the scale created by Geilvoet (2009) (see Table 4-2 in Section 4.3.8), the
quality of the sludge tested varied between excellent, good, moderate and poor. No
mediocre sludge was observed. In Figure 5-1 it’s possible to see that sludges from
Monheim, Heenvliet and Nordkanal have the best filterability, moderate - excellent, as
opposed to Ootmarsum and Varsseveld with very poor filterability.
However, it is important to mention that sludge samples were collected at different
WWTPs in different months, which implies different temperatures when performing the
filterability tests. Not only was the test temperature affected by the seasonal variations but
also by whether the DFCi was placed “in situ” or “ex situ”:
a) “in situ” – directly in the WWTP where the sludge temperature is considered similar to the external temperature
b) “ex situ” - at laboratory in TU Delft where the temperature of the sludge is the same as in the room.
Only the sludge from Heenvliet was, sometimes, tested at the laboratory since the distance
between the treatment plant and TUDelft was not compromising to the reliability of the test
(see Sub-chapter 4.2).
0,0
0,1
1,0
10,0
0 2 4 6 8 10 12 14 16 18 20
∆R
20 (x
1012
m-1
)
MLSS (g/L)
Filterability and MLSS - 5 MBR systems
Monheim Heenvliet Nordkanal Ootmarsum Varsseveld

The influence of sludge characteristics from full-scale MBR in membrane filterability
68
In Figure 5-2 the temperature from all experiments is plotted along the time with the
respective filterability values.
Figure 5-2 – Temperature and ∆R20 by experiment date
In general, higher temperatures correspond to lower values of ∆R20, which indicates a
better filterability. However, the lowest temperature of 8.2oC registered on February 5th
doesn´t match the highest ∆R20 which is verified when temperature is 10.8oC in February
12th. The main reason why we should pay more attention to “in situ” temperature values is
because, while in “ex situ” the sludge experiences a quick change of temperature (from the
treatment plant to the lab), “in situ” the sludge is considered stabilized and more
representative of the real conditions in which MBRs are operated.
5.2.2 Correlating filterability with MLSS and Temperature
When plotting filterability in terms of quality sludge instead of the WWTP where sludge
was collected, a more clear perception is given regarding the relation between MLSS and
filterability. In Figure 5-3 it can be seen that, when the sludge quality is good, a large range
of MLSS can coexist, 7.6 – 17.0 g/L. Also, for sludge with moderate quality, a
considerable high interval of solids content occurs (10.7-16.4 g/L). Besides that, sludges of
different quality can have similar MLSS. For instance, blanks of good and poor quality are
observed when MLSS is approximately 8.0 g/L.
0
5
10
15
20
25
0
1
2
3
4
5
08-09-08
10-09-08
22-10-08
05-11-08
20-11-08
26-11-08
27-11-08
27-11-08
28-11-08
17-12-08
07-01-09
23-01-09
05-02-09
12-02-09
Tem
pera
ture
(oC
)
∆R
20(x
1012
m-1
)
Temperature test and filterability by date
∆R20 Temperature in situ Temperature ex situ

The influence of sludge characteristics from full-scale MBR in membrane filterability
69
Figure 5-3 –Filterability plotted against MLSS according to sludge quality
When considering all the collected data, no correlation between MLSS and filterability is
found. Harada et.al,. (1994), Rosenberger and Kraume (2003), and (Lesjean et.al,., 2005)
have reported the same.
In relation to temperature, since higher temperatures corresponded in general to lower
values of ∆R20, a mathematical correlation between temperature “in situ” and filterability
was made throughout a polynomial equation, see Figure 5-4.
Figure 5-4 – Temperature “in situ” vs. ∆R20
The correlation found is relatively high with a correlation factor of 0.68. This might
indicate that temperature has a role in filterability. Geilvoet et.al,. (2007a) and Lyko
et.al,. (2008) monitoring different full-scale MBRs also found an influence of
temperature (seasonal variations) on filtration performance, where lower temperatures
0,0
0,1
1,0
10,0
0 2 4 6 8 10 12 14 16 18 20
∆R
20(x
1012
m-1)
MLSS (g/L)
MLSS vs. Filterability according to sludge quality
Excellent Good Moderate Poor
y = 0,0085x2 - 0,5449x + 7,2615R² = 0,6801
0
1
2
3
4
5
0 5 10 15 20 25
∆R
20 (x
1012
m-1
)
Temperature ( oC)
Temperature "in situ" vs. ∆R20

The influence of sludge characteristics from full-scale MBR in membrane filterability
70
corresponded to a worse filterability. The latter author attributes this relationship to the
increase of the permeate viscosity and carbohydrate concentration at lower temperatures.
5.3 Particle counting in the range size of 2-100 µm
The particle size characterization in range 2-100 µm includes blank samples from
Monheim, Heenvliet and Nordkanal. In Table 5-3 the particle counting parameters are
presented according to the type of analysis.
Table 5-3 – Results from particle counting analysis in the range 2-100 µm
5.3.1 Characterization of the particle size and volume distributions
Particle number analysis
The results showed a different particle size distribution (PSD) for each WWTP. To have a
clear perception and to allow a possible comparison of the different PSDs, only one
representative blank from each treatment plant was chosen and plotted in Figure 5-5 (for
all PSD see Appendix VII).
NameCumulative
Nr (/ 100 mL)
Max Nr (/ 100 mL)
Max (%) *
Mean size max
Cumulative Vol
(ppb)
Max Vol (ppb)
Max (%) *
Mean size max
Blank 1 1.11E+06 2.12E+04 1.91 5.0 1.21E+07 1.60E+05 1.32 35.5Blank 2 1.07E+06 1.96E+04 1.83 5.0 1.26E+07 1.59E+05 1.27 34.5Blank 3 1.03E+06 1.88E+04 1.83 5.0 1.74E+07 1.57E+05 0.90 36.5Blank 4 1.08E+06 1.76E+04 1.63 5.0 1.56E+07 1.87E+05 1.20 39.0Blank 5 1.12E+06 1.34E+04 1.20 25.0 3.98E+07 3.99E+05 1.00 51.0Blank 6 1.02E+06 1.26E+04 1.24 26.0 3.28E+07 3.29E+05 1.00 49.0Blank 7 1.09E+06 1.37E+04 1.26 25.0 3.46E+07 3.53E+05 1.02 49.0Blank 8 1.09E+06 1.31E+04 1.20 26.0 4.09E+07 4.10E+05 1.00 51.0Blank 9 9.73E+05 1.19E+04 1.22 26.0 3.36E+07 3.45E+05 1.03 51.0Blank 19 1.05E+06 1.28E+04 1.22 25.0 2.82E+07 2.58E+05 0.91 70.5Blank 21 1.03E+06 1.26E+04 1.23 25.0 2.52E+07 2.27E+05 0.90 66.5blank 22 1.13E+06 1.41E+04 1.25 18.0 3.11E+07 2.82E+05 0.91 75.0Blank 23 1.11E+06 1.39E+04 1.25 18.0 3.08E+07 3.07E+05 1.00 69.5Blank 12 7.46E+05 1.19E+04 1.59 5.0 2.82E+07 2.62E+05 0.93 73.5Blank 13 7.32E+05 1.19E+04 1.63 5.0 3.01E+07 2.81E+05 0.93 66.5Blank 14 7.70E+05 9.81E+03 1.27 6.0 3.06E+07 2.83E+05 0.92 70.5Blank 15 8.38E+05 1.29E+04 1.54 5.0 4.01E+07 3.95E+05 0.99 51.0Blank 16 8.64E+05 1.87E+04 2.17 5.0 4.00E+07 3.91E+05 0.98 51.0Blank 17 7.81E+05 1.37E+04 1.76 3.5 3.49E+07 3.48E+05 1.00 51.0Blank 18 7.51E+05 1.03E+04 1.37 3.5 3.36E+07 3.34E+05 0.99 51.0
* Percentage of maximum relatively to the cumulative
Monhein
Heenvliet
Noordkanal
Particle number analysis Particle volume analysis

The influence of sludge characteristics from full-scale MBR in membrane filterability
71
Figure 5-5 – Particle number distribution representative of different full-scale MBR
From Figure 5-5 it is visible that, for all distributions, in general, the higher particle
number occurs for smaller particle sizes.
Of all three different PSDs, Monheim presents the highest particle number, in the interval
3-28 µm, and also the lowest, approximately from 50 till 100 µm. In Heenvliet the higher
particle number exists when the particle size ranges from 15 till 35 µm. For particle sizes
above 30 µm, Heenvliet presents the higher number of particles when compared to the
others. For Nordkanal, the most particles are situated in a compact interval of 3-6 µm and
from there the particle number decreases gradually.
In the interval 99.5-100.5 µm no particles were counted. The reason for this is probably
related with the sieving (100 µm) used in the measuring protocol (see Sub-chapter 4.4).
Even with the cleaning of the sieve after each test, most likely an accumulation of
materials within the pores took place reducing the pore size of 100 µm. This might also
explain why from 2 µm till 87 µm 99% of the cumulative particle number is represented in
all blank samples. Therefore particle counting analysis and further correlations will only be
made with values within the interval 2-87 µm.
In relation to cumulative particle number values are found between 7.32E+06 particles
/100 mL and 1.15E+06 particles /100 mL. From Figure 5-6 it is possible to see that the
Nordkanal presents the lowest values, around 7.8E+05 particles /100 mL, whilst Monheim
0,0E+00
5,0E+03
1,0E+04
1,5E+04
2,0E+04
0 10 20 30 40 50 60 70 80 90 100
Num
ber o
f par
ticle
s / 1
00 m
L
Particle size (µm)
Particle number distribution - Monheim, Heenvliet and Noordkanal
Monheim (blank 4) Heenvliet (blank 8) Noordkanal (blank 17)

The influence of sludge characteristics from full-scale MBR in membrane filterability
72
and Heenvliet have values around 1.1E+06 particles /100 mL (35% higher than
Nordkanal).
Figure 5-6 –Cumulative particle number of different WWTP
The maximum particle number per particle size represents in average 1.5 % of cumulative
particle number. The values for maximum particle number are found between 2.0E+04
particles /100 mL and 9.83E+04 particles /100 mL. Heenvliet and Nordkanal both present
an average of 1.3E+04 particles /100 mL while in Monheim it is slightly higher, 1.8E+04
particles /100 mL.
The results for the particle size of maximum particle number showed divergent values. In
Monheim and Nordkanal the maximum particle number occurs at small size: 5.0 µm for
Monheim and between 3.5 µm and 6 µm for Nordkanal. In Heenvliet a different behavior
is observed since the particle size of maximum particle number varies between 18 µm and
26 µm, see Figure 5-7.
0,0E+00
5,0E+05
1,0E+06
1,5E+06
Monhein Heenvliet Noordkanal
Par
ticle
num
ber
/ 100
mL
Cumulative particle number

The influence of sludge characteristics from full-scale MBR in membrane filterability
73
Figure 5-7 - Mean particle size of maximum particle number per WWTP
As said in Sub-chapter 3.2, the PSD of a sludge sample can be influenced by the operating
conditions in MBR, namely severe aeration, intensive recirculation and SRT.
In relation to the aeration intensity, usually expressed as specific aeration demand
(SADm), values are around 0.4 m3m-2h-1 for Heenvliet and Nordkanal. No data is available
from Monheim, but since it’s a Zenon system, it is expected to have similar values to
Nordkanal (a Zenon system as well). Thus, aeration does not explain the differences
observed. The values found for SRT are quite different: 20 days for Heenvliet, 25-29 for
Nordkanal, and 30 for Monheim. The differences found in the mean particle size for
maximum particle number can be due to the SRT, since Nordkanal and Monheim have
similar SRTs. One possible explanation is that for higher SRT a higher recirculation is
required for the activated sludge, leading to floc breakage and subsequently to a
modification in the particle distribution (Wisniewski and Grasmick, 1998). However, SRT
is also dependent of the membrane tank volumes, which were not possible to compare.
Particle volume analysis
In Figure 5-8, the cumulative particle volume distributions for each WWTP are
represented. In Monheim the values are much lower when compared to the other two
WWTPs, and also a different pattern is observed which is similar to a “mountain”. The
highest peak is reached when particle size is near 37 µm.
0
5
10
15
20
25
30
Monhein Heenvliet Noordkanal
Par
ticle
siz
e (µ
m)
Mean particle size of maximum particle number

The influence of sludge characteristics from full-scale MBR in membrane filterability
74
Figure 5-8 – Particle volume distribution representative of different full-scale MBR
For Heenvliet and Nordkanal distributions an identical pattern is evident, though the
particle volumes are much higher for Heenvliet. The highest peak of particle volume is at
51 µm for Heenvliet and 70 µm for Nordkanal. After these peaks are reached there is a
slight decrease along the following particle sizes.
The cumulative particle volumes for the blank samples are situated between 1.2E+07 and
3.7E+07 ppb (ppb – one part per billion: denotes one part in 109 parts). Heenvliet has the
higher values, an average of 3.3E+07 ppb, followed by Nordkanal with an average of
2.5+07 ppb and finally Monheim with 1.4+07 ppb, see Figure 5-9.
Figure 5-9 – Cumulative particle volume per WWTP
0,0E+00
1,0E+05
2,0E+05
3,0E+05
4,0E+05
5,0E+05
0 20 40 60 80
Pa
rtic
le v
olu
me
(p
pb
)
Particle size (µm)
Particle volume distribution
Monheim (blank 4) Heenvliet (blank 8) Noordkanal (blank 17)
0,0E+00
1,0E+07
2,0E+07
3,0E+07
4,0E+07
Monhein Heenvliet Noordkanal
Par
ticle
vol
ume
(ppb
)
Cumulative particle volume

The influence of sludge characteristics from full-scale MBR in membrane filterability
75
For the maximum particle volume, values ranged from 1.6E+05 ppb till 4.1E+05 ppb. The
distribution of maximum particle volume is practically the same observed for cumulative
particle volume.
Each WWTP presents a different mean particle size of maximum particle volume.
Monheim and Nordkanal present some variations along their values in opposite to
Heenvliet where they are significantly constant - only 2 samples out of 9 had different
values, see Figure 5-10.
Figure 5-10 – Mean particle size of maximum particle volume
On average, the mean particle size of maximum particle volume is 36 µm for Monheim,
51µm for Heenvliet and 70 µm for Nordkanal.
5.3.2 Correlation between filterability with particle counting in range 2-87 µm
From Figure 5-11 it is possible to see the cumulative particle number per group quality
with the associated filterability. When the sludge quality is excellent and good, the
cumulative particle number is more or less the same and filterability does not vary
significantly. However, in moderate sludge two different patterns are observed: a smaller
group of blanks with a lower cumulative number (corresponding to Nordkanal blanks),
and two blanks with higher cumulative numbers (Heenvliet). This is due to their different
origin.
0
10
20
30
40
50
60
70
80
Monhein Heenvliet Noordkanal
Par
ticle
siz
e (µ
m)
Mean particle size of maximum particle volume

The influence of sludge characteristics from full-scale MBR in membrane filterability
76
Figure 5-11 – Cumulative particle number and ∆R20 by group quality
The last two blanks in the moderate group have similar cumulative numbers as the ones
seen in sludge of excellent and good quality. This means that the difference in filterability
cannot be explained by the cumulative particle number.
No relationship between cumulative particle number and ∆R20 was found.
When correlating the filterability with cumulative particle volume no correlation is found
either. Blanks with excellent and moderate quality presented cumulative particle volumes
in the same range of values.
For maximum particle number all blanks have on average more or less the same maximum
particle number, 1.4E+04 particles /100 mL. From the presented groups, only inside the
group with good quality there are some more emphasized oscillations for the maximum
particle number but with no relationship with filterability. No correlation between
maximum particle number and filterability was found.
In relation to the maximum particle volume, no relationship with filterability seems to exist
either since to identical maximum particle volumes correspond different ∆R20, and for
different maximum particle volumes similar ∆R20 coexist.
0,00
0,05
0,10
0,15
0,20
0,25
0,30
0,35
0,40
0,45
7,0E+05
8,0E+05
9,0E+05
1,0E+06
1,1E+06
1,2E+06
∆R
20(x
1012
m-1
)
Num
ber o
f par
ticle
s / 1
00 m
LCumulative particle number and ∆R20
∆R20 Excellent Good Moderate

The influence of sludge characteristics from full-scale MBR in membrane filterability
77
When correlating the mean particle size for the maximum particle number with filterability
no relationship is found; however, the particle size for the maximum particle volume has
shown a correlation with filterability.
From Figure 5-12 it can be verified that, in general, when the mean particle size of
maximum particle volume is high, the additional resistance in the membrane is also high,
though not in a linear pattern.
Figure 5-12 – Mean particle size of maximum particle volume per group quality
To evaluate how significant this relation is, a mathematical correlation throughout a
polynomial equation is applied, as Figure 5-13 illustrates.
Figure 5-13 – Mean particle size of maximum particle volume vs. filterability
0,00
0,05
0,10
0,15
0,20
0,25
0,30
0,35
0,40
0,45
0
10
20
30
40
50
60
70
80
∆R
20(x
1012
m-1
)
Par
ticle
siz
e (µ
m)
Mean particle size of maximum particle volume and ∆R20
∆R20
y = 0,0003x2 - 0,021x + 0,4859R² = 0,7961
0,0
0,1
0,2
0,3
0,4
0,5
30 40 50 60 70 80
∆R
20(x
1012
m-1
)
Particle size (µm)
Correlation between mean particle size of maximum particle volume and ∆R20
Excellent Good Moderate

The influence of sludge characteristics from full-scale MBR in membrane filterability
78
A correlation factor of 0.80 was found showing a strong correlation between mean
particle size of maximum particle volume and filterability. Though for particle size
around 50 µm ∆R20 values differ from 0.03x10¹²m-1 till 0.25 x10¹²m-1.
This relationship suggests that filterability decreases for higher particle sizes of maximum
particle volume.
5.4 Particle counting in the range size of 0.4-5 µm
The particle counting analysis in the range of 0.4-5 µm was performed on blank samples
from Heenvliet, Ootmarsum and Varsseveld. In Table 5-4 an overview of the results is
presented.
Table 5-4 – Results from particle counting analysis in the range 0.4-5 µm
5.4.1 Characterization of the particle size and volume distributions
Particle number analysis
The PSD, as Figure 5-14 reveals, shows that Heenvliet and Ootmarsum have an identical
pattern while Varsseveld demonstrates a major difference, more precisely when the particle
size is 0.45 µm.
NameCumulative
Nr (/ mL)
Max Nr (/ mL)
Max (%) *
Mean size max
Cumulative Vol
(ppb)
Max Vol (ppb)
Max (%) *
Mean size max
Blank 5 4.40E+06 3.15E+06 71.6% 0.45 2.90E+02 1.50E+02 51.9% 0.45Blank 6 1.87E+06 1.32E+06 70.5% 0.45 1.24E+02 6.29E+01 50.6% 0.45Blank 7 2.44E+06 1.77E+06 72.4% 0.45 1.67E+02 8.42E+01 50.5% 0.45Blank 9 2.16E+06 1.65E+06 76.0% 0.45 1.46E+02 7.85E+01 53.9% 0.45
Blank 19 7.74E+05 6.57E+05 84.9% 0.45 6.79E+01 4.61E+01 67.9% 0.45Blank 20 2.00E+06 1.45E+06 72.4% 0.45 1.40E+02 6.92E+01 49.3% 0.45Blank 21 1.15E+07 8.25E+06 71.9% 0.45 7.04E+02 3.93E+02 55.9% 0.45Blank 24 6.58E+06 4.17E+06 63.3% 0.45 4.89E+02 1.99E+02 40.7% 0.45Blank 25 3.85E+06 2.65E+06 68.8% 0.45 2.83E+02 1.26E+02 44.7% 0.45Blank 26 1.86E+07 1.32E+07 71.0% 0.45 1.19E+03 6.29E+02 52.9% 0.45Blank 27 1.97E+07 1.38E+07 70.2% 0.45 1.27E+03 6.61E+02 52.0% 0.45
* Percentage of maximum relatively to the cumulative
Heenvliet
Ootmarsum
Varsseveld
Particle number analysis Particle volume analysis

The influence of sludge characteristics from full-scale MBR in membrane filterability
79
Figure 5-14 – Particle number distribution in the range 0.4-5 µm (representative blanks)
All blanks show a PSD where the number of particles is decreasing as the particle size
increases. It is also visible that higher particle numbers occur from 0.45 till 1.0 µm. This
was confirmed by the analysis of all blanks, which revealed that 99% of the cumulative
particle number is represented in the interval of 0.4-1.0 µm. For that reason further
analyses will only include the particles in this range.
The Figure 5-15 illustrates the cumulative particle number according to each treatment
plant.
Varsseveld presents a much higher particle number than the other two treatment plants, on
average 5 times more than Heenvliet and 4 times more than Ootmarsum.
Values are more inconstant in Heenvliet than in Ootmarsum and Varsseveld, varying
between 1.9E+06 and 1.2E+07 particles/ mL. This could be due to seasonal variations
since in Heenvliet samples were measured between October and January, while
Ootmarsum and Varsseveld measurements only correspond to the same day (see Table 5-
1). In Ootmarsum and Varsseveld values are on average 5.2E+06 particles /mL and
1.9E+07 particles /mL, respectively.
0,0E+00
5,0E+06
1,0E+07
1,5E+07
0,0 0,5 1,0 1,5 2,0 2,5 3,0 3,5 4,0 4,5 5,0
Num
ber o
f par
ticle
s / m
l
Particle size (µm)
Particle number distribution
Heenvliet (blank 5) Ootmarsum (blank 25) Varsseveld (blank 27)
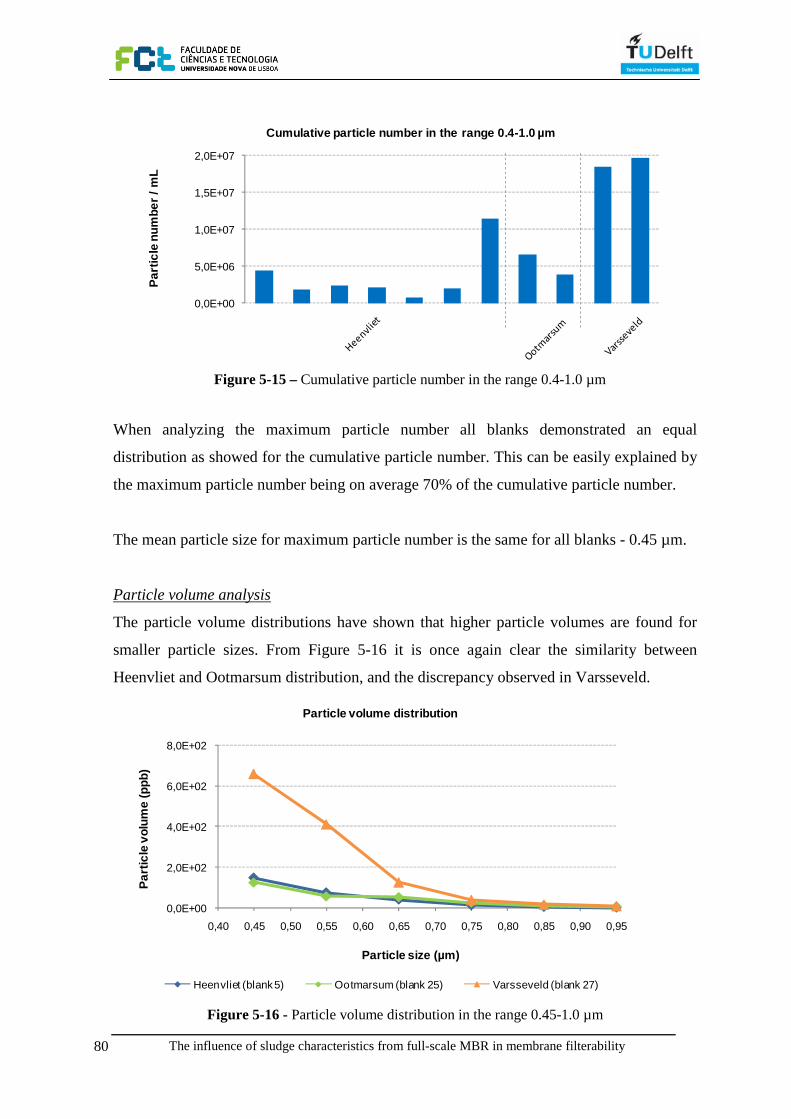
The influence of sludge characteristics from full-scale MBR in membrane filterability
80
Figure 5-15 – Cumulative particle number in the range 0.4-1.0 µm
When analyzing the maximum particle number all blanks demonstrated an equal
distribution as showed for the cumulative particle number. This can be easily explained by
the maximum particle number being on average 70% of the cumulative particle number.
The mean particle size for maximum particle number is the same for all blanks - 0.45 µm.
Particle volume analysis
The particle volume distributions have shown that higher particle volumes are found for
smaller particle sizes. From Figure 5-16 it is once again clear the similarity between
Heenvliet and Ootmarsum distribution, and the discrepancy observed in Varsseveld.
Figure 5-16 - Particle volume distribution in the range 0.45-1.0 µm
0,0E+00
5,0E+06
1,0E+07
1,5E+07
2,0E+07P
artic
le n
umbe
r / m
L
Cumulative particle number in the range 0.4-1.0 µm
0,0E+00
2,0E+02
4,0E+02
6,0E+02
8,0E+02
0,40 0,45 0,50 0,55 0,60 0,65 0,70 0,75 0,80 0,85 0,90 0,95
Par
ticle
vol
ume
(ppb
)
Particle size (µm)
Particle volume distribution
Heenvliet (blank 5) Ootmarsum (blank 25) Varsseveld (blank 27)

The influence of sludge characteristics from full-scale MBR in membrane filterability
81
The cumulative particle volume showed, on average, values of 2.3E+02 ppb, 3.9E+02 ppb
and 1.2E+03 ppb for Heenvliet, Ootmarsum and Varsseveld, in that order.
In relation to maximum particle volume, this includes on average 50% of the cumulative
particle volume. The values varied from 4.6E+01 till 3.9E+02 ppb in Heenvliet, 1.3E+02
till 2.0E+02 ppb in Ootmarsum, and from 6.3E+02 till 6.6E+02 ppb in Varsseveld.
All the samples show their maximum particle volume for a particle size of 0.45 µm.
5.4.2 Correlation between filterability and particle counting in range 0.4-1.0 µm
The analysis of particle counting in range 0.4 – 1.0 µm comprises sludge with excellent,
good, moderate and poor quality.
The cumulative particle number has not revealed a clear behavior along the quality groups.
On one hand, sludges of excellent and good quality have similar particle numbers that are
lower than moderate and poor sludge, see Figure 5-17. On the other hand, there are some
contradictions: the blank with moderate quality presents a higher particle number than two
blanks of poor quality; blanks 5 (excellent) and 24 (poor) have identical cumulative
particle numbers, however a large gap in filterability distinguishes them - 0.3 x10¹²m-1 and
2.7x10¹²m-1, respectively.
Figure 5-17 - Cumulative particle number and ∆R20 by group quality
0,0
1,0
2,0
3,0
4,0
5,0
0,0E+00
5,0E+06
1,0E+07
1,5E+07
2,0E+07
2,5E+07
∆R
20(x
1012
m-1
)
Num
ber o
f par
ticle
s / m
L
Cumulative particle number in the range 0.4-1.0 µm vs. ∆R20
∆R20
Excellent Good Moderate Poor
Blank 24
Blank 5

The influence of sludge characteristics from full-scale MBR in membrane filterability
82
Nevertheless, in overall results a main tendency seems to exist in which higher particle
numbers match higher resistances in the membrane filtration. A correlation factor of 0.67
was found.
In relation to the maximum particle number, since it represents 70% of the cumulative
particle number, the correlation obtained is practically the same (R2=0.66)
In the particle volume analysis the results are quite the same as for the particle number
analysis. Still, the correlation between cumulative particle volume and filterability is
slightly higher than for cumulative particle number, R2 = 0.72.
Benschop (2008) also investigated this relationship at TUDelft with the same methodology
and apparatus but only with Heenvliet sludge. A high correlation between cumulative
particle volume in the range 0.4-1.0 µm and filterability was found, where higher particle
volumes corresponded to higher resistances in the membrane i.e. worst filterability.
When only looking at the results for Heenvliet presented on this thesis, the same
correlation is also found for the cumulative particle volume and filterability, with a high
correlation factor of 0.97. Moreover, the other particle counting parameters have shown a
high correlation with filterability as well, see Table 5-5.
Table 5-5 – Correlation factors between filterability and particle counting in range 0.4-1.0 µm for
Heenvliet
Correlation factor, R2
∆R20, Cumulative Nr. 0.98
∆R20, Maximum Nr. 0.97
∆R20, Cumulative Vol. 0.97
∆R20, Maximum Vol. 0.96
These high correlations show that particles in range 0.4-1.0 µm might help to estimate the
additional resistance in the membrane and can thus be useful to predict membrane fouling.
However, according to the results obtained, the only clear correlation is for Heenvliet
sludge (from excellent to moderate quality). This means that the correlations found can

The influence of sludge characteristics from full-scale MBR in membrane filterability
83
only be valid for Heenvliet sludge and/or to sludge with quality from excellent to
moderate.
5.5 Soluble Microbial Products
5.5.1 SMP results
The results of SMP are represented by the protein and polysaccharide concentrations.
Table 5-6 shows the SMP results concentrations together with other characteristics
according to the sludge quality.
Table 5-6 – SMP results: protein and polysaccharide concentrations
It is visible that in every blank the protein concentration is higher than the polysaccharides
except for Ootmarsum where polysaccharide concentration is 2 mg/L higher than the
proteins. None of the previous researchers at TUDelft obtained a concentration of
polysaccharides higher than the proteins for the same sludge sample. Therefore, the protein
concentration in Ootmarsum will not be considered as a valid measurement and
consequently will not be used for further correlations with other parameters.
The protein concentration varied between 11.3 mg/L and 21.9 mg/L whilst polysaccharide
concentrations have lower values between 3.5 mg/L and 18.3 mg/L.
In Heenvliet the polysaccharide concentrations are below 5.5 mg/L whilst protein
concentrations are at least double – Proteins represent 71% of the total SMP.
Name WWTP Date T oC MLSS (g/L) ΔR20
(x1012
m-1
)
Proteins
(mg/L)Polysaccharides
(mg/L)
Excellent blank 7 Heenvliet 05-11-08 19.46 14.08 0.036 11.32 4.81
blank 9 Heenvliet 20-11-08 20.21 12.96 0.066 12.80 3.48
blank 19 Heenvliet 17-12-08 23.70 15.15 0.096 12.38 5.274
blank 20 Heenvliet 18-12-08 22.92 15.10 0.070 11.32 3.60
Moderate blank 21 Heenvliet 07-01-09 14.46 16.41 0.221 15.48 8.90
blank 24 Ootmarsun 05-02-09 8.18 8.94 2.674 12.03 14.05
blank 26 Varsseveld 12-02-09 10.83 7.83 4.248 20.97 17.14
blank 27 Varsseveld 12-02-09 10.84 7.64 4.104 21.89 18.30
Good
Poor

The influence of sludge characteristics from full-scale MBR in membrane filterability
84
In Varsseveld is where the protein and polysaccharide concentrations are higher when
compared to the other WWTPs (both above 17 mg/L). Although the protein concentrations
are higher than the polysaccharides, they diverge slightly – Proteins are only 55% of SMP.
The analysis of the retention of proteins and polysaccharides by the membrane was
possible since the SMP from the extracted permeate during the filterability test was also
measured. It showed different behaviors for proteins and polysaccharides. On average, the
membrane retained 43% of proteins and 80% of polysaccharides, which means that
proteins breakthrough is 3 times higher than that of polysaccharides. Similar values were
also observed by Geilvoet et.al,. (2007) for the DFCi with the same pore size membrane.
In Figure 5-18 protein and polysaccharide concentrations are plotted according to WWTP
with the respective temperature for each measurement.
Figure 5-18 - Proteins and polysaccharides by WWTP with respective temperature
Looking at Figure 5-18, it can be seen that higher temperatures correspond to lower SMP
concentrations. Further along, a correlation between SMP and temperature will be made to
evaluate how significant this relationship is.
0
5
10
15
20
25
30
0
5
10
15
20
25
Te
mp
era
ture
( o
C)
Pro
tein
s an
d P
olys
acch
arid
es (m
g/L)
Proteins and Polysaccharides concentrations by WWTP with respective temperature
Proteins Polysaccharides Temperature
Invalid
measurement
Heenvliet Ootmarsum Varsseveld

The influence of sludge characteristics from full-scale MBR in membrane filterability
85
5.5.2 Correlating filterability with SMP
The concentrations of the proteins and polysaccharides are plotted in Figures 5-19 and 5-
20 against ∆R20 with the respective correlation factor obtained.
Figure 5-19 – Protein concentrations plotted against ∆R20
Figure 5-20 – Polysaccharide concentrations plotted against ∆R20
A correlation between filterability and SMP concentrations was found.
From Figures 5-19 and 5-20, both relationships for proteins and polysaccharides were
demonstrated throughout a mathematical correlation with very high correlation factors –
R=0.98 for both. However, different regressions were applied for a better approximation of
y = 0,0003e0,438x
R² = 0,9765
0,01
0,1
1
10
0 5 10 15 20 25
∆R
20(x
1012
m-1
)
Proteins (mg/L)
Proteins concentration vs. ∆R20
y = 0,02x2 - 0,1296x + 0,2073
R² = 0,9752
0,01
0,1
1
10
0 5 10 15 20
∆R
20(x
1012
m-1
)
Polysaccharides (mg/L)
Polysaccharides vs. ∆R20
Excellent Good Moderate Poor
Excellent Good Moderate Poor

The influence of sludge characteristics from full-scale MBR in membrane filterability
86
each behavior: for proteins an exponential equation was applied and for polysaccharides a
second order polynomial equation was used.
It is clear that higher concentrations of proteins and polysaccharides correspond to a higher
additional resistance in the membrane. This conforms with many authors that have
reported EPS as one of the most significant contributors for membrane fouling (Nagaoka
et.al,. (1996), Rosenberger and Kraume (2003) and Al-Halbouni et.al,. (2008)). However,
it is not clear yet how proteins and polysaccharides affect the filtration process. Even when
looking at the breakthrough of proteins (≈ 60%) and polysaccharides (20%), no
conclusions can be drawn since different fouling mechanisms may be involved.
A correlation between SMP and temperature was also found.
Looking at Figure 5-21 it can be seen that higher temperatures correspond to lower SMP
concentrations. Both correlation factors for proteins and polysaccharides are significantly
high (R2=0.98 for proteins and R2=0.84 for polysaccharides). This suggests that
temperature might have a role in the release of SMP into the sludge. Also, Al-Halbouni
et.al,. (2008) and Lyko et.al,. (2008) stated that one of the factors that have an influence on
the production of SMP is the temperature. This can be explained by the fact that at lower
temperatures the kinetics of the degradation of SMP is lower than at higher temperatures
or/and also that the dropping of temperature rises the stress level in the microbial cells
leading to a bigger release of SMP.
Figure 5-21 – Proteins and polysaccharides plotted against temperature
y = 0,0904x2 - 3,836x + 52,321
R² = 0,9803
y = 43,155e-0,105x
R² = 0,8415
0
5
10
15
20
25
5 10 15 20 25Free
wat
er c
oncn
etra
tion
(mg/
L)
Temperature ( oC)
Correlation between SMP and Temperature
Proteins
Polysaccharides

The influence of sludge characteristics from full-scale MBR in membrane filterability
87
As demonstrated in Section 5.2.2, a correlation between filterability and temperature was
observed (R2 = 0.68). Since filterability is related to SMP concentrations, and SMP related
to temperature, a relationship between these three parameters seems to exist.
Since a moderate relationship between filterability and particle counting in range 0.4-1.0
µm was found (see Section 5.4.2), a correlation between SMP and particles in this range
was applied. In Table 5-7 the correlations obtained are presented.
Table 5-7 – Correlation factors between SMP and particle counting parameters in range 0.4-1.0 µm
Particle number Particle volume Cumulative Maximum Cumulative Maximum
Proteins 0.98 0.99 0.98 0.99 Polysaccharides 0.73 0.71 0.76 0.71
A relationship was established between particle counting in range 0.4-1.0 µm and SMP.
When SMP concentrations are higher, a higher number of particles is also associated. This
is especially valid for proteins, which present much higher correlation factors than
polysaccharides. This however doesn’t mean that SMP particles are contained in the range
from 0.4 µm till 1.0 µm. Evenblij and van der Graaf (2004) reported that EPS particles are
mainly present with particles of smaller size than 0.1 µm. Also Geilvoet et.al,. (2007)
stated that in the range of 0.2 µm till 1.2 µm no SMP particles are present.
However, this correlation might indicate that a higher number of particles in the range 0.4-
1.0 µm correspond to a higher number of particles in the submicron range, range where
SMP particles coexist. Therefore, the particle counting in range 0.4-1.0 µm may be a
useful tool to estimate and predict the SMP concentrations and to enlarge the knowledge
on membrane fouling.
5.6 Viscosity
The viscosity measurements were performed for all blanks of temperature 20 ± 1 oC with
different shear rates applied, from 5s-1 till 1000s-1. Besides apparent viscosity, shear stress

The influence of sludge characteristics from full-scale MBR in membrane filterability
88
was also obtained and used to produce rheograms consisting of the shear rate plotted
against shear stress.
5.6.1 Results
The viscosity results showed that for all samples, at a certain shear rate, a modification on
the sludge structure occurred. As the shear rate increases, a decrease on the apparent
viscosity is expected (Hasar et.al,., 2004), however, there is a turning point where apparent
viscosity starts to raise whilst shear rate continues to increase. This phenomenon was
mostly observed at a shear rate of 500 s-1 but it was also noticed at shear rates of 700 s-1
and 250 s-1. Therefore, the viscosity analysis will only focus on shear rates in the range 5-
150s-1, which ensures that the original floc structure remains the same for all blanks.
All blanks show a non-Newtonian behavior since the shear rate is non-linear related to the
shear stress, see Figure 5-22.
Figure 5-22 – Rheogram for all blanks with the respective MLSS concentration
The maximum shear stress listed corresponds to blank 22 with the higher MLSS (17.0 g/L)
and the minimum is registered for blank 26 with an MLSS equal to 7.8 g/L. As Figure 5-22
demonstrates, blanks 25 and 27, with an MLSS of 7.5 g/L and 7.6 g/L correspondingly,
have higher values of shear stress when compared to blank 26, which has a higher MLSS
0
0,5
1
1,5
2
2,5
3
0 25 50 75 100 125 150
She
ar s
tres
s [P
a]
Shear rate [s -1]
Rheogram (T = 20 ±1 oC)
Blank 26 (7.8 g/L) Blank 27 (7.6 g/L) Blank 25 (7.5 g/L) Blank 24 (8.9 g/L)
Blank 9 (13.0 g/L) Blank 8 (15.1 g/L) Blank 7 (14.1 g/L) Blank 20 (15.1 g/L)
Blank 19 (15.1 g/L) Blank 23 (16.1 g/L) Blank 22 (17.0 g/L)

The influence of sludge characteristics from full-scale MBR in membrane filterability
89
of 7.8 g/L. The same also happens with blanks 7 and 8 where the latter has a higher MLSS
(1.1 g/L more) and presents lower shear stress values.
The reason for these results is probably related with the very small differences in MLSS
concentration among the samples, in spite of the high precision of the rheometer. For this
reason the results obtained are considered valid and reliable for further use.
In Figure 5-23, it is possible to see that blanks with lower MLSS also have lower apparent
viscosities, and as shear rate increases the apparent viscosity decreases. This is a
characteristic of shear thinning fluids.
Figure 5-23 – Apparent viscosity per blank samples
5.6.2 Correlating viscosity
The relationship between apparent viscosity and MLSS was found with the same
significant correlation factor for all shear rates (R=0.95) showing that the solids content is
a major factor in apparent viscosity as literature states (Rosenberger et.al,., 2002; Hasar
et.al,., 2004; Seyssiecq et.al,., 2008).
Many authors have studied the influence of MLSS on apparent viscosity with sludge from
a full-scale MBR and developed mathematical models for rheological simulations.
1
10
100
1000
1 10 100 1000
App
aren
t vis
cosi
ty [
mP
a.s]
Shear rate [s-1]
Shear rate vs. apparent viscosity Rheogram (T = 20 ±1 oC)
Blank 26 (7.8 g/L) Blank 27 (7.6 g/L) Blank 25 (7.5 g/L) Blank 24 (8.9 g/L)
Blank 9 (13.0 g/L) Blank 8 (15.1 g/L) Blank 7 (14.1 g/L) Blank 20 (15.1 g/L)
Blank 19 (15.1 g/L) Blank 23 (16.1 g/L) Blank 22 (17.0 g/L)
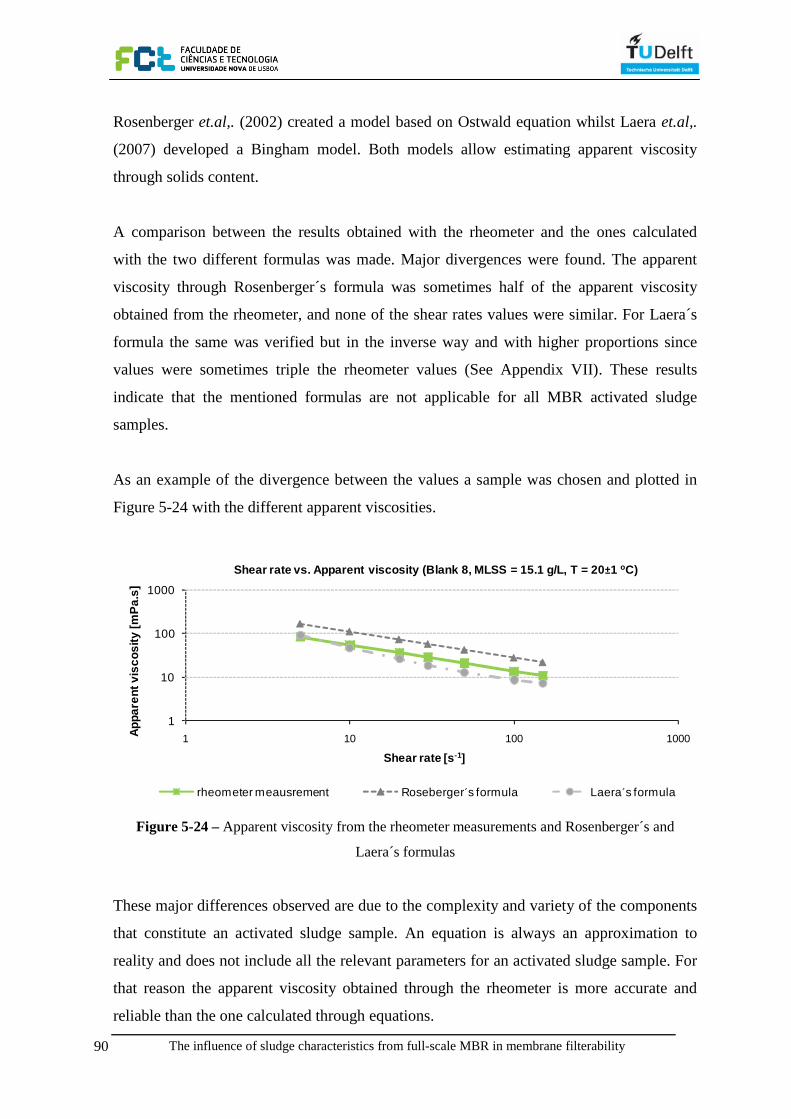
The influence of sludge characteristics from full-scale MBR in membrane filterability
90
Rosenberger et.al,. (2002) created a model based on Ostwald equation whilst Laera et.al,.
(2007) developed a Bingham model. Both models allow estimating apparent viscosity
through solids content.
A comparison between the results obtained with the rheometer and the ones calculated
with the two different formulas was made. Major divergences were found. The apparent
viscosity through Rosenberger´s formula was sometimes half of the apparent viscosity
obtained from the rheometer, and none of the shear rates values were similar. For Laera´s
formula the same was verified but in the inverse way and with higher proportions since
values were sometimes triple the rheometer values (See Appendix VII). These results
indicate that the mentioned formulas are not applicable for all MBR activated sludge
samples.
As an example of the divergence between the values a sample was chosen and plotted in
Figure 5-24 with the different apparent viscosities.
Figure 5-24 – Apparent viscosity from the rheometer measurements and Rosenberger´s and
Laera´s formulas
These major differences observed are due to the complexity and variety of the components
that constitute an activated sludge sample. An equation is always an approximation to
reality and does not include all the relevant parameters for an activated sludge sample. For
that reason the apparent viscosity obtained through the rheometer is more accurate and
reliable than the one calculated through equations.
1
10
100
1000
1 10 100 1000App
aren
t vis
cosi
ty [
mP
a.s]
Shear rate [s -1]
Shear rate vs. Apparent viscosity (Blank 8, MLSS = 15.1 g/L, T = 20 ±1 oC)
rheometer meausrement Roseberger´s formula Laera´s formula

The influence of sludge characteristics from full-scale MBR in membrane filterability
91
For the correlation between filterability and viscosity a shear rate was chosen to equally
compare all blanks. At 100 s-1, it is assured that the original structure from the sludge has
not changed, and thus it will be used for comparison. In Figure 5-25 the filterability is
plotted together with apparent viscosity.
Figure 5-25 – Apparent viscosity (100 s-1) and filterability
No correlation between filterability and apparent viscosity is found.
Higher apparent viscosities would be expected for blanks with higher values of ∆R20. This
is not observed since blanks 24-27 have the lowest apparent viscosities and the highest
∆R20 values. This suggests that apparent viscosity is not a major parameter influencing
filterability.
5.7 Conclusions
The Blanks Characterization experiment goal was to study the characteristics of sludge in
full-scale MBRs in order to evaluate their effects on membrane filterability and membrane
fouling. Five MBR systems were analyzed: Monheim, Heenvliet, Nordkanal, Ootmarsum
and Varsseveld. Each blank, in addition to the filterability test, was submitted, when
possible, to different tests such as particle counting in range 2-100 µm, particle counting in
range 0.4-5.0 µm, EPS, and viscosity.
0,01
0,1
1
10
0
5
10
15
20
25
30
blank
7
blank
8
blank
9
blank
19
blank
20
blank
22
blank
23
blank
24
blank
25
blank
26
blank
27
ΔR
20
(x1
01
2m
-1)
App
aren
t vis
cosi
ty [
mP
a.s]
Apparent viscosity (100 s -1) and ∆R20
Apparent viscosity (100/s) ∆R20

The influence of sludge characteristics from full-scale MBR in membrane filterability
92
The filterability of the activated sludge varied from 0.03 till 4.25x10¹²m-1, i.e. from
excellent to poor quality. However, no sludge with mediocre quality was observed. The
MLSS concentrations varied from 6.9 till 17.7 g/L, and the temperature between 8.2 and
23.7oC.
No correlation between filterability and MLSS was found. Sludge blanks with good and
extremely poor quality were observed at MLSS≈8g/L. This suggests that MLSS does not
play a fundamental role in membrane fouling.
The seasonal variations, temperature differences, seemed to have an impact on membrane
filterability (R2=0.68). At lower temperatures, higher resistances in the membrane were
found.
For the particle counting in range 2-100 µm, it was observed that 99% of particles exist in
the range 2-87 µm. The particle counting in range 2-100 µm revealed a different PSD for
each WWTP. This was probably due to the different SRT, probably implying different
recirculation ratios, applied in each treatment plant. No correlation between filterability
and particles in range 2-100 µm was found, except for the mean particle size of maximum
particle volume with a correlation factor of 0.80. The floc size of the maximum particle
volume varied between 34.5 and 75 µm, and higher resistances corresponded to a bigger
floc size.
For the particle counting in range 0.4-5.0 µm, it was observed that 99% of particles exist in
the range 0.4-1.0 µm. When correlating the filterability with particle counting parameters,
a main tendency was present in which the blanks with highest number of particles were the
ones with the worst filterability. This was even clearer when only analyzing sludge from
Heenvliet with excellent to moderate quality, since all correlations were found with
correlation factors above 0.96. This means that particles in this range have an effect on
membrane filterability. However, since this is only clear when analyzing Heenvliet sludge
samples, the conclusions drawn have to be careful when extrapolation is made for all MBR
sludge samples. Overall, particle counting in range 0.4-1.0 µm can be a useful tool to
predict membrane fouling.

The influence of sludge characteristics from full-scale MBR in membrane filterability
93
A high relationship between filterability and SMP was found with a correlation factor of
0.98 (proteins and polysaccharides). A higher concentration of SMP led to a worst
filterability. Also a relationship between SMP and temperature was found with high
significance (R2=0.98 for proteins and R2=0.84 for polysaccharides). A strong correlation
between SMP and particle counting parameters in range 0.4-1.0 µm was also found. Even
though SMP particles are considered as being smaller than in the observed range, particle
counting in range 0.4-1.0 µm seems to be a good indicative of the SMP levels in the
activated sludge.
This suggests that a three-way relationship exists between filterability, SMP and
temperature. The temperature seems to influence the release of SMP into the activated
sludge, and SMP concentrations seem to be a major factor influencing membrane
filterability. Therefore, SMP and temperature might play a major role in membrane
filterability, and in a long-term operation, have an impact on membrane fouling.
The apparent viscosity of the activated sludge showed to be highly influenced by the
MLSS concentration. No correlation between filterability and apparent viscosity was
found.

The influence of sludge characteristics from full-scale MBR in membrane filterability
94

The influence of sludge characteristics from full-scale MBR in membrane filterability
95
6 DILUTIONS EXPERIMENT
This chapter describes the Dilutions experiment in which activated sludge from Heenvliet,
Ootmarsum and Varsseveld was used. The sub-chapters present the results and discussion
of each test applied, namely filterability, particle counting in ranges 2-100 µm and 0.4-5.0
µm, SMP, and viscosity. In Sub-chapter 6-6 the conclusions drawn are shown. All results
can be seen in Appendix IX.
6.1 Filtration characteristics - MLSS and ∆R20
6.1.1 Results and Discussion
In Table 6-1 the filtration characteristics from the dilutions experiments are presented.
Table 6-1 – Filtration characteristics from Dilutions experiment
*D10p = 10L of permeate + 20L sludge; D20p = 20L of permeate + 10L sludge
WWTP Sample Date MLSS (g/L) ∆R20 (x1012m-1) R2
blank 5 Heenvliet MT 22-10-08 17.7 0.025 0.63D10p 9.5 0.101 0.98D20p 4.5 0.020 0.13
blank 6 Heenvliet MT 29-10-08 14.3 0.047 0.24D10p 7.5 0.081 0.86D20p 3.7 0.031 0.70
blank 7 Heenvliet MT 05-11-08 14.1 0.036 0.85D10p 9.2 0.104 0.96D20p 4.2 0.068 0.94
blank 9 Heenvliet MT 20-11-08 13.0 0.066 0.47D10p 7.3 0.183 0.98D20p 5.3 0.099 0.91
blank 19 Heenvliet MT 17-12-08 15.1 0.096 0.92D10p 10.4 0.326 0.98D20p 2.2 0.156 0.98
blank 20 Heenvliet MT 18-12-08 15.1 0.070 0.91D10p 8.5 0.330 0.99D20p 3.7 0.162 0.98
blank 21 Heenvliet MT 07-01-09 16.4 0.221 0.99D10p 9.8 1.096 1.00D20p 4.7 0.500 0.99
blank 22 Heenvliet MT 21-01-09 17.0 0.183 0.95D10p 12.3 1.878 0.94D20p 4.6 0.839 0.96
blank 23 Heenvliet MT 23-01-09 16.1 0.246 0.88D10p 6.0 0.814 0.99D20p 2.6 0.404 0.96
blank 24 Ootmarsum MT 05-02-09 8.9 2.674 0.99D10p 5.9 1.232 0.99D20p 4.2 0.640 0.99
blank 26 Varsseveld MT 12-02-09 7.8 4.248 0.99D10p 5.1 2.343 0.97D20p 2.8 1.005 0.99
blank 27 Varsseveld MT 12-02-09 7.6 4.104 0.98D10p 6.5 2.541 1.00D20p 2.0 1.333 0.99
Set 7
Set 8
Set 9
Set 10
Set 11
Set 12
Set 1
Set 2
Set 3
Set 4
Set 5
Set 6

The influence of sludge characteristics from full-scale MBR in membrane filterability
96
In Table 6-1 the values of MLSS and ∆R20 from each dilution set are visible. Since D10p
and D20p are done following the same procedure, it would be expectable that sets with the
same blank MLSS concentration would have similar MLSS in the prepared dilutions.
However, this wasn’t always the case, with differences occurring between the dilutions, for
instance when comparing set 7 and set 9. The MLSS concentration in sets 7 and 9 is
respectively 16.4 g/L and 16.1 g/L for blank, 9.8 g/L and 6 g/L for D10p and 4.7 g/L and
2.6 g/L for D20p. This happens because the measuring of volumes, for sludge and
permeate, is not always precise, which leads to differences in the final solids content.
In Figure 6-1 all sets are plotted with the respective MLSS and ∆R20.
Figure 6-1 – MLSS plotted against ∆R20 by set
Observing Figure 6-1 it is seen that the behavior along the sets is not always the same, with
two different patterns existing according to ∆R20 values:
• Group A: D10p >blank It is the most frequent situation, where two sub-groups are observed:
- A1 - D10p >D20p>blank, which occurs in seven cases out of nine;
- A2 - D10p >blank > D20p, only valid for sets 1 and 2.
0,0
0,1
1,0
10,0
0 2 4 6 8 10 12 14 16 18 20
∆R
20(x
1012
m-1
)
MLSS (g/L)
MLSS vs. ∆R20
Set 1 Set 2 Set 3 Set 4Set 5 Set 6 Set 7 Set 8Set 9 Set 10 Set 11 Set 12

The influence of sludge characteristics from full-scale MBR in membrane filterability
97
• Group B: blank >D10p > D20p It is only applied for sets 10, 11 and 12.
From now on, to simplify, the reference to these two different patterns will be according to
groups A and B.
Looking to Figure 6-2, the most eye-catching difference between these two patterns is
related to the blank solids concentration. In group A, all blanks show an MLSS superior to
10 g/L as opposed to blanks from group B, where MLSS is inferior to 10 g/L.
a) b)
Figure 6-2 MLSS plotted against ∆R20 – Group A (a) and Group B (b)
This situation was also observed before by Lousada-Ferreira (2008). Temperature could
also be a main factor influencing these two diverged behaviors since the sets from group B
have much lower temperatures (between 8.2 and 10.8 oC). However, in the results from the
previous author temperature did not show a relevant influence.
No direct correlations between MLSS and filterability were found.
When correlating filterability with D10p no relationship is found. The same is observed for
the relationship filterability – D20p. Although, in group B, when MLSS decreases along
the set, an increase in filterability is observed. It can only be said that if the original blank
0,0
0,1
1,0
10,0
0 2 4 6 8 10 12 14 16 18 20
∆R
20(x
1012
m-1
)
MLSS (g/L)
MLSS vs. ∆R20 - Group A
Set 1 Set 2 Set 3Set 4 Set 5 Set 6Set 7 Set 8 Set 9
0,0
0,1
1,0
10,0
0 2 4 6 8 10 12 14 16 18 20
∆R
20(x
1012
m-1
)
MLSS (g/L)
MLSS vs. ∆R20 - Group B
Set 10 Set 11 Set 12

The influence of sludge characteristics from full-scale MBR in membrane filterability
98
has an MLSS above 10 g/L, a worst filterability is expected in dilution D10p. If the
original blank has an MLSS below 10 g/L, an improvement on filterability is observed
along the set, i.e, as MLSS decreases.
In order to obtain a possible explanation for these results, more information from particle
counting, SMP and viscosity is required.
6.2 Particle counting in the range size 2-100 µm
For the particle counting in range 2-100 µm only sets from group A were analyzed. All
conclusions to be drawn are only valid for this group. All results from particle counting are
presented in Appendix IX.
6.2.1 Particle counting characterization
Particle number analysis
In Section 5.3.1, it was referred that 99% of the cumulative particle number was within the
interval 2-87 µm. The same was observed for D10p and D20p, thus the subsequent
analysis will be done for this range.
All sets presented a change in the particle number distribution for each dilution, when
compared to the PSD of the blank. In general, diluted samples present a higher number of
particles for smaller sizes when compared to blank samples. Set 8 is a good and
representative example of all sets, see Figure 6-3.

The influence of sludge characteristics from full-scale MBR in membrane filterability
99
Figure 6-3 – Particle number distribution (Set 8)
Figure 6-3 reveals a shift to the left of the particles along the dilution set. Thus the number
of smaller size particles increases along the set, i.e, from the most to the less concentrated
sample.
In relation to the cumulative particle numbers, no clear pattern is observed. D10p shows
both higher or lower number of particles than the blank sample. D20p showed lower values
than the blank for all sets, though in each set a different ratio D20p/blank is observed.
The effect of each dilution in the PSD is clearer when looking at the mean particle size of
maximum particle number. In general, along the set the particle size of the maximum
number is decreasing, showing that in dilution a floc breakage takes place - deflocculation.
Both dilutions show lower particle sizes for the maximum number when compared to the
blank, however, D10p does not always have higher values than D20p. In sets 4 and 8, both
dilutions have equal values and in set 9 D20p is slightly higher than D10p, see Figure 6-4.
0,0E+00
5,0E+03
1,0E+04
1,5E+04
2,0E+04
2,5E+04
3,0E+04
0 20 40 60 80
Par
ticle
num
ber
/ 100
mL
Particle size (µm)
Particle number distributon - Set 8
Blank (17.0 g/L)
D10p (12.3 g/L)
D20p (4.6 g/L)

The influence of sludge characteristics from full-scale MBR in membrane filterability
100
Figure 6-4 – Mean particle size of maximum particle number (all sets)
Particle volume analysis
In the analysis of the particle volume distribution the process of deflocculation is more
obvious. The floc size is shifting from 50-60 µm (blank) to 35-45 µm (D20p), see Figure
6-5. This is also clear when comparing the mean particle size for maximum particle
volume: 51 µm (blank), 49 µm (D10p) e 39.5 µm (D20p).
Figure 6-5– Particle volume distribution (Set 8)
6.2.2 Correlation between filterability with particle counting in range 2-87 µm
Although in the particle counting analysis the deflocculation process can be easily
observed along the set, no correlation was found between filterability and particle counting
in the range 2-87 µm.
0,0
5,0
10,0
15,0
20,0
25,0
30,0
Set 1 set 2 set 3 set 4 set 5 set 7 set 8 set 9
Par
ticle
siz
e (µ
m)
Mean particle size of maximum particle number
0,0E+00
1,0E+05
2,0E+05
3,0E+05
4,0E+05
0 10 20 30 40 50 60 70 80
Par
ticle
vol
ume
(ppb
)
Particle size (µm)
Particle volume distributon - Set 8
Blank (17.0 g/L) D10p (12.3 g/L) D20p (4.6 g/L)
Blank D10p D20p
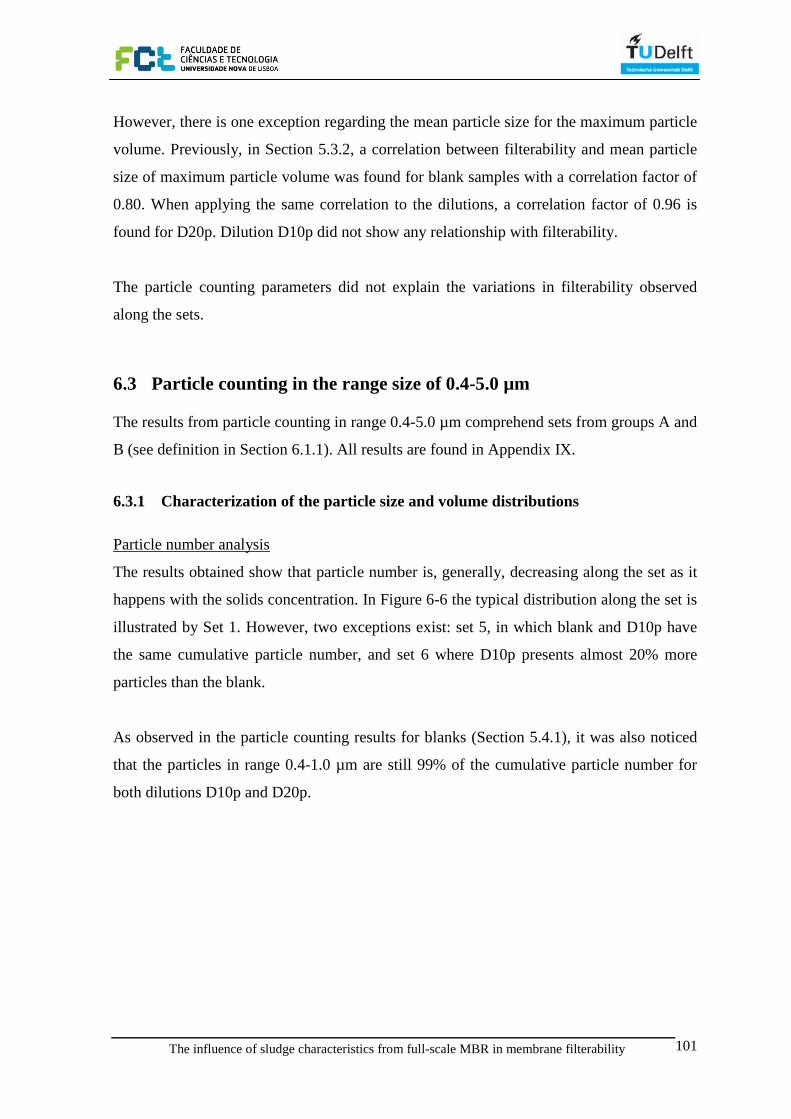
The influence of sludge characteristics from full-scale MBR in membrane filterability
101
However, there is one exception regarding the mean particle size for the maximum particle
volume. Previously, in Section 5.3.2, a correlation between filterability and mean particle
size of maximum particle volume was found for blank samples with a correlation factor of
0.80. When applying the same correlation to the dilutions, a correlation factor of 0.96 is
found for D20p. Dilution D10p did not show any relationship with filterability.
The particle counting parameters did not explain the variations in filterability observed
along the sets.
6.3 Particle counting in the range size of 0.4-5.0 µm
The results from particle counting in range 0.4-5.0 µm comprehend sets from groups A and
B (see definition in Section 6.1.1). All results are found in Appendix IX.
6.3.1 Characterization of the particle size and volume distributions
Particle number analysis
The results obtained show that particle number is, generally, decreasing along the set as it
happens with the solids concentration. In Figure 6-6 the typical distribution along the set is
illustrated by Set 1. However, two exceptions exist: set 5, in which blank and D10p have
the same cumulative particle number, and set 6 where D10p presents almost 20% more
particles than the blank.
As observed in the particle counting results for blanks (Section 5.4.1), it was also noticed
that the particles in range 0.4-1.0 µm are still 99% of the cumulative particle number for
both dilutions D10p and D20p.

The influence of sludge characteristics from full-scale MBR in membrane filterability
102
Figure 6-6– Particle number distribution (Set 1)
In relation to the maximum particle number, it represents on average 75% of the
cumulative particle number for D10p and D20p, and occurs for a mean particle size of 0.45
µm. The only exception is set 2 where both dilutions present their maximum number when
the particle size is 0.55 µm.
Particle volume analysis
In the particle volume distribution, a decrease along the set is observed. Only Set 6, as it
happens for the particle number, has a cumulative particle volume higher in D10p than in
the blank. The maximum particle volume shows the same behavior along the sets since it is
on average 51% for blank, 65% for D10p and 53% for D20p.
The maximum particle volume has a mean particle size of 0.45 µm for all sets, except for
set 2 where both dilutions have a particle size of 0.55 µm.
6.3.2 Correlation between filterability and particle counting in range 0.4-1.0 µm
In figure 6-7 the cumulative particle number of each set is plotted together with the
respective ∆R20.
1,0E+02
1,0E+04
1,0E+06
1,0E+08
0,4 0,5 0,6 0,7 0,8 0,9 1,0Par
ticle
num
ber
/ 100
mL
Particle size (µm)
Particle number distribution - Set 1
blank (17.7 g/L) D10p (9.5 g/L) D20p (4.5 g/L)

The influence of sludge characteristics from full-scale MBR in membrane filterability
103
Figure 6-7 – Cumulative particle number in the range 0.4-1.0µm vs. ∆R20, by set and group
The results obtained for each group regarding particle counting in range 0.4-1.0 µm are
divergent.
In group A no relationship between filterability and particle counting is observed. For
group A the D10p, which has always a worst filterability than the blank, shows a lesser
number of particles than the blank for most sets. However, in this group the values for
particle number and ∆R20 varied in a very small interval when compared to the range of
values presented in Group B, which may explain the enormous difference within the
groups.
When looking at group B, a relationship is found since higher resistances are associated to
higher cumulative particle numbers for blanks, D10p and D20p.
The behaviors observed in groups A and B may be explained by the quality of the blank. If
the quality is excellent, good or moderate, the number of particles and respective ∆R20
along the set suffers minimal variations that cannot lead to a clear interpretation. If the
sludge presents a poor quality, the particle number and ∆R20 values undoubtedly show
differences for each sample type - blank, D10p and D20p.
However, when all values from dilutions D10p are considered together and linked to
filterability, a strong relationship between cumulative particle number and filterability is
0
1
2
3
4
5
4,0E+04
4,0E+06
8,0E+06
1,2E+07
1,6E+07
2,0E+07
∆R
20 (x
1012
m-1
)
Par
ticle
num
ber
/mL
Cumulative particle number vs. ∆R20
ΔR20
Group A Group B
Blank D10p D20p

The influence of sludge characteristics from full-scale MBR in membrane filterability
104
found (R=0.90). Also, the same relationship is found for dilutions D20p, though slighlty
lower with R=0.84. Both correlations are higher than the one for blank samples (R=0.78),
see Figure 6-8.
Figure 6-8 – Cumulative particle number in the range 0.4-1.0µm vs. ∆R20
Also, significant correlations were found regarding the other particle counting parameters,
see Table 6-2.
Table 6-2 – Correlations between filterability and particle counting parameters
Although D10p and D20p have shown high correlations between filterability and particles
from 0.4 µm till 1.0 µm, it has to be noted that these dilutions are artificial sludge and
therefore all the results have to be carefully interpreted. Although the dilutions correlations
cannot be extrapolated to real sludge samples, the results are, at least, consistent for each
dilution type and can be helpful to support other behaviors observed with real sludge.
y = 9E-15x2 + 4E-08x + 0,0555R² = 0,777
y = -2E-15x2 + 2E-07x + 0,0115R² = 0,9007
y = 3E-15x2 + 7E-08x + 0,0902R² = 0,8427
0,01
0,1
1
10
1,0E+05 1,0E+06 1,0E+07 1,0E+08
∆R
20(x
1012
m-1
)
Cumulative particle number / mL
Cumulative particle number in range 0.4-1.0 µm vs. ∆R20
Blank D10p D20p
Blank D10p D20p
∆R20, Cumulative particle number 0.78 0.90 0.84
∆R20, Maximum particle number 0.76 0.89 0.85
∆R20, Cumulative particle volume 0.81 0.80 0.81
∆R20, Maximum particle volume 0.76 0.89 0.84

The influence of sludge characteristics from full-scale MBR in membrane filterability
105
6.4 Soluble Microbial Products
6.4.1 Results
In order to evaluate how the SMP concentrations have varied along the set, dilutions D10p
and D20p were also submitted to SMP analysis. Table 6-3 presents the concentrations
obtained in mg/L from the measurement of proteins (PT) and polysaccharides (PS).
Table 6-3 – Protein (PT) and polysaccharide (PS) concentrations in mg/L by set
Looking to Table 6-3, it’s possible to see that SMP concentrations varied differently along
the sets. There are sets where SMP concentrations decrease from the blank to D20p; sets
where concentrations remained identical; and sets where D10p presented higher
concentrations than the blank.
In order to have a better understanding of SMP evolution along each set, a comparison
between the D10p and D20p was made in relation to the initial blank concentration, see
Figure 6-9.
PT PS PT PS PT PSSet 3 11.3 4.8 11.0 3.4 11.2 4.5Set 5 12.4 5.3 10.1 6.2 10.8 3.4Set 6 11.3 3.6 11.5 3.3 10.1 2.3Set 7 15.5 8.9 12.0 6.8 11.9 4.7Set 11 21.0 17.1 17.5 10.9 14.4 9.5Set 12 21.9 18.3 15.5 8.3 19.1 14.1
Blank D10p D20p
Group A
Group B

The influence of sludge characteristics from full-scale MBR in membrane filterability
106
a b
Figure 6-9 – Variation of protein (a) and polysaccharide (b) concentrations compared to blank
initial concentration (%)
In Figure 6-9 the differences between protein and polysaccharide evolution along each set
are clear. In proteins, values are more constant especially for group A. Variations observed
were only of 10% to 30% compared to the blank initial concentration. In all sets, D10p and
D20p have lower concentrations than the respective blank except set 6 where blank and
D10p have nearly the same concentration. However, between both dilutions sometimes
D20p has a higher concentration than D10p.
In polysaccharides, larger variations are observed. In Set 5, D10p has a concentration of
almost 20% more than the blank. On the other hand, there are sets where dilutions have
only half of the blank concentration. All sets except set 5 have a lower concentration in
D10p and D20p than in the blank. However, when comparing dilutions only, sets 3 and 12
have a higher polysaccharide concentration in D20p than in D10p.
Overall, it can be said that in the majority of the set dilutions have lower concentrations of
proteins and polysaccharides than the blanks. Yet between dilutions no pattern can be
established.
The protein and polysaccharide breakthrough had some variations for both dilutions as
well, see Table 6-4.
0%
20%
40%
60%
80%
100%
120%
Set 3 Set 5 Set 6 Set 7 Set 11 Set 12
Variations of proteins concentration relative to initial blank concentration (%)
Blank D10p D20p
0%
20%
40%
60%
80%
100%
120%
Set 3 Set 5 Set 6 Set 7 Set 11 Set 12
Variations of polysaccharides concentration relative to initial blank
concentration (%)
Blank D10p D20p
Group A Group B Group A Group B

The influence of sludge characteristics from full-scale MBR in membrane filterability
107
Table 6-4 – Proteins (PT) and polysaccharides (PS) retained in the membrane (average values)
From Table 6-4 it is visible that, in average, D10p and D20p had a higher breakthrough of
proteins and polysaccharides when compared with the blank. Dilutions D10p and D20p
have the same percentage of retained proteins, nearly 30%, which is 17% lower than the
blank retention. In polysaccharides, blank and D10p have almost the same retention
percentage, 76% and 70% respectively, though in D20p the polysaccharide retention is
59%.
Since the membrane pore size in the filtration test was the same for all sets, this may
suggest that a change in the protein and polysaccharide concentrations affects the
breakthrough process. It may be related with the fact that at lower concentrations the layer
built on the membrane surface is not so dense and is more permissive so that more SMP
flocs can pass through the membrane; and/or that a modification in the sludge structure
occurred in which the sludge flocs incorporated less SMP, becoming therefore more easy
to breakthrough the membrane.
6.4.2 Correlating filterability with SMP
In Figures 6-10 and 6-11, protein and polysaccharide concentrations from each set are
plotted with the respective ∆R20.
Retained PT Retained PSBlank 47.2% 76.3%
D10p 29.2% 70.1%
D20p 29.9% 58.9%

The influence of sludge characteristics from full-scale MBR in membrane filterability
108
Figure 6-10 – Protein concentration and ∆R20 by set
.
Figure 6-11 – Protein concentration and ∆R20 by set
Figures 6-10 and 6-11 show that filterability is not explained by protein or polysaccharide
concentrations along the sets. For instance in sets 11 and 12, both from group B, two
different patterns are seen. In set 11 proteins and polysaccharides decrease along the set as
∆R20 does, however in set 12 the D20p has a higher protein and polysaccharide
concentration than D10p, and yet the latter has a higher ∆R20.
In the meanwhile, a trend is present where higher resistances in the membrane filtration
correspond to higher SMP concentrations. In sequence of the correlations between SMP
and the blanks analysis found in Section 5.5.2, the same correlations, ∆R20 with SMP and
SMP with cumulative particle number in range 0.4-1.0 µm, are applied separately to both
dilutions. The results are presented in Table 6-5.
0
1
2
3
4
5
0
5
10
15
20
25
Set 3 Set 5 Set 6 Set 7 Set 11 Set 12
∆R
20(x
1012
m-1
)
Pol
ysac
char
ides
(mg/
L)
Polysaccharides concentration and ∆R20 by set
∆R20
0
1
2
3
4
5
0
5
10
15
20
25
Set 3 Set 5 Set 6 Set 7 Set 11 Set 12
∆R
20(x
1012
m-1
)
Pro
tein
s (m
g/L)
Proteins concentration and ∆R20 by set
∆R20
Blank D10p D20p
Blank D10p D20p
Group A Group B
Group A Group B

The influence of sludge characteristics from full-scale MBR in membrane filterability
109
Table 6-5– Correlation factors for proteins and polysaccharides according to dilution type
The correlation factors are considerably high for the relationship between ∆R20 and SMP in
both dilutions – above 0.90, except for polysaccharides in D10p (R=0.78). The same is true
for the correlation between SMP and cumulative particle counting 0.4-1.0 µm however in a
smaller degree. The correlations factors varied from 0.68 till 0.91 for D10p and D20p.
Although SMP do not entirely explain the resistances found in the membrane filtration
along each set, the high correlations show that in each type of sample i.e. blank, D10p and
D20p, the performance in membrane filtration can be attributed to SMP concentrations.
The particles from 0.4 µm till 1.0 µm showed a strong relationship with SMP, the same
verified before in the blanks analysis, although in reported literature SMP is not present in
the range of 0.2 µm till 1.2 µm (Geilvoet et.al,., 2007). Nevertheless, particle counting in
range 0.4-1.0 µm might be a valuable tool to help predicting SMP concentrations in sludge.
6.5 Viscosity
6.5.1 Results
The viscosity was measured along the sets at constant temperature, 20 ± 1oC. As said in
Section 5.6.1, the blank analysis had only comprehended shear rates from 5s-1 till 150s-1, in
order to maintain the original floc structure. The dilutions D10p and D20p have shown that
in some cases the apparent viscosity at 150s-1 turned out to be higher than at 100s-1. To
guarantee that all dilutions are compared at equal conditions, the range of shear rates is
between 5s-1 and 100s-1.
∆R20Cumulative particle number 0.4-1.0 µm
Proteins 0.98 0.98
Polysaccharides 0.98 0.73
Proteins 0.90 0.68
Polysaccharides 0.78 0.89
Proteins 0.94 0.84
Polysaccharides 0.92 0.91
Blank
D10p
D20p

The influence of sludge characteristics from full-scale MBR in membrane filterability
110
All sets showed that apparent viscosity decreases along the set just as the solids content. In
all sets, a non-Newtonian behavior was observed for each sample type. In Figure 6-12 it is
possible to observe the viscosity results from Set 3, which is representative of all sets.
Figure 6-12 – Shear rate vs. apparent viscosity for Set 3 (T=20 ±1oC)
D10p and D20p results were analyzed separately to identify how apparent viscosity varied
inside of each dilution type. In Figure 6-13 shear rate is plotted against apparent viscosity
for D10p.
Figure 6-13 – Shear rate vs. apparent viscosity for D10p (T=20 ±1oC)
1
10
100
1000
1 10 100App
aren
t vi
scos
ity (
mP
a s)
Shear rate (s -1)
Apparent viscosity vs. Shear rate (Set 3)
Blank (MLSS=14.01 g/L) D10p (MLSS=9.2 g/L) D20p (MLSS=4.2 g/L)
1
10
100
1 10 100
App
aren
t vis
cosi
ty [
mP
a.s]
Shear rate [s -1]
Shear rate vs. apparent viscosity for D10p (T=20 ±1oC)
D10p (12.3 g/L) D10p (10.4 g/L) D10p (9.2 g/L) D10p (8.5 g/L)
D10p (7.3 g/L) D10p (6.5 g/L) D10p (6.0 g/L) D10p (5.9 g/L)

The influence of sludge characteristics from full-scale MBR in membrane filterability
111
According to Figure 6-13 it is possible to see that, in general, higher MLSS correspond to
higher apparent viscosities. Though there are some contradictions. The apparent viscosity
is the same for samples with MLSS of 9.2 g/L and 10.4 g/L; the same is verified for
samples with 5.9 g/L and 7.3 g/L. The differences are quite small, so it is not surprising
that this happens. However, it cannot be ignored that other parameters might have
influenced viscosity, even if they aren´t the most significant (like solids content, shear rate
and temperature).
When looking at Figure 6-14, all D20p show identical apparent viscosity. It is visible that
two samples with the same MLSS, 4.2 g/L, have slightly different apparent viscosities.
Also samples with MLSS in the interval 3.7-2.0 g/L present practically the same apparent
viscosity. This is probably due to the fact that the range of MLSS is very small, varying
from 2.0 till 5.3 g/L. However, there is also the possibility that other parameters influenced
viscosity.
Figure 6-14 – Shear rate vs. apparent viscosity for D20p (T=20 ±1oC)
6.5.2 Correlating viscosity
To identify how MLSS affects the apparent viscosity, a correlation was made firstly for
each set, and then for both dilutions at each shear rate. Inside each set a very strong
relationship between apparent viscosity and MLSS was found, where all sets presented a
1
10
100
1 10 100 1000
App
aren
t vis
cosi
ty [
mP
a.s]
Shear rate [s -1]
Shear rate vs. apparent viscosity for D20p (T=20 ±1oC)
D20p (5.3 g/L) D20p (4.6 g/L) D20p (4.2 g/L) D20p (4.2 g/L)
D20p (3.7 g/L) D20p (2.6 g/L) D20p (2.2 g/L) D20p (2.0 g/L)

The influence of sludge characteristics from full-scale MBR in membrane filterability
112
correlation factor ≈1. When considering each dilution type, D10p and D20p, the results
showed a different behavior, see Table 6-6.
Table 6-6– Correlation factors between MLSS and apparent viscosity, according to dilution type
In dilution D10p it is clear that MLSS has a significant impact on apparent viscosity since
correlation factors varied between 0.94 and 0.95 for all shear rates. The strength of this
relationship was found to be the same as observed in blanks with a correlation factor of
0.95 (see Section 5.6.2). Although D10p is an artificial sludge, this shows that the same
coherence in terms of apparent viscosity is verified as in real sludge.
On the contrary, D20p did not show any relationship between MLSS and apparent
viscosity given that the higher correlation factor was 0.23 at 100s-1. This occurs probably
due to the solids content that only varies from 2.0 g/L till 5.3 g/L, which is a very small
interval. However, contrary to D10p samples, it may also be possible that viscosity in
D20p samples might be influenced by other parameters.
For the correlation between filterability and viscosity, values at a shear rate of 100 s-1 were
used. In Figure 6-14 the apparent viscosity is plotted together with ∆R20 for D10p and
D20p.
Shear rate (s-1) D10p D20p
5 0.94 0.1410 0.95 0.1620 0.95 0.2230 0.95 0.2250 0.95 0.22100 0.95 0.23

The influence of sludge characteristics from full-scale MBR in membrane filterability
113
Figure 6-15 - Apparent viscosity (100 s-1) and filterability – D10p (left-side) and D20p (right-side)
The results show that apparent viscosity does not have a major influence in filtration
performance. In D10p, the highest resistance in the membrane showed one of the lower
viscosities. For D20p, sets 5 and 12 have both the same apparent viscosity and the
difference in ∆R20 goes from 0.16 till 2.0x10¹²m-1.
No correlation was found between filterability and viscosity for both dilutions D10p and
D20p.
6.6 Conclusions
The Dilutions experiment was carried out with sludge samples from three full-scale MBR
systems: Heenvliet, Ootmarsum and Varsseveld. This experiment had as main purpose to
study the MLSS effect on membrane filterability.
The change of the MLSS concentration from the original sludge sample was made in an
artificial way, through two dilutions with permeate: D10p (10L permeate + 20L sludge)
and D20p (20L permeate + 10L sludge). The analyses were divided in 12 sets, in which a
set is composed by blank, D10p and D20p. Besides the filterability test, other tests were
applied when possible: particle counting in range 2-100 µm, particle counting in range 0.4-
5.0 µm, EPS, and viscosity.
0
0,5
1
1,5
2
2,5
3
0
2
4
6
8
10
12
Set 3 Set 4 set 5 set 6 set 8 Set 9 Set 10Set 12
∆R
20(x
1012
m-1
)
App
aren
t vis
cosi
ty [
mP
a.s]
Apparent viscosity (100 s -1) and ∆R20 - D10p
Apparent viscosity (100/s) ΔR20
0
0,2
0,4
0,6
0,8
1
1,2
1,4
0
0,5
1
1,5
2
2,5
3
3,5
4
Set 3 Set 4 set 5 set 6 set 8 Set 9 Set 10
Set 12
∆R
20(x
1012
m-1
)
App
aren
t vis
cosi
ty [
mP
a.s]
Apparent viscosity (100 s -1) and ∆R20 - D20p
Apparent viscosity (100/s) ΔR20

The influence of sludge characteristics from full-scale MBR in membrane filterability
114
The filterability along the set was expressed by two groups of different behavior when
considering the ∆R20 values:
- Group A: D10p > blank, which coincides when the blank MLSS is superior to 10
g/L.
This group can be divided in two sub-groups: D10p > D20p > blank (7 sets) and D10p
> blank > D20p (2 sets)
- Group B: blank > D10p > D20p, which coincides when the blank MLSS is lower
than 10 g/L.
When correlating filterability with MLSS no relationship is found for group A. In this
group, the highest resistance in the membrane is always verified for D10p, which is the
sample from the set having the mean MLSS concentration. For group B, a correlation is
found where filterability improves as MLSS concentration decreases. However, no
explanation is found for these two different behaviors. It can only be stated that, when the
blank MLSS is superior to 10 g/L, higher resistances are expected for the following
dilutions; when the blank has an MLSS concentration lower than 10 g/L, filterability
improves from the most concentrated to the most diluted sample.
For particle counting in range 2-100 µm no relationship with filterability was found, except
for the mean particle size of maximum particle volume (correlation previously observed in
the Blanks Characterization experiment). However, this correlation was not valid along the
set, but only valid when considering D20p. A bigger floc size of the maximum particle
volume seems to be linked to a worst filterability. When considering D10p no relationship
was observed.
The particle counting in the range 2-100 µm did not explain the variations in filterability
observed along the sets.
As in Blanks Characterization experiment, it was observed for the particle counting in
range 0.4-5.0 µm that 99% of particles exist in the range 0.4-1.0 µm.

The influence of sludge characteristics from full-scale MBR in membrane filterability
115
For particle counting in range 0.4-1.0 µm a relationship with filterability is observed only
for group B. Along the set, the particle number decreases while filterability also decreases.
This suggests that a higher number of particles in this range leads to an increase of the
membrane resistance. For group A, the variation of the particle number along the set is
minimal when compared to group B, thus a clear interpretation is difficult to make.
However, when the dilutions in groups A and B are considered separately, D10p and
D20p, a relationship between filterability and cumulative particle number is found for both
dilutions: R2=0.90 for D10p and R2=0.84 for D20p. Both correlations are higher than the
one for blank samples (R2=0.78).
In the SMP analysis, the relationship between filterability and SMP is not clear along the
sets. Nevertheless, a trend is present where higher resistances in the membrane filtration
correspond to higher SMP concentrations. In the meanwhile, when considering D10p and
D20p separately, high correlations are found between filterability and SMP. A relationship
was also observed between particles in range 0.4-1.0 µm and SMP, though at a lower level.
Although SMP concentrations do not entirely explain the resistances found in the
membrane filtration along each set, when considering separately the blank, D10p and
D20p, performance in membrane filtration can be attributed to SMP concentrations.
From the viscosity measurements, D10p showed that its apparent viscosity is highly
influenced by the MLSS concentrations (R2~95). The opposite occurs for D20p, where no
correlation between apparent viscosity and MLSS is found. When correlating filterability
with viscosity no relationship is observed.
The Dilutions experiment showed that some of the results were coherent with other
behaviors observed in the Blanks Characterization experiment. Although the dilutions are
considered artificial sludge, it is important to observe identical patterns as in “real” sludge,
contributing to reinforce the statements relative to sludge from a full-scale MBR.

The influence of sludge characteristics from full-scale MBR in membrane filterability
116
The influence of sludge characteristics from full-scale MBR in membrane filterability
117
7 SOLIDS CONCENTRATION EXPERIMENT
During the period from January 20th – 23rd the DFCi was transferred from TUDelft to
Heenvliet WWTP for filterability tests “in situ”. The solids concentration experiments
were carried out on January 20th and 22nd. Besides the filterability test, particle counting in
range 2-100 µm and viscosity measurements were applied.
In the two days of experiments, the HRT from the Membrane Tank (MT) was shifted from
17 hours, at normal operation, to 30.8-40.8 hours, during a period of approximately three
hours. After that, the MBR was again submitted to the normal operation conditions where
the HRT was gradually regularized to its standard value. HRT is controlled by the
wastewater feedstream into the MT. The feedstream was gradually reduced implying an
increase of the HRT. During this period of three hours, sludge samples were collected from
the MT and filterability tests performed.
The particle counting in range 2-100 µm and viscosity measurements were only made at
TUDelft on the day following the filterability tests, due to the localization of Heenvliet
WWTP. To avoid microbiological activity and to preserve as much as possible the
characteristics of the sludge at the time of collection, sludge was saved and stored in a
refrigerator. The results from both tests are considered reliable and truly representative of
the sludge tested since a previous trial was done with positive results. In this trial sludge
was collected from Heenvliet and viscosity was measured, as well as particle counting
done, in the same day of collection. Sludge was saved and both tests repeated again in the
next day. The differences observed only diverged in about 0.2% for both tests.
It is important to state that this experiment is not truly representative of continuous
operation since the characteristics of the sludge are constantly changing and are not in a
steady-state mode.
All results are presented in Appendix X.

The influence of sludge characteristics from full-scale MBR in membrane filterability
118
7.1 Filterability
7.1.1 Results
During the period in which the HRT was modified, several sludge samples were collected
to see the effect caused on membrane filterability. However, the first blank of each day
was measured whilst the HRT was still “normal”, i.e. the MBR was under steady-state
operation.
In Table 7-1 the results obtained from the filterability test are presented.
Table 7-1 – Main results from the filterability tests performed on January 20th and 22nd
The results obtained are organized according to the day of experiment.
Experiment on 20-01-09
The MT was operated with a different HRT during 2h20 minutes. The MLSS increased
from 14.3 g/L till 17.5 g/L, as expected, at the same time as ∆R20 decreased from 0.52 till
0.13x10¹²m-1. The temperature for the filterability tests was in average 11.5 oC.
The results from day 20th are shown on a column chart concerning ∆R20 values with
associated MLSS, see Figure 7-1.
Name Time T MLSS ∆R20
(hh:mm) oC (g/L) (x1012m-1)blank 1a 09:36 11.4 14.3 0.520blank 2a 10:15 11.4 15.1 0.321blank 3a 10:47 11.6 16.0 0.232blank 4a 11:24 11.5 17.2 0.128blank 5a 11:55 11.5 17.5 0.131blank 1b 09:54 12.2 15.2 0.640blank 2b 10:21 12.1 14.9 0.592blank 3b 10:48 12.1 17.1 0.449blank 4b 11:15 12.2 16.2 0.412blank 5b 11:46 12.2 16.3 0.335blank 6b 12:18 12.2 16.5 0.302blank 7b 12:50 12.1 18.2 0.346
20-01-2009
22-01-2009

The influence of sludge characteristics from full-scale MBR in membrane filterability
119
Figure 7-1 – ∆R20 and MLSS in January 20th
As Figure 7-1 shows, there was a significant decrease of additional resistance in the
membrane along time, i.e. while HRT increased.
Experiment on 22-01-09
This experiment had a duration of almost three hours. The MLSS concentration shifted
from 14.9 g/L till 18.2 g/L and ∆R20 from 0.64 till 0.30 x10¹²m-1. The average temperature
during the experiment was 12.2 oC.
In Figure 7-2 the results from day 22nd are shown with the evolution of MLSS and ∆R20
during the experiment.
Figure 7-2 – MLSS and ∆R20 in January 22nd
0
5
10
15
20
0,0
0,2
0,4
0,6
0,8
9:36 10:15 10:47 11:24 11:55
ML
SS
(g
/L
)
∆R
20(x
1012
m-1
)
Time (hh:mm)
Solids concentration experiment (20-01-09)
∆R20 MLSS
0
5
10
15
20
0,0
0,2
0,4
0,6
0,8
9:54 10:21 10:48 11:15 11:46 12:18 12:50
MLS
S (g
/L)
∆R
20(x
1012
m-1
)
Time (hh:mm)
Solids concentration experiment (22-01-09)
∆R20 MLSS

The influence of sludge characteristics from full-scale MBR in membrane filterability
120
The results obtained on January 22nd show the same trend observed on January 20th,
although in a more inconstant way. The initial blank was measured with an MLSS of 15.2
g/L. Due to the change of HRT, the following sample would be expected to have a higher
MLSS concentration. On the contrary, MLSS decreased slightly to 14.9 g/L and at the
same time there was an improvement on filterability from 0.64 till 0.59 x10¹²m-1. The
subsequent samples showed that MLSS was increasing in a non-linear way while
filterability was improving along time. However, the lowest ∆R20 does not match the
higher MLSS like it happened on day 20th.
7.1.2 Correlating filterability
In order to have a better notion of how filterability changed along the time, a correlation
between filterability and MLSS was made. The correlation factors are presented in Figure
7-3.
Figure 7-3 – Correlation between ∆R20 and MLSS in January 20th and 22nd
Correlations were found in both experiments: on day 20th, the relationship between
filterability and MLSS was highly significant (R2=0.99); on day 22nd, a strong correlation
was also found but at a lower level (R2=0.73).
In spite of the correlations found, it was previously demonstrated in the Blanks
Characterization experiment that no correlation between filterability and MLSS was
observed for five different MBRs (see Section 5.6.2). One the other hand, it has been
y = 0,0394x2 - 1,3763x + 12,134R² = 0,9936
y = 0,0476x2 - 1,6552x + 14,736R² = 0,7166
0,0
0,2
0,4
0,6
0,8
13 14 15 16 17 18 19
∆R
20(x
1012
m-1
)
MLSS (g/L)
Solids concentration experiment on January 20 th and 22 nd
20-01-2009 22-01-2009

The influence of sludge characteristics from full-scale MBR in membrane filterability
121
reported that higher MLSS concentrations showed an improvement in filterability
(Madaeni et.al,., 1999; Le-Clech et.al,., 2003). The effect of increasing HRT has probably
other impacts on the sludge quality beyond the increase of solids content. Meng et.al,.
(2007a) reported that, when HRT decreased, the filamentous bacteria grew easily followed
by a significant increase in the EPS concentration and sludge viscosity. Chae et.al,. stated
that a reduction from 10 to 4 h promoted a decline in sludge settleability, caused by the
increase of EPS and average particle size. As a consequence, the total resistance filtration
increased. Therefore, other mechanisms might have been involved in changing the
characteristics of the sludge, most likely EPS.
When comparing days 20th and 22nd, although both showed the same behavior, the results
from the experiment on the 22nd were more irregular. This is probalby due to the different
techniques used to change the normal operation HRT. The temperature was not an
influencing parameter since both experiments were performed under similar temperatures.
7.2 Particle counting in the range size of 2-100 µm
7.2.1 Results and Discussion
It was observed that 99% of the cumulative particle number was found in the range 2-87
µm. Therefore, and as it happened with the previous experiments, further analysis will only
be considered in this interval.
The PSD was the same as observed in the blanks from Heenvliet for the blanks
characterization experiment (see Sub-chapter 5.3).
The cumulative particle number shows different patterns for each day, see Figure 7-4.

The influence of sludge characteristics from full-scale MBR in membrane filterability
122
a b
Figure 7-4 – Cumulative particle number and ∆R20 on January 20th (a) and 22nd (b)
On day 20th there was a slight decrease of the cumulative particle number as filterability
improved. A correlation factor of 0.90 was found for this relationship. In spite of this high
correlation, it has to be stated that the variations of the cumulative particle number were
very subtle. For day 22nd no correlation was found since the cumulative particle number
varied up and down while filterability improved.
Since the cumulative particle number did not suffer considerable changes along time, it is
more likely and prudent to say that no correlation between cumulative particle number in
the range 2-87 µm and filterability was found. Also, no relationship between filterability
and maximum particle number was found. In relation to the mean particle size for
maximum number, it varied between 18 µm, 25 µm and 26 µm, the same values observed
for other blanks from Heenvliet. No relationship with filterability was found either.
In the particle volume analysis no correlations between filterability and particle volume
parameters were found.
0,0
0,1
0,2
0,3
0,4
0,5
0,6
0,0E+00
3,0E+05
6,0E+05
9,0E+05
1,2E+06
9:36 10:15 10:47 11:24 11:55
∆R
20(x
10
12m
-1)
Par
ticle
num
ber/
10
0 m
L
Time (hh:mm)
Cumulative particle number (20-01-09)
Cumulative particle number ∆R20
0,0
0,1
0,2
0,3
0,4
0,5
0,6
0,7
0,0E+00
3,0E+05
6,0E+05
9,0E+05
1,2E+06
9:54 10:21 10:48 11:15 11:46 12:18 12:50
∆R
20(x
10
12m
-1)
Pa
rtic
le n
umbe
r/ 1
00 m
L
Time (hh:mm)
Cumulative particle number (22-01-09)
Cumulative particle number ∆R20

The influence of sludge characteristics from full-scale MBR in membrane filterability
123
7.3 Viscosity
7.3.1 Results and discussion
The viscosity measurements comprehended sludge with MLSS between 14.3 g/L and 18.2
g/L. It was observed that at 150s-1 some samples showed a modification in their structure
since apparent viscosity started to increase. For that reason the interval of shear rates
concerned is from 5s-1 till100s-1.
All samples showed non-Newtonian and shear thinning behavior. In general, the apparent
viscosity was higher for samples with higher solids content. When the opposite was
observed it was due to slight differences in the solids content.
Figures 7-5 and 7-6 show how apparent viscosity decreased along the shear rate for both
days.
Figure 7-5 – Shear rate vs. apparent viscosity for day 20th
10
100
1000
1 10 100 1000
App
aren
t vis
cosi
ty [
mP
a.s]
Shear rate [s-1]
Shear rate vs. apparent viscosity for January 20 th (T=20 ±1oC)
17.5 g/L 17.2 g/L 16.0 g/L 15.1 g/L 14.3 g/L

The influence of sludge characteristics from full-scale MBR in membrane filterability
124
Figure 7-6 – Shear rate vs. apparent viscosity for day 22nd
The correlation factors between MLSS and apparent viscosity were found with high
significance for both days, although in different levels.
On day 20th, a correlation factor of 1.00 was found at all shear rates, elucidating the major
impact of solids content in apparent viscosity.
For day 22nd the correlations factors were not so high, varying between 0.78 and 0.83,
which still demonstrates a major influence of MLSS in the apparent viscosity. This might
be a consequence of the behavior observed before in the MLSS concentrations (see Figures
7-1 and 7-2).
In Figures 7-7 and 7-8 the filterability is plotted together with the apparent viscosity
measured at a shear rate of 100 s-1 for days 20th and 22nd.
10
100
1000
1 10 100 1000
App
aren
t vis
cosi
ty [
mP
a.s]
Shear rate [s-1]
Shear rate vs. apparent viscosity for January 22 nd (T=20 ±1oC)
18.2 g/L 16.5 g/L 16.3 g/L
16.2 g/L 15.2 g/L 14.9 g/L

The influence of sludge characteristics from full-scale MBR in membrane filterability
125
Figure 7-7 – Filterability and apparent viscosity (100 s-1) – January 20th
Figure 7-8 – Filterability and apparent viscosity (100 s-1) – January 22nd
From Figure 7-7 it is clear that filterability increased as apparent viscosity increased. This
is a natural consequence of the increase registered for MLSS concentrations. A correlation
factor of 0.99 was found between filterability and apparent viscosity at 100 s-1.
When looking at Figure 7-8, the apparent viscosity also increased while filterability
improved, though not in a linear way. This is confirmed by the correlation factor of 0.59
between filterability and apparent viscosity.
0
0,1
0,2
0,3
0,4
0,5
0,6
0
5
10
15
20
25
30
09:36 10:15 10:47 11:24 11:55
∆R
20(x
1012
m-1
)
App
aren
t vis
cosi
ty [
mP
a.s]
Time (hh:mm)
Filterability and apparent viscosity (100 s -1) - January 20 th
Apparent viscosity (100/s) ∆R20
0
0,1
0,2
0,3
0,4
0,5
0,6
0,7
0
5
10
15
20
25
09:54 10:21 11:15 11:46 12:18 12:50
∆R
20(x
1012
m-1
)
App
aren
t vis
cosi
ty [
mP
a.s]
Time (hh:mm)
Filterability and apparent viscosity (100 s -1) - January 22 th
Apparent viscosity (100/s) ∆R20

The influence of sludge characteristics from full-scale MBR in membrane filterability
126
These results are contradictory to what has been reported in literature. The increase in
apparent viscosity is expected to contribute to membrane fouling since higher shear rates
are required to maintain a turbulent regime, which is fundamental to a sustainable
membrane filtration. For that reason, the results show that apparent viscosity was not a
main factor contributing to the increase of the additional resistance in the membrane, while
other factors have prevailed to improve considerably the filterability of the sludge.
7.4 Conclusions
The solids concentration experiment was carried out in Heenvliet WWTP on January 20th
and 22nd. The goal for this experience was to change in a “natural” way the MLSS of the
sludge in the MT. By increasing the HRT it was possible to achieve higher MLSS
concentrations.
The filterability improved considerably in both days, especially since it was a short-term
experience (3 hours for each day). On both days an increase of approximately 3 g/L
occurred from the initial blank MLSS.
The particle counting in range 2-100µm did not reveal any relationship between
filterability and particle number/volume.
In relation to viscosity, as expected, an increase was observed during the experiment. High
correlation factors were found between apparent viscosity and MLSS. The relationship
between filterability and apparent viscosity was very significant for day 20th (R2=0.99)
while for day 22nd a poor correlation was found (R2=0.59). Since apparent viscosity has a
negative impact on membrane filtration, this suggests that apparent viscosity does not have
a major impact on membrane filtration and other mechanisms have prevailed in improving
the sludge quality.
Through this experiment it was possible to confirm that manipulating operating conditions
in the MBR has an effect on membrane filterability. In particular, it was observed that an
improvement in membrane filtration occurred when HRT was changed from 17 hours to
30.8-40.8 hours at the same time that MLSS varied from 14.3 till 18.2 g/L, approximately.

The influence of sludge characteristics from full-scale MBR in membrane filterability
127
However, it has to be noted that this is only true for a short-term experience (~3hours), for
which considerations for a continuous MBR operation cannot be established.

The influence of sludge characteristics from full-scale MBR in membrane filterability
128

The influence of sludge characteristics from full-scale MBR in membrane filterability
129
8 GENERAL CONCLUSIONS AND RECOMMENDATIONS
FOR FURTHER RESEARCH
8.1 General conclusions
This thesis is a result of research conducted between September 2008 and February 2009.
During this period, five full-scale MBRs located between The Netherlands and Germany
were visited to collect sludge and study the characteristics/components of activated sludge
and its impact on membrane filterability.
Three different experiments were done aiming at different objectives:
- the Blanks Characterization experiment, for a characterization of the sludge in full-
scale MBRs
- the Dilutions experiment, to study the impact of different MLSS in filterability,
through two dilutions, D10p and D20p, composed of activated sludge and
permeate collected in the WWTP
- the Solids Concentration experiment, to see the impact of different MLSS by
changing the operating conditions in Heenvliet full-scale MBR
In addition to the filterability test, five key parameters for the sludge analysis were chosen:
mixed liquor suspended solids (MLSS), particles in range 2-100 µm, particles in range 0.4-
5.0 µm, soluble microbial products (SMP), and viscosity. A relationship between
filterability and each of these parameters was tried in order to explain the results observed.
In the Blanks Characterization and Dilutions experiments no direct correlation between
filterability and MLSS was found. Also, the viscosity did not show a major role in
membrane filterability.
The particle counting in range 2-100 µm did not show a clear relationship with membrane
filterability.

The influence of sludge characteristics from full-scale MBR in membrane filterability
130
From the analysis of sludge from a full-scale MBR, a three-way relationship was observed
between filterability, SMP and temperature. Seasonal variations, the temperature
differences, had an impact on membrane filterability, since at lower temperatures a worst
filterability was registered. A high relationship between filterability and SMP was found in
which filterability was better at lower SMP concentrations. Also, a relationship between
SMP and temperature was found with high significance. One possible explanation for this
triple relationship is that temperature seems to influence the release of SMP into the
activated sludge, and SMP concentrations seem to be a major factor in influencing
membrane filterability through the build up of a gel layer near the membrane surface. In a
long-term operation it is most likely that SMP will highly contribute to membrane fouling.
A strong correlation between SMP and particle counting parameters in range 0.4-1.0 µm
was also found. Although SMP particles are considered to be smaller than in the observed
range, particle counting in range 0.4-1.0 µm seems to be a good indicative of the SMP
levels in the activated sludge.
This is also supported by the results from the Dilutions experiment. When considering
D10p and D20p separately, it was observed that in each dilution type the filterability could
be attributed to the SMP concentrations. A relationship between particles in range 0.4-1.0
µm and SMP was also observed, though at a lower level. Although the dilutions D10p and
D20p are artificial sludge, it is a good outcome to see that the same results observed with
“real” sludge are reflected in this type of “artificial” sludge.
The Solids Concentration experiment showed that an improvement in membrane filtration
occurred when the hydraulic retention time (HRT) was changed from 17 hours to 30.8-40.8
hours while at the same time MLSS varied approximately from 14.3 till 18.2 g/L. In spite
of the fact that for this experiment a better filterability is observed for higher MLSS, it
cannot be assured that MLSS played a role in filterability, especially when no correlation
was found in the Blanks Characterization and Dilutions experiments. Through the Solids
Concentration experiment it was possible to confirm that the manipulation of the operating
conditions in the MBR has an effect on membrane filterability. Although, it must be noted
that this is only true for a short-term experience (~3hours), and therefore considerations for
a continuous MBR operation cannot be established.

The influence of sludge characteristics from full-scale MBR in membrane filterability
131
8.2 Recommendations for further research
As said before in literature review, Extracellular polymeric substances (EPS) are largely
appointed has one of the most crucial contributors for membrane fouling. It would be
interesting to see the evolution of EPS and/or SMP along the biotreatment process in an
MBR system. Thus, the SMP should be periodically measured in the different processes of
the biological treatment such as anaerobic, anoxic, aerobic, membrane tank, and final
effluent. Then different biotreatment sequences should be tested to see if the
concentrations of SMP in the different processes changed. At the same time, filterability is
being continuously measured to study the impact of the different processes applied.
The same type of study should be developed by changing the operating conditions in the
MBR. For example, the effects of different HRTs should be studied as well as their impact
on the SMP concentrations and consequently on membrane filterability. Also, the solids
retention time (SRT) should be manipulated to see both the impact on the membrane
filtration performance and the SMP levels.
In addition, the particle counting in range 0.4-1.0 µm could turn out to be a useful tool to
predict membrane fouling in MBR operation. The implementation of such measuring
method on an online MBR operation would be appealing.

The influence of sludge characteristics from full-scale MBR in membrane filterability
132
The influence of sludge characteristics from full-scale MBR in membrane filterability
133
9 REFERENCES
Åhl, R., Leiknes, T., Ødegaard, H. (2006) Tracking particle size distributions in a moving
bedbiofilm membrane reactor for treatment of municipal wastewater, Water Science &
Technology, Vol. 53, pp. 33–42
Al-Halbouni, D., Traber, J., Lyko, S., Wintgens, T., Melin, T.,Tacke, D., Janot, A., Dott,
W., Hollender, J.(2008) Correlation of EPS content in activated sludge at different sludge
retention times with membrane fouling phenomena, Water Research, Vol. 423, pp. 1475-
1488
Al-Halbouni, D., Dott, W., Hollender, J.(2009) Occurrence and composition of
extracellular lipids and polysaccharides in a full-scale membrane bioreactor, Water
Research, Vol. 43, pp. 97-106
Bae, T. and Tak, T. (2005) Interpretation of fouling characteristics of ultrafiltration
membranes during the filtration of membrane bioreactor mixed liquor, Journal of
Membrane Science, Vol. 264, pp. 151-160
Benschop, M. (2008) Influence of temperature on filtration in membrane bioreactors, Msc
Thesis, Delft University of Technology, Delft, The Netherlands
Berg van den G. and Smolders, C. (1990) Flux decline in ultrafiltration processes,
Desalination, Vol. 77, pp. 101-133
Bouhabila, E., Aïm, R., Buisson, H. (2001) Fouling characterization in membrane
bioreactors, Separation and Purification Technology, Vol. 22-23, pp. 123-132
Chae, S.-R., Ahn, Y.-T., Kang, S.-T., Shin, H.-S. (2006) Mitigated membrane fouling in a
vertical submerged membrane bioreactor, Journal of Membrane Science, Vol. 280, pp.
572–581.
Cheryan, M. (1998) Ultrafiltration and Microfiltration Handbook, Techonomic Publishing
Co., Inc., Lancaster, PA

The influence of sludge characteristics from full-scale MBR in membrane filterability
134
Cho, B., Fane, A. (2003) Fouling phenomena in a MBR: transmembrane pressure
transients and the role of EPS (extracellular polymeric substances), Water Science and
Technology, Vol. 3, pp. 261-266
Cicek, N., Macomber, J., Davel, J., Suidan, M., Audic, J,. Genestet, P. (2000) Effect of
solids retention time on the performance and biological characteristics of a membrane
bioreactor, Water Science and Technology, Vol. 43, pp. 43-50
Davies, J., Le, M., Heath, C. (1998) Intensified activated sludge process with submerged
membrane microfiltration, Water Science and Technology, Vol. 38, pp. 421-428
Defrance, L. and Jaffrin, Y. (1999) Comparison between filtrations at fixed transmembrane
pressure and fixed permeate flux: application to a membrane bioreactor used for
wastewater, Journal of Membrane Science, Vol. 152, pp. 203-210
Defrance, L., Jaffrin, Y. Gupta, B.,Paullier, P., Geaugey, V. (2000) Contribution of various
constituents of activated sludge to membrane bioreactor fouling, Bioresource Technology,
Vol.73, pp. 105-112
Dubois, M., Gilles, K.A., Hamilton, J.K., Rebers, P.A., Smith, F. (1956) Colorimetric
method for determination of sugars and related substances, Analytical Chemistry, Vol. 28,
pp 350-356
Evenblij, H. and Van der Graaf, J. (2004) Occurrence of EPS in activated sludge from a
membrane bioreactor treating municipal wastewater, Water Science and Technology, Vol.
50, pp. 293-300
Evenblij, H., Geilvoet, S.P., Van der Graaf, J.H.J.M., Van der Roest, H.F. (2005).
Filtration characterization for assessing MBR performance: three cases compared,
Desalination, Vol. 178, pp 115-124
Evenblij, H. (2006), Filtration Characteristics in Membrane Bioreactors. PhD thesis, Delft
University of Technology, The Netherlands.

The influence of sludge characteristics from full-scale MBR in membrane filterability
135
Flemming, H.C. and Wingender, J. (2001) Relevance of microbial extracellular polymeric
substances (epsss) – part I: Structural and ecological aspects, Water Science Technology,
Vol. 43, pp. 1-8
Frølund, B., Palmgren, R., Keiding, P.H., Nielsen, K. (1996) Extraction of extracellular
polymers from activated sludge using a cation exchange resin, Water Science &
Technology, Vol. 30, pp. 1749-1758.
Geilvoet, S., Moreau, A., Lousada-Ferreira, M., van Nieuwenhuijzen, A., van der Graaf, J.
(2007) Filtration characterisation, SMP analyses and particle size distribution in the
submicron range of MBR activated sludge. IWA International Conference on Particle
Separation, Toulouse, France
Geilvoet, S., Moreau, A., Lousada-Ferreira, M., van Nieuwenhuijzen, A., van der Graaf, J.
(2007a) Filtration characterization and sludge quality monitoring at a full-scale MBR
during its first year of operation. 4th IWA Conference on Membranes for Water and
Wastewater Treatment; Harrogate, UK
Geilvoet S. P. (2009) The Delft Filtration Characterization method, Assessing membrane
bioreactors activated sludge filtration. PhD thesis (in preparation), Delft University of
Technology, The Netherlands.
Harada, H., Momonoi, K., Yamazaki, S., Takizawa, S. (1994) Application of anaerobic-UF
membrane reactor for treatment of a waste-water containing high-strength particulate
organics, Water Science & Technology, Vol. 30, pp. 307–319.
Hasar, H., Kinaci, C., Ünlü, A., Toğrul, Ipek, U. (2004) Rheological properties of activated
sludge in a sMBR, Biochemical Engineering Journal, Vol. 20, pp. 1-6
Itonaga, T., Kimura, K., Watanabe, Y. (2004) Influence of suspension viscosity and
colloidal particles on permeability of membrane used in membrane bioreactor (MBR),
Water Science Technology, Vol. 50, pp. 301–309.

The influence of sludge characteristics from full-scale MBR in membrane filterability
136
Ivanovic, I., Leiknes,T. (2008) Impact of aeration rates on particle colloidal fraction in the
biofilm membrane bioreactor (BF-MBR), Desalination, Vol. 231, pp. 182–190
Jiang, T., Kennedy, M., Guinzbourg, B., Vanrolleghem, P., Schippers, J. (2005)
Optimising the operation of a MBR pilot plant by quantitative analysis of the membrane
fouling mechanism, Water Science Technology, Vol. 51, pp. 19-25
Judd, Simon (2006) The MBR book: Principles and Applications of Membrane Bioreactors
in Water and Wastewater Treatment (1st Edition). Elsevier, Oxford
Koros, J., Ma, Y., Shimidzu, T. (1996) Terminology for membrane and membrane
processes; IUPAC recommendations 1996, Pure & Applied Chemistry, Vol. 68, pp. 1479-
1489
Laera, G., Giordano, C., Pollice, A., Saturno, D., Mininni, (2007) Membrane bioreactor
sludge rheology at different solid retention times, Water Research, Vol. 41, pp. 4197-4203
Laspidou, C.S. and B.E. Rittmann (2002) A unified theory for extracellular polymeric
substances, soluble microbial products, and active and inert biomass, Water Research, Vol.
36 pp. 2711-2720
Le-Clech, P., Jefferson, B., Judd, S. (2003) Impact of aeration, solids concentration and
membrane characteristics on the hydraulic performance of a membrane bioreactor, Journal
of Membrane Science, Vol. 218, pp. 117-129
Le-Clech, P., Fane, A., Leslie, G., Childress, A. (2005) The operator’s perspective,
Filtration Separation, Vol. 42, pp. 20-23
Le-Clech, P., Chen, V., Fane, A. (2006) Fouling in membrane bioreactors used in
wastewater treatment (review), Journal of Membrane Science, Vol. 284, pp. 17-53
Lee, W., Kang, S., Shin, H. (2003) Sludge characteristics and their contribution for
microfiltration in submerged membrane bioreactors, Journal of Membrane Science, Vol.
216, pp. 217-227

The influence of sludge characteristics from full-scale MBR in membrane filterability
137
Lesjean, B., Rosenberger, S., Laabs, C., Jekel, M., Gnirss, R., Amy, G. (2005) Correlation
between membrane fouling and soluble/colloidal organic substances in membrane
bioreactors for municipal wastewater treatment, Water Science & Technology, Vol.51 pp.
1–8
Lesjean, B. and Huisjes, E. (2008) Survey of the European MBR market: trends and
perspectives, Desalination, Vol. 231, pp. 71-81
Liu, R., Huang, X., Wang, C., Chen, L., Qian, Y. (2000) Study on hydraulic characteristics
in a submerged membrane bioreactor process, Process Biochemistry, Vol. 36, pp. 249-254
Lojkine, H., Field, R., Howell, J. (1992) Crossflow microfiltration of cell suspensions: a
review of models with emphasis on particle size effects, Trans. Inst. Chem. Eng, Vol. 70,
pp149-164
Lousada-Ferreira, M., Geilvoet, S., Moreau, A., Atasoy, E., Krzeminiski, A., van
Nieuwenhuijzen, J., van de Graaf (2008) MLSS: Still a poorly understood parameter?, in:
International Conference on Membranes in drinking water production and wastewater
treatment, Toulouse, France.
Lowry, O.H., Rosebrough, N.J., Farr, A.L., Randall, R.J. (1951) Protein measurement with
the Folin phenol reagent, Journal of Biological Chemistry, Vol. 193, pp. 265-275
Lyko, S., Wintgens, T., Al-Halbouni, D., Baumgarten, S., Tacke, D., Drensla, K., Janot,
A., Dott, W., Pinnekamp, J., Melin, T. (2008) Long-term monitoring of a full-scale
municipal membrane bioreactor - Characterisation of foulants and operational
performance, Journal Membrane of Science, Vol. 317, pp. 78-87
Meng, F., Shi, B., Yang, F., Zhang, H. (2007a) New insights into membrane fouling in
submerged membrane bioreactor based on rheology and hydrodynamics concepts, Journal
of Membrane Science, Vol. 302, pp. 87-94

The influence of sludge characteristics from full-scale MBR in membrane filterability
138
Meng, F., Shi, B., Yang, F., Zhang, H. (2007b) Effect of hydraulic retention time on
membrane fouling and biomass characteristics in submerged membrane bioreactors,
Bioprocess and biosystems engineering, Vol. 30, pp. 359-367
Metcalf & Eddy (2003) Wastewater engineering: treatment and reuse (4th international
edition). McGraw-Hill, New York
Mulder, M. (1996) Basic principles of membrane technology, Kluwer Academic
Publishers, Dordrecht
Nagaoka, H., Ueda, S., Miya, A. (1996) Influence of bacterial extracellular polymers on
the membrane separation activated sludge process, Water Science and Technology, Vol.
34, pp. 165-172
Nagaoka, H. and Akoh, H. (2008) Decomposition of EPS on the membrane surface and its
influence on the fouling mechanism in MBRs, Desalination, Vol. 231, pp. 150-155
Nataraj, S., Schomäcker, R., Kraume, M., Mishra, I., Drews, A. (2008) Analyses of
polysaccharide fouling mechanisms during crossflow membrane filtration, Jornal of
Memebrane Science, Vol. 308, pp. 152-161
Poele, S. te (2005) Foulants in Ultrafiltration of wwtp effluent, PhD Thesis, Delft
University of Technology, Delft, The Netherlands
Rojas, M., Kaam, R., Schetrite, S., Albasi, C. (2005) Role and variations of supernatant
compounds in submerged membrane bioreactor fouling, Desalination, Vol. 179, pp. 95-
107
Rosenberger, S. and Kraume, M. (2002) Filterability of activated sludge in membrane
bioreactors, Desalination, Vol. 151, pp. 195-200
Rosenberger, S., Kubin, K., Kraume, M. (2002) Rheology of activated sludge in
Membrane Bioreactors, Engineering in Life Sciences, Vol. 2, pp. 269-275

The influence of sludge characteristics from full-scale MBR in membrane filterability
139
Rosenberger, S., Laabs, C., Lesjean, B., Gnirss, R., Amy, G., Jekel, M., Schrotter, J. (2006)
Impact of colloidal and soluble organic material on membrane performance in membrane
bioreactors for municipal wastewater treatment, Water Research, Vol. 40, pp. 710-720
Stephenson, T., Judd, S., Jefferson, B., Brindle, K. (2000) Membrane Bioreactors for
Wastewater Treatment, IWA Publishing, London
Seyssiecq, I., Ferrasse, J.-H., Roche, N. (2003) Sate-of-art: rheological characaterisation of
wastewater treatment sludge, Biochemical Engineering Journal, Vol. 16, pp. 41-56
Seyssiecq, I., Marrot, B., Djerroud, D., Roche, N. (2008) In situ triphasic rheological
characterisation of activated sludge, in an aerated bioreactor, Biochemical Engineering
Journal, Vol. 142, pp. 40-47
Wisniewski, C. and Grasmick, A. (1998) Particle size distribution in a membrane
bioreactor and consequences for membrane fouling, Colloids and Surfaces A:
Physicochemical and Engineering Aspects, Vol. 138, pp. 403–411
Wu, Z., Wang, Z., Zhou, Z., Yu, g., Gu, G. (2007) Sludge rheological and physiological
characteristics in a pilot-scale submerged membrane bioreactor, Desalination, Vol. 212,
pp. 152-164
Yamamoto, K., Hiasa, M., Mahmood, T., Matsuo, T. (1999) Direct solid–liquid separation
using hollow fiber membrane in an activated-sludge aeration tank, Water Science &
Technology, Vol. 21, pp. 43-54

The influence of sludge characteristics from full-scale MBR in membrane filterability
140
The influence of sludge characteristics from full-scale MBR in membrane filterability
141
APPENDICES

The influence of sludge characteristics from full-scale MBR in membrane filterability
142
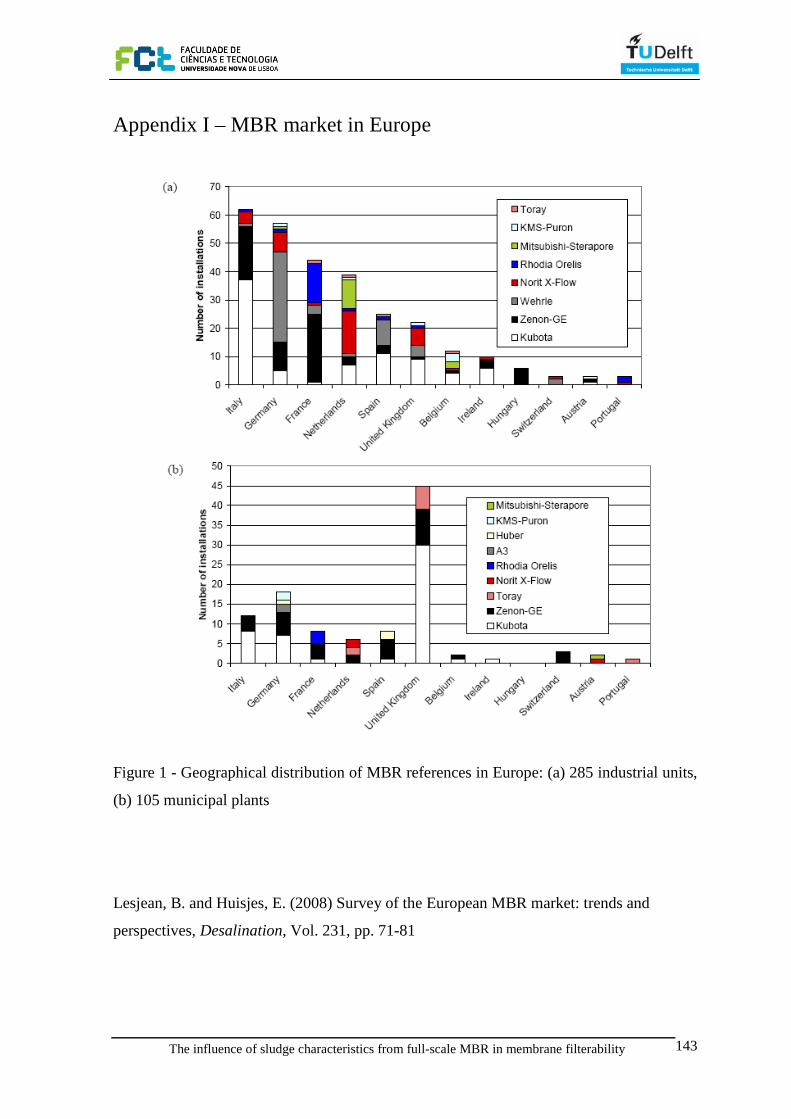
The influence of sludge characteristics from full-scale MBR in membrane filterability
143
Appendix I – MBR market in Europe
Figure 1 - Geographical distribution of MBR references in Europe: (a) 285 industrial units,
(b) 105 municipal plants
Lesjean, B. and Huisjes, E. (2008) Survey of the European MBR market: trends and
perspectives, Desalination, Vol. 231, pp. 71-81
The influence of sludge characteristics from full-scale MBR in membrane filterability
144

The influence of sludge characteristics from full-scale MBR in membrane filterability
145
Appendix II – Product details ultrafiltration membrane
Compact membrane
Duty UF
Membrane type F 5385
Membrane material Polyvinilidene fluoride
(PVDF)
Internal diameter [mm] 8.0
Clean water flux in module at 25oC [lm-2h-1 at 100 kPa] > 750
Pore size [µm] 0.03
Max. pressure [kPa] 500
Max. temperature [oC] 70
pH feed 2-10

The influence of sludge characteristics from full-scale MBR in membrane filterability
146

The influence of sludge characteristics from full-scale MBR in membrane filterability
147
Appendix III – Product details particle counter in range 2-100 µm

The influence of sludge characteristics from full-scale MBR in membrane filterability
148

The influence of sludge characteristics from full-scale MBR in membrane filterability
149
Appendix IV – Product details particle counter in range 0.4-5.0 µm

The influence of sludge characteristics from full-scale MBR in membrane filterability
150

The influence of sludge characteristics from full-scale MBR in membrane filterability
151
Appendix V – Product details Anton Paar rheometer

The influence of sludge characteristics from full-scale MBR in membrane filterability
152

The influence of sludge characteristics from full-scale MBR in membrane filterability
153
Appendix VI – Standard Methods for MLSS
2540 D. Total Suspended Solids Dried at 103–105°C
1. General Discussion
a. Principle: A well-mixed sample is filtered through a weighed standard glass-fiber filter
and the residue retained on the filter is dried to a constant weight at 103 to 105°C. The
increase in weight of the filter represents the total suspended solids. If the suspended
material clogs the filter and prolongs filtration, it may be necessary to increase the
diameter of the filter or decrease the sample volume. To obtain an estimate of total
suspended solids, calculate the difference between total dissolved solids and total solids.
b. Interferences: See Section 2540A.2 and Section 2540B.1. Exclude large floating
particles or submerged agglomerates of nonhomogeneous materials from the sample if it is
determined that their inclusion is not representative. Because excessive residue on the filter
may form a water-entrapping crust, limit the sample size to that yielding no more than 200
mg residue. For samples high in dissolved solids thoroughly wash the filter to ensure
removal of dissolved material. Prolonged filtration times resulting from filter clogging may
produce high results owing to increased colloidal materials captured on the clogged filter.
2. Apparatus
Apparatus listed in Section 2540B.2 and Section 2540C.2 is required, except for
evaporating dishes, steam bath, and 180°C drying oven. In addition:
Aluminum weighing dishes.
3. Procedure
a. Preparation of glass-fiber filter disk: If pre-prepared glass fiber filter disks are used,
eliminate this step. Insert disk with wrinkled side up in filtration apparatus. Apply vacuum
and wash disk with three successive 20-mL portions of reagent-grade water. Continue
suction to remove all traces of water, turn vacuum off, and discard washings. Remove filter
from filtration apparatus and transfer to an inert aluminum weighing dish. If a Gooch
crucible is used, remove crucible and filter combination. Dry in an oven at 103 to 105°C

The influence of sludge characteristics from full-scale MBR in membrane filterability
154
for 1 h. If volatile solids are to be measured, ignite at 550°C for 15 min in a muffle furnace.
Cool in desiccator to balance temperature and weigh. Repeat cycle of drying or igniting,
cooling, desiccating, and weighing until a constant weight is obtained or until weight
change is less than 4% of the previous weighing or 0.5 mg, whichever is less. Store in
desiccator until needed.
b. Selection of filter and sample sizes: Choose sample volume to yield between 2.5 and
200 mg dried residue. If volume filtered fails to meet minimum yield, increase sample
volume up to 1 L. If complete filtration takes more than 10 min, increase filter diameter or
decrease sample volume.
c. Sample analysis: Assemble filtering apparatus and filter and begin suction. Wet filter
with a small volume of reagent-grade water to seat it. Stir sample with a magnetic stirrer at
a speed to shear larger particles, if practical, to obtain a more uniform (preferably
homogeneous) particle size. Centrifugal force may separate particles by size and density,
resulting in poor precision when point of sample withdrawal is varied. While stirring, pipet
a measured volume onto the seated glass-fiber filter. For homogeneous samples, pipet from
the approximate midpoint of container but not in vortex. Choose a point both middepth and
midway between wall and vortex. Wash filter with three successive 10-mL volumes of
reagent-grade water, allowing complete drainage between washings, and continue suction
for about 3 min after filtration is complete. Samples with high dissolved solids may require
additional washings. Carefully remove filter from filtration apparatus and transfer to an
aluminum weighing dish as a support. Alternatively, remove the crucible and filter
combination from the crucible adapter if a Gooch crucible is used. Dry for at least 1 h at
103 to 105°C in an oven, cool in a desiccator to balance temperature, and weigh. Repeat
the cycle of drying, cooling, desiccating, and weighing until a constant weight is obtained
or until the weight change is less than 4% of the previous weight or 0.5 mg, whichever is
less. Analyze at least 10% of all samples in duplicate. Duplicate determinations should
agree within 5% of their average weight. If volatile solids are to be determined, treat the
residue according to 2540E.

The influence of sludge characteristics from full-scale MBR in membrane filterability
155
4. Calculation
5. Precision
The standard deviation was 5.2 mg/L (coefficient of variation 33%) at 15 mg/L, 24 mg/L
(10%) at 242 mg/L, and 13 mg/L (0.76%) at 1707 mg/L in studies by two analysts of four
sets of 10 determinations each. Single-laboratory duplicate analyses of 50 samples of water
and wastewater were made with a standard deviation of differences of 2.8 mg/L.
Clesceri, L., Greenberga, A., Eaton, A. (1998) Standard Methods for the Examination of
Water and Wastewater – 20th Edition, American Public Health Association

The influence of sludge characteristics from full-scale MBR in membrane filterability
156

The influence of sludge characteristics from full-scale MBR in membrane filterability
157
Appendix VII – Blanks Characterization experiments results
• Filtration characteristics - ∆R20, MLSS and Temperature
Figure 1 – MLSS vs. ∆R20 for all blanks
Figure 2 – Temperature vs. ∆R20 for all blanks
0,0
0,1
1,0
10,0
0 2 4 6 8 10 12 14 16 18 20
∆R
20(x
1012
m-1)
MLSS (g/L)
MLSS vs. Filterability according to sludge quality
Excellent Good Moderate Poor
0,0
0,1
1,0
10,0
6 8 10 12 14 16 18 20 22 24 26
∆R
20(x
1012
m-1
)
Temperature ( oC)
Temperature vs. Filterability
Excellent Good Moderate Poor

The influence of sludge characteristics from full-scale MBR in membrane filterability
158
• Particle counting in range 2-100 µm
Figure 3 – Particle number distribution in the range 2-100 µm
Figure 4 – Particle volume distribution in the range 2-100 µm
0,0E+00
2,0E+03
4,0E+03
6,0E+03
8,0E+03
1,0E+04
1,2E+04
1,4E+04
1,6E+04
1,8E+04
2,0E+04
0 10 20 30 40 50 60 70 80 90 100
Num
ber o
f par
ticle
s / m
L
Particle size (µm)
Particle number distribution (all blanks)
blank 5 blank 6 blank 7 blank 8 blank 9 blank 19 Blank 21 blank 22 Blank 23
0,0E+00
1,0E+05
2,0E+05
3,0E+05
4,0E+05
5,0E+05
0 10 20 30 40 50 60 70 80 90 100
Par
ticle
vol
ume
(ppb
)
Particle size (µm)
Particle volume distribution (all blanks)
blank 5 blank 6 blank 7 blank 8 blank 9 blank 19 blank 22 Blank 21 Blank 23

The influence of sludge characteristics from full
• Particle counting in range
Figure 5 – Particle
Figure 6 – Particle
1,00E+00
1,00E+07
0,4
Num
ber o
f par
ticle
s / m
L
blank 5
Blank 21
The influence of sludge characteristics from full-scale MBR in membrane filterability
Particle counting in range 0.4-1.0 µm
Particle number distribution in the range 0.4-5.0
Particle volume distribution in the range 0.4-5.0
0,5 0,6 0,7 0,8 0,9
Particle size (µm)
Particle number distribution (all blanks)
blank 6 blank 9 blank 19
blank 24 blank 25 blank 26
scale MBR in membrane filterability 159
5.0 µm
5.0 µm
1,0
blank 20
blank 27

The influence of sludge characteristics from full-scale MBR in membrane filterability
160
• Soluble Microbial Products
Figure 7 – Proteins vs. filterability
Figure 8 – Polysaccharides vs. filterability
0,01
0,1
1
10
0 5 10 15 20 25
∆R
20(x
1012
m-1
)
Free water Proteins (mg/L)
Proteins vs. ∆R20 (x1012m -1)
Excellent Good Moderate Poor
0,01
0,1
1
10
0 5 10 15 20 25
∆R
20(x
1012
m-1
)
Free water Polysaccharides (mg/L)
Polysaccharides vs. ∆R20 (x1012m -1)
Excellent Good Moderate Poor

The influence of sludge characteristics from full-scale MBR in membrane filterability
161
• Viscosity
Figure 9 – Rheogram for all blanks
Figure 10 – Apparent viscosity and shear rate
0
0,5
1
1,5
2
2,5
3
0 10 20 30 40 50 60 70 80 90 100 110
She
ar s
tres
s [P
a]
Shear rate [1/s]
Rheogram (all blanks)
blank 7 blank 8 blank 9 blank 19 blank 20 blank 22
blank 23 blank 24 blank 25 blank 26 blank 27
0,1
1
10
100
1000
1 10 100 1000
App
aren
t vi
scos
ity [
mP
a.s]
Shear rate [1/s]
Apparent viscosity vs shear rate (all blanks)
blank 7 blank 8 blank 9 blank 19 blank 20 blank 22
blank 23 blank 24 blank 25 blank 26 blank 27

The influence of sludge characteristics from full-scale MBR in membrane filterability
162
Table 1 – Apparent viscosity obtained from the rheometer measurements
Table 2 – Apparent viscosity obtained with Rosenverger´s formula
Table 3 – Apparent viscosity obtained with Laera´s formula
Shear Rate [s -1]blank 7 blank 8 blank 9 blank 19 blank 20 blank 22 blank 23 blank 24 blank 25 blank 26 blank 27
5 161.2 121.2 83.37 108.9 104.4 104.1 102.2 40.24 22.54 24.88 2610 99.17 76.3 54.73 71.39 69.53 66.16 64.76 27.52 15.88 17.24 18.2820 70.12 54.17 37.04 45.69 45.23 42.16 38.76 19.2 11.38 12.4 13.4730 54.19 42.6 28.8 34.5 34.24 31.91 28.3 15.42 9.18 10.06 11.1550 38.79 30.86 21.18 24.9 24.88 23.06 19.58 11.51 7.006 7.6 8.495
100 24.47 19.55 13.78 15.96 15.84 14.61 12.82 8.078 5.371 5.697 6.242
150 18.84 15.28 11.09 12.71 12.5 11.53 10.51 6.87 4.739 5.01 5.435
Viscosity [mPa·s]
Shear Rate [s -1]
blank 7 blank 8 blank 9 blank 19 blank 20 blank 22 blank 23 blank 24 blank 25 blank 26 blank 275 145.72 170.16 121.93 171.77 170.42 225.59 198.29 58.94 43.81 46.74 44.86
10 97.13 112.23 82.27 113.21 112.38 145.97 129.43 41.83 31.75 33.72 32.4620 64.74 74.02 55.51 74.62 74.11 94.45 84.48 29.69 23.01 24.33 23.4930 51.06 58.02 44.10 58.47 58.09 73.22 65.82 24.29 19.06 20.10 19.4450 37.87 42.69 33.00 43.01 42.74 53.13 48.07 18.87 15.04 15.80 15.31
100 25.24 28.16 22.26 28.35 28.19 34.38 31.37 13.39 10.90 11.40 11.08150 19.91 22.07 17.69 22.21 22.09 26.65 24.45 10.96 9.03 9.42 9.17
Viscosity [mPa·s]
Shear Rate [s -1]
blank 7 blank 8 blank 9 blank 19 blank 20 blank 22 blank 23 blank 24 blank 25 blank 26 blank 275 85.74 91.84 79.03 92.22 91.90 103.53 98.09 54.81 46.35 48.13 47.00
10 45.01 48.18 41.52 48.37 48.21 54.25 51.42 28.95 24.55 25.48 24.8920 24.65 26.35 22.77 26.45 26.36 29.61 28.09 16.01 13.65 14.15 13.8330 17.86 19.07 16.52 19.14 19.08 21.40 20.31 11.70 10.02 10.37 10.1550 12.43 13.25 11.52 13.30 13.26 14.82 14.09 8.26 7.11 7.35 7.20
100 8.35 8.88 7.77 8.91 8.89 9.90 9.42 5.67 4.93 5.09 4.99150 6.99 7.43 6.52 7.45 7.43 8.25 7.87 4.81 4.21 4.33 4.25
Viscosity [mPa·s]

The influence of sludge characteristics from full-scale MBR in membrane filterability
163
Appendix VIII – MBR systems configurations
Figure 1 – Heenvliet WWTP diagram (Brandão, 2008)
Figure 2 – Nordkanal WWTP configuration

The influence of sludge characteristics from full
164
Figure 3
Figure 4 – Varsseveld WWTP: 1
oxidation ditch; 4- Membrane tanks; 5
Brandão, D. (2008) Particle size distribution in the range of 2
MBR systems, Msc Thesis,
1
The influence of sludge characteristics from full-scale MBR in membrane filterabil
Figure 3 – Ootmarsum WWTP schematic diagram
Varsseveld WWTP: 1- Sewage water collection; 2- sand and oil trap; 3
Membrane tanks; 5- Machines room; 6- Sludge thickener; 7
storage
Particle size distribution in the range of 2-100 µm and filterability on
, Msc Thesis, Universidade Nova de Lisboa, Lisboa , Portugal
2
3
4
5
6
7
scale MBR in membrane filterability
sand and oil trap; 3-
Sludge thickener; 7 – Sludge
100 µm and filterability on
Lisboa , Portugal

The influence of sludge characteristics from full-scale MBR in membrane filterability
165
Appendix IX – Dilutions experiment results
• Filtration characteristics - ∆R20 and MLSS
Figure 1 – MLSS vs. ∆R20 for all sets
• Particle counting in range 2-100 µm
Particle number distribution by set
0,0
0,1
1,0
10,0
0 2 4 6 8 10 12 14 16 18 20
∆R
20(x
1012
m-1
)
MLSS (g/L)
MLSS vs. ∆R20
Set 1 Set 2 Set 3 Set 4 Set 5 Set 6
Set 7 Set 8 Set 9 Set 10 Set 11 Set 12
0,0E+00
5,0E+03
1,0E+04
1,5E+04
2,0E+04
0 20 40 60 80
Pa
rtic
le n
umbe
r /
10
0 m
L
Particle size (µm)
Particle number distributon - Set 1
Blank D10p D20p

The influence of sludge characteristics from full-scale MBR in membrane filterability
166
0,0E+00
5,0E+03
1,0E+04
1,5E+04
2,0E+04
0 20 40 60 80
Pa
rtic
le n
umbe
r /
10
0 m
L
Particle size (µm)
Particle number distributon - Set 7
Blank D10p D20p
0,0E+00
5,0E+03
1,0E+04
1,5E+04
2,0E+04
0 20 40 60 80
Pa
rtic
le n
um
ber
/ 1
00
mL
Particle size (µm)
Particle number distributon - Set 5
Blank D10p D20p
0,0E+00
5,0E+03
1,0E+04
1,5E+04
2,0E+04
0 20 40 60 80
Pa
rtic
le n
umbe
r /
10
0 m
L
Particle size (µm)
Particle number distributon - Set 4
Blank D10p D20p
0,0E+00
5,0E+03
1,0E+04
1,5E+04
2,0E+04
0 20 40 60 80
Pa
rtic
le n
um
ber
/ 1
00
mL
Particle size (µm)
Particle number distributon - Set 3
Blank D10p D20p
0,0E+00
5,0E+03
1,0E+04
1,5E+04
2,0E+04
2,5E+04
3,0E+04
0 20 40 60 80
Pa
rtic
le n
um
ber
/ 1
00
mL
Particle size (µm)
Particle number distributon - Set 8
Blank D10p D20p
0,0E+00
5,0E+03
1,0E+04
1,5E+04
2,0E+04
2,5E+04
3,0E+04
0 20 40 60 80
Pa
rtic
le n
umbe
r /
10
0 m
L
Particle size (µm)
Particle number distributon - Set 9
blank D10p D20p
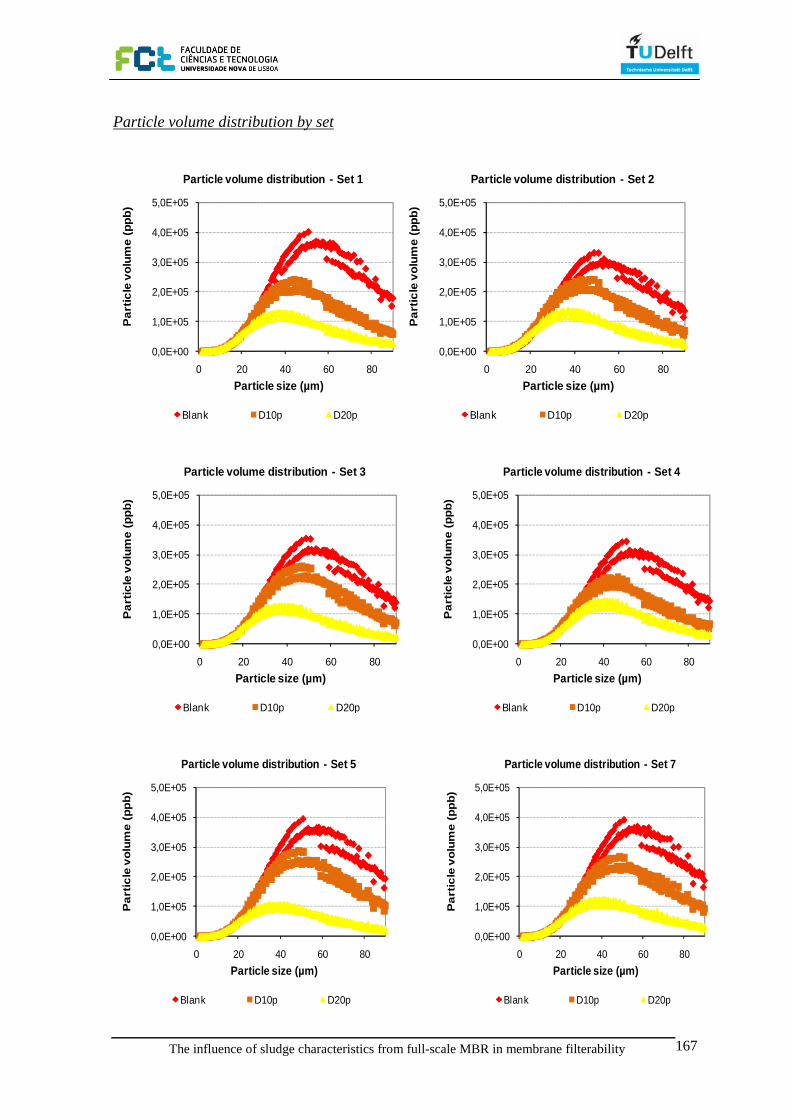
The influence of sludge characteristics from full-scale MBR in membrane filterability
167
Particle volume distribution by set
0,0E+00
1,0E+05
2,0E+05
3,0E+05
4,0E+05
5,0E+05
0 20 40 60 80
Pa
rtic
le v
olum
e (
ppb)
Particle size (µm)
Particle volume distribution - Set 1
Blank D10p D20p
0,0E+00
1,0E+05
2,0E+05
3,0E+05
4,0E+05
5,0E+05
0 20 40 60 80
Pa
rtic
le v
olum
e (
ppb)
Particle size (µm)
Particle volume distribution - Set 2
Blank D10p D20p
0,0E+00
1,0E+05
2,0E+05
3,0E+05
4,0E+05
5,0E+05
0 20 40 60 80
Pa
rtic
le v
olum
e (
ppb)
Particle size (µm)
Particle volume distribution - Set 3
Blank D10p D20p
0,0E+00
1,0E+05
2,0E+05
3,0E+05
4,0E+05
5,0E+05
0 20 40 60 80
Pa
rtic
le v
olum
e (
ppb)
Particle size (µm)
Particle volume distribution - Set 4
Blank D10p D20p
0,0E+00
1,0E+05
2,0E+05
3,0E+05
4,0E+05
5,0E+05
0 20 40 60 80
Pa
rtic
le v
olu
me
(pp
b)
Particle size (µm)
Particle volume distribution - Set 5
Blank D10p D20p
0,0E+00
1,0E+05
2,0E+05
3,0E+05
4,0E+05
5,0E+05
0 20 40 60 80
Pa
rtic
le v
olu
me
(pp
b)
Particle size (µm)
Particle volume distribution - Set 7
Blank D10p D20p

The influence of sludge characteristics from full-scale MBR in membrane filterability
168
0,0E+00
1,0E+05
2,0E+05
3,0E+05
4,0E+05
5,0E+05
0 20 40 60 80
Pa
rtic
le v
olum
e (
ppb)
Particle size (µm)
Particle volume distribution - Set 8
Blank D10p D20p
0,0E+00
1,0E+05
2,0E+05
3,0E+05
4,0E+05
5,0E+05
0 20 40 60 80
Pa
rtic
le v
olu
me
(pp
b)
Particle size (µm)
Particle volume distribution - Set 9
Blank D10p D20p

The influence of sludge characteristics from full-scale MBR in membrane filterability
169
• Particle counting in range 0.4-1.0 µm
Particle number distribution by set
0,0E+00
1,0E+06
2,0E+06
3,0E+06
4,0E+06
0,4 0,5 0,6 0,7 0,8 0,9 1,0
Pa
rtic
le n
um
be
r/ m
L
Particle size (µm)
Particle number distributon - Set 1
Blank D10p D20p
0,0E+00
1,0E+06
2,0E+06
3,0E+06
4,0E+06
0,4 0,5 0,6 0,7 0,8 0,9 1,0
Pa
rtic
le n
umbe
r/ m
L
Particle size (µm)
Particle number distributon - Set 2
Blank D10p D20p
0,0E+00
1,0E+06
2,0E+06
3,0E+06
4,0E+06
0,4 0,5 0,6 0,7 0,8 0,9 1,0
Pa
rtic
le n
umbe
r/ m
L
Particle size (µm)
Particle number distributon - Set 3
Blank D10p D20p
0,0E+00
1,0E+06
2,0E+06
3,0E+06
4,0E+06
0,4 0,5 0,6 0,7 0,8 0,9 1,0
Pa
rtic
le n
umbe
r/ m
LParticle size (µm)
Particle number distributon - Set 4
Blank D10p D20p
0,0E+00
1,0E+06
2,0E+06
3,0E+06
4,0E+06
0,4 0,5 0,6 0,7 0,8 0,9 1,0
Pa
rtic
le n
um
be
r/ m
L
Particle size (µm)
Particle number distributon - Set 5
Blank D10p D20p
0,0E+00
1,0E+06
2,0E+06
3,0E+06
4,0E+06
0,4 0,5 0,6 0,7 0,8 0,9 1,0
Pa
rtic
le n
um
be
r/ m
L
Particle size (µm)
Particle number distributon - Set 6
Blank D10p D20p

The influence of sludge characteristics from full-scale MBR in membrane filterability
170
0,0E+00
2,0E+06
4,0E+06
6,0E+06
8,0E+06
1,0E+07
0,4 0,5 0,6 0,7 0,8 0,9 1,0
Pa
rtic
le n
umbe
r/ m
L
Particle size (µm)
Particle number distributon - Set 7
Blank D10p D20p
0,0E+00
1,0E+06
2,0E+06
3,0E+06
4,0E+06
5,0E+06
0,4 0,5 0,6 0,7 0,8 0,9 1,0
Pa
rtic
le n
umbe
r/ m
L
Particle size (µm)
Particle number distributon - Set 10
Blank D10p D20p
0,0E+00
5,0E+06
1,0E+07
1,5E+07
0,4 0,5 0,6 0,7 0,8 0,9 1,0
Pa
rtic
le n
umbe
r/ m
L
Particle size (µm)
Particle number distributon - Set 11
Blank D10p D20p
0,0E+00
5,0E+06
1,0E+07
1,5E+07
0,4 0,5 0,6 0,7 0,8 0,9 1,0
Pa
rtic
le n
umbe
r/ m
L
Particle size (µm)
Particle number distributon - Set 12
Blank D10p D20p

The influence of sludge characteristics from full-scale MBR in membrane filterability
171
Particle volume distribution by set
0,0E+00
5,0E+01
1,0E+02
1,5E+02
2,0E+02
0,4 0,5 0,6 0,7 0,8 0,9 1,0
Pa
rtic
le v
olum
e (
ppb)
Particle size (µm)
Particle volume distributon - Set 1
Blank D10p D20p
0,0E+00
2,5E+01
5,0E+01
7,5E+01
1,0E+02
0,4 0,5 0,6 0,7 0,8 0,9 1,0
Pa
rtic
le v
olum
e (p
pb)
Particle size (µm)
Particle volume distributon - Set 2
Blank D10p D20p
0,0E+00
2,5E+01
5,0E+01
7,5E+01
1,0E+02
0,4 0,5 0,6 0,7 0,8 0,9 1,0
Pa
rtic
le v
olum
e (
ppb)
Particle size (µm)
Particle volume distributon - Set 3
Blank D10p D20p
0,0E+00
2,5E+01
5,0E+01
7,5E+01
1,0E+02
0,4 0,5 0,6 0,7 0,8 0,9 1,0
Pa
rtic
le v
olum
e (
ppb)
Particle size (µm)
Particle volume distributon - Set 4
Blank D10p D20p
0,0E+00
2,5E+01
5,0E+01
7,5E+01
1,0E+02
0,4 0,5 0,6 0,7 0,8 0,9 1,0
Pa
rtic
le v
olum
e (
ppb)
Particle size (µm)
Particle volume distributon - Set 5
Blank D10p D20p
0,0E+00
2,5E+01
5,0E+01
7,5E+01
1,0E+02
0,4 0,5 0,6 0,7 0,8 0,9 1,0
Pa
rtic
le v
olum
e (
ppb)
Particle size (µm)
Particle volume distributon - Set 6
Blank D10p D20p

The influence of sludge characteristics from full-scale MBR in membrane filterability
172
0,0E+00
1,0E+02
2,0E+02
3,0E+02
4,0E+02
5,0E+02
0,4 0,5 0,6 0,7 0,8 0,9 1,0
Pa
rtic
le v
olum
e (
ppb)
Particle size (µm)
Particle volume distributon - Set 7
Blank D10p D20p
0,0E+00
5,0E+01
1,0E+02
1,5E+02
2,0E+02
2,5E+02
0,4 0,5 0,6 0,7 0,8 0,9 1,0
Pa
rtic
le v
olu
me
(pp
b)
Particle size (µm)
Particle volume distributon - Set 10
Blank D10p D20p
0,0E+00
2,0E+02
4,0E+02
6,0E+02
8,0E+02
1,0E+03
0,4 0,5 0,6 0,7 0,8 0,9 1,0
Pa
rtic
le v
olum
e (
ppb)
Particle size (µm)
Particle volume distributon - Set 11
Blank D10p D20p
0,0E+00
2,0E+02
4,0E+02
6,0E+02
8,0E+02
1,0E+03
0,4 0,5 0,6 0,7 0,8 0,9 1,0
Pa
rtic
le v
olum
e (
ppb)
Particle size (µm)
Particle volume distributon - Set 12
Blank D10p D20p

The influence of sludge characteristics from full-scale MBR in membrane filterability
173
• Soluble Microbial Products
Figure 1 – Polysaccharides concentration and ∆R20 alog the sets
Figure 2 – Proteins concentration and ∆R20 alog the sets
0
1
2
3
4
5
0
5
10
15
20
25
Set 3
Set 5
Set 6
Set 7
Set 11
Set 12
∆R
20(x
1012
m-1
)
Pol
ysac
char
ides
(m
g/L)
Polysaccharides concentration and ∆R20 by set
ΔR20
0
1
2
3
4
5
0
5
10
15
20
25
Set 3 Set 5 Set 6 Set 7 Set 11 Set 12
∆R
20(x
1012
m-1
)
Pro
tein
s (m
g/L)
Proteins concentration and ∆R20 by set
ΔR20
Blank D10p D20p
Blank D10p D20p

The influence of sludge characteristics from full-scale MBR in membrane filterability
174
• Viscosity
Figure 1 – Shear rate vs. Apparent viscosity for D10p
Figure 2 – Shear rate vs. Apparent viscosity for D20p
1
10
100
1 10 100 1000
Ap
pa
ren
t v
isco
sity
[m
Pa
.s]
Shear rate [s-1]
Shear rate vs. apparent viscosity for D10p (T=20 ±1oC)
D10p (12.3 g/L) D10p (10.4 g/L) D10p (9.2 g/L)
D10p (8.5 g/L) D10p (7.3 g/L) D10p (6.5 g/L)
D10p (6.0 g/L) D10p (5.9 g/L)
1
10
100
1 10 100 1000
Ap
pa
ren
t v
isco
sity
[m
Pa
.s]
Shear rate [s-1]
Shear rate vs. apparent viscosity for D20p (T=20 ±1oC)
D20p (5.3 g/L) D20p (4.6 g/L) D20p (4.2 g/L)
D20p (4.2 g/L) D20p (3.7 g/L) D20p (2.6 g/L)
D20p (2.2 g/L) D20p (2.0 g/L)

The influence of sludge characteristics from full-scale MBR in membrane filterability
175
Appendix X – Solids Concentration experiment results
• Filtration characteristics - ∆R20 and MLSS
Figure 1 – MLSS and ∆R20 along time in 20-01-09
Figure 2 – MLSS and ∆R20 along time in 22-01-09
0
5
10
15
20
0,0
0,2
0,4
0,6
0,8
9:36 10:15 10:47 11:24 11:55
ML
SS
(g
/L
)
∆R
20(x
1012
m-1
)
Time (hh:mm)
Solids concentration experiment (20-01-09)
∆R20 MLSS
0
5
10
15
20
0,0
0,2
0,4
0,6
0,8
9:54 10:21 10:48 11:15 11:46 12:18 12:50
MLS
S (g
/L)
∆R
20(x
1012
m-1
)
Time (hh:mm)
Solids concentration experiment (22-01-09)
∆R20 MLSS

The influence of sludge characteristics from full-scale MBR in membrane filterability
176
• Particle counting in range 2-100 µm
Particle number distribution
Figure 1 – Particle number distribution in 20-01-09
Figure 2 – Particle number distribution in 22-01-09
0,0E+00
2,0E+03
4,0E+03
6,0E+03
8,0E+03
1,0E+04
1,2E+04
1,4E+04
1,6E+04
0 20 40 60 80 100
Par
ticle
num
ber /
100
mL
Particle size (µm)
Particle number distribution (20-01-09)
Blank 1a Blank 2a Blank 3a Blank 4a Blank 5a
0,0E+00
2,0E+03
4,0E+03
6,0E+03
8,0E+03
1,0E+04
1,2E+04
1,4E+04
1,6E+04
0 20 40 60 80 100
Par
ticle
num
ber /
100
mL
Particle size (µm)
Particle number distribution (22-01-09)
Blank 1b Blank 2b Blank 3b Blank 4b Blank 5b Blank 6b Blank 7b

The influence of sludge characteristics from full-scale MBR in membrane filterability
177
Particle volume distribution
Figure 3 – Particle volume distribution in 20-01-09
Figure 4 – Particle volume distribution in 22-01-09
0,0E+00
5,0E+04
1,0E+05
1,5E+05
2,0E+05
2,5E+05
3,0E+05
3,5E+05
4,0E+05
4,5E+05
0 20 40 60 80 100
Par
ticle
vol
ume
(ppb
)
Particle size (µm)
Particle volume distribution (20-01-09)
Blank 1a Blank 2a Blank 3a Blank 4a Blank 5a
0,0E+00
5,0E+04
1,0E+05
1,5E+05
2,0E+05
2,5E+05
3,0E+05
3,5E+05
4,0E+05
0 20 40 60 80 100
Par
ticle
vol
ume
(ppb
)
Particle size (µm)
Particle number distribution (22-01-09)
Blank 1b Blank 2b Blank 3b Blank 4b Blank 5b Blank 6b Blank 7b

The influence of sludge characteristics from full-scale MBR in membrane filterability
178
Viscosity
Figure 1 – Shear rate vs. apparent viscosity in 20-01-09
Figure 2 – Shear rate vs. apparent viscosity in 22-01-09
10
100
1000
1 10 100 1000
Appa
rent
vis
cosi
ty [
mP
a.s]
Shear rate [1/s]
Apparent viscosity vs shear rate (20-01-09)
Blank 1a (MLSS=14,3 g/L) Blank 2a (MLSS=15,1 g/L)
Blank 3a (MLSS=16,0 g/L) Blank 4a (MLSS=17,2 g/L)
Blank 5a (MLSS=17,5 g/L)
10
100
1000
1 10 100 1000
Appa
rent
vis
cosi
ty [
mP
a.s]
Shear rate [1/s]
Apparent viscosity vs shear rate (22-01-09)
Blank 1b (MLSS=15,2 g/L) Blank 2b (MLSS=14,9 g/L)
Blank 4b (MLSS=16,2 g/L) Blank 5b (MLSS=16,3 g/L)
Blank 6b (MLSS=16,5 g/L) Blank 7b (MLSS=18,2 g/L)