Embed Size (px)
Citation preview

1
THE INFLUENCE OF ROOM REFLECTIONS ON SUBWOOFER REPRODUCTION IN A SMALL ROOM: BINAURAL INTERACTIONS PREDICT PERCEIVED LATERAL ANGLE OF PERCUSSIVE LOW-
FREQUENCY MUSICAL TONES
David Spargo1, William L. Martens2, and Densil Cabrera3
1Faculty of Architecture, Design and Planning The University of Sydney, NSW 2006, Australia
1Email: [email protected] 2Email: [email protected]
3Email: [email protected] Abstract In free field listening, interaural differences provide auditory information that enable listeners to identify the lateral angle of sound sources very accurately. When listening in rooms, however, performance is greatly reduced by the presence of room reflections, particularly for sources containing energy primarily at low frequencies. Within the frequency band of speech signals, the influence of room reflections on directional hearing has been well established; however, less is known about the influence of room reflections on low-frequency directional hearing. Headphone-displayed binaural simulation of subwoofers located at 17 positions in a small reverberant room were prepared by convolving a dry source with binaural room impulse response measurements made using a Head and Torso Simulator (HATS). In an identification task using percussive low-frequency musical tones as sound sources, perceived lateral angles of these sources were reported by 10 listeners, for comparison with the actual subwoofer angles. The peak in the interaural cross correlation function of the binaural stimuli predicted observed lateral angle judgement data much better than did the actual subwoofer angles. A multivariate regression analysis revealed that including interaural coherence (IC) as an additional predictor of lateralisation judgements improved the amount of variance for which the regression model could account, suggesting that IC effectively modulated a listener’s ability to utilise interaural time difference (ITD) cues.
1. Introduction
There is a general held belief that when subwoofers are used as part of a listening room sound reproduction systems, the spectral region below 300 Hz contains no perceivable directional information, and that in terms of the of low-frequency source localisation, the positioning of the subwoofer is arbitrary [1], [2]. Nevertheless, it has been shown that some localization ability exists in the low frequency range, at least in acoustically dry conditions [3], [4] (where ‘dry’ refers to an absence of room reflections). In rooms, sound arriving at the two ears includes complex combinations of direct sound, reflections and room modes that create large differences between the signals arriving at each ear. This has a considerable effect on the auditory perception of low-frequency source location, which is conceptually distinct from veridical localization. Generally, studies on sound source localisation focus on statistical measures of the differences

2
between the signals at the two ears. At low frequencies listeners are known to be sensitive to interaural differences in the fine structure of signals reaching the ears [5], [6]. These differences include interaural level difference (ILD) and interaural time difference (ITD). However, at frequencies below ≈ 700 Hz listeners are more sensitive to ITD than to ILD [7]. In the free field (which is the context of much spatial hearing research), large ILDs do not occur in the low frequency range, except for lateral sources close to the head. In more recent work specifically investigating low-frequency localisation in sound reproduction systems, researchers are reporting listeners can localise source locations and that ITD is a principal perceptual cue [8], [9]. The similarity between the two signals at the ears also contains useful information in the form of Interaural coherence (IC). IC is expressed as the peak of the binaural cross-correlation function, the lag time of which (τ) corresponds to the ITD. This is further explained in section 2.5.
In the present study we evaluate the efficacy of using both ITD and IC as predictors of perceived sound source lateral angle to test the hypotheses that: 1) The perceived lateral source lateral angle depends on more than one attribute. 2) The combination of several binaural attributes predict the perceived source lateral angle of percussive low-frequency musical tones better than the actual lateral angle of the subwoofer reproducing those tones.
2. Method
This study was conducted in two parts: Objective physical measurement of a subwoofer in a moderately reverberant room, and a subjective perceptual experiment consisting of lateral angle judgments (via matching).
2.1 Measurements of Subwoofer in Room
The physical measurements were conducted in the Spatial Audio Lab at McGill University’s Centre for Interdisciplinary Research in Music Media and Technology (CIRMMT). The room has dimensions of: length 6.4 m, width 5.4 m, height 3.8 m and a volume of 130m3. It is fitted internally with modular acoustic absorption throughout resulting in a consistent reverberation time of 0.12 s from 20 kHz down to 250 Hz, then rising to a peak of 0.35 s at 80 Hz. A single subwoofer was moved in steps of 15 cm along the front wall of the room, beginning with the centre position (0 cm) and ending at a position close to the front corner of the room (240 cm), 17 positions in total. A Brüel & Kjær head and torso simulator (HATS) Type 4100 was mounted on a chair with its ears at the seated listening height of 1.2 m and centred between the sidewalls and 2.5 m back from the front wall.
Steady-state sinusoidal test signals (stepped sine) were presented to the subwoofer using an Audio Precision, System 2700, 2-channel audio analyser. Sound pressure level (SPL) was measured at the two ears of the HATS at low frequencies, ranging from 50 to 300 Hz, also with the Audio Precision System 2700 analyser. From these measurements, ILDs and IPDs were calculated for every subwoofer position.
In addition, binaural recordings, also made using the HATS, of a system stimulus (described below) reproduced by the subwoofer at each of the 17 subwoofer position were also made. These were recorded digitally at 44.1 kHz sample rate, 16 bit. By deconvolving the dry system stimulus with the recordings in MATLAB, binaural room impulse responses (BRIRs) for each subwoofer location were derived. Creating BRIRs from the original dry test signal removed potential distortions and noise contributed by the reproduction system. The BRIRs were then convolved with the dry system stimulus to derive the binaural stimuli used in the listening experiment.
2.2 System Stimulus
For the experiment to be ecologically valid (representative of a typical sound reproduction scenario), a low frequency musical signal stimulus was required. The signal chosen was a synthetic plucked bass guitar note. This particular signal was chosen because it was spectrally dense and had a strong initial attack. The signal was generated in MATLAB by combining 5 exponentially decaying harmonic

3
sinusoidal waves of various frequencies resulting in the signal shown in figure 1. The stimulus has spectral components from 100 Hz to 300 Hz, which covered the spectrum of interest and matched the subwoofer’s ability to reproduce sound in this range. The stimulus was generated at 44.1 kHz sample rate and 16 bit.
Figure 1. Synthetic bass signal. Upper panel: waveform. Lower panel: Spectrum.
2.3 Perceptual Measurements
In this study we are measuring listeners’ ability to perceive the lateral angle of the auditory image associated with the reproduced sound of a subwoofer in a room. The study uses a headphone-displayed binaural simulation of a low frequency stimulus reproduced through a subwoofer in a room located at various lateral angles.
Binaural signals are presented to the ears via headphones to measure listeners’ sensitivity to ITD cues of the low-frequency musical sound source in a typical standard listening room. ITD was chosen as the controlled variable since the variation in measured broadband ILD was less than 0.4 dB and so could be discounted as a localisation cue. Previous studies have also shown that ILD remains essentially constant at low frequencies regardless of azimuth position [10], [8] and so may be discounted as a perceptual variable in this case.
2.4 Experiment: Lateral Angle Judgments (via Matching)
Listeners were presented with a set of 68 stimulus-pair trials, i.e., four trials each of the 17 randomly selected subwoofer positions recorded. The stimulus-pairs consist of a target and a moveable pointer. The target stimulus was a simulation of the real room system, constructed by convolving the dry stimulus signal with the BRIR for a particular subwoofer position. The pointer stimulus begins as a diotic version of the dry stimulus, identical in each ear when presented, with no ITD. Using a simple keyboard user interface the, subjects could adjust the apparent lateral angle of the dry pointer stimulus to match the apparent lateral angle of the binaurally presented target stimulus. This was done by adjusting the ITD by offsetting in time one channel from the other. The initial adjustment is coarse in steps of 10 samples of delay offset (0.2268 ms at 44.4 kHz) then, once the pointer is close to the target lateral angle, fine adjustments in 1 sample of delay offset (0.02268 ms at 44.1 kHz) steps are made.
Time Sec0 0.1 0.2 0.3 0.4 0.5
Ampl
itude
-0.4
-0.2
0
0.2
0.4
0.6
0.8 Signal Waveform
Frequency Hz50 102 200 300 400 500
Mag
nitu
de d
B
-10
0
10
20
30
40 Signal Spectrum

4
The ITD value set by the listener for each of the matching trials was recorded along with the ITD of the target. A total of eight subjects participated in the ITD matching experiment.
2.5 Predictors
Several potential predictors were considered, ITD waveform coherence and ITD envelope coherence. ITD was an obvious choice, since it was a variable of significance identified in the literature and was the variable manipulated in the listening experiment. The results of a thorough examination of the variance between accepted methods for the calculation of ITD is reported in Katz, et al [11], which does not presume the existence of a “correct” value, but notes the differences that result when using various methods. The first family of methods identified in Katz, et al [11] constitute the more classic approach that attempts to establish the ITD by comparing the time of arrival in the left and right ear signals, as exemplified in the work of Kuhn [12]. Methods of this sort were not employed in the current study. Rather than examining inter aural differences in times of arrival, two approaches were compared here that were from the family of methods focusing upon the time difference associated with the cross-correlation between the left and right ear signals (i.e., the temporal moment of maximum coherence). The first of the two approaches used the maximum of the cross-correlation of the binaural impulse responses (the HRIR pair), as was done by Kistler and Wightman [13]. The second of the two approaches used the maximum cross-correlation calculated on the energy envelopes, as was done by Middlebrooks and Green [14].
Interaural waveform coherence 𝛾" 𝜏 is a statistical measure of the similarity of the signals at the two ears. It is derived from the interaural cross-correlation function, 𝛾 𝜏 calculated as a function of the time lag 𝜏 between the two signals, 𝛾" $ = &
'( )*)+𝑑𝑡𝑥/ 𝑡 𝑥0 𝑡 + 𝜏
'23 (1)
where 𝑥0 𝑡 is the left ear signal and 𝑥/ 𝑡 the right ear signal and 𝑃 is the average power of the signal. The coherence is the height of the peak of where a maximum value of 1 indicates complete coherence and a minimum value of 0 indicates complete incoherence. The ITD is given by the value of 𝛿 where the peak occurs.
The envelope coherence 𝛾6 𝜏 the same as the wave coherence except that the signal waveforms 𝑥 are replaced with the signal envelopes, 𝐸,
𝛾6 $ = &
'( )8,*)8,+𝑑𝑡𝐸/ 𝑡 𝐸0 𝑡 + 𝜏
'23 . (2)
The signal envelope is calculated from the Hilbert transform, 𝐻, of the signal, 𝐸(𝑡) = |𝑥(𝑡) + 𝐻{𝑥(𝑡)}|. (3) 3. Results and discussion
Figure 2 shows the results obtained for two of the eight listeners who participated in the listening experiment as examples. The ordinate in each graph shows the mean of four ITD values set by listeners when they were asked to adjust the apparent lateral angle of a variable pointer stimulus so that it would match the apparent lateral angle of each of 17 binaural target stimuli. The standard deviation of the four settings is shown at each subwoofer position, revealing that settings for lateral positions nearest front-wall centre (the 0-meter point) were less variable than those at the more extreme positions, at least for these two listeners. What is noteworthy is that apparent lateral, as indicated by the ITD set for the pointer stimulus, does not grow monotonically with increasing lateral position of the subwoofer. Rather, both listeners show a similar pattern of increase and then decrease within the first meter of position offsets from the centre. Finally, both graphs show an increase in apparent lateral again as the subwoofer was positioned closer and closer to the side wall of the room. Although not all

5
listeners used the full range of ITD values available to them during the adjustment task, all showed a similar pattern of change over subwoofer lateral position. The grand mean ITD values over all eight listeners are shown in Figure 3.
Figure 2. Right Panel: Mean Interaural Time Difference (in milliseconds) plotted as a function of the lateral positions (in meters) of the 17 subwoofer stimuli for one listener. The filled circles plot the mean ITD value of the pointer stimulus set by that one listener in order to match the lateral angle of that pointer stimulus to the apparent lateral angle of each test stimulus. The solid vertical lines show
the extent of the standard deviation above and below each mean ITD value, and the dashed lines connect these extreme values across subwoofer lateral positions.
Left Panel: Mean Interaural Time Difference set by a second listener, plotted just as in the upper panel for the first listener.
Figure 3. Interaural Time Difference (in milliseconds) plotted as a function of the lateral positions (in meters) of the 17 subwoofer stimuli from three perspectives: The filled circles (connected with dashed lines) plot the mean ITD value for the variable pointer stimulus that was set by 8 listeners in reporting the apparent lateral angle of the test stimulus. The open circles (blue online) plot the waveform ITD
for the test stimuli, and the filled diamonds (red online) plot the envelope ITD for the test stimuli. The additional two curves plotted at the top of the graph show the peak coherence values calculated for the
waveforms and envelopes of the 17 binaural test stimuli, using open circles and filled diamonds, respectively.
The filled circles connected with dashed lines in Figure 3 show the combined mean results for all eight listeners who participated in the listening experiment. The graph also shows a number of potential predictors for the obtained ITD matching data that were calculated for each of the 17 binaural stimuli presented to those listeners. The two curves plotted using open circles show the results of two calculations based upon the waveform analysis, while the two curves plotted using filled diamonds show calculations based upon the envelope analysis. In order to determine which of these four predictors fits the obtained data best, a stepwise regression analysis was performed using Matlab’s [N] graphical user interface called ‘stepwise’ to determine the optimal combination of predictive terms

6
(see Draper and Smith [15] for more details). Potential predictors of the obtained data included lateral position of the subwoofer, and the two ITD envelope-based parameters (calculated from the peak in the envelope cross-correlation for the binaural signals). All three of these predictors produced a very low R2 value in linear regression. The best single predictor of the outcome (which was the mean matching ITD values from 8 listeners) was the lag at which the cross-correlation between binaural waveforms reached its maximum (termed here the waveform ITD).
Figure 4. Left Panel: Mean Interaural Time Difference (filled circles, connected by the dashed lines) plotted as a function of the lateral positions (in meters) of the 17 subwoofer stimuli. The solid curve without plotting symbols (blue online) shows the outcome as predicted by waveform ITD (for which
regression the resulting coefficient of determination R2 is shown). Right Panel: The same Mean Interaural Time Difference values (filled circles) plotted as a function of
the lateral positions. The solid curve without plotting symbols (magenta online) shows the fit to the data of a regression model based upon both waveform ITD and the peak coherence values calculated
for the waveforms for each of the 17 subwoofer stimuli (again coefficient of determination R2
indicating the regression goodness of fit).
The regression model’s goodness of fit with waveform ITD as a predictor is illustrated in the left panel of Figure 4, for which a relatively high R2 statistic was found. However, when a second predictor was added to the regression model, the R2 value increased from 0.56 to 0.85, and the fit was visibly improved, as can be seen in the right panel of Figure 4. The multivariate predictor on the abscissa more fully spans the range of obtained mean matching ITD. Of course, the goodness of fit should be compared by examining the regression residuals, as well as the R2 values resulting from the regression. The residuals, which are calculated by subtracting the values predicted by the regression from the obtained data values being estimated, will show some structure if the model provides a poor fit. Figure 4 plots the regression residuals for the two cases that are compared in Figure 3.
The left panel of Figure 5 shows little evidence of non-random structure in the residuals calculated for the regression on waveform ITD. The right panel shows the residuals calculated for the multivariate regression results that included waveform coherence value as well as waveform ITD in the prediction equation. The substantial reduction in Mean Square Error (MSE) from 0.015 to 0.006 documents how much the fit improved when the second term was added. Interestingly, the MSE calculated for waveform ITD was not so different from that which resulted when the lateral position of the subwoofer was submitted as the sole predictor of the obtained data; however, the residuals in this later case showed systematic structure due to the non-monotonic relation between position and matching ITD (which is clearly apparent in Figures 2 though 4). From an examination of the regression residuals, the R2 values, and the MSE values, it can be concluded that the regression model provides only an adequate fit when based upon a single predictor, the lag at which the cross-correlation between binaural signals reaches its maximum (i.e., waveform ITD alone); however, the model provides a much better fit when the maximum value reached at the lag value is also included as a second predictor.
7
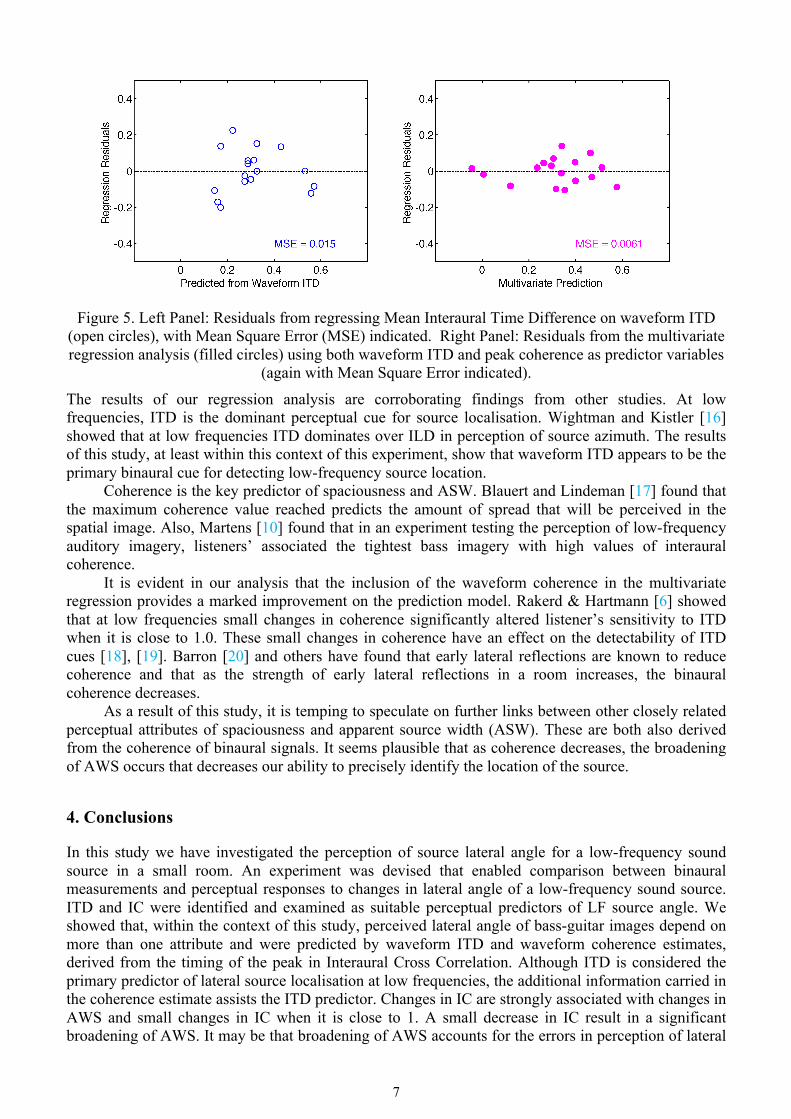
Figure 5. Left Panel: Residuals from regressing Mean Interaural Time Difference on waveform ITD (open circles), with Mean Square Error (MSE) indicated. Right Panel: Residuals from the multivariate regression analysis (filled circles) using both waveform ITD and peak coherence as predictor variables
(again with Mean Square Error indicated).
The results of our regression analysis are corroborating findings from other studies. At low frequencies, ITD is the dominant perceptual cue for source localisation. Wightman and Kistler [16] showed that at low frequencies ITD dominates over ILD in perception of source azimuth. The results of this study, at least within this context of this experiment, show that waveform ITD appears to be the primary binaural cue for detecting low-frequency source location.
Coherence is the key predictor of spaciousness and ASW. Blauert and Lindeman [17] found that the maximum coherence value reached predicts the amount of spread that will be perceived in the spatial image. Also, Martens [10] found that in an experiment testing the perception of low-frequency auditory imagery, listeners’ associated the tightest bass imagery with high values of interaural coherence.
It is evident in our analysis that the inclusion of the waveform coherence in the multivariate regression provides a marked improvement on the prediction model. Rakerd & Hartmann [6] showed that at low frequencies small changes in coherence significantly altered listener’s sensitivity to ITD when it is close to 1.0. These small changes in coherence have an effect on the detectability of ITD cues [18], [19]. Barron [20] and others have found that early lateral reflections are known to reduce coherence and that as the strength of early lateral reflections in a room increases, the binaural coherence decreases.
As a result of this study, it is temping to speculate on further links between other closely related perceptual attributes of spaciousness and apparent source width (ASW). These are both also derived from the coherence of binaural signals. It seems plausible that as coherence decreases, the broadening of AWS occurs that decreases our ability to precisely identify the location of the source.
4. Conclusions
In this study we have investigated the perception of source lateral angle for a low-frequency sound source in a small room. An experiment was devised that enabled comparison between binaural measurements and perceptual responses to changes in lateral angle of a low-frequency sound source. ITD and IC were identified and examined as suitable perceptual predictors of LF source angle. We showed that, within the context of this study, perceived lateral angle of bass-guitar images depend on more than one attribute and were predicted by waveform ITD and waveform coherence estimates, derived from the timing of the peak in Interaural Cross Correlation. Although ITD is considered the primary predictor of lateral source localisation at low frequencies, the additional information carried in the coherence estimate assists the ITD predictor. Changes in IC are strongly associated with changes in AWS and small changes in IC when it is close to 1. A small decrease in IC result in a significant broadening of AWS. It may be that broadening of AWS accounts for the errors in perception of lateral

8
source angle. It is possible that the lateral localisation shifts that occur in small rooms may be explained by a
combination of comb filtering and associated phase shifts from single lateral reflections from the sidewall [20]. Continuing work in reconciling these results with room modelling along these lines has shown excellent results.
Acknowledgements
This work was supported by the Centre for Interdisciplinary Research in Music Media and Technology (CIRMMT), located within at the Schulich School of Music at McGill University. Special Thanks are due to Kensuke Irie for his assistance in running the listening experiment at McGill University.
References
[1] Borenius, J. “Perceptibility of direction and time delay errors in subwoofer reproduction”, 79th Audio Eng. Soc. Conv., New York, USA
[2] Thiele, G. and Kügler, C. “Loudspeaker Reproduction: Study on the Subwoofer Concept”, Audio Engineering Society Convention 92, 1992.
[3] Cabrera, D., Ferguson, S. and Subkey, A. “Localization and Image Size Effects for Low Frequency Sound”, Audio Engineering Society Convention 118, 2005.
[4] Irfan, M., Mohamed, J. and Cabrera, D. “Human Sensitivity to Interaural Phase Difference for Very Low Frequency Sound”, Acoustics 2008, Australian Acoustical Society, Geelong, Victoria, Australia, pp. 1–6, 2008.
[5] Aaronson, N.L. and Hartmann, W.M. “Interaural coherence for noise bands: Waveforms and envelopes”, The Journal of the Acoustical Society of America. 127, 3, 1367–1372, (2010).
[6] Rakerd, B. and Hartmann, W.M. “Localization of sound in rooms. V. Binaural coherence and
human sensitivity to interaural time differences in noise”, Journal of The Acoustical Society of America. 128, 5, 3052–3063 (Nov. 2010).
[7] Macpherson, E.A. and Middlebrooks, J.C. “Listener weighting of cues for lateral angle: The
duplex theory of sound localization revisited”, The Journal of the Acoustical Society of America. 111, 5, 2219–2236, (2002).
[8] Braasch, J., Martens, W.L. & Woszczyk, W. “Modeling Auditory Localization of Subwoofer
Signals in Multi-Channel Loudspeaker Arrays”, Audio Engineering Society Convention 117. S. Hirzel Verlag. Oct. 2004.
[9] Staff, A. “Bass Handling in Spatial Reproduction. Journal of The Audio Engineering Society,
52(9), pp.962–967, 2004. [10] W. L. Martens, July, 2008 Effects of Low-frequency Absorption on Perceived Tightness of Bass
Imagery in Music Reproduction. Proceedings of the second ASA-EAA joint conference, organized by the Acoustical Society of America (ASA), the European Acoustics Association (EAA), and the Société Française d’Acoustique (SFA), Paris, France July, 2008.
[11] Katz, B. F. and Noisternig, M. “A comparative study of interaural time delay estimation
methods”, The Journal of the Acoustical Society of America, 135(6), 3530-3540, (2014).

9
[12] Kuhn, G. F. “Model for the interaural time differences in the azimuthal plane,” J. Acoust. Soc. Am. 62, 157–167, (1977).
[13] Kistler, D. J., and Wightman, F. L. “A model of head-related transfer functions based on
principal components analysis and minimum-phase reconstruction,” The Journal of the Acoustical Society of America, 91, 1637–1647, (1992).
[14] Middlebrooks, J. C. and Green, D. M. “Directional dependence of interaural envelope delays,”
The Journal of the Acoustical Society of America 87, 2149–2162, (1990). [15] Draper, N. R., and H. Smith. “Applied Regression Analysis”. Hoboken, NJ: Wiley-Interscience,
pp. 307–312, (1998). [16] Wightman, F.L. 1992. The dominant role of low-frequency interaural time differences in sound
localization. The Journal of the Acoustical Society of America. 91, 3, 1648–1661, (1992). [17] Blauert, J. and Lindemann, W. Auditory spaciousness: Some further psychoacoustic analyses.
The Journal of the Acoustical Society of America. 80, 2, 533, (1986). [18] Kuttruff, H. Room acoustics. Spon Press. (2000). [19] Le Goff, N., Buchholz, J.M. and Dau, T. Spectral integration of interaural time differences in
auditory localization. ICA 2013 Montreal. (2013) [20] Barron, M. “The subjective effects of first reflections in concert halls—the need for lateral
reflections”, Journal of Sound and Vibration. 15, 4, 475–494, (1971).