Embed Size (px)
Citation preview
The Influence of Respiratory Muscle Work on Locomotor and Respiratory Muscle Oxygenation
Trends in Repeated-sprint Exercise Ramón F. Rodriguez-Anderson
Submitted in fulfilment of the requirements of the degree of Doctor of Philosophy
Principal supervisor: Professor Robert J. Aughey Associate Supervisor: Professor François Billaut
2018 VICTORIA UNIVERSITY
College of Sport and Exercise Science

Preface
ABSTRACT
This thesis investigated the role respiratory muscle work has on locomotor and
respiratory muscle oxygen (O2) utilisation during multiple sprint work. To measure O2
delivery and uptake in real time, near-infrared spectroscopy (NIRS) can be used.
However, there are inconsistent methods of smoothing and determining peaks and nadirs
from the NIRS signal. Therefore, the aim of study 1 was to examine the effects of different
methodologies commonly used in the literature on the determination of peaks and nadirs
in the vastus lateralis deoxyhaemoglobin (HHbVL) signal. Means derived from
predetermined windows, irrespective of length and data smoothing, underestimated the
magnitude of peak and nadir [HHbVL] compared to a rolling mean approach. Based on the
results, we suggest using a digital filter to smooth NIRS data, rather than an arithmetic
mean, and a rolling approach to determine peaks and nadirs for accurate interpretation
of muscle oxygenation trends.
In the second study, the effects of heightened inspiratory muscle work on
[HHbVL] and respiratory muscle deoxyhaemoglobin ([HHbRM]) trends were examined. In
response to the heightened inspiratory muscle work, HHbRM was elevated across the
sprint series. There were no clear differences in HHbVL trends between exercise
conditions. The lack of difference in HHbVL between trials implies respiratory muscle O2
uptake does not limit locomotor oxygenation trends.
Study 3 investigated the role of arterial hypoxemia on respiratory muscle
oxygenation trends, and its implications on locomotor oxygenation. While exercising in
hypoxia (14.5% O2), HHbVL was higher during the sprint and recovery phases of the

Preface
II
repeated-sprint protocol compared to normoxia (21% O2). There were no clear
differences in respiratory muscle oxygenation trends between conditions. The clear
reduction in locomotor muscle O2 delivery (inferred from HHbVL) while respiratory
muscle oxygenation was maintained, suggests preferential blood flow distribution to the
respiratory muscle to compensate for arterial hypoxemia, which may explain in part
compromise locomotor O2 delivery.
The aim of the final study was to examine the role of respiratory muscle strength
on locomotor and respiratory muscle oxygenation trends in repeated-sprint exercise.
Inspiratory muscle training (IMT) was used to reduce the relative intensity of exercise
hyperpnoea by strengthening the respiratory muscles. Repeat-sprint ability was again
assessed in normoxia and hypoxia. After 4 weeks of training, there was a 35% increase of
inspiratory muscle pressure in the IMT beyond the control group. Despite the substantial
change in respiratory muscle strength, oxygenation trends were not affected in either
normoxia or hypoxia.
The findings of this thesis do not support the work of breathing as being a
limiting factor in locomotor muscle oxygenation in normoxia. The intermittent nature of
repeated-sprint activity is likely a key mediating factor for which O2 delivery can be
maintained to both the locomotor and respiratory muscles. However, under conditions
of arterial hypoxemia, locomotor muscle oxygenation may be compromised by
preferential O2 delivery to the respiratory muscles.

Preface
III
DOCTOR OF PHILOSOPHY DECLARATION
I, Ramón F. Rodriguez-Anderson, declare that the Ph.D. thesis entitled “The
Influence of Respiratory Muscle Work on Locomotor and Respiratory Muscle
Oxygenation Trends in Repeated-sprint Exercise” is no more than 100,000 words in
length including quotes and exclusive of tables, figures, appendices, bibliography and
references. This thesis contains no material that has been submitted previously, in whole
or in part, for the award of any other academic degree or diploma. Except where
otherwise indicated, this thesis is my own work.
Signature ____________________________________________________ Date ______________________

Preface
IV
ACKNOWLEDGMENTS
Firstly, I would like to express my sincere gratitude to my supervisors Dr. Robert
Aughey and Dr. François Billaut for your continual support, patience, and sharing of your
extensive research experience with me throughout my Ph.D. journey. I would also like
thank Dr. Nathan Townsend for your valuable insights and contribution to this research.
To the laboratory technical staff, Collene Steward and Robert Stokes, without
your assistance this research could not have happened. A special thank you to Samantha
Cassar, laboratory manager, for running such a tight ship, but also for your support during
the time I’ve have worked under you as a laboratory technician.
Thank you to my colleagues and friends who helped with pilot-testing and data
collection – Kristal Hammond, Mathew Inness, Michele Lo, Briar Rudsits, and Alice
Sweeting. To Mario Popovic, thank you for your tremendous efforts towards data
collection in the latter stages of my Ph.D. I am also thankful to the other post-graduate
research students in the college for creating and being a part of such a warm research
environment.
To Andrew Hibbert, thank you for helping with data collection and pilot testing.
But your most important role was being my gym and late night Xbox playing buddy. I
think we were both a help, and hindrance to each other’s research. Thanks mate.
To my family. Barbra, I don’t know if I would have had the opportunities I had
growing up which has lead me to now, if it was not for your support. Thank you. To my
mother and father, though you did not help directly with my studies, you inspired me to

Preface
V
follow what I love in life, which has been the most valuable contribution to not only my
work, but also to me as a person. I will find you a good nursing home one day.
Last but not the least; I would like to thank my partner Amy, for your love, support, and
encouragement. I love you.
Preface
VI
LIST OF PUBLICATIONS
The Following work has been presented at scientific meetings or accepted for
publication at peer-reviewed journals in support of this thesis:
1. Ramón F. Rodriguez., Nathan E. Townsend., Robert J. Aughey., & François Billaut.
(2018). Influence of Averaging Method on Muscle deoxygenation Interpretation in
Repeated-Sprint Exercise. Scandinavian Journal of Medicine and Science in Sports,
28(11), 2263-2271. doi:10.1111/sms.13238 (Chapter Three).
2. Ramón F. Rodriguez., Nathan E. Townsend., Robert J. Aughey., & François Billaut.
(December 2016). Influence of Averaging Method on Muscle deoxygenation
Interpretation in Repeated-Sprint Exercise. Presented at the College of Sport and
Exercise Science Higher Degree by Research conference, Melbourne, Australia.
(Chapter Three).
3. Ramón F. Rodriguez., Nathan E. Townsend., François Billaut., & Robert J. Aughey.
(July 2016). Inspiratory muscle loading during repeated-sprint exercise. Presented
at the 21st Annual Congress of the European College of Sport Science ECSS, Vienna,
Austria (Chapter Four).
4. Ramón F. Rodriguez., Nathan E. Townsend., François Billaut., & Robert J. Aughey.
(December 2015). Inspiratory loading, muscle oxygenation and repeated-sprint
exercise. Presented at the College of Sport and Exercise Science Higher Degree by
Research conference, Melbourne, Australia. (Chapter Four).

Preface
VII
The Following work is being prepared for publication at peer reviewed journals
in support of this thesis:
1. Ramón F. Rodriguez., Nathan E. Townsend., Robert J. Aughey., & François Billaut.
Muscle oxygenation and performance maintained during repeated-sprints despite
inspiratory muscle loading. Currently under review at PLOS One. (Chapter Four).
2. Ramón F. Rodriguez., Nathan E. Townsend., & Robert J. Aughey.,
François Billaut. Respiratory muscle oxygenation is not impacted by hypoxia during
repeated-sprint exercise. Currently being prepared for submission to Respiratory
Physiology and Neurobiology. (Chapter Five).
3. Ramón F. Rodriguez., Nathan E. Townsend., & Robert J. Aughey.,
François Billaut. Ventilation patterns in repeated-sprint exercise: evidence of
hyperventilation and entrainment. Currently being prepared for submission to
Respiratory Physiology and Neurobiology. (Chapter Three and Chapter Four).
The following work has been published in a peer reviewed journal during
candidature, but is outside the scope of this thesis:
1. Sweeting, A., Billaut, F., Varley, M. C., Rodriguez, R. F., Hopkins, W., & Aughey, R. J.
(2017). Variations in Hypoxia Impairs Muscle Oxygenation and Performance During
Simulated Team-Sport Running. Frontiers in Physiology, 8(80). doi:
10.3389/fphys.2017.00080
Preface
VIII
TABLE OF CONTENTS
ABSTRACT I
DOCTOR OF PHILOSOPHY DECLARATION III
ACKNOWLEDGMENTS IV
LIST OF PUBLICATIONS VI
TABLE OF CONTENTS VIII
LIST OF FIGURES XII
LIST OF TABLES XV
LIST OF EQUATIONS XVI
LIST OF ABBREVIATIONS XVII
CHAPTER ONE: INTRODUCTION 1
CHAPTER TWO: LITERATURE REVIEW 6
Chapter Outline 7
Control of Breathing During Exercise 7 2.2.1 Metabolic and Locomotor Feedback 9 2.2.2 Central Command 12 2.2.3 Hyperventilation during Heavy Exercise 13 2.2.4 Acute Environmental Hypoxia 15
Oxygen Transport 18 2.3.1 Oxygen Cascade 18 2.3.2 Blood Flow Redirection and Competition during Exercise 22
Respiratory Muscle Work during Exercise 25 2.4.1 Mechanics of Pulmonary Ventilation 26 2.4.2 Respiratory Muscle Work and the Oxygen Cost of Breathing 27 2.4.3 Consequences of Sustained Respiratory Muscle Work 31
Respiratory Muscle Training 38 2.5.1 Respiratory Muscle Endurance Training 39
Preface
IX
2.5.2 Respiratory Muscle Strength Training 40
Repeated Sprint-exercise 55 2.6.1 Metabolic Determinates of Repeated-sprint Exercise 56 2.6.2 Skeletal Muscle Tissue Oxygenation 61 2.6.3 Ventilation in Repeated-sprint Exercise 70
Study Aims 73 2.7.1 Study 1 (Chapter Three) 73 2.7.2 Study 2 (Chapter Four) 73 2.7.3 Study 3 (Chapter Five) 74 2.7.4 Study 4 (Chapter Six) 74
CHAPTER THREE: INFLUENCE OF AVERAGING METHOD ON MUSCLE DEOXYGENATION INTERPRETATION IN REPEATED-SPRINT EXERCISE 75
Introduction 76
Methods 78 3.2.1 Subjects 78 3.2.2 Experimental Design 79 3.2.3 Near-infrared Spectroscopy 80 3.2.4 Data Analysis 82 3.2.5 Statistical Analysis 83
Results 84 3.3.1 Application of the Butterworth Filter 84 3.3.2 Peak Muscle Deoxyhaemoglobin 86 3.3.3 Nadir Muscle Deoxyhaemoglobin 88 3.3.4 Muscle Reoxygenation 89
Discussion 92
Conclusion 96
CHAPTER FOUR: EFFECTS OF INSPIRATORY LOADING ON LOCOMOTOR AND RESPIRATORY MUSCLE OXYGENATION TRENDS 98
Introduction 99
Methods 101 4.2.1 Subjects 101 4.2.2 Experimental Design 102 4.2.3 Maximal Ramp Exercise 103 4.2.4 Repeated-sprint Exercise 103 4.2.5 Metabolic and Ventilatory Measurements 105 4.2.6 Near-infrared Spectroscopy 106 4.2.7 Statistical Analysis 108
Results 109 4.3.1 Mouth Pressure 109 4.3.2 Mechanical Measurements 110 4.3.3 Physiological Responses 111

Preface
X
4.3.4 Muscle Oxygenation 114 4.3.5 Rating of Perceived Exertion 117
Discussion 118 4.4.1 Work of Breathing and Respiratory Muscle Oxygenation 118 4.4.2 Locomotor Muscle Oxygenation 120 4.4.3 Worked Matched Exercise 123
Conclusion 124
CHAPTER FIVE: INFLUENCE OF ACUTE ARTERIAL HYPOXEMIA ON RESPIRATORY MUSCLE OXYGENATION 125
Introduction 126
Methods 128 5.2.1 Subjects 128 5.2.2 Experiment Design 129 5.2.3 Incremental Exercise Testing 130 5.2.4 Repeated-sprint Exercise 130 5.2.5 Metabolic and Ventilatory Measurements 132 5.2.6 Near-infrared Spectroscopy 133 5.2.7 Statistical Analysis 134
Results 135
Discussion 140
Conclusion 144
CHAPTER SIX: EFFECTS OF INSPIRATORY MUSCLE TRAINING ON LOCOMOTOR AND RESPIRATORY MUSCLE OXYGENATION TRENDS 145
Introduction 146
Methods 148 6.2.1 Subjects 148 6.2.2 Experimental Design 149 6.2.3 Incremental Exercise Testing 150 6.2.4 Repeated-sprint Exercise 150 6.2.5 Metabolic and Ventilatory Measurements 152 6.2.6 Near-infrared Spectroscopy 153 6.2.7 Inspiratory Muscle Training 154 6.2.8 Statistical Analysis 155
Results 156 6.3.1 Adherence to Training and Exercise Load 156 6.3.2 Respiratory Muscle and Pulmonary Function 157 6.3.3 Incremental Exercise 158 6.3.4 Repeated-sprint Exercise 158
Discussion 162 6.4.1 Respiratory muscle and pulmonary function adaptation 162 6.4.2 Repeated-sprint performance and Tissue Oxygenation 164

Preface
XI
6.4.3 Limitations 166
Conclusion 167
CHAPTER SEVEN: SUMMARY AND CONCLUSIONS 168
Summary of Main Findings 169 7.1.1 Work of breathing and respiratory muscle oxygenation 170 7.1.2 Influence of respiratory muscle work on vastus lateralis oxygenation trends 172 7.1.3 The role of respiratory muscle work on exercise performance 175
Limitation of this Research 176
Suggested Future Research 179
REFERENCES 183

Preface
XII
LIST OF FIGURES
Figure 2.1: An illustration of the typical ventilation responses to exercise at different exercise intensities .............................................................................................................................. 9
Figure 2.2: Effects of the partial pressure of arterial oxygen on pulmonary ventilation during rest and exercise .................................................................................................................. 16
Figure 2.3: The partial pressure of oxygen along the oxygen cascade at sea-level, and simulated altitude .............................................................................................................................. 19
Figure 2.4: Oxygen-haemoglobin dissociation curve and factors affecting oxygen’s binding affinity to haemoglobin ................................................................................................... 20
Figure 2.5: Mechanical work of breathing relative to pulmonary minute ventilation ...... 28
Figure 2.6: Relationship of exercise pulmonary ventilation to respiratory muscle oxygen uptake ..................................................................................................................................................... 30
Figure 2.7: Proposed respiratory muscle metaboreflex and its effects .................................. 38
Figure 2.8: Mechanical work performed during repeated-sprint exercise ........................... 56
Figure 2.9: Phosphocreatine shuttle system ..................................................................................... 61
Figure 2.10: Evolution of vastus lateralis deoxyhaemoglobin during repeated-sprint exercise ................................................................................................................................................... 62
Figure 2.11: An example of averaging windows used to determine vastus lateralis deoxyhaemoglobin during repeated sprint exercise ............................................................ 64
Figure 3.1: A plot of the root-mean-square residuals between filtered and unfiltered signals as a function of the filter cut-off frequency from the data of a representative subject ..................................................................................................................................................... 81
Figure 3.2: Representative data from a single subject illustrating the effects of a 10th order zero-lag low-pass Butterworth filter compared with raw data ....................................... 85
Figure 3.3: Correlation and residual analysis of the pooled subject data comparing the output from the Butterworth filter to the raw deoxyhaemoglobin data ...................... 86
Figure 3.4: Mean and standard deviation of deoxy-haemoglobin concentration changes over the entire repeated-sprint protocol determined from the different analysis methods .................................................................................................................................................. 91
Figure 4.1: Representative data of mouth pressure during exercise. The traces represent mouth pressure during a single breath in the Inspiratory Loading, Control, and Work Matched exercise conditions. ...................................................................................................... 110
Preface
XIII
Figure 4.2: Total mechanical work per sprint performed during the sprints ................... 111
Figure 4.3: Sprint and recovery pulmonary oxygen uptake expressed as a percentage of V� O2peak for Control, Inspiratory Loading and Worked Matched exercise ................. 114
Figure 4.4: Near-infrared spectroscopy responses to repeated-sprints during the Control Inspiratory Loading and Work Matched trials ..................................................................... 116
Figure 4.5: Standardised effects with 90% confidence intervals for near-infrared spectroscopy variables comparing Inspiratory Loading to Control, and Work Matched exercise to Inspiratory Loading. ............................................................................. 117
Figure 5.1: Study 3 design. Familiarisation trials are represented by the open squares, whereas experimental trials are represented by the filled squares. ........................... 130
Figure 5.2: Total mechanical work completed during repeated-sprint exercise in Normoxia and Hypoxia .................................................................................................................. 135
Figure 5.3: Sprint and recovery pulmonary oxygen uptake during Normoxia and Hypoxia repeated-sprint exercise trials ................................................................................................... 137
Figure 5.4: Vastus lateralis deoxyhaemoglobin during repeated-sprint exercise in normoxia and hypoxia ................................................................................................................... 138
Figure 5.5: Respiratory muscle oxygenation trends during repeated-sprint exercise in Normoxia and Hypoxia expressed as an absolute change from baseline .................. 139
Figure 6.1: Study 4 design. Familiarisation trials are represented by the open squares, whereas experimental trials are represented by the filled squares. ........................... 150
Figure 6.2: Pressure threshold level and exercise load presented as mean ± SD for the Inspiratory Muscle Training and Control groups .............................................................. 157
Figure 6.3: Relative change of maximal inspiratory mouth pressure (MIP) from baseline after each week of the intervention period for the Inspiratory Muscle Training and Control groups with 90% CL ....................................................................................................... 158
Figure 6.4: Total mechanical work completed during repeated-sprint exercise pre- and post-intervention in Normoxia and Hypoxia for both the Control and Inspiratory Muscle Training groups ................................................................................................................ 159
Figure 6.5: Standardised effects for the change in locomotor muscle oxygenation responses to repeated-sprint exercise in normoxia and hypoxia for both the Control and Inspiratory Muscle Training groups ................................................................................ 161
Figure 6.6: Standardised effects for the change in respiratory muscle oxygenation responses to repeated-sprint exercise in normoxia and hypoxia for both the Control and Inspiratory Muscle Training groups ................................................................................ 161
Preface
XIV
Figure 6.7: Relationship between maximal inspiratory mouth pressure and total work completed in normoxia and hypoxia for the Inspiratory Muscle Training and Control groups.. ................................................................................................................................................ 162
Figure 7.1: Partial pressure of end-tidal gasses oxygen and carbon dioxide recorded on a breath-by-breath basis during repeated-sprint exercise ................................................ 181

Preface
XV
LIST OF TABLES
Table 2.1: Effects of respiratory muscle training on respiratory function, physiological responses to exercise, and performance in healthy individuals. ..................................... 44
Table 2.2: Overview of the methodology used to analyse near-infrared spectroscopy data collected during repeated-sprint exercise ................................................................................ 66
Table 3.1: Comparison of smoothing method responses on peak [HHb]. Standardised effects relative differences are presented as change score [95% confidence limits]. ................................................................................................................................................................... 87
Table 3.2: Comparison of smoothing method responses on nadir [HHb]. Standardised effects relative differences are presented as change score [95% confidence limits]. ................................................................................................................................................................... 89
Table 3.3: Comparison of smoothing method responses on ΔReoxy [HHb]. Standardised effects relative differences are presented as change score [95% confidence limits]. ................................................................................................................................................................... 90
Table 4.1: Subject Characteristics ....................................................................................................... 102
Table 4.2: Pulmonary function and respiratory muscle strength .......................................... 103
Table 4.3: Physiological responses to the repeated-sprint exercise. The columns include data from Control, Inspiratory Loading, and Work Match exercise conditions. Data was averaged over the entire 5.5 min repeated-sprint protocol. ................................................... 113
Table 4.4: Mean near-infrared spectroscopy responses to repeated-sprint exercise. The columns include data from Control, Inspiratory Loading, and Work Match exercise conditions. ........................................................................................................................................... 115
Table 5.1: Subject characteristics. ...................................................................................................... 129
Table 5.2: Physiological responses to repeated-sprint exercise in Normoxia and Hypoxia. ................................................................................................................................................................ 136
Table 5.3: Near-infrared spectroscopy responses to repeated-sprint exercise in Normoxia and Hypoxia. ...................................................................................................................................... 138
Table 6.1: Subject characteristics. Inspiratory Muscle Training and Control groups .... 149
Table 6.2: Physiological responses to repeated-sprint exercise pre-and post-Inspiratory muscle training. ................................................................................................................................ 160
Preface
XVI
LIST OF EQUATIONS
Equation 2.1: Bicarbonate buffer system ............................................................................................. 7
Equation 2.2: Calculation of the partial pressure of alveolar oxygen ...................................... 15
Equation 2.3: Fick equation ..................................................................................................................... 22
Equation 2.4: Boyle's law .......................................................................................................................... 26
Equation 2.5: Adenosine triphosphate resynthesis by phosphocreatine dephosphorylation reaction ........................................................................................................... 57
Preface
XVII
LIST OF ABBREVIATIONS
% Percent
%∙s-1 Percent per second
[H+] Concentration of hydrogen ions
[HHb] Concentration of deoxyhaemoglobin
[O2Hb] Concentration of oxyhaemoglobin
~ Approximately
< Less than
> Greater than
∆%[HHb] Percent change in the concentration of deoxyhaemoglobin
∆Reoxy Reoxygenation
∫Pm × ƒb Inspiratory muscle force development
≤ Less than or equal to
↑ Increase
→ No change
↓ Decrease
µm Micrometre
2MA 2 s moving average
2PD 2 s predetermined average
5MA 5 s moving average
5PD 5 s predetermined average
A-aO2diff Alveolar to arterial O2 pressure difference
ADP Adenosine diphosphate
ATP Adenosine triphosphate

Preface
XVIII
ATP·kg-1 Adenosine triphosphate per kilogram
AU Arbitrary units
b·min-1 Beats per minute
BL Baseline
BWFMA Value obtained from a predetermined time point after the data was smoothed with the Butterworth filter
BWFPD Single peak/nadir value within each 40 s sprint/recovery cycle.
CL Confidence limit
cm Centimetre
cmH2O Centimetre of water
CO2 Carbon dioxide
Cr Creatine
CTRL Control
EMT Expiratory muscle training
ES Effect size
ET Endurance training
ƒb breathing frequency
ƒc cut-off frequency
FEV1 Forced expiratory volume in 1 s
FICO2 fraction of inspired carbon dioxide
FIO2 fraction of inspired oxygen
FVC forced vital capacity
GET Gas exchange threshold
H+ Hydrogen ion
H2CO3 Carbonic acid

Preface
XIX
H2O Water
Hb Haemoglobin
HCO3− Bicarbonate
HHbRM Respiratory muscle deoxyhaemoglobin
HHbVL Vastus lateralis deoxyhaemoglobin
HR Heart rate
Hz Hertz
IMT Inspiratory muscle training
INSP Inspiratory loading repeated-sprint exercise
IV Inspiratory volume
J·L-1 Joules per litre
J·min-1 Joules per minute
kg Kilogram
kJ Kilojoule
km Kilometre
Kp Kilopond
L Litre
L·min-1 Litters per min
m Meter
m·s-1 Meters per second
MATCH Work matched exercise
MEP Maximal expiratory pressure
min Minute
MIP Maximal inspiratory mouth pressure
mL∙min-1∙kg-1 Millilitres per minute per kilogram
mm Millimetre

Preface
XX
mmHg Millimetre of mercury
mmol Millimole
MVC Maximal voluntary contraction
MVV Maximal voluntary ventilation
n Sample size
N·kg-1 Newton per kilogram
NIRS Near-infrared spectroscopy
O2 Oxygen
O2HbRM Respiratory muscle oxyhaemoglobin
P0 Maximal inspiratory pressure at zero flow
P1 pressure of first gas
P2 pressure of second gas
PaCO2 Partial pressure of arterial carbon dioxide
PACO2 Partial pressure of alveolar CO2
PaO2 Partial pressure of arterial oxygen
PAO2 Partial pressure of alveolar oxygen
PaO2 Partial pressure arterial oxygen
PAV Proportional assist ventilation
PB Barometric pressure
PcO2 Partial pressure capillary oxygen
PCr Phosphocreatine
PEF Peak expiratory flow
PETCO2 End-tidal carbon dioxide
PETO2 End-tidal oxygen
PFVO2 Partial pressure femoral vein oxygen
PH2O Pressure of inspired water vapour

Preface
XXI
PIF Peak inspiratory flow
PIO2 Partial pressure of inspired oxygen
Pm Mouth pressure
POPT Optimal pressure for maximal flow production
PPO Peak power output
Q� Blood flow
R Respiratory exchange ratio quotient
r Pearson's product-moment correlation
r2 Coefficient of determination
Reoxy rate Vastus lateralis reoxygenation rate
RET Respiratory endurance time
RMET Respiratory muscle endurance training
RMS Root-mean squared
RPE Rating of perceived exertion
RPEBreath Rating of perceived exertion for breathing
RPEExercise Rating of perceived exertion for exercise
rpm Revolutions per minute
RS Repeat-sprint
s Second
SD Standard deviation
SPO2 Arterial oxygen saturation by pulse oximetry
tHbRM Respiratory muscle total haemoglobin
TSIRM Respiratory muscle tissue saturation index
TSIVL Vastus lateralis tissue saturation index
TT Time trial
TTPHHb Time to peak vastus lateralis deoxyhaemoglobin

Preface
XXII
V1 Volume of first gas
V2 Volume of second gas
V� CO2 Rate of carbon dioxide elimination
V� E Ventilation rate
V� Epeak Peak ventilation rate
V� O2 Rate of oxygen uptake
V� O2max Maximal rate of oxygen uptake
V� O2peak Peak rate of oxygen uptake
V� O2RM Respiratory muscle oxygen uptake
V� OPT Optimal flow
VT Tidal volume
W Watt
W∙min-1 Watts per minute
WImax Maximal inspiratory power
wk week

CHAPTER ONE: INTRODUCTION
Respiratory Muscle Work and Tissue Oxygenation Trends During Repeated-sprint Exercise
∼ 2 ∽
The respiratory system is primarily responsible for regulating arterial blood
gasses through pulmonary ventilation (V� E). The degree of hyperpnoea is controlled by
the integration of multiple factors in order to prevent hypocapnia and hypoxia from
occurring (Forster, Haouzi, & Dempsey, 2012). At rest, and up to moderate intensity
exercise (<80% of maximal oxygen uptake), the energy requirements of the respiratory
muscle necessary to generate airflow is relatively low. However, the ventilation demands
of high-intensity exercise (>80% of maximal oxygen uptake) require considerable blood
flow and oxygen (O2) supply to support the muscular work of breathing. It is estimated
that the O2 cost of exercise hyperpnoea accounts for 10-15% of the total whole body O2
uptake (V� O2) (Aaron, Seow, Johnson, & Dempsey, 1992; Harms et al., 1998; Turner et al.,
2012). As both locomotor and respiratory muscle demands for O2 rich blood flow begin
to encroach on the maximal transport capacity of the cardiovascular system, competition
for available cardiac output can arise. By elevating inspiratory muscle work during
sustained high-intensity exercise, limb blood flow is attenuated (Harms et al., 1997),
peripheral fatigue hastened (Romer, Lovering, Haverkamp, Pegelow, & Dempsey, 2006),
and exercise performance impaired (Harms, Wetter, St Croix, Pegelow, & Dempsey,
2000). Conversely, the opposite effects have been observed when the work of breathing
incurred during exercise has been lowered with assisted ventilation technology.
Most of the research in this area has focused on prolonged bouts of exercise,
with very little on intermittent high-intensity exercise. One such model is repeated-sprint
exercise, which is characterised by brief periods of maximal exertion, separated by short
rest periods. Underpinning the capacity to maintain sprint performance over multiple
efforts is the ability to resynthesise phosphocreatine (PCr), the primary metabolite in

Introduction
∼ 3 ∽
sprint exercise (Dawson et al., 1997; Gaitanos, Williams, Boobis, & Brooks, 1993). Even
though ATP generation from PCr is entirely an anaerobic process, PCr resynthesis is
derived solely from aerobic metabolism, and is highly sensitive to muscle O2 availability
(Haseler, Hogan, & Richardson, 1999; Sahlin, Harris, & Hultman, 1979). Therefore, the
ability to deliver O2 to the locomotor muscles during rest periods between sprints is
critical to maintaining maximal sprint performance (Billaut & Buchheit, 2013; Kime et al.,
2003). It is currently unclear, however, if respiratory muscle work has any influence on
muscle O2 delivery during repeated-sprint exercise. There is some evidence that training
targeted specifically at the respiratory muscles improves repeat-sprint performance
(Archiza et al., 2017; Romer, McConnell, & Jones, 2002b). In fact, reducing the relative
intensity of exercise hyperpnoea through training is reported to lessen the O2 cost of
breathing. However, there has been no investigation into the muscle oxygenation trends
following respiratory muscle training.
Near-infrared spectroscopy (NIRS) is used to evaluate tissue oxygenation during
exercise. This technology relies on the light absorbing characteristics of oxy- and deoxy-
haemoglobin, and reflects the balance between O2 delivery and utilisation (Ferrari,
Mottola, & Quaresima, 2004). Before investigating the locomotor muscle oxygenation
trends in repeated-sprint exercise, understanding the how varying methodology of NIRS
analysis influences the reported outcomes was needed. Therefore, the aim of the first
study (Chapter Three) was to compare and evaluate the effect of different NIRS signal
analysis methods on vastus lateralis oxygenation trends during repeated-sprint exercise.
The next aim (Chapter Four) was to identify the consequences of heightened
inspiratory muscle work during repeated-sprint exercise. Vastus lateralis and intercostal

Respiratory Muscle Work and Tissue Oxygenation Trends During Repeated-sprint Exercise
∼ 4 ∽
muscle NIRS responses were examined as an index for locomotor and respiratory muscle
O2 delivery and uptake. The balance of O2 delivery between the locomotor and
respiratory muscle was assessed in relation to pulmonary V� O2.
The aim of the third study (Chapter Five) was to examine the effects of acute
arterial hypoxemia on intercostal muscle oxygenation relative to normoxia. It has been
demonstrated that vastus lateralis reoxygenation kinetics between sprints is impaired in
environmental hypoxia (Billaut & Buchheit, 2013). But how the respiratory muscles
responded was unclear. Intercostal muscle oxygenation was assessed to determine if the
respiratory muscles are equally affected by hypoxia, or if intercostal muscles “steal” O2
from the locomotor muscles to maintain hyperpnoea.
The final research chapter (Chapter Six) explored respiratory muscle training as
a potential pathway to enhance locomotor muscle reoxygenation, and repeated-sprint
performance. Once again repeated-sprint ability was assessed in normoxia and hypoxia,
and muscle oxygenation was assessed with NIRS. The training design used in this study
was well established for enhancing inspiratory muscle strength and exercise
performance (McConnell & Romer, 2004b).
Commencing with a literature review (Chapter Two), this thesis further
comprises four experimental chapters:
I. Chapter Three (Study 1): Influence of averaging method on muscle
deoxygenation interpretation during repeated-sprint exercise.
II. Chapter Four (Study 2): Muscle oxygenation and performance
maintained during repeated sprints despite inspiratory muscle loading.

Introduction
∼ 5 ∽
III. Chapter Five (Study 3): Acute hypoxia and respiratory muscle
oxygenation.
IV. Chapter Six (Study 4): The Effects of inspiratory muscle training on
muscle oxygenation trends.
The main findings of this thesis are summarised with a general discussion of the
results (Chapter Seven), including limitations of the research presented, and suggestions
for future research.

CHAPTER TWO: LITERATURE REVIEW

Respiratory Muscle Work and Tissue Oxygenation Trends During Repeated-sprint Exercise
∼ 7 ∽
CHAPTER OUTLINE
This review of literature begins with an introduction to the control of breathing,
with focus on exercise hyperpnoea. Ventilation will also be discussed in the context of
high-intensity exercise and the response to hypoxia. After this, there will be a brief
overview of the oxygen cascade and the regulation of blood flow during exercise. The next
section details the interplay between respiratory muscle work, and the development of
locomotor muscle fatigue. This is then followed by a review of the current literature
surrounding respiratory muscle training. The review ends with a detailed overview of
repeated-sprint exercise, integrating the previously discussed topics.
CONTROL OF BREATHING DURING EXERCISE
Ensuring homeostasis during exercise requires that the O2 extracted from
arterial blood by the muscles is replenished, and carbon dioxide (CO2) produced by the
muscles is eliminated. The primary challenge of the respiratory system is to regulate
these gasses, to ensure hypocapnia and hypoxia do not develop (Casaburi, Whipp,
Wasserman, Beaver, & Koyal, 1977; Douglas & Haldane, 1909; Forster et al., 1993;
Forster, Pan, & Funahashi, 1986; Somers, Mark, Zavala, & Abboud, 1989; Weil et al., 1972).
Pulmonary ventilation can also assist with buffering hydrogen ions (H+) during exercise.
Bicarbonate (HCO3−) will combine with H+ to form carbonic acid (H2CO3), which is then
converted to CO2 and water (H2O).
Equation 2.1: Bicarbonate buffer system (Hultman & Sahlin, 1980).
𝐻𝐻𝐻𝐻𝐻𝐻3− + 𝐻𝐻+ ⟺ 𝐻𝐻2𝐻𝐻𝐻𝐻3 ⟺ 𝐻𝐻𝐻𝐻2 + 𝐻𝐻2𝐻𝐻
At the onset of exercise, total pulmonary ventilation (V� E) increases abruptly
(Krogh & Lindhard, 1913). When the metabolic rate rises, V� E proportionally increases to

Literature Review
∼ 8 ∽
prevent hypercapnia. This prevention of hypercapnia is achieved through a combination
of elevated breathing frequency (ƒb) and tidal volume (VT) (Forster et al., 2012; Sheel &
Romer, 2012). During light exercise (VT below ~50% of vital capacity), an increase in V� E
is predominantly achieved by an elevation in VT (Hey, Lloyd, Cunningham, Jukes, & Bolton,
1966). During more strenuous exercise (VT between 50-60% of vital capacity,) there is
no further rise in VT. The continual increase in V� E experienced during incremental
exercise is therefore achieved by more rapid ƒb (Hey et al., 1966; Younes & Kivinen, 1984).
These changes in breathing pattern are closely tied to metabolic activity. However, above
the ventilatory threshold, V� E increases disproportionately to the metabolic rate (Figure
2.1) (Wasserman, Whipp, Koyl, & Beaver, 1973).
Exercise hyperpnoea and hyperventilation constrain the development of arterial
hypoxemia as the alveolar-arterial O2 gradient widens (Harms & Stager, 1995); provides
some compensation for progressive metabolic acidosis (Forster et al., 2012);
hyperventilation induced hypocapnia results in cerebral vasoconstriction (Raichle &
Plum, 1972); and respiratory muscle work is supported by a large portion of cardiac
output during high-intensity exercise (Harms et al., 1998). The degree of exercise
hyperpnoea is regulated by the integration of multiple factors with built-in redundancy
so that no one factor regulates ventilation.

Respiratory Muscle Work and Tissue Oxygenation Trends During Repeated-sprint Exercise
∼ 9 ∽
Figure 2.1: An illustration of the typical ventilation responses to exercise at different exercise intensities. Ventilation rate (in this case V� , but typically abbreviated to V� E) rises proportionally to the work rate (O2 consumption, and pulse rate) during rhythmic exercise, such that the partial pressure of arterial oxygen (PaO2) and carbon dioxide (PaCO2), and pH are held constant during mild to moderate exercise. Above an individual threshold, indicated by the vertical dashed line, ventilation rises exponentially to an increasing work rate, causing a fall in PaCO2 and pH, and a concurrent rise in PaO2. Reproduced from Waldrop (1989).
2.2.1 Metabolic and Locomotor Feedback
The production of a respiratory motor pattern to drive the respiratory muscles
involves the integration of multiple sensory inputs of both chemical and mechanical
nature (Forster et al., 2012; Lahiri & Forster, 2003; Sheel & Romer, 2012). Afferent
sensory input originating peripherally and centrally is responsible for generating an
appropriate respiratory motor pattern to match metabolic demands. Peripheral
chemoreceptors are sensitive to chemical changes of the circulating arterial blood, while

Literature Review
∼ 10 ∽
nerve endings in skeletal muscle provide feedback on the chemical and structural
changes in response to muscle contraction.
2.2.1.1 Chemoreceptor Feedback
Peripheral arterial chemoreception is important for the reflex control of
respiration, and the chemoreceptors are located in the carotid and aortic bodies
(Haymans & Neil, 1959; Schmidt & Comroe, 1940). Carotid and aortic bodies are small
clusters of cells within the arteries sensitive to hypocapnia, hypoxia, and acidosis
(O'Regan & Majcherczyk, 1982). The carotid bodies are located at the carotid bifurcations.
The advantageous location of the carotid bodies provide early feedback on the status of
arterial blood prior to the blood entering the brain’s circulation (Parkes, 2013).
Secondary peripheral chemoreceptors exist at the aortic arch, but are less chemically
sensitive (Comroe, 1939; Lahiri, Mokashi, Mulligan, & Nishino, 1981).
Additional chemoreceptors are in the medulla region of the brain stem (Mitchell,
Loeschcke, Severinghaus, Richardson, & Massion, 1963; Nattie & Li, 2012). The central
chemoreceptors are immersed in the brains interstitial fluid, and are highly sensitive to
changes in interstitial pH (Nattie & Li, 2012). However, the cerebral spinal fluid has a
closely regulated environment partially enforced by the selective permeability of the
blood-brain barrier. Arterial acids and bases defuse slowly across the blood-brain
barrier, whereas CO2 permeates radially and changes the pH of the medullary interstitial
fluid quickly and substantially (Hladky & Barrand, 2016; Paulson, 2002).
2.2.1.2 Feedback from Locomotor Muscles
Mechanical and biochemical stimuli provide feedback on contraction-induced
perturbation of skeletal muscle, contributing to the generation of a respiratory motor
pattern via group III (myelinated) and IV (unmyelinated) muscle afferent fibres (Amann,

Respiratory Muscle Work and Tissue Oxygenation Trends During Repeated-sprint Exercise
∼ 11 ∽
2012; Haouzi, Chenuel, & Huszczuk, 2004). A sudden rise in ventilation occurs at the
transition from rest to exercise (Krogh & Lindhard, 1913). The abrupt change in
ventilation is too rapid for chemical feedback to be the initial stimuli for hyperpnoea
(Torelli & Brandi, 1961; Whipp, 1977). Therefore, it may be the limb activity itself that is
responsible for the initial increase in ventilation at exercise onset. Through passive limb
movement an abrupt change in ventilation can be induced, which has been demonstrated
to be persistent for up to 5 min (Waisbren, Whiting, & Nadel, 1990). Since there is an
inherent delay in chemoreceptor mediated exercise hyperpnoea (Torelli & Brandi, 1961),
immediate feedback is important for pre-emptive adjustments of ventilation in
anticipation of metabolic disturbances (Forster et al., 2012).
Feedback during prolonged exercise is also important for fine tuning the degree
of exercise hyperpnoea. When a neural blockade is used to inhibit sensory feedback (1
mL of fentanyl, injected into the L3-L4 interverbal space), ventilatory responses to cycling
exercise are attenuated in moderately trained males (Amann et al., 2010). These cyclists
exercised for 3 min at 50, 100, and 150 W, followed by 4 min at 80% of peak power output
(325 ± 19 W). At rest and 50 W cycling, the blockade had no discernible effects on V� E.
However, at the higher work rates V� E was decreased ~8–10 L·min-1 (8-17%) primarily by
reduction in ƒb. At the highest work rate, the blunted hyperpnoea resulted in arterial
hypoxemia (monitored via pulse oximetry), accelerated the development of peripheral
fatigue (quadriceps twitch interpolation), and reduced the time to exhaustion (Amann et
al., 2010, 2011).
The combined data from both animal and human models reveal that at least a
small degree of exercise hyperpnoea is mediated by contracting muscles. Group III and
IV fibres within the muscle provide the important immediate feedback on length, tension,

Literature Review
∼ 12 ∽
and chemical status of contracting musculature, prior to metabolic by-products entering
systemic circulation.
2.2.2 Central Command
Feedforward mechanisms are theorised to mediate hyperpnoea, and may in part
be responsible for some of the increases in ventilation during exercise (Waldrop,
Eldridge, Iwamoto, & Mitchell, 2010). The sudden rise in ventilation at exercise onset that
was introduced in section 2.2.1.2 may have central origins. Specifically, co-activation of
locomotor and respiratory areas of the brain serve as the feedforward control mechanism
(Waldrop et al., 2010).
Electrical stimulation of the hypothalamus to produce locomotion in
decorticated cats, results in a proportionate increase in respiration (Eldridge, Millhorn,
& Waldrop, 1981). In this instance, respiration was quantified by the electrical activity of
the phrenic nerve. The cats also had their carotid bodies and baroreceptors denervated.
To further eliminate feedback as the source of hyperpnoea, four cats were paralysed
using the neuromuscular blockade gallamine triethiodide delivered intravenously. The
same relative increase in respiration to fictive locomotion (measured as a change in nerve
activity of the hide limb) was observed in response to hypothalamus stimulation. The
authors concluded by proposing that activation of the locomotor areas of the
hypothalamus are primarily responsible for the proportional drive for locomotion and
respiration (Eldridge et al., 1981).
In humans, the role of central command has been assessed in subjects with
unilateral leg weakness (Innes, De Cort, Evans, & Guz, 1992). Three groups were studied:
1) six patients recovering from orthopaedic disorders, 2) two patients with neurological
disorders, and 3) eight healthy subjects with temporary weakness induced by local

Respiratory Muscle Work and Tissue Oxygenation Trends During Repeated-sprint Exercise
∼ 13 ∽
antistatic. Subjects performed single leg cycling for 4 min at an intensity which resulted
in a similar V� O2 when exercising each leg. Ventilation increased more when exercise was
performed with the weakened leg in all subjects, and independently in metabolic rate.
Since greater muscle activation to the weakened leg was likely necessary, the magnitude
of central activation was believed to have influenced the heightened ventilatory
responses (Innes et al., 1992).
2.2.3 Hyperventilation during Heavy Exercise
At work rates below the ventilatory threshold, there is a linear increase in V� E
proportional to the metabolic rate (Figure 2.1). However, above the ventilation threshold
V� E rises disproportionally to the metabolic rate, initially causing the pressure of alveolar
O2 to increase, then CO2 to fall (Forster et al., 2012; Waldrop, 1989; Wasserman et al.,
1973). It is likely that arterial acidosis is a major contributor to the hyperventilation.
However, other feedback/feedforward mechanisms also appear to be influential to the
excess ventilation.
2.2.3.1 Arterial Acidosis
Rapid elevation of H+ concentration ([H+]) in the blood and tissues occurs during
high-intensity exercise, and accumulates when production exceeds the rate which CO2 is
eliminated from the body through ventilation (A. V. Hill, Long, & Lupton, 1924). A strong
relationship exists between the onset of blood lactate accumulation and ventilation
threshold (Loat & Rhodes, 1993). Therefore, it may be assumed that chemoreceptor
exposure to CO2/H+ incurred with high-intensity exercise is the cause of the “extra” drive
to breathe (Figure 2.1). However, an exercise and dietary intervention that promotes
glycogen depletion and therefore reduced carbohydrate metabolism, resulted in an
uncoupling of ventilation and lactate thresholds (Hughes, Turner, & Brooks, 1982). Since

Literature Review
∼ 14 ∽
ventilation and lactate thresholds can be manipulated independently of each other, lactic-
acid accumulation is unlikely to be responsible for exercise-induced hyperventilation.
Additionally, patients with McArdle’s syndrome who are incapable of producing lactic-
acid due to the lack on the enzyme glycogen phosphorylase, hyperventilation should not
occur if acidosis was responsible for the “extra” ventilation during high-intensity
exercise. However, these patients still display a normal hyperventilation response,
despite no increase in blood lactate or H+ concentration (Hagberg et al., 1982).
2.2.3.2 Locomotor Muscle Fatigue
Locomotor muscle fatigue rapidly develops during high-intensity exercise, and
may be more influential than acidosis alone towards “excess” ventilation. Peripheral
fatigue resulting in a decrease in muscle force-generating capacity, is associated with an
increase in central command to maintain force production and subsequent co-activation
respiratory muscles (Forster et al., 2012). Indirectly, increased motor drive is supported
by an elevation in electromyography of the locomotor muscles coinciding with the
ventilation threshold (Lucia, Sanchez, Carvajal, & Chicharro, 1999; Mateika & Duffin,
1994). To mimic fatigue, subjects can be given either a muscle relaxant or local
anaesthetics to cause chemically induced muscle weakness. In these subjects, V� E is higher
during the “fatiguing” exercise compared to their fatigue free state (Asmussen, Johansen,
Jørgensen, & Nielsen, 1965; Galbo, Kjaer, & Secher, 1987; Innes et al., 1992). For example,
a neuromuscular blockade can be given as a method of inducing muscular weakness. At a
given cycling work rate and at a similar V� O2, V� E was as least 37% higher when performed
under the influence of the blockade (tubocurarine chloride) compared to control. It was
speculated that in order to overcome the muscle weakness, there was compensatory

Respiratory Muscle Work and Tissue Oxygenation Trends During Repeated-sprint Exercise
∼ 15 ∽
recruitment of additional accessory muscles, and therefore the requirement of greater
central command (Galbo et al., 1987).
2.2.4 Acute Environmental Hypoxia
Ventilation in acute hypoxia is higher to mitigate the reduction in partial
pressure of O2 in the environment (Figure 2.2; Forster et al., 2012). Environmental
hypoxia naturally occurs when the barometric pressure falls on the ascent of a mountain.
Altitude can also be simulated in two ways 1) reducing the barometric pressure within
an airtight chamber (hypobaric hypoxia), and 2) reducing the O2 in the inspired gas
mixture (normobaric hypoxia). Both these altitude simulation methodologies reduce the
O2 diffusion capacity between alveoli and pulmonary capillaries to promote arterial
hypoxemia. The partial pressure of alveolar O2 (PAO2) available for gas exchange is
calculated as:
Equation 2.2: Calculation of the partial pressure of alveolar oxygen (Biro, 2013).
𝑃𝑃𝐴𝐴𝐻𝐻2 = 𝐹𝐹𝐼𝐼𝐻𝐻2�𝑃𝑃𝑏𝑏 − 𝑃𝑃𝐻𝐻2𝑂𝑂� − (𝑃𝑃𝐴𝐴𝐻𝐻𝐻𝐻2 ÷ 𝑅𝑅)
where FIO2 is the fraction of inspired O2; Pb is barometric pressure; PH2O is the pressure of
inspired water vapour; PACO2 is the pressure of alveolar CO2; and R is respiratory
exchange ratio quotient V� CO2/V� O2.
When cycling at the same absolute work rate and duration (82.1 ± 0.5% of the
peak power output obtained during a graded exercise test in hypoxia) in normoxia and
hypoxia (FIO2 = 0.15), V� E is elevated by 53 ± 7% over the final minute of exercise (Amann,
Pegelow, Jacques, & Dempsey, 2007). The elevation in V� E was achieved through an
increase in ƒb (from 40.3 ± 2.8, to 59.5 ± 2.7 breaths·min-1). However, when exercising at
altitude, there is a linear decrease in maximal work rate and the maximal rate of O2 uptake

Literature Review
∼ 16 ∽
(V� O2max) (Martin & O'Kroy, 1993; Wehrlin & Hallén, 2006). Since the subjects in the
previously mentioned study were exercised at the same absolute work rate (Amann,
Pegelow, et al., 2007), it is likely that the relative intensity was much greater in hypoxia.
To account for the decrease in exercise capacity at altitude, a lower work rate can be
selected which would represent the same relative exercise intensity. Even after adjusting
for the relative intensity of exercise, V� E is still higher at altitude. When subjects performed
submaximal exercise to exhaustion (75% V� O2max in the respective environment), V� E was
elevated by 47% in the final moments of exercise at high altitude (5050 m, ~410 mmHg;
equivalent to a FiO2 of 0.11), even though the work rate was 23% lower (Cibella et al.,
1996). The increase in ventilation was achieved through a 40.7% increase in ƒb, which is
comparable to what was described previously (Amann, Pegelow, et al., 2007).
Figure 2.2: Effects of the partial pressure of arterial oxygen (PaO2) on pulmonary ventilation (V� E) during rest and exercise. The partial pressure of arterial carbon dioxide (PaCO2) was held constant throughout the trials. Data represented by the closed symbols (•) were obtained during rest, and the open symbols (⨯ and ○) were obtained during two levels of submaximal exercise (n = 3). Reproduced from Forster et al. (2012) with data from Asmussen and Nielsen (1957).

Respiratory Muscle Work and Tissue Oxygenation Trends During Repeated-sprint Exercise
∼ 17 ∽
Aside from the direct mediating effects of arterial hypoxemia on ventilation via
chemoreceptor activation (O'Regan & Majcherczyk, 1982), there are secondary effects of
hypoxia influencing ventilation. Exposure to hypoxia causes the chemoreceptors to
become more sensitive to changes in arterial blood gasses and pH (Eyzaguirre & Koyano,
1965; Lahiri & DeLaney, 1975). Second, to compensate for the reduced O2 availability,
there is a shift in metabolism towards greater reliance on anaerobic pathways for ATP
formation (Ibañez, Rama, Riera, Prats, & Palacios, 1993; Morales-Alamo et al., 2012).
Therefore, greater circulating by-products of anaerobic metabolism (CO2/H+) are
available to activate the respiratory chemoreceptors (Asmussen & Nielsen, 1957). Lastly,
the hastened development of peripheral muscle fatigue associated with arterial
hypoxemia (Amann & Calbet, 2008), contributes to exercise hyperpnoea. To maintain
force production, greater central drive (central command) of the active muscle is
necessary to overcome fatigue (Amann, Romer, Subudhi, Pegelow, & Dempsey, 2007;
Moritani, Muro, & Nagata, 1986). As introduced earlier (section 2.2.3.2), it is likely that
there is co-activation of locomotor and respiratory centres (Mateika & Duffin, 1994).
Therefore, heightened central motor command associated with the progression of
locomotor muscle fatigue is another likely source contributing of exercise hyperpnoea in
hypoxia.
Literature Review
∼ 18 ∽
OXYGEN TRANSPORT
Human skeletal muscle has limited O2 storage capability (Millikan, 1939).
Because of this limited O2 storage, a constant blood supply rich with O2 is necessary to
support aerobic metabolism. To meet the metabolic demands of exercise, cardiac output
can increase from ~5 L·min-1 at rest, to 20 L·min-1 during maximal exercise in untrained
subjects and up to 40 L·min-1 in elite endurance athletes (Joyner & Casey, 2015). The
regional distribution of blood flow is closely related to the metabolic rate of the exercising
muscle (Andersen & Saltin, 1985; Hamann, Kluess, Buckwalter, & Clifford, 2005; Knight
et al., 1992; Rowell, Saltin, Kiens, & Christensen, 1986). However, during high-intensity
exercise competition can arise for available cardiac output between muscle groups (e.g.
legs vs. arms) (Calbet et al., 2004; Harms et al., 1997; Secher, Clausen, Klausen, Noer, &
Trap-Jensen, 1977; Volianitis, Krustrup, Dawson, & Secher, 2003; Volianitis & Secher,
2002). Along with blood flow, the passive movement of O2 down its concentration
gradient from environmental air to the mitochondria is fundamental for sustained
aerobic metabolism.
2.3.1 Oxygen Cascade
Moving O2 from the environment to the tissue involves a complex series of steps.
Breakdown at any point along the pathway can result in inadequate muscle O2 supply,
and impair exercise performance. Though exposure to (simulated) altitude can impair O2
transport at every step in the O2 cascade, and attenuate muscle O2 extraction (Figure 2.3).

Respiratory Muscle Work and Tissue Oxygenation Trends During Repeated-sprint Exercise
∼ 19 ∽
Figure 2.3: The partial pressure of oxygen along the oxygen cascade at sea-level, and simulated altitude. The black line represents subjects breathing room air (FIO2 = 0.21), and the grey line a hypoxic gas mixture (FIO2 = 0.105) during cycling exercise. Moving from left to right, values are for the partial pressure of inspired oxygen (PIO2); alveolar oxygen (PAO2); arterial oxygen (PaO2); estimated mean capillary oxygen (PcO2); and femoral vein oxygen (PFVO2). Adapted from Calbet, Rådegran, Boushel, and Saltin (2009).
2.3.1.1 Pulmonary ventilation
Pulmonary ventilation is responsible for O2 and CO2 gas exchange between the
lungs and external environment. The respiratory muscles, primarily the diaphragm, act
as a two-way flow generator, moving air in and out of the lungs (Aliverti et al., 1997).
Ventilation is closely tied to metabolism, and regulated by continual feedback on the
internal environment (Forster et al., 2012; Sheel & Romer, 2012). Through exposure to
hypoxia and during high-intensity exercise, ventilation rises disproportionately to the
metabolic rate (Amann, Pegelow, et al., 2007; Cibella et al., 1996; Waldrop, 1989;
Wasserman et al., 1973). Hyperventilation can have a protective mechanism against
hypoxemia, as a reduction in CO2/H+ causes a leftward shift of the oxygen-haemoglobin

Literature Review
∼ 20 ∽
dissociation curve, increasing the O2 binding affinity for haemoglobin (Figure 2.4) (Bohr,
Hasselbalch, & Krogh, 1904; Jensen, 2004).
Figure 2.4: Oxygen-haemoglobin dissociation curve and factors affecting oxygen’s binding affinity to haemoglobin. A leftward shift in the oxygen-haemoglobin dissociation curve results in an increased oxygen binding affinity. Whereas the consequence of a rightward shift is a decrease in binding affinity. Abbreviations are: CO2, carbon dioxide; 2, 3 DPG, 2, 3-diphosphoglycerate acid. Reproduced from O’Driscoll, Howard, and Davison (2008).
2.3.1.2 Pulmonary gas exchange
Once inhaled air reaches the lung, gas exchange can occur between the thin
walled alveoli and pulmonary capillaries. This gas exchange is achieved through the
passive movement of O2 (from air to blood) and CO2 (from blood to air) down their
respective pressure gradients (Wagner, 2015). In healthy young subjects, the alveolar to
arterial O2 pressure difference (A-aO2diff) averages 5-10 mmHg at rest (Mellemgaard,
1966; Raine & Bishop, 1963). This pressure difference facilitates the movement of O2 to
move down the concentration gradient and diffuse across the alveolar-capillary
membrane. During exercise, there is a progressive widening of A-aO2diff, which during
maximal exercise can exceed 25-30 mmHg (Dempsey & Wagner, 1999). Once past the

Respiratory Muscle Work and Tissue Oxygenation Trends During Repeated-sprint Exercise
∼ 21 ∽
alveolar-capillary membrane, O2 enters the blood stream (oxygenation). Because O2 has
such low solubility in plasma (Christoforides, Laasberg, & Hedley-Whyte, 1969), the
majority of O2, approximately 98%, is transported via a reversible bond to haemoglobin
(Hb) (Collins, Rudenski, Gibson, Howard, & O’Driscoll, 2015).
2.3.1.3 Oxygen transport from the lungs to the tissue
The Hb protein can bind up to four molecules of O2, and is densely packed within
red blood cells (Jensen, 2009; Mairbäurl, 2013; Storz, 2016). The now oxygenated blood
returning from the lungs is pumped into the aorta via the left ventricle. To meet the blood
flow demands of exercise, cardiac output increases via a combination of increased heart
rate (HR), and stroke volume (Joyner & Casey, 2015; Siebenmann & Lundby, 2015). For
an increase in cardiac output to be effective at supplying O2 for exercise metabolism,
blood flow is directed away for regions of low metabolic activity, and towards regions of
high activity (Hellsten, Nyberg, Jensen, & Mortensen, 2012; Joyner & Casey, 2014; Reglin
& Pries, 2014). The release of vasoactive substance increases with tissue metabolism (i.e.
muscle contraction), so that any increase in metabolism will result in a proportional rise
in blood flow to that region (Joyner & Wilkins, 2007).
2.3.1.4 Tissue gas exchange
When a red blood cell passes through capillary beds of muscle tissue, it enters an
environment of low O2 and the steep portion of the oxygen dissociation curve (Figure 2.4)
(Mairbäurl, 2013). The change in O2-Hb binding affinity causes O2 to be released into the
plasma, and then diffuse into the tissue (Jensen, 2004). By-products of metabolism, which
are especially prominent during exercise, also have a negative allosteric effect on O2-Hb
binding affinity. The major effectors are, 2,3-diphosphoglycerate acid (by-product of
glucose metabolism in red blood cells), temperature, H+ and CO2 (Astrup, Engel,

Literature Review
∼ 22 ∽
Severinghaus, & Munson, 1965; Benesch & Benesch, 1967; Bohr et al., 1904; Dill & Forbes,
1941; Næraa, Petersen, Boye, & Severinghaus, 1966). Therefore, when a red blood cell
passes through tissues with high metabolic demands, O2 will be readily unbound from Hb
(Mairbäurl, 1994, 2013). As exercise intensity increases, the amount of O2 extracted by
the contracting muscles increase, which results in a reduction in O2 returning to the
alveoli and widening of A-aO2diff (Dempsey, Johnson, & Saupe, 1990). The rate of muscle
oxygen uptake determined based on the Fick principal (Fick, 1870), and is calculated as:
Equation 2.3: Fick equation (Albouaini, Egred, Alahmar, & Wright, 2007).
�̇�𝑉𝐻𝐻2 = �̇�𝑄(𝑎𝑎 − �̅�𝑣𝐻𝐻2𝑑𝑑𝑑𝑑𝑑𝑑𝑑𝑑)
where Q̇ is blood flow, and a-v�O2diff is arterial venous oxygen difference.
2.3.2 Blood Flow Redirection and Competition during Exercise
Blood flow to contracting muscles closely matches the metabolic rate (Andersen
& Saltin, 1985; Hamann et al., 2005; Harms et al., 1998; Knight et al., 1992; Rowell et al.,
1986). It has been robustly demonstrated that there is a positive linear relationship
between the rate of O2 uptake (V� O2) in the quadriceps muscles and blood flow through
the femoral artery (Andersen & Saltin, 1985; Richardson et al., 1993), which ensures that
there is a match between O2 supply and demand for the exercising muscles. Blood flow is
directed to areas of need by vasoconstriction in the relatively inactive regions, and
vasodilatation in the active locomotor muscles (Harms et al., 1997; Harms et al., 1998;
Hellsten et al., 2012; McAllister, 1998; Secher & Volianitis, 2006). During high-intensity
and maximal exercise, the accompanying increase in cardiac output is almost exclusively
devoted to the working skeletal muscle (Joyner & Casey, 2015), whereas blood flow to
the splanchnic, renal and inactive skeletal muscle tissue beds can fall by ~70% from
resting values during maximal exercise (Poortmans, 1984; Rowell, Blackmon, Kenny, &
Respiratory Muscle Work and Tissue Oxygenation Trends During Repeated-sprint Exercise
∼ 23 ∽
Escourrou, 1984). It is likely that multiple biological factors contribute to biological
redundancy in the system (Joyner & Wilkins, 2007). However, there does appear to be a
limit to systemic vasodilation, a procreative mechanism to maintain arterial blood
pressure and ensure adequate O2 supply to vital organs (Calbet & Lundby, 2012;
Dempsey, Romer, Rodman, Miller, & Smith, 2006; Saltin, 1985; Secher & Volianitis, 2006).
Additionally, when the metabolic demands of multiple muscle groups are high, and
cardiac output is nearing maximal flow rates, competition for available blood flow can
arise between exercise muscle groups. However, there is some conflicting evidence.
When arm exercise is superimposed on ongoing leg exercise, V� O2 is lower than
the sum of the arm and leg exercise alone, which is suggestive of compromised O2 delivery
(Secher et al., 1977; Volianitis & Secher, 2002). For example, when subjects performed
upright cycle ergometer and arm crank exercise in isolation, a V� O2 of 67% and 44% of
V� O2max respectively was induced (Secher et al., 1977). However, when performed in
combination, a V� O2 of only 77% V� O2max was observed during exercise. The mismatch
required O2 uptake and actual O2 uptake was likely caused by an increased leg vascular
resistance (1.8 [S.E. 0.51] mmHg·min·1-1), which resulted in a decrease in leg blood flow
by 1.9 L·min-1 (S.E. 0.72). Not only is O2 uptake compromised in the lower limbs, but in
the upper body too. While performing the combined exercise of arm crank and cycle
ergometry, a V� O2 of ~95% of V� O2max was elicited (Volianitis & Secher, 2002), lower than
what would have been predicted by combining the arm and leg exercise (arm V� O2: 58%
V� O2max; leg V� O2: 60% V� O2max). In this instance arm blood flow and O2 uptake was
attenuated by 0.58 L·min-1 and 0.40 ± 0.06 L·min-1 during the combined exercise
(Volianitis & Secher, 2002). In both these examples, blood flow, and consequently muscle

Literature Review
∼ 24 ∽
O2 uptake, was compromised when combined arm and leg exercise was performed
compared to when the muscle groups are solicited in isolation.
To gain insights on the effects of combined upper and lower body exercise on
arm blood flow and muscle tissue oxygenation, thermodilution has been used in
conjunction with near-infrared spectroscopy (NIRS) of the biceps brachii (Volianitis et
al., 2003). Arm blood flow was ~0.35 L·min-1 lower when combined arm and leg exercise
was performed compared to arm exercise alone. The concentration of oxyhaemoglobin
([O2Hb]) and total haemoglobin ([tHb]) biceps brachii was also lower during the
combined exercise compared to arm exercise alone. The reduction in muscle tissue
oxygenation during the combined exercise was likely due to the attenuation of arm blood
flow caused by competition for available cardiac output with the lower limbs (Volianitis
et al., 2003).
There is also some evidence that single leg blood flow can be maintained during
whole body maximal exercise. Leg blood flow was measured in five healthy male
competitive cyclists during incremental single leg knee extensor exercise, and during
incremental double-legged knee extensor with superimposed incremental arm crank
exercise (Richardson, Kennedy, Knight, & Wagner, 1995). Data presented in this study
did not support blood flow competition since leg blood flow was not compromised during
the combined arm and leg exercise. However, leg blood flow was ~1.0 L·min-1 lower while
exercising at 90% and 100% of max work rate, but the difference was not statically
significant. Differences in relative work rate subjects exercise at, and low statistical
power due to the small sample size (n = 5), may have caused this discrepancy between
studies (Secher et al., 1977; Volianitis & Secher, 2002). In a meta-analysis included within
the Volianitis and Secher (2002) study which took into account the negative findings

Respiratory Muscle Work and Tissue Oxygenation Trends During Repeated-sprint Exercise
∼ 25 ∽
(Richardson et al., 1995), revealed that the combination of arm and leg exercise limits
lower limb blood flow by 11.0 ± 3.7% (Glass’s effect size: 0.732 [95% confidence limits,
0.328-1.137]).
While the exercise model of superimposed arm exercise lacks ecological validity,
it does highlight how cardiac output is distributed between exercising muscle groups
competing for O2. Perhaps more relevant to the exercising human is the interaction
between locomotor and respiratory muscles during high-intensity exercise. There is
evidence that the O2 cost of exercise hyperpnoea, and associated blood flow
requirements, can compromise the proportion of cardiac output devoted to the
locomotor muscles (Aaron, Seow, et al., 1992; Harms et al., 1997; Harms et al., 1998).
Though the mechanisms responsible for the change in blood flow distribution are likely
similar, the relevance to exercise is far more persistent. The work and O2 cost of exercise
hyperpnoea rises exponentially with V� E (Aaron, Johnson, Seow, & Dempsey, 1992; Turner
et al., 2012). Therefore during high-intensity exercise when ventilation demands are
higher, an O2 competitive environment can arise between locomotor and respiratory
muscles for available cardiac output (Harms et al., 1998).
RESPIRATORY MUSCLE WORK DURING EXERCISE
The increased V� E required for effective CO2/H+ elimination is achieved by the
respiratory pump muscles (Sheel & Romer, 2012). From rest to moderate exercise, the
energy requirements of exercise hyperpnoea can be readily met by utilising only a small
fraction of the respiratory system capacity (Margaria, Milic-Emili, Petit, & Cavagna, 1960).
Whereas during high-intensity exercise when ventilation requirements are great, and the
O2 cost of exercise hyperpnoea can pose limitations to exercise capacity (Dempsey et al.,
2006; Harms et al., 2000).
Literature Review
∼ 26 ∽
2.4.1 Mechanics of Pulmonary Ventilation
Pulmonary ventilation is the process by which air flow is generated by the
respiratory muscles to change the pressure within the lungs by acting on the thoracic
cavity to change their volume (Wilson, 2016). The relationship between pressure and
volume is described by Boyle’s Law:
Equation 2.4: Boyle's law (Boyle, 1662).
𝑃𝑃1 × 𝑉𝑉1 = 𝑃𝑃2 × 𝑉𝑉2
where P1 and V1 represent the pressure and volume of the original gas, and, P2 and V2 are
the second pressure and volume. Inhalation commences when the diaphragm contracts,
moving downwards to increase the space in the thoracic cavity for the lungs to expand
(Aliverti et al., 1997). The intercostal muscles aid in increasing the space by pulling the
ribs upward and outward (Aliverti, 2016; Ratnovsky, Elad, & Halpern, 2008). As the lungs,
expand air is drawn in via the mouth or nose, down the trachea, through the bronchial
tubes and into the pulmonary alveoli (Ratnovsky et al., 2008; Strohl, Butler, & Malhotra,
2012; Wilson, 2016). Once inspiration is complete, respiratory muscles relax and elastic
recoil compress the thoracic cavity to reduce the size of the lungs. The positive pressure
created by decreasing lung volume forces air out of the lungs and trachea through the
mouth/nose (Strohl et al., 2012). When breathing demands are high, such as during
exercise, exhalation becomes a more active process to reduce expiratory time and the
overall duty cycle of each breath (Aliverti et al., 1997; Henke, Sharratt, Pegelow, &
Dempsey, 1988; Strohl et al., 2012; Younes & Kivinen, 1984). The work done by the
respiratory muscles increases from rest to maximal exercise, along with the O2 cost of
breathing. (Aaron, Johnson, et al., 1992; Aaron, Seow, et al., 1992). That is, as hyperpnoea

Respiratory Muscle Work and Tissue Oxygenation Trends During Repeated-sprint Exercise
∼ 27 ∽
rises, O2 is consumed at an increasing rate by the respiratory muscles to move air in and
out of the lungs for gas exchange.
2.4.2 Respiratory Muscle Work and the Oxygen Cost of Breathing
When breathing, the respiratory muscles perform work to overcome the elastic
recoil of the lungs and chest, resistance from turbulent and viscous air flow through the
respiratory tract and tissue deformation (Otis, Fenn, & Rahn, 1950). In healthy subjects,
at rest, the work of breathing is approximately 0.25-1.5 J·L-1 (Dellweg, Haidl, Siemon,
Appelhans, & Kohler, 2008). As V� E rises, there is an exponential increase in the work being
performed by the respiratory muscles (Figure 2.4) (Aaron, Johnson, et al., 1992; Margaria
et al., 1960; Otis, 1954; Otis et al., 1950). The rise in work of breathing in this way is
caused by two factors, 1) dynamic hyperinflation to accommodate greater expiratory
flow rates (Pellegrino et al., 1993), and 2) progressive increase in the contribution of the
expiratory muscles to breathing (Aliverti et al., 1997). As the lungs and chest are
progressively stretched to accommodate the increasing volume of inhaled air and end-
expiratory lung volume is reduced, the contribution of elasticity in these tissues to the
work of breathing increases (Guenette, Witt, McKenzie, Road, & Sheel, 2007; B. D.
Johnson, Babcock, Suman, & Dempsey, 1993).

Literature Review
∼ 28 ∽
Figure 2.5: Mechanical work of breathing relative to pulmonary minute ventilation. The work performed by the respiratory muscles during exercise is expressed as joules per minute (joules/min; 1 J·min-1 = 0.0167 W), and pulmonary ventilation (V� E) is expressed as litters per minute (l/min). Subjects (n=8) mimicked their V� E from an incremental exercise test at two work rates corresponding to the attainment of 70% (64-78%) and 100% of V� O2max. Each symbol represents a single mimicking trial in an individual subject with a fitted regression line (r=0.88). The symbols ▴ and • represent data from the 70% and 100% V� O2max mimicking trials. Reproduced from Aaron, Johnson, et al. (1992).
Accompanying the changes in work of breathing with V� E, there is a certain O2 cost
of exercise hyperpnoea which increases from rest to maximal exercise (Figure 2.5).
(Aaron, Johnson, et al., 1992; Dominelli et al., 2015). In exercise, respiratory muscle
oxygenation progressively declines with increasing intensity (Legrand et al., 2007;
Mancini, Ferraro, Nazzaro, Chance, & Wilson, 1991; Moalla, Dupont, Berthoin, & Ahmaidi,
2005; Terakado et al., 1999). Using NIRS to interrogate respiratory muscle oxygenation,
there is a gradual increase in [HHb] and decrease in [O2Hb]. At the respiratory
compensatory point, the rate of [HHb] and [O2Hb] change is greatly accelerated (Legrand
et al., 2007; Terakado et al., 1999).

Respiratory Muscle Work and Tissue Oxygenation Trends During Repeated-sprint Exercise
∼ 29 ∽
By mimicking the ventilation pattern obtained during exercise while at rest, it is
possible to estimate the proportion of whole body V� O2 that is devoted to the respiratory
muscles. To determine the O2 cost of exercise hyperpnoea, a target V� E is maintain for 4-6
min by replicating the exercise ƒb and VT. Eucapnia is maintained by inspiring a gas
mixture consisting of 4-5% CO2 and 21% O2. To calculate the O2 cost of hyperpnoea, V� O2
determined during quiet rest is subtracted from the values obtained from the mimicking
trials. During moderate exercise, it is estimated that the O2 cost of breathing accounts for
3-6% of the total whole body V� O2. During high-intensity exercise, the relative
contribution of exercise hyperpnoea to whole body V� O2 increases to 10-15% (Aaron,
Seow, et al., 1992; Harms et al., 1998; Turner et al., 2012). Though, there is a broad range
which the O2 cost of hyperpnoea can represent as a percentage of total V� O2 during
maximal exercise. Estimates have ranged between 5.0% and 17.6% (mean = 8.8 ± 3.3%)
with only six of the twenty one subjects examined obtaining results greater than 10%
(Vella, Marks, & Robergs, 2006). Similarly broad results of the O2 cost of breathing have
been published by others (Dominelli et al., 2015). The O2 cost of breathing was estimated
to range between ~8-24% (mean = 13.8%) in females, and ~6-18% (mean = 9.4%) in
males during maximal exercise (Dominelli et al., 2015). Aside from the structural
characteristics of the pulmonary system, the relative strength of the respiratory muscles
is likely to have a key role in the O2 cost of exercise hyperpnoea. After 6 weeks of
inspiratory muscle strength training, ventilation O2 efficiency was improved compared
with sham training (training at an intensity shown to exhibit no changes in inspiratory
muscle function) (Turner et al., 2012). Specific training targeting the respiratory muscles
reduces the relative intensity of hyperpnoea, and therefore, the O2 cost of breathing at
any given V� E (Witt, Guenette, Rupert, McKenzie, & Sheel, 2007).

Literature Review
∼ 30 ∽
The work of breathing associated with high-intensity and maximal exercise
requires a considerable portion of whole-body O2 uptake, which creates an environment
where the locomotor and respiratory muscles compete for O2 delivery (Harms et al.,
1997; Harms et al., 1998). Therefore, respiratory muscle work likely contributes to the
development of locomotor muscle fatigue, and reduces the capacity to sustain high-
intensity exercise (Dempsey et al., 2006; Romer & Polkey, 2008).
Figure 2.6: Relationship of exercise pulmonary ventilation to respiratory muscle oxygen uptake. Subjects (n=16; V� O2max: 61.8 mL·Kg-1·min-1) mimicked their exercise ventilation rate (V� E) at rest which corresponded to the attainment of 50, 75, and 100% V� O2max. Each symbol represents a single mimicking trial in an individual subject with a fitted regression line (solid) and 95% confidence intervals. A significant correlation between respiratory muscle oxygen uptake (V� O2RM) and V� E was found (P>0.05, r=0.88). The symbols ▴ and • represent pre-training data from control and inspiratory muscle training groups respectively. Reproduced from Turner et al. (2012).
Respiratory Muscle Work and Tissue Oxygenation Trends During Repeated-sprint Exercise
∼ 31 ∽
2.4.3 Consequences of Sustained Respiratory Muscle Work
In a comparable way that the lower and upper limbs compete for cardiac output
during strenuous exercise, the respiratory and lower limb locomotor muscles also
compete. The relationship between respiratory and lower limb locomotor muscle groups
is particularly challenged during sustained high-intensity exercise (>80% V� O2mx). The
degree of hyperaemia necessary to support the substantial demands of the respiratory
muscles can limit the proportion of cardiac output available for the locomotor muscles to
perform high-intensity work.
2.4.3.1 Locomotor Muscle Fatigue
An inverse relationship exists between the work of breathing and leg O2 uptake
during maximal exercise (Harms et al., 1997). To reduce the work of breathing,
proportional assist ventilation (PAV) can be used to generate inspiratory pressure
proportional to the effort of the patient/subject (Younes et al., 1992). Conversely, to
elevate inspiratory muscle work, a mesh screen can be placed over the inspiratory line,
or the aperture of an inspiratory port can be reduced. In one such study employing these
techniques, subjects exercised at a workload sustainable for 2.5-3 min at, or near a work
rate corresponding to the attainment of V̇O2max. The work of breathing was attenuated by
60% with PAV, and increased by 95% with inspiratory loading compared to control
during the exercise bout. Elevating the work of breathing had negligible effect on whole
body V� O2. Moreover, both leg blood flow and V� O2 fell compared to control exercise which
coincided with an increase in leg vascular resistance, which suggests that cardiac output
did not increase to accommodate the additional muscular work (Harms et al., 1998). It is
likely that blood flow was redistributed to the respiratory muscles to support the
heightened metabolic activity at the expense of the locomotor muscles (Harms et al.,

Literature Review
∼ 32 ∽
1997). When the respiratory muscles were unloaded with PAV, there was a slight
increase in limb blood flow which corresponded with an increase in leg V� O2. By reducing
the metabolic demands of the respiratory muscles, O2 delivery to the lower limbs can be
improved. The “normal” work of breathing incurred during high-intensity exercise may
actually be a limiting factor of O2 transport to the locomotor muscle during high-intensity
exercise (Harms et al., 1997).
When inspiratory loading has been added to continuous locomotor exercise to
increase the work of breathing, locomotor muscle oxygenation trends are negatively
impacted (Turner et al., 2013). While exercising at a work rate corresponding to 80% of
V� O2max, locomotor and respiratory muscle oxygenation was monitored with NIRS. Before
inspiratory loading was added, there was a plateau of [O2Hb] and [HHb] in the different
muscle groups, indicative of achieving a steady state (Grassi et al., 2003). Exercise was
continued for a further 3 min with the addition of an inspiratory load, which was,
achieved by reducing the aperture of the inspiratory line to 10 mm, and 8 mm. In
response to the elevated work of breathing, there was a proportional increase in
respiratory muscle [HHb] (Aaron, Johnson, et al., 1992; Aaron, Seow, et al., 1992; Wetter,
Harms, Nelson, Pegelow, & Dempsey, 1999). There was also an increase in limb [HHb]
from 12.2 ± 9.0 µm, to 15.3 ± 11.7 µm, but only during exercise with the smallest
inspiratory aperture (Turner et al., 2013). The increase in limb [HHb] in the absence of
increased O2 uptake, reflects a decrease in O2 delivery to the locomotor muscles
(Kowalchuk, Rossiter, Ward, & Whipp, 2002).
Exercise intensity also plays an important role in the competition between the
locomotor and respiratory muscles for available O2. While exercising at submaximal work
rates (50-75 % V� O2max), there was a small but significant increase in whole body V� O2 in

Respiratory Muscle Work and Tissue Oxygenation Trends During Repeated-sprint Exercise
∼ 33 ∽
response to an elevated work of breathing (Wetter et al., 1999). Since V� O2 responded
proportionally to the changes in inspiratory muscle work, suggests that there is enough
capacity in cardiac output to increase to meet the demands of additional muscular work
during submaximal exercise (Harms et al., 1997). It is only during high-intensity exercise
when cardiac output begins to approach maximal flow rates that competition for
available blood flow begins to develop (Harms et al., 1997).
Since the high work of breathing during high-intensity exercise (>80% V� O2max)
seems to have a limiting effect on locomotor muscle blood flow, the rate development of
peripheral fatigue is likely affected too. To examine exercise-induced quadriceps muscle
fatigue, supra-maximal femoral nerve stimulation was used, which provided an objective
measure of muscle force generation capacity (Polkey et al., 1996). Peripheral muscle
fatigue was assessed after four bouts of exercise at a work rate corresponding to the
attainment of 92% of V� O2max (Romer, Lovering, et al., 2006). On one occasion, subjects
exercised to volitional exhaustion (13.2 min). On a separate visit, exercise of the same
work rate and duration was repeated while the respiratory muscle were unloaded using
PAV (56% reduction of inspiratory muscle work). Following the completion of exercise,
peripheral muscle fatigue was 8% greater when subjects were not using the breathing
assistance. To examine how a heightened work of breathing affects peripheral fatigue,
exercise was repeated with inspiratory loading (80% increase of inspiratory muscle
work) to exhaustion (7.9 min). Following the termination of exercise, the force generating
capacity of the quadriceps was 8% lower when performed with inspiratory loading
compared to control (Romer, Lovering, et al., 2006). These data show that peripheral
fatigue can be manipulated by altering the work for breathing, which suggests that
respiratory muscle work is a limiting factor of high-intensity exercise. It is likely that

Literature Review
∼ 34 ∽
blood flow competition between the locomotor and respiratory muscles contribute to
exercise-induced fatigue (Harms et al., 1997; Harms et al., 1998).
It is unlikely for healthy humans to undergo inspiratory loading during exercise.
However, exposure to (simulated) altitude is a more common environmental condition
that will increase the work of breathing compared to normoxia via a stimulation of V� E. To
examine the relationship between hypoxia-induced elevated work of breathing and
peripheral fatigue, subjects were exercised at a constant work rate (~273 W)
corresponding to 82% of V� O2max in simulated altitude (FIO2 = 0.15) to exhaustion (Amann,
Pegelow, et al., 2007). Exercise was then repeated at the same work rate for an identical
duration in normoxia (~273 W for 8.6 min). Compared to hypoxia, subjects performed
36% less inspiratory muscle work while exercising in normoxia, and incurred a lesser
reduction in quadriceps force generation (normoxia -16%, hypoxia -30 %). To isolate the
effects of the work of breathing on peripheral fatigue, subjects repeated both exercise
trials (normoxia and hypoxia) using PAV. Inspiratory muscle work was nearly identical
during exercise and the reduction in hypoxia induced peripheral fatigue was slightly
attenuated compared to normoxia (normoxia -15%, hypoxia -22%). Exercising at a work
rate where the work of breathing has no discernible effect of quadriceps fatigue in
normoxia, fatigue development is accelerated in hypoxia when matched for inspiratory
muscle work. (Amann, Pegelow, et al., 2007; Romer, Lovering, et al., 2006). By alleviation
respiratory muscle work in hypoxia, the development of peripheral fatigue can be
lessened during high-intensity exercise.

Respiratory Muscle Work and Tissue Oxygenation Trends During Repeated-sprint Exercise
∼ 35 ∽
2.4.3.2 Respiratory Muscle Fatigue
Diaphragm fatigue can develop concomitantly with locomotor fatigue during
high-intensity exercise, primarily due to the respiratory muscle work necessary to
sustain the required V� E (Amann, Pegelow, et al., 2007; B. D. Johnson et al., 1993; Vogiatzis
et al., 2008). Using supra-maximal stimulation of the phrenic nerve, the pressure
generation capacity of the diaphragm can be assessed. Phrenic nerve stimulation (PNS)
depolarises nerves at the base of the neck responsible for diaphragm contractions. When
exercising above 80% V� O2max until volitional exhaustion, pressure generation capacity
can decrease by 40% from pre-exercise levels, and take over an hour to recover (B. D.
Johnson et al., 1993). However, if the same work of breathing is mimicked at rest,
diaphragm fatigue does not develop (Babcock, Pegelow, McClaran, Suman, & Dempsey,
1995). Blood flow competition may explain the diaphragm fatigue that occurs during
high-intensity exercise which is not present when a similar diaphragm work is performed
at rest (Secher & Volianitis, 2006).
To explore the role hypoxia plays in the development of diaphragm fatigue, a
group of subjects exercised at 85% of V� O2max to exhaustion while breathing either room
air (FIO2 = 0.21) or a hypoxic gas mixture (FIO2 = 0.15) (Babcock, Johnson, et al., 1995).
There was a decrease in exercise time by 9 min breathing the hypoxic gas mixture
(normoxia: 24.9 min; hypoxia: 15.8 min), and the work of breathing was 24% higher at
the start and middle portions of the exercise bout. However, the degree of diaphragm
fatigue incurred at the end of exercise was similar after exercise in both conditions. The
hypoxic effects on exercise-induced diaphragm fatigue is that the rate of fatigue
development was accelerated so that the same reduction of pressure generating capacity
was reached in a shorter time. It has been proposed that fatigue can be “centrally”

Literature Review
∼ 36 ∽
regulated to ensure that a critical threshold of fatigue is not exceeded, to prevent
excessive homeostasis disruption (Noakes, 2011). Once the critical fatigue threshold is
reached, central motor drive is reduced so that exercise can no longer continue at the
same intensity (Amann & Dempsey, 2008; Amann, Eldridge, et al., 2006; Billaut et al.,
2013). When exercise is performed at the same absolute work rate between normoxic
and hypoxic (Babcock, Johnson, et al., 1995), V� E and the work of breathing is likely to be
higher to offset the reduced O2 availability (Amann, Pegelow, et al., 2007; Forster et al.,
2012). Therefore the development of diaphragm fatigue may not solely be affected by
hypoxemia per se, but simply the elevated work being performed by the diaphragm.
To explore the relationship between respiratory muscle work and O2 availability,
locomotor work can be manipulated to produce a similar work of breathing in varying
environmental conditions. To replicate the work of breathing at varying inspired O2 gas
concentration, seven trained cyclists were exercised at work rates corresponding to 90%,
80% and 65% of V� O2max, while breathing air consisting an FIO2 of 1.00, 0.21 and 0.13
(Vogiatzis et al., 2008). At the conclusion of exercise (5 min), diaphragm fatigue was
greater in hypoxia despite less leg locomotor work being performed (Vogiatzis et al.,
2008; Vogiatzis et al., 2007a). There was also no compensatory increase in respiratory
muscle blood flow (measured with NIRS and an indocyanine green tracer) in response to
the altered O2 availability (Vogiatzis et al., 2008).
In theory, reduced leg work should increase the proportion of cardiac output
available to the respiratory muscles. Since this is not the case, perhaps the respiratory
muscle work associated with high-intensity exercise is sufficiently strenuous to induce
maximal vasodilatation. Though hypoxia is a potent vasodilator (Joyner & Casey, 2014),

Respiratory Muscle Work and Tissue Oxygenation Trends During Repeated-sprint Exercise
∼ 37 ∽
there is no additive effect on respiratory muscle blood flow when exercising at near
maximal work rates (Koskolou, Calbet, Radegran, & Roach, 1997).
2.4.3.3 Respiratory Muscle Metaboreflex
Despite exercise hyperpnoea being a protective mechanism against hypercapnia
and hypoxia, the work of breathing is associated with increased locomotor and
diaphragm fatigue, and is accelerated by hypoxia (Amann, Pegelow, et al., 2007; Babcock,
Johnson, et al., 1995; Gudjonsdottir et al., 2001; Verges, Bachasson, & Wuyam, 2010). A
respiratory muscle metaboreflex (Figure 2.6) is the likely cause of limited blood flow
during a sustained high work of breathing (Dempsey et al., 2006). In resting and
submaximal exercising dogs, it has been demonstrated that infusing lactate acid into the
diaphragm via the phrenic artery causes limb vasoconstriction and reduced blood flow,
and increases mean arterial pressure (Rodman, Henderson, Smith, & Dempsey, 2003).
An accumulation of reflex-activating by-products of muscle contraction (lactate,
potassium, deprotonated phosphate, adenosine and CO2) stimulates the discharge of
chemically sensitive group III/IV afferent nerve fibres in the fatiguing diaphragm
(Amann, 2012; J. M. Hill, 2000). Reflexively, discharge of group III/IV afferent nerve fibres
causes an increased lower limb sympathetic nerve discharge and vasoconstriction
(Harms et al., 1997; Sheel et al., 2001; St Croix, Morgan, Wetter, & Dempsey, 2000).
Changes in lower-limb vascular conductance serve to support blood flow demands of the
fatiguing respiratory muscles to ensure critical failure does not occur (Joyner & Casey,
2015). As a consequence of increased blood flow to the respiratory muscles, locomotor
O2 transport is attenuated which accelerated development of limb fatigue during high-
intensity exercise (Dempsey et al., 2006).
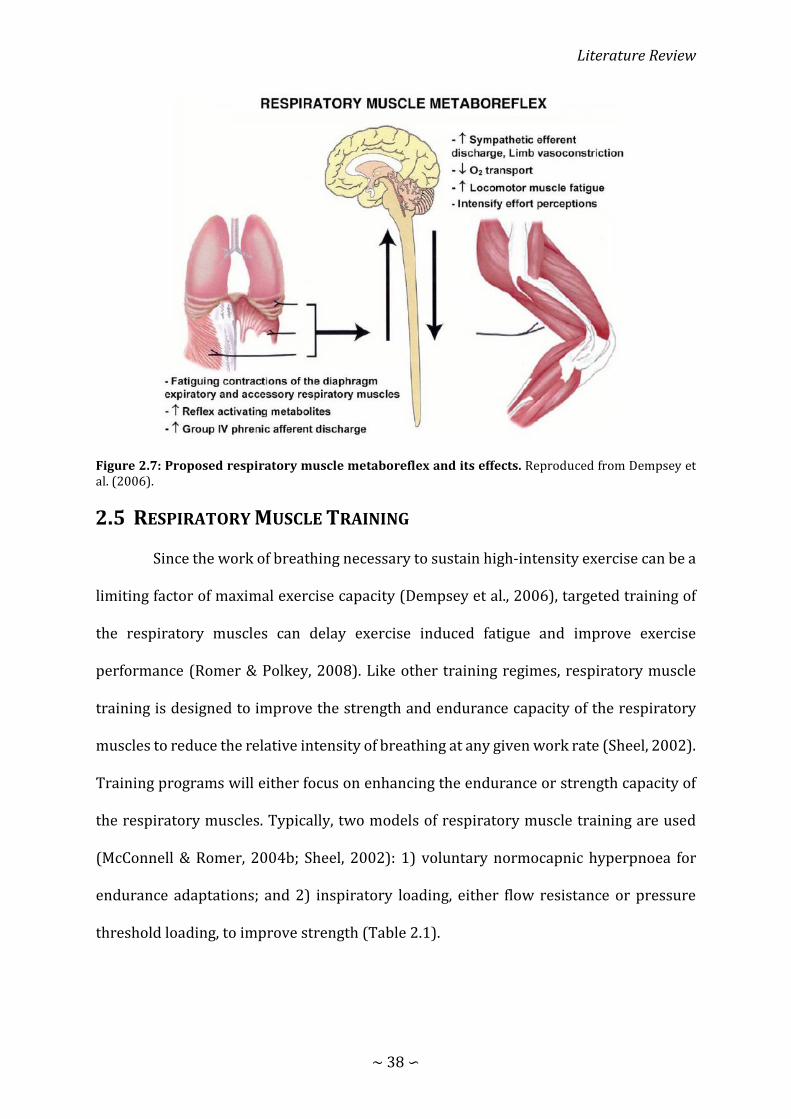
Literature Review
∼ 38 ∽
Figure 2.7: Proposed respiratory muscle metaboreflex and its effects. Reproduced from Dempsey et al. (2006).
RESPIRATORY MUSCLE TRAINING
Since the work of breathing necessary to sustain high-intensity exercise can be a
limiting factor of maximal exercise capacity (Dempsey et al., 2006), targeted training of
the respiratory muscles can delay exercise induced fatigue and improve exercise
performance (Romer & Polkey, 2008). Like other training regimes, respiratory muscle
training is designed to improve the strength and endurance capacity of the respiratory
muscles to reduce the relative intensity of breathing at any given work rate (Sheel, 2002).
Training programs will either focus on enhancing the endurance or strength capacity of
the respiratory muscles. Typically, two models of respiratory muscle training are used
(McConnell & Romer, 2004b; Sheel, 2002): 1) voluntary normocapnic hyperpnoea for
endurance adaptations; and 2) inspiratory loading, either flow resistance or pressure
threshold loading, to improve strength (Table 2.1).

Respiratory Muscle Work and Tissue Oxygenation Trends During Repeated-sprint Exercise
∼ 39 ∽
2.5.1 Respiratory Muscle Endurance Training
Voluntary normocapnic hyperpnoea requires individuals to sustain a high target
V� E (60-90% maximal voluntary ventilation) for up to 30 min, 5 days per week (Boutellier,
Büchel, Kundert, & Spengler, 1992; McMahon, Boutellier, Smith, & Spengler, 2002;
Sonetti, Wetter, Pegelow, & Dempsey, 2001; Wylegala, Pendergast, Gosselin, Warkander,
& Lundgren, 2007). Multiple studies have demonstrated positive functional respiratory
adaptations after voluntary normocapnic hyperpnoea training, which have translated to
enhanced exercise capacity (see Table 2.1). For example, a group of fifteen subjects
completed 40 sessions of voluntary hyperpnoea over a 15-week period, consisting of
30 min breathing at 60% of maximal voluntary ventilation (Markov, Spengler, Knöpfli-
Lenzin, Stuessi, & Boutellier, 2001). After the training intervention, respiratory muscle
time to exhaustion was extended from 4.6 min (range: 2.0-10.2 min) to 40 min (15.4-40.0
min; tests were terminated after 40 min if no sign of exhaustion was present). Constant-
load cycling time to exhaustion (cycling at 70% of V� O2max; same absolute work rate was
used in post testing) was extended by 24% (35.6 ± 11.9 min vs. 44.2 ± 17.6 min). Time to
exhaustion was improved without the cardiovascular adaptation (V� O2max, cardiac stroke
volume, substrate utilisation) that are traditionally seen with whole body training. Seeing
as cycling time to exhaustion was extended without changes in cardiovascular function,
exercise was likely extended through localised adaptation of the respiratory muscles
(Markov et al., 2001). Following training, the respiratory muscles were more fatigue
resistant, and accumulated less metabolic by-products (Verges, Renggli, Notter, &
Spengler, 2009). As introduced earlier (section 2.4.3), diaphragm fatigue is known to be
a potent stimulant of sympathetically mediated vasoconstriction (Dempsey et al., 2006).
Therefore, delaying the development of diaphragm fatigue would suspend a respiratory
Literature Review
∼ 40 ∽
muscle metaboreflex having a subsequent significant effect on locomotor blood flow
(McConnell & Lomax, 2006; Witt et al., 2007).
There are a few drawbacks from respiratory muscle endurance training. First, it
is relatively time consuming compared to other forms of respiratory muscle training, and
requires a high degree of motivation from the participants to maintain their target V� E.
Second, preventing hypocapnia during voluntary hyperpnoea has traditionally been
constrained to the laboratory setting. Commercially available rebreathing equipment
(SpiroTiger®) have made training more accessible, but the devices are considerably
more complicated and expensive than pressure threshold training devices.
2.5.2 Respiratory Muscle Strength Training
Another training method to improve the functional capacity of the respiratory
muscle is inspiratory pressure threshold training (inspiratory muscle training, IMT).
Commercially available training devices (POWERbreathe®) that are relatively cheap and
simple to use have made this form of training easily accessible to large groups of people.
Training typically involves inspiring against a closed valve set to open at ~50% of an
individual’s maximal inspiratory mouth pressure (MIP), repeated 30 times twice per day.
Pressure threshold training is associated with diaphragm hypertrophy (Downey et al.,
2007) and an increased in inspiratory pressure generation of ~20-40% (see Table 2.1).
Strengthening the inspiratory muscles has translated to reduced O2 cost of voluntary
hyperpnoea, attenuated exercise-induced respiratory muscle fatigue, and improved
exercise capacity. (Downey et al., 2007; Illi, Held, Frank, & Spengler, 2012; Turner et al.,
2012).
Enhanced exercise performance following training likely results from an
enhanced functional capacity of the respiratory muscles. Therefore, for any given V� E
Respiratory Muscle Work and Tissue Oxygenation Trends During Repeated-sprint Exercise
∼ 41 ∽
during exercise, a smaller fraction of the maximal pressure generating capacity is
required to maintain hyperpnoea. The O2 cost of exercise hyperpnoea has been estimated
to account for 10-15% of whole body V� O2 during high-intensity exercise (Aaron, Johnson,
et al., 1992; Dominelli et al., 2015). However, training the respiratory muscles can
increase their pumping efficiency. Following 6 weeks of IMT, a group of trained cyclists
improved their MIP by 22% (Turner et al., 2012). As a result of increasing inspiratory
muscle strength, the contribution of exercise hyperpnoea to whole body V� O2 during
maximal exercise decreased from 11% to 8% (Turner et al., 2012). Presumably lowering
the O2 cost of exercise hyperpnoea increased the proportion of cardiac output available
for locomotor exercise (Harms et al., 1998). Additionally, the magnitude of the
respiratory muscle metaboreflex can be weakened by attenuating respiratory muscle
fatigue. Following 6 weeks of IMT, a decrease in respiratory muscle function (mean
maximal inspiratory mouth pressure at zero flow rate, and inspiratory flow rate at 30%
of maximal inspiratory pressure) was lessened after 20-km and 40-km trials (Romer,
McConnell, & Jones, 2002a, 2002c). Exercise time to completion was also improved by
3.8% and 4.6% during the 20-km and 40-km time trials, respectively. Since exercise
induced respiratory muscle fatigue is lower after training, improvements in performance
are likely derived from a blunted respiratory muscle metaboreflex and locomotor O2
availability (McConnell & Lomax, 2006). Increasing respiratory muscle strength may
even be transferable to hypoxic environments where there is greater strain on the
respiratory musculature and connective O2 transport.
At terrestrial altitude, or when breathing a hypoxic gas mixture, the work of
breathing can be 20-30% higher and diaphragm fatigue is accelerated (Babcock, Johnson,
et al., 1995). Following a constant speed treadmill running test in hypoxia (FIO2 = 0.14)

Literature Review
∼ 42 ∽
at 85% of V� O2max, four weeks of IMT blunted exercise-induced inspiratory muscle fatigue
(Downey et al., 2007). Attenuating a fall in MIP following exercise is likely achieved
through a reduction in the fraction of maximal pressure generated with each breath
during exercise. Following IMT, V� E can also be lower during exercise which would lower
the work of breathing (Downey et al., 2007; Lomax, Massey, & House, 2017). It is unclear
why V� E would be lower following training, but could be partly attributed to a reduction
in ventilatory drive achieved by a 5-6% increase arterial O2 saturation (Downey et al.,
2007; Lomax, 2010). Despite improvements in inspiratory muscle strength being a
potential mechanism enhancing exercise performance, the effectiveness of IMT in
improving exercise performance in hypoxia has been mixed (Downey et al., 2007;
Salazar-Martínez, Gatterer, Burtscher, Naranjo Orellana, & Santalla, 2017). After 4 weeks
of IMT and a ~24% increase in inspiratory muscle strength, no change in time to
exhaustion (cycling at 85% of V� O2max) occurred while exercising in hypoxia (FIO2 = 0.14)
(Downey et al., 2007). Whereas others have shown an increase in mean power output by
7% during a 10-min time trial in hypoxia (FIO2 = 0.165) (Salazar-Martínez et al., 2017).
Exercise protocols where subjects can “self-pace” their efforts in response to sensory
information may yield the greatest ergogenic effects of IMT (Amann & Calbet, 2008;
Noakes, St Clair Gibson, & Lambert, 2005).
Research so far on work of breathing and respiratory muscle training has
predominantly used time-to-exhaustion or a time trial as a performance measure (Table
2.1). Time-to-exhaustion tests are a good measure for adaptation because external work
can be controlled, and physiological responses compared. However, exercise intensity
cannot be regulated by subjects in response to metabolic disturbances (Amann, Eldridge,
et al., 2006). Moreover, constant load exercise tests are a poor representation of athletic
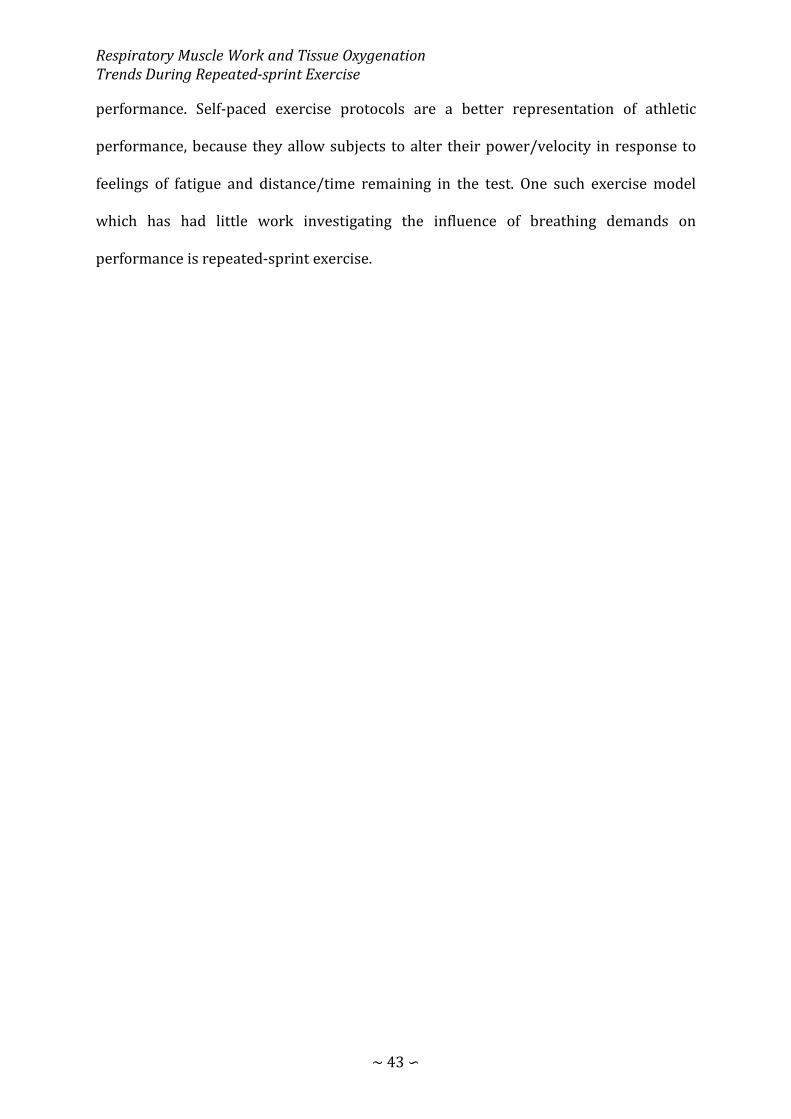
Respiratory Muscle Work and Tissue Oxygenation Trends During Repeated-sprint Exercise
∼ 43 ∽
performance. Self-paced exercise protocols are a better representation of athletic
performance, because they allow subjects to alter their power/velocity in response to
feelings of fatigue and distance/time remaining in the test. One such exercise model
which has had little work investigating the influence of breathing demands on
performance is repeated-sprint exercise.

∼ 44 ∽
Table 2.1: Effects of respiratory muscle training on respiratory function, physiological responses to exercise, and performance in healthy individuals.
Author Subject characteristics
Respiratory Muscle Training
Change in Respiratory Function Exercise Testing
Change in Exercise Responses and Performance
Archiza et al. (2017)
Professional female football (soccer) players IMT: n = 10
Sham: n = 8
IMT: Pressure threshold. 6 wk, 2 session/day, 30 breaths at ~50% MIP
Sham: Pressure threshold. 6 wk, 2 session/day, 30 breaths at ~15% MIP
↑ MIP 22% Time to exhaustion: Treadmill running at 100% of the speed reached during a graded exercise test.
RS exercise: Six 40 m (20 m + 180° turn + 20 m) sprints, with 20s of passive rest between each sprint.
Time to exhaustion: ↑ Time to exhaustion by 42%. ↓ Δ[HHb] and ↑ Δ[tHb] of intercostal muscles ↑Δ[O2Hb] and ↑Δ[tHb] of vastus lateralis
RS: ↓ Mean RS time 6% ↓ % decrement 2.4%
Bailey et al. (2010) Recreationally active
IMT: n = 8 (6 male, 2 female)
Sham: n = 8 (6 male, 2 female)
IMT: Pressure threshold. 4 wk, 2 sessions per day, 30 breaths at ~50% MIP
Sham: 4 wk, 1 session per day, 60 breaths at ~15% MIP
↑ MIP 17%
Incremental test to exhaustion: 3 min of cycling at 0 W, after which the work rate was increased by 30 W·min-1 for males and 24 W·min-1 for females
Step tests: Moderate, 80% GET; Severe, 60% the difference between GET and V� O2max; “maximal”, 100% V� O2max
Cycling incremental test to exhaustion: → V� O2max ↑ Max work rate
Step tests: ↓ Respiratory muscle fatigue after severe and maximal exercise. ↓ V� O2 slow component and exercise tolerance during severe and maximal exercise.
(Downey et al., 2007)
Moderately active (1 – 5 h/wk aerobic exercise).
IMT: Pressure threshold. 4 wk, 5 day/wk, 2 sessions/day, 30 breaths at ~50% MIP
Control: no training
↑ MIP 25% ↑ Diaphragm thickness
Time to exhaustion: Cycling at 85% V� O2max, normoxia FIO2 0.21, hypoxia FIO2 0.14
↓ post exercise respiratory muscle fatigue ~7.5% in normoxia and hypoxia ↓ RPE and dyspnoea ratings in hypoxia
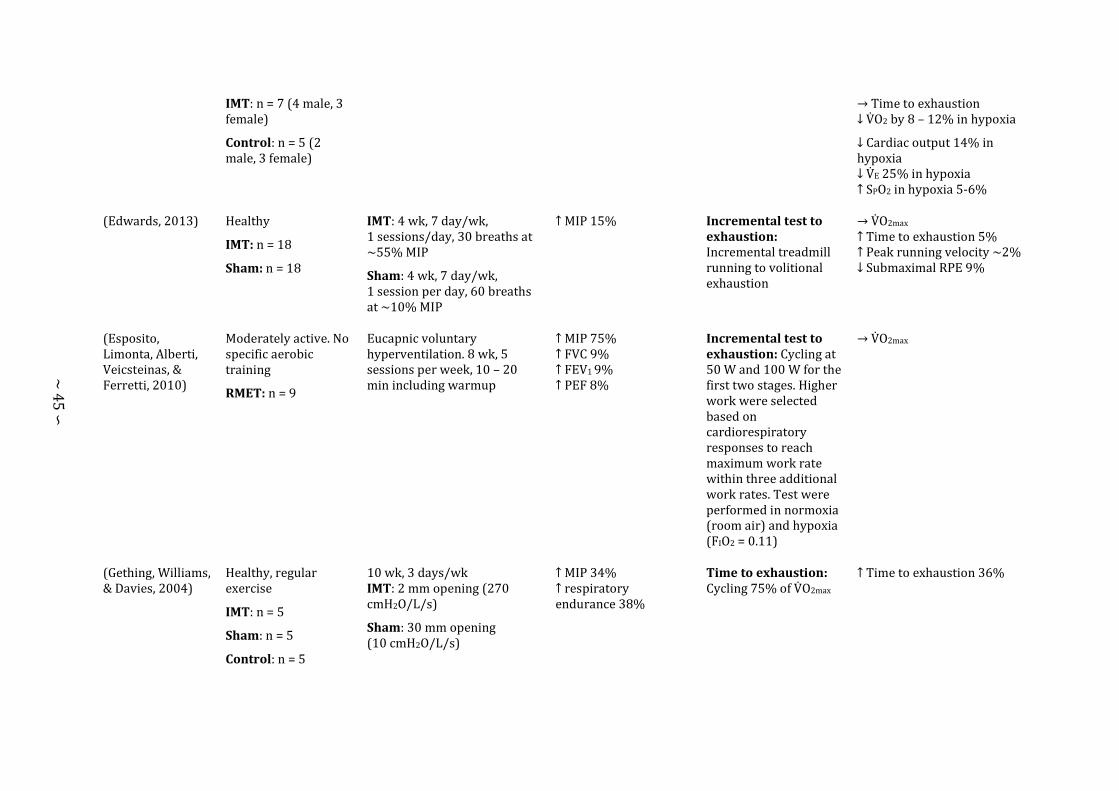
∼ 45 ∽
IMT: n = 7 (4 male, 3 female)
Control: n = 5 (2 male, 3 female)
→ Time to exhaustion ↓ V� O2 by 8 – 12% in hypoxia
↓ Cardiac output 14% in hypoxia ↓ V� E 25% in hypoxia ↑ SPO2 in hypoxia 5-6%
(Edwards, 2013) Healthy
IMT: n = 18
Sham: n = 18
IMT: 4 wk, 7 day/wk, 1 sessions/day, 30 breaths at ~55% MIP
Sham: 4 wk, 7 day/wk, 1 session per day, 60 breaths at ~10% MIP
↑ MIP 15%
Incremental test to exhaustion: Incremental treadmill running to volitional exhaustion
→ V� O2max
↑ Time to exhaustion 5%
↑ Peak running velocity ~2%
↓ Submaximal RPE 9%
(Esposito, Limonta, Alberti, Veicsteinas, & Ferretti, 2010)
Moderately active. No specific aerobic training
RMET: n = 9
Eucapnic voluntary hyperventilation. 8 wk, 5 sessions per week, 10 – 20 min including warmup
↑ MIP 75% ↑ FVC 9% ↑ FEV1 9% ↑ PEF 8%
Incremental test to exhaustion: Cycling at 50 W and 100 W for the first two stages. Higher work were selected based on cardiorespiratory responses to reach maximum work rate within three additional work rates. Test were performed in normoxia (room air) and hypoxia (FIO2 = 0.11)
→ V� O2max
(Gething, Williams, & Davies, 2004)
Healthy, regular exercise
IMT: n = 5
Sham: n = 5
Control: n = 5
10 wk, 3 days/wk IMT: 2 mm opening (270 cmH2O/L/s)
Sham: 30 mm opening (10 cmH2O/L/s)
↑ MIP 34% ↑ respiratory endurance 38%
Time to exhaustion: Cycling 75% of V� O2max
↑ Time to exhaustion 36%
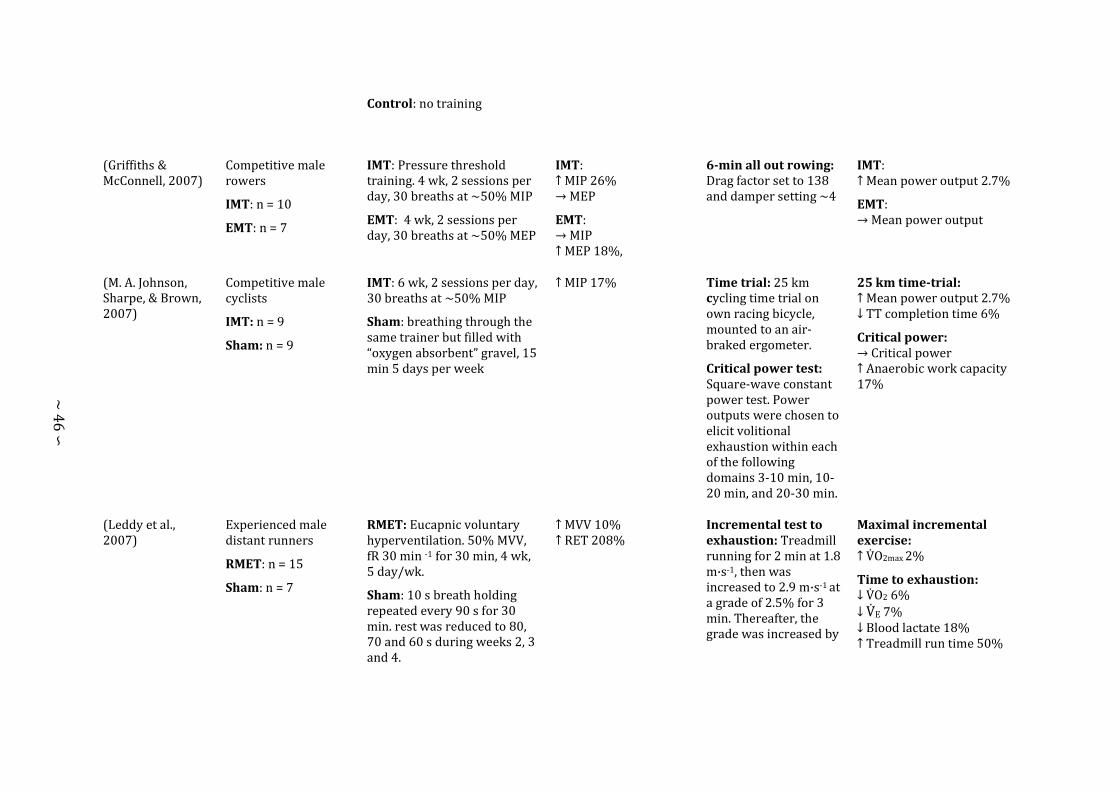
∼ 46 ∽
Control: no training
(Griffiths & McConnell, 2007)
Competitive male rowers
IMT: n = 10
EMT: n = 7
IMT: Pressure threshold training. 4 wk, 2 sessions per day, 30 breaths at ~50% MIP
EMT: 4 wk, 2 sessions per day, 30 breaths at ~50% MEP
IMT: ↑ MIP 26% → MEP
EMT: → MIP ↑ MEP 18%,
6-min all out rowing: Drag factor set to 138 and damper setting ~4
IMT: ↑ Mean power output 2.7%
EMT: → Mean power output
(M. A. Johnson, Sharpe, & Brown, 2007)
Competitive male cyclists
IMT: n = 9
Sham: n = 9
IMT: 6 wk, 2 sessions per day, 30 breaths at ~50% MIP
Sham: breathing through the same trainer but filled with “oxygen absorbent” gravel, 15 min 5 days per week
↑ MIP 17% Time trial: 25 km cycling time trial on own racing bicycle, mounted to an air-braked ergometer.
Critical power test: Square-wave constant power test. Power outputs were chosen to elicit volitional exhaustion within each of the following domains 3-10 min, 10-20 min, and 20-30 min.
25 km time-trial: ↑ Mean power output 2.7% ↓ TT completion time 6%
Critical power: → Critical power ↑ Anaerobic work capacity 17%
(Leddy et al., 2007)
Experienced male distant runners
RMET: n = 15
Sham: n = 7
RMET: Eucapnic voluntary hyperventilation. 50% MVV, fR 30 min -1 for 30 min, 4 wk, 5 day/wk.
Sham: 10 s breath holding repeated every 90 s for 30 min. rest was reduced to 80, 70 and 60 s during weeks 2, 3 and 4.
↑ MVV 10% ↑ RET 208%
Incremental test to exhaustion: Treadmill running for 2 min at 1.8 m·s-1, then was increased to 2.9 m·s-1 at a grade of 2.5% for 3 min. Thereafter, the grade was increased by
Maximal incremental exercise: ↑ V� O2max 2%
Time to exhaustion:
↓ V� O2 6%
↓ V� E 7% ↓ Blood lactate 18%
↑ Treadmill run time 50%
∼ 47 ∽
2,5% every 2 min until exhaustion.
Time to exhaustion: treadmill running at 80% of V� O2max
Time trial: 4-mile run (6.44 km) on an indoor circular running track
Time trial (n = 7) ↓ Run time 4%
(Lomax, 2010) Healthy service personal from British Armed Forces
IMT n = 7
Control n = 7
IMT: 4 wk, 2 sessions per day, 30 breaths at ~50-60% MIP
Control: No training
↑ MIP 15%
Resting: Resting at terrestrial altitude of 1400 m, 4880 m, and 5550 m
SPO2: → 1400 m ↑ 4880 m 6% ↑ 5550 m 6% → Dyspnoea
(Lomax et al., 2017)
Healthy males
IMT n = 8
Sham n =9
IMT: 4 wk, 7 day/wk, 1 sessions/day, 30 breaths at ~50% MIP
Sham: 4 wk, 7 day/wk, 1 session per day, 30 breaths with no load
↑ MIP 15%
Submaximal exercise test: Cycling for 10 min and 100 W while in normoxia (room air), and hypoxia (FIO2
0.146)
Normoxia: no clear changes
Hypoxia: ↓ V� CO2 12% ↓ V� E 14% ↑ SPO2 3% ↓ Dyspnoea 42%
(Markov et al., 2001)
Sedentary subjects RMET n = 13 (8 male, 5 female)
Endurance training n = 9 (4 male, 5 female)
Control n = 15 (8 male, 7 female)
RMET: Eucapnic voluntary hyperventilation at 60% MVV for 30 min. 40 sessions over 15 wk.
ET: Cycling and/or running. 40 sessions over 15 wk, 30 min per session
Control: No training
Breathing endurance at 65-70 % MVV.
RMET: ↑ 600%
ET: →
Control: →
Incremental test to exhaustion: Cycling at an initial work rate of 60 W for females, and 80 W for males. Every 2 min the work rate was increased by 20 W until volitional exhaustion.
Time to exhaustion: Cycling at 70% V� O2max
Incremental test to exhaustion: VO2max: → RMT ↑ ET 19% → Control
Time to exhaustion: ↑ RMT 24%, ↑ ET 40% → Control

∼ 48 ∽
until volitional exhaustion.
(McConnell & Lomax, 2006)
IMT: n = 8 (1 male) IMT: 4 wk, 2 sessions per day, 30 breaths at ~50% MIP
↑ MIP 17% ↑ Inspiratory muscle work to task failure (same relative intensity) 26%
Time to exhaustion: Planter flexion time to exhaustion at 85% of MVC after inspiratory muscle pre-fatigue
↓ Time to exhaustion 36% (3.6 min)
McMahon et al. (2002)
Healthy males, cycling trained
RMET: n = 10
Control: n = 10
RMET: Eucapnic voluntary hyperventilation. 20, 30 min session at 60% MVV over 4-6 wk
Control: no training
↑ vital capacity 3% ↑ MVV 10% ↑ Time to fatigue 260%
Incremental test to exhaustion: Cycling at 100 W to begin with, and increased by 30 W every 2 min there after until volitional exhaustion
Time to exhaustion: cycling at 85% of V� O2max
Incremental test to exhaustion: → VO2max
Time to exhaustion: ↑ Time to exhaustion ~27%
Mickleborough, Nichols, Lindley, Chatham, and Ionescu (2010)
Recreational active road runners
IMT: n = 8
Sham: n = 8
Control: n = 8
IMT: Repeated sets of 6 inspirations at 80% sustained MIP until task failure, 3 days/wk. rest between sets gradually reduced from 45 s to 5 s.
Sham: Repeated sets of 6 inspirations at 30% sustained MIP until task failure, 3 days/wk. rest between sets gradually reduced from 45 s to 5 s.
↑ MIP 43% ↑ sustained MIP 26% ↑ MVV 9%
Time to exhaustion: Running at 80% of V� O2max
↑ Time to exhaustion 16% ↓ V� O2 13% ↓ V� E 26% ↓ Blood lactate 39% ↓ RPE 33%

∼ 49 ∽
Control: no training
Mickleborough, Stager, Chatham, Lindley, and Ionescu (2008)
Competitively trained swimmers
IMT: n= 10
Sham: n = 10
Control: n = 10
All subjects maintain their swim training designed to enhance athletic performance. 10-12 supervised session per week.
IMT: Repeated sets of 6 inspirations at 80% sustained MIP until task failure, 3 days/wk. rest between sets gradually reduced from 45 s to 5 s.
Sham: Repeated sets of 6 inspirations at 30% sustained MIP until task failure, 3 days/wk. rest between sets gradually reduced from 45 s to 5 s.
Control: Swim training only
↑ MIP 46% ↑ Sustained MIP 49% ↑ RET 17%
* No clear differences from performing swim training only.
Morgan, Kohrt, Bates, and Skinner (1987)
Moderately trained male cyclists.
RMET: n = 4
Control n = 5
RMET: Eucapnic voluntary hyperventilation. 5 days per week for 3 weeks at 85% MVV
Control: No training
↑ MVV 14% ↑ Endurance breathing time 385%
Incremental test to exhaustion: Cycling at 60 rpm against a resistance of 0.5 kp, which was increased every 2 min by 0.5 kp until volitional exhaustion
Time to exhaustion: Cycling at 95% VO2max
Incremental test to exhaustion: → V� O2max
Time to exhaustion: → time to exhaustion

∼ 50 ∽
Ozmen, Gunes, Ucar, Dogan, and Gafuroglu (2017)
Male soccer player
RMET: n = 9
Control: n = 9
RMET: 15 min, twice per week, for 5 weeks
Control: no training
↑ MIP 14% → FVC → FEV1 → MVV → MEP
Multistage shuttle run: 20 m multi-stage shuttle run test
→ Shuttle run
Romer et al. (2002b)
Male team sport athletes.
IMT n = 12
Sham n = 12
IMT: Pressure threshold training. 6 wk, 2 sessions per day, 30 breaths per session at ~50% MIP
Sham: 6 wk, 1 session per day, 60 breaths per session at ~15% MIP
↑ PIF 20% ↑ MIP 31%
Multistage shuttle run: 20 m multi-stage shuttle run test
RS exercise: Fifteen 20 m sprints, maximum of 30 s passive recovery
Multistage shuttle run: → Maximal speed → Estimated V� O2max
RS exercise: → Sprint time ↓ Self-selected recovery time 7%
Romer et al. (2002a) and Romer et al. (2002c)
Male trained road cyclists/triathletes
IMT: n = 8
Sham: n = 8
IMT: Pressure threshold training. 6 wk, 2 sessions per day, 30 breaths per session at ~50% MIP
Sham: 6 wk, 1 session per day, 60 breaths per session at ~15% MIP
↑ P0 28% ↑ Vmax 17% ↑ WI max 49% ↑ Popt 25% ↑ Vopt 17%
Incremental test to exhaustion: Cycling work rate increased by 35 W every 3-min starting from 95 W until volitional exhaustion
Time trial: 20 km and 40 km cycling time trial
Maximal incremental exercice → Wmax,
↓ dyspnoea 16% ↓ RPE 18%
20 km time trial ↓ Time to completion 3.8% ↑ MPO 4% ↓ Diaphragm fatigue ~7% ↓ RPE 16%
40 km time trial ↓ Time to completion 4.6% ↑ MPO 3%. ↓ Diaphragm fatigue ~6% ↓ RPE 16%
Salazar-Martínez et al. (2017)
Sixteen physically active males (n = 9) and females (n = 7)
IMT: n = 9
IMT: Pressure threshold training. 6 wk, 5 d/wk, 2 sessions per day, 30 breaths per session at ~50% MIP
↑ MIP 28% Maximal incremental exercise: Cycling work rate increased by 25 W every 1-min starting
Maximal incremental exercise: → V� O2max in normoxia and hypoxia.

∼ 51 ∽
Control: n = 7 Control: no training
from 50 W until volitional exhaustion
Time trial: 10 min time trial in normoxia (room air), and hypoxia (FIO2 = 0.165).
↑ PPO in normoxia 5.26%, and hypoxia 2.51%.
Time trial ↑ MPO 11% in normoxia, and 7% in hypoxia.
Linear relationship between MIP and MPO in normoxia (R2 = 0.69) and hypoxia (R2 = 0.67).
(Segizbaeva, Timofeev, Donina Zh, Kur'yanovich, & Aleksandrova, 2015)
Healthy, moderately trained males.
IMT: n = 10
Control: n = 6
IMT: Pressure threshold training 3 wk, 7 day/wk, 1 session per day, 60 breaths per session. Pressure threshold was set to 60%, 70%, and 80% of MIP for weeks 1, 2, and 3 respectively.
Control: 3 wk, 7 day/wk, 1 session per day, 30 breaths per session. Pressure threshold was set to the minimum setting.
↑ MIP 18%
Maximal incremental exercise: Cycling for 2 min at 1 W·kg-1 and 60-70 rpm. The work rate was increased thereafter by 0.5 W·kg-1 every 2 min until volitional exhaustion
↑ Maximal work rate 10% ↑ V� O2max 24%
↑ Anaerobic threshold 8% ↓ Respiratory muscle fatigue 6%
(Sonetti et al., 2001)
Competitive male cyclists
REMT + IMT: n = 9
Sham n = 8
REMT + IMT: Endurance and strength training 5 wk, 1 session per day; Hyperpnoea endurance training, 50-60% MVV at fR 50-60 min -1 for 30 min; Pressure threshold training, ~50% MIP until task failure (~40 breaths). Pressure threshold training. 6 wk, 5 d/wk, 2 sessions per day, until task failure at ~50% MIP.
↑ FVC 3% ↑ MIP 8%
Maximal incremental exercise: 10 min warm up on a cycle ergometer at 117 W. The test began at an initial work rate of 167 W and increased by 17 W ever 1 min thereafter volitional exhaustion
Time to exhaustion: Cycling at 80-85% of
Maximal incremental exercise: ↑ maximal work rate 9% → V� O2max
Time to exhaustion: ↑ 26%, Sham ↑16%
8 km TT ↓ Time to completion 1.8%

∼ 52 ∽
Sham: breathing through the same trainer but filled with “oxygen absorbent” gravel, 30 min 5 days per week
Wmax until volitional exhaustion
Time trial: 8 km cycling time trial
No clear differences between groups
(Tong et al., 2008) Healthy males, regularly engaged in either soccer of rugby training
IMT: n = 10
Sham: n = 10
Control: n = 10
IMT: Pressure threshold training. 6 wk, 6 d/wk, 2 sessions per day, 30 breaths per session at ~50% MIP
Sham: 6 wk, 6 d/wk, 2 sessions per day, 30 breaths per session at ~15% MIP
Control: No training
↑ P0 32% → Vmax 3% ↑ WI max 40% ↑ Popt 39% → Vopt 2%
Multistage shuttle run: Yo-Yo intermittent recovery tests (level 1)
↑ Shuttle run 16% ↓ Rate of increased breathlessness 11%
Turner et al. (2012)
Highly trained male cyclists
IMT: n = 8
Control: n = 8
IMT: Pressure threshold training. 6 wk, 2 sessions per day, 30 breaths per session at ~50% MIP
Sham: 6 wk, 1 session per day, 60 breaths per session at ~15% MIP
↓ O2 cost of voluntary hyperpnoea
Turner et al. (2016)
Highly trained male cyclists
IMT: n = 8
Control: n = 8
IMT: Pressure threshold training. 6 wk, 6 d/wk, 2 sessions per day, 30 breaths per session at ~50% MIP
Sham: 6 wk, 6 d/wk, 2 sessions per day, 30 breaths per session at ~15% MIP
↑ MIP 26% Constant load exercise. Cycling at 80% of V� O2max with “moderate” and “heavy” inspiratory loading. Cycling at 100% of V� O2max
Heavy inspiratory loading: ↓ Locomotor muscle [HHb] 37% ↓ Respiratory muscle [HHb] 59%
Verges et al. (2009)
Moderately trained males
REMT: n = 8
REMT: 60% MVV for 30 min. 20 training sessions, 1 day of rest following 2 consecutive days of training, for 4 wk.
REMT: ↑ respiratory endurance 62%

∼ 53 ∽
IMT: n = 8
Sham: n = 8
IMT: area under the curve training equating to approximately 62% MIP. 2 sessions per day, 30 breaths per session, for 4 wk.
Sham: respiratory muscle “co-ordination training”. 1 session per day, 60 breaths per session, for 4 wk.
↓ MIP 4%; ↑ MEP 2%
IMT: ↑ respiratory endurance 38% ↑ MIP 31%; ↓ MEP 17 %
Sham: ↑ respiratory endurance 9% ↑ MIP 5% ↓ MEP 2%
(Volianitis et al., 2001)
Female competitive rowers
IMT: n = 7
Sham: n = 7
IMT: Pressure threshold training. 11 wk, 6 day/wk, 2 sessions per day, 30 breaths per session at ~50% MIP
Sham: 11 wk, 6 d/wk, 2 sessions per day, 30 breaths per session at ~15% MIP
IMT: ↑ MIP 38% at 4 wk, 42% at 11 wk
Sham: ↑ MIP 4% at 4 wk, 4% at 11 wk
6-min all out rowing: Rowing ergometer
Time trial: 5 km rowing ergometer time trial
6 min “all-out” rowing. ↑ Distance covered by 3% and 4% after wk 4 and 11. ↓ Post exercise respiratory muscle fatigue 8%
Time trial ↑ distance travelled 3% after 4 wk
(Witt et al., 2007) Healthy makes
IMT: n = 8
Sham: n = 8
IMT: Pressure threshold training. 5 wk, 6 day/wk, 1 sessions per day, 3 sets of 75 breaths, 5 min recovery between sets at ~50% MIP.
Sham: 5 wk, 6 day/wk, 1 sessions per day, 3 sets of 75 breaths, 5 min recovery between sets at ~10% MIP.
↑ MIP 17%
Resistive breathing task. Inspiring against a resistance of 60% MIP. ƒb = 15 b·min-1, duty cycle 0.70. Iso-time post training
↓ HR 27% ↓ Mean arterial blood pressure 4%

∼ 54 ∽
(Wylegala et al., 2007)
Male experienced swimmers
Respiratory muscle strength training (RMST): n = 10
RMET: n = 10
SHAM: n = 10
Training for all protocols 30 min/day, 5 days/wk, 4 wk.
RMST: Inspiratory and expiratory pressure threshold training. One breath every 30 s at an opening pressure of 50 cmH2O.
RMET: Eucapnic voluntary hyperventilation at 60% MVV
SHAM: Breath holding
RMST: ↑ MIP 11% ↑ MEP 15% ↑ Respiratory muscle endurance 31%
RMET: ↑ 7% MVV ↑ FVC 3% ↑ FEV1 3% ↑ MVV 217%
Surface endurance swim. Swimming at ~75% HR max heart rate until they could no longer maintain the pace.
Under water swim. Swimming continued until tethered weight could not be kept off the bottom of swimming pool
Surface endurance swim. ↑ Time to exhaustion: RMST 66%; RMET 26%.
Under water swim. ↑ Time to exhaustion: RMST 33%; RMET 38%.
Abbreviations are: EMT, expiratory muscle training; FEV1, forced expiratory volume in 1 s; FIO2, fraction of inspired oxygen; fR, breathing frequency; FVC, forced vital capacity; GET, gas exchange threshold; HR, heart rate, IMT, inspiratory muscle training; MIP, maximal inspiratory mouth pressure; MVC, maximum voluntary contraction; MVV, maximum voluntary ventilation; P0, maximal inspiratory pressure at zero flow; PEF, peak expiratory flow; PIF, peak inspiratory flow; Popt, optimal pressure for maximal flow production; PPO, peak power output; RET, respiratory endurance time; RMET, respiratory muscle endurance training; RPE, rating of perceived exertion; RS, repeated-sprint; SPO2, arterial oxygen saturation; V� CO2, pulmonary carbon dioxide elimination; V� E, pulmonary ventilation; Vmax, ; V� O2, pulmonary oxygen uptake; V� O2max, maximal pulmonary oxygen uptake; Vopt, optimal flow ; WImax, maximal inspiratory power; wk, week(s); W·min-1, watts per minute. Arrows indicate the direction of change: ↑ increase, ↓ decrease, and → no change.

Respiratory Muscle Work and Tissue Oxygenation Trends During Repeated-sprint Exercise
∼55 ∽
REPEATED SPRINT-EXERCISE
Typically, prolonged bouts of exercise have been used to examine how the work
of breathing influences muscle O2 delivery and exercise capacity with very little research
on multiple sprint work. Repeated-sprint exercise is characterised by brief “all-out”
exercise of 4-15 s, separated by incomplete recovery periods of 14-30 s (Billaut et al.,
2013; Dupont, Moalla, Guinhouya, Ahmaidi, & Berthoin, 2004; Faiss et al., 2013; Sweeting
et al., 2017). Performance in a repeat-sprint context is therefore represented as the ability
to reproduce power output after a previous bout of maximal exercise (da Silva, Guglielmo,
& Bishop, 2010; Mendez-Villanueva, Hamer, & Bishop, 2007). Over the course of a
repeated-sprint series, there is a progressive decline in total mechanical work performed
in each successive sprint (Figure 2.7). The rate of performance decline is also typically
accelerated in low O2 environments (Billaut et al., 2013; Bowtell, Cooke, Turner, Mileva,
& Sumners, 2014; Goods, Dawson, Landers, Gore, & Peeling, 2014). Initial sprint
performance is largely determined by muscular strength and power production (Morin
et al., 2012; Newman, Tarpenning, & Marino, 2004; Young, McLean, & Ardagna, 1995),
whereas the ability to resist fatigue and maintain performance is underpinned by aerobic
capacity and the ability to deliver O2 to the locomotor muscles in the between sprint
recovery periods (Billaut & Buchheit, 2013; Gharbi, Dardouri, Haj-Sassi, Chamari, &
Souissi, 2015).

Literature Review
∼ 56 ∽
Figure 2.8: Mechanical work performed during repeated-sprint exercise. Ten 10 s sprints with 30 s passive rest were performed in normoxia (•) and hypoxia (FIO2 = 0.13; ∆) on a friction-loaded cycle ergometer with a breaking force of 0.9 N·Kg-1 of body mass. Initial sprint performance was similar between conditions, but a significant main effect of condition on total work performed was observed (normoxia, 67.2 ± 5.5 kJ vs. hypoxia 62.1 ± 5.4 kJ). Arterial O2 saturation (estimated via pulse oximetry) was 12% lower in hypoxia. Reproduced from Smith and Billaut (2010).
2.6.1 Metabolic Determinates of Repeated-sprint Exercise
Muscle contractions rely on the release of energy through the hydrolysis of
adenosine triphosphate (ATP) (Baker, McCormick, & Robergs, 2010). Resting
intramuscular stores of ATP are limited to ~20-25 mmol·kg-1 of dry muscle weight, which
during a sprint, can only provide energy for 1-2 s (Bogdanis, Nevill, Lakomy, & Boobis,
1998; Gaitanos et al., 1993; Parolin et al., 1999). As resting ATP stores become depleted,
three major energy systems are responsible for ATP resynthesis. Rapid ATP resynthesis
is achieved through phosphocreatine (PCr) degradation (Gaitanos et al., 1993). Anaerobic
glycolysis also has a large involvement in sprint metabolism (Gaitanos et al., 1993).
Though as sprints are repeated, the relative contribution of anaerobic glycolysis towards
ATP resynthesis declines (Gaitanos et al., 1993; Parolin et al., 1999). Conversely, aerobic
metabolism has a very small role in isolated sprit performance (~10% of total ATP

Respiratory Muscle Work and Tissue Oxygenation Trends During Repeated-sprint Exercise
∼57 ∽
production), which increases as sprint are repeated (Bogdanis, Nevill, Boobis, & Lakomy,
1996; Parolin et al., 1999).
2.6.1.1 Phosphocreatine Degradation
Intramuscular PCr is especially important for the rapid resynthesis of ATP during
explosive activities via the reversible PCr-creatine kinase pathway (Baker et al., 2010;
Guimaraes-Ferreira, 2014; Schlattner, Tokarska-Schlattner, & Wallimann, 2006). In the
presence of the enzyme creatine kinase, adenosine diphosphate (ADP) is converted to
ATP through the dephosphorylation of PCr to form creatine (Cr).
Equation 2.5: Adenosine triphosphate resynthesis by phosphocreatine dephosphorylation reaction (Baker et al., 2010).
𝐴𝐴𝐴𝐴𝑃𝑃 + 𝑃𝑃𝐻𝐻𝑃𝑃𝑐𝑐𝑃𝑃𝑐𝑐𝑎𝑎𝑐𝑐𝑑𝑑𝑐𝑐𝑐𝑐 𝑘𝑘𝑑𝑑𝑐𝑐𝑎𝑎𝑘𝑘𝑐𝑐��������������� 𝐴𝐴𝐴𝐴𝑃𝑃 + 𝐻𝐻𝑃𝑃
It is estimated that during a single 6-s sprint, 50% of anaerobic ATP production
is derived predominantly through PCr degradation (Gaitanos et al., 1993). The remaining
anaerobic energy contribution during an isolated sprint is supported mainly by glycolysis
(44%), and in minority by intramuscular ATP stores (6%). When sprints are repeated,
the relative contribution of PCr to anaerobic ATP resynthesis increases. By the tenth 6-s
sprints, each separated by 30 s passive rest, PCr degradation is estimated to account for
80% of the total anaerobic energy contribution (Gaitanos et al., 1993). However,
intramuscular PCr stores are limited to ~80 mmol·kg-1 of dry muscle weight, and after
only a single 6-s sprint, stores are reduced ~50% from baseline (Dawson et al., 1997;
Gaitanos et al., 1993). When multiple sprints are performed, PCr depletion can be up to
75% after five repetitions (Dawson et al., 1997), and 84% after ten (Gaitanos et al., 1993).
Since PCr degradation has such a large contribution to ATP resynthesis, the recovery of

Literature Review
∼ 58 ∽
intramuscular stores PCr are critically important to the restoration of power output
(Sahlin et al., 1979).
The capacity to recover PCr is limited in a multiple sprint series, largely
constrained by the short recovery periods between sprints. The rate of PCr resynthesis
follows an initial fast phase, followed by a second longer slow component (Harris et al.,
1976; Walter, Vandenborne, McCully, & Leigh, 1997). After a single 6-s sprint,
approximately 70% of PCr replenishment is achieved in the first 30 s of passive rest
(Dawson et al., 1997). But as sprints are repeated and muscle stores are further depleted,
PCr can only recover to 50% of resting stores after just five repetitions. When rest is
extended post a repeat-sprint series, only 80% of PCr is recovered after 3 min (Dawson
et al., 1997), and 85% after 6 min of passive rest (Mendez-Villanueva, Edge, Suriano,
Hamer, & Bishop, 2012). Though PCr degradation is an anaerobic process, PCr
resynthesis is an aerobic process, and is sensitive to O2 availability (Harris et al., 1976;
Haseler et al., 1999; Kime et al., 2003; Sahlin et al., 1979). When breathing a hypoxic gas
mixture (FIO2 = 0.10), the rate of PCr resynthesis has been demonstrated to be attenuated
by 23% (Haseler et al., 1999). While breathing a hyperoxic gas (FIO2 = 1.00) enhances
recovery by 20% compared with normoxia, which suggests that under normal exercise
conditions PCr resynthesis is limited by O2 availability (Haseler et al., 1999). Therefore, if
the work of breathing is high enough to limit locomotor muscle O2 delivery, PCr
resynthesis in repeated-sprint exercise may be impaired.
2.6.1.2 Anaerobic Glycolysis
The energy debt created by the rapid decrease in muscle PCr during a single
sprint is met by a sizable contribution of anaerobic glycolysis to ATP resynthesis.
Respiratory Muscle Work and Tissue Oxygenation Trends During Repeated-sprint Exercise
∼59 ∽
Approximately 44% of ATP resynthesis is derived from anaerobic glycolysis during a
single 6 s sprint (Gaitanos et al., 1993). However, the relative contribution of anaerobic
metabolism decreases as sprints are repeated (McGawley & Bishop, 2015). By the tenth
sprint, Gaitanos et al. (1993) estimated that glycolysis was only responsible for 16% of
total anaerobic ATP production. Moreover, in four of the seven subjects, it was estimated
to be zero (range 0-23.1 mmol ATP·kg-1 of dry muscle weight). Many mechanisms play a
role in the relative decrease in anaerobic glycolysis during multiple-sprint work. The
most likely being the progressive depletion of muscle glycogen that is associated with
high-intensity activity (Balsom, Gaitanos, Soderlund, & Ekblom, 1999).
2.6.1.3 Aerobic Metabolism
The aerobic contribution to an isolated sprint is minimal since the maximal rate
of ATP resynthesis is far below the requirements of maximal sprint work (Baker et al.,
2010). In an isolated sprint, aerobic metabolism is responsible for ~10% of total energy
production (McGawley & Bishop, 2015; Parolin et al., 1999). But as sprints are repeated,
the relative increase in aerobic metabolism to total ATP turnover rate rises to
compensate for reduced energy supply from anaerobic pathways (Bogdanis et al., 1996;
Trump, Heigenhauser, Putman, & Spriet, 1996). Following five 6-s sprints, it is estimated
the aerobic energy contribution rises to ~40% of total ATP production (McGawley &
Bishop, 2015). The remaining 60% being derived from anaerobic pathways,
predominantly PCr degradation (Dawson et al., 1997; Gaitanos et al., 1993). Pulmonary
V� O2 can fluctuate between 70-100% of V̇O2max from sprint to recovery periods in the latter
stages of a repeat-sprint series (Buchheit et al., 2009; Dupont, Millet, Guinhouya, &
Berthoin, 2005). When no external work is being performed (i.e. passive rest) during the
recovery period between sprints, the elevated V� O2 above baseline is representative of

Literature Review
∼ 60 ∽
lactate metabolism, removal of inorganic phosphate, and most importantly PCr
resynthesis (Bahr, Gronnerod, & Sejersted, 1992; Gaesser & Brooks, 1984; Guimaraes-
Ferreira, 2014).
Aerobic metabolism may have a limited role in ATP formation during multiple
sprint work (Bogdanis et al., 1996; McGawley & Bishop, 2015), but is fundamental to PCr
resynthesis between sprints. Compartment specific creatine kinase isozymes are located
in the cytosol and mitochondrial intermembrane space, and are associated with either
the ATP-consuming or -delivering process, respectively (Guimaraes-Ferreira, 2014;
Schlattner et al., 2006). In the PCr shuttle system (Figure 2.8), mitochondrial creatine
kinase mediates the reaction between creatine and ATP formed by oxidative metabolism,
to generate PCr and ADP (Bessman & Carpenter, 1985). Therefore, the rate at which the
mitochondria can generate ATP through oxidative phosphorylation, will dictate PCr
resynthesis. A positive correlation between aerobic fitness, and maintaining repeat-
sprint performance exists (Bishop, Edge, & Goodman, 2004; da Silva et al., 2010; Gharbi
et al., 2015; Tomlin & Wenger, 2001). It is likely that improvements in mitochondria
function and content, that are associated with exercise training (Bishop, Granata, &
Eynon, 2014), underpin the correlation between aerobic fitness and repeated-sprint
ability. Additionally, muscle O2 availability between sprint efforts likely affects
mitochondrial oxidative phosphorylation, which would explain the connection between
PCr resynthesis and O2 availability (Haseler et al., 1999; Sahlin et al., 1979).

Respiratory Muscle Work and Tissue Oxygenation Trends During Repeated-sprint Exercise
∼61 ∽
Figure 2.9: Phosphocreatine shuttle system. Abbreviations are: ADP, adenosine diphosphate; ATP, adenosine triphosphate; Ck, creatine kinase; PCr, phosphocreatine, Cr, creatinine. Adapted from Guimaraes-Ferreira (2014).
2.6.2 Skeletal Muscle Tissue Oxygenation
Muscle O2 availability during repeated-sprint exercise is critical for supporting
PCr resynthesis, which underpins the capacity to maintain power out over a sprint series
(Gaitanos et al., 1993; Haseler et al., 1999). Changes in local O2 balance (delivery vs.
consumption) can be measured in real time with NIRS (Boushel & Piantadosi, 2000;
Ferrari, Muthalib, & Quaresima, 2011). The NIRS technology relies on the relative
transparency of biological tissue to near-infrared light (650-950 nm), and light
absorption of oxy-haemoglobin (O2Hb) and deoxy- haemoglobin (Alhemsi, Zhiyun, &
Deen, 2013). The concentration of [HHb] and [O2Hb] rises and falls, respectively,
proportional to an increase in metabolic activity in the underlying tissue and display
similar kinetics to pulmonary V� O2 (Grassi, Quaresima, Marconi, Ferrari, & Cerretelli,
1999; Subudhi, Dimmen, & Roach, 2007).

Literature Review
∼ 62 ∽
By employing NIRS in repeated-sprint exercise, muscle oxygenation kinetics can
be studied in real time (Boushel & Piantadosi, 2000; Ferrari et al., 2011). Analysis
typically focuses on [HHb] due to [O2Hb] being influenced by rapid blood volume and
perfusion variations caused by forceful muscle contractions (De Blasi, Cope, Elwell,
Safoue, & Ferrari, 1993; Takaishi et al., 2002). Changes in muscle [HHb] during exercise
is relatively independent of blood volume compared to [O2Hb], (De Blasi et al., 1993;
Grassi et al., 2003), and reflect venous [HHb] to provide an estimate of muscular O2
extraction (DeLorey, Kowalchuk, & Paterson, 2003; Grassi et al., 2003). At the onset of a
sprint, there is a rapid increase in vastus laterals [HHb] (deoxygenation), which during
the rest period subsequent to the sprint trends back towards baseline (reoxygenation)
(Figure 2.9).
Figure 2.10: Evolution of vastus lateralis deoxyhaemoglobin during repeated-sprint exercise. The concentration of vastus lateralis deoxyhaemoglobin ([HHb]) is expressed as a percentage relative to resting baseline. Subjects (n = 9) performed ten 6 s sprints (represented by the vertical bars) on a friction braked cycle ergometer against a resistive force of 0.9 N·kg-1 of body mass. Sprints were interspersed by 30 s of passive rest. Data was continuously sampled at 2 Hz. Reproduced from Racinais et al. (2007).

Respiratory Muscle Work and Tissue Oxygenation Trends During Repeated-sprint Exercise
∼63 ∽
2.6.2.1 Problems with Analysis Methods of Near-infrared Spectroscopy
To obtain a single sprint and recovery value for each sprint and recovery phase,
a mean is typically calculated over a predetermined duration within the closing seconds
of each sprint and recovery periods, which serves to smooth the large fluctuations in NIRS
variables (as seen in Figure 2.10). Predetermined analysis windows have been used in
acute settings (Racinais et al., 2007; Sandbakk et al., 2015), varying environmental O2
availability (Billaut & Buchheit, 2013; Billaut et al., 2013; Smith & Billaut, 2010, 2012),
active vs. passive rest (Buchheit et al., 2009; Dupont et al., 2004), after respiratory muscle
warm-up (Cheng et al., 2013), and in response to training (Buchheit, Hader, & Mendez-
Villanueva, 2012; Buchheit & Ufland, 2011; Galvin, Cooke, Sumners, Mileva, & Bowtell,
2013). A drawback of predefined analysis windows is that the true, physiological peak
and/or nadir of the [HHb] signal may occur outside the predefined analysis windows
(Figure 2.10). It may be that [HHb] continues to rise if tissue O2 consumption remains
elevated post sprint (Figure 2.9 and Figure 2.10). The nadir of [HHb] may also not occur
within a predefined window of analysis, especially since [HHb] will be affected by limb
activity when the athlete prepares for the next sprint (i.e., leg movement to place the
pedal in the right position and static contraction of the quadriceps (Gotshall, Bauer, &
Fahrner, 1996). To overcome this, a rolling mean approach may be applied to smooth the
data to determine the true peak and nadir of the NIRS signal (Bowtell et al., 2014; Faiss
et al., 2013; Ihsan, Abbiss, Lipski, Buchheit, & Watson, 2013; Jones, Hamilton, & Cooper,
2015; Ohya, Aramaki, & Kitagawa, 2013; Ohya, Hagiwara, & Suzuki, 2015). It is currently
unclear if there are any clear differences in the reported vastus lateralis [HHb] means
calculated from predetermined time periods or a rolling mean approach. A digital filter is
another typical technique used to attenuate noise and smooth raw data (Elmer & Martin,

Literature Review
∼ 64 ∽
2009). Such filters have been used to smooth the NIRS signal, removing the necessity to
calculate an arithmetic mean (Faiss et al., 2013; Sandbakk et al., 2015; Willis, Alvarez,
Millet, & Borrani, 2017). There is currently no consistency among researchers for
analysing NIRS data collected during repeated-sprint exercise (Table 2.2). Furthermore,
the effect that different analysis methods may have on NIRS derived variables it is
currently unclear.
Figure 2.11: An example of averaging windows used to determine vastus lateralis deoxyhaemoglobin during repeated sprint exercise. Representative data from an individual subject during a single sprint/recovery cycle of repeated-sprint exercise. The exercise protocol was ten 10 s sprints, separated by 30 s of passive rest. The grey shaded areas represent examples of averaging windows used to determine the change in vastus laterals deoxyhaemoglobin ([HHb]) induced by a sprint bout. Change in [HHb] is expressed relative to the maximal 5 s average obtained during femoral arterial occlusion (100%).
Respiratory Muscle Work and Tissue Oxygenation Trends During Repeated-sprint Exercise
∼65 ∽
Even though there is no consensus on how best to approach to identifying a
single value to represent each sprint and recovery phase during multiple sprint work,
lessons on muscle oxygenation during repeated-sprint exercise can still be drawn. Peak
sprint [HHb] will reflect muscle O2 uptake during exercise (Smith & Billaut, 2010; Tran et
al., 1999). The [HHb] recovery value, and the difference between peak and nadir [HHb]
values (reoxygenation), will provide information on the quality of metabolic recovery
between sprint efforts (Billaut & Buchheit, 2013; Buchheit & Ufland, 2011; Kime et al.,
2003).

∼ 66 ∽
Table 2.2: Overview of the methodology used to analyse near-infrared spectroscopy data collected during repeated-sprint exercise
Author Protocol Sample Rate Analysis
Sprint Recovery
Billaut and Buchheit (2013)
10 x 10 s cycling sprints, 30 s rest 10 Hz Mean of the last 5 s Mean of the last 5 s
Billaut et al. (2013) Three sets of 5 x 5 s cycling sprints, 25 s rest between sprints, and 120 s between sets
10 Hz Mean of the last 2.5 s
Buchheit et al. (2009)
6 x 4 s sprints on a non-motorised treadmill, 21 s of passive or active (2 m·s-1) rest
6 Hz (averaged to give 1 s value) Maximum 5 s average Minimum 5 s average
Buchheit and Ufland (2011)
2 x 15 s all-out shuttle runs, 15 s rest 10 Hz (averaged to give 1 s value and 3 s moving average applied
End of both sprints Immediately before second sprint
Cheng et al. (2013) 6 X 10 cycling sprints, 60 s active recovery 10 Hz Average
Dupont et al. (2004) 15 s high-intensity cycling, 15 s passive recovery until task failure
1 Hz Lowest value
Faiss et al. (2013) 10 s cycling sprints, 20 recovery until task failure
10 Hz (10th order Butterworth filter)
Maximum value Minimum Value
Galvin et al. (2013) 10 x 20 m running sprints, 30 s rest Not provided Prior to each sprint
Jones et al. (2015) 5 x 30 s cycling sprints, 4 min rest 10 Hz Maximum 3 s average Minimum 3 s average
Ohya et al. (2013) 10 x 5 s cycling sprints, active recovery (40% V� O2max) and passive recovery of either 25, 50 or 100 s
10 Hz Maximum 1 s average Minimum 1 s average
Ohya et al. (2015) 10 x 5 s cycling sprints, 25 s of active recovery (40% V� O2max)
5 Hz Maximum 1 s average Minimum 1 s average

∼ 67 ∽
Racinais et al. (2007)
10 x 6 s cycling sprints, 30 s rest 2 Hz End value End value
Sandbakk et al. (2015)
8 x 8 s poling sprints (skiing), 22 s rest 10 Hz (8th order Butterworth filter) Mean of the last 2 s
Smith and Billaut (2010)
10 x 10 s cycling sprints, 30 s rest 10 Hz Mean of the last 5 s
Smith and Billaut (2012)
10 x 10 s cycling sprints, 30 s rest 10 Hz Mean of the last 5 s
Willis et al. (2017) 10 s cycling sprints, 20 s of active rest at 20 W. Sprints were repeated until exhaustion (cadence <70 rpm)
10 Hz (4th order Butterworth filter) Maximum value Minimum value
Abbreviations are: rpm, revolutions per minute; V� O2max, maximal rate of pulmonary oxygen uptake.

Literature Review
∼ 68 ∽
2.6.2.2 Vastus Lateralis Deoxygenation
Elevated [HHb] during exercise reflects an increased muscle O2 uptake. But
muscle deoxygenation may also be caused by an increase of muscle CO2/H+, which
reduces the heamoglobin-O2 binding affinity (Astrup et al., 1965; Næraa et al., 1966).
There is a tendency for peak [HHb] to plateau over a repeat-sprint series (Buchheit et al.,
2009; Smith & Billaut, 2010), whereas others have shown a slight increase with each
sprint repetition (Racinais et al., 2007). A plateau in [HHb] is taken as evidence of
maximal muscle O2 extraction, which is typically observed during arterial occlusion
(Esaki et al., 2005; Tran et al., 1999). Since the average increase in [HHb] during a sprint
remains fairly consistent across repetition, an increase in peak [HHb] as sprints are
repeated seems to result from a limited ability of the locomotor muscles to reoxygenate
between sprint bouts (Racinais et al., 2007). Using hypoxia to examine the role of O2
availability on vastus lateralis deoxygenation has returned mixed results. While
performing ten 10-s sprints with 30 s of passive rest, vastus lateralis deoxygenation can
be up to 12% greater when breathing a hypoxic gas mixture (FIO2 = 0.13) compared to
normoxia (Billaut & Buchheit, 2013). Though using the same experimental protocol, peak
deoxygenation can be no higher in hypoxia compared to normoxia when examined in a
similar group of subjects (Smith & Billaut, 2010, 2012). Individual variability in muscle
O2 extraction is the likely cause for this discrepancy vastus lateralis deoxygenation
trends. Some subjects may be able to better compensate for reduced O2 availability
through greater muscle O2 extraction as sprints are repeated.
2.6.2.3 Vastus Lateralis Reoxygenation
Because PCr resynthesis is achieved through oxidative processes (Haseler et al.,
1999; Hogan, Richardson, & Haseler, 1999), the availability of muscle O2 during rest
periods is critically important for metabolic recovery. In maximal voluntary isometric
Respiratory Muscle Work and Tissue Oxygenation Trends During Repeated-sprint Exercise
∼ 69 ∽
handgrip exercise, reoxygenation rate measured as the rate change of [O2Hb] during
recovery was strongly correlated with the recovery of muscle PCr (r2 = 0.939) (Kime et
al., 2003). Therefore, factors affecting muscle reoxygenation between sprint efforts will
likely affect PCr resynthesis and repeated-sprint performance.
Vastus lateralis reoxygenation capacity can be attenuated by performing low
intensity activity (jogging/cycling) between sprint efforts (Buchheit et al., 2009; Ohya et
al., 2013). By reducing the O2 availability, the restoration of peak cycling power and peak
running speed following periods of “active” recovery is 3-7% lower compared to passive
rest. The time to exhaustion is also lowered by performing “active” recovery when
performing 15-s sprints, repeated every 15 s (745 ± 171 s vs. 445 ± 79 s; -60%) (Dupont
et al., 2004). Performing active recovery between sprints, muscle tissue reoxygenation is
impaired through the constant O2 uptake supporting the metabolic requirements of the
active recovery. Therefore, PCr resynthesis is likely blunted because ATP from oxidative
phosphorylation is devoted directly to maintain muscle contractions, rather than towards
PCr resyntheses (Ohya et al., 2013; Schlattner et al., 2006).
The influence of limited reoxygenation on repeated-sprint ability has also been
highlighted by manipulating the FIO2. When performing ten 10-s sprints with 30 s of
passive rest and inspiring a hypoxic gas mixture (FIO2 = 0.13), reoxygenation was
attenuated by 11% (Billaut & Buchheit, 2013). There was a ~8% reduction in total
mechanical work in hypoxia compared to normoxia, and the reduction in work was
strongly correlated with the attenuated muscle reoxygenation (r = 0.78; 90% confidence
interval: 0.49, 0.91). Since PCr resynthesis has similar recovery kinetics to reoxygenation
(Kime et al., 2003), it is likely that muscle PCr recovery was hindered by limited O2
availability.

Literature Review
∼ 70 ∽
Reoxygenation capacity is improved after endurance training, which may explain
in part the positive relationship between aerobic fitness and repeat-sprint ability (Bishop
et al., 2004; da Silva et al., 2010; Gharbi et al., 2015; Tomlin & Wenger, 2001). After eight
weeks of endurance training, repeated-sprint running (Two 15 s 20 m shuttle sprints,
with 15 s of passive rest), and muscle oxygenation were evaluated (Buchheit & Ufland,
2011). Initial-sprint performance was unaffected, presumably because improvements in
aerobic function do not support the anaerobic nature of an isolated sprint. However, prior
to the commencement of the second sprint, muscle oxygenation was 152% higher
following training, and the decrement in subsequent sprint performance was attenuated
by 26% (Buchheit & Ufland, 2011). It is likely that by improving O2 delivery to the
locomotor muscle, O2 availability for oxidative phosphorylation was enhanced, and in
turn, the phosphocreatine shuttle system (Baker et al., 2010; Guimaraes-Ferreira, 2014).
2.6.3 Ventilation in Repeated-sprint Exercise
There has been limited research on the role respiratory muscle work plays in
repeated-sprint exercise, and specifically reoxygenation capacity between sprint efforts.
Unlike sustained constant load exercise that induces respiratory muscle fatigue (B. D.
Johnson et al., 1993), the same has not been demonstrated for multiple-sprint work
(Minahan et al., 2015). Following four sets of 4 x 6-s sprints, with 24-s rest between
sprints, and 2 min between sets, no reduction in respiratory muscle strength was
reported in a group recreational active individual (Minahan et al., 2015). The intermittent
nature of repeated-sprint exercise may be sufficient to mitigate the fatiguing effects on
the diaphragm that is associated with high-intensity exercise. Therefore, activation of the
respiratory muscle metaboreflex (Figure 2.6) may not necessarily occur (Dempsey et al.,
2006). However, there is evidence that respiratory muscle training does provide some

Respiratory Muscle Work and Tissue Oxygenation Trends During Repeated-sprint Exercise
∼ 71 ∽
benefit towards maintaining repeated-sprint performance, though the mechanisms are
unclear (Archiza et al., 2017; Romer et al., 2002b).
After a six-week period of IMT, repeated-sprint ability was reported in a group
of recreational sprint sport players (soccer, rugby, field hockey and basketball) (Romer
et al., 2002b). Performance was assessed during fifteen 20-m sprints, which they were
allowed a maximum of 30 s rest. Following the IMT intervention, there were no clear
changes in sprint times. However, self-selected recovery time was attenuated by 6.9%
(range: -0.9-14.5%). Strengthening the inspiratory muscles presumably reduced the O2
cost of exercise hyperpnoea and blunted the respiratory muscle metaboreflex, which
would in turn reduce O2 competition between locomotor and respiratory muscles
(Turner et al., 2012; Witt et al., 2007). Through attenuating a respiratory muscle
metaboreflex, it is likely that the quality of metabolic recovery was enhanced with IMT,
so that subjects could maintain performance with less rest between sprints. But since
there were no measurements of muscle oxygenation (Romer et al., 2002b), it is difficult
to separate potential changes in O2 delivery from reduced feelings of dyspnoea that is
associated with respiratory muscle training (McConnell & Romer, 2004a).
The effectiveness of IMT on repeat-sprint ability and time to exhaustion in a
constant speed running test has also been assessed in a group of professional female
soccer players (Archiza et al., 2017). Repeated-sprint ability was assessed with six 40 m
sprints (20 m + 180° turn + 20 m) with 20 s passive rest between each sprint. Muscle
oxygenation was only examined during the time to exhaustion trials (100% of the speed
obtained during a maximal incremental exercise test). Both placebo and experimental
groups had improvements in time to exhaustion, but the effect size in the IMT group was
larger (Sham: 0.46; IMT: 0.74). Specific training of the respiratory muscles therefore

Literature Review
∼ 72 ∽
provided additional performance benefits beyond professional soccer training.
Performance benefits were partly attributed to a blunted increase in respiratory muscle
[HHb], with a concurrent increase in vastus lateralis [O2Hb] (Archiza et al., 2017). In
terms of the athlete’s ability to preserve repeat-sprint performance, the IMT group
showed the greatest improvement in the capacity to maintain sprint time over multiple
sprints. The blunted respiratory muscle metaboreflex in the exhaustion test may have
also occurred during the repeated-sprint test. However, without muscle oxygenation
measurements during the sprint trials, it is unclear if there were any changes to O2
availability after training. The few studies demonstrating enhanced repeated-sprint
performance following IMT (Archiza et al., 2017; Romer et al., 2002b) support the notion
that respiratory muscle work plays a negative effect on high-intensity exercise.
In conclusion, a high work of breathing limits locomotor O2 muscle delivery
during sustained high-intensity exercise, and can limit maximal exercise capacity
(Amann, Pegelow, et al., 2007; Harms et al., 1997; Harms et al., 2000). Training the
respiratory muscles can reduce the O2 cost of exercise hyperpnoea (Turner et al., 2012),
and attenuate blood flow competition between the locomotor and respiratory muscles
(McConnell & Lomax, 2006). However, there remains very limited understanding of the
role exercise hyperpnoea plays during repeated-sprint exercise. It remains to be
answered if respiratory muscle work influences vastus lateralis reoxygenation during
repeated-sprint exercise. Also, it is unclear if the enhanced repeated-sprint ability
following respiratory muscle training (Archiza et al., 2017; Romer et al., 2002b) is derived
from improved muscle oxygenation kinetics.

Respiratory Muscle Work and Tissue Oxygenation Trends During Repeated-sprint Exercise
∼ 73 ∽
STUDY AIMS
The general aim of this thesis is therefore to investigate the influence of
respiratory muscle work on skeletal muscle tissue oxygenation during repeated-sprint
exercise. This thesis will build upon previous work examining repeated-sprint exercise
and vastus lateralis tissue oxygenation (Billaut & Buchheit, 2013; Billaut et al., 2013; Faiss
et al., 2013; Galvin et al., 2013; Smith & Billaut, 2010, 2012; Sweeting et al., 2017).
Respiratory muscle oxygenation was also be assessed which to date has not been
examined in the context of repeated-sprint exercise. This thesis will use similar study
designs as previous work in this area, which will allow for direct comparisons between
studies. The specific aims of the research chapters were as follows.
2.7.1 Study 1 (Chapter Three)
Currently, there is no consistency for smoothing and determining peaks and
nadirs from a NIRS signal, which can make interpretation and comparisons between
studies difficult. Therefore, the aim of study 1 was to evaluate the current methodologies
employed to evaluate NIRS responses of repeated-sprint exercise.
2.7.2 Study 2 (Chapter Four)
A high work of breathing has been demonstrated to compromise limb O2
delivery during sustained high-intensity exercise. But it is unclear if intermittent exercise
can induce a respiratory muscle metaboreflex. Therefore, the aim of study 2 was to
explore the influence of elevated inspiratory muscle work on locomotor and respiratory
muscle oxygenation.

Literature Review
∼ 74 ∽
2.7.3 Study 3 (Chapter Five)
Following study 2, the capacity to increase V� O2 to meet the demands of
heightened respiratory muscle work appears to be a crucial factor in the maintenance of
O2 delivery to both the locomotor and respiratory muscles. Therefore, the aim of study 3
was to evaluate the respiratory muscle oxygenation responses to arterial hypoxemia
during repeated-sprint exercise, and contrast them against the oxygenation trends of the
locomotor muscles.
2.7.4 Study 4 (Chapter Six)
Specific training targeting the respiratory muscles has been demonstrated to
attenuate the activation of the respiratory muscle metaboreflex and improve exercise
performance. The aim of study 4 was therefore to examine the effects of respiratory
muscle training on muscle oxygenation trends and repeated-sprint performance.
Secondly, the training effects were also examined in response to arterial hypoxemia.
CHAPTER THREE: INFLUENCE OF AVERAGING
METHOD ON MUSCLE DEOXYGENATION
INTERPRETATION IN REPEATED-SPRINT
EXERCISE

Respiratory Muscle Work and Tissue Oxygenation Trends During Repeated-sprint Exercise
∼ 76 ∽
INTRODUCTION
Near-infrared spectroscopy (NIRS) is a common tool to indirectly measure
muscular oxygen availability and microvascular reactivity non-invasively (De Blasi et al.,
1993; DeLorey et al., 2003; Ferrari et al., 2011; Grassi et al., 2003; McLay et al., 2016)
Implementation of NIRS relies on the transparency of human tissue, and the light
absorbing characteristics of oxy- (O2Hb) and deoxy-haemoglobin (HHb) chromophores
for the determination of their concentration ([O2Hb] and [HHb] respectively) in a
localised tissue bed(Ferrari & Quaresima, 2012). Changes in [O2Hb] and [HHb] reflect the
dynamic balance between muscle O2 delivery and extraction in the underlying
tissue(Ferrari et al., 2004). In continuous exercise where NIRS responses are relatively
stable, averages can be calculated over discrete and pre-determined time points for
identification of overall trends within the exercise bout (DeLorey et al., 2003; Grassi et
al., 2003). When maximal sprint efforts are repeated, however, there is a rapid
deoxygenation at exercise onset that slowly recovers at sprint cessation The evolution of
peaks and nadirs across the NIRS signal is often used to describe the quality of metabolic
recovery between sprint bouts(Billaut & Buchheit, 2013; Ohya et al., 2015; Sandbakk et
al., 2015). Because of the rapid oxygenation adjustments and short duty cycle of repeated-
sprint exercise(Ohya et al., 2013; Ohya et al., 2015; Racinais et al., 2007), accurate
identification of peaks and nadirs in the NIRS signal is critical.
Analysis of NIRS data obtained during repeated-sprint exercise is often
constrained to [HHb](Billaut & Buchheit, 2013; Bowtell et al., 2014; Buchheit et al., 2009;
Galvin et al., 2013; Racinais et al., 2007) due to Δ[O2Hb] being influenced by rapid blood
volume and perfusion variations caused by forceful muscle contractions(De Blasi et al.,
1993; Takaishi et al., 2002). Additionally, the HHb signal is considered to be relatively

Influence of Averaging Method on Muscle Deoxygenation Interpretation
∼ 77 ∽
independent of blood volume (De Blasi et al., 1993; Grassi et al., 2003), and taken to
reflect venous [HHb] which provides an estimate of muscular oxygen extraction (DeLorey
et al., 2003; Grassi et al., 2003). However, across studies there are differing methods used
to smooth the NIRS signal and determine peak and nadir [HHb], which can potentially
affect comparisons between studies and, therefore, interpretation.
To analyse a NIRS signal, single values for each sprint and recovery are typically
determined for each peak and nadir (Buchheit et al., 2009; Buchheit & Ufland, 2011; Faiss
et al., 2013; Ohya et al., 2013; Racinais et al., 2007). A mean is calculated over a
predetermined duration within the closing seconds of each sprint and recovery periods
in order to smooth fluctuations in raw NIRS data during sprint exercise (Billaut et al.,
2013; Buchheit et al., 2009; Jones et al., 2015; Ohya et al., 2013; Sandbakk et al., 2015;
Smith & Billaut, 2010, 2012). This method has been used on numerous occasions in acute
settings (Racinais et al., 2007; Sandbakk et al., 2015), varying inspired O2 fraction (Billaut
& Buchheit, 2013; Billaut et al., 2013; Smith & Billaut, 2010, 2012), active vs passive rest
(Buchheit et al., 2009; Dupont et al., 2004), after respiratory muscle warm-up (Cheng et
al., 2013), and in response to training (Buchheit et al., 2012; Buchheit & Ufland, 2011;
Galvin et al., 2013). However, a possible drawback is that the true, physiological peak
and/or nadir [HHb] may not fall within the predefined analysis window. It may be that
[HHb] continues to rise if tissue O2 consumption remains elevated post sprint, and/or if
O2 delivery decreases. Additionally, the recovery nadir may be affected by limb activity
when the athlete prepares for the next sprint (i.e., leg movement to place the pedal in the
right position and static contraction of the quadriceps). To overcome this, a rolling mean
approach may be applied to smooth the data in order to determine the true peak and
nadir of the NIRS signal (Bowtell et al., 2014; Faiss et al., 2013; Ihsan et al., 2013; Jones et
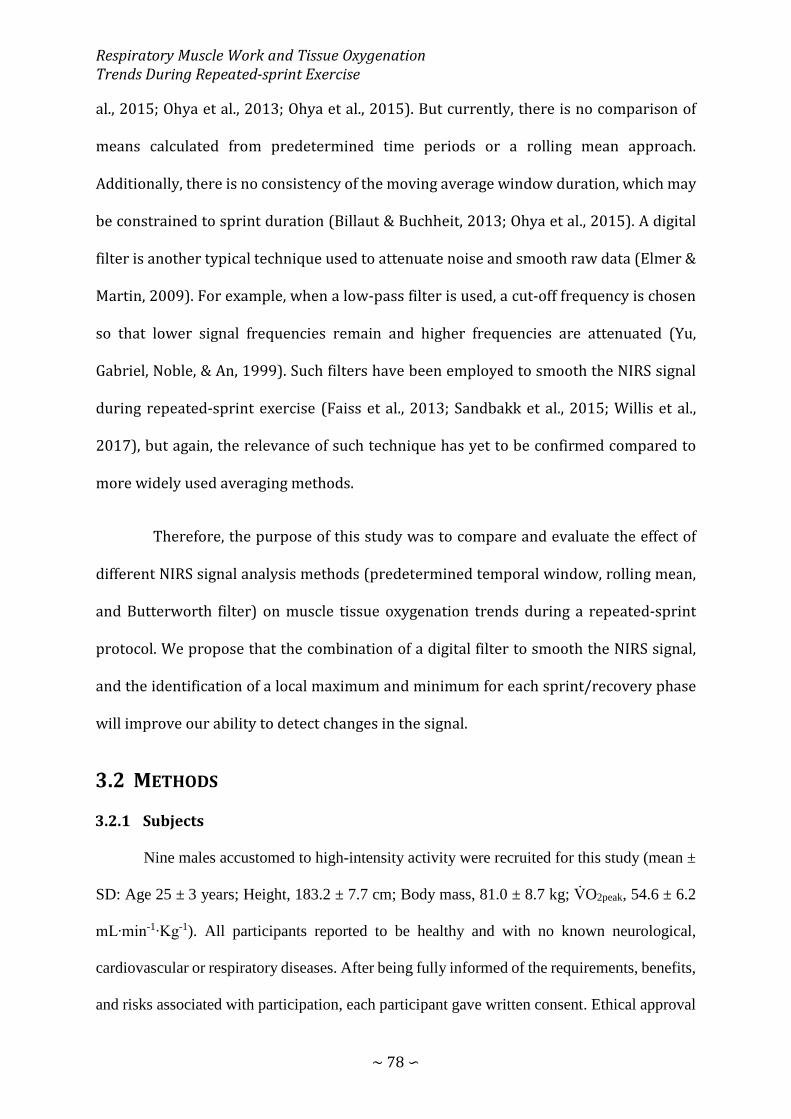
Respiratory Muscle Work and Tissue Oxygenation Trends During Repeated-sprint Exercise
∼ 78 ∽
al., 2015; Ohya et al., 2013; Ohya et al., 2015). But currently, there is no comparison of
means calculated from predetermined time periods or a rolling mean approach.
Additionally, there is no consistency of the moving average window duration, which may
be constrained to sprint duration (Billaut & Buchheit, 2013; Ohya et al., 2015). A digital
filter is another typical technique used to attenuate noise and smooth raw data (Elmer &
Martin, 2009). For example, when a low-pass filter is used, a cut-off frequency is chosen
so that lower signal frequencies remain and higher frequencies are attenuated (Yu,
Gabriel, Noble, & An, 1999). Such filters have been employed to smooth the NIRS signal
during repeated-sprint exercise (Faiss et al., 2013; Sandbakk et al., 2015; Willis et al.,
2017), but again, the relevance of such technique has yet to be confirmed compared to
more widely used averaging methods.
Therefore, the purpose of this study was to compare and evaluate the effect of
different NIRS signal analysis methods (predetermined temporal window, rolling mean,
and Butterworth filter) on muscle tissue oxygenation trends during a repeated-sprint
protocol. We propose that the combination of a digital filter to smooth the NIRS signal,
and the identification of a local maximum and minimum for each sprint/recovery phase
will improve our ability to detect changes in the signal.
METHODS
3.2.1 Subjects
Nine males accustomed to high-intensity activity were recruited for this study (mean ±
SD: Age 25 ± 3 years; Height, 183.2 ± 7.7 cm; Body mass, 81.0 ± 8.7 kg; V̇O2peak, 54.6 ± 6.2
mL∙min-1∙Kg-1). All participants reported to be healthy and with no known neurological,
cardiovascular or respiratory diseases. After being fully informed of the requirements, benefits,
and risks associated with participation, each participant gave written consent. Ethical approval

Influence of Averaging Method on Muscle Deoxygenation Interpretation
∼ 79 ∽
for the study was obtained from the institutional Human Research Ethics Committee and
conformed to the declaration of Helsinki.
3.2.2 Experimental Design
Participants were part of a larger project that required six separate laboratory
visits. Data presented here were taken from the control trial that took place after
familiarisation. Testing was performed on an electronically braked cycle ergometer
(Excalibur, Lode, Groningen, The Netherlands), set to “isokinetic” mode. In this mode, a
variable resistance is applied to the flywheel proportional to the torque produced by the
subjects to constrain their pedalling rate to 120 rpm. Below 120 rpm, no resistance is
applied to the flywheel. This mode was chosen to avoid cadence-induced changes in
mechanical power production (van Soest & Casius, 2000), and haemodynamics (Gotshall
et al., 1996), within and between sprints. After a 7-min warm-up consisting of 5 min of
unloaded cycling at 60-70 rpm and two 4 s sprints (separated by 1 min each), participants
rested for another 2.5 min before the repeated-sprint protocol was initiated. The
repeated-sprint protocol consisted of ten 10 s self-paced sprints separated by 30 s of
passive rest. Participants were instructed to give an “all-out” effort for every sprint and
verbally encouraged throughout to promote a maximal effort. Each sprint was performed
in the seated position and initiated with the crank arm of the dominant leg at 45°. Before
sprint one, subjects were instructed to accelerate the flywheel to 95 rpm over a 15-s
period and assume the ready position 5 s before the commencement of the test. This
ensured that each sprint was initiated with the flywheel rotating at ~90 rpm so that
subjects could quickly reach 120 rpm. Five seconds prior to the initiation of each sprint,
participants were asked to assume the ready position, followed by a verbal 3-2-1
countdown.

Respiratory Muscle Work and Tissue Oxygenation Trends During Repeated-sprint Exercise
∼ 80 ∽
3.2.3 Near-infrared Spectroscopy
Participants were instrumented with NIRS probes (Oxymon MKIII, Artinis, the
Netherland) fixed over the distal part of the vastus lateralis muscle belly of their
dominant leg, approximately 10-15 cm above the proximal border of the patella and held
in place with plastic spacers with an optode distance of 4 cm. Skinfold thickness was
measured between the emitter and detector using a skinfold calliper (Harpenden Ltd.) to
account for skin and adipose tissue thickness covering the muscle. The skinfold thickness
(12.4 ± 6.9 mm) was less than half the distance between the emitter and the detector in
each case. Probes were attached using double-sided stick disks, secured with tape, and
shielded from light with black elastic bandages. Between sprints, participants were asked
to minimise leg movement by remaining seated and relax their dominant leg in the
extended position. A modified form of the Beer-Lambert law was used to calculate
micromolar changes in tissue [HHb] across time using received optical density from one
continuous wavelength of NIR light (763 nm). A differential pathlength factor of 4.95 was
used (Billaut et al., 2013; Smith & Billaut, 2010). Data was acquired at 10 Hz and exported
to Excel for analysis. These data were expressed as a percentage so that resting baseline
represented 0% and maximal [HHb] represented 100% (Δ%[HHb]). Maximal [HHb] was
obtained with femoral arterial occlusion using a pneumatic tourniquet (inflated to 300-
350 mm Hg) around the root of the thigh for 3-5 min until the [HHb] increase reached a
plateau. Arterial occlusion was performed after the completion of the repeated-sprint
protocol (within 10 min), while the subjects lay on an examination bed with the leg under
examination at 90° knee flexion, and foot on the bed. During the trials, markers were
placed in the NIRS software at sprint onset to demarcate the 40-s sprint/recovery
windows for analysis.

Influence of Averaging Method on Muscle Deoxygenation Interpretation
∼ 81 ∽
The application of the 10th order zero-lag low-pass Butterworth filter was
conducted in the R environment (R Core Team, 2016) using the signal package (Signal
developers, 2013). The filter order was determined based on previous research (Faiss et
al., 2013; Sandbakk et al., 2015), and the effects of filter order on the sharpness of filter
response. The filters cut-off frequency (ƒc) was determined based on a combination of
previous research (Faiss et al., 2013), residual analysis (of data from three subjects) of
the effects of a range of different normalised ƒc on HHb (Figure 3.1), and visual inspection
with attention paid to local maxima and minima of filtered data compared to the raw
signal (Winter, 2009). Based on these, it was concluded that 0.1 was suitable ƒc to be
applied to the data for the remaining subjects. After the filter passed through the data,
the resulting output was exported to Excel for standardisation to occlusion values and
determination of peaks and nadirs.
Figure 3.1: A plot of the root-mean-square (RMS) residuals between filtered and unfiltered signals as a function of the filter cut-off frequency from the data of a representative subject. A line of best fit (ab) is projected to the Y-axis. At the intercept c, the horizontal line cd is drawn to intersect with the residuals. The chosen cut-off frequency ƒc is at this point of intersection.

Respiratory Muscle Work and Tissue Oxygenation Trends During Repeated-sprint Exercise
∼ 82 ∽
3.2.4 Data Analysis
Six methods were used to obtain a single peak and nadir %Δ[HHb] for every sprint and
recovery period based on the methods outlined in previous research (Billaut & Buchheit, 2013;
Billaut et al., 2013; Buchheit et al., 2009; Faiss et al., 2013; Jones et al., 2015; Ohya et al.,
2013; Ohya et al., 2015; Sandbakk et al., 2015; Smith & Billaut, 2010, 2012; Willis et al.,
2017).
1. Averages calculated from a predetermined range over the final 2 s of
exercise (peak) and recovery (nadir): 2PD.
2. Averages calculated from a predetermined range over the final 5 s of
exercise (peak) and recovery (nadir): 5PD.
3. Moving average with a window of 2 s applied to the data, followed by the
identification peaks and nadirs within each 40-s exercise-recovery cycle:
2MA.
4. Moving average with a window of 5 s applied to the data, followed by the
identification peaks and nadirs within each 40-s exercise-recovery cycle:
5MA
5. Application of a Butterworth filter smooth the raw NIRS data, followed by
the identification of peaks and nadirs from predetermined time points. A
single value prior to each phase change (i.e. end of exercise and end of
recovery, 0.1 s): BWFPD.
6. The application of a Butterworth filter smooth the data, followed by the
identification of a peak and nadir using a rolling approach within each 40-
s exercise-recovery cycle (0.1 s): BWFMA.

Influence of Averaging Method on Muscle Deoxygenation Interpretation
∼ 83 ∽
Tissue reoxygenation (ΔReoxy) was calculated as the difference between the
peak and nadir for each analysis method.
3.2.5 Statistical Analysis
Data in text and figures are presented as mean ± SD. Relative changes (%) are
expressed with 95% confidence limits (95% CL). Effects of the Butterworth filter on the
NIRS signal was assessed by calculating Pearson's product-moment correlation (r), and
standardised residuals of the raw vs filtered data in the R environment using the stats
package(R Core Team, 2016). The correlation between the raw and filtered NIRS signal
was assessed by fitting a linear regression model to the pooled subject data. The following
criteria were adopted to interpret the magnitude of the correlation between variables:
≥0.1, trivial; >0.1-0.3, small; >0.3-0.5, moderate; >0.5-0.7, large; >0.7-0.9, very large; and
>0.9-1.0, almost perfect (Hopkins, Marshall, Batterham, & Hanin, 2009). To determine the
effects of analysis method, practical significance was also assessed by standardised
effects and presented with 95% CL (Cohen, 1988). Effect sizes (ES) between 0-<0.2, >0.2-
0.5, >0.5-0.8, and >0.8 were considered to as trivial, small, moderate and large
respectively. Probabilities were also calculated to establish if the chance the true
(unknown) differences were lower, similar or higher than the smallest worthwhile
change (0.2 multiplied by the between-subject SD, based on Cohen’s effect size principle).
Quantitative probability of lower, similar, or higher differences were assessed
qualitatively as follows: <1%, almost certainly not; >1%-5%, very unlikely; >5%-25%,
unlikely; >25%-75%, possible; >75%-95%, likely; >95%-99%, very likely; >99%, almost
certainly. If the probability of having higher/lower values than the smallest worthwhile
difference was both >5%, the true difference was assessed as unclear (Batterham &
Hopkins, 2006; Hopkins et al., 2009). Data analysis was performed using a modified

Respiratory Muscle Work and Tissue Oxygenation Trends During Repeated-sprint Exercise
∼ 84 ∽
statistical Excel spreadsheet (Hopkins, 2006b). To examine the interaction effects
between the method for identifying Δ%[HHb] peak, nadir and ΔReoxy (predetermined
and moving), and the size of the analysis window (0.1 s, 2 s and 5 s), two-way repeated
measure ANOVA’s were performed. Post hoc analysis was conducted using the Holm-
Šídák method and adjusted for multiple comparisons. A threshold for significance was set
at the of P <0.05 level. Analysis was performed GraphPad Prism 6.
RESULTS
3.3.1 Application of the Butterworth Filter
An example of the raw compared to the filtered data of a representative subject
is presented in Figure 3.2. There was an almost perfect Pearson's correlation between the
raw NIRS data and that after the Butterworth filter (Figure 3.3 A). The mean standardized
residual of the raw data compared to the filtered was -9.71×10³ ± 3.80 (Figure 3.3 B).
When rectified, the mean residual was 2.51 ± 2.86 with a relative difference of 2.5% [CL:
1.7, 3.4].

Influence of Averaging Method on Muscle Deoxygenation Interpretation
∼ 85 ∽
Figure 3.2: Representative data from a single subject illustrating the effects of a 10th order zero-lag low-pass Butterworth filter compared with raw data. (A) Deoxy-haemoglobin concentration changes ([HHb]) over the entire repeated-sprint protocol. (B) Residuals between raw and filtered data shown in panel A. (C) Change of [HHb] during sprint one and subsequent recovery period. Grey shaded areas represent the 10-s sprint periods. The black lines represent raw HHb data. Red lines are the resulting data after the application of the Butterworth filter.
Respiratory Muscle Work and Tissue Oxygenation Trends During Repeated-sprint Exercise
∼ 86 ∽
Figure 3.3: Correlation and residual analysis of the pooled subject data comparing the output from the Butterworth filter to the raw deoxyhaemoglobin (HHb) data. (A) Pearson's product-moment correlation (r) with associated P value of a linear regression model fitted to the filtered and raw HHb data. (B) Standardized residuals from the raw vs. filtered data of the pooled subject data set.
3.3.2 Peak Muscle Deoxyhaemoglobin
Mean results of the different analysis methods are presented in Figure 3.4 A.
Comparisons of analysis methods are shown in Figure 3.1. There was a significant effect
of the method for identify peaks on peak muscle Δ%[HHb] at the P < 0.05 level [F (1, 8) =
5.346, P = 0.0495]. The size of the analysis window also had a significant effect on peak
muscle [HHb] [F (2, 16) = 29.68, P < 0.0001]. There was also a significant interaction effect
[F (2, 16) = 6.445, P = 0.0089]. Changes in Δ%[HHb] across all sprints were almost
certainly higher when calculated from 5MA compared to 5PD with a small effect (15.3%
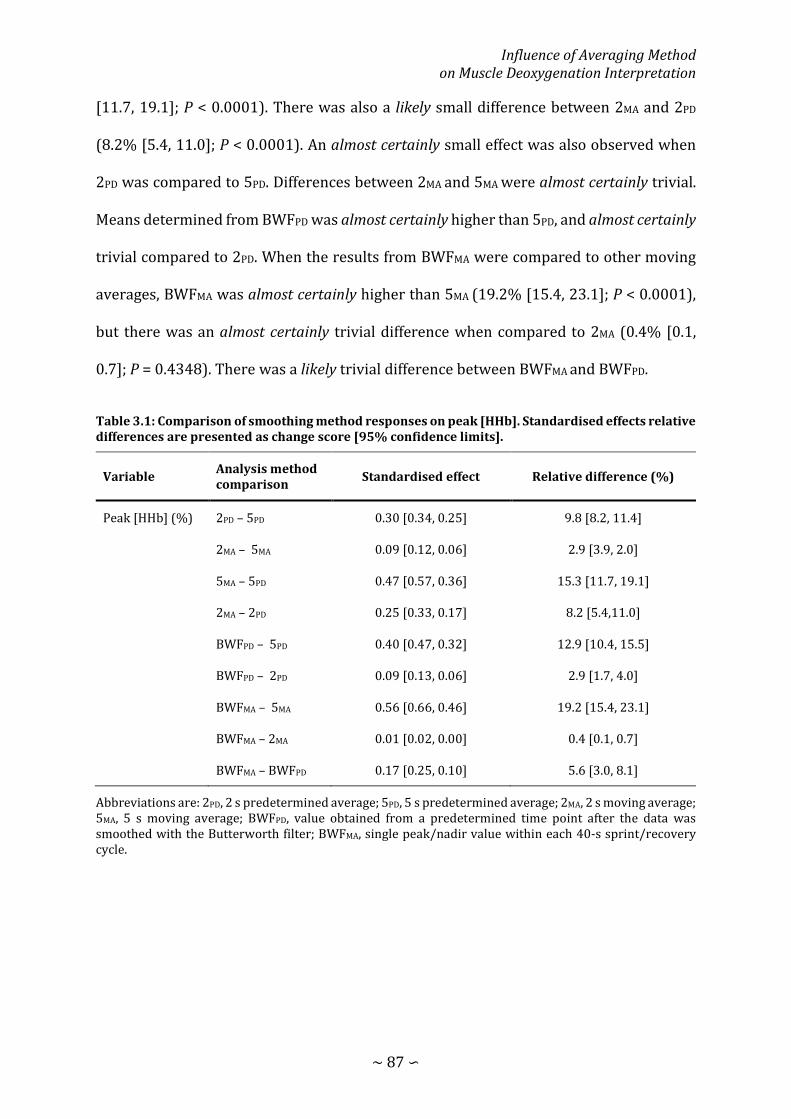
Influence of Averaging Method on Muscle Deoxygenation Interpretation
∼ 87 ∽
[11.7, 19.1]; P < 0.0001). There was also a likely small difference between 2MA and 2PD
(8.2% [5.4, 11.0]; P < 0.0001). An almost certainly small effect was also observed when
2PD was compared to 5PD. Differences between 2MA and 5MA were almost certainly trivial.
Means determined from BWFPD was almost certainly higher than 5PD, and almost certainly
trivial compared to 2PD. When the results from BWFMA were compared to other moving
averages, BWFMA was almost certainly higher than 5MA (19.2% [15.4, 23.1]; P < 0.0001),
but there was an almost certainly trivial difference when compared to 2MA (0.4% [0.1,
0.7]; P = 0.4348). There was a likely trivial difference between BWFMA and BWFPD.
Table 3.1: Comparison of smoothing method responses on peak [HHb]. Standardised effects relative differences are presented as change score [95% confidence limits].
Variable Analysis method comparison Standardised effect Relative difference (%)
Peak [HHb] (%) 2PD – 5PD 0.30 [0.34, 0.25] 9.8 [8.2, 11.4]
2MA – 5MA 0.09 [0.12, 0.06] 2.9 [3.9, 2.0]
5MA – 5PD 0.47 [0.57, 0.36] 15.3 [11.7, 19.1]
2MA – 2PD 0.25 [0.33, 0.17] 8.2 [5.4,11.0]
BWFPD – 5PD 0.40 [0.47, 0.32] 12.9 [10.4, 15.5]
BWFPD – 2PD 0.09 [0.13, 0.06] 2.9 [1.7, 4.0]
BWFMA – 5MA 0.56 [0.66, 0.46] 19.2 [15.4, 23.1]
BWFMA – 2MA 0.01 [0.02, 0.00] 0.4 [0.1, 0.7]
BWFMA – BWFPD 0.17 [0.25, 0.10] 5.6 [3.0, 8.1]
Abbreviations are: 2PD, 2 s predetermined average; 5PD, 5 s predetermined average; 2MA, 2 s moving average; 5MA, 5 s moving average; BWFPD, value obtained from a predetermined time point after the data was smoothed with the Butterworth filter; BWFMA, single peak/nadir value within each 40-s sprint/recovery cycle.
Respiratory Muscle Work and Tissue Oxygenation Trends During Repeated-sprint Exercise
∼ 88 ∽
3.3.3 Nadir Muscle Deoxyhaemoglobin
Mean results of the different analysis methods are presented in Figure 3.4 A.
Comparisons of analysis methods are shown in Figure 3.1. There was a significant effect
of the method for identify peaks on peak muscle Δ%[HHb] at the P < 0.05 level [F (1, 8) =
5.346, P = 0.0495]. The size of the analysis window also had a significant effect on peak
muscle [HHb] [F (2, 16) = 29.68, P < 0.0001]. There was also a significant interaction effect
[F (2, 16) = 6.445, P = 0.0089]. Changes in Δ%[HHb] across all sprints were almost
certainly higher when calculated from 5MA compared to 5PD with a small effect (15.3%
[11.7, 19.1]; P < 0.0001). There was also a likely small difference between 2MA and 2PD
(8.2% [5.4, 11.0]; P < 0.0001). An almost certainly small effect was also observed when
2PD was compared to 5PD. Differences between 2MA and 5MA were almost certainly trivial.
Means determined from BWFPD was almost certainly higher than 5PD, and almost certainly
trivial compared to 2PD. When the results from BWFMA were compared to other moving
averages, BWFMA was almost certainly higher than 5MA (19.2% [15.4, 23.1]; P < 0.0001),
but there was an almost certainly trivial difference when compared to 2MA (0.4% [0.1,
0.7]; P = 0.4348). There was a likely trivial difference between BWFMA and BWFPD.

Influence of Averaging Method on Muscle Deoxygenation Interpretation
∼ 89 ∽
Table 3.2: Comparison of smoothing method responses on nadir [HHb]. Standardised effects relative differences are presented as change score [95% confidence limits].
Variable Analysis method comparison Standardised effect Relative difference (%)
Nadir [HHb] (%) 2PD – 5PD -0.20 [0.18, -0.59] -8.9 [-23.5, 8.6]
2MA – 5MA -0.38 [-0.13, -0.64] -20.3 [-31.4, -7.3]
5MA – 5PD -0.19 [0.04, -0.42] -8.3 [-17.6, 1.8]
2MA – 2PD -0.37 [-0.05, -0.70] -19.7 [-33.8, -2.7]
BWFPD – 5PD -0.47 [-0.10, -0.84] -31.0 [-48.5, -7.5]
BWFPD – 2PD -0.35 [-0.15, -0.55] -24.3 [-35.3, -11.5]
BWFMA – 5MA -0.61 [-0.19, -1.02] -40.4 [-58.1, -15.2]
BWFMA – 2MA -0.34 [-0.10, -0.59] -25.3 [-39.5, -7.8]
BWFMA – BWFPD -0.27 [-0.09, -0.46] -20.8 [-32.2, -7.4]
Abbreviations are: 2PD, 2 s predetermined average; 5PD, 5 s predetermined average; 2MA, 2 s moving average; 5MA, 5 s moving average; BWFPD, value obtained from a predetermined ed time point after the data was smoothed with the Butterworth filter; BWFMA, single peak/nadir value within each 40-s sprint/recovery cycle.
3.3.4 Muscle Reoxygenation
Mean results of the different analysis methods are presented in Figure 3.4 C.
Comparisons of analysis methods are shown in Table 3.3. There was a significant effect
of the method for identify peaks and nadirs on ΔReoxy [F (1, 8) = 40.00, P = 0.0002]. A
significant effect of the window size was also detected [F (2, 16) = 108.9, P < 0.0001].
There was also a significant interaction effect [F (2, 16) = 13.31, P = 0.0004]. Using the
5MA method to calculate ΔReoxy yielded almost certainly higher results than 5PD (28.2%
[17.7, 39.7]; P < 0.0001). Similarly, 2MA was very likely to be greater than 2PD (19.4 [11.2,
28.3]; P < 0.0001). Comparing the predetermined mean approaches, 2PD was very likely
greater than 5PD. Rolling means was possibly higher when the 2MA approach was used
compared to 5MA. When the Butterworth filter was used, values from predetermined time
points were (BWFPD) almost certainly greater than 5PD (31.0% [22.4, 40.3]; P < 0.0001),

Respiratory Muscle Work and Tissue Oxygenation Trends During Repeated-sprint Exercise
∼ 90 ∽
and possibly greater than 2PD (10.9% [8.3, 13.5]; P < 0.0001). Means calculated from the
BWFMA approach were almost certainly higher than 5MA, almost certainly trivial compared
to 2MA, and likely greater than BWFPD (13.2% [7.9, 18.7]; P < 0.0001).
Table 3.3: Comparison of smoothing method responses on ΔReoxy [HHb]. Standardised effects relative differences are presented as change score [95% confidence limits].
Variable Analysis method comparison Standardised effect Relative difference (%)
ΔReoxy [HHb] (%) 2PD – 5PD 0.34 [0.48, 0.20] 18.2 [10.1, 26.9]
2MA – 5MA 0.21 [0.26, 0.17] 10.1 [7.9, 12.3]
5MA – 5PD 0.52 [0.71, 0.34] 28.2 [17.7, 39.7]
2MA – 2PD 0.39 [0.55, 0.23] 19.4 [11.2, 28.3]
BWFPD – 5PD 0.56 [0.70, 0.42] 31.0 [22.4, 40.3]
BWFPD – 2PD 0.21 [0.26, 0.16] 10.9 [8.3, 13.5]
BWFMA – 5MA 0.32 [0.39, 0.26] 15.7 [12.5, 18.9]
BWFMA – 2MA 0.11 [0.14, 0.08] 5.1 [3.5, 6.7]
BWFMA – BWFPD 0.28 [0.38, 0.17] 13.2 [7.9, 18.7]
Abbreviations are: 2PD, 2 s predetermined average; 5PD, 5 s predetermined average; 2MA, 2 s moving average; 5MA, 5 s moving average; BWFPD, value obtained from a predetermined time point after the data was smoothed with the Butterworth filter; BWFMA, single peak/nadir value within each 40-s sprint/recovery cycle.
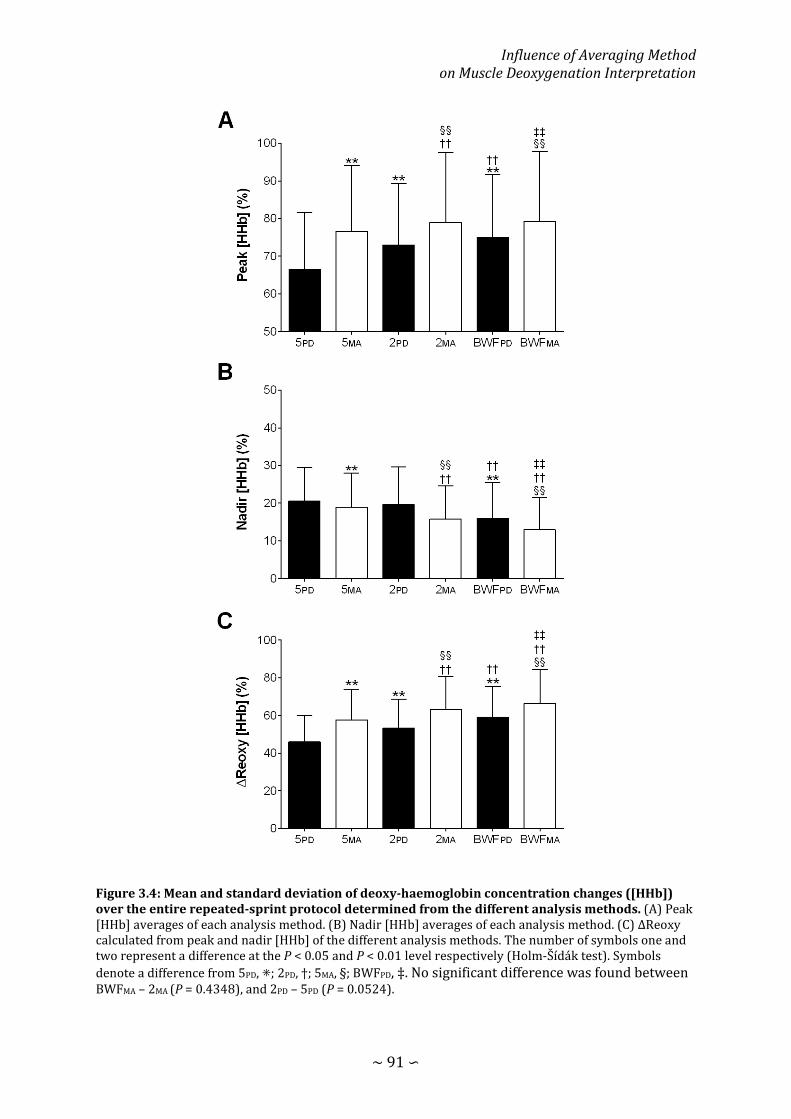
Influence of Averaging Method on Muscle Deoxygenation Interpretation
∼ 91 ∽
Figure 3.4: Mean and standard deviation of deoxy-haemoglobin concentration changes ([HHb]) over the entire repeated-sprint protocol determined from the different analysis methods. (A) Peak [HHb] averages of each analysis method. (B) Nadir [HHb] averages of each analysis method. (C) ΔReoxy calculated from peak and nadir [HHb] of the different analysis methods. The number of symbols one and two represent a difference at the P < 0.05 and P < 0.01 level respectively (Holm-Šídák test). Symbols denote a difference from 5PD, ⁕; 2PD, †; 5MA, §; BWFPD, ‡. No significant difference was found between BWFMA – 2MA (P = 0.4348), and 2PD – 5PD (P = 0.0524).
Respiratory Muscle Work and Tissue Oxygenation Trends During Repeated-sprint Exercise
∼ 92 ∽
DISCUSSION
Results indicate that by using predefined averaging windows to analyse the NIRS
signal within sprint and recovery periods, Δ%[HHb] peaks and nadirs are consistently
underestimated compared to a moving average, regardless of the window length.
Subsequently, muscle reoxygenation between efforts is underestimated using 5PD and 2PD
compared to 5MA and 2MA. However, a drawback of using the arithmetic mean is that each
data point contributes equally to the average, which allows outlying data points to bias
the result (Dawson & Trapp, 2004). To overcome this, we applied a 10th order zero-lag
low-pass Butterworth filter to the NIRS signal, which incorporates a weighted mean from
several data points across the signal. Correlation and residual analysis revealed the
Butterworth filter attenuated the “noise” yet maintained the integrity of the raw data
(Figure 3.3). Since NIRS responses are used as a surrogate for metabolic perturbations,
detecting the magnitude of change is critical for assessing the influence of interventions
and environmental factors. Thus, it appears that a digital filter combined with a rolling
approach for determining peaks and nadirs of the NIRS signal, is the best method for
accurate interpretation of oxygenation trends in repeated-sprint exercise.
There were clear differences in peak Δ%[HHb] means between the predefined
averaging methods. The difference between 2PD and 5PD can be attributed to the length of
the averaging window. At sprint onset, there is a sharp rise in Δ%[HHb] from rest that
peaks at sprint cessation or shortly thereafter (Figure 2 and (Buchheit et al., 2009; Faiss
et al., 2013; Ohya et al., 2013; Ohya et al., 2015; Racinais et al., 2007)). In our
representative data, Δ%[HHb] continued to increase ~40% in the final 5 s of the first
sprint which led to a significant 10% reduction in peak Δ%[HHb] for 5PD compared with

Influence of Averaging Method on Muscle Deoxygenation Interpretation
∼ 93 ∽
2PD (Table 3.1). Consequently, an averaging duration that encapsulates a sharp rise within
the window length will underestimate the amplitude of Δ%[HHb] change.
It is clear from Figure 2 that Δ%[HHb] continued to increase after the predefined
averaging window. This would tend to underestimate the peak Δ%[HHb] response. To
overcome this potential confounding factor, we applied both a 5- and 2-s moving average
to the NIRS signal. The 2MA and 5MA yielded 15% and 8% greater peaks compared to 2PD
and 5PD, respectively. Since maximal Δ%[HHb] may occur either at, or immediately after
sprint cessation, identification of peaks using a moving average will always capture this
maximal deoxygenation. Therefore, studies that only employed predetermined averaging
windows (Billaut & Buchheit, 2013; Billaut et al., 2013; Buchheit & Ufland, 2011;
Sandbakk et al., 2015; Smith & Billaut, 2010, 2012) may have underestimated the true
magnitude of Δ%[HHb] change induced by repeated-sprint exercise. To more accurately
represent muscle oxygenation changes in response to repeated-sprint exercise, values
need to be determined from a moving average approach (Buchheit et al., 2009; Faiss et
al., 2013; Jones et al., 2015; Ohya et al., 2013; Ohya et al., 2015; Willis et al., 2017).
However, a moving average may not be appropriate when exercise protocols incorporate
other muscular activity around repeated-sprint bouts. For example, some authors have
used low-intensity exercise during recovery periods between sprints (Buchheit et al.,
2009; Ohya et al., 2013; Ohya et al., 2015), and others have used running-based protocols,
which impose eccentric loading during the negative acceleration phase post-sprint
(Buchheit et al., 2009; Buchheit & Ufland, 2011; Galvin et al., 2013). Another limitation is
that when using arithmetic means (i.e., 5PD and 2PD; 5MA and 2MA), equal weight is given to
all data points, which can lead to the result being distorted by outliers (Dawson & Trapp,

Respiratory Muscle Work and Tissue Oxygenation Trends During Repeated-sprint Exercise
∼ 94 ∽
2004). But in the field of repeated-sprint exercise, an arithmetic mean is commonly
employed to smooth perturbations in NIRS data.
To address this methodological limitation, we used a Butterworth filter to
smooth the data, and obtained Δ%[HHb] peak from both predetermined time points
within each sprint and from a rolling approach. The BWFPD approach yielded 13 and 3%
greater peaks than both 5PD and 2PD methods, respectively. Since BWFPD used the last
value within each sprint (in the current instance, the 100th value of a 10-s sprint sampled
at 10 Hz), this was the highest Δ%[HHb] value achieved within each 10-s sprint period.
Similarly, peak Δ%[HHb] determined by BWFMA was 19% greater than 5MA. However,
only a trivial difference was found between BWFMA filtering and 2MA. Various studies have
applied digital filters to smooth biomechanical and biological data (Robertson & Dowling,
2003; Schlichthärle, 2011; Winter, 2009), yet few authors have used a filter to smooth a
NIRS signal during repeated-sprint exercise (Faiss et al., 2013; Sandbakk et al., 2015).
When a low-pass filter is used, a ƒc is chosen so that lower signal frequencies remain and
higher frequencies (noise) are attenuated (Yu et al., 1999). A low-pass Butterworth filter
attenuates signal power above a specified ƒc, but also included a weighted average across
several data points (Elmer & Martin, 2009), which leads to lag in the signal output. This
temporal shift can be removed by running the filter a second time in the reverse direction
(zero-lag). Repeated-sprint exercise represents a particularly salient challenge to
Δ%[HHb] signal due to the rapid changes in duty cycle. Our results suggest that an
arithmetic mean underrepresents [HHb] peak in most cases, and that both BWFPD and
BWFMA better reflect peak [HHb] after sprint exercise.
Differences in nadir Δ%[HHb] were less clear between the averaging methods.
Since means were calculated on the flatter portion of the NIRS signal during the late stage

Influence of Averaging Method on Muscle Deoxygenation Interpretation
∼ 95 ∽
of recovery, differences between averaging methods were minimal. There was an 8% and
20% lower Δ%[HHb] nadir from both a 5MA and 2MA compared to 5PD and 2PD respectively
(Table 2). While the difference between nadir 5MA and 5PD did not reach the typically
adopted threshold for statistical significance of P <0.05 (“trivial” standardised effect), we
reported a small standardised effect (20% relative difference, P < 0.0001) between the
2MA and 2PD analysis methods. The 5 s averaging windows may not have the sensitivity to
detect subtle differences between the nadir determined from predetermined and moving
averages. It appears that a short moving average is better suited at detecting changes in
nadir Δ%[HHb]. Since the restoration of NIRS variable towards baseline has become a
surrogate for metabolic recovery between sprints (Billaut & Buchheit, 2013; Bowtell et
al., 2014; Buchheit et al., 2009; Buchheit & Ufland, 2011; Ohya et al., 2013), an accurate
depiction of this variable is necessary to assess metabolic perturbations leading to
greater peripheral fatigue. Additionally, the detection of the magnitude of change has
important implications for assessing the potency of training programs and
environmental factors. Unless the nadir of the signal is obtained from a rolling approach,
the magnitude of [HHb] recovery will be underestimated.
The ΔReoxy is determined from both peak and nadir Δ%[HHb] responses, hence,
the analysis method that yields the greatest peaks and nadirs will have the greatest
ΔReoxy. Consequently, we observed clear and substantial differences between all ΔReoxy
analysis methods apart from BWFMA vs 2MA, with a range of relative differences from 5%
to 31%. Studies reporting ΔReoxy from predetermined windows (Billaut & Buchheit,
2013; Buchheit & Ufland, 2011) have likely underestimated reoxygenation capacity. The
most accurate representation of ΔReoxy would come from works that have chosen a

Respiratory Muscle Work and Tissue Oxygenation Trends During Repeated-sprint Exercise
∼ 96 ∽
moving average approach for the determination of peaks and nadirs (Faiss et al., 2013;
Ohya et al., 2015).
Irrespective of the method, a narrow window for analysis (2 s) allows reporting greater
magnitudes of response than a longer window (5 s). However, care should be taken when using
a narrow analysis window. It contains less data from which the average is calculated, which
increases the risk that outliers bias the calculated mean (Dawson & Trapp, 2004). Such a
methodological pitfall is displayed in the sprint phase of Figure 2 A, where a small number of
data points are far above the characteristics of the surrounding data. A narrow analysis window
would place greater weight on these individual data points in the mean compared to a larger
window (Dawson & Trapp, 2004). Currently, there is no consistency on the length of the
analysis window. In some cases, a window as large as 5 s (Billaut & Buchheit, 2013; Buchheit
et al., 2009; Smith & Billaut, 2010, 2012) and as small as 1 s (Ohya et al., 2013; Ohya et al.,
2015) has been used. When a Butterworth filter was employed, both peak and nadir values
(Faiss et al., 2013) and a 2-s average (Sandbakk et al., 2015) have been used. However, by
using a Butterworth filter, a single data point from the resulting output can be used with
assurance that it reflects the characteristics of the surrounding data. Though our choice to use
a Butterworth filter was based on previous research(Faiss et al., 2013; Sandbakk et al., 2015;
Willis et al., 2017), other smoothing/filtering techniques which eliminate outliers may also
yield similar results. Readers should also be aware that these data and analytical methods were
collected during isokinetic sprints where cadence was constrained to 120 rpm, and, although
muscle oxygenation patterns appear similar, one may exert caution when analysing NIRS
signal in non-isokinetic conditions where cadence is influenced by gear ratio and
neuromuscular fatigue.
CONCLUSION

Influence of Averaging Method on Muscle Deoxygenation Interpretation
∼ 97 ∽
NIRS-derived variables in sprint exercise are subject to rapid and large
perturbations. Furthermore, during cyclic movements such as running or cycling, there
are relatively large oscillations in the [HHb] signal response due to mechanical effects of
muscle contraction on local blood flow. This requires appropriate smoothing of the signal
to avoid either over or underestimation of peaks and nadirs. Sprint and recovery means
calculated over a 1-5 s window in predetermined time frames are often reported (Billaut
& Buchheit, 2013; Billaut et al., 2013; Buchheit et al., 2009; Buchheit et al., 2012; Buchheit
& Ufland, 2011; Cheng et al., 2013; Dupont et al., 2004; Galvin et al., 2013; Racinais et al.,
2007; Sandbakk et al., 2015; Smith & Billaut, 2010, 2012), however, there remains little
consistency between studies examining muscle oxygenation during repeated-sprint
exercise. The current results reveal that moving averages derive greater changes in
muscle oxygenation than means calculated from predetermined time points. Hence, this
method is less prone to underestimation of the maximum rate of de- and reoxygenation.
However, since these calculations are susceptible to signal bias from outliers, especially
when a shorter averaging window is used (Dawson & Trapp, 2004), we recommend using
a digital filter (Faiss et al., 2013; Sandbakk et al., 2015; Willis et al., 2017) or other
smoothing/filtering techniques prior to analysis. We also suggest that future studies
should avoid predetermined analysis windows, and focus on the determination of a single
value for peaks and nadirs from a rolling approach.

CHAPTER FOUR: EFFECTS OF INSPIRATORY
LOADING ON LOCOMOTOR AND RESPIRATORY
MUSCLE OXYGENATION TRENDS

Respiratory Muscle Work and Tissue Oxygenation Trends During Repeated-sprint Exercise
∼ 99 ∽
INTRODUCTION
Repeated-sprint exercise is characterized by brief periods of “maximal” exertion,
interspersed with incomplete recovery periods. Over the course of a repeated-sprint
series, there is a progressive reduction in both peak and mean power output, with a
plateau in the latter sprints (Gaitanos et al., 1993; Racinais et al., 2007). Phosphocreatine
(PCr) hydrolysis and anaerobic glycolysis are heavily relied on as a rapid source of
adenosine triphosphate (ATP) replenishment in sprint exercise (Gaitanos et al., 1993;
Parolin et al., 1999). Additionally, the aerobic system plays a significant role in
maintaining repeated-sprint performance. Resynthesis of PCr and removal of inorganic
phosphate is exclusively through oxidative processes (Harris et al., 1976), and sensitive
to oxygen (O2) availability (Sahlin et al., 1979). Therefore, the inability to maintain power
production is due to ATP/PCr depletion, accumulation of metabolic by-products such as
inorganic phosphate, and a decrease in ATP turnover rate with an increase in oxidative
phosphorylation (Bergström & Hultman, 1991; Gaitanos et al., 1993; Hogan et al., 1999).
Maintaining O2 delivery to the locomotor muscles during repeated-sprint exercise is
therefore an important mediating factor of performance.
Near-infrared spectroscopy offers the possibility to explore O2 balance (delivery
vs. consumption) in skeletal muscle during sprint activity in real time. Deoxyhaemoglobin
([HHb]) and oxyhemoglobin ([O2Hb]) rise and fall respectively, proportional to an
increase in metabolic activity in the underlying tissue. When NIRS has been used in
repeated-sprint exercise, relative changes in [HHb] are primarily examined, because it is
considered to be independent of blood volume (De Blasi et al., 1993; Grassi et al., 2003);
and assumed to reflect venous [HHb] to provide an estimate of muscular oxygenation
(DeLorey et al., 2003; Grassi et al., 2003). At sprint onset, there is a rapid increase of

Inspiratory Loading and Muscle Oxygenation Trends
∼ 100 ∽
vastus lateralis [HHb] which trends back towards baseline during the between sprint rest
periods (Buchheit et al., 2009; Racinais et al., 2007; Smith & Billaut, 2010). Other than
muscle deoxygenation during exercise, reoxygenation between sprints is often examined
as a primary measure to describe locomotor muscle O2 availably and therefore quality of
metabolic recovery (Billaut & Buchheit, 2013). Improving this capacity can have positive
effects for repeated-sprint performance (Buchheit & Ufland, 2011; Galvin et al., 2013;
Jones et al., 2015), whereas a decreased reoxygenation is associated with performance
impairments (Billaut & Buchheit, 2013; Buchheit et al., 2009; Dupont et al., 2004).
However, there has been no examination whether the O2 cost associated with hyperpnoea
influences locomotor muscle oxygenation trends in repeated-sprint exercise.
The respiratory muscles require ~10-15% of total pulmonary oxygen uptake
(V� O2) during high-intensity exercise, and a considerable portion of cardiac output in
order to maintain adequate O2 delivery to these muscles (Aaron, Johnson, et al., 1992;
Aaron, Seow, et al., 1992). An elevated work of breathing during high-intensity exercise
promotes competition between locomotor and respiratory muscles for available cardiac
output (Dempsey et al., 2006). In fact, the addition of an inspiratory load to artificially
increase the work of breathing during maximal exercise (>95% V� O2peak) clearly limits
endurance capacity via decreased limb perfusion and O2 delivery, mediated by
sympathetically-activated vasoconstriction in the locomotor muscles (Harms et al., 1997;
Harms et al., 1998). However, at moderate intensities (50-75% V� O2peak) there is no change
in vascular resistance or blood flow to the locomotor muscles (Wetter et al., 1999),
suggesting that exercise intensity is an important mediator of locomotor vasoconstriction
when the work of breathing is high.

Respiratory Muscle Work and Tissue Oxygenation Trends During Repeated-sprint Exercise
∼ 101 ∽
Exercising at ~94% V� O2peak, there is no further rise in vastus lateralis [HHb] with
the addition of a moderate respiratory load (both inspiratory and expiratory)
(Kowalchuk et al., 2002). It was only when partial arterial occlusion was applied that an
increase in [HHb] compensated for reduced blood flow (Harms et al., 1997; Kowalchuk et
al., 2002). This implies that there was no meaningful reduction of blood flow away from
locomotor muscles, and that muscle O2 extraction from arterial blood remained
consistent despite an elevated work of breathing. But when the work of breathing was
elevated further with heavy inspiratory load, an increase in vastus lateralis [HHb] during
constant load exercise occurred (Turner et al., 2013). It appears that along with exercise
intensity, the external load imposed on the respiratory muscles plays a role in blood flow
redistribution (Turner et al., 2013). It is currently unclear if an elevated work of breathing
has an influence on reoxygenation capacity in repeated-sprint exercise. Therefore, we
aimed to determine the potentially deleterious impact of an elevated work of breathing
on V� O2, tissue oxygenation trends and mechanical output during repeated-sprint
exercise.
METHODS
4.2.1 Subjects
Ten males from a variety of athletic backgrounds were recruited for this study
(team sports, road cycling, combat sports, CrossFit). These subjects were chosen because
they were accustomed to producing “all-out” bouts of exercise. Nine of the10 subject who
participated in this research, also participated in the research of the previous chapter
(Chapter Three). Subjects self-reported to be healthy and with no known neurological,
cardiovascular or respiratory diseases. After being fully informed of the requirements,
benefits, and risks associated with participation, each subject gave written informed

Inspiratory Loading and Muscle Oxygenation Trends
∼ 102 ∽
consent. Ethical approval for the study was obtained from the institutional Human
Research Ethics Committee and the study conformed to the declaration of Helsinki.
Subject characteristics are presented in Table 4.1.
Table 4.1: Subject Characteristics (n = 10).
Measure Value
Age (years) 25.5 ± 3.6
Height (cm) 184.00 ± 7.69
Body mass (kg) 81.45 ± 8.29
V� O2peak (L∙min-1) 4.40 ± 0.36
V� O2peak (mL∙min-1∙kg-1) 54.4 ± 5.9
V� Epeak (L∙min-1) 173.6 ± 26.9
Values are mean ± SD. Abbreviations are: V� O2peak, peak pulmonary oxygen uptake; V� Epeak, pulmonary ventilation at VO2peak.
4.2.2 Experimental Design
Subjects visited the laboratory on seven occasions. During visit one, subjects
completed a pulmonary function (Ultima CPX, MGC Diagnostics, Minnesota, USA) and
respiratory muscle strength tests (MicroRPM, Micro Medical, Hoechberg, Germany) (see
procedures below). Once completed, subjects then performed a familiarization trial of a
ramp exercise test. Visit two had subjects complete a ramp exercise test to exhaustion for
the determination of V� O2peak. During visit three, subjects were familiarized with the
repeated-sprint protocol. This involved completing the same exercise protocol that was
used in later experimental sessions, but the inspiratory load was applied for the first two
sprints only. In visits five and six, subjects completed the repeated-sprint exercise in a
randomized, cross-over design with no restriction to their breathing (CTRL) and with
inspiratory loading (INSP). The seventh trial (MATCH) consisted of ten work-matched
intervals to that of the INSP trial. All exercise testing was performed on an electronically-
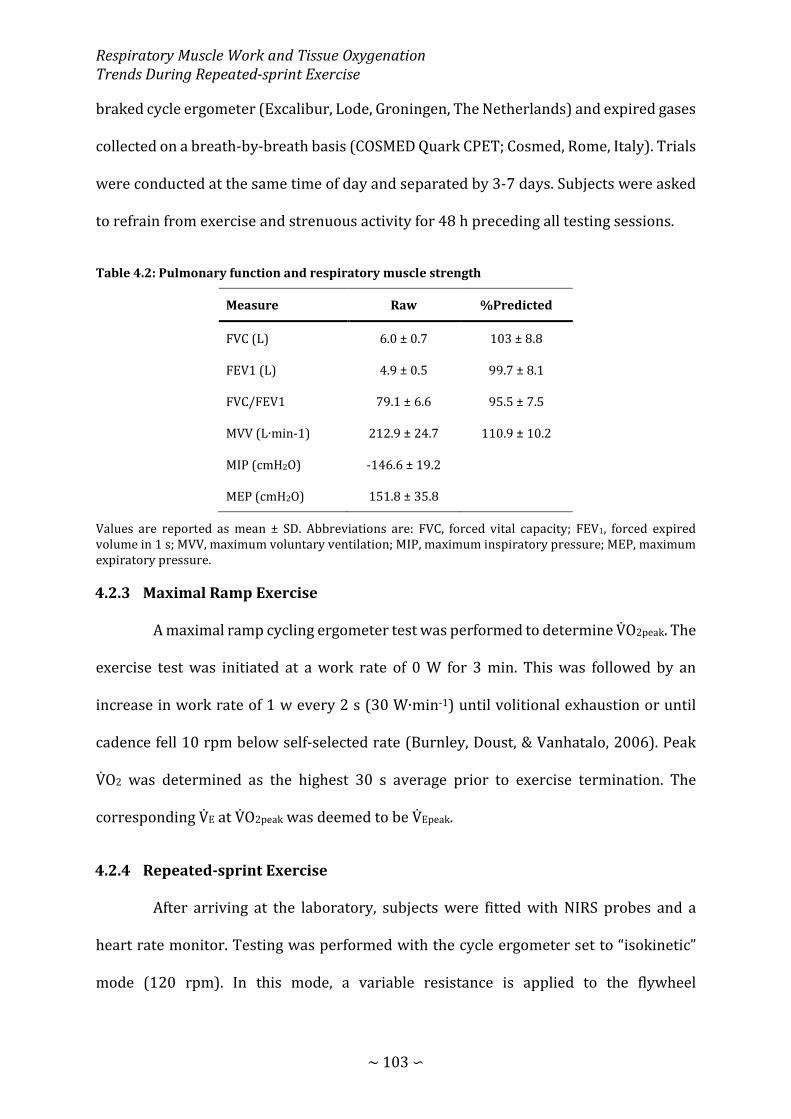
Respiratory Muscle Work and Tissue Oxygenation Trends During Repeated-sprint Exercise
∼ 103 ∽
braked cycle ergometer (Excalibur, Lode, Groningen, The Netherlands) and expired gases
collected on a breath-by-breath basis (COSMED Quark CPET; Cosmed, Rome, Italy). Trials
were conducted at the same time of day and separated by 3-7 days. Subjects were asked
to refrain from exercise and strenuous activity for 48 h preceding all testing sessions.
Table 4.2: Pulmonary function and respiratory muscle strength
Measure Raw %Predicted
FVC (L) 6.0 ± 0.7 103 ± 8.8
FEV1 (L) 4.9 ± 0.5 99.7 ± 8.1
FVC/FEV1 79.1 ± 6.6 95.5 ± 7.5
MVV (L∙min-1) 212.9 ± 24.7 110.9 ± 10.2
MIP (cmH2O) -146.6 ± 19.2
MEP (cmH2O) 151.8 ± 35.8
Values are reported as mean ± SD. Abbreviations are: FVC, forced vital capacity; FEV1, forced expired volume in 1 s; MVV, maximum voluntary ventilation; MIP, maximum inspiratory pressure; MEP, maximum expiratory pressure.
4.2.3 Maximal Ramp Exercise
A maximal ramp cycling ergometer test was performed to determine V� O2peak. The
exercise test was initiated at a work rate of 0 W for 3 min. This was followed by an
increase in work rate of 1 w every 2 s (30 W∙min-1) until volitional exhaustion or until
cadence fell 10 rpm below self-selected rate (Burnley, Doust, & Vanhatalo, 2006). Peak
V� O2 was determined as the highest 30 s average prior to exercise termination. The
corresponding V� E at V� O2peak was deemed to be V� Epeak.
4.2.4 Repeated-sprint Exercise
After arriving at the laboratory, subjects were fitted with NIRS probes and a
heart rate monitor. Testing was performed with the cycle ergometer set to “isokinetic”
mode (120 rpm). In this mode, a variable resistance is applied to the flywheel
Inspiratory Loading and Muscle Oxygenation Trends
∼ 104 ∽
proportional to the torque produced by the subjects to constrain their pedalling rate.
Below 120 rpm, no resistance is applied to the flywheel. This mode was chosen to avoid
cadence-induced changes in mechanical power production Cadence was fixed for every
sprint so that exercise-induced changes in mechanical power and physiological responses
were not influenced by cadence (Gotshall et al., 1996; Tomas, Ross, & Martin, 2010). The
handlebars and seat were individually adjusted to each subjects’ characteristic and feet
secured using toe cages and retention straps fitted to the ergometer. Crank arm length
was standardized to 175 mm. Visual feedback of power output was not available to the
subjects during any sprint. The cycle ergometer software provides power and cadence at
4 Hz. After a 7-min warm-up consisting of 5 min of unloaded cycling at 60-70 rpm and
two 4 s sprints (separated by 1 min), subjects rested for another 2.5 min before the
repeated-sprint protocol was initiated. The repeated-sprint protocol was ten 10 s sprints
separated by 30 s passive rest (5.5 min). Subjects were instructed to give an “all-out”
effort for every sprint and verbally encouraged throughout to promote a maximal effort.
Each sprint was performed in the seated position and initiated with the crank arm of the
dominant leg at 45°. Before sprint one, subjects were instructed to accelerate the flywheel
to 95 rpm over a 15-s period and assume the ready position 5 s before the
commencement of the test. This ensured that each sprint was initiated with the flywheel
rotating at ~90 rpm so that subjects could quickly reach 120 rpm. To minimise the chance
of a protective pacing strategy, the first 10 s sprint of the repeated-sprint series was
examined to ensure that peak power output exceeded that of the two preceding 4 s
sprints. In every instance, peak power output was highest during sprint one of the
repeated-sprint series. Data was exported into Excel for the calculation of mechanical
work completed and power production for individual sprints, and over the entire
protocol. After sprint one, five and ten, subjects were asked to rate on a 6-20 scale the

Respiratory Muscle Work and Tissue Oxygenation Trends During Repeated-sprint Exercise
∼ 105 ∽
difficulty of exercise (RPEExercise) and difficulty of breathing (RPEBreath). In every case,
subjects were asked the questions “how difficult is exercise?” and “how difficult is
breathing?”.
Inspiratory loading was achieved by placing a plastic disk with a 10-mm opening
over the inspiratory side of a two-way non-rebreathing valve (Hans Rudolph inc., Kansas,
United States of America) attached to the distal end of the breath-by-breath gas sampling
line and turbine. The inspiratory load was applied after warm-up, 1 min before the
commencement of the repeated-sprint protocol. Work matched exercise was conducted
by performing ten 10 s bouts of exercise separated by 30 s of passive rest. This was
achieved by reproducing the mean power output of the corresponding sprint repetition
from the INSP trial. The cycle ergometers isokinetic function cannot be used when
controlling for power output, therefore, subjects were asked to maintain cadence at 120
RPM during each interval.
4.2.5 Metabolic and Ventilatory Measurements
Subjects wore a silicone facemask to which the breath-by-breath gas sampling
line and turbine were attached. The analyser was calibrated before each test against
known gas concentrations and the turbine volume transducer was calibrated using a 3 L
syringe (Cosmed, Rome, Italy). Data was then exported into Excel so that V� O2 and V� E could
be inspected for errant data points. Editing data was performed to remove the occasional
errant breaths caused by for example swallowing or coughing which were considered not
be reflective the metabolic responses to exercise. These errant data points were removed
by the same researcher in every case before values greater than 4 standard deviations
from the local mean were removed (Lamarra, Whipp, Ward, & Wasserman, 1987;
Rossiter et al., 2000). A 5-breath rolling average was then applied for the calculation of

Inspiratory Loading and Muscle Oxygenation Trends
∼ 106 ∽
peak and nadir for both V� O2 and V� E for every 40-s sprint/recovery period to give a single
value for each sprint and recovery phase. Inspiratory volume (IV), breathing frequency
(ƒb), end-tidal O2 partial pressure (PETO2), end-tidal CO2 partial pressure (PETCO2) was
averaged to give one value for each 40-s period. Because the facemask was removed
immediately after the tenth sprint, only maximum values were calculated over the first
10 s. Mouth pressure (Pm) was recorded continuously at 50 Hz with a pressure transducer
(Honeywell, New Jersey, United States of America) attached to the saliva port of the non-
rebreathing valve via Tygon tubing. Representative data from one subject of the effects
of inspiratory muscle loading on Pm is displayed in Figure 4.1. Mean inspiratory and
expiratory Pm was then calculated as an index of respiratory muscle work as well as mean
peak inspiratory Pm. For statistical analysis, inspiratory Pm was converted to positive
values and presented in the results as such. Heart rate (HR) and arterial oxygen
saturation (estimated by fingertip pulse oximetry; SPO2) was sampled on a breath-by-
breath basis integrated into the COSMED system.
4.2.6 Near-infrared Spectroscopy
Subjects were instrumented with two NIRS probes to assess muscle oxygenation
(Oxymon MKIII, Artinis, the Netherland). The first probe was fixed over the distal part of
the vastus lateralis muscle belly approximately 15 cm above the proximal border of the
patella of the dominate leg. The second probe was fixed over the left 6th intercostal space
at the anterior axillary line of the serratus anterior to assess changes in the accessory
respiratory muscles. Probes were held in place with black plastic spacers secured to the
skin using double-sided stick disks and shielded from light using black self-adhesive
elastic bandage. Optode spacing was set to 4.5 cm and 3.5 cm for vastus lateralis and
respiratory muscles, respectively. Skinfold thickness was measured between the emitter

Respiratory Muscle Work and Tissue Oxygenation Trends During Repeated-sprint Exercise
∼ 107 ∽
and detector using a skinfold calliper (Harpenden Ltd.) to account for skin and adipose
tissue thickness covering the muscle. The skinfold thickness for vastus lateralis (1.19 ±
0.69 cm) and respiratory muscles (1.12 ± 0.44 cm) was less than half the distance
between the emitter and the detector in every case. A modified form of the Beer-Lambert
law was used to calculate micromolar changes in tissue [HHb] and [O2Hb] across time
using the received optical density from continuous wavelengths of NIR light. A differential
pathlength factor of 4.95 was used (Smith & Billaut, 2010; Subudhi et al., 2007). Tissue
saturation index was used as an index of tissue oxygenation (TSI = [O2Hb] ÷ ([O2Hb] +
[HHb]), expressed in %), which reflects the dynamic balance between O2 supply and O2
consumption in the tissue microcirculation and is independent of near-infrared photon
pathlength in tissue. Tissue saturation index was determined for both the vastus lateralis
(TSIVL) and respiratory muscles (TSIRM). We also chose to focus our analysis on Δ[HHb]
to allow comparisons to previous research because Δ[HHb] is independent of changes in
total haemoglobin (De Blasi et al., 1993) and taken to reflect venous [HHb] which
provides an estimate of muscular oxygen extraction (DeLorey et al., 2003; Grassi et al.,
2003), and because Δ[O2Hb] is influenced by rapid blood volume and perfusion variations
caused by forceful muscle contractions (De Blasi et al., 1993; Takaishi et al., 2002).
Data were acquired at 10 Hz. A 10th order zero-lag low-pass Butterworth filter
was applied to the data to remove artefacts and smooth pedalling induced fluctuations;
the resulting output was used for analysis (Rodriguez, Townsend, Aughey, & Billaut,
2018). The application of the filter was conducted in the R environment (R Core Team,
2016) using the signal package (Signal developers, 2013). Values were then normalized
to femoral artery occlusion so that 0% represented a 5-s average immediately prior the
occlusion and 100% represented the maximum 5 s average. To obtain one value per
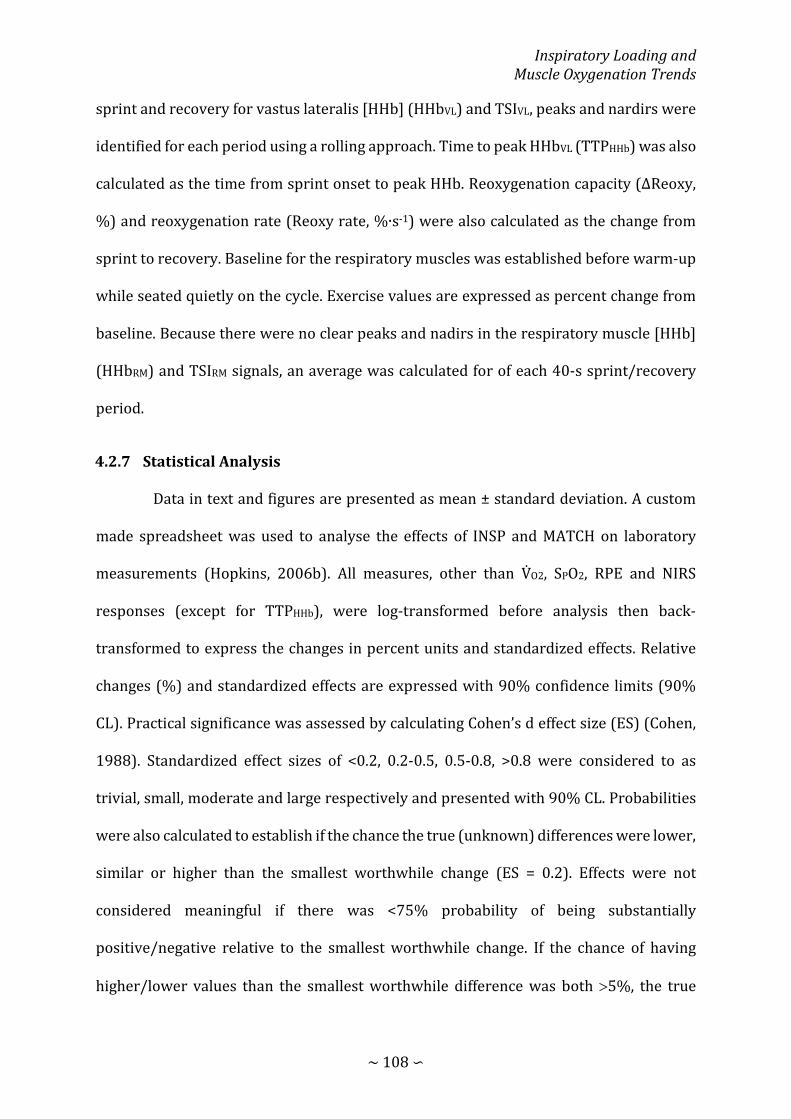
Inspiratory Loading and Muscle Oxygenation Trends
∼ 108 ∽
sprint and recovery for vastus lateralis [HHb] (HHbVL) and TSIVL, peaks and nardirs were
identified for each period using a rolling approach. Time to peak HHbVL (TTPHHb) was also
calculated as the time from sprint onset to peak HHb. Reoxygenation capacity (∆Reoxy,
%) and reoxygenation rate (Reoxy rate, %∙s-1) were also calculated as the change from
sprint to recovery. Baseline for the respiratory muscles was established before warm-up
while seated quietly on the cycle. Exercise values are expressed as percent change from
baseline. Because there were no clear peaks and nadirs in the respiratory muscle [HHb]
(HHbRM) and TSIRM signals, an average was calculated for of each 40-s sprint/recovery
period.
4.2.7 Statistical Analysis
Data in text and figures are presented as mean ± standard deviation. A custom
made spreadsheet was used to analyse the effects of INSP and MATCH on laboratory
measurements (Hopkins, 2006b). All measures, other than V� O2, SPO2, RPE and NIRS
responses (except for TTPHHb), were log-transformed before analysis then back-
transformed to express the changes in percent units and standardized effects. Relative
changes (%) and standardized effects are expressed with 90% confidence limits (90%
CL). Practical significance was assessed by calculating Cohen’s d effect size (ES) (Cohen,
1988). Standardized effect sizes of <0.2, 0.2-0.5, 0.5-0.8, >0.8 were considered to as
trivial, small, moderate and large respectively and presented with 90% CL. Probabilities
were also calculated to establish if the chance the true (unknown) differences were lower,
similar or higher than the smallest worthwhile change (ES = 0.2). Effects were not
considered meaningful if there was <75% probability of being substantially
positive/negative relative to the smallest worthwhile change. If the chance of having
higher/lower values than the smallest worthwhile difference was both >5%, the true

Respiratory Muscle Work and Tissue Oxygenation Trends During Repeated-sprint Exercise
∼ 109 ∽
difference was assessed as unclear. For clear effects, the likelihood that the true effect
was substantial were assessed qualitatively as follows: likely (75 to <95%), very likely
(95-99.5%), almost certainly (>99%) (Batterham & Hopkins, 2006; Hopkins et al., 2009).
RESULTS
4.3.1 Mouth Pressure
Mouth pressure responses to exercise and inspiratory muscle loading are
presented in Table 4.3, and representative data from a single subject are presented in
Figure 4.1. Mean inspiratory Pm was greater during INSP compared to CTRL with a large
effect (relative difference = 629.8%, ±61.8%; standardised effect size = 12.75, ±0.58).
Additionally, peak inspiratory Pm was greater during Insp than CTRL with a large effect
(702.4%, ±70.9%; ES =13.00, ±0.55). But there was a trivial difference in expiratory Pm (-
0.3%, ±5.6%; ES = -0.03, CL ±0.43).
Mean inspiratory Pm was lower during MATCH compared to INSP with a large
effect (-91.2%, ±1.0%; ES = -10.27, ±0.45). Similarly, peak inspiratory Pm was lower
during MATCH than INSP with a large effect (-92.4%, ±0.9%; ES = -10.75, ±0.50). A large
effect was also present for expiratory Pm with MATCH being lower than Insp (-40.0%,
±5.0%; ES = -4.21, ±0.69).

Inspiratory Loading and Muscle Oxygenation Trends
∼ 110 ∽
Figure 4.1: Representative data of mouth pressure during exercise. The traces represent mouth pressure (Pm) during a single breath in the Inspiratory Loading (INSP), Control (CTRL), and Work Matched (MATCH) exercise conditions.
4.3.2 Mechanical Measurements
Total work completed per sprint for each condition is presented in Figure 4.2.
There was no meaningful effect of INSP on total work completed over the entire repeated-
sprint protocol (56.62 ± 7.02 kJ) compared to CTRL (57.87 ± 8.02 kJ) (-2.7%, ±6.4%; ES =
-0.17, ±0.42). Similarly, total work developed in MATCH (55.92 ± 6.98 kJ) and INSP (-
0.6%, ±0.1%; ES = -0.04 ±0.01) were not different. There was no meaningful effect of INSP
on PPO (1097 ± 148 W) compared to CTRL (1158 ± 172 W) (-5.1%, ±6.1; ES -0.30, ±0.35).
Whereas an almost certainly large effect existed between MATCH (773 ± 122 W) and INSP
(-29.7%, ±2.3%; ES = -2.21 ±0.20).

Respiratory Muscle Work and Tissue Oxygenation Trends During Repeated-sprint Exercise
∼ 111 ∽
Figure 4.2: Total mechanical work per sprint performed during the sprints. The bars represent data from control (CTRL), Inspiratory Loading (INSP), and Work Match (MATCH) exercise conditions. Values are presented as mean ± SD.
4.3.3 Physiological Responses
Responses to exercise are presented in Table 4.3 and Figure 4.3. Over the entire
protocol, V� O2 was greater during both sprint (4.7%, ±2.7%; ES = 0.64, ±0.37) and
recovery (4.2%, ±3.1; ES = 0.74, ±0.55) for INSP compared to CTRL. Additionally, V� O2 was
lower during MATCH compared to INSP during both sprint (-21.7%, ±5.0%; ES = -4.59,
±1.06) and recovery (16.3%, ±2.9%; ES = -3.30, ±0.58). Likewise, V� E during INSP was
greater than CTRL both during sprint (-19.6%, ±3.5%; ES = -1.13, ±0.22) and recovery (-
11.5%, ±5.6; ES = -0.80, ±0.41) compared to INSP. Throughout MATCH, V� E was lower
during both sprint (-35.8%, ±9.5%; ES = -2.92, ±0.98) and recovery (-33.2%, ±6.2%; ES =
-2.81, ±0.65). There was no meaningful difference of IV between INSP and CTRL (2.8%,
±4.8%; ES = 0.16, ±0.27). On the other hand, IV was almost certainly lower during MATCH
compared to INSP (-15.6%, ±5.1%; ES = -0.91, ±0.32). There was an almost certainly large
effect of INSP on Rf compared to CTRL (-21.2%, ±4.7%; ES = -1.41, ±0.35). Additionally, ƒb
was very likely lower during MATCH compared to INSP (-20.8%, ±9.6%; ES = -1.53, ±0.79).

Inspiratory Loading and Muscle Oxygenation Trends
∼ 112 ∽
During Insp, PETO2 was lower than CTRL (-3.7%, ±2.3%; ES = -1.71, ±0.65), and
lower during MATCH compared to CTRL (-7.4%, ±2.3; ES = -2.81, ±0.91). Conversely,
PETCO2 was higher during INSP compared to CTRL (9.1%, ±4.0%; ES = 1.22, ±0.51), and
higher during MATCH compared to INSP (7.7%, ±4.2; ES = 1.03, ±0.54). There were
unclear differences for SPO2 between both INSP and CTRL (-0.1%, ±0.5; ES = -0.10, ±0.43),
and, MATCH and INSP (0.2%, ±0.4%; ES = 0.16, ±0.34).
Differences for HR were unclear between INSP and CTRL (1.0%, ±4.4%; ES =
0.11, ±0.50). However, there was a clear almost certainly large effect between MATCH and
INSP (-15.6%, = ±3.3; ES = -2.66, ±0.61).

Respiratory Muscle Work and Tissue Oxygenation Trends During Repeated-sprint Exercise
∼ 113 ∽
Table 4.3: Physiological responses to the repeated-sprint exercise. The columns include data from Control (CTRL), Inspiratory Loading (INSP), and Work Match (MATCH) exercise conditions. Data was averaged over the entire 5.5 min repeated-sprint protocol.
Variable CTRL INSP MATCH
Inspiratory Pm (cmH2O) 2.3 ± 0.2 17.1 ± 2.8*** 1.5 ± 0.3###
Peak inspiratory Pm (cmH2O) 3.5 ± 0.3 28.1 ± 4.8*** 2.1 ± 0.4###
Expiratory Pm (cmH2O) 2.0 ± 0.2 2.0 ± 0.1 1.2 ± 0.2###
Sprint V� O2 (%V� O2peak) 90.7 ± 6.72 95.4 ± 4.32 ** 73.7 ± 6.1 ###
Recovery V� O2 (%V� O2peak) 70.7 ± 5.2 74.9 ± 4.5 * 58.6 ± 4.3 ###
Sprint V� E (L∙min-1) 161.5 ± 27.5 129.1 ± 16.8 *** 83.4 ± 15.2 ###
Recovery V� E (L∙min-1) 101.4 ± 13.9 89.7 ± 11.4 ** 60.2 ± 10.0 ###
IV (L) 3.0 ± 0.5 3.1 ± 0.5 2.6 ± 0.4 ###
ƒb (b∙min-1) 48.1 ± 7.8 37.8 ± 5.0 *** 30.2 ± 6.0 ##
PETO2 (mmHg) 117.7 ± 2.3 113.4 ± 2.8 *** 105 ± 5.1 ###
PETCO2 (mmHg) 35.5 ± 2.3 38.6 ± 2.6 *** 41.6 ±3.2 ##
SPO2 (%) 97 ± 1 97 ± 1 97 ± 1
HR (b∙min-1) 153 ± 12 154± 9 131 ±12 ###
RPEExercise (AU)
Sprint 1 15 ± 3 14 ± 2 12 ± 2 ###
Sprint 5 17 ± 2 17 ± 2 13 ± 2 ###
Sprint 10 18 ± 2 18 ± 2 13 ± 2 ###
RPEBreath (AU)
Sprint 1 12 ± 2 15 ± 2 *** 11 ± 2 ###
Sprint 5 15 ± 1 18 ± 2 *** 12 ± 2 ###
Sprint 10 16 ± 2 19 ± 1 *** 12 ± 2 ###
Values are reported as mean ± SD. Abbreviations are: Pm, mouth pressure; V� O2, pulmonary oxygen uptake; V� E, pulmonary ventilation; IV, inspiratory volume; ƒb, respiratory frequency; PETO2, partial pressure of end-tidal oxygen; PETCO2, partial pressure of end-tidal carbon dioxide; SpO2, arterial oxygen saturation estimated by pulse oximetry; HR, heart rate; RPEExercise, rating of perceived exertion for exercise; RPEBreath, rating of perceived exertion for breathing. The symbols represent comparisons between INSP and CTRL (⁕), INSP and MATCH (#). The number of symbols; one, two and three denote likely, very likely and almost certainly respectively, that the chance of the true effect exceeds a small (-0.2-0.2) effect size.

Inspiratory Loading and Muscle Oxygenation Trends
∼ 114 ∽
Figure 4.3: Sprint and recovery pulmonary oxygen uptake (V� O2) expressed as a percentage of V� O2peak for Control (CTRL), Inspiratory Loading (INSP) and Worked Matched (MATCH) exercise. The symbols represent comparisons between INSP and CTRL (⁕), INSP and MATCH (#). The number of symbols; one, two and three denote likely, very likely and almost certainly respectively, that the chance of the true effect exceeds a small (-0.2-0.2) effect size. Results are mean ± SD.
4.3.4 Muscle Oxygenation
Responses to exercise are presented in Table 4.4 and, Figure 4.4 and Figure 4.5.
Differences were unclear between INSP and CTRL for TSIRM (1.0%, ±7.5%), but MATCH
was very likely lower than INSP (22.1%, ±12.5%). Average HHbRM was likely greater
during INSP compared to CTRL (9.0%, ±7.5%). Conversely, HHbRM was lower during
MATCH compared to INSP (-19.6%, ±6.0%).
Differences of sprint TSIVL (-0.3%, ±9.5%) and recovery TSIVL (-1.1%, ±7.0%)
were unclear between INSP and CTRL. Similarly, the differences between INSP and CTRL
for both sprint HHbVL (-1.1%, ±5.1) and recovery HHbVL (-2.7%, ±5.4%) were unclear.
There was no meaningful difference in TTPHHb between INSP and CTRL (-5.8%, ±6.0).

Respiratory Muscle Work and Tissue Oxygenation Trends During Repeated-sprint Exercise
∼ 115 ∽
There was also no meaningful difference in ΔReoxy between INSP and CTRL (4.7%, ±8.3).
Additionally, there was an unclear difference in Reoxy rate (0.0%, ±0.3%).
In MATCH exercise, differences in TSIVL were unclear compared to INSP for both
sprint (2.2%, ±6.7%), and recovery (-1.4%, ±7.6) phases. Additionally, there was no
meaningful difference in sprint HHbVL (-1.1%, ±5.1%), and an unclear difference for
recovery HHbVL (3.0%, ±5.7%). The TTPHHb was greater during MATCH than INSP (12.0%,
±14.4%). There were also unclear differences in ΔReoxy (-5.2%, ±11.5%), and Reoxy rate
(0.1%, ±0.4%) between MATCH and INSP.
Table 4.4: Mean near-infrared spectroscopy responses to repeated-sprint exercise. The columns include data from Control (CTRL), Inspiratory Loading (INSP), and Work Match (MATCH) exercise conditions.
Variable CTRL INSP MATCH
TSIRM (%) 40.34 ± 19.01 41.93 ± 20.73 63.50 ± 8.21 ##
HHbRM (%) 28.94 ± 19.85 37.96 ± 16.41 * 18.36 ± 13.60 ###
Sprint TSIVL (%) 36.66 ± 25.91 36.38 ± 20.29 38.57 ± 16.48
Recovery TSIVL (%) 77.02 ± 12.79 75.95 ± 14.29 74.57 ±7.13
Sprint HHbVL (%) 83.65 ± 11.61 82.56 ± 16.22 85.11 ± 12.23
Recovery HHbV (%) 30.63 ± 9.82 27.90 ± 13.43 30.90 ± 8.67
TTPHHb (s) 13.0 ± 3.3 12.3 ± 3.4 13.8 ± 3.7 #
ΔReoxy (%) 49.94 ± 20.3 54.66 ± 19.24 49.45 ± 21.08
Reox rate (%∙s-1) 2.16 ± 0.78 2.20 ± 0.75 2.27 ± 0.79
Values are reported as mean ± SD. Abbreviations are: TSIRM, respiratory muscle tissue saturation index (n = 8); HHbRM, respiratory muscle deoxyhaemoglobin; TSIVL, vastus lateralis tissue saturation index; HHbVL, vastus lateralis deoxyhaemoglobin; TTPHHb, time to peak deoxyhaemoglobin; ΔReoxy, reoxygenation; Reoxy rate, reoxygenation rate. The symbols represent comparisons between INSP and CTRL (⁕), INSP and MATCH (#). The number of symbols; one, two and three denote likely, very likely and almost certainly respectively, that the chance of the true effect exceeds a small (-0.2-0.2) effect size.
Inspiratory Loading and Muscle Oxygenation Trends
∼ 116 ∽
Figure 4.4: Near-infrared spectroscopy responses to repeated-sprints during the Control (CTRL) Inspiratory Loading (INSP) and Work Matched (MATCH) trials. (A) Respiratory muscle tissue saturation index (TSIRM) (n = 8). (B) Respiratory muscle deoxy haemoglobin (HHbRM) expressed as percent change from baseline (n = 10). (C) Vastus lateralis tissue saturation index (TSIVL). (D) Vastus lateralis deoxy haemoglobin (HHbVL) expressed relative to occlusion values. Values are presented as mean ± SD. The symbols represent comparisons between INSP and Control (⁕), INSP and MATCH (#). The number of symbols; one, two and three denote likely, very likely and almost certainly respectively, that the chance of the true effect exceeds a small (-0.2-0.2) effect size.

Respiratory Muscle Work and Tissue Oxygenation Trends During Repeated-sprint Exercise
∼ 117 ∽
Figure 4.5: Standardised effects (Cohen’s d) with 90% confidence intervals for near-infrared spectroscopy variables comparing Inspiratory Loading (INSP) to Control (CTRL), and Work Matched exercise (MATCH) to INSP. Shaded area indicates a trivial effect, and dotted lines thresholds for small, moderate and large effects. Abbreviations are: TSIRM, respiratory muscle tissue saturation index; HHbRM, respiratory muscle deoxyhaemoglobin; TSIVL, vastus lateralis tissue saturation index; HHbVL, vastus lateralis deoxyhaemoglobin; ΔReoxy, vastus laterals reoxygenation; Reoxy rate, vastus laterals reoxygenation rate; TTPHHb, time to peak deoxyhaemoglobin.
4.3.5 Rating of Perceived Exertion
Perceptions of exercise and breathing difficulty are presented in Table 4.4. There
was a likely trivial effect of INSP on RPEExercise compared to CTRL after sprint 1 (-0.2%,
±0.5%; ES = -0.08, ±0.21), unclear effects after sprint 5 (0.3%, ±1.1%; ES = 0.14, ±0.52),
and unclear effects after sprint 10 (0.4%, ±1.0%; ES = 0.19, ±0.49). On the other hand,
RPEExercise during MATCH was almost certainly lower than INSP after sprint 1 (-2.1%,
±0.8%; ES = -0.98, ±0.37), sprint 5 (-4.4%, ±1.3%; ES = -2.78, ±0.79), and 10 (-5.6%,
±1.2%; ES = -3.43, ±0.73).
During INSP, RPEbreath was almost certainly greater then CTRL after sprint 1
(2.8%, ±0.7; ES = 1.46, ±0.37), sprint 5 (2.4%, ±1.0%; ES = 1.79, ±0.77), and sprint 10
(2.7%, ±1.2; ES =1.32, ±0.57). Similarly, MATCH was almost certainly lower then INSP

Inspiratory Loading and Muscle Oxygenation Trends
∼ 118 ∽
after sprint 1 (-4.0%, ±1.1%; ES = -2.09, 90% CL ±0.57), sprint 5 (-6.1%, ±2.0%; ES = -
4.54, ±1.50), and sprint 10 (-6.8%, ±1.6%; ES = -3.93, ±0.95).
DISCUSSION
This study examined the physiological responses in repeated-sprint exercise to
heightened respiratory muscle work, in particular, the oxygenation trends of both
respiratory and vastus lateralis muscles. The addition of inspiratory loading increased
mouth pressure and respiratory muscle O2 utilization. However, this had no meaningful
impact on blood arterial O2 saturation and tissue oxygenation trends within the vastus
lateralis muscle. We interpret these findings to suggest during maximal intermittent
work, O2 delivery and demands of the respiratory and locomotor muscles can be
maintained.
4.4.1 Work of Breathing and Respiratory Muscle Oxygenation
Hyperpnoea during high-intensity exercise requires a considerable portion of
whole-body V� O2 to support the metabolic demands of the respiratory muscles (Aaron,
Johnson, et al., 1992; Aaron, Seow, et al., 1992), and is increased when an inspiratory load
is added (Harms et al., 1998). In the present study, V� O2 was elevated by 4-5% during both
the sprint and recovery phases of the repeated-sprint protocol when an inspiratory load
was added. This occurred even with no meaningful difference in total work between INSP
and CTRL. Responses in HHbRM lend support to the notion of increased O2 utilization by
the respiratory muscles. The addition of an inspiratory load increased oxygen utilization
of the respiratory muscles probably to accommodate an elevated work of breathing, as
demonstrated during endurance exercise (Turner et al., 2013; Wetter et al., 1999).
Furthermore, there were unclear differences in TSIRM suggesting that [O2Hb] was higher
to MATCH the demands for O2 delivery of the respiratory muscles. Previous studies have
Respiratory Muscle Work and Tissue Oxygenation Trends During Repeated-sprint Exercise
∼ 119 ∽
shown similar changes in HHbRM in response to inspiratory loading (Turner et al., 2013),
and resistive breathing (Nielsen, Boesen, & Secher, 2001). The present data further
suggest maintenance of respiratory muscle [O2Hb] with inspiratory loading. But this can
have negative consequences for exercise tolerance and the development of peripheral
fatigue if blood flow is redirected away from the active limbs, and towards the respiratory
muscles to meet the metabolic demands of breathing.
During continuous high-intensity exercise when the work of breathing is high,
there can be an increase in vascular resistance and a reduction in limb perfusion (Harms
et al., 1997; Harms et al., 1998; Sheel et al., 2001). It is believed that this is a protective
mechanism aiming at maintaining adequate blood flow and O2 supply to the respiratory
muscles. An accumulation of metabolites in the respiratory muscles stimulate group IV
afferent discharge in the respiratory muscles (J. M. Hill, 2000), leading to sympathetically
mediated efferent discharge and vasoconstriction in the locomotor muscles (Harms et al.,
1997; St Croix et al., 2000). Though there is evidence of this in sustained high-intensity
exercise, such evidence does not exist in repeated-sprint exercise. The intermittent
nature of repeated-sprint exercise may have sufficient recovery time to prevent the
accumulation of fatigue inducing metabolites recovery O2 debt in the respiratory muscles.
Moreover, respiratory muscle fatigue does not appear to be induced by repeated-sprint
exercise (Minahan et al., 2015). The deleterious effects of respiratory muscle work may
be more prominent in a repeated-sprint protocol with shorter between sprint recovery
periods (i.e. 10 s sprint and 20 s rest (Faiss et al., 2013; Willis et al., 2017)). But to date,
no examination exists exploring the role of respiratory muscle work in repeated-sprint
exercise and the effects on locomotor muscle oxygenation.

Inspiratory Loading and Muscle Oxygenation Trends
∼ 120 ∽
4.4.2 Locomotor Muscle Oxygenation
Inspiratory loading had no discernible effects on sprint HHbVL despite a
considerable increase in the work of breathing and respiratory muscle O2 utilization. The
evolution of vastus lateralis deoxygenation is a rapid increase at sprint onset, and then
plateaus with sprint repetition (Buchheit et al., 2009; Racinais et al., 2007; Smith &
Billaut, 2010). This suggests that a maximal level of O2 extraction in the locomotor
muscles is achieved (Esaki et al., 2005). However, a higher secondary ceiling point to
vastus lateralis deoxygenation has been observed when repeated-sprint exercise has
been performed in simulated altitude (normobaric hypoxia) (Billaut & Buchheit, 2013).
This can be in part explained by a compensatory increase in muscle O2 extraction to
negate a reduced O2 availability (Legrand et al., 2005). If vastus lateralis O2 availability
had been impacted in the present study by an elevated work of breathing, it would have
been expected for sprint HHbVL to be greater during INSP. Nevertheless, muscle
deoxygenation per se may play a limited role in prolonged repeated-sprint performance.
But muscle O2 availability during recovery appears to be more influential in maintaining
performance (Billaut & Buchheit, 2013). The capacity to reoxygenate between sprints is
highly sensitive to O2 availability, and underpins metabolic recovery between sprint
bouts (Billaut & Buchheit, 2013; Buchheit et al., 2009; Jones et al., 2015). Even with the
addition of an inspiratory load which increased respiratory muscle O2 utilization vastus
lateralis O2 delivery was maintained. It appears that the cardiovascular system can adjust
to support the metabolic O2 demands of both the respiratory and locomotor muscles
during repeated-sprint exercise.
Exercise intensity is an important mediator of blood flow redirection. Increasing
the work of breathing artificially at submaximal exercise intensities (up to 75% V� O2peak)

Respiratory Muscle Work and Tissue Oxygenation Trends During Repeated-sprint Exercise
∼ 121 ∽
has been shown to increase whole-body V� O2 with no change in limb blood flow (Wetter
et al., 1999). On the other hand, when an inspiratory load is added during maximal
exercise, blood flow to the locomotor muscles is compromised (Harms et al., 1997; Harms
et al., 1998). During maximal exercise, cardiac output is limited and its ability to supply
adequate blood flow to both locomotor and respiratory muscles is challenged.
Consequently, part of the available blood is directed away from the limbs and towards
the respiratory muscles to support the elevated work of breathing.
Though repeated-sprint exercise is known to elicit V� O2 of >90% of peak, it is not
sustained throughout the entire protocol (Buchheit et al., 2009; Dupont, Blondel, &
Berthoin, 2003), and skeletal muscle O2 extraction fluctuates between efforts and
recovery (Billaut & Buchheit, 2013) . In the current study, sprint pulmonary V� O2
fluctuated between 90% and 70% of V� O2peak during sprint and recovery phases,
respectively, but increased by ~4.5% when the inspiratory load was added (Figure 4.3).
Even though participants in the present study were asked to produce maximal “all-out”
efforts, the load on the cardiovascular system remained submaximal (Buchheit et al.,
2009; Dupont et al., 2003). Subsequently, competition for available cardiac output
between locomotor and respiratory muscles was minimized. When limb blood flow has
been attenuated with inspiratory loading, there is no accommodating increase in V� O2
(Harms et al., 1997; Harms et al., 1998). This presumably occurs when the prescribed
exercise intensity is sufficient to elicit sustained V� O2peak, and therefore, no further
increase can occur. In the present study, maintenance of TSIRM suggested that there was
a rise in O2 delivery proportional to the additional metabolic work of the respiratory
muscles. Because there were no differences in HR, it is improbable that cardiac output
increased to accommodate the additional O2 demand. Demands may have been met by a

Inspiratory Loading and Muscle Oxygenation Trends
∼ 122 ∽
redirection of blood flow from less active regions towards the respiratory muscles (Ogata
et al., 2007; Peltonen et al., 2013).
Hyperventilation was present in both CTRL, and to a lesser degree, INSP trials,
which may have had a protective effect on limb O2 delivery. Hyperventilation is
associated with an increase in alveolar ventilation disproportionate to V� O2 (pressure of
alveolar O2 increases), and V� CO2 (pressure of alveolar CO2 decreases) (Forster et al.,
2012; Sheel & Romer, 2012). This is a potential mechanism associated with high-intensity
exercise which can constrain a fall in arterial O2 and pH (Forster et al., 2012; Whipp &
Ward, 1998). Despite a reduction of V� E in a state of heightened O2 demand during the
INSP trial, SpO2 was maintained with no signs of arterial hypoxia. In studies where vastus
lateralis tissue oxygenation was impaired during exercise with resistive breathing and
inspiratory loading, there was a small degree of arterial hypoxemia (Nielsen et al., 2001;
Turner et al., 2013). Exercise-induced arterial hypoxemia is a known limiting factor of
exercise (Dempsey & Wagner, 1999), and preventing it with supplemental O2 can
attenuate peripheral muscle fatigue (Romer, Haverkamp, Lovering, Pegelow, & Dempsey,
2006). The respiratory muscle work may only be influential to exercise if a significant
degree of arterial O2 desaturation has also occurred. Though exercise-induced arterial
hypoxemia has been demonstrated to be incurred with repeated-sprint exercise (Smith
& Billaut, 2010), there was no evidence of its occurrence in the present study. Meaningful
changes in repeated-sprint oxygenation trends from an elevated work of breathing may
only occur if exercise-induced arterial hypoxemia is also present.
The level of inspiratory loading may have also had an influence on the outcomes
in this study. In previous work, inspiratory loading was achieved by reducing the
inspiratory aperture to 10 mm and 8 mm (Turner et al., 2013). Only with the smaller

Respiratory Muscle Work and Tissue Oxygenation Trends During Repeated-sprint Exercise
∼ 123 ∽
opening that changes in [HHb] of the exercise limb were detected. Similarly, when
resistive breathing has been used, the most noticeable changes in tissue oxygenation
trends occurred when the aperture was reduced to 4.5 mm (Nielsen et al., 2001). The
inspiratory work in the present study may have been too low to induce a respiratory
muscle metaboreflex. However we do not believe this to be the case since peak Pm in our
experiment was similar to the previous work when an 8-mm aperture was used (30.7 ±
6.6 cmH2O vs. 28.1 ± 4.8 cmH2O) (Turner et al., 2013). Additionally V� E was considerably
higher than previous work (Nielsen et al., 2001; Turner et al., 2013) which would have
contributed to a heightened work of breathing.
4.4.3 Worked Matched Exercise
To our knowledge, this is the first time repeated work matched bouts of exercise
have been used to examine the demands of repeated-sprint exercise under altered
metabolic conditions. Regardless of a similar degree of vastus lateralis tissue
deoxygenation incurred during the work matched sprints, the physiological load placed
on the cardiovascular system was considerably lower. This is evidenced by the
consistently lower V� O2, in part, due to markedly lower respiratory muscle O2 utilization.
But more importantly, V� O2 was heavily influenced by how exercise was prescribed.
Matching total work was achieved by replicating mean power output for each sprint, and
therefore was lacking maximal acceleration and power production associated with sprint
exercise. Reliance on intramuscular ATP and PCr hydrolysis would have been reduced
(Gaitanos et al., 1993; Glaister, 2005), and metabolic perturbations associated with
maximal exercise minimized (Gaitanos et al., 1993; Glaister, 2005; Hogan et al., 1999;
Parolin et al., 1999). Despite a substantial decrease in the O2 cost associated with the
work of breathing and sprint exercise, there was no substantial difference in ΔReoxy nor

Inspiratory Loading and Muscle Oxygenation Trends
∼ 124 ∽
Reoxy rate. This implies that tissue reoxygenation was maximal in all exercise conditions
whatever the respiratory challenge. It appears that there exists some degree of reserve
in the cardiovascular system that is called upon to maintain O2 delivery to both the
respiratory and locomotor muscle. Therefore, the O2 cost of breathing in repeated-sprint
cycling is unlikely to have a meaningful negative impact on locomotor O2 transport.
CONCLUSION
An important factor of repeated-sprint performance is the reoxygenation
capacity between sprint bouts (Billaut & Buchheit, 2013; Buchheit et al., 2009; Buchheit
& Ufland, 2011). We further tested this mechanism by increasing the work of breathing,
which is known to negatively influence limb blood flow and O2 delivery at least in
endurance exercise (Aaron, Seow, et al., 1992; Dempsey et al., 2006; Harms et al., 1997;
Sheel et al., 2001). The present data demonstrate that the addition of inspiratory loading
did no impair O2 delivery to the vastus lateralis. When maximal exercise is interspersed
with short rest periods, the cardiovascular system appears to maintain O2 delivery to
both the locomotor and respiratory muscle in a state of heightened metabolic demands.
CHAPTER FIVE: INFLUENCE OF ACUTE
ARTERIAL HYPOXEMIA ON RESPIRATORY
MUSCLE OXYGENATION

Respiratory Muscle Work and Tissue Oxygenation Trends During Repeated-sprint Exercise
∼ 126 ∽
INTRODUCTION
Repeated-sprint ability describes the capacity to recover from and maintain
sprint (≤10 s) performance during subsequent “all-out” efforts (Girard, Bishop, &
Racinais, 2013). Phosphocreatine hydrolysis and anaerobic glycolysis are primary
sources of rapid ATP replenishment in repeated exercise (Gaitanos et al., 1993; Parolin
et al., 1999). However, the time course of metabolic recovery exceeds the rest period
characterised by repeated-sprint exercise (Gaitanos et al., 1993; Harris et al., 1976).
Resulting in a progressive reduction in both peak and mean power output, with a plateau
in the latter sprints (Gaitanos et al., 1993; Racinais et al., 2007). Resynthesis of
phosphocreatine and removal of inorganic phosphate is derived exclusively through
oxidative processes and is sensitive to muscle oxygen (O2) availability (Harris et al., 1976;
Hogan et al., 1999; Sahlin et al., 1979). Therefore, underpinning the ability to maintain
performance over multiple sprints is the capacity to deliver oxygen to the locomotor
muscles between efforts (Billaut & Buchheit, 2013; Buchheit & Ufland, 2011).
The balance of muscle O2 delivery vs. extraction can be elucidated with the use
of near-infrared spectroscopy (NIRS). Concentrations deoxyhaemoglobin ([HHb]) and
oxyhemoglobin ([O2Hb]) rise and fall respectively, proportional to an increase in
metabolic activity in the underlying tissue. However, analysis is often restricted to [HHb]
as it is less sensitive to blood volume changes and provides an estimate of muscular
oxygenation (De Blasi et al., 1993; DeLorey et al., 2003; Grassi et al., 2003). At sprint onset,
there is a rapid increase of vastus lateralis [HHb] (deoxygenation) which trends back
towards baseline during inters sprint rest periods (reoxygenation) (Buchheit et al., 2009;
Racinais et al., 2007; Smith & Billaut, 2010). But there is limited work examining if the O2
cost of hyperpnoea influences repeated-sprint oxygenation trends.

Arterial Hypoxemia and Respiratory Muscle Oxygenation
∼ 127 ∽
During high-intensity exercise, the O2 cost of hyperpnoea and cardiac output
distribution devoted to the respiratory muscle accounts for 10-15% of total pulmonary
O2 uptake (V� O2) (Aaron, Johnson, et al., 1992; Aaron, Seow, et al., 1992; Harms et al.,
1998). To ensure the required O2 demands are met, sympathetically mediated
vasoconstriction of the locomotor muscles promote blood flow redistribution towards
respiratory musculature (respiratory muscle metaboreflex) (Dempsey et al., 2006;
Harms et al., 1997; Sheel et al., 2001; St Croix et al., 2000). This mechanism in part
contributes to the peripheral muscle fatigue that is incurred during high-intensity
exercise, and is exaggerated by fatiguing contractions of the respiratory muscles (Romer,
Lovering, et al., 2006). But the data presented in Chapter 4 do not support this
phenomenon occurring in repeated-sprint exercise, where despite an elevated work of
breathing and respiratory muscle O2 utilisation, vastus lateralis oxygenation was
maintained. The deletions effects of respiratory muscle work may be more apparent in
acute hypoxia. It has been demonstrated that hypoxia leads to elevated pulmonary
ventilation and work of breathing compared to normoxia (Cibella et al., 1996; Reeves,
Welsh, & Wagner, 1994). By alleviating the hypoxia-induced rise in work of breathing, the
rate development of peripheral fatigue can be attenuated (Amann, Pegelow, et al., 2007).
The associated negative consequence of respiratory muscle work are seemingly
amplified in acute hypoxia, likely mediated by a hastening activation of the respiratory
muscle metaboreflex (Amann, Pegelow, et al., 2007; Dempsey et al., 2006).
Negative effects of hypoxia on exercise performance and the development of
peripheral fatigue during repeated sprints is fairly well established (Billaut & Buchheit,
2013; Billaut et al., 2013; Smith & Billaut, 2010, 2012). Arterial hypoxemia specifically
limits reoxygenation capacity between sprint efforts to constrain metabolic recovery

Respiratory Muscle Work and Tissue Oxygenation Trends During Repeated-sprint Exercise
∼ 128 ∽
(Billaut & Buchheit, 2013). However, it is currently unclear what influence acute hypoxia
has on respiratory muscle oxygenation, and balance between locomotor and respiratory
muscle oxygenation. Therefore, the purpose of the present study was to examine the
effect of severe acute arterial hypoxemia on respiratory muscle oxygenation during
repeated-sprint exercise. Hypoxemia was induced via a reduction in the fraction of
inspired O2 (FIO2), and oxygenation of the vastus lateralis and intercostal muscle were
simultaneously measured with NIRS. It was reasoned that both vastus lateralis and
intercostal muscle oxygenation would be impaired during exercise, mediated by arterial
oxygenation and the work of breathing.
METHODS
5.2.1 Subjects
Ten males from a variety of athletic backgrounds were recruited to participate
in this study (team sports, road cycling, heavy resistance training). These subjects were
chosen because they were accustomed to producing “all-out” bouts of exercise. Subjects
self-reported to be healthy and with no known neurological, cardiovascular or
respiratory diseases. After being fully informed of the requirements, benefits, and risks
associated with participation, each subject gave written informed consent. Ethical
approval for the study was obtained from the institutional Human Research Ethics
Committee and the study conformed to the declaration of Helsinki.

Arterial Hypoxemia and Respiratory Muscle Oxygenation
∼ 129 ∽
Table 5.1: Subject characteristics.
Measure Value
Age (year) 26.0 ± 3.6
Body mass (kg) 78.6 ± 9.4
Height (m) 178.3 ± 7.5
V� O2peak (mL·min-1·kg-1) 48.42 ± 6.92
Values are mean ± SD. Abbreviations are: V� O2peak, peak pulmonary oxygen uptake.
5.2.2 Experiment Design
On a preliminary visit, participants were familiarised with an incremental
exercise test used in the following session. In the next session, the incremental exercise
test was performed to exercise tolerance. On the following two sessions, subjects
completed the same repeated-sprint protocol used in the main testing sessions for
familiarisation. The main testing sessions were performed in a randomised order in
normoxia and hypoxia. Trials were conducted at the same time of day and separated by
3-7 days. Subjects were asked to refrain from exercise and strenuous activity for 48 h
preceding all testing sessions. All exercise testing was performed on an electronically-
braked cycle ergometer (Excalibur, Lode, Groningen, The Netherlands) and expired gases
collected on a breath-by-breath basis (COSMED Quark CPET; Cosmed, Rome, Italy).
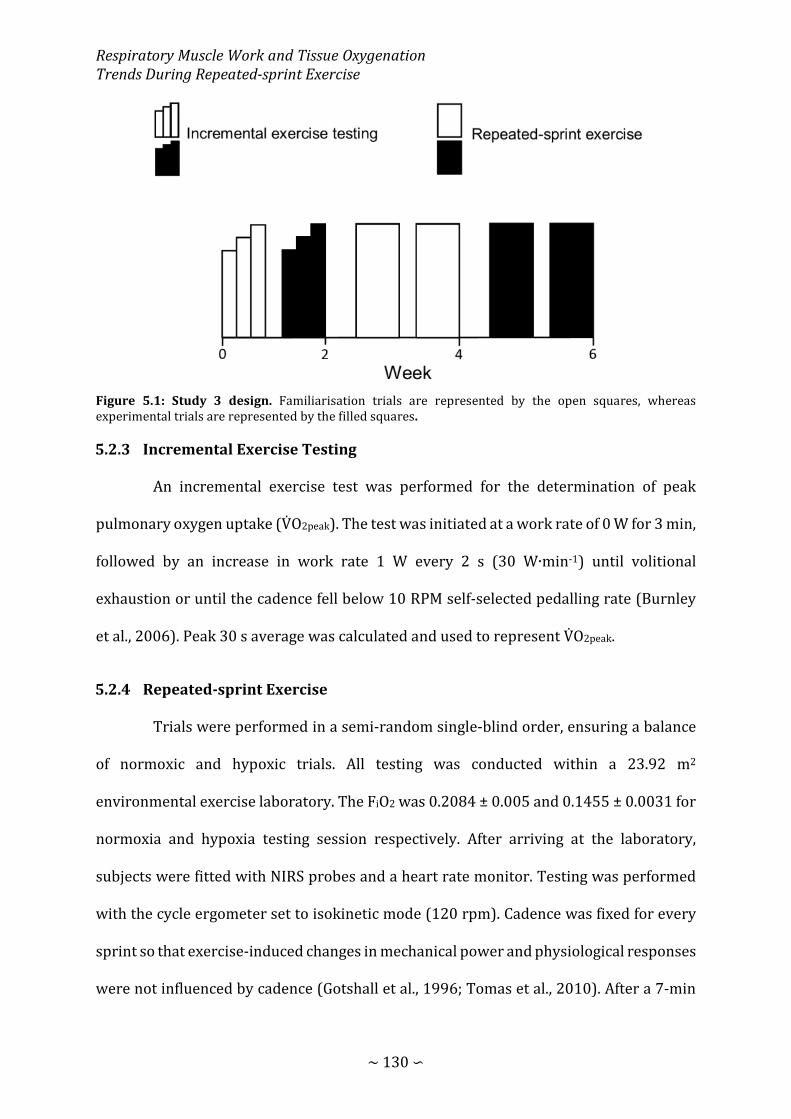
Respiratory Muscle Work and Tissue Oxygenation Trends During Repeated-sprint Exercise
∼ 130 ∽
Figure 5.1: Study 3 design. Familiarisation trials are represented by the open squares, whereas experimental trials are represented by the filled squares.
5.2.3 Incremental Exercise Testing
An incremental exercise test was performed for the determination of peak
pulmonary oxygen uptake (V� O2peak). The test was initiated at a work rate of 0 W for 3 min,
followed by an increase in work rate 1 W every 2 s (30 W∙min-1) until volitional
exhaustion or until the cadence fell below 10 RPM self-selected pedalling rate (Burnley
et al., 2006). Peak 30 s average was calculated and used to represent V� O2peak.
5.2.4 Repeated-sprint Exercise
Trials were performed in a semi-random single-blind order, ensuring a balance
of normoxic and hypoxic trials. All testing was conducted within a 23.92 m2
environmental exercise laboratory. The FiO2 was 0.2084 ± 0.005 and 0.1455 ± 0.0031 for
normoxia and hypoxia testing session respectively. After arriving at the laboratory,
subjects were fitted with NIRS probes and a heart rate monitor. Testing was performed
with the cycle ergometer set to isokinetic mode (120 rpm). Cadence was fixed for every
sprint so that exercise-induced changes in mechanical power and physiological responses
were not influenced by cadence (Gotshall et al., 1996; Tomas et al., 2010). After a 7-min

Arterial Hypoxemia and Respiratory Muscle Oxygenation
∼ 131 ∽
warm-up consisting of 5 min of unloaded cycling at 60-70 rpm and two 4 s sprints
(separated by 1 min), subjects rested for another 2.5 min before the repeat-sprint
protocol was initiated. The repeat-sprint protocol was ten 10 s sprints separated by 30
passive rest (5.5 min). Subjects were instructed to give an “all-out” effort for every sprint
and verbally encouraged throughout to promote a maximal effort. Each sprint was
performed in the seated position and initiated with the crank arm of the dominant leg at
45°. Before sprint one, subjects were instructed to accelerate the flywheel to 95 rpm over
a 15-s period and assumed the ready position 5 s before the commencement of the test.
This ensured that each sprint was initiated with the flywheel rotating at ~90 rpm so that
subjects could quickly reach 120 rpm. To minimise the chance of a protective pacing
strategy, the first 10 s sprint of the repeated-sprint series was examined to ensure that
peak power output exceeded that of the two preceding 4 s sprints. In only one instance
was the peak power produced by a subject below that of the preceding sprints.
Consequently the subject was asked to immediately terminate the sprint activity and
passively rest for 5 min before the repeated-sprint protocol was restarted. The
handlebars and seat were individually adjusted to each subjects’ characteristic. Four
subjects used their own clipless pedals and cycling shoes, the reaming six had their feet
secured using toe cages and retention straps fitted to the ergometer. Crank arm length
was standardized to 175 mm. Visual feedback of power output was not available to the
subjects during any sprint. The cycle ergometer software provides power and cadence at
4 Hz. Data was exported in to excel for the calculation of mechanical work completed and
power production for individual sprints, and over the entire protocol.

Respiratory Muscle Work and Tissue Oxygenation Trends During Repeated-sprint Exercise
∼ 132 ∽
5.2.5 Metabolic and Ventilatory Measurements
Subjects wore a silicone facemask which the breath-by-breath gas sampling line
and turbine were attached. The analyser was calibrated before each test against known
gas concentrations (normoxia: 16% O2 and 5% CO2; hypoxia: 7% O2 and 5% CO2) and the
turbine volume transducer was calibrated using a 3 L syringe (Cosmed, Rome, Italy). Data
was then exported into Excel so that V� O2 could be inspected for errant data points. Editing
data was performed to remove the occasional errant breaths caused by for example
swallowing or coughing which were considered not be reflective the metabolic responses
to exercise. These errant data points were removed by the same researcher in every case
before values greater then 4 standard deviations from the local mean were removed
(Lamarra et al., 1987; Rossiter et al., 2000). A 5-breath rolling average was then applied
for the calculation of peak and nadir for every 40-s sprint/recovery period to give a single
value for each sprint and recovery phase. Respiratory frequency (ƒb) was averaged over
the entire sprint protocol to give one value for each subject per trial. Because the
facemask was removed immediately after the tenth sprint, only maximum values were
calculated over the first 10 s. Mouth pressure (Pm) was recorded continuously at 50 Hz
with a pressure transducer (Honeywell, New Jersey, United States of America) attached
to the saliva port of the non-rebreathing valve via Tygon tubing (Hans Rudolph inc.,
Kansas, United States of America). Mean inspiratory Pm was then calculated as an index
of respiratory muscle work. An index of inspiratory muscle force development was also
calculated for each exercise trial (∫Pm × ƒR) (Witt et al., 2007). For statistical analysis,
inspiratory Pm was converted to positive values and presented in the results as such.
Arterial oxygen saturation (estimated by fingertip pulse oximetry; SPO2) and heart rate
(HR) was sampled on a breath-by-breath basis integrated into the COSMED system.

Arterial Hypoxemia and Respiratory Muscle Oxygenation
∼ 133 ∽
5.2.6 Near-infrared Spectroscopy
Subjects were instrumented with two NIRS probes to assess muscle O2 status
(Oxymon MKIII, Artinis, The Netherlands). The first probe was fixed over the distal part
of the vastus lateralis muscle belly approximately 15 cm above the proximal border of the
patella. The second was fixed over the sixth intercostal space at the anterior axillary line
to assess changes in the accessory respiratory muscles. Probes were held in place with
black plastic spacers secured to the skin using double sided stick disks and shielded from
light using a black self-adhesive elastic bandage. Optode spacing was set to 4.5 cm and
3.5 cm for vastus lateralis and respiratory muscles respectively. Skinfold thickness was
measured between the emitter and detector using a skinfold calliper (Harpenden Ltd.) to
account for skin and adipose tissue thickness covering the muscle. The skinfold thickness
for vastus lateralis (1.19 ± 0.69 cm) and respiratory muscles (1.12 ± 0.44 cm) was less
than half the distance between the emitter and the detector in every case. A differential
pathlength factor of 4.95 was used (Smith & Billaut, 2010; Subudhi et al., 2007). Data was
acquired at 10 Hz. A 10th order zero-lag low-pass Butterworth filter was applied to the
data to remove artefacts and smooth pedalling induced fluctuations; the resulting output
was used for analysis (Rodriguez et al., 2018). The application of the filter was conducted
in the R environment (R Core Team, 2016) using the signal package (Signal developers,
2013). Vastus lateralis deoxyhaemoglobin was normalised to femoral artery occlusion so
that 0% represented a 5-s average immediately prior the occlusion and 100%
represented the maximum 5 s average. Peaks and nadirs were then identified within
every 40-s sprint/recovery period to represent each sprint and recovery phase
respectively (HHbVL). Reoxygenation capacity (∆Reoxy, %) was also calculated as the
change from peak to nadir. Respiratory muscle oxyhaemoglobin (O2HbRM) and
deoxyhaemoglobin (HHbRM) were expressed as an absolute change from baseline. A 2 min

Respiratory Muscle Work and Tissue Oxygenation Trends During Repeated-sprint Exercise
∼ 134 ∽
resting baseline was established before warm-up while seated quietly on the cycle.
Because there were no clear peaks and nadirs in the HHbRM signal, an average was
calculated for of each 40-s sprint/recovery period.
5.2.7 Statistical Analysis
Data in text and figures are presented as mean ± standard deviation. Custom
made spreadsheets were used to analyse the effects of hypoxia on laboratory
measurements (Hopkins, 2006b). To assess the difference between trials, analysis was
performed using the post-only crossover spreadsheet. All measures, other than SPO2, and
NIRS variables were log-transformed before analysis then back-transformed to express
the changes in percent units and standardized effects. Relative changes (%) and effect
size statistics are expressed with 90% confidence limits (90% CL). Practical significance
was assessed by calculating Cohen’s d effect size (ES) (Cohen, 1988). Standardized effect
sizes of <0.2, >0.2 – 0.5, >0.5 – 0.8, <0.8 were considered to as trivial, small, moderate and
large respectively and presented with 90% CL. Probabilities were also calculated to
establish if the chance the true (unknown) differences were lower, similar or higher than
the smallest worthwhile change (ES = 0.2). Effects were not considered meaningful if
there was <75% probability of being substantially positive/negative relative to the
smallest worthwhile change. If the chance of having higher/lower values then the
smallest worthwhile difference was both >5%, the true difference was assessed as
unclear. For clear effects, the likelihood that the true effect was substantial were assessed
qualitatively as follows: likely (75 to <95%), very likely (95 – 99.5%), most likely (>99%)
(Batterham & Hopkins, 2006; Hopkins et al., 2009).

Arterial Hypoxemia and Respiratory Muscle Oxygenation
∼ 135 ∽
RESULTS
Mechanical work recorded during the repeated-sprint tests are displayed in
Figure 5.2. There was no meaningful difference in total work between hypoxia and
normoxia (relative difference = -2.9%, 90% CL ±5%; standardised effect size = -0.21, 90%
CL ±0.37). There was also a trivial difference in peak power during sprint one output
between the conditions (-2.1%, ±5.7; ES = -0.11, ±0.32).
Figure 5.2: Total mechanical work completed during repeated-sprint exercise in Normoxia and Hypoxia. Mean total work per sprint (A) and, individual and mean total work completed over the entire protocol (B). The number of symbols (*); one, two and three denote likely, very likely and most likely respectively, that the chance of the true effect exceeds a small (-0.2-0.2) effect size. Results are mean ± SD.
Physiological responses to exercise are presented in Table 5.2. Each sprint and
recovery V� O2 is displayed in Figure 5.3. Overall, sprint V� O2 in hypoxia was likely lower
than normoxia. But no clear difference was observed during recovery (Table 5.2).

Respiratory Muscle Work and Tissue Oxygenation Trends During Repeated-sprint Exercise
∼ 136 ∽
Table 5.2: Physiological responses to repeated-sprint exercise in Normoxia and Hypoxia.
Abbreviations are: Pm, mouth pressure; ∫Pm × ƒb, inspiratory muscle force development; V� O2, pulmonary oxygen uptake; IV, inspiratory volume; ƒb, respiratory frequency; PETO2, end-tidal oxygen; PETCO2, end-tidal carbon dioxide; SpO2, arterial oxygen saturation; HR, heart rate. The number of symbols (*); one, two and three denote likely, very likely, and most likely respectively, that the chance of the true effect exceeds a small (-0.2-0.2) effect size.
Normoxia (mean ± SD)
Hypoxia (mean ± SD)
Relative difference
(% [90% CI])
Effect size (Cohen’s d [90% CI])
SPO2 (%) 96 ± 2 87 ± 3 -9.7 [11.4, -8.1 -5.70 [-6.67, 4,73]***
HR (bpm) n = 9 151 ± 12 156 ± 11 2.0 [-0.1, 4.2] 0.22 [-0.01, 0.46]
Sprint V� O2 (mL·min-1·kg-1) 44.99 ± 5.49 42.65 ± 5.61 -5.3 [-8.4, -2.2] -0.40 [-0.64, -0.16]*
Recovery V� O2 (mL·min-1·kg-1) 37.02 ± 6.19 35.28 ± 6.10 -4.7 [-8.7, -0.6] -0.27 [-0.50, -0.03]
PETO2 (mmHg) 118 ± 3 75 ± 3 -36.5 [-37.6, -35.5] -17.59 [-18.21, -16.96]
***
PETCO2 (mmHg) 34 ± 3 31 ± 3 -7.4 [-9.9, -4.8] -0.89 [-1.21, -0.57] ***
IV (L) 2.72 ± 0.50 2.70 ± 0.51 -0.6 [-4.0, 2.9] -0.03 [-0.20, 0.14
ƒb
(b·min-1) 52.01 ± 15.32 51.40 ± 10.91 0.1 [-5.8, 6.4] 0.00 [-0.21, 0.22]
Inspiratory Pm (cmH2O) 2.10 ± 0.33 2.20 ± 0.45 3.9 [-3.6, 12.0] 0.22 [-0.21, 0.66]
∫Pm × ƒb 68.17 ± 13.85 70.48 ± 12.76 3.7 [-4.2, 12.3] 0.17 [-0.20, 0.53]
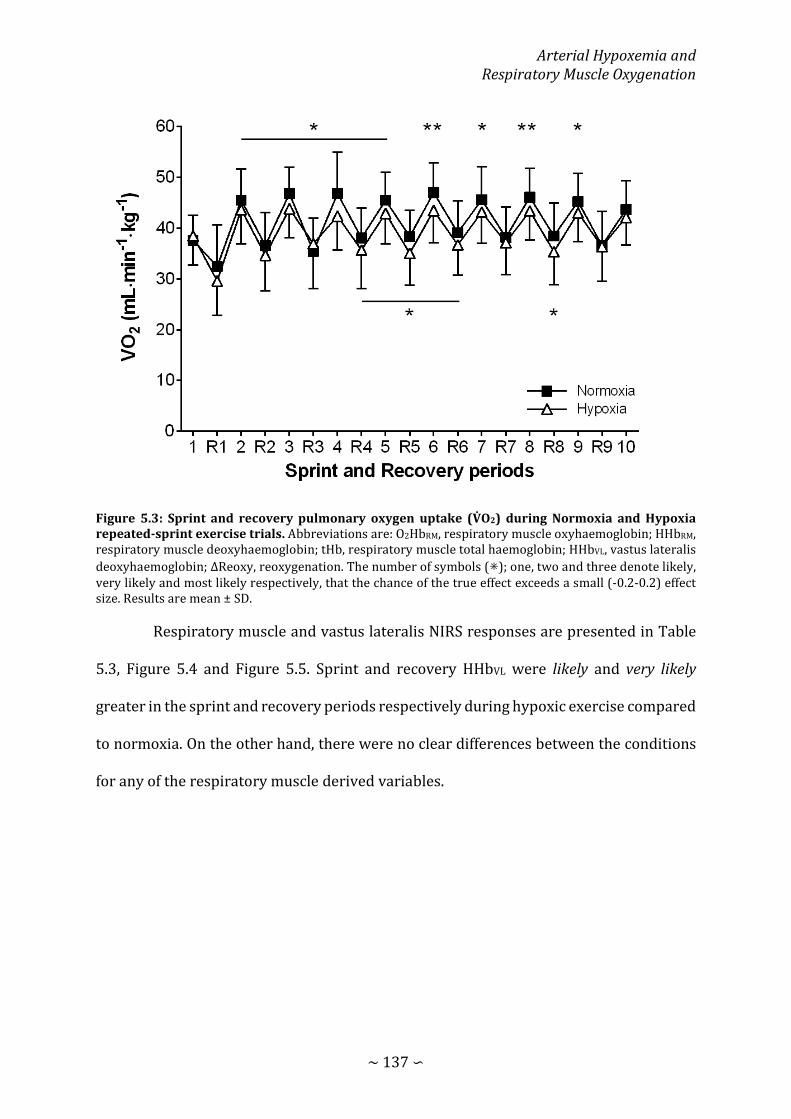
Arterial Hypoxemia and Respiratory Muscle Oxygenation
∼ 137 ∽
Figure 5.3: Sprint and recovery pulmonary oxygen uptake (V� O2) during Normoxia and Hypoxia repeated-sprint exercise trials. Abbreviations are: O2HbRM, respiratory muscle oxyhaemoglobin; HHbRM, respiratory muscle deoxyhaemoglobin; tHb, respiratory muscle total haemoglobin; HHbVL, vastus lateralis deoxyhaemoglobin; ΔReoxy, reoxygenation. The number of symbols (⁕); one, two and three denote likely, very likely and most likely respectively, that the chance of the true effect exceeds a small (-0.2-0.2) effect size. Results are mean ± SD.
Respiratory muscle and vastus lateralis NIRS responses are presented in Table
5.3, Figure 5.4 and Figure 5.5. Sprint and recovery HHbVL were likely and very likely
greater in the sprint and recovery periods respectively during hypoxic exercise compared
to normoxia. On the other hand, there were no clear differences between the conditions
for any of the respiratory muscle derived variables.
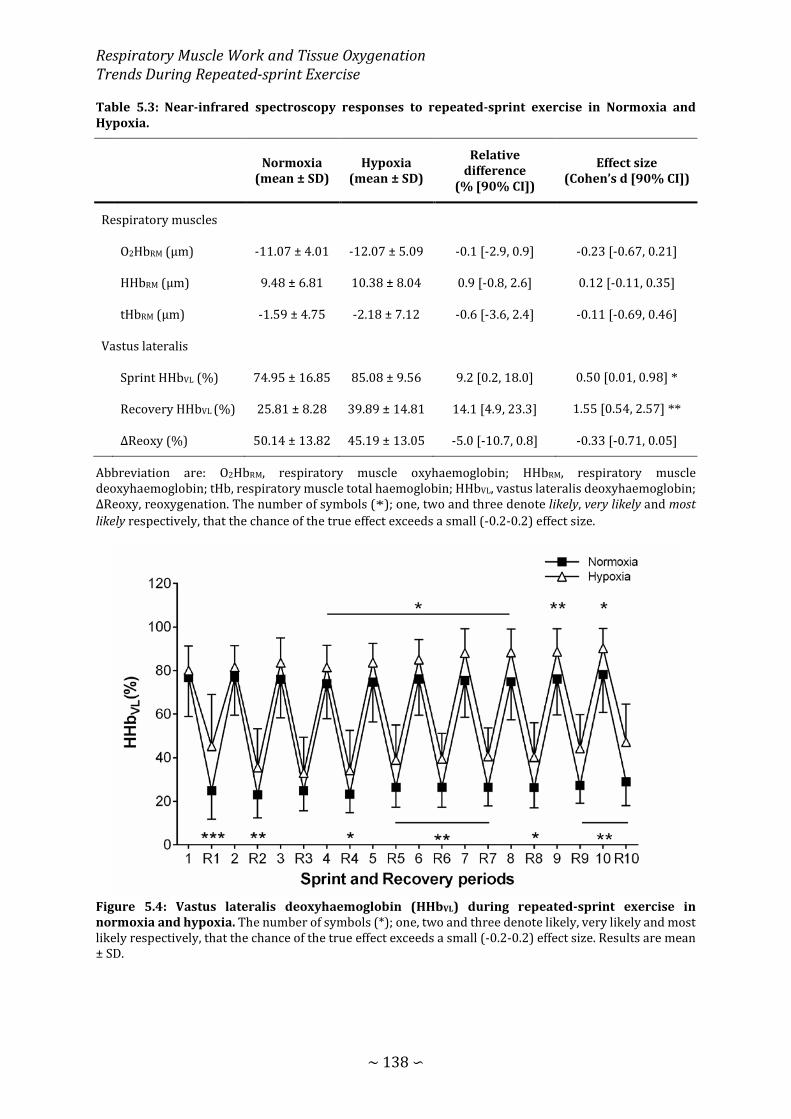
Respiratory Muscle Work and Tissue Oxygenation Trends During Repeated-sprint Exercise
∼ 138 ∽
Table 5.3: Near-infrared spectroscopy responses to repeated-sprint exercise in Normoxia and Hypoxia.
Normoxia (mean ± SD)
Hypoxia (mean ± SD)
Relative difference
(% [90% CI])
Effect size (Cohen’s d [90% CI])
Respiratory muscles
O2HbRM (μm) -11.07 ± 4.01 -12.07 ± 5.09 -0.1 [-2.9, 0.9] -0.23 [-0.67, 0.21]
HHbRM (μm) 9.48 ± 6.81 10.38 ± 8.04 0.9 [-0.8, 2.6] 0.12 [-0.11, 0.35]
tHbRM (μm) -1.59 ± 4.75 -2.18 ± 7.12 -0.6 [-3.6, 2.4] -0.11 [-0.69, 0.46]
Vastus lateralis
Sprint HHbVL (%) 74.95 ± 16.85 85.08 ± 9.56 9.2 [0.2, 18.0] 0.50 [0.01, 0.98] *
Recovery HHbVL (%) 25.81 ± 8.28 39.89 ± 14.81 14.1 [4.9, 23.3] 1.55 [0.54, 2.57] **
ΔReoxy (%) 50.14 ± 13.82 45.19 ± 13.05 -5.0 [-10.7, 0.8] -0.33 [-0.71, 0.05]
Abbreviation are: O2HbRM, respiratory muscle oxyhaemoglobin; HHbRM, respiratory muscle deoxyhaemoglobin; tHb, respiratory muscle total haemoglobin; HHbVL, vastus lateralis deoxyhaemoglobin; ΔReoxy, reoxygenation. The number of symbols (*); one, two and three denote likely, very likely and most likely respectively, that the chance of the true effect exceeds a small (-0.2-0.2) effect size.
Figure 5.4: Vastus lateralis deoxyhaemoglobin (HHbVL) during repeated-sprint exercise in normoxia and hypoxia. The number of symbols (*); one, two and three denote likely, very likely and most likely respectively, that the chance of the true effect exceeds a small (-0.2-0.2) effect size. Results are mean ± SD.

Arterial Hypoxemia and Respiratory Muscle Oxygenation
∼ 139 ∽
Figure 5.5: Respiratory muscle oxygenation trends during repeated-sprint exercise in Normoxia and Hypoxia expressed as an absolute change from baseline (dotted horizontal line). (A) Respiratory muscle oxyhaemoglobin (O2HbRM); (B) respiratory muscle deoxyhaemoglobin (HHbRM); (C) respiratory muscle total haemoglobin (tHbRM). There was no clear effect of Hypoxia on respiratory muscle oxygenation. Results are mean ± SD.
Respiratory Muscle Work and Tissue Oxygenation Trends During Repeated-sprint Exercise
∼ 140 ∽
DISCUSSION
The present study is the first to report on the influence of a reduction in FiO2 on
respiratory muscle oxygenation trends during repeated sprint exercise. Despite
substantial arterial hypoxemia, respiratory muscle oxygenation was maintained to a
similar level to that of normoxic exercise. This was in contrast to the impairment of vastus
lateralis oxygenation that was demonstrated here, and in previous research (Billaut &
Buchheit, 2013).
Acute hypoxia typically has no discernible effects on isolated sprint performance
(Girard, Brocherie, & Millet, 2017). However, as sprints are repeated, the effects of
reduced O2 availability typically become more apparent (Billaut & Buchheit, 2013; Billaut
et al., 2013; Smith & Billaut, 2012). Surprisingly, arterial hypoxemia did not negatively
affect total mechanical work to the same extent as previous research. A non-meaningful -
2.9% reduction in total work performed was observed, which was considerably less than
previous research using a similar protocol (Billaut & Buchheit, 2013; Smith & Billaut,
2010, 2012). It is probable that there was an element of pacing from two subjects, despite
receiving strong verbal encouragement throughout the sprint exercise. More typical
responses were demonstrated in the other eight subjects. There is the chance that the
pacing strategy adopted may have impacted the results. However, this is unlikely because
of the more typical responses demonstrated in the other measures.
Consistent with others, sprint HHbVL was higher during the hypoxic trials
compared to normoxia (Billaut & Buchheit, 2013). Similarly, recovery HHbVL was
negatively affected by hypoxia. It is plausible that the metabolic demands of exercise were
similar between conditions. The additive effect of arterial hypoxemia to skeletal muscle
O2 extraction, is the likely source of the elevated HHbVL during exercise (Costes et al.,
Arterial Hypoxemia and Respiratory Muscle Oxygenation
∼ 141 ∽
1996). Whereas recovery HHbVL (and to a lesser extent ΔReoxy) is solely linked to limited
muscle O2 delivery between sprint efforts (Billaut & Buchheit, 2013). Changes in muscle
oxygenation trends in these ways is representative of a mismatch between O2 supply and
extraction. Importantly, vastus lateralis O2 availability during recovery is a strong
determining factor of metabolic recovery, and therefore performance decline in
repeated-sprint exercise (Gaitanos et al., 1993; Harris et al., 1976; Parolin et al., 1999).
Impairment of O2 transport was also represented by the ~5% reduction in V� O2 during
hypoxic exercise that was shown here (Figure 5.3), and similarly by others (Bowtell et al.,
2014). It is fairly well established that hypoxia results in a linear decrease in V� O2peak
(Martin & O'Kroy, 1993; Wehrlin & Hallén, 2006). Therefore, the lower V� O2 represented
a similar, or even greater fraction of the maximal O2 utilisation relative to blunted V� O2peak
(Mazzeo, 2008). Therefore, in order to meet the metabolic demands of the sprint
intervals, non-oxidative ATP resynthesis, specifically PCr hydrolysis, must increase to
compensate (Hogan et al., 1999). Contrary to the clear changes in vastus lateralis
oxygenation, respiratory muscle oxygenation appears to be unaffected by hypoxia.
Despite clear differences in arterial O2 saturation (87% vs. 96%), respiratory
muscle oxygenation responses were similar between the hypoxic and normoxic exercise
trials. This distinct lack of difference suggests that hypoxia no further compromises O2
delivery to the respiratory muscles. However, this contrasts with others who have shown
progressive deoxygenation of the respiratory muscles in response to hypoxia. During
voluntary isocapnic hyperpnoea and inspiring a hypoxic gas mixture (FIO2 = 0.10-0.11),
deoxygenation of the strernocleildmastroid and intercostal muscles is exaggerated
compared to normoxia (Katayama et al., 2015). Our contradictory results could be
explained by the stark difference in hypoxic gas mixtures used (FiO2 = 0.10 vs. 0.15), and

Respiratory Muscle Work and Tissue Oxygenation Trends During Repeated-sprint Exercise
∼ 142 ∽
resulting SPO2. In the present study, SPO2 averaged 87%, compared to the 82% exhibited
in the previous research (Katayama et al., 2015). There is some evidence in resting rats
that respiratory muscle blood flow increases to compensate for arterial hypoxemia,
serving to protect O2 supply (Kuwahira, Gonzalez, Heisler, & Piiper, 1993). If arterial
hypoxemia was greater, there is the possibility for exaggerated respiratory muscle
deoxygenation. However, the degree of arterial hypoxemia induced in the present study
does not appear to exaggerate respiratory muscle respiratory deoxygenation compared
to similar exercise in normoxia.
Hypoxia is a known potent stimulant of hyperpnoea, which consequently
elevates the work of breathing (Cibella et al., 1996; Reeves et al., 1994). As shown in the
previous chapter (Chapter 4) and by others (Turner et al., 2013), an elevated work of
breathing amplifies respiratory muscle deoxygenation. Since there were no meaningful
differences in either ventilation patterns (ƒb and IV), or inspiratory pressure generation
(Pm and ∫Pm × ƒb) in the present study, O2 cost of hyperpnoea was likely similar between
conditions (Aaron, Johnson, et al., 1992; Dominelli, Render, Molgat-Seon, Foster, & Sheel,
2014). The results provide evidence that neither the work of breathing, nor the O2 cost of
exercise hyperpnoea were significantly influenced by the FIO2 used in this study.
Intercostal NIRS responses look to only respond proportionally to the metabolic activity
of hyperpnoea, and free from influence of hypoxemia (Costes et al., 1996; Ferrari et al.,
2004; Katayama et al., 2015).
The evidence that the intercostal muscle oxygenation was not influenced by
hypoxia, but vastus lateralis oxygenation trends were, has important implications for the
ability to perform repeated-sprints. It is unlikely that cardiac output increased to meet
the demands of the additional muscle work because 1) HR was similar between the

Arterial Hypoxemia and Respiratory Muscle Oxygenation
∼ 143 ∽
conditions. 2) stroke volume does not increase with work rates above 40-60% of V� O2peak
(Higginbotham et al., 1986), and subjects in present research were exercising at 70-90%
of V� O2peak. It appears that O2 delivery was preferentially distributed to the intercostal
muscles to constrain an excessive decrease in respiratory muscle oxygenation. The work
of breathing is estimated to account for 10-15% of total O2 uptake during high-intensity
exercise (Aaron, Johnson, et al., 1992; Aaron, Seow, et al., 1992; Harms et al., 1998). In
order to maintain O2 supply to these essential muscles, blood flow is directed away from
the locomotor muscles by the sympathetic nervous system (Dempsey et al., 2006; Harms
et al., 1997; Sheel et al., 2001; St Croix et al., 2000). For these reasons, the O2 cost of
exercise hyperpnoea during repeated-sprint exercise could be a contributor of impaired
vastus lateralis oxygenation in hypoxia. Vastus lateralis oxygenation is implicated as an
important mediating factor for the metabolic recovery between sprint efforts (Harris et
al., 1976; Hogan et al., 1999; Sahlin et al., 1979), and therefore performance (Billaut &
Buchheit, 2013; Buchheit et al., 2009). Reducing the O2 cost of hyperpnoea is a potential
pathway of enhancing blood flow and O2 availability for the locomotor muscle in hypoxic
environments. There is evidence that inspiratory muscle training attenuates the O2 cost
of voluntary hyperpnoea (Turner et al., 2012), and improves the self-selected recovery
time between repeated-sprints (Romer et al., 2002b). However, in Chapter 4 it was
demonstrated that increasing respiratory muscle O2 utilisation with inspiratory loading
has no discernible effects of vastus lateralis oxygenation. Competition for available O2 is
potentially minimised by the brief periods of passive rest between sprints. As theorised
by Dempsey et al. (2006), locomotor muscle fatigue is exacerbated when a high work of
breathing is accompanied by sustained high-intensity exercise. But more work is still
needed exploring the role of hypoxia in locomotor and respiratory muscle oxygenation
trends.

Respiratory Muscle Work and Tissue Oxygenation Trends During Repeated-sprint Exercise
∼ 144 ∽
CONCLUSION
As demonstrated in the past, vastus lateralis deoxygenation during repeated-
sprint exercise is exaggerated by hypoxia. On the other hand, with a similar level of
inspiratory pressure development, hypoxia did not affect intercostal muscle oxygenation.
Blood flow appears to be preferentially distributed to the respiratory muscles in order to
maintain O2 delivery proportional to metabolic activity.
CHAPTER SIX: EFFECTS OF INSPIRATORY
MUSCLE TRAINING ON LOCOMOTOR AND
RESPIRATORY MUSCLE OXYGENATION
TRENDS
Respiratory Muscle Work and Tissue Oxygenation Trends During Repeated-sprint Exercise
∼ 146 ∽
INTRODUCTION
The energy requirement and oxygen (O2) cost of breathing increase relative to
pulmonary ventilation (V� E) (Aaron, Johnson, et al., 1992). During moderate intensity-
exercise, the oxygen cost of breathing is 3-6%, and increases to 10-15% of pulmonary
oxygen uptake (V� O2) during maximal exercise (Aaron, Seow, et al., 1992; Harms et al.,
1998). However, competition between locomotor and respiratory musculature for
available blood and O2 delivery flow can develop (Dempsey et al., 2006; Harms et al.,
1997; Vogiatzis et al., 2009). The work of breathing incurred during high-intensity
exercise causes locomotor vasoconstriction and a reduction in O2 perfusion. (Harms et
al., 1997; Mortensen, Damsgaard, Dawson, Secher, & Gonzalez-Alonso, 2008; Vogiatzis et
al., 2009). This effect is mediated by an accumulation of metabolites in the respiratory
muscles stimulating group IV afferent discharge (J. M. Hill, 2000), leading to
sympathetically mediated efferent discharge in the locomotor muscles (Harms et al.,
1997; St Croix et al., 2000). When both exercise hyperpnoea and locomotor work are high,
the respiratory and locomotor muscle can compete for a limited cardiac output to
maintain adequate O2 supply for metabolic activity.
Whole body exercise in acute hypoxia hastens the development of peripheral
fatigue compared to exercise in normoxia (Amann, Romer, et al., 2006; Billaut et al.,
2013). Hypoxemia also stimulates V� E, increasing the respiratory muscle load and
accelerates the development of locomotor and respiratory muscle fatigue (Amann,
Pegelow, et al., 2007; Babcock, Johnson, et al., 1995; Verges et al., 2010). Even when the
ventilatory demands are matched between normoxia and hypoxia by exercising at a
lower work rate, diaphragm fatigue is greater in hypoxia (Gudjonsdottir et al., 2001;
Vogiatzis et al., 2007b). The accelerated rate of fatigue development is brought on by a
Inspiratory Muscle Training and Muscle Oxygenation Trends
∼ 147 ∽
persistent respiratory muscle deoxygenation beyond that experienced in normoxia
(Katayama et al., 2015). Moreover, the work of breathing incurred in hypoxia also has an
influence on the development of peripheral fatigue. When the respiratory muscles are
unloaded in hypoxia by ~70% with proportional assist ventilation, locomotor muscle
fatigue can be attenuated by up to 40% compared to normoxia (Amann, Pegelow, et al.,
2007). Therefore, specific training targeting the respiratory muscle is a potential pathway
to overcome detrimental effects of hypoxemia.
Inspiratory muscle training (IMT) is associated with enhanced exercise
performance during the Yo-Yo intermittent recovery test (Lomax, Grant, & Corbett, 2011;
Nicks, Morgan, Fuller, & Caputo, 2009), time trials (Romer et al., 2002c; Salazar-Martínez
et al., 2017; Volianitis et al., 2001), constant load cycling (Bailey et al., 2010;
Mickleborough et al., 2010), and repeated-sprint exercise (Romer et al., 2002b). By
improving the strength of the respiratory muscle, the relative intensity of breathing at
any given V� E decreases. Consequently, reducing the intensity of hyperpnoea would
attenuate the accumulation of metabolites to blunt the respiratory muscle metaboreflex
(McConnell & Lomax, 2006; Witt et al., 2007), reduce the O2 cost of hyperpnoea (Turner
et al., 2012), and lessen respiratory muscle fatigue in both normoxia and hypoxia
(Downey et al., 2007). For these reasons, IMT is a possible method of alleviating the
detrimental of an elevated work of breathing. But the application of IMT in repeated-
sprint exercise is limited (Romer et al., 2002b).
Underpinning the ability to maintain performance during repeated-sprint
exercise, is the capacity to deliver O2 to the locomotor muscles in the short rest periods
between sprints (Billaut & Buchheit, 2013; Buchheit & Ufland, 2011). When repeated
sprints are performed in hypoxia, this capacity is severely impacted (Billaut & Buchheit,
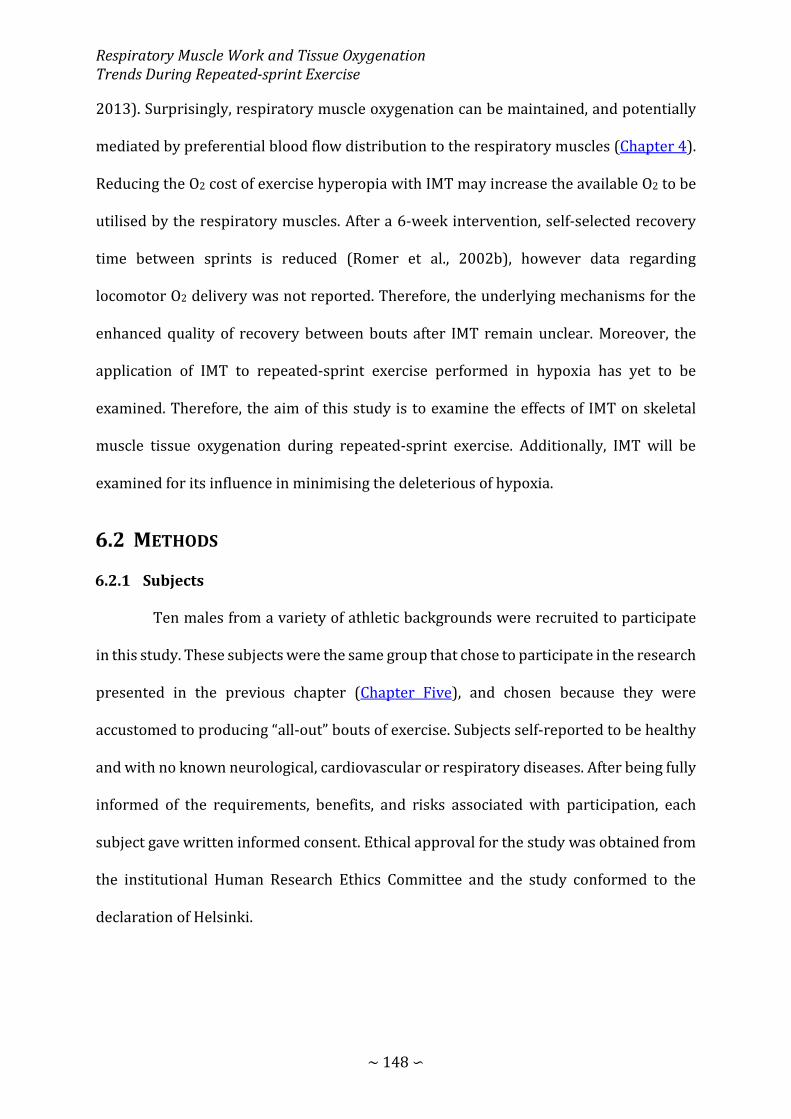
Respiratory Muscle Work and Tissue Oxygenation Trends During Repeated-sprint Exercise
∼ 148 ∽
2013). Surprisingly, respiratory muscle oxygenation can be maintained, and potentially
mediated by preferential blood flow distribution to the respiratory muscles (Chapter 4).
Reducing the O2 cost of exercise hyperopia with IMT may increase the available O2 to be
utilised by the respiratory muscles. After a 6-week intervention, self-selected recovery
time between sprints is reduced (Romer et al., 2002b), however data regarding
locomotor O2 delivery was not reported. Therefore, the underlying mechanisms for the
enhanced quality of recovery between bouts after IMT remain unclear. Moreover, the
application of IMT to repeated-sprint exercise performed in hypoxia has yet to be
examined. Therefore, the aim of this study is to examine the effects of IMT on skeletal
muscle tissue oxygenation during repeated-sprint exercise. Additionally, IMT will be
examined for its influence in minimising the deleterious of hypoxia.
METHODS
6.2.1 Subjects
Ten males from a variety of athletic backgrounds were recruited to participate
in this study. These subjects were the same group that chose to participate in the research
presented in the previous chapter (Chapter Five), and chosen because they were
accustomed to producing “all-out” bouts of exercise. Subjects self-reported to be healthy
and with no known neurological, cardiovascular or respiratory diseases. After being fully
informed of the requirements, benefits, and risks associated with participation, each
subject gave written informed consent. Ethical approval for the study was obtained from
the institutional Human Research Ethics Committee and the study conformed to the
declaration of Helsinki.
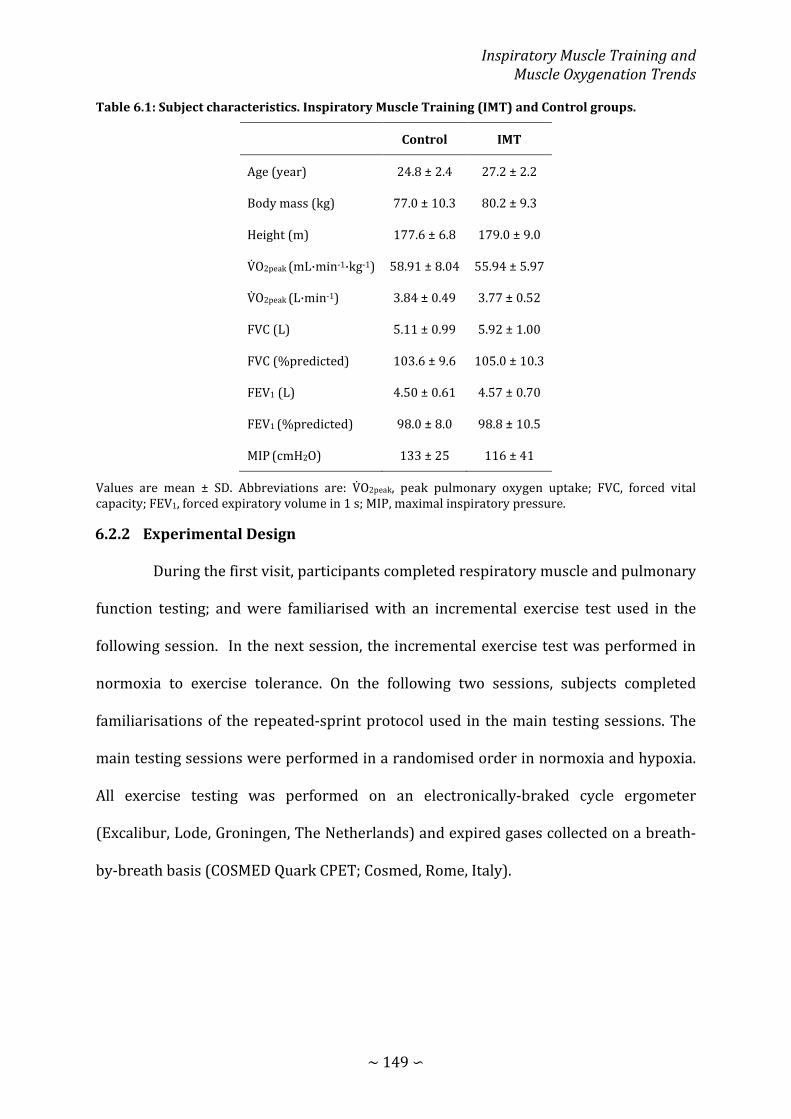
Inspiratory Muscle Training and Muscle Oxygenation Trends
∼ 149 ∽
Table 6.1: Subject characteristics. Inspiratory Muscle Training (IMT) and Control groups.
Control IMT
Age (year) 24.8 ± 2.4 27.2 ± 2.2
Body mass (kg) 77.0 ± 10.3 80.2 ± 9.3
Height (m) 177.6 ± 6.8 179.0 ± 9.0
V� O2peak (mL·min-1·kg-1) 58.91 ± 8.04 55.94 ± 5.97
V� O2peak (L·min-1) 3.84 ± 0.49 3.77 ± 0.52
FVC (L) 5.11 ± 0.99 5.92 ± 1.00
FVC (%predicted) 103.6 ± 9.6 105.0 ± 10.3
FEV1 (L) 4.50 ± 0.61 4.57 ± 0.70
FEV1 (%predicted) 98.0 ± 8.0 98.8 ± 10.5
MIP (cmH2O) 133 ± 25 116 ± 41
Values are mean ± SD. Abbreviations are: V� O2peak, peak pulmonary oxygen uptake; FVC, forced vital capacity; FEV1, forced expiratory volume in 1 s; MIP, maximal inspiratory pressure.
6.2.2 Experimental Design
During the first visit, participants completed respiratory muscle and pulmonary
function testing; and were familiarised with an incremental exercise test used in the
following session. In the next session, the incremental exercise test was performed in
normoxia to exercise tolerance. On the following two sessions, subjects completed
familiarisations of the repeated-sprint protocol used in the main testing sessions. The
main testing sessions were performed in a randomised order in normoxia and hypoxia.
All exercise testing was performed on an electronically-braked cycle ergometer
(Excalibur, Lode, Groningen, The Netherlands) and expired gases collected on a breath-
by-breath basis (COSMED Quark CPET; Cosmed, Rome, Italy).

Respiratory Muscle Work and Tissue Oxygenation Trends During Repeated-sprint Exercise
∼ 150 ∽
Figure 6.1: Study 4 design. Familiarisation trials are represented by the open squares, whereas experimental trials are represented by the filled squares.
6.2.3 Incremental Exercise Testing
An incremental exercise test was performed in normoxia for the determination
of peak pulmonary oxygen uptake (V� O2peak). The test was initiated at a work rate of 0 W
for 3 min, followed by an increase in work rate 1 W every 2 s (30 W∙min-1) until volitional
exhaustion or until the cadence fell below 10 RPM self-selected pedalling rate (Burnley
et al., 2006). Peak 30 s average was calculated and used to represent V� O2peak.
6.2.4 Repeated-sprint Exercise
Trials were performed in a single-blind semi-random order, ensuring a balance
of normoxic and hypoxic trials pre- and post-testing. All testing was conducted within a
23.92 m2 environmental exercise laboratory, and environmental hypoxia was achieved
via nitrogen dilution. Fraction of inspired O2 for pre-testing was 0.2084 ± 0.005 and
0.1455 ± 0.0031 for normoxia and hypoxia respectively. Post-testing, the fraction of
inspired O2 was 0.2071 ± 0.0022 and 0.1443 ± 0.0036, for normoxia and hypoxia
respectively.
After arriving at the laboratory, subjects were fitted with NIRS probes and a
heart rate monitor. Testing was performed with the cycle ergometer set to isokinetic

Inspiratory Muscle Training and Muscle Oxygenation Trends
∼ 151 ∽
mode (120 RPM). Cadence was fixed for every sprint so that exercise-induced changes in
mechanical power and physiological responses were not influenced by cadence (Gotshall
et al., 1996; Tomas et al., 2010). After a 7-min warm-up consisting of 5 min of unloaded
cycling at 60-70 RPM and two 4 s sprints (separated by 1 min), subjects rested for another
2.5 min before the RS protocol was initiated. The RS protocol was ten 10 s sprints
separated by 30 passive rest (5.5 min). Subjects were instructed to give an “all-out” effort
for every sprint and verbally encouraged throughout to promote a maximal effort. Each
sprint was performed in the seated position and initiated with the crank arm of the
dominant leg at 45°. Before sprint one, subjects were instructed to accelerate the flywheel
to 95 rpm over a 15-s period and assume the ready position 5 s before the
commencement of the test. This ensured that each sprint was initiated with the flywheel
rotating at ~90 rpm so that subjects could quickly reach 120 rpm. To minimise the chance
of a protective pacing strategy, the first 10 s sprint of the repeated-sprint series was
examined to ensure that peak power output exceeded that of the two preceding 4 s
sprints. In only one instance during pre-testing was the peak power produced by a subject
below that of the preceding sprints. Consequently the subject was asked to immediately
terminate the sprint activity and passively rest for 5 min before the repeated-sprint
protocol was restarted. The handlebars and seat were individually adjusted to each
subjects’ characteristic and feet secured using toe cages and retention straps fitted to the
ergometer. Crank arm length was standardized to 175 mm. Visual feedback of power
output was not available to the subjects during any sprint. The cycle ergometer software
provides power and cadence data at 4 Hz. Data was exported into excel for the calculation
of mechanical work completed and power production for individual sprints, and over the
entire protocol. Inspiratory loading was achieved by placing a plastic disk with a 10-mm
opening over the inspiratory side of a two-way non-rebreathing valve (Hans Rudolph inc.,

Respiratory Muscle Work and Tissue Oxygenation Trends During Repeated-sprint Exercise
∼ 152 ∽
Kansas, United States of America) attached to the distal end of the breath-by-breath gas
sampling line and turbine. The inspiratory load was applied after warmup, 1 min before
the commencement of the RS protocol.
6.2.5 Metabolic and Ventilatory Measurements
Subjects wore a silicone facemask which the breath-by-breath gas sampling line
and turbine were attached. The analyser was calibrated before each test against known
gas concentrations (normoxia: 16% O2 and 5% CO2; hypoxia: 7% O2 and 5% CO2) and the
turbine volume transducer was calibrated using a 3 L syringe (Cosmed, Rome, Italy). Data
was then exported into Excel so that V� O2 could be inspected for errant data points. Editing
data was performed to remove the occasional errant breaths caused by for example
swallowing or coughing which were considered not be reflective the metabolic responses
to exercise. These errant data points were removed by the same researcher in every case
before values greater than 4 standard deviations from the local mean were removed
(Lamarra et al., 1987; Rossiter et al., 2000). A 5-breath rolling average was then applied
for the calculation of peak and nadir for every 40-s sprint/recovery period to give a single
value for each sprint and recovery phase. Breathing frequency (ƒb) was averaged over the
entire sprint protocol to give one value for each subject per trial. Because the facemask
was removed immediately after the tenth sprint, only maximum values were calculated
over the first 10 s. Mouth pressure (Pm) was recorded continuously at 50 Hz with a
pressure transducer (Honeywell, New Jersey, United States of America) attached to the
saliva port of the non-rebreathing valve via Tygon tubing. Representative data from one
subject of the effects of inspiratory muscle loading on Pm is displayed in Figure 1. Mean
inspiratory and expiratory Pm were then calculated as an index of respiratory muscle
work as well as mean peak inspiratory Pm. An index of inspiratory muscle force

Inspiratory Muscle Training and Muscle Oxygenation Trends
∼ 153 ∽
development was also calculated for each exercise trial (∫Pm × ƒb) (Witt et al., 2007). For
statistical analysis, inspiratory Pm was converted to positive values and presented in the
results as such. Arterial oxygen saturation (estimated by fingertip pulse oximetry; SPO2)
and heart rate (HR) was sampled on a breath-by-breath basis integrated into the COSMED
system.
6.2.6 Near-infrared Spectroscopy
Subjects were instrumented with two NIRS probes to assess muscle O2 status
(Oxymon MKIII, Artinis, The Netherland). The first probe was fixed over the distal part of
the vastus lateralis muscle belly approximately 15 cm above the proximal border of the
patella. The second was fixed over the sixth intercostal space at the anterior axillary line
to assess changes in the accessory respiratory muscles. Probes were held in place with
black plastic spacers secured to the skin using double sided stick disks and shielded from
light using a black self-adhesive elastic bandage. Optode spacing was set to 4.5 cm and
3.5 cm for vastus lateralis and respiratory muscles respectively. Skinfold thickness was
measured between the emitter and detector using a skinfold calliper (Harpenden Ltd.) to
account for skin and adipose tissue thickness covering the muscle. The skinfold thickness
for vastus lateralis (1.19 ± 0.69 cm) and respiratory muscles (1.12 ± 0.44 cm) was less
than half the distance between the emitter and the detector in every case. A differential
pathlength factor of 4.95 was used (Smith & Billaut, 2010; Subudhi et al., 2007). Data was
acquired at 10 Hz. A 10th order zero-lag low-pass Butterworth filter was applied to the
data to remove artefacts and smooth pedalling induced fluctuations; the resulting output
was used for analysis (Rodriguez et al., 2018). The application of the filter was conducted
in the R environment (R Core Team, 2016) using the signal package (Signal developers,
2013). Vastus lateralis deoxyhaemoglobin was normalised to femoral artery occlusion so

Respiratory Muscle Work and Tissue Oxygenation Trends During Repeated-sprint Exercise
∼ 154 ∽
that 0% represented a 5-s average immediately prior the occlusion and 100%
represented the maximum 5 s average. Peaks and nadirs were then identified within
every 40-s sprint/recovery period to represent each sprint and recovery phase
respectively (HHbVL). Reoxygenation capacity (∆Reoxy, %) was also calculated as the
change from peak to nadir. Respiratory muscle oxyhaemoglobin (O2HbRM) and
deoxyhaemoglobin (HHbRM) were expressed as an absolute change from baseline.
Baseline was established before warm-up while seated quietly on the cycle. Because there
were no clear peaks and nadirs in the HHbRM signal, an average was calculated for of each
40-s sprint/recovery period.
6.2.7 Inspiratory Muscle Training
Following pre-intervention testing, subjects were randomly assigned to either
Inspiratory Muscle Training (IMT) or Control to complete 4 weeks of training using
POWERbreathe® (light resistance) pressure threshold device (POWERbreathe®, HaB
International Ltd, UK). Subjects were naïve that a Control group existed, but were
informed that the study was investigating the effects of strength (IMT) vs. endurance
(Control) respiratory muscle training. The IMT group completed 30 inspiratory efforts
twice per day (AM and PM) 7 days per week at a pressure threshold corresponding with
50% MIP (Romer et al., 2002b; Volianitis et al., 2001). Once participants could complete
30 breaths comfortably, they were instructed to increase the pressure threshold. The
Control group completed 60 breaths once per day (AM or PM) 7 days per week at a
pressure threshold corresponding with 15% MIP and remained at this level for the
entirety of the intervention period (Romer et al., 2002b; Volianitis et al., 2001). All
subjects were instructed to initiate each breath from residual volume until reaching their
total lung capacity, and to perform the manoeuvre in a slow controlled manner to prevent

Inspiratory Muscle Training and Muscle Oxygenation Trends
∼ 155 ∽
hypocapnia. On a weekly basis, subjects visited the laboratory for respiratory muscle
strength testing. Subjects also completed a diary to monitor compliance to training and
daily exercise. Exercise load was determined by the product of session RPE (11-point
scale) and session duration, and expressed as arbitrary units (AU) (Foster, 1998). The
exercise load was summed to create a weekly exercise lode.
6.2.8 Statistical Analysis
Data in text and figures are presented as mean ± standard deviation. Custom
spreadsheets were used to analyse the effects of training on laboratory measurements
(Hopkins, 2006b). To assess the difference between groups at baseline, and the effects of
training within groups, analysis was performed using the post-only crossover
spreadsheet. If the within group training effects were deemed to be meaningful, analysis
of the between group training effects were assessed using the pre-post parallel group
spreadsheet. All measures, other than SPO2, RPE, and HHbVL were log-transformed before
analysis then back-transformed to express the changes in percent units and standardized
effects. Because O2HbRM values were negative (relative to baseline), they were inversed
before log-transformation. Results were reversed to preserve the direction of O2HbRM.
Relative changes (%) and effect size statistics are expressed with 90% confidence limits
(90% CL). Practical significance was assessed by calculating Cohen’s d effect size (ES)
(Cohen, 1988). Standardized effect sizes of <0.2, >0.2 – 0.5, >0.5 – 0.8, >0.8 were
considered to as trivial, small, moderate and large respectively and presented with 90%
CL. Probabilities were also calculated to establish if the chance the true (unknown)
differences were lower, similar or higher than the smallest worthwhile change (ES = 0.2).
Effects were not considered meaningful if there was <75% probability of being
substantially positive/negative relative to the smallest worthwhile change. If the chance

Respiratory Muscle Work and Tissue Oxygenation Trends During Repeated-sprint Exercise
∼ 156 ∽
of having higher/lower values than the smallest worthwhile difference was both >5%,
the true difference was assessed as unclear. For clear effects, the likelihood that the true
effect was substantial were assessed qualitatively as follows: likely (75 to <95%), very
likely (95 – 99.5%), almost certainly (>99%) (Batterham & Hopkins, 2006; Hopkins et al.,
2009). Pearson's product-moment correlation (r) was computed in the R environment (R
Core Team, 2016) to assess the degree of the relationship between MIP and total work
completed. The following criteria were adopted to interpret the magnitude of the
correlation between variables: ≤0.1, trivial; >0.1 – 0.3, small; >0.3 – 0.5, moderate; >0.5 –
0.7, large; >0.7 – 0.9, very large; and >0.9 –1.0, almost perfect (Hopkins et al., 2009).
RESULTS
6.3.1 Adherence to Training and Exercise Load
The mean prescribed pressure threshold level of the two groups is presented in
Figure 6.2 A. The Control group was expected to complete 28 sessions over 4 weeks, and
the IMT group 56 sessions. There was a 99% and 94% adherence in the Control and IMT
groups respectively. Weekly and total exercise load over the 4-week intervention period
is presented in Figure 6.2 B. There was no meaningful difference in total exercise load
between the groups (relative difference =13.7%, 90% CL ±108.7%; standardised effect
size = 0.19, 90% CL ±1.23).
Inspiratory Muscle Training and Muscle Oxygenation Trends
∼ 157 ∽
Figure 6.2: Pressure threshold level (A) and exercise load (B) presented as mean ± SD for the Inspiratory Muscle Training (IMT) and Control groups. The symbols (*) represent a between group comparison that the chance of the true effect exceeds a small (-0.2 – 0.2) effect size. The number of symbols one, two and three denote likely, very likely, and almost certainly respectively, of the likelihood of the effect being substantial.
6.3.2 Respiratory Muscle and Pulmonary Function
Weekly relative change in maximal inspiratory mouth pressure (MIP) from
baseline is presented in Figure 6.3. Differences between groups were unclear at baseline
(-16.4%, ±31.9%; ES = -0.53, ±1.11). After the intervention period, MIP increased 34.7%,
±25.6% in the IMT group above the Control group (ES = 0.93, ±0.59; very likely). At
baseline, differences in FVC between IMT and Control were unclear (2.2%, ±24.8; ES =
0.11, ±1.19). After the intervention changes were unclear in both the IMT (-0.8%, ±7.9%;
ES = -0.04, ±0.37) and Control groups (-9.6, ±12.5; ES = -0.50, ±0.68). Differences in FEV1
at baseline between IMT and Control were unclear (1.4%, ±12.6%; ES = 0.08, ±0.74).
Changes after the intervention period were unclear in both the IMT (0.5%, ±10.0%; ES =
0.02, ±0.50) and Control groups (-11.4%, ±12.6%; ES = -0.72, ±0.97).

Respiratory Muscle Work and Tissue Oxygenation Trends During Repeated-sprint Exercise
∼ 158 ∽
Figure 6.3: Relative change of maximal inspiratory mouth pressure (MIP) from baseline (BL) after each week of the intervention period for the Inspiratory Muscle Training (IMT) and Control groups with 90% CL. The grey shaded area represents the smallest worthwhile change as a percent. The symbols (*) represent a within group comparison relative to BL that the chance of the true effect exceeds a small (-0.2-0.2) effect size. The number of symbols one and two denote likely and very likely respectively, of the likelihood of the effect being substantial.
6.3.3 Incremental Exercise
After the intervention period, there was no meaningful change in V� O2peak in the
IMT group (-3.4%, ±6.0%; ES = -0.21, ±0.39). Additionally, the change was unclear in the
Control group (-10.8%, ±16.8%; ES = -0.73, ±1.20).
6.3.4 Repeated-sprint Exercise
Total mechanical work completed for both training groups for Normoxia and
Hypoxia is presented in Figure 6.4, and the physiological responses to repeated-sprint
exercise are presented in Table 6.2. There were unclear effects of IMT on total work
completed during both the NM (-5.9%, ±20.6%; ES = -0.40, ±1.42), and HY trials (0.9%,
±4.1%; ES = 0.03, ± 0.11). Similarly, changes in the CON group after the intervention
period were unclear in NM (-1.9%, ±3.2%; ES = -0.11, ±0.30); and not meaningful in HY (-

Inspiratory Muscle Training and Muscle Oxygenation Trends
∼ 159 ∽
6.5%, ±9.4%; ES = -0.32, ±0.48). Muscle oxygenation effects to inspiratory muscle training
are presented in Figure 6.5 and Figure 6.6. In Hypoxia, vastus lateralis ΔReoxy was 9.3%,
±5.4% greater post intervention in the Control group. This translated to a likely moderate
between group effect (-11.2%, 12.0%; ES = -0.78, 0.84). The relationship between MIP
and total work is presented in Figure 6.6. There was a small correlation between MIP and
total work in normoxia, and a moderate correlation in hypoxia.
Figure 6.4: Total mechanical work completed during repeated-sprint exercise pre- and post-intervention in Normoxia (A) and Hypoxia (B) for both the Control and Inspiratory Muscle Training (IMT) groups. Individual total mechanical work for each subject is represented by the grey lines, and mean ± SD is represented by the black lines.

Respiratory Muscle Work and Tissue Oxygenation Trends During Repeated-sprint Exercise
∼ 160 ∽
Table 6.2: Physiological responses to repeated-sprint exercise pre-and post-Inspiratory muscle training.
Control IMT
Pre Post Pre Post
Normoxia
Peak V� O2 (L·min-1) 3.62 ± 0.39 3.57 ± 0.40 3.45 ± 0.53 3.52 ± 0.52
Nadir V� O2 (L·min-1) 2.96 ± 0.44 2.91 ± 0.26 2.83 ± 0.49 2.76 ± 0.43
SPO2 (%) 96 ± 1 97 ± 2 * 96 ± 2 95 ± 3 †
Peak Pm (cmH2O) 2.77 ± 0.61 2.83 ± 0.87 3.06 ± 0.43 3.06 ± 0.54
∫Pm × ƒb 65.67 ± 12.74 63.30 ± 14.36 70.67 ± 15.93 67.81 ±12.69
Hypoxia
Peak V� O2 (L·min-1) 3.31 ± 0.28 3.29 ± 0.26 3.44 ± 0.39 3.35 ± 0.30
Nadir V� O2 (L·min-1) 2.83 ± 0.31 2.71 ± 0.20 2.74 ± 0.36 2.58 ± 0.31
SPO2 (%) 87 ± 3 87 ± 4 86 ± 2 88 ± 4
Peak Pm (cmH2O) 2.84 ± 0.76 2.85 ± 0.62 3.24 ± 0.67 3.06 ± 0.41
∫Pm × ƒb 68.92 ± 12.99 66.90 ± 8.59 72.04 ± 13.84 67.73 ± 8.35
Abbreviations are: V� O2, pulmonary oxygen uptake; SPO2, arterial oxygen saturation; Pm, inspiratory mouth pressure; ∫Pm × ƒb, inspiratory muscle force development. The ⁕ symbol indicates substantial within group effects. Whereas the † symbol indicated a substantial between group effect. The symbols denote a likely chance of the true effect exceeds a small (-0.2 – 0.2) effect size.

Inspiratory Muscle Training and Muscle Oxygenation Trends
∼ 161 ∽
Figure 6.5: Standardised effects for the change in locomotor muscle oxygenation responses to repeated-sprint exercise in normoxia (A) and hypoxia (B) for both the Control and Inspiratory Muscle Training (IMT) groups. The grey shaded area represents the smallest worthwhile change in standardized units. The dotted lines denote the thresholds for small, moderate and large effects. The ⁕ symbol indicates substantial within group effects. Whereas the † symbol indicated a substantial between group effect. The number of symbols one and two denote likely and very likely respectively, of the likelihood of the effect being substantial.
Figure 6.6: Standardised effects for the change in respiratory muscle oxygenation responses to repeated-sprint exercise in normoxia (A) and hypoxia (B) for both the Control and Inspiratory Muscle Training (IMT) groups. The grey shaded area represents the smallest worthwhile change in standardized units. The dotted lines denote the thresholds for small, moderate, and large effects.
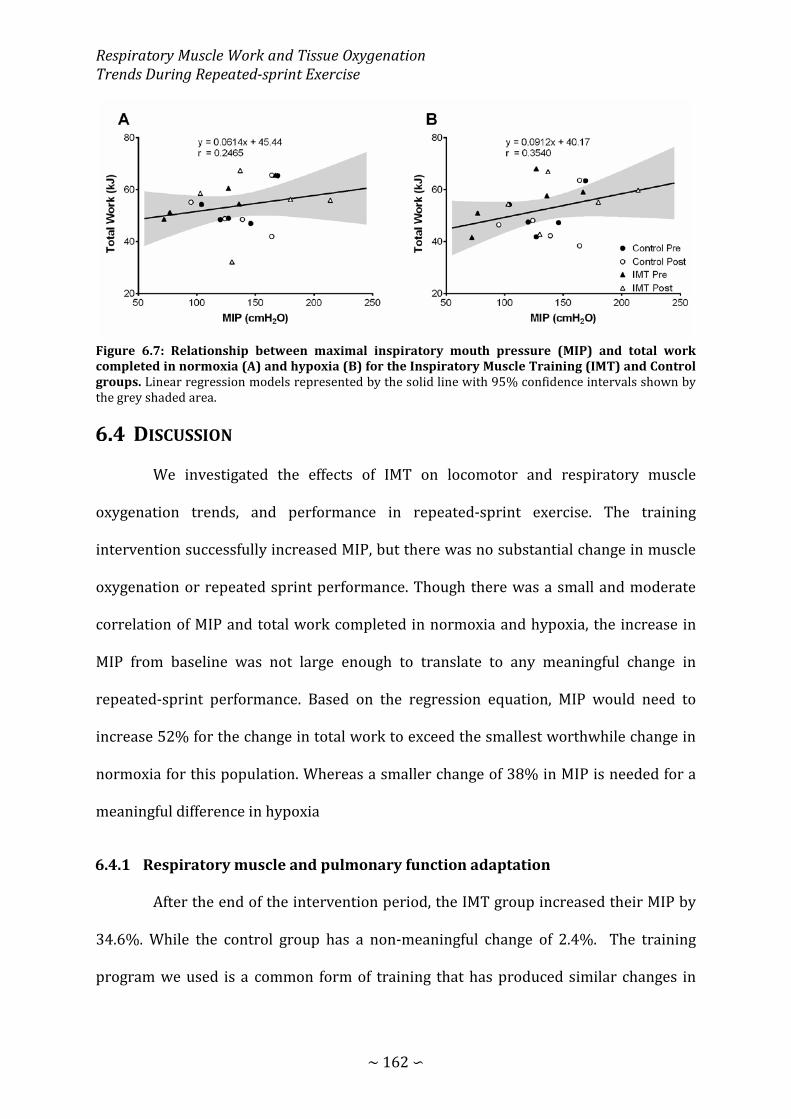
Respiratory Muscle Work and Tissue Oxygenation Trends During Repeated-sprint Exercise
∼ 162 ∽
Figure 6.7: Relationship between maximal inspiratory mouth pressure (MIP) and total work completed in normoxia (A) and hypoxia (B) for the Inspiratory Muscle Training (IMT) and Control groups. Linear regression models represented by the solid line with 95% confidence intervals shown by the grey shaded area.
DISCUSSION
We investigated the effects of IMT on locomotor and respiratory muscle
oxygenation trends, and performance in repeated-sprint exercise. The training
intervention successfully increased MIP, but there was no substantial change in muscle
oxygenation or repeated sprint performance. Though there was a small and moderate
correlation of MIP and total work completed in normoxia and hypoxia, the increase in
MIP from baseline was not large enough to translate to any meaningful change in
repeated-sprint performance. Based on the regression equation, MIP would need to
increase 52% for the change in total work to exceed the smallest worthwhile change in
normoxia for this population. Whereas a smaller change of 38% in MIP is needed for a
meaningful difference in hypoxia
6.4.1 Respiratory muscle and pulmonary function adaptation
After the end of the intervention period, the IMT group increased their MIP by
34.6%. While the control group has a non-meaningful change of 2.4%. The training
program we used is a common form of training that has produced similar changes in
Inspiratory Muscle Training and Muscle Oxygenation Trends
∼ 163 ∽
pressure-generating capacity of the respiratory muscles (Downey et al., 2007; Lomax et
al., 2011; Romer et al., 2002b; Salazar-Martínez et al., 2017; Turner et al., 2012). This
change in respiratory muscle strength is likely the result of diaphragm hypertrophy
induced by the IMT. Diaphragm thickness has been found to have a moderate correlation
with mouth pressure generation capacity (Orrey, Unger, & Hanekom, 2014). After a
similar training protocol of IMT, diaphragm thickness can increase up to ~10%, and MIP
by 24% after 4 weeks of training (Downey et al., 2007). A longer training intervention
could produce greater results. However, the effectiveness of IMT appears to diminish
over time. Over an 11-week training period, MIP has been demonstrated to increase by
45% (Volianitis et al., 2001). But by week 4, MIP had already increased by 41%.
Therefore, extending the training in the present study is unlikely to have provided and
added benefits that could be translated to enhanced repeated-sprint performance.
No meaningful changes in pulmonary function (FVE and FEV1) were induced by
the training intervention in the present study. This is consistent with others who have
shown no change in pulmonary function following IMT in healthy subjects (Romer et al.,
2002b; Salazar-Martínez et al., 2017; Turner et al., 2012), and those with chronic
pulmonary conditions (Shahin, Germain, Kazem, & Annat, 2008; Turner et al., 2011).
These data support the specificity of IMT, that adaptations are localised to the pressure
generating capacity of the respiratory muscles. The effectiveness of IMT in clinical
populations is not a change in pulmonary function, but an unloading of the respiratory
muscle to alleviate sensations of dyspnoea (el-Manshawi, Killian, Summers, & Jones,
1986; Turner et al., 2011).
Respiratory Muscle Work and Tissue Oxygenation Trends During Repeated-sprint Exercise
∼ 164 ∽
6.4.2 Repeated-sprint performance and Tissue Oxygenation
Contrary to others (Romer et al., 2002b), IMT did not alter repeated-sprint
ability. Increasing the strength of the inspiratory muscles can act as a form of respiratory
muscle unloading, lowering the O2 cost of voluntary hyperpnoea (Turner et al., 2012), and
delay the activation of respiratory muscle metaboreflex (McConnell & Lomax, 2006; Witt
et al., 2007). Because of the strong link between locomotor muscle O2 delivery and
recovery from multiple sprint activity (Billaut & Buchheit, 2013), IMT is an appealing
training regime to enhance performance. As such, IMT has attenuated self-selected
recovery time, with no concurrent change in 20 m sprint times (Romer et al., 2002b). This
implies that recovery was accelerated, potentially linked to the perceptual and metabolic
changes that were observed during submaximal exercise. The difference in sprint
exercise protocols may have played a role in the discrepancies of performance outcomes
following IMT. Romer et al (2002b) used sprints over a fixed distance of 20 m, which in
average was covered in ~3.18 s. This represents approximately one third the duration of
the sprints in the present study. The effectiveness of IMT may be limited to repeated-
sprint exercise that consists of sprints <5 s. Sprints of a longer duration may cause
physiological disturbances that surpass the effectiveness of IMT. That unloading the
respiratory muscle by increasing their relative strength, and the associated decrease in
O2 cost of hyperpnoea, appears to be insignificant in repeated-sprints lasting 10 s.
Considering inspiratory muscle force development was similar to pre-post
intervention, a smaller fraction of the maximal pumping capacity would have been
utilized in the present study. Despite the presumed reduction in O2 cost, and relative
intensity of breathing, there was no change in oxygenation trends. Arterial hypoxemia is
a strong limiting factor in locomotor tissue reoxygenation (Billaut & Buchheit, 2013).

Inspiratory Muscle Training and Muscle Oxygenation Trends
∼ 165 ∽
Hypoxemia also stimulates V� E, and hastens the development of respiratory muscle fatigue
via deoxygenation of these muscles (Babcock, Johnson, et al., 1995; Katayama et al., 2015;
Verges et al., 2010). But with IMT the relative intensity of hyperpnoea can be lessened,
blunting the development of fatigue (Downey et al., 2007), and reducing the O2 cost of
voluntary hyperpnoea (Turner et al., 2012). Regardless of evidence supporting IMT to
alleviate O2 competition, it did not translate to any change in muscle oxygenation, or
performance.
Attenuating the relative intensity of hyperpnoea through IMT decrease the O2
cost of ventilation, especially at a higher V� E (Turner et al., 2012). Despite this evidence,
there was no clear change in oxygenation trends after the intervention period in either
locomotor or respiratory muscles in the present study. The lack of change in muscle
oxygenation observed after a period of IMT is consistent with previous research also
using maximal exercise (Turner et al., 2016). This may be in part due to the
cardiovascular strain placed on the system at high workloads. At work rates above 80%
V� O2max, cardiac output and mean arterial blood pressure begin to plateau (Vogiatzis et
al., 2009). As a result, limb and respiratory muscle blood flow is constrained, or even
slightly reduced (Mortensen et al., 2008; Vogiatzis et al., 2009). An overriding
vasoconstriction plays a functional role in maintaining blood pressure by constraining
blood flow to the active muscles (Saltin, Radegran, Koskolou, & Roach, 1998). Combined,
these data demonstrate that a ~30% increase in MIP does not alter the relative intensity
of hyperpnoea in a meaningful way as to reduce the O2 cost of breathing in maximal
exercise.
The intermittent nature of repeated-sprint exercise may also explain the
ineffectiveness of IMT. During the sprint and recovery phases, V� O2 and locomotor muscle

Respiratory Muscle Work and Tissue Oxygenation Trends During Repeated-sprint Exercise
∼ 166 ∽
O2 extraction fluctuates between sprint efforts (Billaut & Buchheit, 2013; Buchheit et al.,
2009; La Monica et al., 2016). Therefore, there is limited competition for available cardiac
output to meet the demands of both locomotor and respiratory muscles. In the previous
chapter (Chapter 5), I demonstrated that inspiratory loading does not compromise
locomotor muscle oxygenation, achieved by a ~4% increase in V� O2 to accommodate the
elevated work of breathing. It appears that there is enough reserved in the cardiovascular
system to meet the demands of both locomotor and respiratory muscles, and the
respiratory muscles are not sufficiently challenged to warrant IMT as a method of
improving repeated-sprint exercise.
6.4.3 Limitations
Though the diaphragm muscle is the primary respiratory flow generator, a direct
measurement of oxygenation is difficult due to the complex arrangement of the
respiratory muscles. Therefore, accessory intercostal muscles are relied on for an index
of global respiratory muscle oxygenation (Katayama et al., 2015; Turner et al., 2016).
Additionally, the complicated arrangement of the respiratory muscles it is not possible to
apply arterial occlusion to these muscles. Instead [O2Hb] and [HHb] were measured as an
absolute change from baseline. While NIRS yields information on muscle O2 perfusion and
extraction in the underlying tissue, the technique employed does not provide a
measurement of blood volume. Using the light absorbing tracer indocyanine green dye,
muscle blood flow can be determined (Vogiatzis et al., 2009). Limits in the current study
restrict the ability to draw conclusions on the distribution of cardiac output after IMT.
Lastly, respiratory muscle pressure generation and work completed can be
directly calculated with the use of oesophageal balloons (Verges et al., 2010; Vogiatzis et
al., 2009). In the present study, a non-invasive measurement of respiratory muscle force
Inspiratory Muscle Training and Muscle Oxygenation Trends
∼ 167 ∽
development (∫Pm × ƒb) was used (Witt et al., 2007). Therefore, clear conclusions on the
effects of IMT on the work of breathing after the intervention period are difficult.
CONCLUSION
This is the first study to investigate the effects of pressure threshold IMT on
skeletal muscle tissue oxygenation and repeated-sprint cycling exercise. Following 4
weeks of IMT, a 34.7% increase in MIP did not alleviate O2 competition between
locomotor and respiratory muscles. Additionally, there was no ergogenic benefits of the
training on repeated-sprint performance in either normoxia or hypoxia. This study does
not support the use of IMT to reduce respiratory muscle O2 utilisation, or locomotor
muscle oxygenation during repeated-sprint exercise.
CHAPTER SEVEN: SUMMARY AND CONCLUSIONS

Respiratory Muscle Work and Tissue Oxygenation Trends During Repeated-sprint Exercise
∼ 169 ∽
SUMMARY OF MAIN FINDINGS
The theory of competition between locomotor and respiratory muscles for
available cardiac output, and therefore O2, proposed by Dempsey and colleagues (Aaron,
Seow, et al., 1992; Amann, Pegelow, et al., 2007; Dempsey et al., 2006; Harms et al., 1997)
was examined in this thesis in a new model of exercise. Specifically, this thesis
investigated the role respiratory muscle work plays in the balance of vastus lateralis O2
delivery and uptake in a repeat-sprint exercise model.
Since NIRS responses are used as a surrogate for metabolic perturbations,
detecting the magnitude of change in oxygenation status is critical for assessing the
influence of interventions and environmental factors. Therefore, in study 1 (Chapter
Three), common methodologies used to smooth and identify peaks and nadirs in vastus
lateralis [HHb] were evaluated. Additionally, to overcome the limitation of an arithmetic
mean, a Butterworth filter was used to smooth the raw NIRS signal. Analysis revealed that
1) the size of an averaging window (2 vs. 5 s) influences the outcomes of analysis, 2) a
larger analysis window underestimates the vastus lateralis [HHb] response compared to
a smaller window, and 3) values obtained from predetermined time-points
underestimate the magnitude of change relative to values obtained from a rolling
approach. For the most accurate representation of NIRS responses to repeated-sprint
exercise, it was suggested that 1) a digital filter be used to smooth NIRS data, rather than
an arithmetic mean, and 2) a rolling approach be used to determine peaks and nadirs
rather than obtaining values from predetermined time-points. These recommendations
where then applied to the analysis conducted in the forthcoming research chapters.
Summary and Conclusions
∼ 170 ∽
7.1.1 Work of breathing and respiratory muscle oxygenation
For the first time, respiratory muscle oxygenation has been investigated in
repeated-sprint exercise. There was a progressive deoxygenation from baseline that
began to plateau by sprints 3-4, which is directly related to the metabolic activity of
respiratory muscles (Nielsen et al., 2001; Turner et al., 2013). It is estimated that the O2
cost of hyperpnoea accounts for 10-15% of whole body V� O2 during high-intensity
exercise (Aaron, Johnson, et al., 1992; Aaron, Seow, et al., 1992; Harms et al., 1998). By
elevating the work of breathing with inspiratory loading, this effect was amplified in
study 2 (Chapter Four). To accommodate the heightened inspiratory work, V� O2 was
elevated by 4-5%. Perceptually, subjects reported a substantial increase in their difficulty
of breathing, while there was no clear difference in their perception of exercise difficulty.
The sensations of respiratory effort are likely derived from feedback originating at the
respiratory muscles regarding tension and displacement (el-Manshawi et al., 1986). No
measures of respiratory muscle fatigue were taken in this study. Therefore, it is unclear
if a loss in pressure generating capacity contributed to the respiratory sensations during
exercise. At a minimum, this was unlikely to occur during the control exercise condition
since respiratory muscle fatigue is not induced by repeated-sprint exercise (Minahan et
al., 2015). But, it is unclear if fatigue developed in the respiratory muscles during the
inspiratory loading trial.
When respiratory muscle oxygenation patterns were evaluated in response to
acute arterial hypoxemia, there were no clear differences when compared to normoxia
(study 3, Chapter Five). There was also no meaningful differences in either ventilation
patterns (fb and IV), or inspiratory pressure generation (Pm and ∫Pm × ƒR). Therefore, the
O2 cost of exercise hyperpnoea was likely similar between conditions (Dominelli et al.,
Respiratory Muscle Work and Tissue Oxygenation Trends During Repeated-sprint Exercise
∼ 171 ∽
2014). This is supported by the evidence of a similar concurrent rise and fall of [HHb] and
[O2Hb] relative to baseline respectively. This suggests that O2 delivery to the respiratory
muscles is maintained close to the levels of normoxia. Therefore, there is minimal effect
of hypoxemia on the O2 status of the respiratory muscles during repeated-sprint exercise.
Others have reported an exaggerated deoxygenation of the respiratory muscles in
hypoxia during voluntary isocapnic hyperpnoea (Katayama et al., 2015). However, their
hypoxia gas mixture resulted in a lower SPO2 of 82% compared to the average 87% in
subjects in study 3. A hypoxic threshold may exist where respiratory muscle O2 delivery
can be maintained close to the rate of that during exercise in normoxia. If arterial
hypoxemia was greater in study 3, further desaturation of the respiratory muscles may
have been detected. The evidence in this chapter suggests that during repeated-sprint
exercise, respiratory muscle O2 status is no further compromised compared to normoxia.
Perhaps there is preferential blood flow distribution which maintains constant O2 supply
to the respiratory muscles proportional to metabolic activity (Costes et al., 1996; Ferrari
et al., 2004).
In study 4 (Chapter Six), the inspiratory muscles were strengthened using a
pressure threshold device (POWERbreathe®, HaB International Ltd, UK), and mimicking
a training protocol of previous work in the area (Downey et al., 2007; Romer et al., 2002b;
Turner et al., 2012; Volianitis et al., 2001). Strengthening the respiratory muscles acts as
form of respiratory muscle unloading, decreasing the O2 cost, and relative intensity of
exercise hyperopia (Downey et al., 2007; Turner et al., 2012; Witt et al., 2007). After the
4-week intervention period, subjects increased the pressure generating capacity of their
inspiratory muscles by 34%, which is consistent with previous research (Downey et al.,
2007; Lomax et al., 2011; Romer et al., 2002b; Salazar-Martínez et al., 2017; Turner et al.,

Summary and Conclusions
∼ 172 ∽
2012). Considering inspiratory pressure during exercise was similar pre\post
intervention, a smaller fraction of the maximal pumping capacity would have been
utilised. However, the change was too small to have any clear effects on respiratory
muscle oxygenation in normoxia, or hypoxia. It is possible that the respiratory workload
was experienced during repeated-sprint exercise is too low for inspiratory muscle
training to be effective. A decrease in respiratory muscle [HHb] during “heavy”
inspiratory loading has been demonstrated wile cycling at 80% V� O2peak, reflecting a
decrease in O2 extraction by the active musculature (Turner et al., 2016). However, no
change in muscle oxygenation post intervention was observed during moderate
inspiratory loading, or during maximal exercise (cycling at 100% V� O2peak). This evidence,
combined with the evidence of study 4, suggest that inspiratory muscle training has no
effect on respiratory muscle oxygenation with the normally occurring work of breathing.
7.1.2 Influence of respiratory muscle work on vastus lateralis oxygenation trends
Respiratory muscle work has been implicated as a limiting factor of limb O2
perfusion (Dempsey et al., 2006). However, competition between locomotor and
respiratory muscle for available cardiac output does not appear to be a significant
characteristic of repeated-sprint exercise. In study 2 when the work of breathing and O2
utilisation of the respiratory muscles was elevated. But there was no clear impairment of
O2 to the locomotor muscles. The intermittent nature of repeated-sprints is likely a key
mediating factor for which O2 delivery can be maintained to both locomotor and
respiratory muscles. The addition of an inspiratory loading while exercising >95%
V� O2peak, results in a decrease in limb perfusion and O2 delivery, mediated by
sympathetically-activated vasoconstriction in the locomotor muscles (Harms et al., 1997;
Harms et al., 1998). Whereas at moderate intensities (50-75% V� O2peak), there is no change

Respiratory Muscle Work and Tissue Oxygenation Trends During Repeated-sprint Exercise
∼ 173 ∽
in vascular resistance or blood flow (Wetter et al., 1999). Even though repeated-sprint
exercise can elicit >90% of V̇O2 peak, it is not sustained throughout the entire protocol
(Buchheit et al., 2009; Dupont et al., 2003). Moreover, skeletal muscle O2 extraction
oscillates between sprint and recovery phases (Billaut & Buchheit, 2013). In study 2, V� O2
fluctuated between 90% and 70% of V� O2peak during sprint and recovery phases
respectively, and increased ~4.5% when the inspiratory load was added. This fluctuation
in O2 demands may aid in minimising the competition for available cardiac output.
Moreover, the fact the V� O2 increased proportionally to the elevated work of breathing,
represents a functional capacity of the cardiovascular system to adjust to meet the
demands of additional muscular activity (Gleser, Horstman, & Mello, 1974). When limb
blood flow has been demonstrated to be restricted when exercising with inspiratory
loading, there is no increase in V� O2 to compensate for the additional muscle work (Harms
et al., 1997; Harms et al., 1998). Available room for V� O2 to increase may also be a crucial
factor in maintaining O2 supply to all active muscles.
To further explore the role of O2 availability, in study 3, the fraction of inspired
O2 was decreased to 0.1455 using an environmental exercise laboratory. Because O2
availability during between sprint rest phases is a strong determining factor of metabolic
recovery, O2 delivery underpins the capacity to maintain sprint performance over
multiple efforts (Gaitanos et al., 1993; Harris et al., 1976; Parolin et al., 1999). As had been
demonstrated by others, hypoxia impaired vastus lateralis O2 delivery compared to
normoxia (Billaut & Buchheit, 2013; Smith & Billaut, 2010). On the other hand,
oxygenation of the respiratory muscles was similar to normoxic exercise. Based on this
evidence, it appears that O2 delivery is preferentially distributed to the respiratory
muscles to maintain pulmonary ventilation. Amann et al. (2007) has demonstrated the

Summary and Conclusions
∼ 174 ∽
link between inspiratory muscle work and the development of quadriceps fatigue during
exercise in acute hypoxia. By reducing the work of breathing with proportional assist
ventilation during high-intensity exercise, the amount of quadriceps fatigue is attenuated
(Amann, Pegelow, et al., 2007). Because hypoxia can accelerate the development of
exercise-induced diaphragm fatigue and accumulation of metabolites (Babcock, Johnson,
et al., 1995; Vogiatzis et al., 2006; Vogiatzis et al., 2007b), a heightened metaboreflex may
compromise limb blood flow to a larger degree than normoxia. Therefore, the respiratory
muscle work incurred during repeated-sprint exercise may play a role in limiting
locomotor muscle oxygenation. Alleviating the O2 cost of hyperpnoea appears to be a
pathway for enhancing limb O2 delivery during exercise.
In study 4, inspiratory muscle training was used as a method of attenuating the
relative intensity of exercise hyperpnoea, and reducing the O2 cost of exercise
hyperpnoea (Turner et al., 2016; Turner et al., 2012). This form of training has also been
demonstrated to attenuate sympathetic activity linked to the respiratory muscle
metaboreflex (Witt et al., 2007). Despite this evidence, there were no clear changes in
vastus lateralis oxygenation trends in either normoxia, or hypoxia after the intervention
period. Unloading the respiratory muscles with proportional assist ventilation can
attenuate leg vascular resistance and promote leg blood flow (Harms et al., 1997; Harms
et al., 1998). Considering this, it is likely that a ~30% increase in maximal inspiratory
mouth pressure has a minimal effect on reducing the relative intensity of exercise
hyperpnoea. Other have also shown no clear difference in locomotor muscle oxygenation
trends during maximal exercise following a 6-week intervention period (Turner et al.,
2016).

Respiratory Muscle Work and Tissue Oxygenation Trends During Repeated-sprint Exercise
∼ 175 ∽
7.1.3 The role of respiratory muscle work on exercise performance
Respiratory muscle work appears to have trivial effects on repeated-sprint
performance in normoxia. When the work of breathing was elevated in study 2 with
inspiratory loading, there was a negatable difference in total work completed. In this
instance, V� O2 increase ~4.5% to accommodate the increased metabolic activity of the
respiratory muscles. In instances where V� O2 is unable to increase to meet the heightened
O2 demands, metabolic recovery between sprints may be compromised, and therefore
subsequent sprint performance. Therefore, if O2 demands of exercise hyperpnoea can be
met without compromising limb blood flow, repeated-sprint performance should be
unaffected. Even the substantial change in perception of breathing difficulty had a trivial
effect of performance. The summation of sensory signals (afferent feedback and central
motor drive) within the central nervous system regulate exercise intensity within
tolerable limits (Hureau, Romer, & Amann, 2016). It appears that subjects can tolerate
the heightened respiratory effort in an intermittent exercise model without effecting
locomotor mechanical work.
The greatest potential for respiratory muscle work to influence performance, is
when exercise is performed in hypoxia. Though there was no clear difference in exercise
performance in this thesis, arterial hypoxemia has previously been demonstrated to have
substantial effects on performance (Balsom, Gaitanos, Ekblom, & Sjodin, 1994; Billaut et
al., 2013; Girard et al., 2017; Goods et al., 2014; Smith & Billaut, 2010). Performance
outcomes in study 3 were likely influenced by an element of pacing in two subjects
(Figure 5.2). The evidence that respiratory muscle oxygenation was maintained, while
locomotor oxygenation was compromised, is suggestive of preferential blood flow
distribution. Therefore, the quality of recovery between sprints may be compromised by

Summary and Conclusions
∼ 176 ∽
the favourable blood flow allocated to the respiratory muscles in hypoxia. Under these
conditions, repeated-sprint performance may be impacted by respiratory muscle work.
Alleviating the relative intensity of exercise hyperpnoea with inspiratory muscle
training has enhanced exercise performance during the Yo-Yo intermittent recovery test
(Lomax et al., 2011; Nicks et al., 2009), time trials (Romer et al., 2002c; Salazar-Martínez
et al., 2017; Volianitis et al., 2001), and constant load cycling (Bailey et al., 2010;
Mickleborough et al., 2010). However, the effective of inspiratory muscle training in
repeated-sprint exercise is mixed. Self-selected recovery time between sprint efforts has
been demonstrated to be reduced after inspiratory muscle training (Romer et al., 2002b).
On the other hand, an improvement in repeated-sprint performance has been shown to
be no grater then the control group (Archiza et al., 2017). The latter finding supports the
performance outcomes in study 4. Based on regression models, for the training
intervention to have had meaningful effects on performance in normoxia and hypoxia,
pressure generating capacity needed to increase by 52% and 38% respectively in these
subjects. Since the required adaptation to enhance performance appears to be beyond the
typical change (Archiza et al., 2017; Downey et al., 2007; Lomax et al., 2011; Romer et al.,
2002b; Salazar-Martínez et al., 2017; Turner et al., 2012), this thesis does not support the
use of inspiratory muscle training to improve repeated sprint performance.
LIMITATION OF THIS RESEARCH
• A fundamental limitation of the research presented in this thesis is the absence of
direct measurements of either leg blood flow or O2 uptake. While the NIRS techniques
employed in this thesis provided information on the relationship between O2 delivery
vs. extraction, the influence of the work of breathing on O2 transport per se remains
speculative. Moreover, there are a number of limitation of NIRS measurements which
Respiratory Muscle Work and Tissue Oxygenation Trends During Repeated-sprint Exercise
∼ 177 ∽
could affect the interoperation of data. 1) There is no consistency within the
literature on an appropriate differential pathlength factor (DPF) to be used. However
the variation in near-infrared light scattering properties in human tissue is like far
more influential than the DPF if selected within an appropriate range. 2) Blood
volume changed (due to muscle contraction) can influence the tissue path length. 3)
Light propagation can be affected by adipose tissue (Matsushita, Homma, & Okada,
1998). 4) It is difficult to separate haemoglobin and myoglobin in the NIRS signal
because the chromophores overlap in the near-infrared light spectrum (Ferrari et al.,
2004).
• The level of arterial oxygenation can either be measured directly or indirectly. A
direct measurement involves blood sampling via an arterial puncture. Along with
arterial O2, arterial CO2 and pH can also be assessed (Harms et al., 1997; Romer,
Haverkamp, et al., 2006). Also, by having a direct sample of arterial blood, factors that
affect the oxygen haemoglobin dissociation curve (Figure 2.4) can be taken into
consideration when interoperating the data. To overcome the invasive nature of
arterial blood sampling, an indirect measurement of arterial oxygenation can be
assessed, as was in this thesis, by pulse oximetry (SPO2) and relies on the same
technology as NIRS. The same limitation of NIRS mentioned above will also apply to
pulse oximetry. Moreover, shifts in the oxygen haemoglobin dissociation curve
during exercise can influence the data. Even though SPO2 is less accurate, there is
typically a <2% difference in arterial oxygenation difference compared to an arterial
blood sample (Collins et al., 2015). An advantage of the indirect method is that SPO2
can be monitored continuously throughout exercise which cannon be done with
blood sampling.

Summary and Conclusions
∼ 178 ∽
• While mouth pressure was used to infer the inspiratory muscle work, it is not a direct
measurement of the work of breathing (Benditt, 2005; Otis, 1954). Although mouth
pressure can give an indication of inspiratory muscle force development (Witt et al.,
2007), it does not account for the increased inspiratory work necessary to overcome
the elastic recoil of the chest cavity at high lung volumes (B. D. Johnson, Saupe, &
Dempsey, 1992). To obtain a more accurate representation of inspiratory muscle
work, a balloon catheter is inserted through the nose and into the oesophagus to
record transdiaphragmatic pressure (Benditt, 2005), however such technique is
invasive and difficult to use during all-out sprint efforts.
• This thesis adds to the body of research on the effectiveness of inspiratory muscle
training on performance and physiological responses to exercise. The training design
adopted in this thesis was similar to previous work in the area (Griffiths & McConnell,
2007; Romer et al., 2002b; Salazar-Martínez et al., 2017; Turner et al., 2013). A typical
training design consists of pre-testing, separated by an intervention period, and
concluded by post-testing. However, this is not the strongest design to determine the
magnitude of change of an intervention in a sample population. A stronger design
would incorporate a double baseline separated by 4-weeks (same duration as the
intervention). Including these components will help establish “normal” activity
profiles of the subjects before commencing training. If participants modify their
activity during the intervention, it makes it difficult to separate the effects of training
from changes in activity on post-intervention outcomes. A double baseline period
would also help establish thresholds for the smallest worthwhile change. Repeated
respiratory muscle strength assessments prior to training would have helped
establish a baseline to set training intensity and interpret training responses, and
separate training effects from normal physiological variance.

Respiratory Muscle Work and Tissue Oxygenation Trends During Repeated-sprint Exercise
∼ 179 ∽
• A single familiarisation prior to the experimental trials is widespread practice in
exercise science research. However, there in increasing evidence that multiple
familiarisation trials are required to reduce the learning effect (Higgins, James, &
Price, 2014; McGawley & Bishop, 2006). In studies 1 and 2, only one single
familiarisation session was performed prior to the experimental sessions.
Considering the nature of study 1, an additional familiarisation would be unlikely to
have influenced the outcomes. Completing a second familiarisation in study 2,
however, may have reduced the potential learning effect prior to the repeated
experimental trials. To overcome this limitation, repeated familiarisation trials were
performed in studies 3 and 4.
• Considering the small sample size, it is likely that study 4 was underpowered. A
suboptimal sample size would widen the confidence intervals and make it difficult to
obtain clear outcomes (Hopkins, 2006a).
SUGGESTED FUTURE RESEARCH
• Further explore the role respiratory muscle work plays in repeated-sprint exercise
by unloading the respiratory muscles with either proportional assist ventilation or a
helium-O2 inspiratory gas mixture. Using of proportional assist ventilation can
reduce the work of breathing by 35-55% (Harms, 2000; Harms et al., 1997). Though
the inspiratory muscle training implemented in study 4 can act as a form of
respiratory muscle unloading (Turner et al., 2016; Turner et al., 2012), it is unlikely
to have the same magnitude of effect as proportional assist ventilation.
• In a team a sport setting, maximal repeated accelerations/sprints do not occur in
isolation. Often, the brief period of maximal exertion is interspersed with longer
periods of low to moderate activity (Spencer, Bishop, Dawson, & Goodman, 2005).

Summary and Conclusions
∼ 180 ∽
Future investigation should explore the role inspiratory muscle work plays in an
intermittent activity protocol that aims to simulate team-sport running (Sweeting et
al., 2017; Zois, Bishop, Fairweather, Ball, & Aughey, 2013). Repeated-sprint running
may pose more of a challenge for the cardiorespiratory system to adequately
oxygenate both the locomotor and respiratory muscles. Running typically elicits a
greater V� O2max since it utilises a larger muscle mass (upper body and postural
muscles) compared to cycling (Millet, Vleck, & Bentley, 2009). Therefore, an elevated
work of breathing may be a limiting factor during running exercise, whereas
inspiratory muscle work appears to have negligible effects on repeated-sprint cycling
• Hyperventilation occurs when alveolar ventilation disproportionally rises relative to
CO2 production causing a decrease in the pressure of alveolar CO2, and increase in
pressure of alveolar O2 (Forster et al., 2012; Sheel & Romer, 2012). This is a potential
mechanism associated with high-intensity exercise which can constrain a fall in
arterial O2 and pH (Forster et al., 2012; Whipp & Ward, 1998). Though this was not
directly examined in this thesis, some evidence of hyperventilation occurring during
repeated-sprint exercise was present. As depicted by the data of a representative
subject (Figure 7.1), PETO2 and PETCO2 rose and fell respectively from baseline over
the course of the repeated-sprint protocol. Further evidence of hyperventilation
comes in study 3. Arterial hypoxemia is a potent stimulant of ventilation. However,
there was no clear difference in IV, fR, or inspiratory pressure. The wave like pattern
in PETO2 and PETCO2 (Figure 7.1) appears to be linked to the sprinting phases of the
protocol, and occurs at exercise onset. This pattern is suggestive of a locomotor
respiratory coupling. Meaning that breathing frequency is entrained to the cadence
of locomotor exercise (Bernasconi & Kohl, 1993; Siegmund et al., 1999). This link

Respiratory Muscle Work and Tissue Oxygenation Trends During Repeated-sprint Exercise
∼ 181 ∽
should be further investigated to determine the influencing factors exercise
hyperpnoea over a variety sprint durations.
Figure 7.1: Partial pressure of end-tidal gasses oxygen (PETO2) and carbon dioxide (PETCO2) recorded on a breath-by-breath basis during repeated-sprint exercise. Data is from a single subject collected in study 2 during the Control exercise condition. The grey shaded area represents the 2-min baseline period observed prior to the commencement of warm-up.

Summary and Conclusions
∼ 182 ∽
• Future research should investigate the concurrent use of inspiratory loading during
high-intensity interval training. The evidence presented in study 2 suggests that
inspiratory loading heightens the metabolic demands of repeated-sprint exercise, but
performance can be maintained. Though this thesis does not support the direct use
of inspiratory muscle training as an ergogenic aid (study 4), using it in conjunction
with repeated-sprint training may provide fruitful results. There is some evidence
that supports the use of airflow-restriction masks during high-intensity interval
training (Porcari et al., 2016). However, evidence to the contrary also exists (Sellers,
Monaghan, Schnaiter, Jacobson, & Pope, 2016). More research is needed to fully
explore these training methods.

REFERENCES
Aaron, E. A., Johnson, B. D., Seow, C. K., & Dempsey, J. A. (1992). Oxygen cost of exercise hyperpnea: measurement. Journal of Applied Physiology, 72(5), 1810-1817. doi:10.1152/jappl.1992.72.5.1810
Aaron, E. A., Seow, K. C., Johnson, B. D., & Dempsey, J. A. (1992). Oxygen cost of exercise hyperpnea: implications for performance. Journal of Applied Physiology, 72(5), 1818-1825. doi:10.1152/jappl.1992.72.5.1818
Albouaini, K., Egred, M., Alahmar, A., & Wright, D. J. (2007). Cardiopulmonary exercise testing and its application. Postgraduate Medical Journal, 83(985), 675-682. doi:10.1136/hrt.2007.121558
Alhemsi, H., Zhiyun, L., & Deen, M. J. (2013, 27-30 April 2013). Time-resolved near-infrared spectroscopic imaging systems. Paper presented at the Electronics, Communications and Photonics Conference (SIECPC), 2013 Saudi International.
Aliverti, A. (2016). The respiratory muscles during exercise. Breathe, 12(2), 165-168. doi:10.1183/20734735.008116
Aliverti, A., Cala, S. J., Duranti, R., Ferrigno, G., Kenyon, C. M., Pedotti, A., . . . Yan, S. (1997). Human respiratory muscle actions and control during exercise. Journal of Applied Physiology, 83(4), 1256-1269. doi:0.1152/jappl.1997.83.4.1256
Amann, M. (2012). Significance of Group III and IV muscle afferents for the endurance exercising human. Clinical and Experimental Pharmacology and Physiology, 39(9), 831-835. doi:10.1111/j.1440-1681.2012.05681.x
Amann, M., Blain, G. M., Proctor, L. T., Sebranek, J. J., Pegelow, D. F., & Dempsey, J. A. (2010). Group III and IV muscle afferents contribute to ventilatory and cardiovascular response to rhythmic exercise in humans. Journal of Applied Physiology, 109(4), 966-976. doi:10.1152/japplphysiol.00462.2010
Amann, M., Blain, G. M., Proctor, L. T., Sebranek, J. J., Pegelow, D. F., & Dempsey, J. A. (2011). Implications of group III and IV muscle afferents for high-intensity endurance exercise performance in humans. The Journal of Physiology, 589(Pt 21), 5299-5309. doi:10.1113/jphysiol.2011.213769
Amann, M., & Calbet, J. A. L. (2008). Convective oxygen transport and fatigue. Journal of Applied Physiology, 104(3), 861-870. doi:10.1152/japplphysiol.01008.2007

Respiratory Muscle Work and Tissue Oxygenation Trends During Repeated-sprint Exercise
∼ 184 ∽
Amann, M., & Dempsey, J. A. (2008). Locomotor muscle fatigue modifies central motor drive in healthy humans and imposes a limitation to exercise performance. The Journal of Physiology, 586(1), 161-173. doi:10.1113/jphysiol.2007.141838
Amann, M., Eldridge, M. W., Lovering, A. T., Stickland, M. K., Pegelow, D. F., & Dempsey, J. A. (2006). Arterial oxygenation influences central motor output and exercise performance via effects on peripheral locomotor muscle fatigue in humans. The Journal of Physiology, 575(Pt 3), 937-952. doi:10.1113/jphysiol.2006.113936
Amann, M., Pegelow, D. F., Jacques, A. J., & Dempsey, J. A. (2007). Inspiratory muscle work in acute hypoxia influences locomotor muscle fatigue and exercise performance of healthy humans. American Journal of Physiology - Regulatory, Integrative and Comparative Physiology, 293(5), R2036-2045. doi:10.1152/ajpregu.00442.2007
Amann, M., Romer, L. M., Pegelow, D. F., Jacques, A. J., Hess, C. J., & Dempsey, J. A. (2006). Effects of arterial oxygen content on peripheral locomotor muscle fatigue. Journal of Applied Physiology, 101(1), 119-127. doi:10.1152/japplphysiol.01596.2005
Amann, M., Romer, L. M., Subudhi, A. W., Pegelow, D. F., & Dempsey, J. A. (2007). Severity of arterial hypoxaemia affects the relative contributions of peripheral muscle fatigue to exercise performance in healthy humans. The Journal of Physiology, 581(Pt 1), 389-403. doi:10.1113/jphysiol.2007.129700
Andersen, P., & Saltin, B. (1985). Maximal perfusion of skeletal muscle in man. The Journal of Physiology, 366, 233-249.
Archiza, B., Andaku, D. K., Caruso, F. C. R., Bonjorno, J. C., Jr., Oliveira, C. R., Ricci, P. A., . . . Borghi-Silva, A. (2017). Effects of inspiratory muscle training in professional women football players: a randomized sham-controlled trial. Journal of Sports Sciences, 1-10. doi:10.1080/02640414.2017.1340659
Asmussen, E., Johansen, S. H., Jørgensen, M., & Nielsen, M. (1965). On the Nervous Factors Controlling Respiration and Circulation during Exercise Experiments with curarization. Acta Physiologica Scandinavica, 63(3), 343-350. doi:10.1111/j.1748-1716.1965.tb04073.x
Asmussen, E., & Nielsen, M. (1957). Ventilatory response to CO2 during work at normal and at low oxygen tensions. Acta Physiologica Scandinavica, 39(1), 27-35. doi:10.1111/j.1748-1716.1957.tb01406.x
Astrup, P., Engel, K., Severinghaus, J. W., & Munson, E. (1965). The influence of temperature and pH on the dissociation curve of oxyhemoglobin of human blood. Scandinavian Journal of Clinical and Laboratory Investigation, 17(6), 515-523. doi:10.1080/00365516509083359

References
∼ 185 ∽
Babcock, M. A., Johnson, B. D., Pegelow, D. F., Suman, O. E., Griffin, D., & Dempsey, J. A. (1995). Hypoxic effects on exercise-induced diaphragmatic fatigue in normal healthy humans. Journal of Applied Physiology, 78(1), 82-92. doi:10.1152/jappl.1995.78.1.82
Babcock, M. A., Pegelow, D. F., McClaran, S. R., Suman, O. E., & Dempsey, J. A. (1995). Contribution of diaphragmatic power output to exercise-induced diaphragm fatigue. Journal of Applied Physiology, 78(5), 1710-1719.
Bahr, R., Gronnerod, O., & Sejersted, O. M. (1992). Effect of supramaximal exercise on excess postexercise O2 consumption. Medicine and Science in Sports and Exercise, 24(1), 66-71.
Bailey, S. J., Romer, L. M., Kelly, J., Wilkerson, D. P., DiMenna, F. J., & Jones, A. M. (2010). Inspiratory muscle training enhances pulmonary O2 uptake kinetics and high-intensity exercise tolerance in humans. Journal of Applied Physiology, 109(2), 457-468. doi:10.1152/japplphysiol.00077.2010
Baker, J. S., McCormick, M. C., & Robergs, R. A. (2010). Interaction among Skeletal Muscle Metabolic Energy Systems during Intense Exercise. J Nutr Metab, 2010, 905612. doi:10.1155/2010/905612
Balsom, P. D., Gaitanos, G. C., Ekblom, B., & Sjodin, B. (1994). Reduced oxygen availability during high intensity intermittent exercise impairs performance. Acta Physiologica Scandinavica, 152(3), 279-285. doi:10.1111/j.1748-1716.1994.tb09807.x
Balsom, P. D., Gaitanos, G. C., Soderlund, K., & Ekblom, B. (1999). High-intensity exercise and muscle glycogen availability in humans. Acta Physiologica Scandinavica, 165(4), 337-345. doi:10.1046/j.1365-201x.1999.00517.x
Batterham, A. M., & Hopkins, W. G. (2006). Making meaningful inferences about magnitudes. International Journal of Sports Physiology and Performance, 1(1), 50-57.
Benditt, J. O. (2005). Esophageal and Gastric Pressure Measurements. Respiratory Care, 50(1), 68-77.
Benesch, R., & Benesch, R. E. (1967). The effect of organic phosphates from the human erythrocyte on the allosteric properties of hemoglobin. Biochemical and Biophysical Research Communications, 26(2), 162-167.
Bergström, M., & Hultman, E. (1991). Relaxation and force during fatigue and recovery of the human quadriceps muscle: relations to metabolite changes. Pflügers Archiv, 418(1-2), 153-160. doi:10.1007/BF00370464
Respiratory Muscle Work and Tissue Oxygenation Trends During Repeated-sprint Exercise
∼ 186 ∽
Bernasconi, P., & Kohl, J. (1993). Analysis of co-ordination between breathing and exercise rhythms in man. J Physiol, 471, 693-706.
Bessman, S. P., & Carpenter, C. L. (1985). The creatine-creatine phosphate energy shuttle. Annu Rev Biochem, 54, 831-862. doi:10.1146/annurev.bi.54.070185.004151
Billaut, F., & Buchheit, M. (2013). Repeated-sprint performance and vastus lateralis oxygenation: Effect of limited O2 availability. Scandinavian Journal of Medicine and Science in Sports, 23(3), 185-193. doi:10.1111/sms.12052
Billaut, F., Kerris, J. P., Rodriguez, R. F., Martin, D. T., Gore, C. J., & Bishop, D. J. (2013). Interaction of central and peripheral factors during repeated sprints at different levels of arterial O2 saturation. PLoS One, 8(10), e77297. doi:10.1371/journal.pone.0077297
Biro, G. P. (2013). From the Atmosphere to the Mitochondrion: The Oxygen Cascade. In H. W. Kim & A. G. Greenburg (Eds.), Hemoglobin-Based Oxygen Carriers as Red Cell Substitutes and Oxygen Therapeutics (pp. 27-53). Berlin, Heidelberg: Springer Berlin Heidelberg.
Bishop, D. J., Edge, J., & Goodman, C. (2004). Muscle buffer capacity and aerobic fitness are associated with repeated-sprint ability in women. European Journal of Applied Physiology, 92(4), 540-547. doi:10.1007/s00421-004-1150-1
Bishop, D. J., Granata, C., & Eynon, N. (2014). Can we optimise the exercise training prescription to maximise improvements in mitochondria function and content? Biochimica et Biophysica Acta - General Subjects, 1840(4), 1266-1275. doi:10.1016/j.bbagen.2013.10.012
Bogdanis, G. C., Nevill, M. E., Boobis, L. H., & Lakomy, H. K. (1996). Contribution of phosphocreatine and aerobic metabolism to energy supply during repeated sprint exercise. Journal of Applied Physiology, 80(3), 876-884.
Bogdanis, G. C., Nevill, M. E., Lakomy, H. K., & Boobis, L. H. (1998). Power output and muscle metabolism during and following recovery from 10 and 20 s of maximal sprint exercise in humans. Acta Physiologica Scandinavica, 163(3), 261-272.
Bohr, C., Hasselbalch, K., & Krogh, A. (1904). Uber einen in biologischer Beziehung wichtigen Einfluss, den die Kohlensäurespannung des Blutes auf dessen Sauerstoffbindung übt. [Concerning a Biologically Important Relationship - The Influence of the Carbon Dioxide Content of Blood on its Oxygen Binding]. Acta Physiologica Scandinavica, 16(2), 402-412. doi:10.1111/j.1748-1716.1904.tb01382.x

References
∼ 187 ∽
Boushel, R., & Piantadosi, C. A. (2000). Near-infrared spectroscopy for monitoring muscle oxygenation. Acta Physiologica Scandinavica, 168(4), 615-622. doi:10.1046/j.1365-201x.2000.00713.x
Boutellier, U., Büchel, R., Kundert, A., & Spengler, C. (1992). The respiratory system as an exercise limiting factor in normal trained subjects. European Journal of Applied Physiology and Occupational Physiology, 65(4), 347-353.
Bowtell, J. L., Cooke, K., Turner, R., Mileva, K. N., & Sumners, D. P. (2014). Acute physiological and performance responses to repeated sprints in varying degrees of hypoxia. Journal of Science and Medicine in Sport, 17(4), 399-403. doi:10.1016/j.jsams.2013.05.016
Boyle, R. (1662). New Experiments Physico-Mechanical, Touching the Air: Whereunto is Added A Defence of the Authors Explication of the Experiments, Against the Obiections of Franciscus Linus, and, Thomas Hobbes.: H. Hall for T. Robinson, Oxford.
Buchheit, M., Cormie, P., Abbiss, C. R., Ahmaidi, S., Nosaka, K. K., & Laursen, P. B. (2009). Muscle deoxygenation during repeated sprint running: Effect of active vs. passive recovery. International Journal of Sports Medicine, 30(6), 418-425. doi:10.1055/s-0028-1105933
Buchheit, M., Hader, K., & Mendez-Villanueva, A. (2012). Tolerance to high-intensity intermittent running exercise: do oxygen uptake kinetics really matter? Frontiers in Physiology, 3, 406. doi:10.3389/fphys.2012.00406
Buchheit, M., & Ufland, P. (2011). Effect of endurance training on performance and muscle reoxygenation rate during repeated-sprint running. European Journal of Applied Physiology, 111(2), 293-301. doi:10.1007/s00421-010-1654-9
Burnley, M., Doust, J. H., & Vanhatalo, A. (2006). A 3-min all-out test to determine peak oxygen uptake and the maximal steady state. Medicine and Science in Sports and Exercise, 38(11), 1995-2003. doi:10.1249/01.mss.0000232024.06114.a6
Calbet, J. A. L., Jensen-Urstad, M., van Hall, G., Holmberg, H. C., Rosdahl, H., & Saltin, B. (2004). Maximal muscular vascular conductances during whole body upright exercise in humans. The Journal of Physiology, 558(1), 319-331. doi:10.1113/jphysiol.2003.059287
Calbet, J. A. L., & Lundby, C. (2012). Skeletal muscle vasodilatation during maximal exercise in health and disease. The Journal of Physiology, 590(24), 6285-6296. doi:10.1113/jphysiol.2012.241190

Respiratory Muscle Work and Tissue Oxygenation Trends During Repeated-sprint Exercise
∼ 188 ∽
Calbet, J. A. L., Rådegran, G., Boushel, R., & Saltin, B. (2009). On the mechanisms that limit oxygen uptake during exercise in acute and chronic hypoxia: role of muscle mass. The Journal of Physiology, 587(2), 477-490. doi:10.1113/jphysiol.2008.162271
Casaburi, R., Whipp, B. J., Wasserman, K., Beaver, W. L., & Koyal, S. N. (1977). Ventilatory and gas exchange dynamics in response to sinusoidal work. Journal of Applied Physiology, 42(2), 300-301.
Cheng, C. F., Tong, T. K., Kuo, Y. C., Chen, P. H., Huang, H. W., & Lee, C. L. (2013). Inspiratory muscle warm-up attenuates muscle deoxygenation during cycling exercise in women athletes. Respiratory Physiology and Neurobiology, 186(3), 296-302. doi:10.1016/j.resp.2013.02.029
Christoforides, C., Laasberg, L. H., & Hedley-Whyte, J. (1969). Effect of temperature on solubility of O2 in human plasma. Journal of Applied Physiology, 26(1), 56-60.
Cibella, F., Cuttitta, G., Kayser, B., Narici, M., Romano, S., & Saibene, F. (1996). Respiratory mechanics during exhaustive submaximal exercise at high altitude in healthy humans. The Journal of Physiology, 494(3), 881-890.
Cohen, J. (1988). Statistical power analysis for the behavioral sciencies: Routledge.
Collins, J.-A., Rudenski, A., Gibson, J., Howard, L., & O’Driscoll, R. (2015). Relating oxygen partial pressure, saturation and content: the haemoglobin–oxygen dissociation curve. Breathe, 11(3), 194-201. doi:10.1183/20734735.001415
Comroe, J. H. (1939). The location and function of the chemoreceptors of the aorta. American Heart Journal, 18(4), 504-505. doi:10.1016/S0002-8703(39)90679-4
Costes, F., Barthelemy, J. C., Feasson, L., Busso, T., Geyssant, A., & Denis, C. (1996). Comparison of muscle near-infrared spectroscopy and femoral blood gases during steady-state exercise in humans. Journal of Applied Physiology, 80(4), 1345-1350. doi:10.1152/jappl.1996.80.4.1345
da Silva, J. F., Guglielmo, L. G., & Bishop, D. J. (2010). Relationship between different measures of aerobic fitness and repeated-sprint ability in elite soccer players. Journal of Strength and Conditioning Research, 24(8), 2115-2121. doi:10.1519/JSC.0b013e3181e34794
Dawson, B., Goodman, C., Lawrence, S., Preen, D., Polglaze, T., Fitzimons, M., & Fournier, P. (1997). Muscle phosphocreatine repletion following single and repeated short sprint efforts. Scandinavian Journal of Medicine and Science in Sports, 7(4), 206-213. doi:10.1111/j.1600-0838.1997.tb00141.x
Dawson, B., & Trapp, R. G. (2004). Basic and clinical biostatistics (4th ed.). New York: Lange Medical Books/McGraw-Hill.

References
∼ 189 ∽
De Blasi, R. A., Cope, M., Elwell, C., Safoue, F., & Ferrari, M. (1993). Noninvasive measurement of human forearm oxygen consumption by near infrared spectroscopy. European Journal of Applied Physiology and Occupational Physiology, 67(1), 20-25. doi:10.1007/bf00377698
Dellweg, D., Haidl, P., Siemon, K., Appelhans, P., & Kohler, D. (2008). Impact of breathing pattern on work of breathing in healthy subjects and patients with COPD. Respiratory Physiology and Neurobiology, 161(2), 197-200. doi:10.1016/j.resp.2008.02.002
DeLorey, D. S., Kowalchuk, J. M., & Paterson, D. H. (2003). Relationship between pulmonary O2 uptake kinetics and muscle deoxygenation during moderate-intensity exercise. Journal of Applied Physiology, 95(1), 113-120. doi:10.1152/japplphysiol.00956.2002
Dempsey, J. A., Johnson, B. D., & Saupe, K. W. (1990). Adaptations and limitations in the pulmonary system during exercise. Chest, 97(3 Suppl), 81S-87S.
Dempsey, J. A., Romer, L., Rodman, J., Miller, J., & Smith, C. (2006). Consequences of exercise-induced respiratory muscle work. Respiratory Physiology and Neurobiology, 151(2-3), 242-250. doi:10.1016/j.resp.2005.12.015
Dempsey, J. A., & Wagner, P. D. (1999). Exercise-induced arterial hypoxemia. Journal of Applied Physiology, 87(6), 1997-2006. doi:10.1152/jappl.1999.87.6.1997
Dill, D. B., & Forbes, W. H. (1941). Respiratory and metabolic effects of hypothermia. American Journal of Physiology - Legacy Content, 132(3), 685-697. doi:10.1152/ajplegacy.1941.132.3.685
Dominelli, P. B., Render, J. N., Molgat-Seon, Y., Foster, G. E., Romer, L. M., & Sheel, A. W. (2015). Oxygen cost of exercise hyperpnoea is greater in women compared with men. The Journal of Physiology, 593(8), 1965-1979. doi:10.1113/jphysiol.2014.285965
Dominelli, P. B., Render, J. N., Molgat-Seon, Y., Foster, G. E., & Sheel, A. W. (2014). Precise mimicking of exercise hyperpnea to investigate the oxygen cost of breathing. Respiratory Physiology and Neurobiology, 201, 15-23. doi:doi.org/10.1016/j.resp.2014.06.010
Douglas, C. G., & Haldane, J. S. (1909). The regulation of normal breathing. The Journal of Physiology, 38(5), 420-440. doi:10.1113/jphysiol.1909.sp001315
Downey, A. E., Chenoweth, L. M., Townsend, D. K., Ranum, J. D., Ferguson, C. S., & Harms, C. A. (2007). Effects of inspiratory muscle training on exercise responses in normoxia and hypoxia. Respiratory Physiology and Neurobiology, 156(2), 137-146. doi:10.1016/j.resp.2006.08.006

Respiratory Muscle Work and Tissue Oxygenation Trends During Repeated-sprint Exercise
∼ 190 ∽
Dupont, G., Blondel, N., & Berthoin, S. (2003). Performance for short intermittent runs: active recovery vs. passive recovery. European Journal of Applied Physiology, 89(6), 548-554. doi:10.1007/s00421-003-0834-2
Dupont, G., Millet, G. P., Guinhouya, C., & Berthoin, S. (2005). Relationship between oxygen uptake kinetics and performance in repeated running sprints. European Journal of Applied Physiology, 95(1), 27-34. doi:10.1007/s00421-005-1382-8
Dupont, G., Moalla, W., Guinhouya, C., Ahmaidi, S., & Berthoin, S. (2004). Passive versus active recovery during high-intensity intermittent exercises. Medicine and Science in Sports and Exercise, 36(2), 302-308. doi:10.1249/01.mss.0000113477.11431.59
Edwards, A. M. (2013). Respiratory muscle training extends exercise tolerance without concomitant change to peak oxygen uptake: Physiological, performance and perceptual responses derived from the same incremental exercise test. Respirology, 18(6), 1022-1027. doi:10.1111/resp.12100
el-Manshawi, A., Killian, K. J., Summers, E., & Jones, N. L. (1986). Breathlessness during exercise with and without resistive loading. Journal of Applied Physiology, 61(3), 896-905.
Eldridge, F. L., Millhorn, D. E., & Waldrop, T. G. (1981). Exercise hyperpnea and locomotion: parallel activation from the hypothalamus. Science, 211(4484), 844-846. doi:10.1126/science.7466362
Elmer, S. J., & Martin, J. C. (2009). Fourier Series Approximations and Low Pass Filtering: Facilitating Learning of Digital Signal Processing for Biomechanics Students. Sportscience, 13, 1-8.
Esaki, K., Hamaoka, T., Radegran, G., Boushel, R., Hansen, J., Katsumura, T., . . . Mizuno, M. (2005). Association between regional quadriceps oxygenation and blood oxygen saturation during normoxic one-legged dynamic knee extension. European Journal of Applied Physiology, 95(4), 361-370. doi:10.1007/s00421-005-0008-5
Esposito, F., Limonta, E., Alberti, G., Veicsteinas, A., & Ferretti, G. (2010). Effect of respiratory muscle training on maximum aerobic power in normoxia and hypoxia. Respiratory Physiology and Neurobiology, 170(3), 268-272. doi:10.1016/j.resp.2010.02.004
Eyzaguirre, C., & Koyano, H. (1965). Effects of hypoxia, hypercapnia, and pH on the chemoreceptor activity of the carotid body in vitro. The Journal of Physiology, 178(3), 385-409. doi:10.1113/jphysiol.1965.sp007634
References
∼ 191 ∽
Faiss, R., Leger, B., Vesin, J. M., Fournier, P. E., Eggel, Y., Deriaz, O., & Millet, G. P. (2013). Significant molecular and systemic adaptations after repeated sprint training in hypoxia. PLoS One, 8(2), e56522. doi:10.1371/journal.pone.0056522
Ferrari, M., Mottola, L., & Quaresima, V. (2004). Principles, techniques, and limitations of near infrared spectroscopy. Canadian journal of applied physiology, 29(4), 463-487. doi:10.1139/h04-031
Ferrari, M., Muthalib, M., & Quaresima, V. (2011). The use of near-infrared spectroscopy in understanding skeletal muscle physiology: recent developments. Philosophical Transactions. Series A, Mathematical, Physical, and Engineering Sciences, 369(1955), 4577-4590. doi:10.1098/rsta.2011.0230
Ferrari, M., & Quaresima, V. (2012). A brief review on the history of human functional near-infrared spectroscopy (fNIRS) development and fields of application. Neuroimage, 63(2), 921-935. doi:10.1016/j.neuroimage.2012.03.049
Fick, A. (1870). Über die messung des blutquantums in den herzevent rikeln. [Concerning the Measurement of Blood Quantum in the Cardiac Ventricles]. Sitzber Physik-Med Ges Wurzburg(36).
Forster, H. V., Dunning, M. B., Lowry, T. F., Erickson, B. K., Forster, M. A., Pan, L. G., . . . Effros, R. M. (1993). Effect of asthma and ventilatory loading on arterial PCO2 of humans during submaximal exercise. Journal of Applied Physiology, 75(3), 1385-1394.
Forster, H. V., Haouzi, P., & Dempsey, J. A. (2012). Control of breathing during exercise. Comprehensive Physiology, 2(1), 743-777. doi:10.1002/cphy.c100045
Forster, H. V., Pan, L. G., & Funahashi, A. (1986). Temporal pattern of arterial CO2 partial pressure during exercise in humans. Journal of Applied Physiology, 60(2), 653-660. doi:10.1152/jappl.1986.60.2.653
Foster, C. (1998). Monitoring training in athletes with reference to overtraining syndrome. Medicine and Science in Sports and Exercise, 30(7), 1164-1168. doi:10.1097/00005768-199807000-00023
Gaesser, G. A., & Brooks, G. A. (1984). Metabolic bases of excess post-exercise oxygen consumption: a review. Medicine and Science in Sports and Exercise, 16(1), 29-43.
Gaitanos, G. C., Williams, C., Boobis, L. H., & Brooks, S. (1993). Human muscle metabolism during intermittent maximal exercise. Journal of Applied Physiology, 75(2), 712-719. doi:10.1152/jappl.1993.75.2.712
Respiratory Muscle Work and Tissue Oxygenation Trends During Repeated-sprint Exercise
∼ 192 ∽
Galbo, H., Kjaer, M., & Secher, N. H. (1987). Cardiovascular, ventilatory and catecholamine responses to maximal dynamic exercise in partially curarized man. The Journal of Physiology, 389, 557-568. doi:10.1113/jphysiol.1987.sp016672
Galvin, H. M., Cooke, K., Sumners, D. P., Mileva, K. N., & Bowtell, J. L. (2013). Repeated sprint training in normobaric hypoxia. British Journal of Sports Medicine, 47(Suppl 1), i74-79. doi:10.1136/bjsports-2013-092826
Gething, A. D., Williams, M., & Davies, B. (2004). Inspiratory resistive loading improves cycling capacity: a placebo controlled trial. British Journal of Sports Medicine, 38(6), 730-736. doi:10.1136/bjsm.2003.007518
Gharbi, Z., Dardouri, W., Haj-Sassi, R., Chamari, K., & Souissi, N. (2015). Aerobic and anaerobic determinants of repeated sprint ability in team sports athletes. Biology of Sport, 32(3), 207-212. doi:10.5604/20831862.1150302
Girard, O., Bishop, D. J., & Racinais, S. (2013). Hot conditions improve power output during repeated cycling sprints without modifying neuromuscular fatigue characteristics. European Journal of Applied Physiology, 113(2), 359-369. doi:10.1007/s00421-012-2444-3
Girard, O., Brocherie, F., & Millet, G. P. (2017). Effects of Altitude/Hypoxia on Single- and Multiple-Sprint Performance: A Comprehensive Review. Sports Medicine, 1-19. doi:10.1007/s40279-017-0733-z
Glaister, M. (2005). Multiple sprint work: physiological responses, mechanisms of fatigue and the influence of aerobic fitness. Sports Medicine, 35(9), 757-777. doi:10.2165/00007256-200535090-00003
Gleser, M. A., Horstman, D. H., & Mello, R. P. (1974). The effect on Vo2 max of adding arm work to maximal leg work. Medicine and Science in Sports, 6(2), 104-107.
Goods, P. S., Dawson, B. T., Landers, G. J., Gore, C. J., & Peeling, P. (2014). Effect of Different Simulated Altitudes on Repeat Sprint Performance in Team Sport Athletes. International Journal of Sports Physiology and Performance, 9(5), 857-862. doi:10.1123/ijspp.2013-0423
Gotshall, R. W., Bauer, T. A., & Fahrner, S. L. (1996). Cycling cadence alters exercise hemodynamics. International Journal of Sports Medicine, 17(1), 17-21. doi:10.1055/s-2007-972802
Grassi, B., Pogliaghi, S., Rampichini, S., Quaresima, V., Ferrari, M., Marconi, C., & Cerretelli, P. (2003). Muscle oxygenation and pulmonary gas exchange kinetics during cycling exercise on-transitions in humans. Journal of Applied Physiology, 95(1), 149-158. doi:10.1152/japplphysiol.00695.2002

References
∼ 193 ∽
Grassi, B., Quaresima, V., Marconi, C., Ferrari, M., & Cerretelli, P. (1999). Blood lactate accumulation and muscle deoxygenation during incremental exercise. Journal of Applied Physiology, 87(1), 348-355.
Griffiths, L. A., & McConnell, A. K. (2007). The influence of inspiratory and expiratory muscle training upon rowing performance. European Journal of Applied Physiology, 99(5), 457-466. doi:10.1007/s00421-006-0367-6
Gudjonsdottir, M., Appendini, L., Baderna, P., Purro, A., Patessio, A., Vilianis, G., . . . Donner, C. F. (2001). Diaphragm fatigue during exercise at high altitude: the role of hypoxia and workload. European Respiratory Journal, 17(4), 674-680. doi:10.1183/09031936.01.17406740
Guenette, J. A., Witt, J. D., McKenzie, D. C., Road, J. D., & Sheel, A. W. (2007). Respiratory mechanics during exercise in endurance-trained men and women. The Journal of Physiology, 581(3), 1309-1322. doi:10.1113/jphysiol.2006.126466
Guimaraes-Ferreira, L. (2014). Role of the phosphocreatine system on energetic homeostasis in skeletal and cardiac muscles. Einstein (Sao Paulo), 12(1), 126-131. doi:10.1590/S1679-45082014RB2741
Hagberg, J. M., Coyle, E. F., Carroll, J. E., Miller, J. M., Martin, W. H., & Brooke, M. H. (1982). Exercise hyperventilation in patients with McArdle's disease. Journal of applied physiology: respiratory, environmental and exercise physiology, 52(4), 991-994. doi:10.1152/jappl.1982.52.4.991
Hamann, J. J., Kluess, H. A., Buckwalter, J. B., & Clifford, P. S. (2005). Blood flow response to muscle contractions is more closely related to metabolic rate than contractile work. Journal of Applied Physiology, 98(6), 2096-2100. doi:10.1152/japplphysiol.00400.2004
Haouzi, P., Chenuel, B., & Huszczuk, A. (2004). Sensing vascular distension in skeletal muscle by slow conducting afferent fibers: neurophysiological basis and implication for respiratory control. Journal of Applied Physiology, 96(2), 407-418. doi:10.1152/japplphysiol.00597.2003
Harms, C. A. (2000). Effect of skeletal muscle demand on cardiovascular function. Medicine and Science in Sports and Exercise, 32(1), 94-99.
Harms, C. A., Babcock, M. A., McClaran, S. R., Pegelow, D. F., Nickele, G. A., Nelson, W. B., & Dempsey, J. A. (1997). Respiratory muscle work compromises leg blood flow during maximal exercise. Journal of Applied Physiology, 82(5), 1573-1583. doi:10.1152/jappl.1997.82.5.1573

Respiratory Muscle Work and Tissue Oxygenation Trends During Repeated-sprint Exercise
∼ 194 ∽
Harms, C. A., & Stager, J. M. (1995). Low chemoresponsiveness and inadequate hyperventilation contribute to exercise-induced hypoxemia. Journal of Applied Physiology, 79(2), 575-580. doi:10.1152/jappl.1995.79.2.575
Harms, C. A., Wetter, T. J., McClaran, S. R., Pegelow, D. F., Nickele, G. A., Nelson, W. B., . . . Dempsey, J. A. (1998). Effects of respiratory muscle work on cardiac output and its distribution during maximal exercise. Journal of Applied Physiology, 85(2), 609-618. doi:10.1152/jappl.1998.85.2.609
Harms, C. A., Wetter, T. J., St Croix, C. M., Pegelow, D. F., & Dempsey, J. A. (2000). Effects of respiratory muscle work on exercise performance. Journal of Applied Physiology, 89(1), 131-138. doi:10.1152/jappl.2000.89.1.131
Harris, R. C., Edwards, R. H., Hultman, E., Nordesjö, L. O., Nylind, B., & Sahlin, K. (1976). The time course of phosphorylcreatine resynthesis during recovery of the quadriceps muscle in man. Pflügers Archiv, 367(2), 137-142. doi:10.1007/BF00585149
Haseler, L. J., Hogan, M. C., & Richardson, R. S. (1999). Skeletal muscle phosphocreatine recovery in exercise-trained humans is dependent on O2 availability. Journal of Applied Physiology, 86(6), 2013-2018. doi:10.1152/jappl.1999.86.6.2013
Haymans, C., & Neil, E. (1959). Reflexogenic Areas of the Cardiovascular System. Postgraduate Medical Journal, 35(401), 160-161. doi:10.1136/pgmj.35.401.160-a
Hellsten, Y., Nyberg, M., Jensen, L. G., & Mortensen, S. P. (2012). Vasodilator interactions in skeletal muscle blood flow regulation. The Journal of Physiology, 590(24), 6297-6305. doi:10.1113/jphysiol.2012.240762
Henke, K. G., Sharratt, M., Pegelow, D., & Dempsey, J. A. (1988). Regulation of end-expiratory lung volume during exercise. Journal of Applied Physiology, 64(1), 135-146. doi:10.1152/jappl.1988.64.1.135
Hey, E. N., Lloyd, B. B., Cunningham, D. J., Jukes, M. G., & Bolton, D. P. (1966). Effects of various respiratory stimuli on the depth and frequency of breathing in man. Respiration Physiology, 1(2), 193-205. doi:10.1016/0034-5687(66)90016-8
Higginbotham, M. B., Morris, K. G., Williams, R. S., McHale, P. A., Coleman, R. E., & Cobb, F. R. (1986). Regulation of stroke volume during submaximal and maximal upright exercise in normal man. Circ Res, 58(2), 281-291.
Higgins, M. F., James, R. S., & Price, M. J. (2014). Familiarisation to and reproducibility of cycling at 110% peak power output. The Journal of sports medicine and physical fitness, 54(2), 139-146.

References
∼ 195 ∽
Hill, A. V., Long, C. N. H., & Lupton, H. (1924). Muscular Exercise, Lactic Acid, and the Supply and Utilisation of Oxygen. Proceedings of the Royal Society of London. Series B, Containing Papers of a Biological Character, 96(679), 438-475.
Hill, J. M. (2000). Discharge of group IV phrenic afferent fibers increases during diaphragmatic fatigue. Brain Research, 856(1–2), 240-244. doi:10.1016/S0006-8993(99)02366-5
Hladky, S. B., & Barrand, M. A. (2016). Fluid and ion transfer across the blood–brain and blood–cerebrospinal fluid barriers; a comparative account of mechanisms and roles. Fluids and Barriers of the CNS, 13(1), 19. doi:10.1186/s12987-016-0040-3
Hogan, M. C., Richardson, R. S., & Haseler, L. J. (1999). Human muscle performance and PCr hydrolysis with varied inspired oxygen fractions: a 31P-MRS study. Journal of Applied Physiology, 86(4), 1367-1373. doi:10.1152/jappl.1999.86.4.1367
Hopkins, W. G. (2006a). Estimating sample size for magnitude-based inferences. Sportscience, 10, 63-70.
Hopkins, W. G. (2006b). Spreadsheets for analysis of controlled trials, with adjustment for a subject characteristic. Sportscience, 10, 46-50.
Hopkins, W. G., Marshall, S. W., Batterham, A. M., & Hanin, J. (2009). Progressive statistics for studies in sports medicine and exercise science. Medicine and Science in Sports and Exercise, 41(1), 3-13. doi:10.1249/MSS.0b013e31818cb278
Hughes, E. F., Turner, S. C., & Brooks, G. A. (1982). Effects of glycogen depletion and pedaling speed on "anaerobic threshold". Journal of applied physiology: respiratory, environmental and exercise physiology, 52(6), 1598-1607. doi:10.1152/jappl.1982.52.6.1598
Hultman, E., & Sahlin, K. (1980). Acid-base balance during exercise. Exerc Sport Sci Rev, 8(1), 41-128.
Hureau, T. J., Romer, L. M., & Amann, M. (2016). The ‘sensory tolerance limit’: A hypothetical construct determining exercise performance? European Journal of Sport Science, 1-12. doi:10.1080/17461391.2016.1252428
Ibañez, J., Rama, R., Riera, M., Prats, M. T., & Palacios, L. (1993). Severe hypoxia decreases oxygen uptake relative to intensity during submaximal graded exercise. European Journal of Applied Physiology and Occupational Physiology, 67(1), 7-13. doi:10.1007/bf00377696
Ihsan, M., Abbiss, C. R., Lipski, M., Buchheit, M., & Watson, G. (2013). Muscle oxygenation and blood volume reliability during continuous and intermittent running.

Respiratory Muscle Work and Tissue Oxygenation Trends During Repeated-sprint Exercise
∼ 196 ∽
International Journal of Sports Medicine, 34(07), 637-645. doi:10.1055/s-0032-1331771
Illi, S. K., Held, U., Frank, I., & Spengler, C. M. (2012). Effect of respiratory muscle training on exercise performance in healthy individuals: a systematic review and meta-analysis. Sports Medicine, 42(8), 707-724. doi:10.2165/11631670-000000000-00000
Innes, J. A., De Cort, S. C., Evans, P. J., & Guz, A. (1992). Central command influences cardiorespiratory response to dynamic exercise in humans with unilateral weakness. The Journal of Physiology, 448(1), 551-563. doi:0.1113/jphysiol.1992.sp019057
Jensen, F. B. (2004). Red blood cell pH, the Bohr effect, and other oxygenation-linked phenomena in blood O2 and CO2 transport. Acta Physiologica Scandinavica, 182(3), 215-227. doi:10.1111/j.1365-201X.2004.01361.x
Jensen, F. B. (2009). The dual roles of red blood cells in tissue oxygen delivery: oxygen carriers and regulators of local blood flow. The Journal of Experimental Biology, 212(21), 3387-3393. doi:10.1242/jeb.023697
Johnson, B. D., Babcock, M. A., Suman, O. E., & Dempsey, J. A. (1993). Exercise-induced diaphragmatic fatigue in healthy humans. The Journal of Physiology, 460(1), 385-405. doi:10.1113/jphysiol.1993.sp019477
Johnson, B. D., Saupe, K. W., & Dempsey, J. A. (1992). Mechanical constraints on exercise hyperpnea in endurance athletes. Journal of Applied Physiology, 73(3), 874-886. doi:10.1152/jappl.1992.73.3.874
Johnson, M. A., Sharpe, G. R., & Brown, P. I. (2007). Inspiratory muscle training improves cycling time-trial performance and anaerobic work capacity but not critical power. European Journal of Applied Physiology, 101(6), 761-770. doi:10.1007/s00421-007-0551-3
Jones, B., Hamilton, D. K., & Cooper, C. E. (2015). Muscle oxygen changes following sprint interval cycling training in elite field hockey players. PLoS One, 10(3), e0120338. doi:10.1371/journal.pone.0120338
Joyner, M. J., & Casey, D. P. (2014). Muscle blood flow, hypoxia, and hypoperfusion. Journal of Applied Physiology, 116(7), 852-857. doi:10.1152/japplphysiol.00620.2013
Joyner, M. J., & Casey, D. P. (2015). Regulation of Increased Blood Flow (Hyperemia) to Muscles During Exercise: A Hierarchy of Competing Physiological Needs. Physiol Rev, 95(2), 549-601. doi:10.1152/physrev.00035.2013

References
∼ 197 ∽
Joyner, M. J., & Wilkins, B. W. (2007). Exercise hyperaemia: is anything obligatory but the hyperaemia? The Journal of Physiology, 583(Pt 3), 855-860. doi:10.1113/jphysiol.2007.135889
Katayama, K., Suzuki, Y., Hoshikawa, M., Ohya, T., Oriishi, M., Itoh, Y., & Ishida, K. (2015). Hypoxia exaggerates inspiratory accessory muscle deoxygenation during hyperpnoea. Respiratory Physiology and Neurobiology, 211(0), 1-8. doi:10.1016/j.resp.2015.02.005
Kime, R., Hamaoka, T., Sako, T., Murakami, M., Homma, T., Katsumura, T., & Chance, B. (2003). Delayed reoxygenation after maximal isometric handgrip exercise in high oxidative capacity muscle. European Journal of Applied Physiology, 89(1), 34-41. doi:10.1007/s00421-002-0757-3
Knight, D. R., Poole, D. C., Schaffartzik, W., Guy, H. J., Prediletto, R., Hogan, M. C., & Wagner, P. D. (1992). Relationship between body and leg VO2 during maximal cycle ergometry. Journal of Applied Physiology, 73(3), 1114-1121. doi:10.1152/jappl.1992.73.3.1114
Koskolou, M. D., Calbet, J. A. L., Radegran, G., & Roach, R. C. (1997). Hypoxia and the cardiovascular response to dynamic knee-extensor exercise. American Journal of Physiology, 272(6 Pt 2), H2655-2663.
Kowalchuk, J. M., Rossiter, H. B., Ward, S. A., & Whipp, B. J. (2002). The effect of resistive breathing on leg muscle oxygenation using near-infrared spectroscopy during exercise in men. Experimental Physiology, 87(5), 601-611. doi:10.1113/eph8702456
Krogh, A., & Lindhard, J. (1913). The regulation of respiration and circulation during the initial stages of muscular work. The Journal of Physiology, 47(1-2), 112-136. doi:10.1113/jphysiol.1913.sp001616
Kuwahira, I., Gonzalez, N. C., Heisler, N., & Piiper, J. (1993). Changes in regional blood flow distribution and oxygen supply during hypoxia in conscious rats. Journal of Applied Physiology, 74(1), 211-214. doi:10.1152/jappl.1993.74.1.211
La Monica, M. B., Fukuda, D. H., Beyer, K. S., Hoffman, M. W., Miramonti, A. A., Riffe, J. J., . . . Stout, J. R. (2016). Altering Work to Rest Ratios Differentially Influences Fatigue Indices During Repeated Sprint Ability Testing. Journal of Strength and Conditioning Research, 30(2), 400-406. doi:10.1519/jsc.0000000000001122
Lahiri, S., & DeLaney, R. G. (1975). Stimulus interaction in the responses of carotid body chemoreceptor single afferent fibers. Respiration Physiology, 24(3), 249-266. doi:10.1016/0034-5687(75)90017-1

Respiratory Muscle Work and Tissue Oxygenation Trends During Repeated-sprint Exercise
∼ 198 ∽
Lahiri, S., & Forster, R. E., 2nd. (2003). CO2/H(+) sensing: peripheral and central chemoreception. The International Journal of Biochemistry and Cell Biology, 35(10), 1413-1435. doi:10.1016/S1357-2725(03)00050-5
Lahiri, S., Mokashi, A., Mulligan, E., & Nishino, T. (1981). Comparison of aortic and carotid chemoreceptor responses to hypercapnia and hypoxia. Journal of applied physiology: respiratory, environmental and exercise physiology, 51(1), 55-61. doi:10.1152/jappl.1981.51.1.55
Lamarra, N., Whipp, B. J., Ward, S. A., & Wasserman, K. (1987). Effect of interbreath fluctuations on characterizing exercise gas exchange kinetics. Journal of Applied Physiology, 62(5), 2003-2012. doi:10.1152/jappl.1987.62.5.2003
Leddy, J. J., Limprasertkul, A., Patel, S., Modlich, F., Buyea, C., Pendergast, D. R., & Lundgren, C. E. G. (2007). Isocapnic hyperpnea training improves performance in competitive male runners. European Journal of Applied Physiology, 99(6), 665-676. doi:10.1007/s00421-006-0390-7
Legrand, R., Ahmaidi, S., Moalla, W., Chocquet, D., Marles, A., Prieur, F., & Mucci, P. (2005). O2 arterial desaturation in endurance athletes increases muscle deoxygenation. Medicine and Science in Sports and Exercise, 37(5), 782-788. doi:10.1249/01.MSS.0000161806.47058.40
Legrand, R., Marles, A., Prieur, F., Lazzari, S., Blondel, N., & Mucci, P. (2007). Related trends in locomotor and respiratory muscle oxygenation during exercise. Medicine and Science in Sports and Exercise, 39(1), 91-100. doi:10.1249/01.mss.0000241638.90348.67
Loat, C. E., & Rhodes, E. C. (1993). Relationship between the lactate and ventilatory thresholds during prolonged exercise. Sports Medicine, 15(2), 104-115. doi:10.2165/00007256-199315020-00004
Lomax, M. (2010). Inspiratory muscle training, altitude, and arterial oxygen desaturation: a preliminary investigation. Aviation, Space, and Environmental Medicine, 81(5), 498-501. doi:10.3357/ASEM.2718.2010
Lomax, M., Grant, I., & Corbett, J. (2011). Inspiratory muscle warm-up and inspiratory muscle training: separate and combined effects on intermittent running to exhaustion. Journal of Sports Sciences, 29(6), 563-569. doi:10.1080/02640414.2010.543911
Lomax, M., Massey, H. C., & House, J. R. (2017). Inspiratory Muscle Training Effects on Cycling During Acute Hypoxic Exposure. Aerospace medicine and human performance, 88(6), 544-549. doi:10.3357/amhp.4780.2017

References
∼ 199 ∽
Lucia, A., Sanchez, O., Carvajal, A., & Chicharro, J. L. (1999). Analysis of the aerobic-anaerobic transition in elite cyclists during incremental exercise with the use of electromyography. British Journal of Sports Medicine, 33(3), 178-185. doi:10.1136/bjsm.33.3.178
Mairbäurl, H. (1994). Red blood cell function in hypoxia at altitude and exercise. International Journal of Sports Medicine, 15(2), 51-63. doi:10.1055/s-2007-1021020
Mairbäurl, H. (2013). Red blood cells in sports: effects of exercise and training on oxygen supply by red blood cells. Frontiers in Physiology, 4, 332. doi:10.3389/fphys.2013.00332
Mancini, D. M., Ferraro, N., Nazzaro, D., Chance, B., & Wilson, J. R. (1991). Respiratory muscle deoxygenation during exercise in patients with heart failure demonstrated with near-infrared spectroscopy. Journal of the American College of Cardiology, 18(2), 492-498. doi:10.1016/0735-1097(91)90605-9
Margaria, R., Milic-Emili, G., Petit, J. M., & Cavagna, G. (1960). Mechanical work of breathing during muscular exercise. Journal of Applied Physiology, 15, 354-358. doi:10.1152/jappl.1960.15.3.354
Markov, G., Spengler, C. M., Knöpfli-Lenzin, C., Stuessi, C., & Boutellier, U. (2001). Respiratory muscle training increases cycling endurance without affecting cardiovascular responses to exercise. European Journal of Applied Physiology, 85(3-4), 233-239. doi:10.1007/s004210100450
Martin, D., & O'Kroy, J. (1993). Effects of acute hypoxia on the VO2 max of trained and untrained subjects. Journal of Sports Sciences, 11(1), 37-42. doi:10.1080/02640419308729961
Mateika, J. H., & Duffin, J. (1994). The ventilation, lactate and electromyographic thresholds during incremental exercise tests in normoxia, hypoxia and hyperoxia. European Journal of Applied Physiology and Occupational Physiology, 69(2), 110-118. doi:10.1007/BF00609402
Matsushita, K., Homma, S., & Okada, E. (1998). Influence of adipose tissue on muscle oxygenation measurement with an NIRS instrument. Paper presented at the BiOS Europe '97.
Mazzeo, R. S. (2008). Physiological Responses to Exercise at Altitude. Sports Medicine, 38(1), 1-8. doi:10.2165/00007256-200838010-00001
McAllister, R. M. (1998). Adaptations in control of blood flow with training: splanchnic and renal blood flows. Medicine and Science in Sports and Exercise, 30(3), 375-381. doi:10.1097/00005768-199803000-00006

Respiratory Muscle Work and Tissue Oxygenation Trends During Repeated-sprint Exercise
∼ 200 ∽
McConnell, A. K., & Lomax, M. (2006). The influence of inspiratory muscle work history and specific inspiratory muscle training upon human limb muscle fatigue. The Journal of Physiology, 577(Pt 1), 445-457. doi:10.1113/jphysiol.2006.117614
McConnell, A. K., & Romer, L. M. (2004a). Dyspnoea in health and obstructive pulmonary disease : the role of respiratory muscle function and training. Sports Medicine, 34(2), 117-132. doi:doi.org/10.2165/00007256-200434020-00005
McConnell, A. K., & Romer, L. M. (2004b). Respiratory muscle training in healthy humans: resolving the controversy. International Journal of Sports Medicine, 25(4), 284-293. doi:10.1055/s-2004-815827
McGawley, K., & Bishop, D. (2006). Reliability of a 5 × 6-s maximal cycling repeated-sprint test in trained female team-sport athletes. European Journal of Applied Physiology, 98(4), 383-393. doi:10.1007/s00421-006-0284-8
McGawley, K., & Bishop, D. J. (2015). Oxygen uptake during repeated-sprint exercise. Journal of Science and Medicine in Sport, 18(2), 214-218. doi:10.1016/j.jsams.2014.02.002
McLay, K. M., Fontana, F. Y., Nederveen, J. P., Guida, F. F., Paterson, D. H., Pogliaghi, S., & Murias, J. M. (2016). Vascular responsiveness determined by near-infrared spectroscopy measures of oxygen saturation. Experimental Physiology, 101(1), 34-40. doi:10.1113/EP085406
McMahon, M. E., Boutellier, U., Smith, R. M., & Spengler, C. M. (2002). Hyperpnea training attenuates peripheral chemosensitivity and improves cycling endurance. The Journal of Experimental Biology, 205(24), 3937-3943.
Mellemgaard, K. (1966). The Alveolar-Arterial Oxygen Difference: Its Size and Components in Normal Man. Acta Physiologica Scandinavica, 67(1), 10-20. doi:10.1111/j.1748-1716.1966.tb03281.x
Mendez-Villanueva, A., Edge, J., Suriano, R., Hamer, P., & Bishop, D. J. (2012). The recovery of repeated-sprint exercise is associated with PCr resynthesis, while muscle pH and EMG amplitude remain depressed. PLoS One, 7(12), e51977. doi:10.1371/journal.pone.0051977
Mendez-Villanueva, A., Hamer, P., & Bishop, D. J. (2007). Physical fitness and performance. Fatigue responses during repeated sprints matched for initial mechanical output. Medicine and Science in Sports and Exercise, 39(12), 2219-2225. doi:10.1249/mss.0b013e31815669dc
Mickleborough, T. D., Nichols, T., Lindley, M. R., Chatham, K., & Ionescu, A. A. (2010). Inspiratory flow resistive loading improves respiratory muscle function and

References
∼ 201 ∽
endurance capacity in recreational runners. Scandinavian Journal of Medicine and Science in Sports, 20(3), 458-468. doi:10.1111/j.1600-0838.2009.00951.x
Mickleborough, T. D., Stager, J. M., Chatham, K., Lindley, M. R., & Ionescu, A. A. (2008). Pulmonary adaptations to swim and inspiratory muscle training. European Journal of Applied Physiology, 103(6), 635. doi:10.1007/s00421-008-0759-x
Millet, G. P., Vleck, V. E., & Bentley, D. J. (2009). Physiological Differences Between Cycling and Running. Sports Medicine, 39(3), 179-206. doi:10.2165/00007256-200939030-00002
Millikan, G. A. (1939). Muscle hemoglobin. Physiol Rev, 19(4), 503-523. doi:10.1152/physrev.1939.19.4.503
Minahan, C., Sheehan, B., Doutreband, R., Kirkwood, T., Reeves, D., & Cross, T. (2015). Repeated-Sprint Cycling Does Not Induce Respiratory Muscle Fatigue in Active Adults: Measurements from The Powerbreathe® Inspiratory Muscle Trainer. Journal of Sports Science and Medicine, 14(1), 233-238.
Mitchell, R. A., Loeschcke, H. H., Severinghaus, J. W., Richardson, B. W., & Massion, W. H. (1963). Regions of respiratory chemosensitivity on the surface of the medulla. Annals of the New York Academy of Sciences, 109(1), 661-681. doi:10.1111/j.1749-6632.1963.tb13496.x
Moalla, W., Dupont, G., Berthoin, S., & Ahmaidi, S. (2005). Respiratory muscle deoxygenation and ventilatory threshold assessments using near infrared spectroscopy in children. International Journal of Sports Medicine, 26(7), 576-582. doi:10.1055/s-2004-830332
Morales-Alamo, D., Ponce-Gonzalez, J. G., Guadalupe-Grau, A., Rodriguez-Garcia, L., Santana, A., Cusso, M. R., . . . Calbet, J. A. L. (2012). Increased oxidative stress and anaerobic energy release, but blunted Thr172-AMPKalpha phosphorylation, in response to sprint exercise in severe acute hypoxia in humans. Journal of Applied Physiology, 113(6), 917-928. doi:10.1152/japplphysiol.00415.2012
Morgan, D. W., Kohrt, W. M., Bates, B. J., & Skinner, J. S. (1987). Effects of respiratory muscle endurance training on ventilatory and endurance performance of moderately trained cyclists. International Journal of Sports Medicine, 8(2), 88-93. doi:10.1055/s-2008-1025647
Morin, J. B., Bourdin, M., Edouard, P., Peyrot, N., Samozino, P., & Lacour, J. R. (2012). Mechanical determinants of 100-m sprint running performance. European Journal of Applied Physiology, 112(11), 3921-3930. doi:10.1007/s00421-012-2379-8
Respiratory Muscle Work and Tissue Oxygenation Trends During Repeated-sprint Exercise
∼ 202 ∽
Moritani, T., Muro, M., & Nagata, A. (1986). Intramuscular and surface electromyogram changes during muscle fatigue. Journal of Applied Physiology, 60(4), 1179-1185. doi:10.1152/jappl.1986.60.4.1179
Mortensen, S. P., Damsgaard, R., Dawson, E. A., Secher, N. H., & Gonzalez-Alonso, J. (2008). Restrictions in systemic and locomotor skeletal muscle perfusion, oxygen supply and VO2 during high-intensity whole-body exercise in humans. The Journal of Physiology, 586(10), 2621-2635. doi:10.1113/jphysiol.2007.149401
Næraa, N., Petersen, E. S., Boye, E., & Severinghaus, J. W. (1966). pH and Molecular CO2 Components of the Bohr Effect in Human Blood. Scandinavian Journal of Clinical and Laboratory Investigation, 18(1), 96-102. doi:10.3109/00365516609065612
Nattie, E., & Li, A. (2012). Central Chemoreceptors: Locations and Functions. Comprehensive Physiology, 2(1), 221-254. doi:10.1002/cphy.c100083
Newman, M. A., Tarpenning, K. M., & Marino, F. E. (2004). Relationships between isokinetic knee strength, single-sprint performance, and repeated-sprint ability in football players. Journal of Strength and Conditioning Research, 18(4), 867-872. doi:10.1519/13843.1
Nicks, C. R., Morgan, D. W., Fuller, D. K., & Caputo, J. L. (2009). The influence of respiratory muscle training upon intermittent exercise performance. International Journal of Sports Medicine, 30(1), 16-21. doi:10.1055/s-2008-1038794
Nielsen, H. B., Boesen, M., & Secher, N. H. (2001). Near-infrared spectroscopy determined brain and muscle oxygenation during exercise with normal and resistive breathing. Acta Physiologica Scandinavica, 171(1), 63-70. doi:10.1046/j.1365-201X.2001.00782.x
Noakes, T. D. (2011). Time to move beyond a brainless exercise physiology: the evidence for complex regulation of human exercise performance. Applied Physiology, Nutrition, and Metabolism, 36(1), 23-35. doi:10.1139/h10-082
Noakes, T. D., St Clair Gibson, A., & Lambert, E. V. (2005). From catastrophe to complexity: a novel model of integrative central neural regulation of effort and fatigue during exercise in humans: summary and conclusions. British Journal of Sports Medicine, 39(2), 120-124. doi:10.1136/bjsm.2003.010330
O'Regan, R. G., & Majcherczyk, S. (1982). Role of peripheral chemoreceptors and central chemosensitivity in the regulation of respiration and circulation. The Journal of Experimental Biology, 100, 23-40.
O’Driscoll, B. R., Howard, L. S., & Davison, A. G. (2008). BTS guideline for emergency oxygen use in adult patients. Thorax, 63(Suppl 6), vi1-vi68. doi:10.1136/thx.2008.102947

References
∼ 203 ∽
Ogata, H., Arimitsu, T., Matsuura, R., Yunoki, T., Horiuchi, M., & Yano, T. (2007). Relationship between oxygenation in inactive biceps brachii muscle and hyperventilation during leg cycling. Physiological Research, 56(1), 57-65.
Ohya, T., Aramaki, Y., & Kitagawa, K. (2013). Effect of duration of active or passive recovery on performance and muscle oxygenation during intermittent sprint cycling exercise. International Journal of Sports Medicine, 34(7), 616-622. doi:10.1055/s-0032-1331717
Ohya, T., Hagiwara, M., & Suzuki, Y. (2015). Inspiratory muscle warm-up has no impact on performance or locomotor muscle oxygenation during high-intensity intermittent sprint cycling exercise. SpringerPlus, 4(1), 1-11. doi:10.1186/s40064-015-1355-2
Orrey, S., Unger, M., & Hanekom, S. (2014). Correlation between diaphragm strength, endurance and muscular cross-sectional area. European Respiratory Journal, 44(Suppl 58), P4897.
Otis, A. B. (1954). The work of breathing. Physiol Rev, 34(3), 449-458. doi:10.1152/physrev.1954.34.3.449
Otis, A. B., Fenn, W. O., & Rahn, H. (1950). Mechanics of Breathing in Man. Journal of Applied Physiology, 2(11), 592-607. doi:10.1152/jappl.1950.2.11.592
Ozmen, T., Gunes, G. Y., Ucar, I., Dogan, H., & Gafuroglu, T. U. (2017). Effect of respiratory muscle training on pulmonary function and aerobic endurance in soccer players. The Journal of sports medicine and physical fitness, 57(5), 507-513. doi:10.23736/s0022-4707.16.06283-6
Parkes, M. J. (2013). Evaluating the Importance of the Carotid Chemoreceptors in Controlling Breathing during Exercise in Man. BioMed Research International, 2013, 893506. doi:10.1155/2013/893506
Parolin, M. L., Chesley, A., Matsos, M. P., Spriet, L. L., Jones, N. L., & Heigenhauser, G. J. F. (1999). Regulation of skeletal muscle glycogen phosphorylase and PDH during maximal intermittent exercise. American Journal of Physiology - Endocrinology and Metabolism, 277(5), E890-900. doi:10.1152/ajpendo.1999.277.5.E89
Paulson, O. B. (2002). Blood–brain barrier, brain metabolism and cerebral blood flow. European Neuropsychopharmacology, 12(6), 495-501. doi:https://doi.org/10.1016/S0924-977X(02)00098-6
Pellegrino, R., Violante, B., Nava, S., Rampulla, C., Brusasco, V., & Rodarte, J. R. (1993). Expiratory airflow limitation and hyperinflation during methacholine-induced bronchoconstriction. Journal of Applied Physiology, 75(4), 1720-1727. doi:10.1152/jappl.1993.75.4.1720

Respiratory Muscle Work and Tissue Oxygenation Trends During Repeated-sprint Exercise
∼ 204 ∽
Peltonen, J. E., Hägglund, H., Koskela-Koivisto, T., Koponen, A. S., Aho, J. M., Rissanen, A. P. E., . . . Tikkanen, H. O. (2013). Alveolar gas exchange, oxygen delivery and tissue deoxygenation in men and women during incremental exercise. Respiratory Physiology and Neurobiology(0). doi:10.1016/j.resp.2013.05.014
Polkey, M. I., Kyroussis, D., Hamnegard, C. H., Mills, G. H., Green, M., & Moxham, J. (1996). Quadriceps strength and fatigue assessed by magnetic stimulation of the femoral nerve in man. Muscle and Nerve, 19(5), 549-555. doi:10.1002/(SICI)1097-4598(199605)19:5<549::AID-MUS1>3.0.CO;2-B
Poortmans, J. R. (1984). Exercise and renal function. Sports Medicine, 1(2), 125-153. doi:10.2165/00007256-198401020-00003
Porcari, J. P., Probst, L., Forrester, K., Doberstein, S., Foster, C., Cress, M. L., & Schmidt, K. (2016). Effect of Wearing the Elevation Training Mask on Aerobic Capacity, Lung Function, and Hematological Variables. Journal of Sports Science and Medicine, 15(2), 379-386.
R Core Team. (2016). R: A language and environment for statistical computing (Version 1.0.136). Vienna, Austria: R Foundation for Statistical Computing. Retrieved from http://www.R-project.org/
Racinais, S., Bishop, D. J., Denis, R., Lattier, G., Mendez-Villaneuva, A., & Perrey, S. (2007). Muscle deoxygenation and neural drive to the muscle during repeated sprint cycling. Medicine and Science in Sports and Exercise, 39(2), 268-274. doi:10.1249/01.mss.0000251775.46460.cb
Raichle, M. E., & Plum, F. (1972). Hyperventilation and Cerebral Blood Flow. Stroke, 3(5), 566-575. doi:10.1161/01.str.3.5.566
Raine, J. M., & Bishop, J. (1963). Aa difference in O 2 tension and physiological dead space in normal man. Journal of Applied Physiology, 18(2), 284-288. doi:10.1152/jappl.1963.18.2.284
Ratnovsky, A., Elad, D., & Halpern, P. (2008). Mechanics of respiratory muscles. Respiratory Physiology and Neurobiology, 163(1-3), 82-89. doi:10.1016/j.resp.2008.04.019
Reeves, J. T., Welsh, C. H., & Wagner, P. D. (1994). The heart and lungs at extreme altitude. Thorax, 49(7), 631. doi:10.1136/thx.49.7.631
Reglin, B., & Pries, A. R. (2014). Metabolic control of microvascular networks: oxygen sensing and beyond. Journal of Vascular Research, 51(5), 376-392. doi:10.1159/000369460

References
∼ 205 ∽
Richardson, R. S., Kennedy, B., Knight, D. R., & Wagner, P. D. (1995). High muscle blood flows are not attenuated by recruitment of additional muscle mass. American Journal of Physiology - Heart and Circulatory Physiology, 269(5), H1545-H1552. doi:10.1152/ajpheart.1995.269.5.H1545
Richardson, R. S., Poole, D. C., Knight, D. R., Kurdak, S. S., Hogan, M. C., Grassi, B., . . . Wagner, P. D. (1993). High muscle blood flow in man: is maximal O2 extraction compromised? Journal of Applied Physiology, 75(4), 1911-1916. doi:10.1152/jappl.1993.75.4.1911
Robertson, D. G., & Dowling, J. J. (2003). Design and responses of Butterworth and critically damped digital filters. Journal of Electromyography and Kinesiology, 13(6), 569-573. doi:10.1016/S1050-6411(03)00080-4
Rodman, J. R., Henderson, K. S., Smith, C. A., & Dempsey, J. A. (2003). Cardiovascular effects of the respiratory muscle metaboreflexes in dogs: rest and exercise. Journal of Applied Physiology, 95(3), 1159-1169. doi:10.1152/japplphysiol.00258.2003
Rodriguez, R. F., Townsend, N. E., Aughey, R. J., & Billaut, F. (2018). Influence of averaging method on muscle deoxygenation interpretation during repeated-sprint exercise. Scandinavian Journal of Medicine and Science in Sports, 28(11), 2263-2271. doi:10.1111/sms.13238
Romer, L. M., Haverkamp, H. C., Lovering, A. T., Pegelow, D. F., & Dempsey, J. A. (2006). Effect of exercise-induced arterial hypoxemia on quadriceps muscle fatigue in healthy humans. American Journal of Physiology - Regulatory, Integrative and Comparative Physiology, 290(2), R365-R375. doi:10.1152/ajpregu.00332.2005
Romer, L. M., Lovering, A. T., Haverkamp, H. C., Pegelow, D. F., & Dempsey, J. A. (2006). Effect of inspiratory muscle work on peripheral fatigue of locomotor muscles in healthy humans. The Journal of Physiology, 571(Pt 2), 425-439. doi:10.1113/jphysiol.2005.099697
Romer, L. M., McConnell, A. K., & Jones, D. A. (2002a). Effects of inspiratory muscle training on time-trial performance in trained cyclists. Journal of Sports Sciences, 20(7), 547-562. doi:10.1080/026404102760000053
Romer, L. M., McConnell, A. K., & Jones, D. A. (2002b). Effects of inspiratory muscle training upon recovery time during high intensity, repetitive sprint activity. International Journal of Sports Medicine, 23(5), 353-360. doi:10.1055/s-2002-33143
Romer, L. M., McConnell, A. K., & Jones, D. A. (2002c). Inspiratory muscle fatigue in trained cyclists: effects of inspiratory muscle training. Medicine and Science in Sports and Exercise, 34(5), 785-792. doi:10.1097/00005768-200205000-00010
Respiratory Muscle Work and Tissue Oxygenation Trends During Repeated-sprint Exercise
∼ 206 ∽
Romer, L. M., & Polkey, M. I. (2008). Exercise-induced respiratory muscle fatigue: implications for performance. Journal of Applied Physiology, 104(3), 879-888. doi:10.1152/japplphysiol.01157.2007
Rossiter, H. B., Howe, F. A., Ward, S. A., Kowalchuk, J. M., Griffiths, J. R., & Whipp, B. J. (2000). Intersample fluctuations in phosphocreatine concentration determined by 31P-magnetic resonance spectroscopy and parameter estimation of metabolic responses to exercise in humans. The Journal of Physiology, 528 Pt 2, 359-369. doi:10.1111/j.1469-7793.2000.t01-1-00359.x
Rowell, L. B., Blackmon, J. R., Kenny, M. A., & Escourrou, P. (1984). Splanchnic vasomotor and metabolic adjustments to hypoxia and exercise in humans. American Journal of Physiology, 247(2), H251-258. doi:10.1152/ajpheart.1984.247.2.H251
Rowell, L. B., Saltin, B., Kiens, B., & Christensen, N. J. (1986). Is peak quadriceps blood flow in humans even higher during exercise with hypoxemia? American Journal of Physiology - Heart and Circulatory Physiology, 251(5), H1038-H1044. doi:10.1152/ajpheart.1986.251.5.H1038
Sahlin, K., Harris, R. C., & Hultman, E. (1979). Resynthesis of creatine phosphate in human muscle after exercise in relation to intramuscular pH and availability of oxygen. Scandinavian Journal of Clinical and Laboratory Investigation, 39(6), 551-558. doi:10.3109/00365517909108833
Salazar-Martínez, E., Gatterer, H., Burtscher, M., Naranjo Orellana, J., & Santalla, A. (2017). Influence of Inspiratory Muscle Training on Ventilatory Efficiency and Cycling Performance in Normoxia and Hypoxia. Frontiers in Physiology, 8(133). doi:10.3389/fphys.2017.00133
Saltin, B. (1985). Hemodynamic adaptations to exercise. The American Journal of Cardiology, 55(10), D42-D47. doi:10.1016/0002-9149(85)91054-9
Saltin, B., Radegran, G., Koskolou, M. D., & Roach, R. C. (1998). Skeletal muscle blood flow in humans and its regulation during exercise. Acta Physiologica Scandinavica, 162(3), 421-436. doi:10.1046/j.1365-201X.1998.0293e.x
Sandbakk, Ø., Skalvik, T. F., Spencer, M., van Beekvelt, M., Welde, B., Hegge, A. M., . . . Ettema, G. (2015). The physiological responses to repeated upper-body sprint exercise in highly trained athletes. European Journal of Applied Physiology, 115(6), 1381-1391. doi:10.1007/s00421-015-3128-6
Schlattner, U., Tokarska-Schlattner, M., & Wallimann, T. (2006). Mitochondrial creatine kinase in human health and disease. Biochimica et biophysica acta, 1762(2), 164-180. doi:10.1016/j.bbadis.2005.09.004

References
∼ 207 ∽
Schlichthärle, D. (2011). Digital filters. basics and design (2nd ed.). Berlin; Heidelberg; New York: Springer.
Schmidt, C. F., & Comroe, J. H. (1940). The functions of the carotid and aortic bodies. The Journal of Laboratory and Clinical Medicine, 26(1), 223-231. doi:10.5555/uri:pii:S002221434090703X
Secher, N. H., Clausen, J. P., Klausen, K., Noer, I., & Trap-Jensen, J. (1977). Central and regional circulatory effects of adding arm exercise to leg exercise. Acta Physiologica Scandinavica, 100(3), 288-297. doi:10.1111/j.1748-1716.1977.tb05952.x
Secher, N. H., & Volianitis, S. (2006). Are the arms and legs in competition for cardiac output? Medicine and Science in Sports and Exercise, 38(10), 1797-1803. doi:10.1249/01.mss.0000230343.64000.ac
Segizbaeva, M. O., Timofeev, N. N., Donina Zh, A., Kur'yanovich, E. N., & Aleksandrova, N. P. (2015). Effects of inspiratory muscle training on resistance to fatigue of respiratory muscles during exhaustive exercise. Advances in Experimental Medicine and Biology, 840, 35-43. doi:10.1007/5584_2014_20
Sellers, J. H., Monaghan, T. P., Schnaiter, J. A., Jacobson, B. H., & Pope, Z. K. (2016). Efficacy of a Ventilatory Training Mask to Improve Anaerobic and Aerobic Capacity in Reserve Officers' Training Corps Cadets. Journal of Strength and Conditioning Research, 30(4), 1155-1160. doi:10.1519/jsc.0000000000001184
Shahin, B., Germain, M., Kazem, A., & Annat, G. (2008). Benefits of short inspiratory muscle training on exercise capacity, dyspnea, and inspiratory fraction in COPD patients. International Journal of Chronic Obstructive Pulmonary Disease, 3(3), 423-427. doi:10.2147/COPD.S1822
Sheel, A. W. (2002). Respiratory muscle training in healthy individuals: physiological rationale and implications for exercise performance. Sports Medicine, 32(9), 567-581. doi:10.2165/00007256-200232090-00003
Sheel, A. W., Derchak, P. A., Morgan, B. J., Pegelow, D. F., Jacques, A. J., & Dempsey, J. A. (2001). Fatiguing inspiratory muscle work causes reflex reduction in resting leg blood flow in humans. The Journal of Physiology, 537(Pt 1), 277-289. doi:10.1111/j.1469-7793.2001.0277k.x
Sheel, A. W., & Romer, L. M. (2012). Ventilation and respiratory mechanics. Comprehensive Physiology, 2(2), 1093-1142. doi:10.1002/cphy.c100046
Siebenmann, C., & Lundby, C. (2015). Regulation of cardiac output in hypoxia. Scandinavian Journal of Medicine and Science in Sports, 25, 53-59. doi:10.1111/sms.12619

Respiratory Muscle Work and Tissue Oxygenation Trends During Repeated-sprint Exercise
∼ 208 ∽
Siegmund, G. P., Edwards, M. R., Moore, K. S., Tiessen, D. A., Sanderson, D. J., & McKenzie, D. C. (1999). Ventilation and locomotion coupling in varsity male rowers. Journal of Applied Physiology, 87(1), 233-242.
Signal developers. (2013). Signal: Signal processing (Version 0.7-6): R Foundation for Statistical Computing. Retrieved from http://r-forge.r-project.org/projects/signal/
Smith, K. J., & Billaut, F. (2010). Influence of cerebral and muscle oxygenation on repeated-sprint ability. European Journal of Applied Physiology, 109(5), 989-999. doi:10.1007/s00421-010-1444-4
Smith, K. J., & Billaut, F. (2012). Tissue oxygenation in men and women during repeated-sprint exercise. International Journal of Sports Physiology and Performance, 7(1), 59-67. doi:10.1123/ijspp.7.1.59
Somers, V. K., Mark, A. L., Zavala, D. C., & Abboud, F. M. (1989). Contrasting effects of hypoxia and hypercapnia on ventilation and sympathetic activity in humans. Journal of Applied Physiology, 67(5), 2101-2106. doi:10.1152/jappl.1989.67.5.2101
Sonetti, D. A., Wetter, T. J., Pegelow, D. F., & Dempsey, J. A. (2001). Effects of respiratory muscle training versus placebo on endurance exercise performance. Respiration Physiology, 127(2-3), 185-199. doi:10.1016/S0034-5687(01)00250-X
Spencer, M., Bishop, D. J., Dawson, B., & Goodman, C. (2005). Physiological and Metabolic Responses of Repeated-Sprint Activities: Specific to Field-Based Team Sports. Sports Medicine, 35, 1025-1044.
St Croix, C. M., Morgan, B. J., Wetter, T. J., & Dempsey, J. A. (2000). Fatiguing inspiratory muscle work causes reflex sympathetic activation in humans. The Journal of Physiology, 529(2), 493-504. doi:10.1111/j.1469-7793.2000.00493.x
Storz, J. F. (2016). Hemoglobin–oxygen affinity in high-altitude vertebrates: is there evidence for an adaptive trend? The Journal of Experimental Biology, 219(20), 3190-3203. doi:10.1242/jeb.127134
Strohl, K. P., Butler, J. P., & Malhotra, A. (2012). Mechanical Properties of the Upper Airway. Comprehensive Physiology, 2(3), 1853-1872. doi:10.1002/cphy.c110053
Subudhi, A. W., Dimmen, A. C., & Roach, R. C. (2007). Effects of acute hypoxia on cerebral and muscle oxygenation during incremental exercise. Journal of Applied Physiology, 103(1), 177-183. doi:10.1152/japplphysiol.01460.2006
Sweeting, A., Billaut, F., Varley, M. C., Rodriguez, R. F., Hopkins, W., & Aughey, R. J. (2017). Variations in Hypoxia Impairs Muscle Oxygenation and Performance During
References
∼ 209 ∽
Simulated Team-Sport Running. Frontiers in Physiology, 8(80). doi:10.3389/fphys.2017.00080
Takaishi, T., Sugiura, T., Katayama, K., Sato, Y., Shima, N., Yamamoto, T., & Moritani, T. (2002). Changes in blood volume and oxygenation level in a working muscle during a crank cycle. Medicine and Science in Sports and Exercise, 34(3), 520-528. doi:10.1097/00005768-200203000-00020
Terakado, S., Takeuchi, T., Miura, T., Sato, H., Nishioka, N., Fujieda, Y., . . . Ibukiyama, C. (1999). Early occurrence of respiratory muscle deoxygenation assessed by near-infrared spectroscopy during leg exercise in patients with chronic heart failure. Japanese Circulation Journal, 63(2), 97-103. doi:10.1253/jcj.63.97
Tomas, A., Ross, E. Z., & Martin, J. C. (2010). Fatigue during maximal sprint cycling: unique role of cumulative contraction cycles. Medicine and Science in Sports and Exercise, 42(7), 1364-1369. doi:10.1249/MSS.0b013e3181cae2ce
Tomlin, D. L., & Wenger, H. A. (2001). The relationship between aerobic fitness and recovery from high intensity intermittent exercise. Sports Medicine, 31(1), 1-11. doi:10.2165/00007256-200131010-00001
Tong, T. K., Fu, F. H., Chung, P. K., Eston, R., Lu, K., Quach, B., . . . So, R. (2008). The effect of inspiratory muscle training on high-intensity, intermittent running performance to exhaustion. Applied Physiology, Nutrition, and Metabolism, 33(4), 671-681. doi:10.1139/h08-050
Torelli, G., & Brandi, G. (1961). Regulation of the ventilation at the beginning of muscular exercise. European Journal of Applied Physiology and Occupational Physiology, 19(2), 134-142. doi:10.1007/BF00697501
Tran, T.-K., Sailasuta, N., Kreutzer, U., Hurd, R., Chung, Y., Mole, P., . . . Jue, T. (1999). Comparative analysis of NMR and NIRS measurements of intracellular Formula in human skeletal muscle. American Journal of Physiology - Regulatory, Integrative and Comparative Physiology, 276(6), R1682-R1690. doi:10.1152/ajpregu.1999.276.6.R1682
Trump, M. E., Heigenhauser, G. J., Putman, C. T., & Spriet, L. L. (1996). Importance of muscle phosphocreatine during intermittent maximal cycling. Journal of Applied Physiology, 80(5), 1574-1580. doi:10.1042/cs087s118
Turner, L. A., Mickleborough, T. D., McConnell, A. K., Stager, J. M., Tecklenburg-Lund, S., & Lindley, M. R. (2011). Effect of inspiratory muscle training on exercise tolerance in asthmatic individuals. Medicine and Science in Sports and Exercise, 43(11), 2031-2038. doi:10.1249/MSS.0b013e31821f4090

Respiratory Muscle Work and Tissue Oxygenation Trends During Repeated-sprint Exercise
∼ 210 ∽
Turner, L. A., Tecklenburg-Lund, S., Chapman, R. F., Stager, J. M., Duke, J. W., & Mickleborough, T. D. (2013). Inspiratory loading and limb locomotor and respiratory muscle deoxygenation during cycling exercise. Respiratory Physiology and Neurobiology, 185(3), 506-514. doi:10.1016/j.resp.2012.11.018
Turner, L. A., Tecklenburg-Lund, S. L., Chapman, R., Shei, R. J., Wilhite, D. P., & Mickleborough, T. (2016). The Effect of Inspiratory Muscle Training on Respiratory and Limb Locomotor Muscle Deoxygenation During Exercise with Resistive Inspiratory Loading. International Journal of Sports Medicine(EFirst). doi:10.1055/s-0042-104198
Turner, L. A., Tecklenburg-Lund, S. L., Chapman, R. F., Stager, J. M., Wilhite, D. P., & Mickleborough, T. D. (2012). Inspiratory muscle training lowers the oxygen cost of voluntary hyperpnea. Journal of Applied Physiology, 112(1), 127-134. doi:10.1152/japplphysiol.00954.2011
van Soest, A. J., & Casius, L. J. (2000). Which factors determine the optimal pedaling rate in sprint cycling? Medicine and Science in Sports and Exercise, 32(11), 1927-1934. doi:10.1097/00005768-200011000-00017
Vella, C. A., Marks, D., & Robergs, R. A. (2006). Oxygen cost of ventilation during incremental exercise to VO2 max. Respirology, 11(2), 175-181. doi:10.1111/j.1440-1843.2006.00825.x
Verges, S., Bachasson, D., & Wuyam, B. (2010). Effect of acute hypoxia on respiratory muscle fatigue in healthy humans. Respiratory Research, 11, 109. doi:10.1186/1465-9921-11-109
Verges, S., Renggli, A. S., Notter, D. A., & Spengler, C. M. (2009). Effects of different respiratory muscle training regimes on fatigue-related variables during volitional hyperpnoea. Respiratory Physiology and Neurobiology, 169(3), 282-290. doi:10.1016/j.resp.2009.09.005
Vogiatzis, I., Athanasopoulos, D., Boushel, R., Guenette, J. A., Koskolou, M., Vasilopoulou, M., . . . Zakynthinos, S. (2008). Contribution of respiratory muscle blood flow to exercise-induced diaphragmatic fatigue in trained cyclists. The Journal of Physiology, 586(22), 5575-5587. doi:10.1113/jphysiol.2008.162768
Vogiatzis, I., Athanasopoulos, D., Habazettl, H., Kuebler, W. M., Wagner, H., Roussos, C., . . . Zakynthinos, S. (2009). Intercostal muscle blood flow limitation in athletes during maximal exercise. The Journal of Physiology, 587(Pt 14), 3665-3677. doi:10.1113/jphysiol.2009.171694
Vogiatzis, I., Georgiadou, O., Giannopoulou, I., Koskolou, M., Zakynthinos, S., Kostikas, K., . . . Roussos, C. (2006). Effects of exercise-induced arterial hypoxaemia and work
References
∼ 211 ∽
rate on diaphragmatic fatigue in highly trained endurance athletes. The Journal of Physiology, 572(Pt 2), 539-549. doi:10.1113/jphysiol.2005.102442
Vogiatzis, I., Georgiadou, O., Koskolou, M., Athanasopoulos, D., Kostikas, K., Golemati, S., . . . Zakynthinos, S. (2007a). Effects of hypoxia on diaphragmatic fatigue in highly trained athletes. The Journal of Physiology, 581(Pt 1), 299-308. doi:10.1113/jphysiol.2006.126136
Vogiatzis, I., Georgiadou, O., Koskolou, M., Athanasopoulos, D., Kostikas, K., Golemati, S., . . . Zakynthinos, S. (2007b). Effects of hypoxia on diaphragmatic fatigue in highly trained athletes. Journal of Physiology, 581(Pt 1), 299-308. doi:10.1113/jphysiol.2006.126136
Volianitis, S., Krustrup, P., Dawson, E., & Secher, N. H. (2003). Arm blood flow and oxygenation on the transition from arm to combined arm and leg exercise in humans. The Journal of Physiology, 547(Pt 2), 641-648. doi:10.1113/jphysiol.2002.034496
Volianitis, S., McConnell, A. K., Koutedakis, Y., McNaughton, L., Backx, K., & Jones, D. A. (2001). Inspiratory muscle training improves rowing performance. Medicine and Science in Sports and Exercise, 33(5), 803-809. doi:10.1097/00005768-200105000-00020
Volianitis, S., & Secher, N. H. (2002). Arm blood flow and metabolism during arm and combined arm and leg exercise in humans. The Journal of Physiology, 544(Pt 3), 977-984. doi:10.1113/jphysiol.2002.023556
Wagner, P. D. (2015). The physiological basis of pulmonary gas exchange: implications for clinical interpretation of arterial blood gases. European Respiratory Journal, 45(1), 227-243. doi:10.1183/09031936.00039214
Waisbren, S. J., Whiting, C. S., & Nadel, E. R. (1990). Effects of passive limb movement on pulmonary ventilation. Yale Journal of Biology and Medicine, 63(6), 549-556. doi:10.1007/BF00582546
Waldrop, T. G. (1989). Respiratory responses and adaptations to exercise. In C. C. Teitz (Ed.), Scientific Foundation of Sports Medicine (pp. 58-76). Toronto: B. C. Decker, Inc.
Waldrop, T. G., Eldridge, F. L., Iwamoto, G. A., & Mitchell, J. H. (2010). Central Neural Control of Respiration and Circulation During Exercise. In D. M. Pollock (Ed.), Comprehensive Physiology (pp. 333–380): John Wiley & Sons, Inc.
Walter, G., Vandenborne, K., McCully, K. K., & Leigh, J. S. (1997). Noninvasive measurement of phosphocreatine recovery kinetics in single human muscles.

Respiratory Muscle Work and Tissue Oxygenation Trends During Repeated-sprint Exercise
∼ 212 ∽
American Journal of Physiology - Heart and Circulatory Physiology, 272(2 Pt 1), C525-534. doi:10.1152/ajpcell.1997.272.2.C525
Wasserman, K., Whipp, B. J., Koyl, S. N., & Beaver, W. L. (1973). Anaerobic threshold and respiratory gas exchange during exercise. Journal of Applied Physiology, 35(2), 236-243. doi:10.1152/jappl.1973.35.2.236
Wehrlin, J. P., & Hallén, J. (2006). Linear decrease in VO2max and performance with increasing altitude in endurance athletes. European Journal of Applied Physiology, 96(4), 404-412. doi:10.1007/s00421-005-0081-9
Weil, J. V., Byrne-Quinn, E., Sodal, I. E., Kline, J. S., McCullough, R. E., & Filley, G. F. (1972). Augmentation of chemosensitivity during mild exercise in normal man. Journal of Applied Physiology, 33(6), 813-819. doi:10.1152/jappl.1972.33.6.813
Wetter, T. J., Harms, C. A., Nelson, W. B., Pegelow, D. F., & Dempsey, J. A. (1999). Influence of respiratory muscle work on VO2 and leg blood flow during submaximal exercise. Journal of Applied Physiology, 87(2), 643-651. doi:10.1152/jappl.1999.87.2.643
Whipp, B. J. (1977). The hyperpnea of dynamic muscular exercise. Exerc Sport Sci Rev, 5(1), 295-311.
Whipp, B. J., & Ward, S. A. (1998). Determinants and control of breathing during muscular exercise. British Journal of Sports Medicine, 32(3), 199-211. doi:10.1136/bjsm.32.3.199
Willis, S. J., Alvarez, L., Millet, G. P., & Borrani, F. (2017). Changes in Muscle and Cerebral Deoxygenation and Perfusion during Repeated Sprints in Hypoxia to Exhaustion. Frontiers in Physiology, 8, 846. doi:10.3389/fphys.2017.00846
Wilson, T. A. (2016). The Chest Wall and the Respiratory Pump. In Respiratory Mechanics (pp. 19-42). Cham: Springer International Publishing.
Winter, D. A. (2009). Biomechanics and motor control of human movement (4th ed.): John Wiley & Sons.
Witt, J. D., Guenette, J. A., Rupert, J. L., McKenzie, D. C., & Sheel, A. W. (2007). Inspiratory muscle training attenuates the human respiratory muscle metaboreflex. The Journal of Physiology, 584(3), 1019-1028. doi:10.1113/jphysiol.2007.140855
Wylegala, J. A., Pendergast, D. R., Gosselin, L. E., Warkander, D. E., & Lundgren, C. E. (2007). Respiratory muscle training improves swimming endurance in divers. European Journal of Applied Physiology, 99(4), 393-404. doi:10.1007/s00421-006-0359-6

References
∼ 213 ∽
Younes, M., & Kivinen, G. (1984). Respiratory mechanics and breathing pattern during and following maximal exercise. Journal of Applied Physiology, 57(6), 1773-1782. doi:10.1152/jappl.1984.57.6.1773
Younes, M., Puddy, A., Roberts, D., Light, R. B., Quesada, A., Taylor, K., . . . Cramp, H. (1992). Proportional assist ventilation. Results of an initial clinical trial. The American Review of Respiratory Disease, 145(1), 121-129. doi:10.1164/ajrccm/145.1.121
Young, W., McLean, B., & Ardagna, J. (1995). Relationship between strength qualities and sprinting performance. The Journal of sports medicine and physical fitness, 35(1), 13-19.
Yu, B., Gabriel, D., Noble, L., & An, K. N. (1999). Estimate of the optimum cutoff frequency for the Butterworth low-pass digital filter. Journal of Applied Biomechanics, 15(3), 318-329. doi:10.1123/jab.15.3.318
Zois, J., Bishop, D. J., Fairweather, I., Ball, K., & Aughey, R. J. (2013). High-Intensity Re-Warm-Ups Enhance Soccer Performance. International Journal of Sports Medicine. doi:10.1055/s-0032-1331197


![Impact Loading and Locomotor-Respiratory Coordination ...s PDF/Daley human ventilation.pdf · entrainment to locomotor forces [2,21,22]. Furthermore, evidence suggests coupling improves](https://img.pdfslide.us/doc/110x75/5f442037fcace86ced45235c/impact-loading-and-locomotor-respiratory-coordination-s-pdfdaley-human-ventilationpdf.jpg)