Embed Size (px)
Citation preview

1
THE INFLUENCE OF PUMPS ON SURFACE PREPARATION
A Final Report (Sep’2010 – Dec’2010)
Submitted by
Prof. Jin-Goo Park Department of Materials Engineering
Hanyang University, Ansan, 426 -791, Korea
To
LEVITRONIX,
Dec. 31, 2010

2
TABLE OF CONTENTS
1 INTRODUCTION 1 2 OBJECTIVES 2
3 METHODOLOGIES 2
4 EXPERIMENTS
4.1 Wafer cleaning Experiments 3
4.2 PIV Measurements 5
5 RESULTS & DISCUSSION
5.1 Effect of pumping methods on wafer cleaning in wet bath 7
5.1.1 Seven wafers test 7
5.1.2 Single wafer test 9
5.2 Effect of pumping methods on wafer cleaning in Single Akrion tool 11
5.3 Effect of pumping methods on temperature rise of the solution 12
5.4 Effect of pumping methods on flow behavior in the wet bath 13
6 SUMMARY 13
7 FUTURE WORK 14
8 REFERNCES 14

3
1. INTRODUCTION
Various types of pump such as bellows, diaphragms and centrifugal have been used in
microelectronic processing industries for range of applications. In principle, the flow delivery
is pulsatile in positive displacement pumps (bellow and diaphragms) whereas continuous in
magnetic levitation pumps. This would influence the performance of various processes in
surface preparation such as cleaning and etching etc. The summary of studies explaining how
the pumping methods can affect the various processes is given below.
One report shows that pump pulsation intensity increases with flow rate of the slurry for
bellow and diaphragm pumps whereas it is constant for MegLev centrifugal pumps. Hence
the flow in the centrifugal pump is more stable [1] in slurry supply.
Particle generation and agglomeration are the major concerns in the slurry circulation
through pumps as they affect the process efficiency. The operation of pump generates
particles because of moving parts such as diaphragms and the seating of the valve [2]. On the
other side, various factors cause the particle agglomeration when the liquid is subjected to
circulation through pump which includes shear stress, mechanical contact between slurry and
the pump and cavitation. Shear stress exhibits on the liquid when it is subjected to high
velocity gradients. For example, flow though orifice and orifice meter and flow across a
diaphragm seat [3]. The degree of level of agglomeration depends on inter particle force,
external shear stress which in turn depends on type of pump that used in the process line and
number of turnovers of slurry [4]. However, shear stress also breaks loose agglomerates. The
dominating mechanism is determined by the magnitude of shear level imparted to the liquid
and the force of attraction /repulsion between particles [3]. In the case of positive displacement
pump, high shear flow increases the oversized particle [5] thereby affects the process
efficiency. Similarly mechanical contact between pump and the slurry particles results in
particle agglomeration. The circulating effect of Cabot silica slurry (EP-C6618) on the health
of slurry was studied with four different pumps including diaphragm (Yamada, PFD3 3226),
bellows (ASTI, DP20F-FT) and medium (Levitronix, BPS-3) and high (Levitronix, BPS-4)
magnetically levitated centrifugal pumps[6]. The studies showed that the cumulative particle

4
size distribution (PSD) in the slurry after circulation increased with increasing turnovers in
diaphragm and bellow pumps while there is only minimal change is observed with both the
MegLev centrifugal pumps. The increase in oversized particle concentration affects the
various processes such as chemical mechanical polishing [4, 7], particle retention on the filter
[1] etc.
In addition, cavitation also leads to particle agglomeration. It is reported that cavitation is
the primary mechanism in bellow and diaphragm pumps for particle agglomeration that
eventually affect the CMP performance. It is also reported that the bellow pump creates more
number of bubbles when compared to centrifugal pump (Levitronix, BSM 3.1C) if a non-
ionic surfactant, triton X, is used in the solution [8]. On the whole, all the studies show that the
levitation magnetic pumps perform much better than positive displacement pumps.
However to the authors’ knowledge, there is no experimental evidence on the effect of
centrifugal and diaphragms pump on cleaning process performance in microelectronic
processing industries. Thus in this present project, the focus is on the influence of pumps on
surface preparation. The objectives and the methodologies of this present work have been set
as follows
2. OBJECTIVES
1. To study the effect of pumping methods (diaphragm vs. magnetic levitation pump) on
cleaning and particles
2. To investigate the fluid flow behavior in the tank with and without pulsation
3. METHODOLOGIES
To meet the above objectives, the following methodologies have been framed.
1) To study the effect of pumping methods on cleaning and particle
i. The effect of centrifugal pump at different flow rates on wafer cleaning in single wafer
tool and conventional wet bath tool

5
ii. The effect of diaphragms pump at different flow rates on wafer cleaning in single
wafer tool and conventional wet bath tool
iii. The particle counting on wafer before and after the cleaning process to estimate the
particle addition on wafer during pumping by using a laser surface particle scanner
2) To investigate the fluid flow in the tank with and without pulsation
i. Particle image velocity (PIV) measurements to investigate the fluid flow in the tank
with both in the presence and absence of pulsation
ii. The image post processing and image analysis to analyze the experimental results
iii. Finally, the results obtained from the PIV results would be integrated with particle
addition to show the relationship between fluid dynamics and particle generation
during pumping
4. EXPERIMENTAL PROCEDURE
4.1 Cleaning experiments
The wet bath and single tool was modified accordingly to accomplish the circulation
cleaning experiments. The schematic diagram and photograph of modified experimental set
up is shown in Fig. 1(a-d). The flow rate and pressure of the circulation system was
monitored by rotameter and pressure gauge, respectively. Three pumps were tested in the
present work and specifications of the same are given in the Table 1. After connecting the
pump to the circulation line, the whole system is flushed with DI water for 24 hours before
the actual run in order to remove the particles generated during the initial pumping. In the
present cleaning study, only DI water was used for all the runs.
8 inches bare silicon wafers were used in this study. Prior to the experiments, wafers
were cleaned with SC1 (NH4OH+H2O2+DIW) solution with megasonic for 10 minutes in wet
bath and dried in Single Akrion tool for 30 seconds to ensure that the surface is hydrophilic.
The particle counts on the wafers were measured using surface scanner (ST6600, KLA
Tencor, USA). Then, the 24 hours cleaning experiments were carried out in two different
approaches. In the first approach, wafers are immersed in the wet bath for the process time of
10 minutes at the end of designated times i.e. 0 , 4 , 8, 12, 16, 20 and 24 hour followed by

6
drying in the single tool. Then, the particle count on these dried wafers was measured again
by surface scanner. The difference in the particle count before and after the cleaning
experiment would give the particle added on the wafer during the processing time. This
approach is termed as seven wafers test in the succeeding sections. In the second approach,
the wafer is immersed in the bath for 24 hours and taken out from the bath only at the
designated times, dried in a single tool and analyzed for particle count using surface scanner
and immersed back again in the bath. This test is termed as single wafer test in the pursuing
sections. In conventional wet bath, experiments were conducted at different flow rates i.e. at
10, 15 and 20 LPM for BPS – 600 pump and at 10 and 15 LPM for both the diaphragm
pumps. Since the maximum flow rate achieved in both the diaphragm pumps is 15 LPM, the
experiments were not carried out at 20 LPM. The constant pressure of 30 psi was maintained
in all the experiments. However, in both the diaphragms, the pressure was fluctuating around
the value of 30 psi. Temperature of the solution was also monitored during the circulation.
In single tool, the feeding conditions of chemical are internally fixed in the tool. Thus the
experiments were conducted at only one test condition. The detailed test conditions of
experiments carried out in both conventional wet bath and Single Akrion tool are given in
Table 2
(a)

7
(b)
(c) (d)
Fig. 1. Modified conventional wet bath tool with pump circulation for cleaning
experiments; (a) schematic diagram of bath with a pump and (b) its photograph (c)
Schematic diagram of Single Akrion tool and (d) its photograph

8
Table 1: Specifications of pumps used in this present study
BPS- 600 Magnum 620r Futur 50
Maker Levitronix Trebor Almatec
Type Centrifugal Diaphragm Diaphragm
Max. Pressure 46 psi 80 psi 80 psi
Max. Flow 75 LPM 45 LPM 50 LPM
Max. Liquid Temp. 90 ℃ 110 ℃ 100 ℃
Table 2: Experimental test conditions employed in the present studies
Pump Tool Test conditions Levitronix (BPS-600)
Conventional wet bath Impeller speed:8000 rpm; Flow rate : 20,15 and 10 LPM; Pressure :30 psi
Diaphragm–I (Magnum 620r) Conventional wet bath Air pressure :1.8 bar; Flow rate : 15 and 10 LPM;
Pressure :30±3 psi
Diaphragm–II (Futur 50) Conventional wet bath Air pressure :1.8 bar; Flow rate : 15 and 10 LPM;
Pressure :30±6 psi
All the three pumps Single Akrion DI water flow rate through nozzle: 0.5 LPM ; Circulation flow rate: Maximum flow rate of the pump
4.2 PIV Measurements
PIV measuring technique (Lavision Model) is used to obtain the information on 2D
instantaneous velocity flow field. In this measuring technique, the fluid in the tank is seeded
with neutrally buoyant tracer particles (glass sphere 100㎛) and these particles are assumed to
faithfully follow the fluid velocity. The area of interest is illuminated using a Laser source
(Nd;YAG 532nm) and the light reflected by these particles in the laser sheet is captured using
a high resolution (1280X1024 pix) CCD camera. Fig. 2a shows schematic diagram of PIV

9
measuring technique. The images of the particles are captured at two instants of time with the
small time interval of milliseconds i.e. at the time t0 and to+Δt. The position of the particles in
these images is used to estimate the instantaneous velocity vectors in the area of interest
using cross correlation technique as explained in the Fig. 2b The data were processed using
the software (DaVis Ver.6) provided by Lavsion to get the instantaneous velocity vector . 150
pairs of images were taken to determine the fluctuations of instantaneous velocity
(b)
Fig. 2: (a) Schematic diagram of PIV measuring technique (b) Cross correlation technique
to determine velocity in the area of interest from PIV images
5. RESULTS AND DISCUSSION
5.1 Effect of pumping methods on wafer cleaning in wet bath
5.1.1 Seven wafers test:
The effect of pumping methods on the number of particles added on to the wafer
during 24 hour cleaning test in wet bath is shown in the Fig. 3(a-c). In the case of BPS-600
pump, the total number of added particles on the wafer is below 5000 at all the flow rates.
At higher flow rates (15 and 20 LPM), the particle count slightly decreases and becomes
(a)

10
constant with circulation time. This might be due to the particles which are shedded during
the initial period of pumping attracting towards the wall and stick remains to it as the flow is
smoother. However at the lower flow rate (10 LPM), particle count increases after 4 hours of
circulation. The reason for this is not clear.
In the case of both Magnum 620r and Futur 50, the particle count on the wafer goes
beyond the inspection range of the instrument. The maximum measuring capability of the
surface scanner instrument is. 30,000. If the wafer has particles which is beyond the
instrument inspection range, then it could not detect the total number of particles and displays
the error message. In that case, particle number on the wafer would be more than 30,000 and
however just for the convenience, it is reported as 30,000 in the following plots. In both these
pumps, the total number of added particles on the wafer increases with flow rate as seen from
the Fig. 3(b-c). This behavior is more common in pumps as the particle shedding increases
with the increase in flow rate [9]. Thus, it can be concluded from the 7 wafer test that number
of particles generated by BPS-600 pump is very much lesser than both the diaphragm pumps.
0
5000
10000
15000
20000
25000
30000
35000
0 4 8 12 16 20 24
Num
ber o
f Add
ed Particles (ea)
Pump Circulation Time (hours)
10LPM
15LPM
20LPM
Out of inspection range
(a)

11
0
5000
10000
15000
20000
25000
30000
35000
0 4 8 12 16 20 24
Num
ber o
f Add
ed Particles (ea)
Pump Circulation Time (hours)
10LPM
15LPM
Out of inspection range
(b)
0
5000
10000
15000
20000
25000
30000
35000
0 4 8 12 16 20 24
Num
ber o
f Add
ed Particles (ea)
Pump Circulation Time (hours)
10LPM
15LPM
Out of inspection range
(c)
Fig. 3: Seven wafer test results of particle count on the wafer as a function of circulation time
in wet bath tool for (a) Levitronix pump (b) Magnum 620r and (c) Futur 50
5.1.2 Single wafer test:
The effect of pumping methods on the number of particles added on to the wafer in the
single wafer test is shown in the Fig.4 (a-c). The total number of particles added on to the
wafer during 24 hour circulation is 17,500 at 20 LPM and decreased to 11,000 at 10 LPM. It

12
clearly shows that number of added particles increase when the flow rate increases. In both
Magnum 620r and Futur 50 pumps, the total number of particles added on to the wafer goes
beyond the inspection range of the instrument at both the flow rates. Thus, single wafer test in
wet bath also clearly shows that the added particles on the wafer is very much lesser in BPS-
600 than the other two pumps.
0
5000
10000
15000
20000
25000
30000
35000
0 4 8 12 16 20 24
Num
ber o
f Particles (ea)
Pump Circulation Time (hours)
10LPM
15 LPM
20 LPM
Out of inspection range
0
5000
10000
15000
20000
25000
30000
35000
0 4 8 12 16 20 24
Num
ber o
f Particles (ea)
Pump Circulation Time (hours)
10LPM
15LPM
Out of inspection range
(b)

13
0
5000
10000
15000
20000
25000
30000
35000
0 4 8 12 16 20 24
Num
ber o
f Particles (ea)
Pump Circulation Time (hours)
10LPM
15LPM
Out of inspection range
(c)
Fig. 4: Single wafer test results of particle count on the wafer as a function of circulation time
in wet bath tool for a. Levitronix pump b. Magnum 620r and c. Futur 50
5.2 Effect of pumping methods on wafer cleaning in single tool
The effect of pumping methods on the number of particles added on to the wafer
during 24 hour cleaning test in single Akrion tool is shown in the Fig. 5. In BPS -600 pump,
the total number of particles added on to the wafer is very less (i.e. around 300) and there is
no significant change in the number with circulation time. The trend looks similar with the
Futur 50 pump though particle number (500) is slightly higher. However, the particle count
slightly increases with circulation time especially after 12 hours. In the case of Magnum620r
pump, the wafer particle count is relatively higher (4200 at 24th hour) and increases linearly
with circulation time. The particle number is significantly lower in this test compared to that
of test carried out in the wet bath. This is mainly due to the lower process time and also most
of the particles escaped from the feed line as a separate branch from the circulation line is
used for supplying DI water to the single tool.

14
0
500
1000
1500
2000
2500
3000
3500
4000
4500
0 4 8 12 16 20 24
Num
ber o
f add
ed particles (ea)
Pump Circulation Time (hours)
BPS‐600
Magnum 620R
Futur 50
Fig.5 : Particle count on the wafer as a function of circulation time in Single tool for the three
pumps.
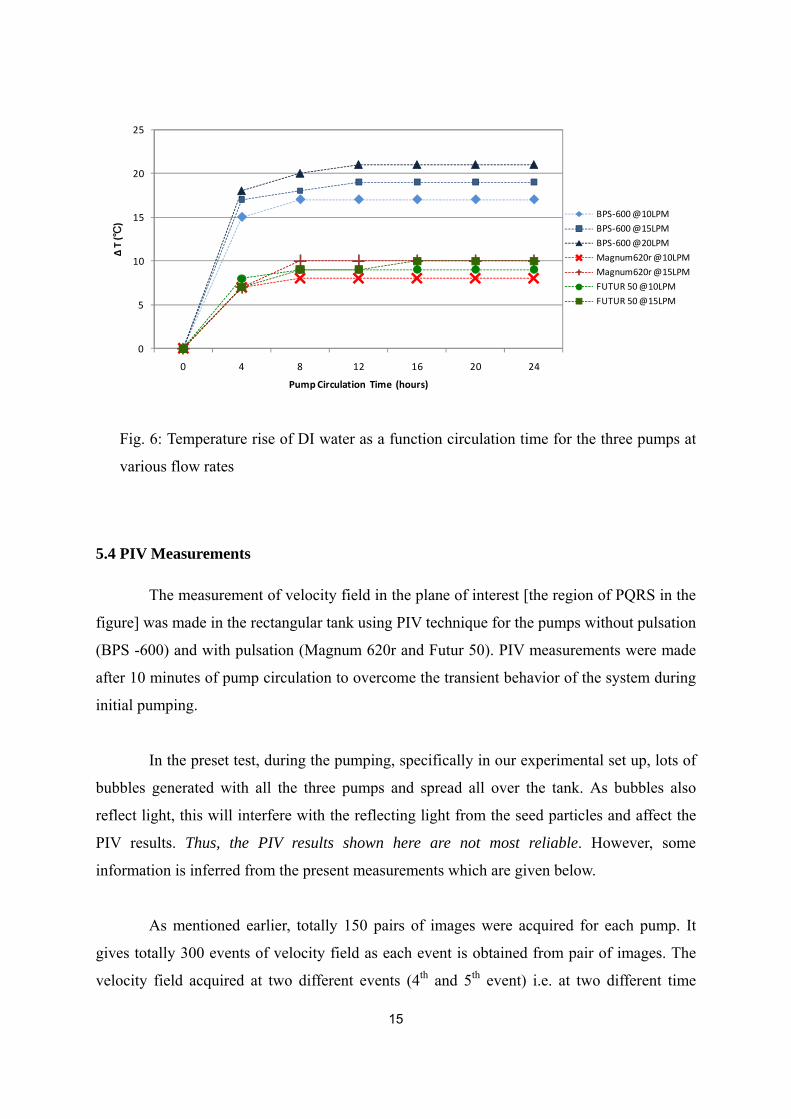
5.3. Effect of pumping methods on temperature rise during cleaning experiments
In general, there is a power loss within the pump due to the difference in the brake
horsepower and water horsepower developed. These power losses are converted in to heat
and results in a temperature rise of the liquid being pumped. Thus temperature of the
circulating DI water was monitored with respect to circulation time for all the three pumps
and for all the flow rates. The results are shown in the Fig. 6. It clearly shows that there is a
rise in the temperature of DI water during first four hours of circulation and after that there is
no significant change in the temperature for all the three pumps. The temperature rise is
relatively higher for magnetic levitation pumps when compared to both the diaphragm pumps
at all the flow rates as seen from the figure 3. The operating condition such as flow rate also
affects the temperature rise of liquid. The effect is more pronounced for BPS - 600 pumps i.e.
ΔT is 17ºC at 10 LPM and increased to 21ºC at 20 LPM. In the case of Magnum 620r and
Futur 50, the ΔT is 8ºC and 9ºC respectively at 10 LPM and increased only to 10ºC when the
flow rate was changed to 15 LPM.
15
0
5
10
15
20
25
0 4 8 12 16 20 24
Δ T (℃
)
Pump Circulation Time (hours)
BPS‐600 @10LPM
BPS‐600 @15LPM
BPS‐600 @20LPM
Magnum620r @10LPM
Magnum620r @15LPM
FUTUR 50 @10LPM
FUTUR 50 @15LPM
Fig. 6: Temperature rise of DI water as a function circulation time for the three pumps at
various flow rates
5.4 PIV Measurements
The measurement of velocity field in the plane of interest [the region of PQRS in the
figure] was made in the rectangular tank using PIV technique for the pumps without pulsation
(BPS -600) and with pulsation (Magnum 620r and Futur 50). PIV measurements were made
after 10 minutes of pump circulation to overcome the transient behavior of the system during
initial pumping.
In the preset test, during the pumping, specifically in our experimental set up, lots of
bubbles generated with all the three pumps and spread all over the tank. As bubbles also
reflect light, this will interfere with the reflecting light from the seed particles and affect the
PIV results. Thus, the PIV results shown here are not most reliable. However, some
information is inferred from the present measurements which are given below.
As mentioned earlier, totally 150 pairs of images were acquired for each pump. It
gives totally 300 events of velocity field as each event is obtained from pair of images. The
velocity field acquired at two different events (4th and 5th event) i.e. at two different time

16
instants for all the three pumps is given in the Fig.7 (a-c) and Fig. 8(a-c). It is seen that
velocity fields are sufficiently distinct from each other confirming the transient behavior of
the system. In addition, the magnitude of most of the vectors is near the value of 1.5 m/s for
BPS -600 pump whereas for the other two pumps the range is wide as seen in the figures.
This confirms that the flow is relatively more uniform in the wet bath with BPS 600 when
compared to that of other two pumps.
(a) (b) (c)
Fig.7 : The velocity field acquired at the 4th event for (a) BPS 600 (b) Magnum 620r and (c)
Futur 50
(a) (b) (c)
Fig.8. The velocity field acquired at the 5th event for (a) BPS 600 (b) Magnum 620r and (c)
Futur 50
The time averaged flow field estimated from the 300 events for all the three pumps is
shown in the Fig. 9 (a-c). It can be seen that vectors are in the downward direction in the left

17
hand side of the plane These downward velocity vectors appeared earlier in the velocity field
for BPS-600 pump than the other two pumps as observed from the Fig.7 and Fig.8. It says
that steady state is reached in a very less time in BPS-600 pump than in the other two
diaphragm pump.
(a) (b) (c)
Fig. 9 Time averaged flow field in the region of interest for (a) BPS 600 (b) Magnum 620r
and (c) Futur 50
The present PIV set up has only single camera which allow us to steady only the 2D (X
and Y component velocity) velocity field. If the Z component velocity also has significant
value, then it may also influence the PIV results. Thus the PIV measurement results could be
improved by
1. Using two cameras simultaneously in the PIV measurements to determine the 3D
velocity field.
2. Using rhodamine coated particles which emit only red light as seed particles and
suitable optical filter in front of camera which allows only the red light emitted from
seed particles to record. This way, one could minimize the interference of bubbles in
liquid flow studies.
However, in given comparison, BPS 600 gave uniform flow distribution and reached a steady
state flow in a shorter time than Magnum and Futur pumps.

18
6. SUMMARY
1. Both Seven wafers test and single wafer test in conventional wet bath show that
number of added particles on the wafer is very much lesser in BPS 600 pump than
the both Magnum 620R and Futur 50 pumps
2. In Single Akrion tool, since the process time is very less, there is no significant
difference observed in the added particle number between BPS -600 pump and Futur
50 pump. However, the particle number is relatively higher in Magnum 620r.
3. The temperature rise of the DI water during circulation is higher in BPS -600 pump
than Magnum 620r and Futur 50 pumps.
4. Since all the pumps being studied in the present work produce lot of bubbles, the
flow behavior in the wet bath was difficult to analyze. However, in given comparison,
more uniform flow and faster steady state flow were observed in BPS pump.
7. FUTURE WORK:
1. In general, the stability of chemicals is affected by various factors. For example,
hydrogen peroxide used in SC1 cleaning is dissociating in to hydrogen and oxygen
with respect to time and the dissociation is accelerated by various means such as
presence of impurities, temperature etc. Hence the pulsation and pump inducted
particles may have influence on the stability of chemicals. Thus, the effect of
pumping methods on the stability of SC1 chemicals will be of interest.
2. The effect of pumping methods on the etching uniformity of the bare or patterned
wafers. If knowledge is given, the dependency on etch rate on kind of films would be
very interesting to investigate.
3. It is observed that higher pump pulsation intensity leads to the vibration of the
experimental set up. This may have influence on Marongoni drying process as the
flow of DI water and iso propyl alcohol (IPA) is supposed to be smooth over the
wafers.
8. REFERNCES
19
1. M.R. Litchy, D.C. Grant and R. Schoeb, SPWCC Wet Process Conference, Effect of
pump pulsation and particle loading on membrane filter retention. 13-15, Feb 2006.
2. Y. Stefani, Plastic pumps for semiconductors, World pumps, 38-41, Oct 2004.
3. M.R. Litchy and D.C. Grant, Effects of shear and cavitation on particle
agglomeration during handling of CMP slurries containing silica, alumina and ceria
particles, CTA pub#70
4. F.C. Chang, S. Tanawade and Rajiv Singh, Effects of stress-Induced particle
agglomeration on defectivity during CMP of low-K dielectrics, J. Electrochem. Soc.
156 (1), H39-H42, 2009.
5. F.C. Chang, S. Tanawade and Rajiv Singh, How pump induced particles affect low-K
dielectrics, University of Florida, Technical report, Sep 2008.
6. M. Litchy, Technical paper, Comparison of four pump systems on the particle size
distribution of Cabot EP-C6618 sully, Nov. 8, 2006
7. L. Bauck and R. Donis, Slurry pump affects on CMP, The 2nd PacRim International
Conference on Planarization CMP and its application Technology, COEX, Seoul,
Korea November 17-19, 2005.
8. B. Wu, Technical paper, foaming effects of Levitronix’s pump. Apr 11, 2003.
9. D.D. Chilcote, An evaluation of particles shedding from Levitronix BpS-3 pump
during operation, CT associates Inc., Technical report, Aug 26, 2002