Embed Size (px)
Citation preview

The
Jou
rnal
of
Exp
erim
enta
l Bio
logy
– A
CC
EPT
ED
AU
TH
OR
MA
NU
SCR
IPT
1
The influence of photosynthesis on host intracellular pH in scleractinian 1
corals 2
3
Julien Laurent 1.2- [email protected] 4
Sylvie Tambutté 1.2 - [email protected] 5
Éric Tambutté 1.2 - [email protected] 6
Denis Allemand 1.2 - [email protected] 7
Alexander Venn 1.2 - [email protected] 8
1. Centre Scientifique de Monaco (CSM), Avenue Saint Martin, MC98000 Monaco 9
2. LEA CSM-CNRS 647 "BioSensib" 10
11
Short title: Photosynthesis shapes coral pHi dynamics 12
13
Keywords : Coral , pH, photosynthesis 14
15
Summary 16
The regulation of intracellular pH is a fundamental aspect of cell physiology that has received 17
little attention in reef building corals and symbiotic cnidarians. Here, we investigated the 18
hypothesis that dynamic changes in the pHi of coral host cells are controlled by the 19
photosynthetic activity of the coral’s dinoflagellate symbionts. Using live cell imaging and the 20
pH sensitive dye SNARF-1, we tracked pH in symbiont-containing and symbiont-free cells 21
isolated from the reef coral Stylophora pistillata. We characterized the response of coral pHi 22
in the presence of a photosynthetic inhibitor, the dynamics of coral pHi during light exposure 23
and how pHi values vary on exposure to a range of irradiance levels lying within the coral’s 24
photosynthesis-irradiance (PI) response curve. Our results demonstrate that increases in coral 25
pHi are dependent on photosynthetic activity of intracellular symbionts and that pHi recovers 26
under darkness to pHi values that match symbiont-free cells. Furthermore, we show that the 27
timing of the pHi response is governed by irradiance level and that pHi increases to 28
irradiance-specific steady state values. Minimum steady state values of pHi 7.05 ± 0.05 were 29
obtained under darkness and maximum values of 7.46 ± 0.07 under saturating irradiance. As 30
changes in pHi often affect organism homeostasis there is a need for continued research into 31
http://jeb.biologists.org/lookup/doi/10.1242/jeb.082081Access the most recent version at J Exp Biol Advance Online Articles. First posted online on 21 December 2012 as doi:10.1242/jeb.082081
Copyright (C) 2012. Published by The Company of Biologists Ltd
http://jeb.biologists.org/lookup/doi/10.1242/jeb.082081Access the most recent version at First posted online on 21 December 2012 as 10.1242/jeb.082081

The
Jou
rnal
of
Exp
erim
enta
l Bio
logy
– A
CC
EPT
ED
AU
TH
OR
MA
NU
SCR
IPT
2
acid/base regulation in symbiotic corals. More generally, these results represent the first 32
characterization of photosynthesis-driven pHi changes in animal cells. 33
34
35
Introduction 36
Photosynthetic symbioses in Cnidaria are major contributors to the structural and trophic 37
foundation of shallow water coral reef ecosystems at tropical and subtropical latitudes. Reef-38
building corals form a symbiosis with photosynthetic dinoflagellates belonging to the genus 39
Symbiodinium, which reside intracellularly in host endodermal cells (Muscatine, 1990; 40
Trench, 1993). This endosymbiosis provides corals with access to a valuable source of 41
photosynthetically-fixed carbon that is used for host respiration and other essential processes 42
(Muscatine, 1990; Venn et al., 2008; Yellowlees et al., 2008). 43
The relationship between corals and their symbiotic dinoflagellates is sensitive to 44
changes in the marine environment associated with climate change (Hoegh-Guldberg, 1999; 45
Hoegh-Guldberg et al., 2007). Elevations in seawater temperature and ocean acidification can 46
exert physiological stress on both coral and dinoflagellate partners (Lesser, 2007; Anthony et 47
al., 2008; Crawley et al., 2010). Much research on coral biology is currently directed towards 48
improving our understanding of how and why corals are sensitive to environmental change, 49
but the field is currently impeded by a limited knowledge of the basics of the cell physiology 50
underpinning the coral-dinoflagellate symbiosis (Weis et al., 2008; Weis and Allemand, 51
2009). 52
Intracellular cytosolic pH (pHi) is a fundamental parameter of cell physiology and 53
potentially very important to the cell biology of the coral-dinoflagellate symbiosis. pHi 54
affects most aspects of cell biology, including protein synthesis, enzyme activity and cell 55
signalling. As such it has a strong influence over the physiology of all organisms and most 56
organisms seek to minimise variations in pHi by a system of intracellular buffers and 57
membrane transporters in order to maintain steady state metabolism (Busa and Nucitelli, 58
1984; Casey et al., 2010). 59
When changes in pHi do occur, they are frequently linked with transitions such 60
changes in rates of cell metabolism and events such as cell activation and division (Roos and 61
Boron, 1981; Busa, 1986; Casey et al., 2010). In algae, pHi also significantly increases on 62
exposure to light due to the activity of photosynthesis (Smith and Raven, 1979; Kurkdjian and 63
The
Jou
rnal
of
Exp
erim
enta
l Bio
logy
– A
CC
EPT
ED
AU
TH
OR
MA
NU
SCR
IPT
3
Guern, 1989). For example, differences of 0.4-0.5 pH units have been observed between 64
photosynthesising and non-photosynthesising cells of the giant single celled algae 65
Chaetomorpha darwinii (Raven and Smith, 1980) and the dinoflagellate Prorocentrum 66
micans. The single previous study performed on cnidarian pHi, suggests that coral pHi may 67
also be responsive to light (Venn et al., 2009). It was observed that pHi in coral cells 68
containing dinoflagellate symbionts exposed to light have a higher pHi than those kept in dark 69
conditions. However for a more complete understanding of the interactions between host pHi 70
and photosynthesis, this previous study requires further research into pHi dynamics since it 71
was built on a single time point measurement with a fixed light intensity. 72
Important advances in the understanding of intracellular pH regulation in many 73
organisms including corals have been facilitated by the use of pH sensitive intracellular dyes 74
(Dubbin et al., 1993; Lemasters et al., 1999). Certain of these dyes (such as 75
carboxyseminaphthorhodafluor-1 (SNARF-1)) emit fluorescence at two wavelengths which 76
can be calibrated to the concentration of ions in the cell (e.g. H+). Used together with 77
confocal microscopy this approach allows the monitoring of dynamic pH changes in living 78
cells. In the case of coral cells, the use of confocal microscopy as proved advantageous for 79
cells containing algal symbionts, where high spatial resolution is required to analyse the coral 80
cell cytoplasm which is stretched tightly around intracellular symbionts (Venn et al. 2009). 81
The current study investigated the hypothesis that changes in the pHi of corals are 82
shaped by the photosynthetic activity of coral symbionts. This involved a) testing whether 83
changes in coral pHi could be blocked in the presence of a photosynthetic inhibitor b) 84
characterizing the dynamics of coral pHi during light exposure c) determining whether pHi 85
values vary on exposure to a range of irradiance levels lying within the corals photosynthesis-86
irradiance (PI) response curve d) and examining the rate of pHi recovery under darkness. To 87
achieve this we analysed pHi in cells isolated from the reef coral Stylophora pistillata (Esper, 88
1797) by confocal microscopy and the pH sensitive intracellular probe (SNARF-1). We 89
monitored pHi in symbiont-containing and symbiont-free cells under controlled conditions of 90
constant seawater pH and oxygen levels in flowing seawater to focus on the effect of 91
intracellular mechanisms. 92
93
94
Materials and Methods 95

The
Jou
rnal
of
Exp
erim
enta
l Bio
logy
– A
CC
EPT
ED
AU
TH
OR
MA
NU
SCR
IPT
4
Coral culture and preparation of cells 96
S. pistillata colonies were maintained at the Centre Scientifique de Monaco in aquaria 97
supplied with flowing Mediterranean seawater (salinity: 38.2) with a 2% h-1 exchange rate, at 98
25 ± 0.5°C. Irradiance levels were provided at 275 µmol photons m-2 s-1 photosynthetically 99
active radiation (PAR) on a 12 h light:dark cycle. Corals were fed 4 times a week with frozen 100
shrimps, krill and live Artemia salina naupii (Linnaeus, 1758). Cells were isolated from 101
branches of S.pistillata colonies immediately before each experiment, by gentle brushing of 102
the tissue with soft bristle tooth brush into 50 ml filtered seawater (FSW). The resulting cell 103
suspension was centrifuged once (350g, 4 min) and the pellet of cells re-suspended in FSW 104
(described previously (Venn et al., 2009)). In the case of experiments on the photosynthetic 105
response of coral cells to irradiance (PI response), preparations of isolated cells were adjusted 106
to density of 2.5. 106 cells. mL-1 and a 3 ml aliquot was taken for oxygen electrode analysis. 107
A second aliquot (5 ml) was stored frozen (-20 ºC) for quantification of chlorophyll (Chl). 108
For pHi experiments, cell preparations were adjusted to density of 2.5. 105 cells. mL-1 with 109
FSW. Viability staining using AnnexinV-conjugate (Invitrogen, Grand Island, NY, USA) and 110
Sytox-green (Invitrogen) confirmed cells remained viable during experiments as in previous 111
study (Venn et al., 2009). 112
113
Analysis of the photosynthetic response of cell preparations to irradiance by oxygen 114
electrode 115
Cell preparations were transferred to a closed combined plate chamber (Hydro-Bios, Halifax, 116
Nova Scotia, Canada) illuminated by a fibre optic variable-irradiance light source (Bioblock, 117
Fisher Scientific, Illkirch, France, with a Philips 21V 150W Halogen bulb). The cell 118
suspension in the cuvette was agitated using a magnetic stirrer and was maintained at 25 ± 119
0.5°C by a recirculating water bath. An oxygen optode sensor system (oxy-4 mini, PreSens, 120
Regensburg, Germany) was used to quantify oxygen flux. Samples were exposed to 121
irradiance after a period of steady dark respiration rate, to increasing irradiances (0, 20, 40, 122
60, 100, 150, 200, 300, 500, 800, 1000 µmol photons m-2 s-1). Irradiance levels were 123
measured by a 2π quantum light meter (LI-Cor LI-250A, Lincoln, Nebraska, USA) and were 124
controlled by varying the light source settings and the distance between light source and the 125
sample. For each value of light intensity the rate of oxygen production/uptake was quantified 126
for 4 min once stable values were reached. Data were recorded with OXY4v2_11FB software 127
(PreSens). 128

The
Jou
rnal
of
Exp
erim
enta
l Bio
logy
– A
CC
EPT
ED
AU
TH
OR
MA
NU
SCR
IPT
5
Chlorophyll measurements 129
Aliquots stored for chlorophyll analysis were thawed, centrifuged (8 000 x g for 10 min at 130
4°C) and resuspended in 5 mL fresh acetone (100%). Samples were vortexed, then incubated 131
overnight at 4°C and centrifuged (11 000 g for 15 min, 15°C) to remove cell debris. An 132
aliquot of 2.5 mL of the supernatant was used to measure absorbance at 750, 663, and 630 nm 133
using a spectrophotometer (SAFAS UV mc2, MC, Monaco). Concentrations of chlorophyll a 134
and C2 were calculated using the equations of Jeffrey and Humphrey (Jeffrey and Humphrey, 135
1975). 136
Calculating the PI response curve 137
Oxygen flux was expressed per chltotal concentration. The PI curve (Fig. 1) was fitted 138
iteratively to the data to create a non linear regression values using the following exponential 139
equation as in previous studies (Romaine et al., 1997; Ferrier-Pagès et al., 2000) : 140
Pnet = Pgmax [1 – exp(-I/Ik)] + R (1) 141
Where Pnet is the net photosynthetic rate (µmol O2 µg Chl-1 min-1), Pgmax is the gross 142
maximum photosynthetic rate (µmol O2 µg Chl-1 min-1), I is the irradiance (µmol photons m-2 143
s-1), Ik is the irradiance at which the initial slope (α) intersects Pgmax (µmol photons m-2 s-1), 144
and R is the respiration rate in the dark (µmol O2 µg Chl-1 min-1). 145
146
Analysis of pHi in coral cells by confocal microscopy 147
One millilitre aliquots of cell preparations (described in (a)) were transferred to an open 148
perfusion chamber (POC cell cultivation system, PECON, Erbach, Germany) and mixed with 149
2 ml of the cell permeant acetoxymethyl ester acetate of SNARF-1 (SNARF-1 AM) 150
(Invitrogen) in FSW (10 µM SNARF-1 AM, 0.01% pluronic F-127, and 0.1% DMSO 0.01%). 151
Cell preparations were then dark incubated for 30 min at 25 ºC to load cells with SNARF-1 152
AM and washed by 5 min perfusion with FSW in the dark to remove residual traces of the 153
dye. 154
SNARF-1 fluorescence was measured by confocal microscope (Leica SP5, Buffalo 155
Grove, IL, USA) and calibrated to pHi (NBS scale) by methods published previously (Venn et 156
al., 2009). Briefly, cells were excited at 543 nm and SNARF-1 fluorescence emission was 157
captured in 2 channels at 585 and 640 ± 10 nm whilst simultaneously monitoring in 158
transmission. In cells containing symbiont, the use of 543 nm as the excitation wavelength 159
minimized chlorophyll autofluorescence, as 543 nm lies outside of absorption spectra of 160

The
Jou
rnal
of
Exp
erim
enta
l Bio
logy
– A
CC
EPT
ED
AU
TH
OR
MA
NU
SCR
IPT
6
chlorophyll a and in low region of absorption of the Peridinin-Chlorophyll-Protein complex 161
(Frank and Cogdell, 1996). pHi image analysis was performed using LAF-AS software 162
(Leica) using digital regions of interest (ROI) to confine fluorescence analysis to the coral cell 163
cytoplasm, avoiding dinoflagellate symbionts and its autofluorescent inclusion bodies that 164
appear with extended exposure time (Kazandjian et al., 2008) (Fig. 2). The 585/640 nm 165
fluorescence intensity ratio (r) was calculated after subtracting background fluorescence 166
recorded in a second ROI in the surrounding cell media. r was related to pHi by the following 167
equation: 168
pH = pKa – log [r – rB/rA – r × FB(�2) / FA(�2)] (2) 169
where (F) is fluorescence intensity measured at 640 nm (�2) and the subscripts A and 170
B represent the values at the acidic and basic end points of the calibration respectively. 171
Intracellular calibration of pHi with SNARF-1 was performed for each experiment in vivo by 172
ratiometric analysis of SNARF-1 fluorescence in cells exposed to buffers ranging from pH 6 173
to pH 8.5 containing the ionophore nigericin (Venn et al., 2009). 174
The fluorescence ratio of SNARF-1 was sensitive to differences in illumination 175
provided by the Halogen lamp used for photosynthesis and pHi experiments in the light. 176
These changes were not related to photodegradation, but rather to the weak excitation of the 177
dye by the wider spectral range of illumination added by the lamp. As such, it was necessary 178
to perform in vivo calibrations for each light level used in the investigation. 179
180
Experiments to determine the influence of photosynthesis on pHi 181
In all pHi experiments, cell preparations were perfused at a rate of 50 mL/h and temperature 182
maintained at 25°C by a thermostatic microscope stage insert (PECON). Illumination was 183
provided by the same-irradiance halogen lamp used for the PI response experiments. 184
Three sets of experiments were performed to investigate the influence of 185
photosynthesis on pHi. The first set of experiments compared the response of coral cell pHi in 186
the presence and absence of the photosynthetic inhibitor 3-(3,4-Dichlorophenyl)-1,1-187
dimethylurea (DCMU, Sigma-Aldrich, St-Louis, MO, USA). Experiments were carried out 188
over 30 min during which cell preparations were perfused with a seawater solution containing 189
100 µM DCMU and 0.1% acetone (DCMU stock solutions were prepared in acetone) or a 190
control seawater solution containing 0.1% acetone. pHi measurements were made on 191
symbiont-containing and symbiont-free cells in the dark or under irradiance at 300 µmol 192
photons m-2 s-1 in the presence and absence of DCMU. Measurements were taken at 1, 5, 10, 193
The
Jou
rnal
of
Exp
erim
enta
l Bio
logy
– A
CC
EPT
ED
AU
TH
OR
MA
NU
SCR
IPT
7
15, 20, 25 and 30 min. Separate experiments conducted by oxygen electrode analysis (as 194
described in (b)) confirmed that 100 µM DCMU was sufficient to block photosynthetic 195
evolution of oxygen by coral cell preparations (data not shown). 196
The second set of experiments examined the influence of light intensity on pHi 197
dynamics of coral cells. We examined the pHi dynamics of coral cells containing symbionts 198
on exposure to various light levels, experiments were conducted over 30 minutes at each light 199
level (dark, 50, 100, 200, 250, 300, 400, 500 and 800 µmol photons m-2 s-1). Measurements 200
were taken at 1, 5, 10, 15, 20, 25 and 30 min. Values at 0 min were obtained using a separate 201
calibration, with cells analysed immediately after SNARF-1 loading and washing with no 202
light exposure and are presented with the time course data. 203
In the third set of experiments, we investigated pHi dynamics on return to darkness 204
after exposure to light. Cells were exposed to 400 µmol photons m-2 s-1 during 20 minutes 205
before measurements were taken for 35 minutes at 0 µmol photons m-2 s-1. 206
In all three sets of experiments, 5 cells were measured at each time point and 207
experiments were conducted three times for each cell type, light level and treatment. 208
Preliminary tests were performed to see whether oxygen levels or pH values shifted in 209
the seawater in the perfusion chamber during the course of the experiments under the range of 210
light levels used. Oxygen levels were monitored by placing a needle type oxygen 211
microsensor (PreSens) in the seawater within the perfusion chamber and values were recorded 212
with TX3v602 software (PreSens). Seawater pH was monitored by adding SNARF-1 to the 213
perfused seawater and measuring the fluorescence ratiometrically as described previously 214
(Venn et al., 2011). 215
pHi data were analysed using SPSS statistical software by repeated measures ANOVA 216
or one way ANOVA after establishing that data conformed to a normal distribution and 217
homogeneity of variance. 218
219
Results 220
Photosynthesis-irradiance response of isolated cell preparations 221
Prior to performing analysis of pHi in coral endoderm cells, we characterized the PI 222
relationship of isolated cell preparations (Fig. 1). Generation of a PI curve established that the 223
maximum rate of photosynthesis was reached around 300 µmol photons m-2 s-1 PAR and 224
remained stable up 1000 µmol photons m-2 s-1. 225
226

The
Jou
rnal
of
Exp
erim
enta
l Bio
logy
– A
CC
EPT
ED
AU
TH
OR
MA
NU
SCR
IPT
8
Establishing the link between coral cell pHi and symbiont photosynthesis 227
Coral cell pHi was analysed using ratiometric analysis of the pH sensitive dye SNARF-1 AM 228
in cells with and without symbionts (Fig. 2). In symbiont containing cells, the low pH 229
symbiosome was visible around the dinoflagellate as described previously (Venn et al., 2009). 230
When symbiont-containing cells were exposed to light in the absence and presence of DCMU, 231
pHi significantly increased in control (non DCMU treated) cells from pH 7.03 ± 0.03 to pH 232
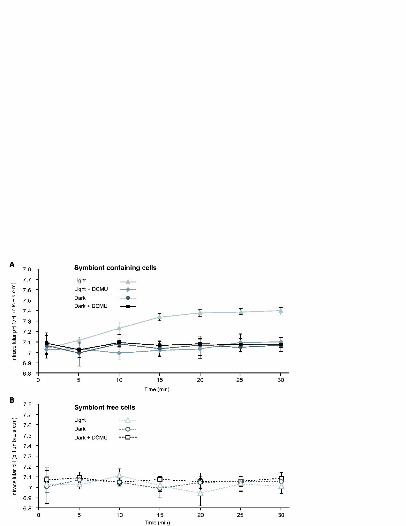
7.37 ± 0.03 over 20 min (repeated measures ANOVA F(6,84) = 17.372, P < 0.001), while pHi in 233
DCMU treated cells remained unchanged (pH 7.04 ± 0.03) (Figs.3A) (repeated measures 234
ANOVA F(6,84) = 0.557, P > 0.05). pHi also remained unchanged in symbiont-containing cells 235
exposed to dark conditions (with and without DCMU) (Fig. 3A) and in symbiont-free cells in 236
the light and dark (with and without DCMU) (Fig. 3B). Separate experiments that monitored 237
external seawater [O2] and pH (pHsw) by oxygen and pH electrode showed the renewal 238
seawater in the perfusion chamber was sufficient to keep [O2] and pHsw stable throughout the 239
30 min exposure to 300 µmol photons m-2 s-1 (Supplemental information Fig. S1) and the full 240
range of irradiances used in subsequent experiments (not shown). 241
242
The impact of irradiance level and duration on pHi in coral cells containing symbionts 243
pHi was measured in coral cells containing dinoflagellate symbionts exposed to a range of 244
light levels (0 to 800 µmol) for 30 min (Fig. 4). pHi increased over the course of the 245
experiment at all light levels, but remained stable in cells kept in the dark. pHi did not 246
increase immediately on exposure to lower irradiances. At irradiances of 50 to 250 µmol 247
photons m-2 s-1, a lag phase of 10 min occurred before significant increases in pHi were 248
measured (Fig. 4, table 1). At 300 µmol photons m-2 s-1, this lag phase shortened to 5 min. 249
For irradiances of 400 µmol photons m-2 s-1 and above, values of pHi measured were higher 250
than dark values at 1 min, suggesting that pHi increases occurred with the first minute of light 251
exposure. Following 20 min of light exposure, pHi values reached a plateau at all irradiances, 252
with successively higher values of pHi associated with higher irradiances. Highest pHi values 253
(ranging from pH 7.4-7.46) were measured at 300 µmol photons m-2 s-1 and above 254
(supersaturating irradiances) (Fig. 4, table 1). 255
256
Recovery of pHi in the dark 257
Having established that host pHi reaches a plateau at pH 7.4-7.46 after 20 min of 258
supersaturing irradiance, we investigated whether pHi declined if cells were returned to dark 259

The
Jou
rnal
of
Exp
erim
enta
l Bio
logy
– A
CC
EPT
ED
AU
TH
OR
MA
NU
SCR
IPT
9
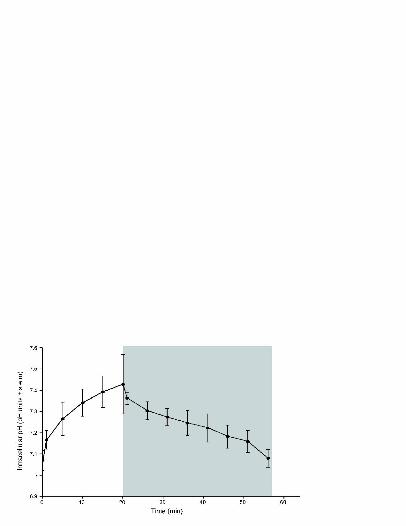
conditions. After increasing to values of pH 7.36 on exposure to 400 µmol photons m-2 s-1 , 260
pHi significantly declined in the dark to 7.08 ± 0.04 over 35 min (Fig. 5) (repeated measures 261
ANOVA F(8,104) = 2.850, P < 0.05). This value was similar to initial values (prior to light 262
exposure) and pHi values in symbiont-free cells. 263
264
Discussion 265
The results of the current study demonstrate that the photosynthetic activity of coral 266
symbionts drives changes in coral host pHi in an irradiance intensity dependant manner. To 267
our knowledge this is the first characterisation of the role of algal photosynthesis in altering 268
pH in the cytoplasm of an animal host. In the first part of the investigation we tested whether 269
changes in coral pHi could be blocked in the presence of a photosynthetic inhibitor. After 270
determining the value of irradiance for maximal rate of photosynthesis, we conducted 271
experiments with the photosynthetic inhibitor DCMU. This inhibitor has been widely used in 272
experiments on coral symbionts (Jones, 2004), free-living algae and plants (Garrigue et al., 273
1992) as it blocks photosystem II by binding to plastoquinone inhibiting the light reactions of 274
photosynthesis. Our experiments showed that while control symbiont-containing cells 275
exposed to a saturating irradiance of 300 µmol photons m-2 s-1 displayed a significant increase 276
of 0.3 pH units in pHi, symbiont-containing cells treated with DCMU exhibited no changes in 277
pHi over a 30 min period. As the pHi of DCMU-treated cells was not distinguishable from 278
pHi of cells kept in the dark nor cells that did not contain symbionts in the light or dark, it is 279
likely that DCMU did not alter coral cell pHi regulation by mechanisms other than inhibiting 280
photosynthesis. 281
One possible way that photosynthesis may induce an increase in pHi of host cells was 282
through modifications of the surrounding seawater in the perfusion chamber during the time 283
course of each experiment, such as an increase in pH resulting from CO2 removal from 284
seawater by the cells. Indeed acid/base balance of most organisms may be affected by 285
changes in the pH of the surrounding environment (Boron, 2004). We ruled this possibility 286
out, by perfusing cell preparations with FSW at a rate which kept pH and O2 levels stable in 287
the perfusion chamber in all our treatments. Thus our data point to a role of symbiont 288
photosynthesis in modifying the pH of host cytoplasm by intracellular mechanisms rather than 289
changes in the pH of the surrounding media. One likely candidate mechanism is the 290
photosynthetic consumption of intracellular CO2. Depletion of CO2 from the cytoplasm will 291
cause the conversion of HCO3- (the dominant form of dissolved inorganic carbon in the cell) 292

The
Jou
rnal
of
Exp
erim
enta
l Bio
logy
– A
CC
EPT
ED
AU
TH
OR
MA
NU
SCR
IPT
10
to CO2 + H2O, consuming protons which would contribute to alkalisation of the cell 293
(Allemand et al., 1998). Conversely, the observed recovery in pHi occurring in darkness after 294
pre-exposure to irradiance may be due to net production of CO2. CO2 is produced by both 295
host and symbiont respiration in the dark, and combined with H2O is converted back to HCO3- 296
and H+ which acidifies the cell. 297
In the following stages of the study we investigated the dynamics of pHi on exposure 298
to a range of light levels. Several observations taken from these experiments provide insight 299
into the mechanisms underlying how photosynthesis may drive pHi changes in corals. 300
Concerning the dynamics of pHi, the important result is that the presence of a lag-phase is 301
dependent on the light intensity. Indeed, there is a 10 min time lag between the beginning of 302
the exposure to light and when increases in pHi occur for irradiances that ranged from 0 to 303
250 µmol photons m-2 s-1. This time lag is absent for higher irradiances (300-800 µmol 304
photons m-2 s-1) as increases in pHi occur earlier in the time course. The existence of the time 305
lag could be interpreted as evidence for the gradual depletion of a CO2 pool that built up 306
within dinoflagellate cells and the symbiosome membrane complex during dark loading with 307
SNARF-1 AM, delaying the eventual consumption of CO2 from host cells. In this scenario, 308
the depletion of the dinoflagellate CO2 pool occurs more rapidly at higher irradiances (when 309
rates of photosynthesis are higher) and thus removal of CO2 from the host cell and the 310
resulting increases in host pHi occurs at an earlier point in the time course. 311
Concerning the influence of irradiance levels on pHi values, the primary observation 312
is that pHi values plateau after 20 min at all light intensities and the value of pHi at the 313
plateau increases with increasing light intensity. Maximum pHi values (pHi 7.4-7.46) were 314
obtained at the maximum rate of photosynthesis and supersaturating light levels. As pHi 315
increases do not surpass values of 7.46, it is likely that after a 20 min delay, regulatory 316
mechanisms intervene to prevent pHi increasing indefinitely in the cell. Membrane bound 317
transporters involved in the regulation of pHi, well-known in many organisms but yet to be 318
characterized in corals, are likely to be involved in this process (Casey et al., 2010). These 319
may include extruders of OH- and bicarbonate-linked transport mechanisms which are highly 320
important for pHi regulation (Russel and Boron, 1976; Furla et al., 2000; Bonar and Casey, 321
2008) and potentially also important for DIC transport and CO2-concentrating mechanisms 322
(CCM) in corals (Al-Moghrabi et al., 1996; Allemand et al., 1998; Brownlee, 2009). 323
Similarly we presume that regulation by membrane bound transporters, particularly acid 324
extruders, contribute to the stable values of pH obtained in darkness (pH 7.05). Additionally 325
as CO2 regularly traverses cell membranes and as the pCO2 of cnidarians cells is estimated to 326
The
Jou
rnal
of
Exp
erim
enta
l Bio
logy
– A
CC
EPT
ED
AU
TH
OR
MA
NU
SCR
IPT
11
be higher than the surrounding seawater (Venn et al., 2009), respiratory CO2 may also leak 327
out of the cell. 328
In our study external variation in seawater pH was deliberately controlled in order to 329
identify intracellularly driven pHi variations. However, one important avenue of future 330
research will be to characterize the interaction of photosynthesis-driven changes in coral pHi 331
with changes in extracellular pH in both the coelenteron lumen and the external seawater pH. 332
The previous studies on pH at the corals surface have characterised pH variation in the 333
diffusive boundary layer (Kühl et al., 1995; De Beer et al., 2000; Al-Horani et al., 2003). For 334
example working with microsensors and the coral Galaxea fasicularis, Al Horani and 335
coworkers observed variations of Diffusive Boundary layer (DBL) pH ranging from pH 7.6 in 336
the dark to 8.5 in the light (Al-Horani et al., 2003). In the coelenteron, variations of 0.6 pH 337
units have been measured between light and dark conditions (Al-Horani et al., 2003). These 338
data from the coelenteron may be of particular relevance when considering our results in 339
context of the intact organism, because coral symbionts reside in the endoderm cell layer 340
lining the coelenteron, rather than directly facing the surrounding seawater. The mechanistic 341
basis underlying these changes in coelenteron pH may be linked to regulation of pHi at the 342
maximum and minimum pHi values observed under constant conditions in the current study. 343
Under irradiance, membrane bound transporters that prevent intracellular pH rising above pH 344
7.46, such as extrusion of OH- / or uptake of H+ may drive alkalinisation of the coelenteron 345
(Furla et al., 2000). Equally regulatory mechanisms that prevent decreases in pHi below 7.05 346
may involve extrusion of H+ that reduces pH in the coelenteron. 347
Together with pH in the DBL and coelenteron, changes in pHi are pieces in a puzzle 348
that will eventually lead towards a better understanding of ion gradients and ion transport 349
(particularly H+ and DIC) across coral tissues. Such an understanding is imperative for a 350
better grasp of the physiological response of corals to environmental change such as ocean 351
acidification (reduced seawater pH driven by ocean uptake of anthropogenic CO2). A recently 352
published hypothesis by Jokiel illustrates this point. Jokiel (2011) argues that reduced rates of 353
calcification in corals exposed to ocean acidification arise through a decrease in the proton 354
gradient across the DBL impeding the efflux of protons generated by the calcification reaction 355
(Jokiel, 2011). It is proposed that photosynthesis may alleviate this unfavourable gradient by 356
increasing pH in the DBL during daylight hours. Allemand et al. (2004) have argued that 357
increases in pH of the coelenteron may also provide a more favourable gradient for the 358
movement of protons from away the site of calcification (Allemand et al., 2004). Much future 359
research is still required to address gaps in our understanding of how protons and other ions 360
The
Jou
rnal
of
Exp
erim
enta
l Bio
logy
– A
CC
EPT
ED
AU
TH
OR
MA
NU
SCR
IPT
12
are transported across coral tissues however. Indeed, the relative contributions of paracellular 361
and transcellular flux of ions in corals are still a matter of debate (Tambutté et al., 2011). 362
In conclusion, the present study provides fundamental information about how 363
symbiont photosynthesis changes coral host pHi. Such information provides a basis to future 364
studies into acid-base regulation that are essential for a better understanding of coral biology 365
in general. In eukaryotes, shifts in pHi of 0.1 pH units and greater are usually associated with 366
changes in primary metabolic processes such as respiration rate, protein synthesis, cell 367
division and cell cycle progression (Busa and Nucitelli, 1984; Madshus, 1988; Kurkdjian and 368
Guern, 1989; Boussouf and Gaillard, 2000; Denker et al., 2000; Putney and Barber, 2003). It 369
follows therefore that the relatively large light-dependant shifts in pHi observed in the current 370
study have the potential to contribute many physiological processes, including diel patterns of 371
coral metabolism and growth. Physiological tuning of coral metabolism to light has been 372
studied for several years. The expression of genes and proteins linked to cellular redox states, 373
division rates of both endoderm cells and symbionts, and rates of calcification all show diel 374
periodicity (Wilkerson et al., 1983; Fitt, 2000; Levy et al., 2006; Levy et al., 2011; Tambutté 375
et al., 2011). The potential role of light-driven pHi variation in contributing to regulation of 376
coral cell physiology is worthy of future research. 377
378
Acknowledgements 379
We thank Dominique Desgré for coral maintenance. We thank Natacha Segonds and Claire 380
Godinot for their technical help, and Michael Holcomb for fruitful discussion. 381
382
Funding 383
This study was conducted as part of the Centre Scientifique de Monaco Research Program, 384
supported by the Government of the Principality of Monaco. J.L. was supported by a 385
fellowship from the Centre Scientifique de Monaco. 386
387
388
389
References 390
Al-Horani, F. A., Al-Moghrabi, S. M. and de Beer, D. (2003). The mechanism of calcification and its 391
relation to photosynthesis and respiration in the scleractinian coral Galaxea fascicularis. Mar Biol 392
142, 419-426. 393
Al-Moghrabi, S., Goiran, C., Allemand, D., Speziale, N. and Jaubert, J. (1996). Inorganic carbon 394
uptake for photosynthesis by the symbiotic coral/ dinoflagellate association II. Mechanisms for 395
bicarbonate uptake. J Exp Mar Biol Ecol 199, 227-248. 396
The
Jou
rnal
of
Exp
erim
enta
l Bio
logy
– A
CC
EPT
ED
AU
TH
OR
MA
NU
SCR
IPT
13
Allemand, D., Furla, P. and Bénazet-Tambutté, S. (1998). Mechanisms of carbon acquisition for 397
endosymbiont photosynthesis in Anthozoa. Can J Bot 76, 925-941. 398
Allemand, D., Ferrier-Pagès, C., Furla, P., Houlbrèque, F., Puverel, S., Reynaud, S., Tambutté, É., 399
Tambutté, S. and Zoccola, D. (2004). Biomineralisation in reef-building corals: from molecular 400
mechanisms to environmental control. C R Paleoevol 3, 453-467. 401
Anthony, K. N. R., Kline, D. I., Diaz-Pulido, G., Dove, S. and Hoegh-Guldberg, O. (2008). Ocean 402
acidification causes bleaching and productivity loss in coral reef builders. Proc Natl Acad Sci USA 105, 403
17442-17446. 404
Bonar, P. T. and Casey, J. R. (2008). Plasma membrane Cl-/HCO3
- exchangers: Structure, mechanism 405
and physiology. Channels 2, 337-345. 406
Boron, W. F. (2004). Regulation of intracellular pH. Physiol Educ 28, 160-179. 407
Boussouf, A. and Gaillard, S. (2000). Intracellular pH changes during oligodendrocyte differentiation 408
in primary culture. J Neurosci Res 59, 731-739. 409
Brownlee, C. (2009). pH regulation in symbiotic anemones and corals: a delicate balancing act. Proc 410
Natl Acad Sci USA 106, 16541-16542. 411
Busa, W. and Nucitelli, R. (1984). Metabolic regulation via intracellular pH. Am J Physiol 246, 409-412
438. 413
Busa, W. B. (1986). Mechanisms and Consequences of pH-Mediated Cell Regulation. Annu Rev 414
Physiol 48, 389-402. 415
Casey, J. R., Grinstein, S. and Orlowski, J. (2010). Sensors and regulators of intracellular pH. Nat Rev 416
Mol Cell Biol 11, 50-61. 417
Crawley, A., Kline, D. I., Dunn, S., Anthony, K. E. N. and Dove, S. (2010). The effect of ocean 418
acidification on symbiont photorespiration and productivity in Acropora formosa. Global Change Biol 419
16, 851-863. 420
De Beer, D., Kühl, M., Stambler, N. and Vaki, L. (2000). A microsensor study of light enhanced Ca2+ 421
uptake and photosynthesis in the reef-building hermatypic coral Favia sp. Mar Ecol Prog Ser 194, 75-422
85. 423
Denker, S. P., Huang, D. C., Orlowski, J., Furthmayr, H. and Barber, D. L. (2000). Direct Binding of the 424
Na-H Exchanger NHE1 to ERM Proteins Regulates the Cortical Cytoskeleton and Cell Shape 425
Independently of H+ Translocation. Mol Cell 6, 1425-1436. 426
Dubbin, P. N., Cody, S. H. and Williams, D. A. (1993). Intracellular pH mapping with SNARF-1 and 427
confocal microscopy. II: pH gradients within single cultured cells. Micron 24, 581-586. 428
Ferrier-Pagès, C., Gattuso, J. P., Dallot, S. and Jaubert, J. (2000). Effect of nutrient enrichment on 429
growth and photosynthesis of the zooxanthellate coral Stylophora pistillata. Corel Reefs 19, 103-113. 430
Fitt, W. K. (2000). Cellular growth of host and symbiont in a cnidarian-zooxanthellae symbiosis. Biol 431
Bull 198, 110-120. 432
Frank, H. A. and Cogdell, R. J. (1996). Carotenoids in Photosynthesis. Photochem Photobiol 63, 257-433
264. 434
Furla, P., Galgani, I., Durand, I. and Allemand, D. (2000). Sources and mechanisms of inorganic 435
carbon transport for coral calcification and photosynthesis. J Exp Biol 203, 3445-3457. 436
Garrigue, C., Clavier, J. and Boucher, G. (1992). The use of photosynthesis inhibitor (DCMU) for in 437
situ metabolic and primary production studies on soft bottom benthos. Hydrobiologia 246, 141-145. 438
Hoegh-Guldberg, O. (1999). Climate change, coral bleaching and the future of the world's coral reefs. 439
Mar Freshwater Res 50, 839-866. 440
Hoegh-Guldberg, O., Mumby, P.-J., Hooten, A. J., Steneck, R. S., Greenfield, P., Gomez, E., Harvell, 441
C. D., Sale, P. F., Edwards, A. J., Caldeira, K. et al. (2007). Coral reefs under rapid climate change and 442
ocean acidification. Science 318, 1737-1742. 443
Jeffrey, S. W. and Humphrey, G. F. (1975). New spectrophotometric equations for determining 444
chlorophylls a, b, c1 and c2 in higher plants, algae and natural phytoplankton. Biochem Physiol 445
Pflanzen 167, 191-194. 446
Jokiel, P. L. (2011). Ocean acidification and control of reef coral calcification by boundary layer 447
limitation of proton flux. Bull Mar Sci 87, 639-657. 448

The
Jou
rnal
of
Exp
erim
enta
l Bio
logy
– A
CC
EPT
ED
AU
TH
OR
MA
NU
SCR
IPT
14
Jones, R. J. (2004). Testing the 'photoinhibition' model of coral bleaching using chemical inhibitors. 449
Mar Ecol Prog Ser 284, 133-145. 450
Kazandjian, A., Shepherd, V. A., Rodriguez-Lanetty, M., Nordemeier, W., Larkum, A. W. D. and 451
Quinnell, R. G. (2008). Isolation of symbiosomes and the symbiosome membrane complex from the 452
zoanthid Zoanthus robustus. Phycologia 47, 294-306. 453
Kühl, M., Cohen, Y., Dalsgaard, T., Jorgensen, B. B. and Revsbech, N. P. (1995). Microenvironment 454
and photosynthesis of zooxanthellae in scleractinian corals studied with microsensors for O2, pH and 455
light. Mar Ecol Prog Ser 117, 159-172. 456
Kurkdjian, A. and Guern, J. (1989). Intracellular pH: Measurement and Importance in Cell Activity. 457
Annu Rev Plant Phys 40, 271-303. 458
Lemasters, J. J., Trollinger, D. R., Qian, T., Cascio, W. E. and Ohata, H. (1999). Confocal Imaging of 459
Ca2+
, pH, Electrical Potential, and Membrane Permeability in Single Living Cells. Meth Enzymol 302. 460
Lesser, M. P. (2007). Coral reef bleaching and global climate change: can corals survive the next 461
century. Proc Natl Acad Sci USA 104, 5259-5260. 462
Levy, O., Achituv, Y., Yacobi, Y. Z., Dubinsky, Z. and Stambler, N. (2006). Diel 'tuning' of coral 463
metabolism: Physiological responses to environmental light cues. J Exp Biol 209, 273-283. 464
Levy, O., Kaniewska, P., Alon, S., Eisenberg, E., Karako-Lampert, S., Bay, L. K., Reef, R., Rodriguez-465
Lanetty, M., Miller, D. J. and Hoegh-Guldberg, O. (2011). Complex diel cycles of gene expression in 466
coral-algal symbiosis. Science 331, 175. 467
Madshus, I. H. (1988). Regulation of intracellular pH in eukaryotic cells. Biochem J 250, 1-8. 468
Muscatine, L. (1990). The role of symbiotic algae in carbon and energy flux in reef corals. In Coral 469
reefs, (ed. Z. Dubinsky), pp. 75-84. Amsterdam: Elsevier. 470
Putney, L. K. and Barber, D. L. (2003). Na-H Exchange-dependent Increase in Intracellular pH Times 471
G2/M Entry and Transition. J Biol Chem 278, 44645-44649. 472
Raven, J. A. and Smith, F. A. (1980). Intracellular pH Regulation in the Giant-Celled Marine Alga 473
Chaetomorpha darwinii. J Exp Bot 31, 1357-1369. 474
Romaine, S., Tambutté, E., Allemand, D. and Gattuso, J. P. (1997). Photosynthesis, respiration and 475
calcification of a zooxanthellate scleractinian coral under submerged and exposed conditions. Mar 476
Biol 129, 175-182. 477
Roos, A. and Boron, W. F. (1981). Intracellular pH. Physiol Rev 61, 296-434. 478
Russel, J. M. and Boron, W. F. (1976). Role of chloride transport in regulation of intracellular pH. 479
Nature 264, 73-74. 480
Smith, F. A. and Raven, J. A. (1979). Intracellular PH and its Regulation. Ann Rev Plant Physio 30, 289-481
311. 482
Tambutté, S., Holcomb, M., Ferrier-Pagès, C., Reynaud, S., Tambutté, É., Zoccola, D. and Allemand, 483
D. (2011). Coral biomineralization: From the gene to the environment. J Exp Mar Biol Ecol 408, 58-78. 484
Trench, R. K. (1993). Microalgal-invertebrate symbioses: a review. Endocytobiosis and Cell Research 485
9, 135-176. 486
Venn, A.A., Tambutté, E., Holcomb, M., Allemand, D. and Tambutté, S. (2011). Live Tissue Imaging 487
Shows Reef Corals Elevate pH under Their Calcifying Tissue Relative to Seawater. PLoS One 6, e20013. 488
Venn, A. A., Loram, J. E. and Douglas, A. E. (2008). Photosynthetic symbioses in animals. J Exp Bot 489
59, 1069-1080. 490
Venn, A. A., Tambutté, E., Lotto, S., Zoccola, D., Allemand, D. and Tambutté, S. (2009). Imaging 491
intracellular pH in a reef coral and symbiotic anemone. Proc Natl Acad Sci USA 106, 16574-16579. 492
Weis, V. M. and Allemand, D. (2009). What Determines Coral Health? Science 324, 1153-1155. 493
Weis, V. M., Davy, S. K., Hoegh-Guldberg, O., Rodriguez-Lanetty, M. and Pringle, J. R. (2008). Cell 494
biology in model systems as the key to understanding corals. Trends Ecol Evol(Personal edition) 23, 495
369-376. 496
Wilkerson, F. P., Muller Parker, G. and Muscatine, L. (1983). Temporal patterns of cell division in 497
natural populations of endosymbiotic algae. Limnol Oceanogr 28, 1009-1014. 498

The
Jou
rnal
of
Exp
erim
enta
l Bio
logy
– A
CC
EPT
ED
AU
TH
OR
MA
NU
SCR
IPT
15
Yellowlees, D., Rees, T. A. V. and Leggat, W. (2008). Metabolic interactions between algal symbionts 499
and invertebrate hosts. Plant Cell Environ 31, 679-694. 500
501
Symbols/abbreviations 502
pHi: intracellular pH 503
SNARF-1: carboxyseminaphthorhodafluor-1 504
PI: photosynthesis-irradiance 505
PAR: photosynthetically active radiation 506
FSW: filtered seawater 507
Chl: chlorophyll 508
PI response: photosynthetic response of coral cells to irradiance 509
Pnet: net photosynthetic rate 510
Pgmax: gross maximum photosynthetic rate 511
I: irradiance 512
Ik: irradiance at which the initial slope (α) intersects Pgmax 513
R: respiration rate in the dark 514
SNARF-1 AM: cell permeant acetoxymethyl ester acetate of SNARF-1 515
ROI: regions of interest 516
r: fluorescence intensity ratio 517
F: fluorescence intensity 518
�2: 640 nm 519
DCMU: 3-(3,4-Dichlorophenyl)-1,1-dimethylurea 520
pHsw: pH seawater 521
CCM: CO2-concentrating mechanisms 522
DBL: diffusive boundary layer 523
524
525
526
Fig. 1. Photosynthesis-irradiance (PI) curve. Net photosynthesis (nmol O2 µgChl-1 min-1 ± s.d) 527
of isolated cells from S.pistillata (n = 5) exposed to different irradiance levels (from 0 to 1000 528
µmol photons m-2 s-1). Maximum rate of photosynthesis Pmax = 3.33 µmol O2 Chl-1 min-1, 529
saturating irradiance Ik = 74.47 µmol m-2 s-1, photosynthetic efficiency α = 0.052 and 530
respiration R = -0.56 µmol O2 µg Chl-1 min-1. Goodness of fit r2 = 0.6789. 531
532
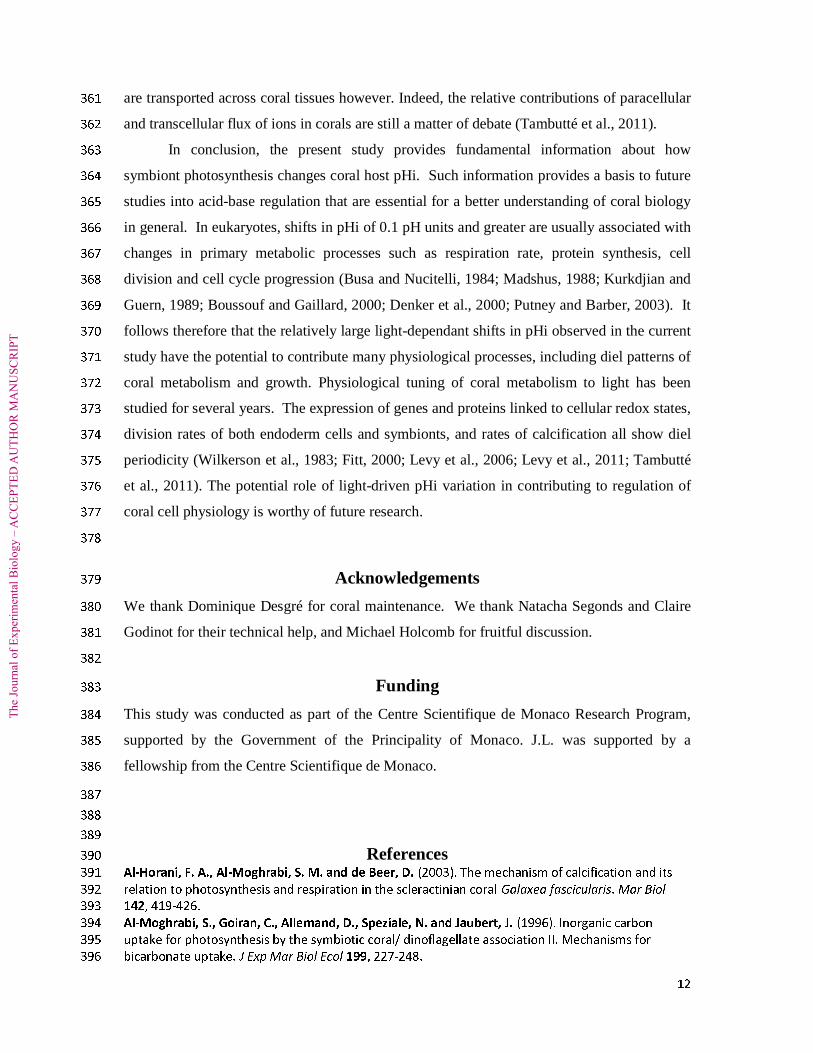
Fig. 2. Ratiometric image of SNARF-1 AM emission (585 and 640 nm) in isolated cells of S. 533
pistillata exposed for 30 min to 300 µmol photons m-2 s-1 irradiance. (A) Cell containing a 534
dinoflagellate symbiont and (B) symbiont-free cell. c = animal cytoplasm, di = dinoflagellate, 535
sb = symbiosome membrane complex, ib = Inclusion body. White circle = ROI (region of 536
The
Jou
rnal
of
Exp
erim
enta
l Bio
logy
– A
CC
EPT
ED
AU
TH
OR
MA
NU
SCR
IPT
16
interest) in host cytoplasm used for pH measurements. Red = chlorophyll autofluorescence of 537
intracellular algae. Green-yellow-orange = fluorescence of SNARF-1 AM indicating pHi. 538
(except autofluoresence of inclusion body (IB)). Note difference in pHi between symbiont-539
containing and symbiont-free cell. 540
541
Fig. 3. pHi (mean ± s.e.m) in symbiont containing (A) and symbiont free cells (B) from 542
S.pistillata exposed to combinations of light (300 µmol photons m-2 s-1), dark and DCMU. 543
Values at t = 0 are not linked to the rest of the time course as they were obtained with a 544
separate calibration. 545
546
Fig. 4. Effect of irradiance level and duration on pHi in symbiont-containing cells isolated 547
from S. pistillata. In situ calibrations were carried out for each light intensity. Dotted lines 548
link time = 0 values (obtained with a separate calibration in the dark) with values at 1 min. 549
Black to grey lines represent light below saturating irradiance, blue lines are used for light 550
above saturating irradiance. Mean values are shown and s.e.m are given in table 1. 551
552
Fig. 5. pHi (mean ± s.e.m) in symbiont containing cells isolated from S.pistillata exposed to 553
20 min at 400 µmol photons m-2 s-1 irradiance (white) followed by 35 min in dark (grey). 554
555
556
Table 1. pHi (mean ± s.e.m) in symbiont-containing cells isolated from S. pistillata exposed 557
to different light intensities for 30 min. Posthoc analysis performed by paired sample t-test’s, 558
following repeated measures ANOVA. Where mean pHi values are significantly different to 559
pHi at other time points they are indicated by superscripted numbers corresponding to time 560
points. 561
562
Supplemental information 563
Fig. S1 (supplemental information): A O2 concentration (µmol kg-1) (mean ± s.e.m) and B pH 564
(mean ± s.e.m) in seawater of the perfusion chamber containing isolated cells with and 565
without symbionts from S.pistillata. Data shown represent an example at 300 µmol photons 566
m-2 s-1 irradiance. Data not shown for other treatments (e.g. dark, DCMU, etc). 567
568

The
Jou
rnal
of
Exp
erim
enta
l Bio
logy
– A
CC
EPT
ED
AU
TH
OR
MA
NU
SCR
IPT
The
Jou
rnal
of
Exp
erim
enta
l Bio
logy
– A
CC
EPT
ED
AU
TH
OR
MA
NU
SCR
IPT
The
Jou
rnal
of
Exp
erim
enta
l Bio
logy
– A
CC
EPT
ED
AU
TH
OR
MA
NU
SCR
IPT

The
Jou
rnal
of
Exp
erim
enta
l Bio
logy
– A
CC
EPT
ED
AU
TH
OR
MA
NU
SCR
IPT
The
Jou
rnal
of
Exp
erim
enta
l Bio
logy
– A
CC
EPT
ED
AU
TH
OR
MA
NU
SCR
IPT

The
Jou
rnal
of
Exp
erim
enta
l Bio
logy
– A
CC
EPT
ED
AU
TH
OR
MA
NU
SCR
IPT
Time (min)
ANOVA
1 5 10 15 20 25 30 L
ight
(µ
mol
pho
tons
.m-2
s-1
) 800
F(6, 72) = 4.618 P= 0.001
7.26 ± 0.08
7.31 ± 0.05
7.35 ± 0.04
7.37 ± 0.06
7.44 ± 0.041,5,10
7.4 ± 0.041,5
7.46 ± 0.071,5,10
500 F(6, 54) = 3.776
P= 0.003 7.22
± 0.02 7.3
± 0.03 1 7.38
± 0.061 7.45
± 0.031,5 7.4
± 0.051,5 7.42
± 0.051,5 7.44
± 0.041,5
400 F(6, 54) = 3.140
P= 0.010 7.17
± 0.05 7.27
± 0.081 7.34
± 0.071 7.39
± 0.081 7.43
± 0.081,5 7.44
± 0.141,5 7.44
± 0.081,5
300 F(6, 48) =5.500
P< 0.001 7.07 ± 0.1
7.15 ± 0.11
7.33 ± 0.071
7.41 ± 0.031,5
7.42 ± 0.031,5
7.4 ± 0.031,5
7.42 ± 0.051,5
250 F(6, 54) = 4.812
P= 0.001 7.06
± 0.05 7.05
± 0.06 7.13
± 0.04 7.28
± 0.091,5 7.31
± 0.091,5 7.28
± 0.081,5 7.30
± 0.081,5
200 F(6, 54) = 2.532
P= 0.042 7.07
± 0.06 7.06
± 0.08 7.1
± 0.08 7.24
± 0.061,5 7.21
± 0.041,5 7.23
± 0.065 7.22
± 0.021,5
100 F(6, 72) = 2.868
P= 0.015 7.04
± 0.06 7.05
± 0.03 7.13
± 0.08 7.15
± 0.075 7.16
± 0.011,5 7.15
± 0.111,5 7.15
± 0.121,5
50 F(6, 48) =2.595
P= 0.034 7.02
± 0.08 7.05
± 0.12 7.07
± 0.09 7.15
± 0.081 7.08
±0.07 7.13
± 0.081 7.14
± 0.11
0 F(6, 114) =0.237
P> 0.05 7.07
± 0.02 7.06
± 0.03 7.09
± 0.03 7.07
± 0.03 7.09
± 0.03 7.07
± 0.05 7.05
± 0.05


![Regulation of the intracellular Ca2+. Regulation of intracellular [H]:](https://img.pdfslide.us/doc/110x75/5a4d1b717f8b9ab0599b56a5/regulation-of-the-intracellular-ca2-regulation-of-intracellular-h.jpg)