Embed Size (px)
Citation preview
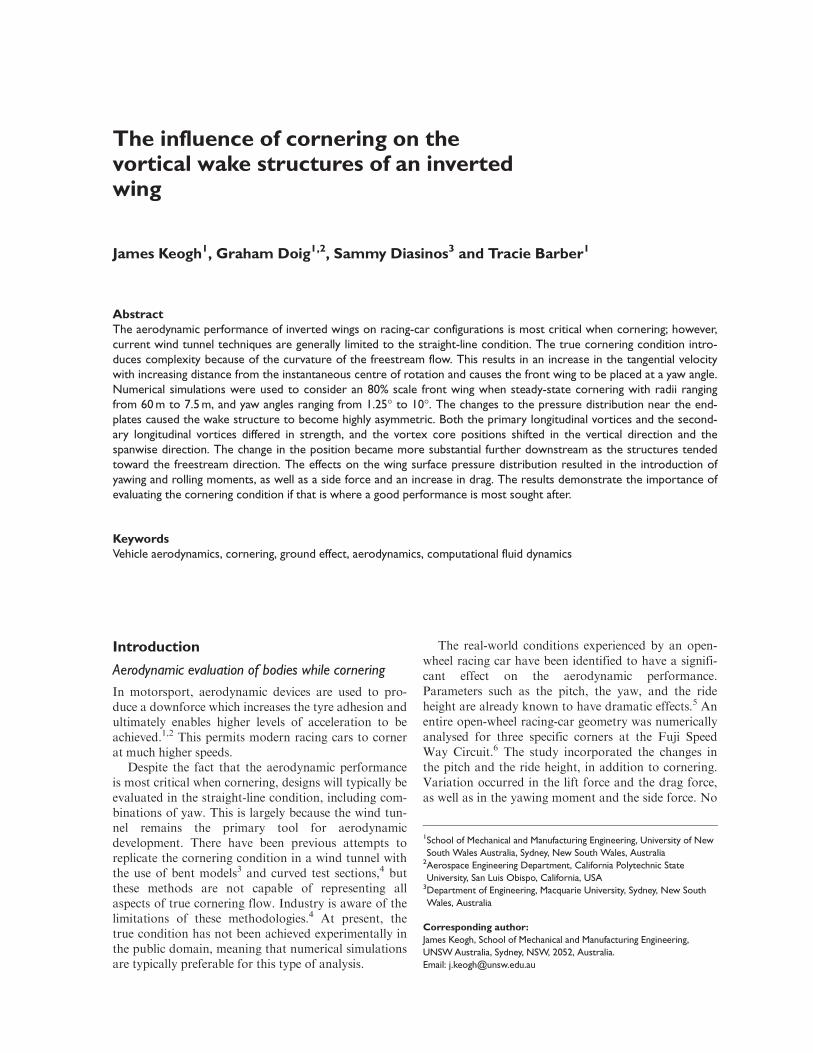
The influence of cornering on the vortical wake structures of an inverted wing
James Keogh1 Graham Doig12 Sammy Diasinos3 and Tracie Barber1
Abstract The aerodynamic performance of inverted wings on racing-car configurations is most critical when cornering however current wind tunnel techniques are generally limited to the straight-line condition The true cornering condition introshyduces complexity because of the curvature of the freestream flow This results in an increase in the tangential velocity with increasing distance from the instantaneous centre of rotation and causes the front wing to be placed at a yaw angle Numerical simulations were used to consider an 80 scale front wing when steady-state cornering with radii ranging from 60 m to 75 m and yaw angles ranging from 125deg to 10deg The changes to the pressure distribution near the end-plates caused the wake structure to become highly asymmetric Both the primary longitudinal vortices and the secondshyary longitudinal vortices differed in strength and the vortex core positions shifted in the vertical direction and the spanwise direction The change in the position became more substantial further downstream as the structures tended toward the freestream direction The effects on the wing surface pressure distribution resulted in the introduction of yawing and rolling moments as well as a side force and an increase in drag The results demonstrate the importance of evaluating the cornering condition if that is where a good performance is most sought after
Keywords Vehicle aerodynamics cornering ground effect aerodynamics computational fluid dynamics
Introduction
Aerodynamic evaluation of bodies while cornering
In motorsport aerodynamic devices are used to proshyduce a downforce which increases the tyre adhesion and ultimately enables higher levels of acceleration to be achieved12 This permits modern racing cars to corner at much higher speeds
Despite the fact that the aerodynamic performance is most critical when cornering designs will typically be evaluated in the straight-line condition including comshybinations of yaw This is largely because the wind tunshynel remains the primary tool for aerodynamic development There have been previous attempts to replicate the cornering condition in a wind tunnel with the use of bent models3 and curved test sections4 but these methods are not capable of representing all aspects of true cornering flow Industry is aware of the limitations of these methodologies4 At present the true condition has not been achieved experimentally in the public domain meaning that numerical simulations are typically preferable for this type of analysis
The real-world conditions experienced by an open-wheel racing car have been identified to have a signifishycant effect on the aerodynamic performance Parameters such as the pitch the yaw and the ride height are already known to have dramatic effects5 An entire open-wheel racing-car geometry was numerically analysed for three specific corners at the Fuji Speed Way Circuit6 The study incorporated the changes in the pitch and the ride height in addition to cornering Variation occurred in the lift force and the drag force as well as in the yawing moment and the side force No
1School of Mechanical and Manufacturing Engineering University of New South Wales Australia Sydney New South Wales Australia 2Aerospace Engineering Department California Polytechnic State University San Luis Obispo California USA 3Department of Engineering Macquarie University Sydney New South Wales Australia
Corresponding author James Keogh School of Mechanical and Manufacturing Engineering UNSW Australia Sydney NSW 2052 Australia Email jkeoghunsweduau
further details regarding the flow structures responsible for these changes was presented and the effects due to cornering were not clearly distinguished from the effects due to other parameters
Okada et al7 and Tsubokura et al8 demonstrated the importance of evaluating the high-speed cornering condition during the aerodynamic design phase for a commercial vehicle Considering a medium-sized sedan geometry the outboard pressure losses were identified that contributed to a negative yawing moment and side force This caused a damping effect that restrained the vehicle during cornering For two different geometries the magnitude of this force varied for various vehicle shapes A temporal variation in the vehicle reacting to the change in the conditions also occurred A 49 difshyference in the aerodynamic damping toward the steershying motion existed between the two geometries this was largely attributed to the increased space around the wheels in the wheel well
In motorsport the aerodynamic performance when cornering becomes even more critical2910 Typical racing-car configurations consist of multiple composhynents which interact to produce a desired aerodynamic outcome The front wing is most likely to have access to relatively clean flow and has a significant influence on the aerodynamic performances of the downstream components911 The vortical wake leaving the front wing then becomes a critical consideration
Inverted wing aerodynamics
The most comprehensive set of straight-line experimenshytal results were conducted by Zerihan12 He used an inverted T026 aerofoil with endplates considered across various ground clearances Studies of this geometry were presented by Zerihan12 Zerihan and Zhang13
and Zhang and Zerihan1014 considering both the
single-element configuration and the double-element configuration Investigations presented the surface presshysures the forces and the wake measurements defining several key aerodynamic characteristics
Close proximity to the ground resulted in increased acceleration of the flow beneath the inverted suction surface creating a strong low-pressure region beneath the wing surface Near the midspan location the flow tended toward a two-dimensional state and the adverse pressure gradient increased as the ground clearance was reduced A critical point was reached where signifishycant trailing-edge separation resulted in the occurrence of the lsquodownforce loss phenomenonrsquo at approximately hc = 0112
The flow near the endplate was characterized by the primary and secondary vortices as well as by a number of smaller flow structures10 The primary vortex formed inside the endplate as shown in Figure 1 owing to the large pressure gradient The primary vortex was identishyfied as an important flow structure for operating effishyciently in close proximity to the ground The vortex alleviated the adverse pressure gradient and permitted lower ground clearances to be achieved15 The secondshyary vortex formed outside the upper edge of the end-plate Increased pressure inside the endplate over the pressure surface resulted in a smaller pressure gradient which produced a weaker vortex
Soso and Wilson16 however highlighted the sensishytivities of an inverted wing to change in the oncoming flow When a wing was positioned in the wake of a genshyeric racing car a significant loss in the downforce was found to occur
These findings together with the little research conshyducted into aerodynamics when cornering6ndash8 strongly suggest that a significant change will occur for an inverted wing in the cornering condition In a practical sense understanding the aerodynamic performance in
Figure 1 Location of the primary vortices and the secondary vortices in the straight-line condition
Figure 2 (a) The cornering flow conditions (b) the effect of understeer toward the flow seen by the front wing (c) the effect of oversteer toward the flow seen by the front wing
this condition could be argued as more critical than in the straight-line condition4
Dynamics of cornering
Modern aerodynamicists have become familiar with a stationary model where the flow field is in motion When cornering obviously this relative motion is no longer in a straight line As the vehicle follows a curved path so does the flow relative to the vehicle as is shown in Figure 2(a) The relative velocity of the flow increases with increasing distance from the centre of rotation In percentage terms corners with tighter radii will increase the velocity gradient across the span The flow curvashyture will also vary and is greater as it becomes closer to the centre of rotation The variation in the curvature means that the yaw angle of the wing will also vary slightly across the span
The attitude of the vehicle will have a significant effect Understeer or oversteer shown in Figure 2(b) and Figure 2(c) respectively can cause the wing to be correspondingly closer to or further away from the censhytre of rotation This causes changes in both the velocity and the effective angle of the oncoming flow
In corners with the tightest radii the aerodynamic forces are reduced in magnitude as the speed of the vehicle is limited by the acceleration able to be
sustained Despite this some racing cars will spend much time in this condition making small gains very advantageous4 As a result the aerodynamic perforshymance in this condition can become crucial
Method
Numerical method
The present study utilizes numerical simulations to investigate the aerodynamics of an isolated inverted wing when cornering at a constant radius and a steady state All results were generated with the use of the commercial finite-volume solver ANSYS Fluent 14517
as is prominent throughout industry Reynolds-avershyaged NavierndashStokes simulations were used Previous studies have proven this technique to be effective for simulating the same geometry in the straight-line condishytion1518ndash21 and it remains the preferred technique within industry as it is more computationally feasible for development This study represents the first investishygation into the aerodynamic performance of an isolated inverted wing in the cornering condition
The pressure-based implicit coupled solver was utilized to achieve steady-state simulations Compressibility effects at the simulated Mach numbers were deemed negligible in accordance with the conclushysions of previous studies192122 Simulations were run using a second-order node-based upwinding discretizashytion scheme across 64 processors Convergence was deemed to be met when the aerodynamic forces ceased to change by more than 002 over 1000 continued iterations and a point velocity monitor placed near the centre of the primary vortex also ceased to change by more than 002 For all simulations the scaled resishydual errors fell below 8 3 1025
The coordinates of the aerofoil can be found in the thesis by Zerihan12 A chord length of 2234 mm and a span of 1100 mm gave an aspect ratio of 492 The wing also features a rectangular endplate measuring 250 mm 3 100 mm 3 4 mm The wing features a blunt trailing edge 15 mm thick The wing was described as being at an incidence of 345deg Since the wing is symmetric valishydation and straight-line cases were run for the semispan with a symmetry plane placed at the midspan location
The present numerical study was validated against the published experimental results12 These experiments were conducted in the Southampton Low-Speed Wind Tunnel which had test-section dimensions of 21 m 3 17 m with an octagonal cross-section The oncoming air was reported at 30 ms within an error of 602 The freestream turbulence intensity was given as 02 An overhead force balance was utilized for measureshyment of all the forces For the numerical validation cases conducted in the current study a simplified recshytangular cross-section was utilized that matched the maximum extents of the wind tunnel23 A further simshyplification of the numerical model was the use of a moving ground plane across the entire width of the test
Figure 3 Examples of the mesh structure (a) isometric view (b) midspan location (c) straight-line condition (d) cornering condition
section The boundary layer growth on the walls was not reported from the experiments but can be expected to have a minimal influence owing to the low blockage ratio As a result the walls and the roof of the domain were modelled as zero-shear slip walls The domain was modelled 7c upstream and 15c downstream
A density of 122 kgm3 gave a Reynolds number Re of 454 3 105 which fell within the reported range for the experimental data In the published experiments a grit strip was located at 01c on both the pressure and the suction surfaces of the wing This enabled the the present computational model to be designed such that laminar and turbulent boundary layer regions were replicated
A multi-block fully structured meshing technique was employed Cells were concentrated near the boundshyaries and four chord lengths downstream of the trailing edge to ensure that the near-wake behavior was accushyrately represented Cells were additionally concentrated near the endplate region to obtain the prominent upper
+and lower vortices The y value remained below 1 over the wing the endplate and the ground plane Three mesh densities were assessed at hc = 0179 to determine the required resolution an omnidirectional refinement ratio of 12 was applied to successive mesh densities The medium mesh consisted of a total of 76 3 106 cells with 117 spanwise cells and 185 chord-wise cells The fine mesh and the coarse mesh consisted of 136 3 106 cells and 47 3 106 cells respectively Examples of the mesh construction in an isometric view and at the symmetry plane are shown in Figure 3(a) and Figure 3(b) respectively Efforts were particularly concentrated on ensuring that high-aspect-ratio cells existed only parallel to the flow at the boundary
For all further cases (post-validation) the boundary layer was assumed to be fully turbulent and the domain was extended in all directions A boundary senshysitivity study was undertaken and as a result the outlet
was extended to 50c downstream The walls the roof and the inlet were also extended to a distance of 10c Beyond these distances the aerodynamic forces ceased to change by more than 001 The mesh around the body was reflected about the z axis and the x axis to incorporate the whole geometry as shown in Figure 3(a) This gave a total of 172 3 106 cells The boundshyaries of the domain were modified to accommodate the path of the freestream flow and the cells were also aligned in this direction This transformation of the domain is shown in Figure 3(c) and (d) A rotating refshyerence frame was used for all cases with flow curvature The steady-state cornering condition was achieved by a constant angular velocity about a fixed point external to the domain
Validation
The results for the mesh study were generated using the k2v shear stress transport (SST) turbulence model24
coupled with a low-Reynolds-number boundary adapshytion The different mesh sizes were found to have very little effect on prediction of the aerodynamic forces shown in Table 1 From the medium mesh to the fine mesh the aerodynamic forces did not change by more than 08 The higher concentration of cells across the span increased the resolution of the downstream wake a noted benefit in the case of the medium mesh and the fine mesh
The realizable k2e turbulence model25 with the enhanced wall function was also assessed against the experimental data The k2v SST model was found to be particularly sensitive to the boundary layer mesh construction and a slow and consistent growth rate away from the wall was required
The results were assessed across nine ground clearshyances from hc = 0045 to hc = 0448 as shown in Figure 4 Particular emphasis was placed on whether
Table 1 Comparison of the experimental lift coefficients and the experimental drag coefficients for the coarse mesh the medium mesh and the fine mesh at hc = 0179
Mesh CL CD
Coarse 1228 0052 Medium 1241 0052 Fine 1248 0052 Experimental12 128 0055 Medium (no transition) 1236 0052
Figure 4 Drag coefficients and lift coefficients comparison of the validation cases with the experimental results SST shear stress transport
the turbulence models were capable of representing the trends in the aerodynamic forces from the published experimental results At ground clearances above hc = 0224 both models were found to under-predict lift and to over-predict drag The over-prediction of drag was more severe in the case of the realizable k2e model with the k2v SST model matching the experishymental results more closely The under-prediction of lift was found to be largely attributed to an under-prediction of the suction peak for both models at the higher ground clearances Below hc = 0134 both models predicted the early onset of vortex burst associshyated with the lsquodownforce loss phenomenonrsquo1013 In the case of the realizable k2e this separation was under-predicted and the result was an over-prediction of the suction peak and lift in close proximity to the ground before a severe loss in efficiency between hc = 0067 and hc = 0045 The k2v SST model showed a similar behavior in close proximity to the ground but demonshystrated a heightened level of sensitivity to separation induced by the adverse pressure gradient As a result lift predictions were matched more closely at low ground clearances despite the fact that the suction peak was also over-predicted
An important point of difference for the two turbushylence models is their abilities to match primary vortex
Figure 5 Streamwise vorticity contours for hc = 0224 at xc = 12 (a) experimental12 (b) kndashv SST (c) realizable kndashe
formation A comparison of streamwise vorticity conshytours at xc = 12 in which both models were comshypared with the published particle image velocimetry measurements is shown in Figure 5 Both models were found to under-predict the maximum streamwise vortishycity for the considered ground clearances The strength of the counter-rotating vortical structures inside the endplate was also greater in the experiments and led to an increased distance between the endplate and the prishymary vortex which is evident in Figure 5 Both numerishycal models predicted the development of the primary vortex to occur further downstream and this contribushyted toward general discrepancies In the case of the reashylizable k2e turbulence model this difference was more
Table 2 Simulated cases in the present study
Curvature Case designation for the following yaw angles
0deg 125deg 25deg 5deg 10deg
0 12688c 11343c 1672c 1336c
S C1 C2 C3 C4
Y1 CR1
Y2
CR2
Y3
CR3
Y4
CR4
significant Both turbulence models matched the vortishycal structure however the k2v SST model was clearly more closely correlated to the vorticity contours preshysented experimentally With this structure forming a key point of investigation in the present work the k2v SST model was deemed to be favorable
Evaluation technique
In reality the front wing is only one component of a complex system In cornering-flow conditions the front wing will typically be in the yawed condition while also experiencing flow curvature At the same time other downstream components will observe different conditions
The changes affected by cornering (the yaw and the curvature) were considered in isolation and then comshybined to give a realistic condition This resulted in three different classes of cases as shown in Table 2 As the cornering flow is variable throughout the domain the described condition is that occurring at x = 05c y =0 (halfway along the chord at the midspan location)
The Cartesian coordinate system was defined relative to wing itself rather than to the flow This is because the other components on a car are positioned relative to the wing rather than to the flow The velocity of the flow travelling in the x direction at the wingrsquos centre was 30 ms for all cases
Results
Near-wake structure
The near-wake structure was highly sensitive to the yaw angle As the yaw angle increased the obstruction of the flow at the endplates increased The oncoming flow began to observe more of the endplate side rather than the edge as shown in Figure 6 The effect was a change in the pressure distribution over the endplate surfaces resulting in significant changes in the primary and secshyondary vortices as well as in the vortical substructures
The primary vortex remained below the suction surshyface near the endplate for all conditions The position of the centre of the primary vortex is shown for cases S C4 Y4 and CR4 in Figure 7
For cases Y and CR the inboard vortex position was shifted toward the midspan location The
Figure 6 Change in the pressure occurring near the endplates owing to the flow angle and the pressure coefficient contours over the outside of the endplates for case Y4
streamwise vorticity for the inboard primary vortex increased owing to the yaw angle while a similar size was retained This indicated an overall increase in the vortex strength For cases Y4 and CR4 the peak streamwise vorticities increased by 66 and 43 respectively at xc = 15 The increase was asymptotic with the yaw angle The induced shear from the ground and the endplate surfaces ultimately limited the size and the circulation
The counter-rotating vortical substructure forming inside the inboard endplate became more prominent as
Figure 7 Streamwise vorticity at xc = 15 (a) case S (b) case C4 (c) case Y4 (d) case CR4
shown in Figure 7(c) and (d) As the induced shear from the primary vortex increased this smaller structure increased in strength Similarly the counter-rotating vortex induced from the ground as shown in Figure 8(a) increased in strength and was initiated earlier In the straight-line condition this was initiated from the
Figure 8 Positions of the prominent vortical substructures (a) leading-edge vortex (b) ground vortex
ground at approximately xc = 103 At the maximum yaw angle the location was near xc = 095
The strength of the outboard primary vortex decreased with increasing yaw angle Decreases in the peak streamwise vorticities of 55 and 51 occurred for cases Y4 and CR4 respectively at xc = 15 as well as decreases in the size The vortex remained in closer proximity to the endplates near the trailing edge The relationship of the vorticity and the size was again asymptotic decreasing as the yaw angle increased The vortex was positioned higher than the inboard primary vortex for all yaw angles and a notably smaller ground vortex formed near xc =2
In the straight-line case the leading-edge vortex formed below the endplate and was drawn inside prior to the suction peak as shown in Figure 8(b) As the yaw angle increased the outboard leading-edge vortex became stronger owing to the increased pressure gradishyent The location at which the vortex was drawn inside the endplate shifted downstream from xc = 01 to xc = 045 For cases Y4 and CR4 the leading-edge vortex passed below the already-formed primary vorshytex affecting their interaction and causing the leading-edge vortex to circulate around the larger vortex This contributed to the change in the primary vortex posishytion relative to the endplate
The leading-edge vortex also occurred inboard but was weaker and was positioned further inside the end-plate Consequentially it interacted to a lesser extent with the primary vortex In all cases the leading-edge vortex was inevitably exposed to a large axial adverse pressure gradient which led to breakdown prior to the trailing edge Where the vortex was stronger it was less susceptible and tended to continue further downstream
Figure 9 Effect of the perceived endplate curvature (a) actual flow field conditions (b) perceived curvature by flow (visualization purposes only) (c) pressure coefficient distribution over the outboard endplate outside surface for case C4 (d) distribution over the inboard endplate outside surface for case C4
The velocity gradient due to flow curvature also influenced the primary vortex strength The freestream velocity increased with increasing distance from the censhytre of rotation meaning that the outboard endplate was in a region of higher local Re with the inboard lower As a result the inboard primary vortex decreased in strength The peak streamwise vorticity was 10 lower than in the straight-line condition The opposite effect occurred for the outboard primary vortex An increase in the vorticity occurred while the vortex retained the straight-line size and position These velocity gradient effects explained why changes were less for cases CR than for cases Y at the same yaw angle
The secondary vortices were more susceptible to changes in the freestream condition as shown in Figure 7 As the yaw angle increased the inboard secshyondary vortex was reduced in strength This was due to the pressure gradient across the endplate For cases Y3 and CR3 (a yaw angle of 5deg) the inboard secondary vortex occurred in the form of two small counter-rotating vortices which traveled above the endplate and
merged near the trailing edge The downstream path was inside the endplate rotating with the opposite sign to the straight-line condition For casesY4 and CR4 the vortex was clearly positioned inside the endplate and rotated in the opposite direction with the magnishytudes of the peak vorticities being 35 and 38 higher than in the straight-line condition
The outboard secondary vortex increased in strength as the summation of pressures had a net effect The relationship was nearly linear with the yaw angle and also resulted in earlier development Figure 7(c) and (d) clearly demonstrates that for cases Y4 and CR4 the vortex is developed at xc = 15 this is not so for the same structure in the straight-line case and case C4
The near wake was more affected by yaw than was the curved path of the flow in most instances However in cases C it was evident that the flow curvature affected how the geometry was perceived Considering the relative motion of the flow past the endplate as shown in Figure 9 the outside of the outboard endplate is observed as a concavity by the freestream flow Effectively the endplate had a pressure and a suction surface This resulted in an increase in the pressure over the outside of the endplate and a decrease in the presshysure inside
For the outboard secondary vortex this reduced the difference in the pressure across the upper half of the endplate The peak streamwise vorticity of this vortex for case C4 decreased by 12 (at xc = 15) and the vortex was smaller despite the fact that it was in a region of higher local Re The inboard secondary vortex experienced the opposite effect The flow curvature caused the endplate to be perceived to have the opposite curvature to that shown in Figure 9(a) and (b) This accelerated the flow and produced a lower pressure over the outside of the endplate as shown in Figure 9(d) The peak streamwise vorticity was 10 higher and a larger vortex indicated increased strength
Downstream vortex trajectories
The downstream trajectory of vortices was affected by the freestream condition as shown in Figure 10 The Q criterion used in the figure is representative of the relashytionship between the rotation and the strain rate and has been shown to be an effective parameter for visualishyzation of vortices26 Measurement of the position in terms of the deflection in the y direction highlighted a large change The divergence of this path is of great importance and determines the position relative to the downstream components In Figure 10 this divergence is measured relative to the freestream condition rather than to the Cartesian coordinate system thus investishygating the effect on the position independent of the freestream
At both ends of the span the endplates aligned the flow and vortices toward the x direction disrupting the freestream path The vortex strength is related to the tendency of the structure to follow the direction of the
Figure 10 Q criterion of 20 000 indicating the primary and secondary vortex paths which are colored according to the proximity of the ground (a) case S (b) case Y4 (c) case C4 (d) case CR4
freestream flow Figure 10(a) shows that in the straight-line condition the primary vortices follow a path approaching the midspan location while the secshyondary vortices aligned more closely with the endplates
The increased strength of the primary vortex resulted in a path initially directed toward the ground and mid-span locations In Figure 10(b) and (d) this relationship is apparent as the inboard primary vortex remained attached to the endplate but then angled across the span The downward path of the inboard primary vorshytex for all cases CR and Y was ultimately limited as the vortex reached the ground This also caused the cross-sectional shape to become elliptical The interaction with the ground boundary layer aligned the vortex back toward the freestream direction The result was a more erratic curvature in its path
The weaker outboard primary vortices retained or increased the ground clearance downstream for cases CR and Y and followed a path of slighter curvature The outboard vortex was initially aligned with the end-plate and then moved closer to the freestream centre as shown in Figure 10(b) and (d) The trajectory retained a higher ground clearance than did the inboard vortex
The inboard secondary vortices in Figure 10(b) and (d) followed the freestream direction closely and retained a ground clearance similar to that of the straight line Stronger outboard secondary vortices folshylowed a wider arc and were directed downward Cumulatively these disparities also affected the posishytion of the structures relative to each other
For case C4 in Figure 10(c) and all cases C the vorshytices followed a path similar to that of the straight line albeit adjusted to the freestream condition The vortices remained attached along the length of the endplate meaning that the outboard vortices were positioned further away from the freestream centre The flow curshyvature was greater inboard and because of this the endplate had a more significant straightening effect on the inboard vortex with the deflection more significant than for the outboard vortex
Surface pressure and aerodynamic forces
The distribution of the pressure over the wing surfaces was influenced by the local changes in Re Figure 11 shows the pressure contours over the suction surface and the pressure plots at yc = ndash18 and 18
The minimum pressure over the suction surface remained at the midspan location for all cases Y as shown in Figure 11(a) Both ends of the span had nearly identical magnitudes in the suction peak Further aft over the suction surface there was an outboard increase in the pressure and an inboard decrease This was largely attributed to the geometric shape of the end-plate In this instance the endplate extends only a small way below the wing surface at the location of the sucshytion peak reducing the interaction with the spanwise velocity component Further aft the endplate extends further below the suction surface increasing the effect The distribution was also affected on the pressure surshyface owing to the interaction of the flow with the endplates
Figure 11 Suction surface pressure coefficient and surface pressure plots (a) case Y4 (b) case C4 (c) case CR4
For cases C the outboard pressure distribution increased in magnitude owing to the local Re increase over this half of the span as shown in Figure 11(b) From the contours on the suction surface it can be seen that the minimum pressure over the suction surshyface clearly shifted outboard
For cases CR the pressure distribution was represhysentative of the combined effects The minimum presshysure over the suction surface was shifted outboard and the suction peak increasedThe imbalance in the presshysure resulted in a net side force rolling moment and
yawing moment about the aerodynamic centre The side force which is shown in Figure 12(a) increased linearly with increasing yaw angle For cases Y4 and CR4 the side-force coefficient exceeded the straight-line drag coefficient
A negative rolling moment resulted for cases C and CR owing to the velocity gradient across the span The curvature demonstrated a near-linear relationship with the magnitude of the moment for cases C The larger magnitude forces acting on the outboard half also increased production of the induced drag and resulted in a negative yawing moment
The yaw angle resulted in a yawing moment which linearly increased with increasing flow angle and a posshyitive rolling moment which increased asymptotically For cases CR these forces were found to match very closely the sum of those observed for cases C and Y This demonstrated a level of independence between the effects of the flow angle and the velocity gradient
In the present study a reference velocity of 30 ms was established to ensure a consistent point of comparishyson allowing simple calculation of the force based on the coefficients Figure 12(d) (e) and (f) shows the lift and drag coefficient values for the three different case types As a point of interest the values were nonshydimensionalized in two different ways The CL values were calculated using the constant reference velocity whereas the corrected lift coefficient CLC accommoshydated the local change in Re by employing the free-stream variation
For all cases a difference of less than 1 existed in the negative lift force This demonstrated a close relashytionship between the x velocity component and the proshyduction of lift It also highlighted that the vortex-induced effects were producing a net result of nearly zero A stronger inboard vortex was always accompashynied by a weaker outboard vortex or vice versa The corrected lift coefficient decreased with increasing yaw angle For case CR4 the corrected lift coefficient was 47 lower than for the straight-line condition The pitching moment of the wing remained within 06 for all cases with no clear trends
As the yaw angle of the wing increased the drag increased This was predominantly due to the obstrucshytion of the flow caused by the endplates Cases Y4 and CR4 resulted in increases in the drag of 221 and 189 respectively The magnitude of this difference increased exponentially with increasing yaw angle
Conclusion
The steady-state cornering condition resulted in a funshydamental change in the flow structures which develshyoped in the wake of an inverted wing in close proximity to the ground This could feasibly result in a significant change in the aerodynamic performance of a vehicle when cornering The most severe effects were attributed to the yaw angle which occurs during cornering
Figure 12 Aerodynamic force and moment coefficients acting on the wing (a) side-force coefficients (b) rolling moment coefficients (c) yawing moment coefficients (d) lift coefficients and drag coefficients for cases Y (e) lift coefficients and drag coefficients for cases C (f) lift coefficients and drag coefficients for cases CR
however both the flow curvature and the velocity gra- The wake became highly asymmetric with both prishydient also affected the changeThe difference in the mary and secondary longitudinal vortices differing in pressure distributions near the endplates resulted in strength The vortex core positions were also altered in changes in the near-wake structure both the vertical direction and the spanwise direction
These changes in position then became more substanshytial further downstream
Smaller vortical substructures were observed to become more and less prominent according to the conshyditions Their interaction with the primary vortex then affected the downstream trajectory of the larger structures
An increase in the drag due to the spanwise flow component was the most significant change in the aeroshydynamic forces Additionally a yawing moment and a rolling moment occurred as an imbalance in the forces over the wing surface occurred owing to the local changes in Re
In a practical situation the wake of the front wing can have a significant effect toward the performances of the downstream components The results highlight the potentially dramatic and cumulative effects that these sensitivities can have toward a vehiclersquos overall aerodynamic performance when cornering Thus this demonstrates the importance of evaluating the cornershying condition if that is where a good performance is most sought after
Declaration of conflict of interest
The authors declare that there is no conflict of interest
Funding
This research received no specific grant from any fundshying agency in the public commercial or not-for-profit sectors
References
1 Zhang X Toet W and Zerihan J Ground effect aerodyshynamics of race cars Appl Mech Rev 2006 59 33ndash49
2 Katz J Aerodynamics of race cars A Rev Fluid Mech 2006 38 7ndash63
3 Gordes A Process for simulating curved airflow on wheeled vehicles in fluid channels with a straight measuring section German Patent EP1610111A2 2005
4 Toet W Aerodynamics and aerodynamic research in Formula 1 Aeronaut J 2013 117(1187) 1ndash26
5 Bradford J Montomoli F and DrsquoAmmaro A Uncershy
tainty quantification and race car aerodynamics Proc IMechE Part D J Automobile Engineering 2014 228(4) 403ndash411
6 Nara K Tsubokura M Ikeda J et al A numerical analyshysis of unsteady aerodynamics of formula car during dynamic cornering motion In 32nd AIAA applied aeroshydynamics conference Atlanta Georgia USA 16ndash20 June 2014 AIAA paper 2014-3138 Reston Virginia AIAA
7 Okada Y Nouzawa T Okamoto S et al Unsteady vehishycle aerodynamics during a dynamic steering action 1st report on-road analysis SAE paper 2012-01-0446 2012
8 Tsubokura M Ikawa Y Nakashima T et al Unsteady vehicle aerodynamics during a dynamic steering action 2nd report numerical analysis SAE paper 2012-01-0448 2012
9 Agathangelou B and Gascoyne M Aerodynamic design considerations of a Formula 1 racing car SAE paper 980399 1998
10 Zhang X and Zerihan J Off-surface aerodynamic meashy
surements of a wing in ground effect J Aircr 2003 40(4) 716ndash725
11 Dominy RG Aerodynamics of Grand Prix car Proc IMechE Part D J Automobile Engineering 1992 206(4) 267ndash274
12 Zerihan J An investigation into the aerodynamics of wings in ground effect PhD Dissertation University of Southshyampton Southampton UK 2001
13 Zerihan J and Zhang X Aerodynamics of a single eleshyment wing in ground effect J Aircr 2000 37(6) 1058ndash 1064
14 Zhang X and Zerihan J Aerodynamics of a double eleshyment wing in ground effect AIAA J 2003 41(6) 1007ndash1016
15 Diasinos S Barber TJ and Doig G Influence of wing span on the aerodynamics of wings in ground effect Proc IMechE Part G J Aerospace Engineering 2013 227(3) 569ndash573
16 Soso M and Wilson P Aerodynamics of a wing in ground effect in generic racing car wake flows Proc IMechE Part D J Automobile Engineering 2006 220(1) 1ndash13
17 ANSYSreg Fluent release 145Canonsburg Pennsylvania ANSYS Inc
18 Mahon SA and Zhang X Computational analysis of pressure and wake characterisitcs of an aerofoil in ground effect Trans ASME J Fluids Engng 2005 127 290ndash298
19 Doig G Barber TJ and Neely AJ The influence of comshy
pressibility on the aerodynamics of an inverted wing in ground effect Trans ASME J Fluids Engng 2011 133(6) 1ndash12
20 Doig G and Barber T Considerations for numerical modshy
elling of inverted wings in ground effect AIAA J 2011 49(10) 2330ndash2333
21 Doig G Barber TJ Leonardi E and Neely AJ The onset of compressibility effects for an inverted aerofoil in ground effect Aeronaut J 2007 111(1126) 797ndash806
22 Keogh J Diasinos S and Doig G Flow compressibility effects around an open-wheel racing car Aeronaut J 2014 118 (1209) 1ndash23
23 Barber TJ Leonardi E and Archer RD Causes for disshycrepancies in ground effect analyses Aeronaut J 2002 106(1066) 653ndash657
24 Menter FR Two-equation eddy-viscosity turbulence models for engineering applications AIAA J 1994 32 269ndash289
25 Shih TH Liou WW Shabbir A et al A new kndashe eddy-viscosity model for high Reynolds number turbulent flows ndash model development and validation Comput Fluids 1995 24(3) 227ndash238
26 Hunt JCR Wray AA and Moin P Eddies streams and convergence zones in turbulent flows In Studying turbulence using numerical simulation databases proceedings of the 1988 summer program Vol 2(1) Report CTR-S88 Centre for Turbulence Research Stanshyford University Staford California USA 1988 pp 193ndash208
CMc coefficient of the yawing moment Appendix 1 Notation
b span = 1100 mm c chord length = 2234 mm CD coefficient of force in the direction aligned
with the freestream CDC coefficient of drag corrected according to
local the freestream velocity magnitude CL coefficient of force in the negative z
direction CLC coefficient of lift corrected according to
the local freestream velocity magnitude CP coefficient of the pressure CMu coefficient of the pitching moment CMu coefficient of the rolling moment
CS coefficient of force in the positive y direction
Q Q criterion second invariant of the velocity grade tensor ru
UN freestream velocity (ms) x y z Cartesian right-handed coordinates
e turbulent dissipation u angle of incidence about the y axis k flow curvature (m21) u angle of incidence about the x axis c angle of incidence about the z axis v specific dissipation rate Ox non-dimensional vorticity about the x axis
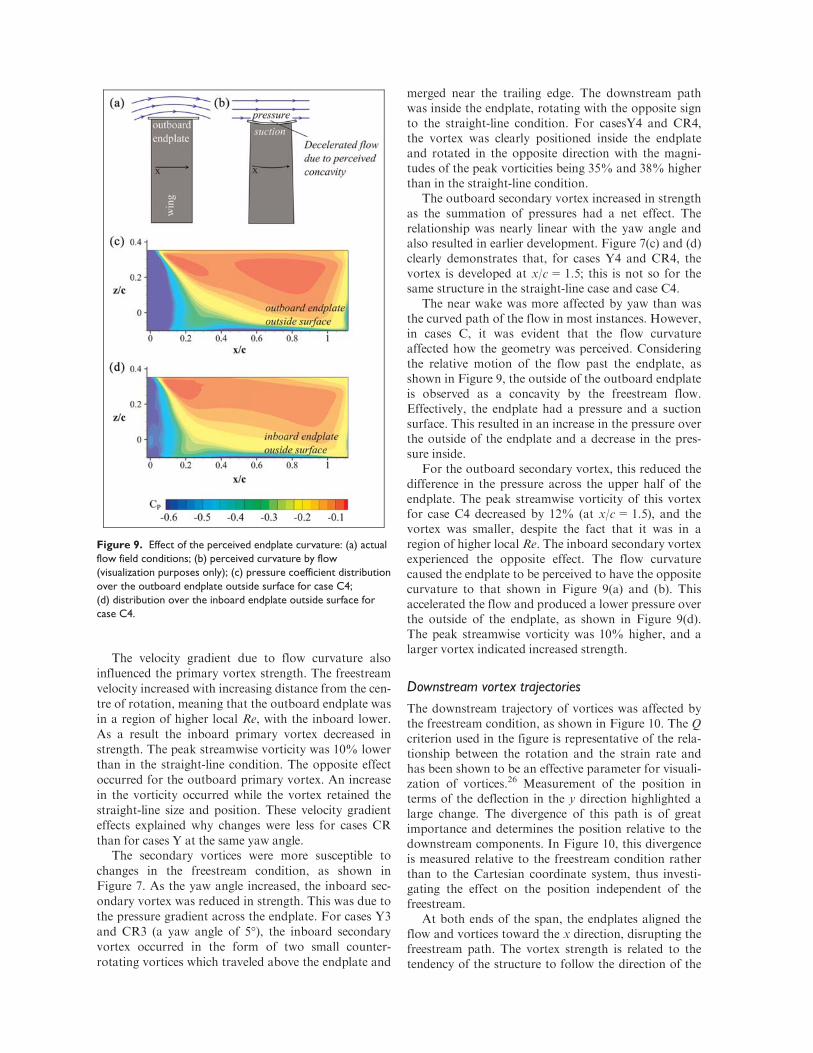
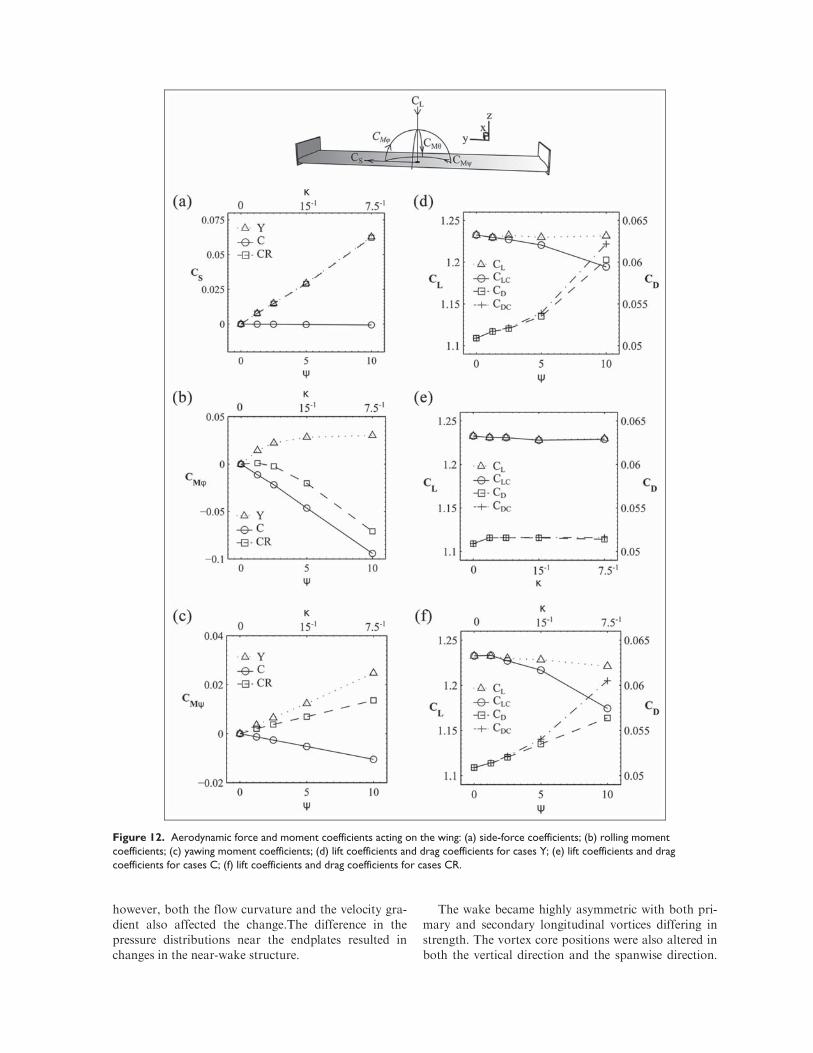