Embed Size (px)
Citation preview
1
The Influence of Coping Behaviours and Exercise on
Psychological Well-being
Sylwia Majszyk
Submitted in partial fulfilment of the requirements of the Higher
Diploma in Psychology at Dublin Business School, School of Arts,
Dublin.
Supervisor: Chris Gibbons
Programme Leader: Dr. R. Reid
March 2017
Department of Psychology
Dublin Business School

2
Table of Contents
Acknowledgements 3
Abstract 4
Introduction 5
Methodology: Participants 17
Design 17
Materials 17
Procedure 22
Results 24
Discussion 41
References 50
Appendices: Questionnaire on Stress, Coping Mechanisms and Life Satisfaction 60
3
Acknowledgments
I would like to express my special appreciation and thanks to my supervisor Dr. Chris
Gibbons for his support, guidance and encouragement throughout this project. Sincere
gratitude is also due to the lecturers of the final year project module, who provided large
amount of beneficial information. A special thanks are also extended to every participant,
who took the time to complete my survey.
I also would like to thank my fiance, Mark Lacey, for being an inspiration and a great
support.
4
Abstract
The health care costs are on the rise, as it is reported by Department of Health in
Ireland, therefore it is becoming more apparent, that health promotion and ill health
prevention should be of interest to the governing bodies. The focus of this study was to
examine the influence of coping behaviours (support, control, self-efficacy and optimism)
and exercise on well-being operationalised as happiness, life satisfaction, stress, anxiety and
depression. The study employed correlational and cross-sectional quantitative design to
determine significance of the variables, which were subsequently entered into regression
models with all the well-being measures. A questionnaire was administered in order to collect
the data in relation to all the variables, and 107 individuals took part in the study. The results
of the study showed, that all predictors had relationship with some, most or all of the outcome
measures, however, only two predictors accounted for the most variance.
5
Introduction
Psychological Well-being and Health
In recent years the Organisation for Economic Co-operation and Development
(OECD) had produced a report with prediction, that the health care costs are rising and by the
2050 they will become unaffordable without reforms (OECD.org). In Irish context the health
expenditure is also on the rise and according to Department of Health it had increased by
9.1% between 2007 and 2016 (health.gov.ie). WHO definition of health is “a state of
complete physical, mental and social well-being and not merely the absence of disease or
infirmity” (WHO.int). According to World Health Organisation Regional Office for Europe
report (2012) health contributes to well-being and well-being contributes to health, there is
some evidence that people who score higher on well-being, have better health outcomes,
there is also some more specific evidence, that low well-being can lead to depression. Present
study is set out to examine the influencing factors on well-being, to provide more insight to
the understanding of interconnections between various mental health aspects. Also, providing
more information on important to well-being factors, may contribute to development of more
effective mental health campaign, what in turn would lead to decrease in health care cost.
Definition of Elements of Subjective Well-being
The World Health Organisation Regional Office for Europe report (2012) also
produced definition of well-being which states that there are two dimensions of well-being,
subjective and objective, where subjective dimension comprises of individual’s experience
of their life and objective dimension comprises of life circumstances with social norms and
values (WHO, 2012). In relation to subjective well-being OECD conceptualised a framework
which distinguished three elements of well being: life evaluation, eudaimonia (competence
6
and purpose) and positive and negative affect (WHO, 2012). Present study is going to focus
on factors described as the positive and negative affect. According to WHO report, examples
of positive affect measurements include happiness and life satisfaction. Examples of negative
affect measurements include stress, anxiety and depression. Weich et al., (2011) in the study
on well-being concluded that single item measures have limited value in monitoring well-
being, or in identifying intervention aims. Therefore this study is going to use variety of
measurements of well-being including single and multiple measures. In the present study
well-being is operationalised as happiness, life satisfaction, stress, anxiety, depression and
GHQ (a measurement of distress).
Subjective happiness in accordance with Erouzabi, Dogan and Adiguzel (2016), has
emotional and cognitive aspects, while emotional aspects are divided into positive affect and
lack of negative affect, cognitive aspect is referred to as life satisfaction. Anxiety can be
defined as “an aversive emotional state, in which the feeling of fear is disproportionate to the
nature of the threat” (Bouayed, Rammal and Soulimani, 2009, p.63). Depression can be
“characterized by a constellation of symptoms including sleep and eating disturbances, low
mood, feelings of worthlessness, increased guilt, and suicidal ideation” (Grant, Guille and
Sen, 2013, p.1).
Interconnection Between Well-being and Stress Coping Behaviours
Dolan, Peasgood and White (2008) stated in the revision of well-being studies that
there is strong relationship between well-being and physical and psychological health. World
Health Organisation defines mental health as a “state of well-being in which every individual
realizes his or her own potential, can cope with the normal stresses of life, can work
productively and fruitfully, and is able to make contribution to her or his community”
(WHO.int). As WHO definition mentions “stresses of life”, and correlation between mental
7
health and well-being was already established by other studies (WHO, 2012), both of these
statements would lead to suggestion that there might be a relationship between stress coping
behaviours and well-being. This study is going to examine the influences of stress coping
behaviours on psychological well-being with expectation to identify the variables which are
the strongest predictors of well-being. In order to better understand stress coping behaviours
and mechanisms linked with them, various aspects of stress need to be mentioned and stress
Transactional Model needs to be described, as coping mechanisms are build within the
structure of the model, which explains the adaptation processes assuring human survival
(Lazarus and Folkman, 1984).
Interconnection Between Stress and Other Adverse Well-being Measures.
The role of coping mechanisms is to protect individual from harmful effects of stress
which can manifest in anxiety and other emotional consequences (Vaida, Todor, Bertossi and
Corega, 2015). This statement closely relates stress to anxiety, also number of studies
provide evidence to significant positive correlations between anxiety and depression (Rawson
Bloomer and Kendall, 1994). In accordance with meta-analyses conducted by Stroud, Davila
and Moyer (2008) the various studies provided evidence to the direct relationship between
life stress and depression. Furthermore, in recent years the molecular link has been
established between stress, anxiety and depression with the use of behavioural mouse model
(Magalhaes et al., 2010). It was concluded that depressive disorders often occur with anxiety
and both are strongly linked to stressful experiences (Magalhaes et al., 2010). The results of
these studies provide an understanding that stress is an important variable connecting all the
adverse indicators of well-being.
8
Stress Types, Definition and Transactional Model
With accordance to Hans Selye (Shabo et al., 2012), stress can be divided into
negative stress, called distress and positive stress, called eustress. Distress is an example of
mental ill health, however eustress can have positive affect on organisms’ cognitive functions
(Lupien et al., 2007). Stress is also unavoidable part of human life and it is defined as a
response to disturbing incidents (Lazarus and Folkman, 1984). Stress was integrated into
humans genetic make up, as an aid in defensive mechanisms and played important role in
assuring survival of the species. Lazarus and his associates developed the psychological
theory of stress and coping and distinguished in it the process of cognitive appraisal and the
process of coping that forms a transaction between the organism and the environment –
secondary appraisal (Folkman et al., 1986). During cognitive appraisal an organism evaluates
an unexpected experience and its relevance to the organism’s well being. This phase is
followed by coping – secondary appraisal – which is based on continuously changing
cognitive and behavioural efforts in order to meet the internal and external demands
(Folkman et al., 1986).
Physiological and Physical Aspects of Stress
As per Boyce and Ellis (2005) – “Environmental events signalling threats to survival
or well being produce a set of complex, highly orchestrated responses within the neural
circuitry of the brain and peripheral neuroendocrine pathways regulating metabolic,
immunologic, and other physiological functions (Boyce et al., 2005, p.272). Human bodies
are designed to respond to stress in a physical way by running, climbing, jumping,
performing agility movements and other forms of physical activity. This physical activity in
turn brings all the bodily functions and chemical responses back to balanced and normal
state. Stress is present in all aspects of life and rarely can be avoided (Baron and Branscombe,
9
2012). Nowadays, due to the sedentary changes in peoples life styles, human body can no
longer deal with all the complex changes and in turn creates pressure effecting internal
organs. Devastating effects of high level of stress can cause serious illness problems as well
as contribute to wide scale of medical problems (Baron et al., 2012, p.272).
Changes elicited by stress on physiological level include enlargement of adrenal glands,
atrophy of thymus and gastric ulcerations, these reactions to stressors were examined by Hans
Selye in 1936 (Lupien et al., 2007). In a result of this studies Selye developed three stages of
General Adaptation Syndrom: alarm reaction, stage of resistance and stage of exhaustion
(Krohne, 2002). Alarm reaction stage involves shock phase and after-shock phase. Major
physiological changes take place during the shock phase and increased adreno-cortical
activity is characteristic of the after-shock phase (Krohne, 2002). In the stage of resistance, an
organism starts to adapt to the stressor but its resistance to other stressors decreases, and in
the exhaustion stage, while the stressor persists to appear, an organism goes through the
physiological reactions of the first stage but there is no more resistance stage, therefore cell
and tissue damage occurs (Krohne, 2002). Mental reactions to stress are not the only type of
reactions that happen in human body, there is a number of physiological reactions that are
caused by presence of chronic stress in peoples life. Physiological changes in the body that
are triggered by stress include damaging effect on cell aging which manifests itself by
shortening chromosome ends – telomeres (Puterman et al., 2010). Puterman et al., stated in
the study that sedentary people would have shorter telomeres which is directly related to
exposure to the chronic stress. It was found that physical activity lessens the effects of stress
on cellular longevity (Puterman et al., 2010)
Damaged tissues and cells in the heart muscle have upmost significance in physical health,
therefore stress is officially recognised by WHO as a contributing factor of Coronary Heart

10
Disease. CHD is the biggest cause of death globally – as per WHO statistics from January
2015.
Psychological Stressors and Coping Strategies
Selye’s work was challenged by various researchers as he focused on physical
stressors while psychological stressors significance was examined in great detail by Mason
(1971). Mason had determined three psychological factors that would induce stress reaction
in any individual: novelty, unpredictability and lack of control (Lupien et al., 2007). Handling
stressful situation or reacting to a stressor is quite often dependent on coping strategies of the
individual (Shankar et al., 2014). There are two main types of strategies: problem –focused
(planning) and emotion-focused (support), which can be further divided into active and
passive strategies (Shankar et al., 2014). However, there are also positive coping strategies,
which involve engagement in physical activities , exercise, improved nutrition, adequate
sleep (Sam et al., 2016). Sam et al., (2016) concluded that , if stress is managed using
positive strategies the healthy psychological and physical results are possible. Nevertheless
Park and Lacocca (2013) argues that engaging in positive health behaviour like exercise is
quite often associated with many other reasons, and coping with stress is only one of the
factors.
The Influence of Exercise on Responses to Stressors
Relation between exercise and response to stressors was examined by Salmon (2001),
where it was determined that exercise has lowering effect on physiological and psychological
response to variety of stressors. This finding was confirmed by meta-analysis review on
effects of exercise on stress induced blood pressure increase, carried out by Hammer, Taylor
and Steptoe (2006) – where it was stated that moderate to high intensity exercise sessions
reduce stress related blood pressure. Hammer et al., (2006) concluded that from the public

11
health perspective it has significant meaning as it reduces probability of development heart
related diseases - therefore manifesting important ecological validity. Cardiovascular
exercise was recommended as an intervention measure in physiological stress reactivity
(Hammer et al., 2006).
Hammer, Stamatakis and Steptoe (2009) carried out study examining relationship
between physical activity and mental health among Scottish population. Results of this study
showed strong association between physical activity and reduced psychological distress,
where lower levels of distress were associated with high levels of activity. However Gerber
and Puhse (2009) reviewed 31 studies on effects of exercise and stress related health
implications – and found that only half of the studies showed significant results confirming
those effects. More experimental and prospective studies were recommended. A mounting
body of evidence suggests, that correlation between exercise and stress has significance in
reducing psycho-somatic symptoms of stress, therefore, present study is going to examine
various aspects of exercise as a coping behaviour.
The Influence of Exercise on Well-being Measures (Happiness, Anxiety, Depression,)
Lathia et al., (2017) concluded, in the study examining physical activity and
happiness, that a frequency of movement throughout the day is associated with physical
health and happiness, even if the movement is not a rigorous exercise. Dubbert (2002) in the
overview to major developments in the area of physical exercise and its affect on mental
health, had determined that there has been major development in the last couple of decades.
This development shows importance of exercise in increasing physical and mental well-being
(Dubbert, 2002). As it is cited by Dubbert, Surgeon General’s Report (U.S. Department of
Health and Human Services, 1996) have determined that experimental studies have shown
that exercise can be a successful intervention in treating anxiety and depression moods.

12
However clinical population is not the only population getting benefits from exercise, general
public perceived mental health and its relation to physical activity was also measured. Goodwin
(2003) in the study examining participants of Comorbidity Syrvey in U.S. concluded, that physical
exercise was significantly related to reduction in occurrence of depression and anxiety disorders.
More recent evidence of the negative correlation between exercise and self-reported anxiety and
depression was provided by Tyson et al., (2010) in the study examining physical activity and mental
health in student population. This study have shown dose-response relationship between the two
variables, the greater the physical activity the lesser the symptoms of anxiety and depression (Tyson
et al., 2010). Furthermore, Salmon (2001) in the review article on exercise and the influence on
stressors, anxiety and depression, stated that number of studies provided evidence to effectiveness of
cardiovascular exercise in reducing depression and anxiety. In addition Strickland and Smith (2014)
in their review of exercise types and effects on well-being determined that combining cardiovascular
exercise with strength exercise can have more robust effect on mental health measures. There are
however studies which do not support relationship between exercise and mental health , therefore
more comprehensive research should be carried out as suggested by Tylor, Sallis and Needle (1985)
review article. In Tylor' s et al., (1985) review paper on relation of physical activity on mental health
there was one study which had shown increase in anxiety following the exercise and two studies that
have shown no change in anxiety levels. Therefore, current study is going to further examine the
relationship between various aspects of exercise and adverse well-being measures.
In case of life satisfaction, a variable associated with well-being and prosperity (Maher
et al., 2015), a number of cross-sectional and prospective studies have provided evidence to
the statement that in midlife and in older adulthood, exercise is positively related to life
satisfaction. Maher et al., (2015) concluded that there is a significant association between
exercise and between-person life satisfaction approach (association driven by differences
between more or less active people), and daily exercise and within-person life satisfaction
approach (association driven by difference between more or less active days). There are

13
studies that confirmed links between life satisfaction and positive emotions (Cohn et al.,
2009). Furthermore Pettit et al., (2001) concluded that people with positive emotions are less
likely to report poor health, and this may have implications in the health care.
Support and Control as Coping Mechanisms and the Influencing Factors on Well-being.
In the article on social support and well-being by Ozbay et al., (2007), social support
was defined as a “support accessible to an individual through social ties to other individual,
group and the larger community” (Ozbay et al., 2007, p.37), and low social support was
associated to physical symptoms of high stress reactivity. According to Roohafza et al.,
(2014), support mechanism coming from the family, friends or social groups can buffer
against life stressors and promote health. In Roohafza et al., (2014) study, family support was
a strong protective factor from depression and anxiety. Furthermore this study examined
relation between perceived social support and coping styles, and concluded that there is a
positive relationship between the social support and active coping styles. Active coping styles
describe direct and rational approach in dealing with a problem and are associated with lower
levels of anxiety and depression (Roohafza et al., 2014). In relation to influencing role of
support on happiness, Liping (2001) concluded that support predicts happiness and positive
affect. In the light of aforementioned studies the influence of support on well-being measures
will be further examined.
A study conducted by Sherman et al., (2012) identified sense of control as a mediator
between stress levels and rank among leaders. The negative relationship between stress levels
and rank meant that the greater the rank the lower was the stress level. The findings of
Sherman et al., (2012) study also associated leadership rank and related with it sense of
control with lower anxiety levels. In case of influence of control on happiness and
depression, Amoura, Berjot, Gillet and Altintas (2014) in their study on perceived control and
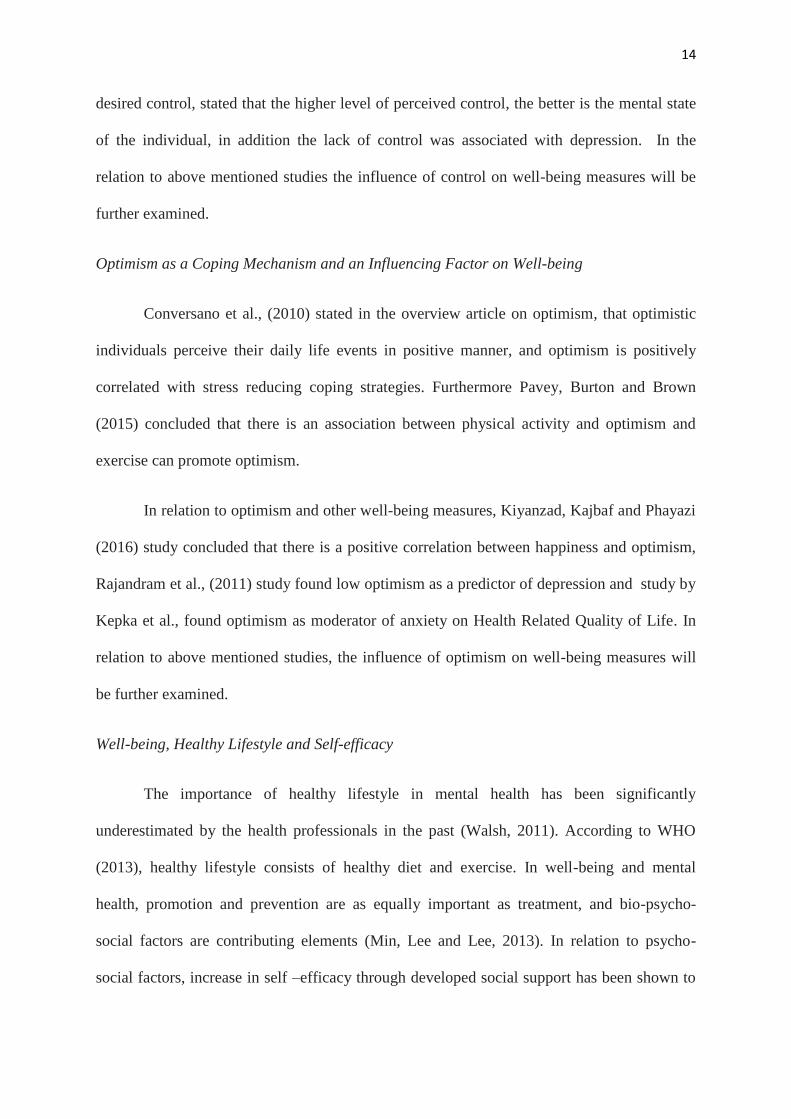
14
desired control, stated that the higher level of perceived control, the better is the mental state
of the individual, in addition the lack of control was associated with depression. In the
relation to above mentioned studies the influence of control on well-being measures will be
further examined.
Optimism as a Coping Mechanism and an Influencing Factor on Well-being
Conversano et al., (2010) stated in the overview article on optimism, that optimistic
individuals perceive their daily life events in positive manner, and optimism is positively
correlated with stress reducing coping strategies. Furthermore Pavey, Burton and Brown
(2015) concluded that there is an association between physical activity and optimism and
exercise can promote optimism.
In relation to optimism and other well-being measures, Kiyanzad, Kajbaf and Phayazi
(2016) study concluded that there is a positive correlation between happiness and optimism,
Rajandram et al., (2011) study found low optimism as a predictor of depression and study by
Kepka et al., found optimism as moderator of anxiety on Health Related Quality of Life. In
relation to above mentioned studies, the influence of optimism on well-being measures will
be further examined.
Well-being, Healthy Lifestyle and Self-efficacy
The importance of healthy lifestyle in mental health has been significantly
underestimated by the health professionals in the past (Walsh, 2011). According to WHO
(2013), healthy lifestyle consists of healthy diet and exercise. In well-being and mental
health, promotion and prevention are as equally important as treatment, and bio-psycho-
social factors are contributing elements (Min, Lee and Lee, 2013). In relation to psycho-
social factors, increase in self –efficacy through developed social support has been shown to
15
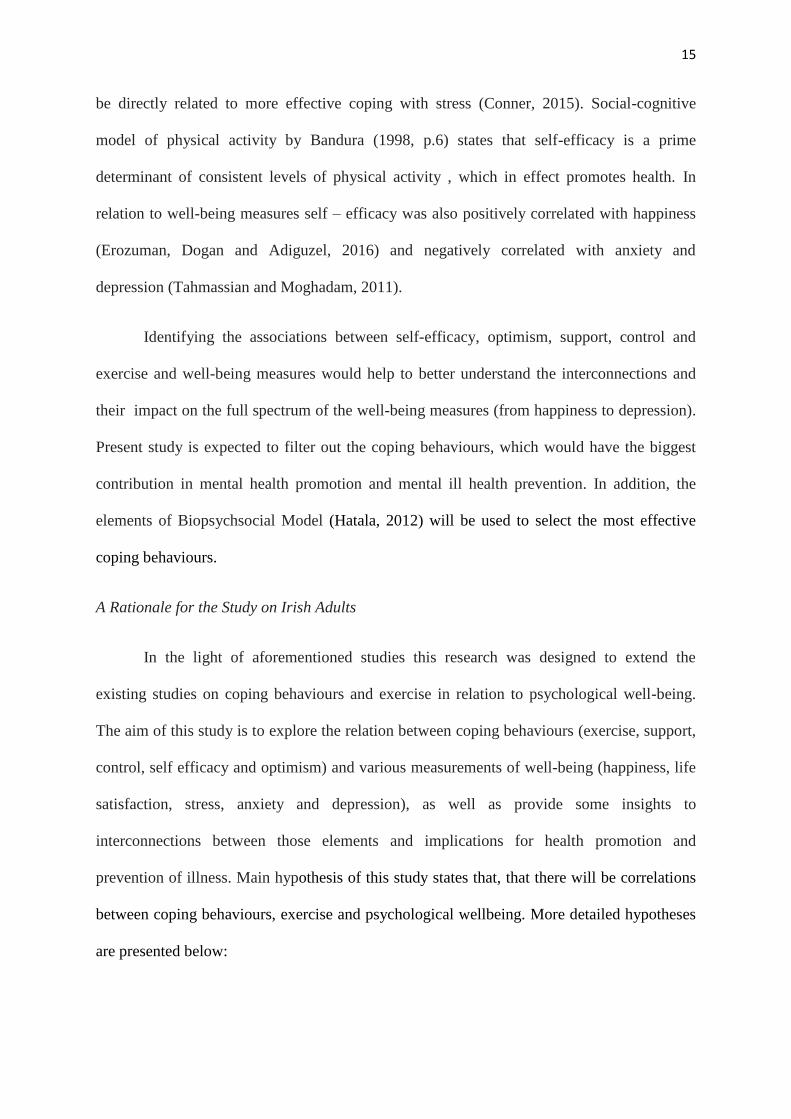
be directly related to more effective coping with stress (Conner, 2015). Social-cognitive
model of physical activity by Bandura (1998, p.6) states that self-efficacy is a prime
determinant of consistent levels of physical activity , which in effect promotes health. In
relation to well-being measures self – efficacy was also positively correlated with happiness
(Erozuman, Dogan and Adiguzel, 2016) and negatively correlated with anxiety and
depression (Tahmassian and Moghadam, 2011).
Identifying the associations between self-efficacy, optimism, support, control and
exercise and well-being measures would help to better understand the interconnections and
their impact on the full spectrum of the well-being measures (from happiness to depression).
Present study is expected to filter out the coping behaviours, which would have the biggest
contribution in mental health promotion and mental ill health prevention. In addition, the
elements of Biopsychsocial Model (Hatala, 2012) will be used to select the most effective
coping behaviours.
A Rationale for the Study on Irish Adults
In the light of aforementioned studies this research was designed to extend the
existing studies on coping behaviours and exercise in relation to psychological well-being.
The aim of this study is to explore the relation between coping behaviours (exercise, support,
control, self efficacy and optimism) and various measurements of well-being (happiness, life
satisfaction, stress, anxiety and depression), as well as provide some insights to
interconnections between those elements and implications for health promotion and
prevention of illness. Main hypothesis of this study states that, that there will be correlations
between coping behaviours, exercise and psychological wellbeing. More detailed hypotheses
are presented below:
16
H1: It is hypothesised that there will be a significant correlations between frequency of
exercise and well being (operationalised as GHQ, stress, anxiety, depression, happiness and
life satisfaction).
H2: It is predicted that there will be a significant difference in well being between
participants who do and do not do cardiovascular exercise.
H3: It is also predicted that there will be a significant difference in well being between
participants who do cardiovascular and strength exercise and those, who do only either
cardiovascular or strength exercise.
H4: It is hypothesised that there will be a significant correlations between control , support
and well being (operationalised as GHQ, stress, anxiety, depression, happiness and life
satisfaction).
H5: It is also hypothesised that there will be a significant correlations between optimism,
self-efficacy and well - being (operationalised as GHQ, stress, anxiety, depression,
happiness and life satisfaction).

17
Methodology
Participants
The study consisted of 107 participants who completed the questionnaire in pen and
pencil and an online form. Some items had missing values, therefore response rate was less
than 107 in some parts of the questionnaire. The participants were a convenience sample
recruited by the researcher personally in a fitness studio and a cross fit gym in the midlands
of Ireland and online through facebook. The sample consisted of 40.2% of males (N=43) and
59.8% of females (N=64). The participants ranged in age (Mean=37.10, SD=8.59) from 22 to
61 years old. Participation in the study was voluntarily.
Design
This study employed quantitative, correlational and cross-sectional design. The
predictor variables in correlational part of the study were identified as : weekly exercise,
control, support, optimism and self efficacy. The criterion variables in the correlational part
of the study were identified as : happiness, life satisfaction, stress, anxiety, depression and
GHQ. The independent variables in relation to cross-sectional part of the study were
identified as: cardio exercise, cardio and strength exercise. The dependent variables in
relation to cross-sectional part of the study were identified as: happiness, life satisfaction,
stress, anxiety, depression and GHQ.
Materials
Materials used in the study comprised of a brief, a consent form, demographic
questionnaire developed by the researcher, Diener’s Happiness scale (single item) (Kesebir
and Diener, 2008), Control and Support measures (Gibbons, Dempster and Moutray, 2009),

18
the Satisfaction with Life Scale (Diener, Emmons, Larsen and Griffin, 1985), Peterson and
Seligman’s Values in Action optimism scale (Peterson and Seligman, 2004), the General
Health Questionnaire (Goldberg, Williams and Williams, 1988), The Generalised Self
Efficacy Scale (Jeruzalem and Schwarzer, 1992), the Depression, Anxiety, Stress Scales
(Lovibond and Lovibond, 1995).
The brief form was provided to inform the participant of the title of the study and the
aims of the study. There was also information about the researcher and the form of contact, as
well as information in relation to anonymity and confidentiality. A consent form was also
provided along with information sheet with contact details for Aware and the Samaritans, in
case of occurrence of any negative feelings resulting from the completion of the
questionnaire.
A demographic questionnaire was developed by the researcher to determine gender
and age of participants, and for the purpose of this study there was a number of questions in
relation to exercise. These questions were designed to establish the frequency of exercise
(computed of individual and group sessions variables), type of exercise (cardio exercise
variable) and variety of exercise (computed of cardio and strength exercise variables). The
author and the thesis supervisor both read and agreed that the items had face validity.
Happiness measure.
In case of a happiness (Kesebir et al., 2008) a one item scale was administered with
the 11 point answer scale (0-10). The participants were asked to answer single question:
"How would you rate your happiness?". The answer possibility range was from 0 – Not
happy to 10 – Very happy, and indicated that the higher was the score the higher was the
participants level of happiness. The single item happiness scale reliability and validity was
examined by Abdel-Khales (2006). The established reliability was at .86 and good
concurrent and convergent validity was also denoted.

19
Support measure.
In relation to support (Gibbons et al., 2009) a 3 item scale was administered
measuring family, friends and gym support on 11 point answer scale (0-10). The participants
were asked to value the level of support. The example of the items asked include: "How
much would you value level of support offered by your family". The answer possibility range
was from 0- No value to 10- Very high value. The answer indicated that, the higher the score
the higher was the valued level of support. The reliability of the support scale was established
by Gibbons (2008) at .7 and the scale was judged to have face validity.
Control measure.
In relation to control (Gibbons et al., 2009) a 3 item measurement was used. The
participants were asked to respond in 5 point likert scale from 5- Strongly agree to 1-
Strongly disagree. The example of the questions asked include: "In general I feel in control of
the things that happen to me". The first and the last item of the scale were scored in reverse
and the highest was the score of participant the highest was the feeling of control. The
reliability of the control scale was .7 (Gibbons, 2008), and the scale was judged to have face
validity.
Satisfaction with life scale.
In terms of the Satisfaction With Life Scale (Diener et al.,1985), a 5 item scale was
used to assess participants general satisfaction with life. Participants were asked to indicate
how much they agree with each item using 7 point likert scale from 1- Strongly disagree to 7-
Strongly agree. The examples of some of the questions asked, include: "In most ways my life
is close to my ideal" and "If I could live my life over, I would change almost nothing". Scores
from 5 to 9 indicate Extreme Dissatisfaction, 10-14 Dissatisfaction referred to substantially

20
dissatisfied with their lives people, 15-19 indicate that participants are Slightly Below
Average in Life Satisfaction, 20-24 range indicates Average Satisfaction and can be referred
to majority of people, 25-29 scores are described as High scores and people, who score in
this range like their lives, finally 30-35 score indicates Very High Satisfaction With Life.
Pavot and Diener (1993) reported good construct validity of Satisfaction with Life Scale with
.87 reliability which decreases to .54 over longer period of time.
Optimism measure.
In relation to Peterson and Seligman’s Values in Action optimism scale (Peterson et
al., 2004), 8 item scale was used and participants were asked to respond in 5 item likert scale
from 1- Strongly disagree to 5- Strongly agree. The examples of some of the items asked
include: "I look on the bright side" and "I think about what is good in my life when I feel
down". The last 3 items of the measurement were scored in reverse. The highest numbers on
the scale, the highest level of optimism in the participant. Ruch et al., (2010) confirmed the
validity and .7 reliability of Values in Action scale.
GHQ - measure of distress.
The General Health Questionnaire (12 item version ) (Goldberg et al., 1988) is a well
established measurement of distress and was developed to determine likelihood and risk of
developing psychiatric disorders. For the purpose of this study the 12 item scale was used.
Examples of some of the items include: “Have you recently lost much sleep over worry?” or
“Have you recently been loosing confidence in yourself?” Each item was accompanied with 4
possible responses. Examples of some of the responses include: “Not at all” or “More so than
usual”. Participants were asked to provide one answer and responses were scored from 1 to 4.
This method of scoring is useful to compare the degree of disorder, however the cut-offs have
not yet been validated. Jackson (2007) confirmed the reliability of GHQ in the range
between .78 - .95.
21
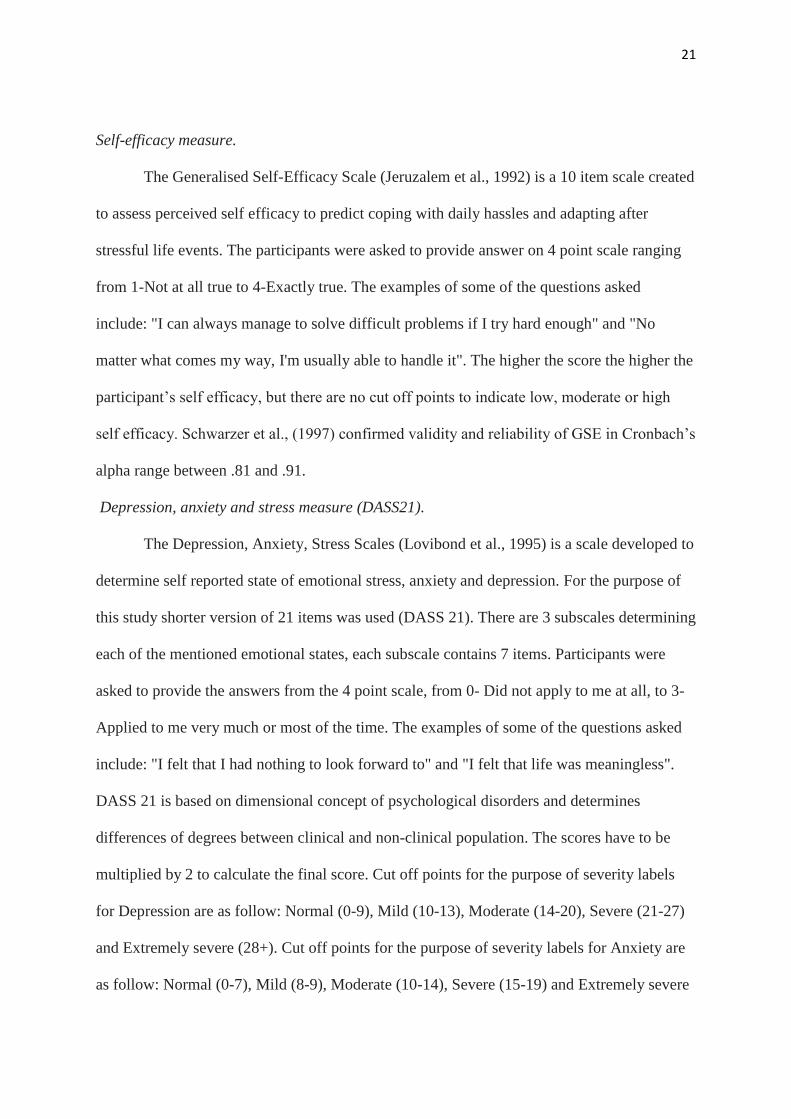
Self-efficacy measure.
The Generalised Self-Efficacy Scale (Jeruzalem et al., 1992) is a 10 item scale created
to assess perceived self efficacy to predict coping with daily hassles and adapting after
stressful life events. The participants were asked to provide answer on 4 point scale ranging
from 1-Not at all true to 4-Exactly true. The examples of some of the questions asked
include: "I can always manage to solve difficult problems if I try hard enough" and "No
matter what comes my way, I'm usually able to handle it". The higher the score the higher the
participant’s self efficacy, but there are no cut off points to indicate low, moderate or high
self efficacy. Schwarzer et al., (1997) confirmed validity and reliability of GSE in Cronbach’s
alpha range between .81 and .91.
Depression, anxiety and stress measure (DASS21).
The Depression, Anxiety, Stress Scales (Lovibond et al., 1995) is a scale developed to
determine self reported state of emotional stress, anxiety and depression. For the purpose of
this study shorter version of 21 items was used (DASS 21). There are 3 subscales determining
each of the mentioned emotional states, each subscale contains 7 items. Participants were
asked to provide the answers from the 4 point scale, from 0- Did not apply to me at all, to 3-
Applied to me very much or most of the time. The examples of some of the questions asked
include: "I felt that I had nothing to look forward to" and "I felt that life was meaningless".
DASS 21 is based on dimensional concept of psychological disorders and determines
differences of degrees between clinical and non-clinical population. The scores have to be
multiplied by 2 to calculate the final score. Cut off points for the purpose of severity labels
for Depression are as follow: Normal (0-9), Mild (10-13), Moderate (14-20), Severe (21-27)
and Extremely severe (28+). Cut off points for the purpose of severity labels for Anxiety are
as follow: Normal (0-7), Mild (8-9), Moderate (10-14), Severe (15-19) and Extremely severe
22
(20+). Cut off points for the purpose of severity labels for Stress are as follow: Normal (0-
14), Mild (15-18), Moderate (19-25), Severe (26-33) and Extremely severe (34+). Tran, Tran
and Fisher (2013) confirmed validity and reliability of DASS21 in Cronbach’s alpha range
between .72 and .77 for each subscale and reliability of .88 for the overall score.
Procedure
The study was approved by the ethics committee. The questionnaire for the study was
distributed in paper form among the willing participants in trx fitness studio and cross fit gym
in the midlands; the link to the online questionnaire was also distributed through facebook
and e-mail network. The participants were provided with the questionnaire and the
information sheet. Information sheet emphasised the anonymity and confidentiality of the
participants, the consent form was also included and participants were asked to indicate their
consent to take part in the survey. Participants in the fitness studio and gym were also
provided with envelopes and self designed letter boxes to facilitate safe return of the surveys.
They could bring the questionnaires home and return them at their convenience, however
there was a deadline of two weeks after which the letter boxes were removed from the
facilities. Participants in the gym and studio were also briefed personally by the researcher
during the initial distribution stage, where they were told that the purpose of the study is to
examine the relationship between mental health (stress), coping and exercise. Similar brief
was given to the participants, who completed the questionnaires online, where the
information page would precede the link to the questionnaire. All the participants were also
advised that completing the questionnaire will take approximately 10-15 minutes.
Participants were thanked for taking part in the survey and given contact information, should
they require more information about the study. After two week period all the data was
collected and entered into SPSS for analysis, paper form was entered manually and online
form was downloaded in excel spreadsheet and subsequently uploaded to SPSS.

23
Ethical considerations
The study was approved by ethics committee of the Dublin Business School. It was of vital
importance to the researcher to maintain rights and dignity of all participants in this study.
All the participants were advised about anonymity and the right to withdraw – as they could
stop completing the survey at any stage however once submitted, withdraw would not be
possible – as all the questionnaires were anonymous. All participants were asked to indicate
their willingness to participate in the study by signing a separate questionnaire consent form
or by placing a tick beside the consent in the online version.
24
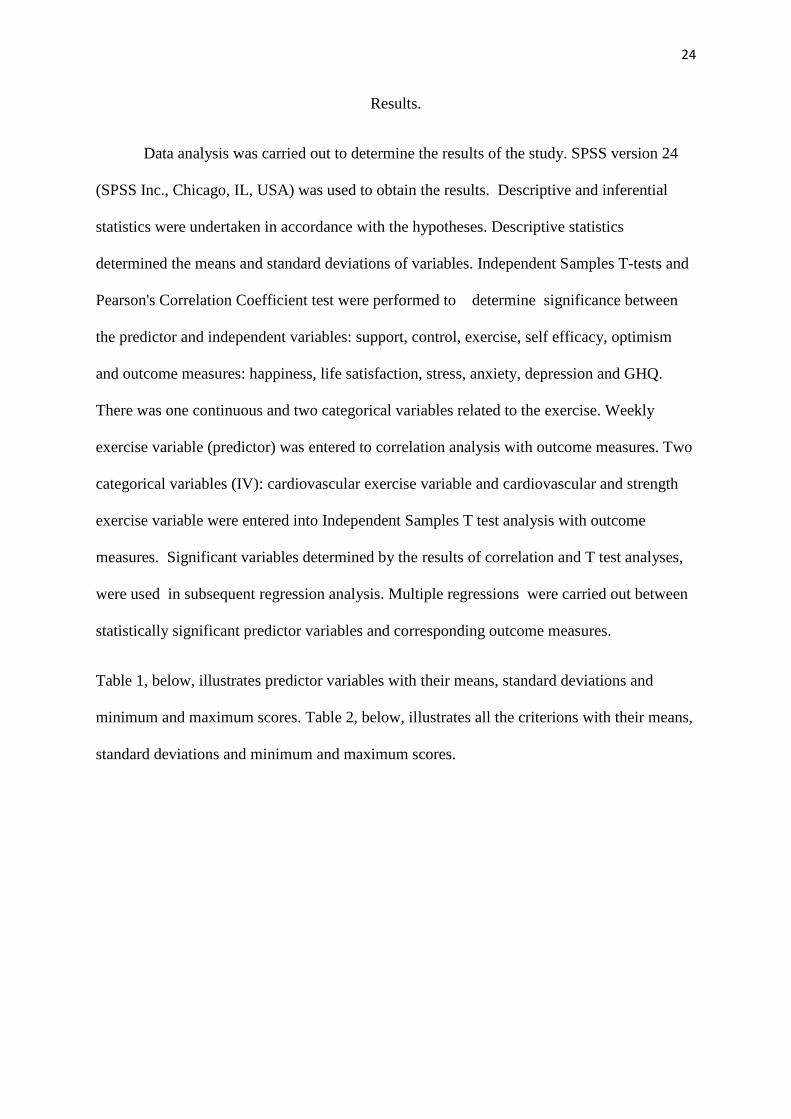
Results.
Data analysis was carried out to determine the results of the study. SPSS version 24
(SPSS Inc., Chicago, IL, USA) was used to obtain the results. Descriptive and inferential
statistics were undertaken in accordance with the hypotheses. Descriptive statistics
determined the means and standard deviations of variables. Independent Samples T-tests and
Pearson's Correlation Coefficient test were performed to determine significance between
the predictor and independent variables: support, control, exercise, self efficacy, optimism
and outcome measures: happiness, life satisfaction, stress, anxiety, depression and GHQ.
There was one continuous and two categorical variables related to the exercise. Weekly
exercise variable (predictor) was entered to correlation analysis with outcome measures. Two
categorical variables (IV): cardiovascular exercise variable and cardiovascular and strength
exercise variable were entered into Independent Samples T test analysis with outcome
measures. Significant variables determined by the results of correlation and T test analyses,
were used in subsequent regression analysis. Multiple regressions were carried out between
statistically significant predictor variables and corresponding outcome measures.
Table 1, below, illustrates predictor variables with their means, standard deviations and
minimum and maximum scores. Table 2, below, illustrates all the criterions with their means,
standard deviations and minimum and maximum scores.
25
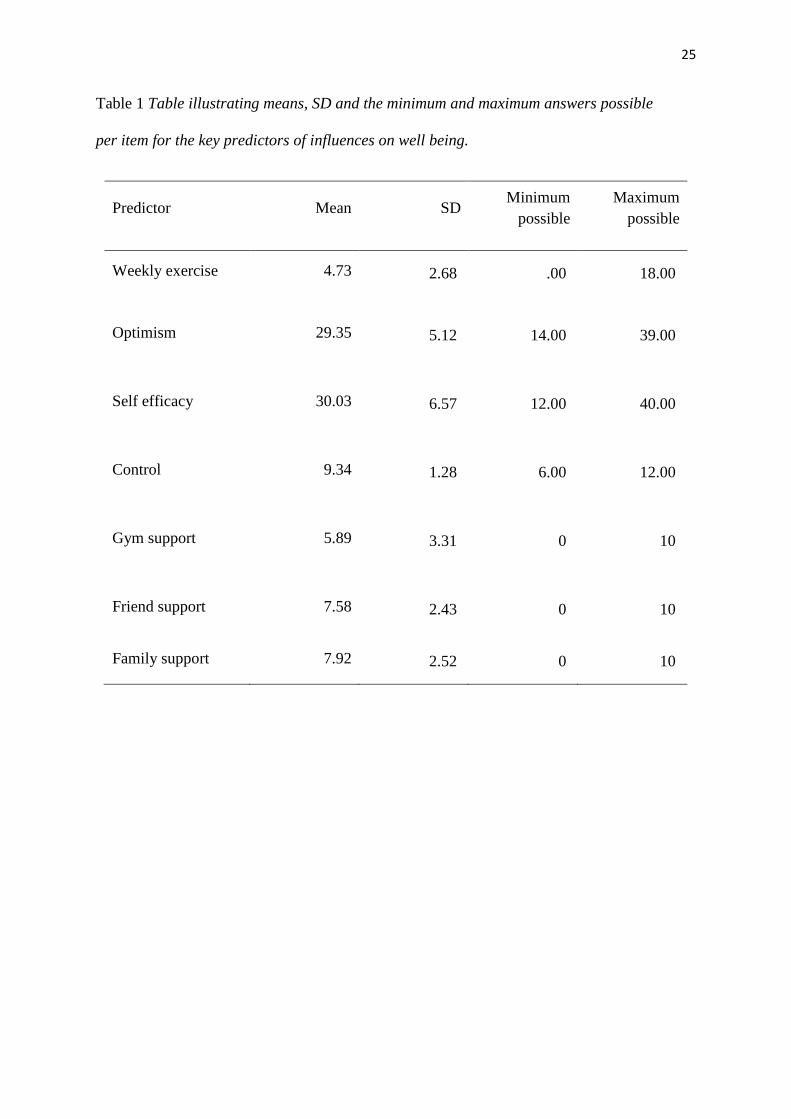
Table 1 Table illustrating means, SD and the minimum and maximum answers possible
per item for the key predictors of influences on well being.
Predictor Mean SD Minimum
possible
Maximum
possible
Weekly exercise 4.73 2.68 .00 18.00
Optimism 29.35 5.12 14.00 39.00
Self efficacy 30.03 6.57 12.00 40.00
Control 9.34 1.28 6.00 12.00
Gym support 5.89 3.31 0 10
Friend support 7.58 2.43 0 10
Family support 7.92 2.52 0 10

26
Table 2 Table illustrating means, SD and minimum and maximum answers possible per item
for the outcome measures of well being.
Outcome
measure Mean SD
Minimum
possible
Maximum
possible
Happiness 7.30 1.98 1 10
Depression 8.04 10.19 .00 40.00
Anxiety 7.63 9.02 .00 40.00
Stress 13.77 10.54 .00 42.00
Life satisfaction 24.66 6.51 6.00 35.00
GHQ 23.63 5.58 15.00 42.00
Some of the predictor variables were categorical, therefore Table 3 and Table 4 below
show the number of participants in each group along with mean differences and standard
deviations of the responses to the well being variables.
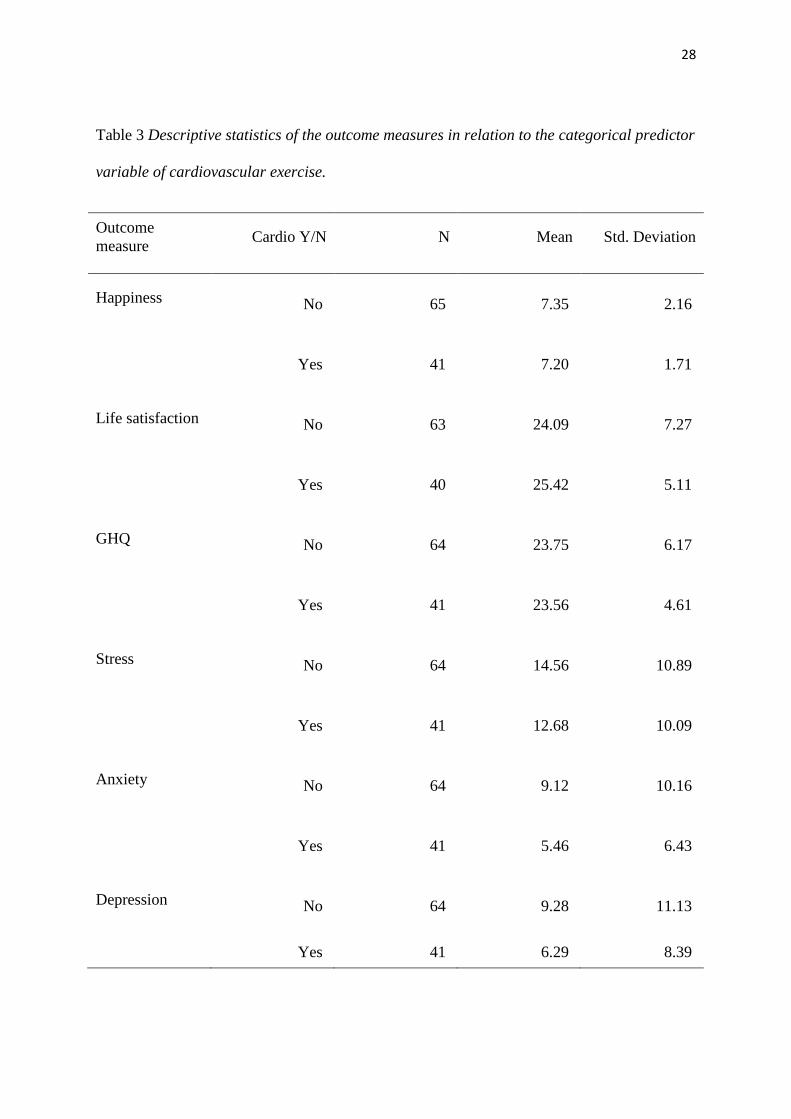
Predictor variable in Table 3 is cardiovascular exercise, this table shows the answers
to outcome measures, provided by the groups of participants who did or did not do
cardiovascular exercise. In terms of happiness, life satisfaction and GHQ scores, the results
displayed in below Table 3 showed no differences between the participants who did and did
not do cardiovascular exercise. In relation to stress, participants who did not do
cardiovascular exercise (M=14.56, SD=10.89) recorded higher levels of stress than those who
did do cardiovascular exercise (M=12.68, SD=10.09). In terms of anxiety, participants who

27
did not do cardiovascular exercise (M=9.12, SD=10.16) reported higher levels of anxiety to
those who did do cardiovascular exercise (M=5.46, SD=6.43). In case of depression,
participants who did not do cardiovascular exercise (M=9.28, SD=11.13) were found to
display higher levels of depression than those who did do cardiovascular exercise ( M=6.29,
SD=8.39). The main difference in the mean scores shows that participants who did do
cardiovascular exercise scored lower on the adverse indicators of well being to those who did
not do the cardiovascular exercise.
Predictor variable in Table 4 is cardiovascular and strength exercise, this table shows
the answers provided by the participants of the groups who did both types of exercise:
cardiovascular and strength , and those, who did either cardiovascular or strength exercise. In
case of happiness, life satisfaction and GHQ scores, the results displayed in below Table 4
showed no differences between the participants who did and did not do both types of
exercise. In terms of stress, participants who did either cardiovascular or strength exercise
(M=14.23, SD=10.73) recorded higher levels of stress than those who did both types of
exercise (M=11.23, SD=8.80). In relation to anxiety, participants who did either
cardiovascular or strength exercise (M=7.97, SD=9.23) reported higher levels of anxiety to
those who did both types of exercise (M=4.77, SD=5.37). In case of depression, participants
who did either cardiovascular or strength exercise (M=8.72, SD=10.55) were found to display
higher levels of depression than those who did both types of exercise ( M=5.00, SD=7.08).
The main difference in the mean scores shows that participants who did both types of
exercise scored lower on the adverse indicators of well being to those who did either
cardiovascular or strength exercise.
28
Table 3 Descriptive statistics of the outcome measures in relation to the categorical predictor
variable of cardiovascular exercise.
Outcome
measure Cardio Y/N N Mean Std. Deviation
Happiness No 65 7.35 2.16
Yes 41 7.20 1.71
Life satisfaction No 63 24.09 7.27
Yes 40 25.42 5.11
GHQ No 64 23.75 6.17
Yes 41 23.56 4.61
Stress No 64 14.56 10.89
Yes 41 12.68 10.09
Anxiety No 64 9.12 10.16
Yes 41 5.46 6.43
Depression No 64 9.28 11.13
Yes 41 6.29 8.39

29
Table 4 Descriptive statistics of the outcome measures in relation to the categorical predictor
variable of cardiovascular and strength exercise.
Outcome
measure
Cardio and
Strength Y/N N Mean Std. Deviation
Happiness No 70 7.30 2.08
Yes 26 7.38 1.44
Life satisfaction No 67 24.63 6.62
Yes 26 25.58 4.54
GHQ No 69 23.83 5.91
Yes 26 23.00 4.62
Stress No 69 14.23 10.73
Yes 26 11.23 8.80
Anxiety No 69 7.97 9.23
Yes 26 4.77 5.37
Depression No 69 8.72 10.55
Yes 26 5.00 7.05
30
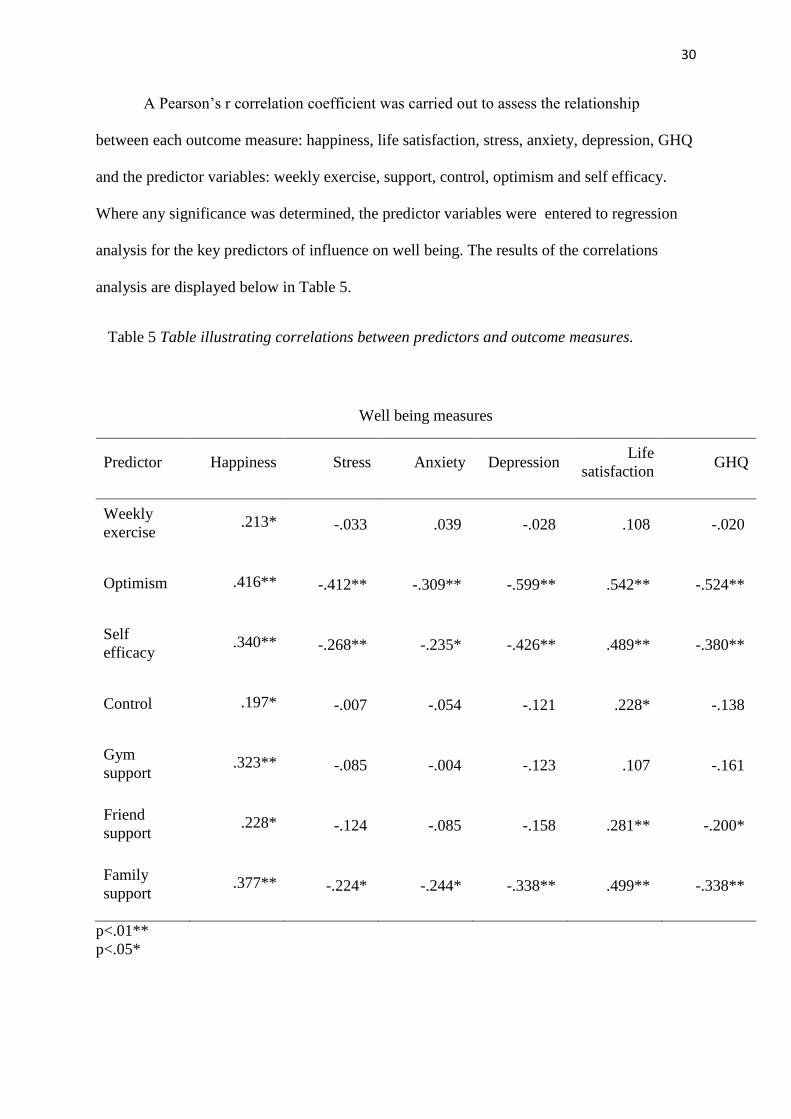
A Pearson’s r correlation coefficient was carried out to assess the relationship
between each outcome measure: happiness, life satisfaction, stress, anxiety, depression, GHQ
and the predictor variables: weekly exercise, support, control, optimism and self efficacy.
Where any significance was determined, the predictor variables were entered to regression
analysis for the key predictors of influence on well being. The results of the correlations
analysis are displayed below in Table 5.
Table 5 Table illustrating correlations between predictors and outcome measures.
Well being measures
Predictor Happiness Stress Anxiety Depression Life
satisfaction GHQ
Weekly
exercise .213* -.033 .039 -.028 .108 -.020
Optimism .416** -.412** -.309** -.599** .542** -.524**
Self
efficacy .340** -.268** -.235* -.426** .489** -.380**
Control .197* -.007 -.054 -.121 .228* -.138
Gym
support .323** -.085 -.004 -.123 .107 -.161
Friend
support .228* -.124 -.085 -.158 .281** -.200*
Family
support .377** -.224* -.244* -.338** .499** -.338**
p<.01**
p<.05*

31
Table 5 illustrates that there was a correlation between happiness and weekly exercise
(r(105)=.21, p=.028) happiness and optimism (r(102)=.42, p<.001), happiness and self
efficacy (r(104)=.34, p<.001), happiness and control (r(103)=.19, p=.044), happiness and
family support (r(104)=.38, p<.001), happiness and friend support (r(104)=.23, p=.019) and
between happiness and gym support (r(102)=.32, p=.001). There was also a correlation
between stress and optimism (r(101)=-.41, p<.001), stress and self efficacy (r(103)=-.27,
p=.006) and stress and family support (r(103)=-.22, p=.022). The correlation was also
determined between anxiety and optimism (r(101)=-.31, p=.001), anxiety and self efficacy
(r(103)=-.23, p=.16) and family support and anxiety (r(103)=.-24, p=.012). Life satisfaction
was correlated to optimism (r(99)=.54, p<.001), to self efficacy (r(101)=.48, p<.001), control
(r(100)=.23, p=.021), family support (r(101)=.49, p<.001) and friend support (r(101)=.28,
p=.004). GHQ was correlated to optimism (r(101)=-.52, p<.001), self efficacy (r(104)=-.38,
p<.001), family support (r(103)=-.34, p<.001) and friend support (r(103)=-.20, p=.041).
Finally correlation was determined between depression and optimism (r(101)=-.59, p<.001),
depression and self efficacy (r(103)=-43, p<.001) and depression and family support
(r(103)=-.34, p<.001).
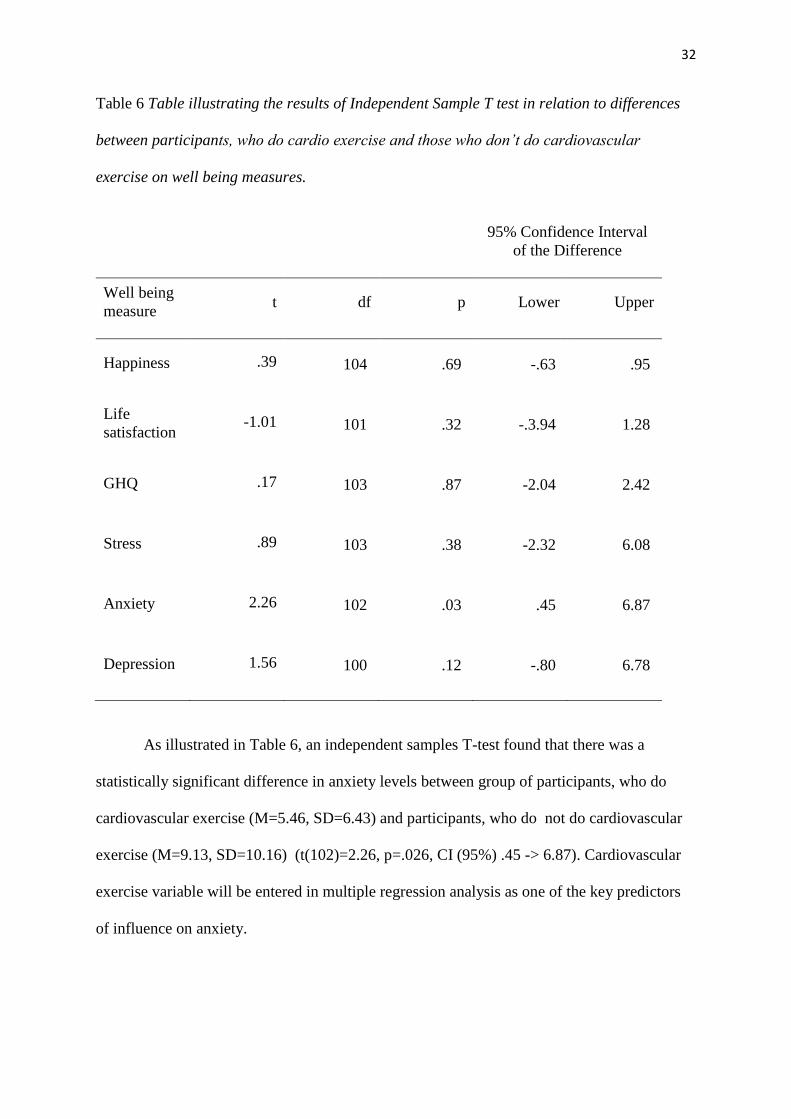
An Independent Samples T test was carried out to distinguish differences between
groups of participants who did and did not do cardiovascular exercise on all well being
measures with results displayed below in Table 6. In relation to second categorical variable:
cardiovascular and strength exercise, an Independent Samples T test results are displayed
below in Table 7 illustrating differences between group of participants who did both types of
exercise and those , who did either cardiovascular or strength exercise.
32
Table 6 Table illustrating the results of Independent Sample T test in relation to differences
between participants, who do cardio exercise and those who don’t do cardiovascular
exercise on well being measures.
95% Confidence Interval
of the Difference
Well being
measure t df p Lower Upper
Happiness .39 104 .69 -.63 .95
Life
satisfaction -1.01 101 .32 -.3.94 1.28
GHQ .17 103 .87 -2.04 2.42
Stress .89 103 .38 -2.32 6.08
Anxiety 2.26 102 .03 .45 6.87
Depression 1.56 100 .12 -.80 6.78
As illustrated in Table 6, an independent samples T-test found that there was a
statistically significant difference in anxiety levels between group of participants, who do
cardiovascular exercise (M=5.46, SD=6.43) and participants, who do not do cardiovascular
exercise (M=9.13, SD=10.16) (t(102)=2.26, p=.026, CI (95%) .45 -> 6.87). Cardiovascular
exercise variable will be entered in multiple regression analysis as one of the key predictors
of influence on anxiety.

33
Table 7 Table illustrating the results of Independent Sample T test in relation to differences
between participants, who do cardiovascular and strength exercise and those who do either
cardiovascular or strength exercise, on well being measures.
95% Confidence Interval
of the Difference
Well being
measure t df p Lower Upper
Happiness -.19 94 .849 -.97 .79
Life
satisfaction -.67 91 .503 -3.76 1.86
GHQ .64 93 .523 -1.73 3.38
Stress 1.27 93 .206 -1.68 7.68
Anxiety 2.09 76 .040 .15 6.25
Depression 1.98 67 .051 -.02 7.47
As illustrated in Table 7, an independent samples T-test found that there was a
statistically significant difference in anxiety levels between group of participants, who do
both types: cardiovascular and strength exercise (M=4.77, SD=5.37) and participants, who do
either cardiovascular or strength exercise (M=7.97, SD=9.23) (t(76)=2.09, p=.040, CI (95%)
.15 -> 6.25). Cardiovascular and strength exercise variable will be entered in multiple
regression analysis as one of the key predictors of influence on anxiety.
34
In order to evaluate the main hypothesis the regression analysis was carried out
and statistically significant variables determined in result of T tests and correlation analyses
were entered in to the regression blocks, to examine the amount of variance these variables
have in influencing psychological well being. The variables with the lowest Beta values were
removed, the regression analysis was repeated and the most parsimonious model was
determined. In the most parsimonious model Adjusted R square approximated the R square
and explained the greatest amount of variance. The assumptions for all the regression
analyses were checked. Normally distributed residual scores were not related to predictor
variables. Mahalanobis distance values showed that there was no substantial outliers.
Tolerance values did not exceed .2 and VIF values were not above 10 therefore there was no
multicollinearity. The criterion variable was always continuous. The assumptions for all the
regressions were confirmed.

35
Table 8 Table illustrating multiple regression model with happiness.
Unstandardised
Coefficients
Standardised
Coefficient
B Std. Error Beta t Sig
(Constant) 1.09 1.06 1.02 .307
Weekly
exercise .11 .07 .15 1.68 .097
Optimism .10 .04 .27 2.34 .022
Self
efficacy .02 .03 .07 .62 .536
Gym
support .09 .05 .16 1.72 .089
Family
support .19 .07 .25 2.78 .007
Dependent Variable: Happiness
R squared = .309, Adjusted R squared = .273
Table 8 above illustrates regression model with happiness where predictors such as
family support, optimism, gym support, weekly exercise and self efficacy explained 27.3% of
the variance in happiness scores (R2 =.27, F(5,94)=8.42, P<.001) . As family support,
optimism, gym support, weekly exercise and self efficacy increased the happiness scores
also increased.

36
Table 9 Table illustrating multiple regression model with anxiety.
Unstandardised
Coefficients
Standardised
Coefficient
B Std. Error Beta t Sig
(Constant) 28.37 5.62 5.05 .000
Cardio -1.44 2.43 -.08 -.59 .555
Cardio and
Strength -1.15 2.68 -.06 -.43 .669
Optimism -.48 .18 -.28 -2.71 .008
Family
support -.44 .35 -.13 -1.28 .205
Dependent Variable: Anxiety
R squared = .147, Adjusted R squared = .108
Table 9 above illustrates the final regression model with anxiety, explained 10.8 % of
the variance in its scores (R2=.11, F (4,86)=3.72, p=.008). As the table shows, optimism,
family support and cardio exercise accounted for the most variance in anxiety. As optimism
and family support increased the lower were the reported anxiety scores. Lower anxiety
scores were also present among people doing cardio exercise and those, who did combination
of cardio and strength exercise as oppose to doing only one type of exercise.

37
Table 10 Table illustrating multiple regression model with stress.
Unstandardised
Coefficients
Standardised
Coefficient
B Std. Error Beta t Sig
(Constant) 41.97 5.87 7.15 .000
Optimism -.81 .19 -.39 -4.29 .000
Family
support -.53 .39 -.12 -1.35 .179
Dependent Variable: Stress
R squared = .193, Adjusted R squared = .177
Table 10 above, illustrates the final regression model with stress. The result of this
regression indicates that optimism and family support explained 17.7 % of the variance in
stress scores (R2=.187, F (2,99) =11.85, p<.001). As the table shows optimism accounted for
the most variance in stress. As optimism and family support increased the lower were the
reported stress scores.

38
Table 11 Table illustrating multiple regression model with depression.
Unstandardised
Coefficients
Standardised
Coefficient
B Std. Error Beta t Sig
(Constant) 46.44 4.79 9.69 .000
Optimism -1.10 .15 -.57 -7.11 .000
Family
support -.75 .32 -.19 -2.37 .020
Dependent Variable: Depression
R squared = .401, Adjusted R squared = .388
Table 11 above, illustrates the final regression model with depression. The result of
this regression indicates that optimism and family support explained 38.8 % of the variance
in depression scores (R2=.39, F (2,99) =33.07, p<.001). As the table shows optimism
accounted for the most variance in depression. As optimism and family support increased the
lower were the reported depression scores.
39
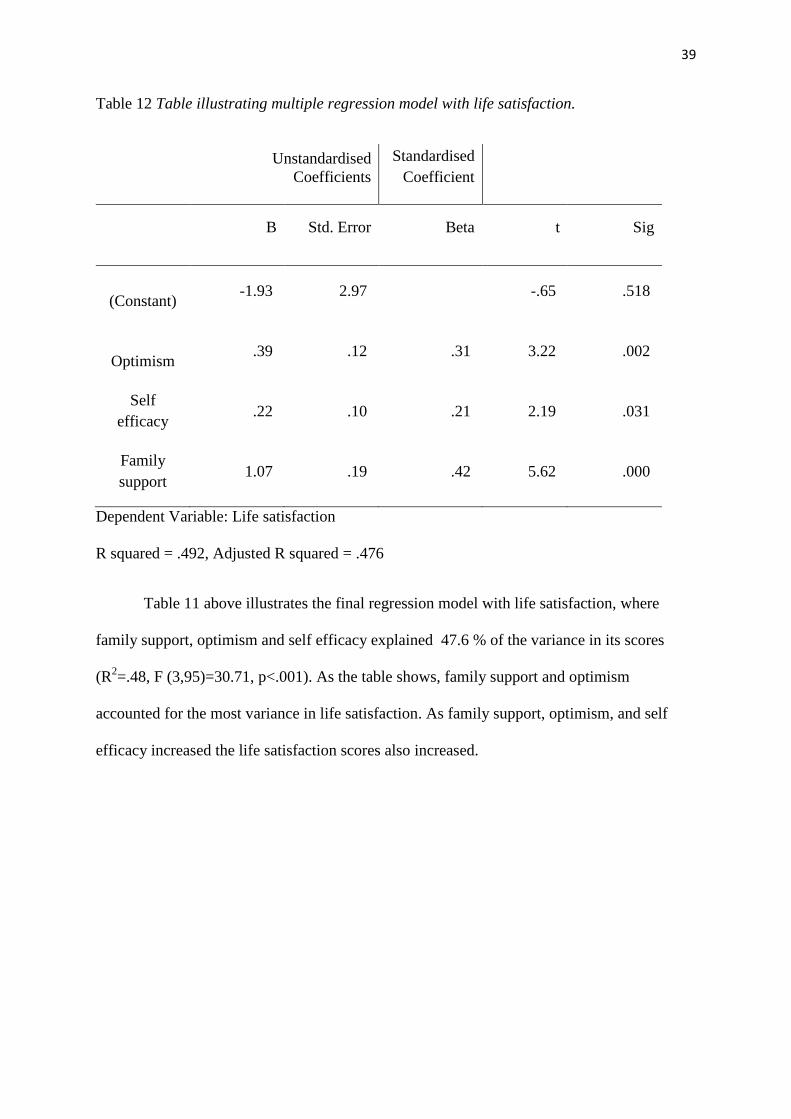
Table 12 Table illustrating multiple regression model with life satisfaction.
Unstandardised
Coefficients
Standardised
Coefficient
B Std. Error Beta t Sig
(Constant) -1.93 2.97 -.65 .518
Optimism .39 .12 .31 3.22 .002
Self
efficacy .22 .10 .21 2.19 .031
Family
support 1.07 .19 .42 5.62 .000
Dependent Variable: Life satisfaction
R squared = .492, Adjusted R squared = .476
Table 11 above illustrates the final regression model with life satisfaction, where
family support, optimism and self efficacy explained 47.6 % of the variance in its scores
(R2=.48, F (3,95)=30.71, p<.001). As the table shows, family support and optimism
accounted for the most variance in life satisfaction. As family support, optimism, and self
efficacy increased the life satisfaction scores also increased.
40
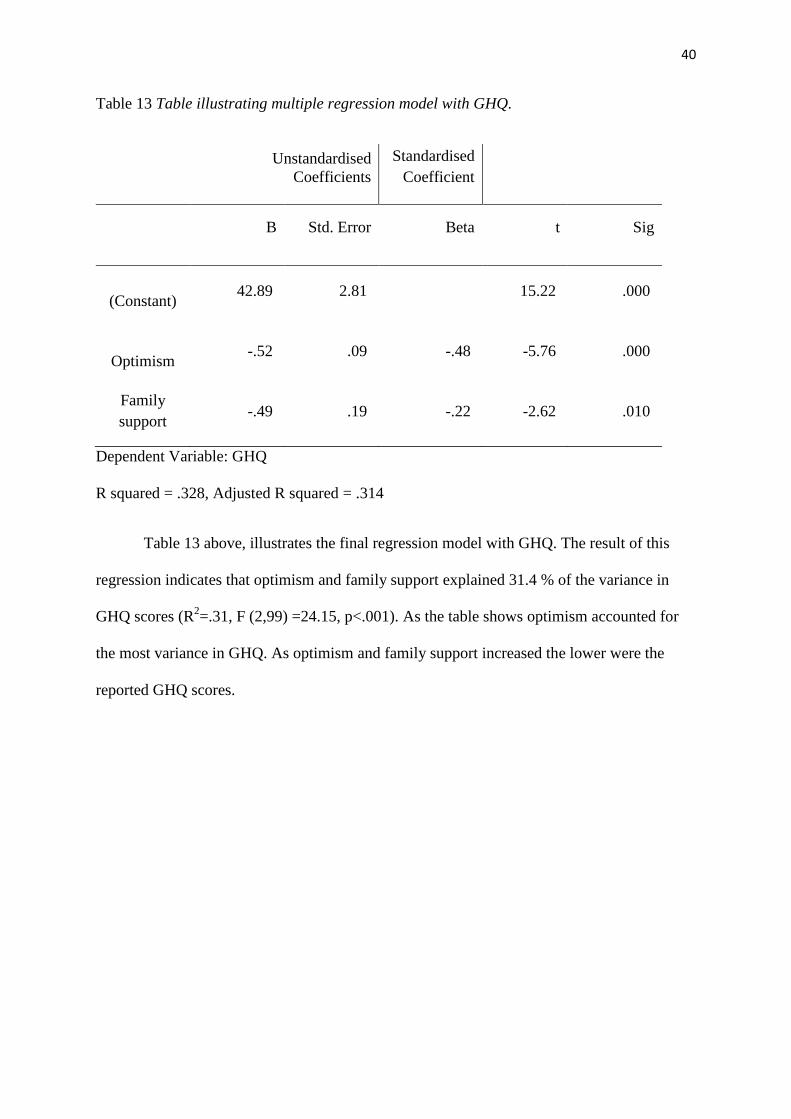
Table 13 Table illustrating multiple regression model with GHQ.
Unstandardised
Coefficients
Standardised
Coefficient
B Std. Error Beta t Sig
(Constant) 42.89 2.81 15.22 .000
Optimism -.52 .09 -.48 -5.76 .000
Family
support -.49 .19 -.22 -2.62 .010
Dependent Variable: GHQ
R squared = .328, Adjusted R squared = .314
Table 13 above, illustrates the final regression model with GHQ. The result of this
regression indicates that optimism and family support explained 31.4 % of the variance in
GHQ scores (R2=.31, F (2,99) =24.15, p<.001). As the table shows optimism accounted for
the most variance in GHQ. As optimism and family support increased the lower were the
reported GHQ scores.
41
Discussion.
The purpose of this study was to examine the influence of coping behaviours and
exercise on well-being. In addition, present study was expected to filter out the coping
behaviours, which could have the biggest contribution in mental health promotion and mental
ill health prevention. There were five sub-hypotheses, which addressed various coping
behaviours and the associations with well-being measures.
In relation to the first hypothesis, current study provided evidence that frequency of
exercise has significant positive correlation with happiness, however there was no correlation
between weekly exercise and stress, anxiety, depression or life satisfaction. This relationship
with happiness was found in accordance with Lathia’s et al., (2017) study and it can be
concluded that the higher the frequency of exercise the higher the level of happiness. The
happiness regression model in the current study showed that weekly exercise was present as
one of the predictors of happiness. The lack of relationship between weekly exercise and
anxiety and depression did not support conclusions of Tyson et al., (2016) study on dose-
response relationship between those variables. The absence of relationship between weekly
exercise and stress also did not support Hammer et al., (2009) study, where the negative
correlation between those variables was found to be very strong.
In case of the second hypothesis, current study provided evidence that participants
doing cardiovascular exercise had different levels of anxiety in comparison to those, who did
not do cardiovascular exercise. This result was in accordance with Salmon’s (2010) statement
on importance of cardiovascular exercise in lowering anxiety levels. The anxiety regression
model, in the present study, revealed negative relationship between cardiovascular exercise
and anxiety, as well as showed that cardiovascular exercise was one of the negative
predictors of anxiety. However the differences in levels of stress and depression between the

42
participants, who did and did not do cardiovascular exercise were present, they were not
significant as the T test determined therefore this finding did not support Salmon’s (2010)
unifying theory that exercise has antidepressant and stress-reducing effects. This study also
did not provide any evidence on differences in happiness or life satisfaction between
cardiovascular and non cardiovascular group.
In case of third hypothesis, current study provided evidence that participants doing
both types of exercise (cardiovascular and strength) had different levels of anxiety in
comparison to those, who did only one type of exercise. This result was in accordance with
findings of Strickland et al., (2014), and confirmed the statement, that combining both types
of exercise can have a significant effect on lowering anxiety levels. According to Strickland
et al., (2014) during the exercise intervention, the use of cardiovascular (aerobic) exercise on
its own failed, but when combined with strength exercise, the intervention produced
significantly lower anxiety levels. The anxiety regression model, in the present study,
revealed negative relationship between doing both types of exercise and anxiety, as well as
showed that combining both types of exercise was one of the negative predictors of anxiety.
However, the differences in levels of stress and depression between the participants, who
combined two types of exercise and those, who only did either cardiovascular or strength
exercise were present, they were not significant. Current study also did not provide evidence
to differences in happiness or life satisfaction between the participants combining both types
of training and those, who did only one type of exercise, however there is a growing body of
research that confirms the association between exercise and well-being (Sharma, Madaan
and Petty, 2005; Aidar et al., 2014) and exercise should not be dismissed as an influencing
factor on mental health .
43
It can be concluded that in relation to physical activity as behaviour influencing well-
being, the most effective way to improve mental health through exercise may be to combine
cardiovascular and strength exercise to provide greater exposure to a wider range of benefits.
In relation to the fourth hypothesis, current study provided evidence to the very strong
relationship between family support and well-being measures. Findings of this study were in
accordance with finding of Ozbay et al., (2007) on strong negative relationship between
stress and social support, and Roohafza et al., (2014) study on strong negative relationship
between anxiety, depression and social support. Family support, friends support and gym
support had significant correlation with happiness. This result was with accordance to the
study by Liping (2001), who concluded that interpersonal support, which includes spouse,
partner, friends, neighbours or colleagues, was significant predictor of happiness. Regression
models for all the outcome measures showed strong predicting value of family support.
In relation to control, current study provided evidence that there is significant
positive correlation between control and happiness and control and life satisfaction and this
finding is in accordance with Amoura et al., (2014) statement, that the higher the perception
of control the better the mental state of an individual. Current study, however did not
confirm findings of Sherman’s et al., (2012) study on negative correlation between stress and
control levels.
In case of the fifth hypothesis, current study provided evidence to the statement that
there will be a correlation between well-being measures and optimism, and between well-
being measures and self-efficacy. In relation to the optimism and outcome measures,
happiness and life satisfaction had strong positive correlation with optimism, and this finding
was in accordance with findings of Kiyanzad et al., (2016). Furthermore very strong negative
correlation was established between optimism and adverse indicators of well-being: stress,

44
anxiety and depression, what was in accordance with findings of Rajandram et al., (2011) and
Kepka et al., (2013). The regression models for all the outcome measures showed strong
predicting value of optimism.
Present study found very strong correlation between self-efficacy and all outcome
measures. A positive correlation was established between happiness and self-efficacy as well
as between life satisfaction and self-efficacy, which confirmed findings of Erozuman et al.,
(2016). Negative correlation was found between self-efficacy and adverse indicators of well-
being: stress, anxiety and depression, these findings were in accordance with study results of
Tahmassian et al., (2011) and Conner (2015).
The results of multiple regressions had shown, which coping behaviours were the key
influence variables in predicting single outcome measure.
Predictors of the well-being measures (happiness and life satisfaction).
The regression model with happiness, had shown that optimism, family support, gym support,
weekly exercise and self efficacy explained 27.3% of variance in happiness scores, however
the two key variables, which accounted for most variance were optimism and family support.
In case of regression model with life satisfaction, family support, optimism and self-efficacy
explained 47.6% of variance in life satisfaction scores, however similarly to happiness,
family support and optimism accounted for most variance. The same variables accounting for
the most variance in both measures, could be explained by close relationship between
happiness and life satisfaction, where it is important to note that life satisfaction, can be
considered as a cognitive aspect of happiness (Erouzabi et al., 2016).
45
Predictors of the adverse indicators of well-being measures.
The regression model with stress, had shown, that optimism and family support explained
17.7% variance, however optimism accounted for the most variance in stress scores. The
regression model with GHQ had shown the same variables explaining 31.4% of the variance,
with optimism accounting for the most variance. The regression model with anxiety, had
shown that optimism accounted for the most variance and along with family support,
cardiovascular exercise and combined cardiovascular/strength exercise, these variables
explained 10.8% of the variance in anxiety scores. The regression model with depression had
shown that optimism and family support explained 38.8% of variance in depression scores,
however optimism accounted for the most variance.
The key predictor variable, which had accounted for the most variance in all the
examined well-being measures, was optimism. Previous research examining optimism and
stress coping mechanisms, had found optimisms to be associated with problem-focused
coping strategies (Strutton and Lumpkin, 1992). Furthermore, previous research had also
provided an evidence that problem-focused coping strategies are more effective than
emotion-focused coping strategies (Tunkay, Musabak, Gok and Kutlu, 2008). Thompson et
al., (2010), stated that problem-focused coping is considered to be an adaptive coping and
adaptive coping as oppose to maladaptive coping has more beneficial effects on mental
health. Therefore, it can be concluded that optimism, as a coping behaviour, positively
influences mental health. Optimism, however is also a personality trait, but research on
personality provided evidence to the statement that personality is dynamic, flexible and it
undergoes changes over the life span, which are shaped by experience (Dweck, 2008).
Furthermore, Seligman (2011), put forward Learned Optimism theory, which states that
optimistic viewpoint can be cultivated by an individual, and everyone can learn the technique
of recognising and disputing negative thoughts (Seligman, 2011). In the light of the
46
aforementioned research it can be concluded that optimism could be effectively used in
mental health promotion and mental ill health prevention, as according to Seligman (2011),
optimism can be elevated.
Coping as a secondary appraisal (Folkman et al., 1986), relates to the question of:
what can be done? or how the stress can be managed? Providing answers to these questions
involves judgement of the extent of control over the situation that individual can gain, and
self-efficacy contributes to this judgment, what in turn effects coping (Chesney et al., 2006).
Self-efficacy in the current study was only present as a predictor in the most parsimonious
model with happiness, nevertheless it was significantly correlated with all of the outcome
measures. Chesney et al., (2006) in the study on Coping Self Efficacy scale, identified three
factors, that had significant influence in changing coping styles: using problem-focused
coping, rejecting any unpleasant emotions and reaching out to friends and family. Chesney's
et al., (2006) study provided evidence to the link between problem-focused coping and social
support, which was the second strongest predictor of the well-being across all the well-being
measures in the current study.
Present study provided evidence, to a strong predicting relationship between optimism
and well-being, and optimism and adverse indicators of well-being. If, the well-being or
mental health measures were to be presented on a spectrum, happiness would be on the one
end and depression would be on the opposite end of the spectrum. A link established between
both ends of the spectrum, was presented in the current study in the form of coping
behaviours, which are closely related to stress. Furthermore, a mounting body of evidence
suggests that the outcome measures from the opposite ends of well-being spectrum:
happiness and depression are also associated with stress. Shiffrin and Nelson (2010) in the
study investigating relationship between stress and happiness, concluded that there is a strong
negative correlation between these two variables. Orzechowska, Zajaczkowska, Talarowska

47
and Galecki (2013) in the study investigating depression and coping with stress, stated that
the effect of stress on depression, triggers subsequent phases of the disease. Interestingly the
same study concluded that individuals suffering from depression use emotion-focused coping
techniques, which were found to be ineffective (Orzechowska et al., 2013). Taking into
consideration results of the current study, and complex interconnections between all the
predictor and criterion variables, it can be concluded that all of the predicting variables had
influence on some, or on all of the outcome measures. Therefore, in the light of the
aforementioned studies, the concept of coping behaviours can be referred to all the items on
the well-being spectrum.
Implications
Taking into consideration increasing costs of health care across all the European countries
including Ireland (OECD.org), prevention and promotion of health would seem to be a good
pro active approach to address the issue (Min et al., 2013). Present study identified factors
influencing whole spectrum of well-being, with two top variables accounting for most of the
variance in all of the outcome measures (optimism and family support). It would be crucial
for mental health promotion and ill mental health prevention campaign to use these two
factors and focus on emphasising their importance in daily lives of people. However, taking
into consideration mounting body of evidence for the role of exercise as coping behaviour
(Hammer et al., 2006) as well as use of exercise in prevention and treatment of psychological
disorders (Dubbert, (2002), Goodwin (2003), (Tyson et al., 2010), Salmon (2001)), even though
current study only found frequency of exercise as one of the predictors of happiness and
cardiovascular exercise as one of the predictors of anxiety, it would be crucial for the mental
health campaign to include the exercise as one of the influencing factors. Suggestion to

48
include exercise into the health campaign has foundations in the Biopsychosocial Model
proposed by George Engel in 1970’s (Hatala, 2012), where three important domains were
mentioned in order to better understand health and illness. Biological factor of the model
relates to the genetic makeup of the individual, however, it is important to note that
contemporary research provided evidence to effect of exercise on gene expression (Rodrigues
et al., 2015). Rodrigues et al., (2015) in the study on rats, had found that exercise has
potential to modulate changes in DNA methylation and gene expression, in consequence to
stress treatment. Another words, the damaging effects of stress on the brain cells can be
reversed through exercise. Psychological domain of the model relates to behaviour and
emotions, and influential role of optimism, as the present study established, would fit within
this area. Social domain of the model represents social context, and influential role of family
support, also established by the present study, would fit within this area.
Strengths
One of the strengths of the study is the wide range of coping behaviours used along with five
well-being measures. With complexity of mental health in mind, this study managed to find
the common predictor for adverse indicators of well being and endorsing indicators of well-
being and draw conclusions, which may impact on mental health promotion and prevention
of mental illness.
Limitations
The limitation of the study is sample size, as in relation to number of measured variables the
expected ratio should be forty participants per variable. The sample type is also considered
as a limitation as the sample is dominated mainly by regularly exercising adults.

49
Conclusions
Present study examined the influence of the various coping behaviours on well-being and
concluded that all the coping behaviours : exercise, support, control, optimism and self-
efficacy had association with some or all of the well-being measures. However, only two
coping behaviours were determined as predictors for ALL the examined adverse and
endorsing well-being measures. The two described variables are: optimism and family
support, but only optimism accounted for the most variance in the well-being scores. This
evidence, could have serious implication in mental health promotion and prevention of
mental illness.
Solutions to complex mental problems do not have to be necessarily complex
themselves, and sometimes simple interventions of increasing the awareness in relation to
importance of optimism and family or social support, in people's lives, may bring unexpected
results, and as quoted by Albert Einstein: "Everything should be made as simple as possible
but not simpler" (Sessions, 1950).
Future research
It is recommended, that the future research conducts a study to examine the influence of
coping behaviours on well-being, with bigger general population sample. It is also
recommended that experimental approach should be used in assessing the impact of exercise
intervention, also the optimism intervention can be design to build upon the results of this
study to examine how optimism levels can change with use of Seligman's Learn Optimism
theory (Seligman, 2011).

50
References
Abdel-Khalek, A. M. (2006). Measuring happiness with a single-item scale. Social Behavior
and Personality: an international journal, 34(2), 139-150.
Aidar, F. J., Gama de Matos, D., Jacó de Oliveira, R., Carneiro, A. L., Tinôco Cabral, B. G.
D. A., Moreira Silva Dantas, P., & Machado Reis, V. (2014). Relationship between
depression and strength training in survivors of the ischemic stroke. Journal of human
kinetics, 43(1), 7-15.
Amoura, C., Berjot, S., Gillet, N., & Altintas, E. (2014). Desire for control, perception of
control: their impact on autonomous motivation and psychological adjustment. Motivation
and Emotion, 38(3), 323-335.
Bandura, A. (1998). Health promotion from the perspective of social cognitive
theory. Psychology and health, 13(4), 623-649.
Baron R. A. Braanscombe N.R. Social Psychology. 13th
ed . United States of America.
Pearson education. 2012.
Bouayed, J., Rammal, H., & Soulimani, R. (2009). Oxidative stress and anxiety: relationship
and cellular pathways. Oxidative Medicine and Cellular Longevity, 2(2), 63-67.
Boyce, W. T., & Ellis, B. J. (2005). Biological sensitivity to context: I. An evolutionary–
developmental theory of the origins and functions of stress reactivity. Development and
psychopathology, 17(02), 271-301.
Chesney, M. A., Neilands, T. B., Chambers, D. B., Taylor, J. M., & Folkman, S. (2006). A
validity and reliability study of the coping self‐efficacy scale. British journal of health
psychology, 11(3), 421-437.
51
Cohn, M. A., Fredrickson, B. L., Brown, S. L., Mikels, J. A., & Conway, A. M. (2009).
Happiness unpacked: positive emotions increase life satisfaction by building
resilience. Emotion, 9(3), 361.
Conner, M. (2015). Self-efficacy, stress, and social support in retention of student registered
nurse anaesthetists. AANA journal, 83(2).
Conversano, C., Rotondo, A., Lensi, E., Della Vista, O., Arpone, F., & Reda, M. A. (2010).
Optimism and its impact on mental and physical well-being. Clinical Practice &
Epidemiology in Mental Health, 6(1).
Department of health website: http://health.gov.ie/publications-research/statistics/statistics-
by-topic/health-expenditure/
Diener, E. D., Emmons, R. A., Larsen, R. J., & Griffin, S. (1985). The satisfaction with life
scale. Journal of personality assessment, 49(1), 71-75.
Dolan, P., Peasgood, T. & White, M., 2008, Do we really know what makes us happy A
review of the economic literature on the factors associated with subjective well-being,
Journal of Economic Psychology, 29(1), pp. 94-122.
Dubbert, P. M. (2002). Physical activity and exercise: Recent advances and current
challenges. Journal of Consulting and Clinical Psychology, 70(3), 526.9-92.
Dweck, C. S. (2008). Can personality be changed? The role of beliefs in personality and
change. Current directions in psychological science, 17(6), 391-394.
Erozkan, A., Dogan, U., & Adiguzel, A. (2016). Self-efficacy, Self-esteem, and Subjective
Happiness of Teacher Candidates at the Pedagogical Formation Certificate Program. Journal
of Education and Training Studies, 4(8), 72-82.
52
Folkman, S., Lazarus, R. S., Dunkel-Schetter, C., DeLongis, A., & Gruen, R. J. (1986).
Dynamics of a stressful encounter: cognitive appraisal, coping, and encounter
outcomes. Journal of personality and social psychology, 50(5), 992.
Gibbons, C. (2008). Measuring Stress and Eustress in Nursing Students (Doctoral
dissertation, Queen's University Belfast).
Gibbons, C., Dempster, M., & Moutray, M. (2009). Index of sources of stress in nursing
students: a confirmatory factor analysis. Journal of Advanced Nursing, 65(5), 1095-1102.
Goldberg, D., Williams, P., & Williams, P. (1988). A user's guide to the General Health
Questionnaire. NFER Nelson Publishing.
Gerber, M., & Pühse, U. (2009). Review article: do exercise and fitness protect against stress-
induced health complaints? A review of the literature. Scandinavian journal of public
health, 37(8), 801-819.
Goodwin, R. D. (2003). Association between physical activity and mental disorders among
adults in the United States. Preventive medicine, 36(6), 698-703.
Grant, F., Guille, C., & Sen, S. (2013). Well-being and the risk of depression under
stress. PloS one, 8(7), e67395.
Hamer, M., Taylor, A., & Steptoe, A. (2006). The effect of acute aerobic exercise on stress
related blood pressure responses: a systematic review and meta-analysis. Biological
psychology, 71(2), 183-190.
Hamer, M., Stamatakis, E., & Steptoe, A. (2009). Dose-response relationship between
physical activity and mental health: the Scottish Health Survey. British journal of sports
medicine, 43(14), 1111-1114.

53
Hatala, A. R. (2012). The status of the “biopsychosocial” model in health psychology:
Towards an integrated approach and a critique of cultural conceptions. Open Journal of
Medical Psychology, 2012, 1, 51-62. dx.doi.org/10.4236/ojmp.2012.14009.
Jackson, C. (2007). The general health questionnaire. Occupational medicine, 57(1), 79-79.
Jerusalem, M., & Schwarzer, R. (1992). Self-efficacy as a resource factor in stress appraisal
processes. Self-efficacy: Thought control of action, 195213.
Kepka, S., Baumann, C., Anota, A., Buron, G., Spitz, E., Auquier, P., ... & Mercier, M.
(2013). The relationship between traits optimism and anxiety and health-related quality of life
in patients hospitalized for chronic diseases: data from the SATISQOL study. Health and
quality of life outcomes, 11(1), 134.
Kesebir, P., & Diener, E. (2008). In pursuit of happiness: Empirical answers to philosophical
questions. Perspectives on psychological science, 3(2), 117-125.
Kiyanzad, S., Kajbaf, M.B., & Phayazi, M., (2015). Examine The Relationship Between
Happiness And Life Orientation (Optimism And Pessimism) Students Of Faculty Of
Psychology, University Of Isfahan. Indian Journal of Fundamental and Applied Life
Sciences, 6 (S1), 290-297.
Krohne, H. W. (2001). Stress and coping theories. The international encyclopedia of the
social and behavioural sciences, 22, 15163-15170.
Lathia, N., Sandstrom, G. M., Mascolo, C., & Rentfrow, P. J. (2017). Happier People Live
More Active Lives: Using Smartphones to Link Happiness and Physical Activity. PLoS
One, 12(1), e0160589.
54
Lazarus, R. S., & Folkman, S. (1984). Stress, appraisal, and coping. Springer publishing
company.
Liping, X. Z. C. (2001). THE RELATIONSHIP BETWEEN HAPPINESS AND SOCIAL
SUPPORT [J]. Journal of Chinese Psychology Acta Psychologica Sinica, 5, 009.
Lovibond, P. F., & Lovibond, S. H. (1995). The structure of negative emotional states:
Comparison of the Depression Anxiety Stress Scales (DASS) with the Beck Depression and
Anxiety Inventories. Behaviour research and therapy, 33(3), 335-343.
Lupien, S. J., Maheu, F., Tu, M., Fiocco, A., & Schramek, T. E. (2007). The effects of stress
and stress hormones on human cognition: Implications for the field of brain and
cognition. Brain and cognition, 65(3), 209-237.
Magalhaes, A. C., Holmes, K. D., Dale, L. B., Comps-Agrar, L., Lee, D., Yadav, P. N., ... &
Anisman, H. (2010). CRF receptor 1 regulates anxiety behaviour via sensitization of 5-HT2
receptor signaling. Nature neuroscience, 13(5), 622-629.
Mason, J. W. (1971). A re-evaluation of the concept of ‘non-specificity’ in stress
theory. Journal of Psychiatric research, 8, 323-333.
Maher, J. P., Pincus, A. L., Ram, N., & Conroy, D. E. (2015). Daily Physical Activity and
Life Satisfaction across Adulthood. Developmental Psychology, 51(10), 1407–1419.
doi.org/10.1037/dev0000037
Min, J. A., Lee, C. U., & Lee, C. (2013). Mental health promotion and illness prevention: a
challenge for psychiatrists. Psychiatry investigation, 10(4), 307-316.
Orzechowska, A., Zajączkowska, M., Talarowska, M., & Gałecki, P. (2013). Depression and
ways of coping with stress: A preliminary study. Medical Science Monitor, 19, 1050-1056.

55
Ozbay, F., Fitterling, H., Charney, D., & Southwick, S. (2008). Social support and resilience
to stress across the life span: a neurobiologic framework. Current psychiatry reports, 10(4),
304-310.
Park, C. L., & Iacocca, M. O. (2014). A stress and coping perspective on health behaviors:
theoretical and methodological considerations. Anxiety, Stress & Coping, 27(2), 123-137.
Pavey, T. G., Burton, N. W., & Brown, W. J. (2015). Prospective relationships between
physical activity and optimism in young and mid-aged women. Journal of Physical Activity
and Health, 12(7), 915-923.
Pavot, W., & Diener, E. (1993). Review of the satisfaction with life scale. Psychological
assessment, 5(2), 164.
Peterson, C., & Seligman, M. E. (2004). Character strengths and virtues: A handbook and
classification (Vol. 1). Oxford University Press.
Pettit, J. W., Kline, J. P., Gencoz, T., Gencoz, F., & Joiner, T. E. (2001). Are happy people
healthier? The specific role of positive affect in predicting self-reported health
symptoms. Journal of Research in Personality, 35(4), 521-536.
Puterman, E., Lin, J., Blackburn, E., O'Donovan, A., Adler, N., & Epel, E. (2010). The power
of exercise: buffering the effect of chronic stress on telomere length. PLoS One, 5(5), e10837.
Rajandram, R. K., Ho, S. M., Samman, N., Chan, N., McGrath, C., & Zwahlen, R. A. (2011).
Interaction of hope and optimism with anxiety and depression in a specific group of cancer
survivors: a preliminary study. BMC research notes, 4(1), 519.
Rawson, H. E., Bloomer, K., & Kendall, A. (1994). Stress, anxiety, depression, and physical
illness in college students. The Journal of Genetic Psychology, 155(3), 321-330.
56
Rodrigues, G. M., Toffoli, L. V., Manfredo, M. H., Francis-Oliveira, J., Silva, A. S., Raquel,
H. A., ... & Gomes, M. V. (2015). Acute stress affects the global DNA methylation profile in
rat brain: modulation by physical exercise. Behavioural brain research, 279, 123-128.
Roohafza, H., Afshar, H., Keshteli, A. H., Mohammadi, N., Feizi, A., Taslimi, M., & Adibi,
P. (2014). The association of perceived social support and coping styles With depression and
anxiety. Journal of Research in Medical Sciences, 19(10).
Ruch, W., Proyer, R. T., Harzer, C., Park, N., Peterson, C., & Seligman, M. E. (2010). Values
in action inventory of strengths (VIA-IS): adaptation and validation of the German version
and the development of a peer-rating form. Journal of individual differences, 31(3), 138.
Salmon, P. (2001). Effects of physical exercise on anxiety, depression, and sensitivity to
stress: a unifying theory. Clinical psychology review, 21(1), 33-61.
Sam, A. T., Muttusamy, B., Yee, S. M., Ayapanaido, T., & Parasuraman, S. (2016).
Investigation of Stressors Affecting a sample of Pharmacy Students and the Coping Strategies
Employed using Modified Academic Stressors Scale and Brief Cope Scale: a Prospective
Study. Journal of Young Pharmacists, 8(2), 122.
Seligman, M. E. (2011). Learned optimism: How to change your mind and your life. Vintage.
Schwarzer, R., Bäßler, J., Kwiatek, P., Schröder, K., & Zhang, J. X. (1997). The assessment
of optimistic self‐beliefs: comparison of the German, Spanish, and Chinese versions of the
general self‐efficacy scale. Applied Psychology, 46(1), 69-88.
Stroud, C. B., Davila, J., & Moyer, A. (2008). The relationship between stress and depression
in first onsets versus recurrences: a meta-analytic review. Journal of abnormal
psychology, 117(1), 206.

57
Szabo, S., Tache, Y., & Somogyi, A. (2012). The legacy of Hans Selye and the origins of
stress research: a retrospective 75 years after his landmark brief “letter” to the editor# of
nature. Stress, 15(5), 472-478.
Shankar, P. R., Balasubramanium, R., Ramireddy, R., Diamante, P., Barton, B., & Dwivedi,
N. R. (2014). Stress and coping strategies among premedical and undergraduate basic science
medical students in a Caribbean medical school. Education in Medicine Journal, 6(4).
Sharma, A., Madaan, V., & Petty, F. D. (2005). Exercise for mental health. Primary care
companion to the Journal of clinical psychiatry, 8(2), 106-106.
Sherman, G. D., Lee, J. J., Cuddy, A. J., Renshon, J., Oveis, C., Gross, J. J., & Lerner, J. S.
(2012). Leadership is associated with lower levels of stress. Proceedings of the National
Academy of Sciences, 109(44), 17903-17907.
Sessions, R. (1950). How a “difficult” composer gets that way. New York Times, 89.
Schiffrin, H. H., & Nelson, S. K. (2010). Stressed and happy? Investigating the relationship
between happiness and perceived stress. Journal of Happiness Studies, 11(1), 33-39.
Strickland, J. C., & Smith, M. A. (2014). The anxiolytic effects of resistance
exercise. Frontiers in psychology, 5, 753.
Strutton, D., & Lumpkin, J. (1992). Relationship between optimism and coping strategies in
the work environment. Psychological Reports, 71(3), 1179-1186.
Tahmassian, K., & Jalali Moghadam, N. (2011). Relationship between self-efficacy and
symptoms of anxiety, depression, worry and social avoidance in a normal sample of
students. Iranian journal of psychiatry and behavioral sciences, 5(2), 91-98.

58
Taylor, C. B., Sallis, J. F., & Needle, R. (1985). The relation of physical activity and exercise
to mental health. Public health reports, 100(2), 195.
Thompson, R. J., Mata, J., Jaeggi, S. M., Buschkuehl, M., Jonides, J., & Gotlib, I. H. (2010).
Maladaptive coping, adaptive coping, and depressive symptoms: Variations across age and
depressive state. Behaviour research and therapy, 48(6), 459-466.
Tran, T. D., Tran, T., & Fisher, J. (2013). Validation of the depression anxiety stress scales
(DASS) 21 as a screening instrument for depression and anxiety in a rural community-based
cohort of northern Vietnamese women. BMC psychiatry, 13(1), 24.
Tuncay, T., Musabak, I., Gok, D. E., & Kutlu, M. (2008). The relationship between anxiety,
coping strategies and characteristics of patients with diabetes. Health and quality of life
outcomes, 6(1), 79.
Tyson, P., Wilson, K., Crone, D., Brailsford, R., & Laws, K. (2010). Physical activity and
mental health in a student population. Journal of mental health,19(6), 492-499.
Vaida, L., Todor, B. I., Bertossi, D., & Corega, C. (2015). Correlations between Stress,
Anxiety and Coping Mechanisms in Orthodontic Patients. Iranian journal of public
health, 44(1), 147.
Walsh, R. (2011). Lifestyle and mental health. American Psychologist, 66(7), 579.
WHO. Retrieved from website: http://www.who.int/mediacentre/factsheets/fs317/en/
WHO Mental Health Action Plan 2013-2020. Retrieved from website:
http://apps.who.int/iris/bitstream/10665/89966/1/9789241506021_eng.pdf?ua=1

59
World Health Organization. (2012). Measurement of and target-setting for well-being: an
initiative by the WHO Regional Office for Europe. Retrieved from website:
http://www.euro.who.int/__data/assets/pdf_file/0009/181449/e96732.pdf
OECD. Retrieved from website:
http://www.oecd.org/health/healthcarecostsunsustainableinadvancedeconomieswithoutreform
.htm

60
Appendices
61
Participant information sheet.
Study on : Stress, Coping Mechanisms and Life Satisfaction
My name is Sylwia Majszyk. I am a final year student in Dublin Business School and I'm conducting
research that explores stress, coping mechanisms and mental health awareness among adults, as
part of my thesis in the Department of Psychology.
You are invited to take part in this study and your participation involves completing this anonymous
survey. This survey has been used widely in the research however some questions might cause some
minor negative feelings. If this occurs - contact information for support services are included below.
Participation is completely voluntary and so you are not obliged to take part.
Participation is anonymous and confidential - responses cannot be attributed to any one participant.
For this reason, it will not be possible to withdraw from participation after you have submitted your
survey.
It is important that you understand that you are consenting to participate in the study by completing
and submitting the questionnaire.
Please note that this research will be submitted for examination and presented in class in a group
setting, all data will be disseminated one year after the exam .
Should you require any further information about the research or have interest in the results of the
study please contact me on [email protected].
Thank you in advance for taking the time to complete this survey.
*Required:
If you consent to participate in this research please provide your signature below:
Signed : _____________________________ Date: ________________

62
Please keep one copy of this information sheet for yourself, and return signed copy
separately in the provided small self sealed envelope. Your answers to research
questions, can be returned in the brown self sealed envelope. There is a different
'letter box' for both of those envelopes in the Gym/Studio.
I would appreciate if you could also take one copy set of this survey and give it to
the person you know, who is not a member of the gym/studio and ask on my behalf
if they could kindly fill it out , put it in a sealed envelope and return.
Contact Details Sheet
If you feel that answering this survey has raised some issues for you, please consider contacting
some of the support services listed below, or speak to a friend, family member or professional.
Aware:
The Aware Support Line 1890 303 302
Available Monday – Sunday, 10am to 10pm.
Email for support at: [email protected]
Samaritans
Call on: 116 123
Available 24hrs a day, 365 days a year. Free to call.
Email: [email protected]

63
Please answer ALL questions in the questionnaire
Please (v) tick or circle your answers:
1. What sex are you?
Male Female
2. What age are you (please write)
3. What is your level of education?
Junior Certificate / O levels Leaving Certificate / A levels Level 6 Certificate (advanced/higher) Level 7 Ordinary Degree Level 8 Honours Degree/Higher Diploma Level 9 Masters/Post-graduate Diploma Level 10 Doctorate/Higher Doctorate
4. What is your marital status?
Married
Single/never married
Widowed
Separated/divorced
5. Approximately what is your annual income?
0 - Don't work less than 10000 10000-19999 20000-29999 30000-39999 40000-49999 50000+
6. Do you have a job?
Yes No
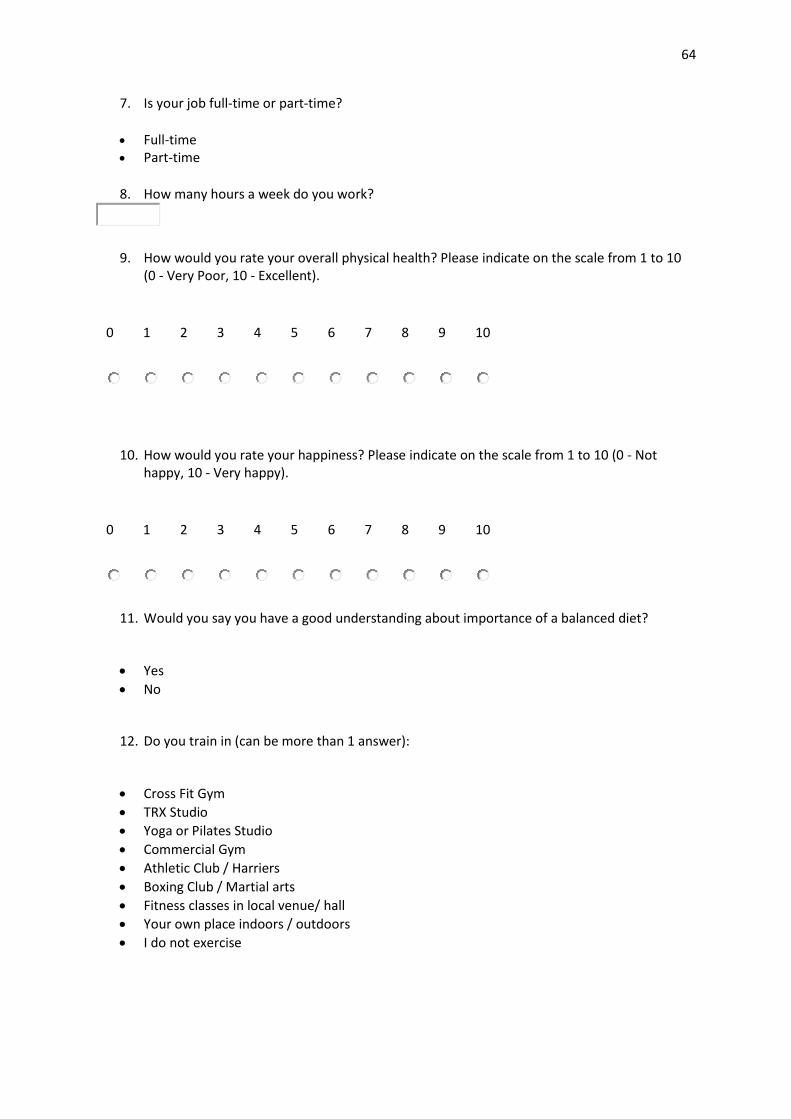
64
7. Is your job full-time or part-time?
Full-time Part-time
8. How many hours a week do you work?
9. How would you rate your overall physical health? Please indicate on the scale from 1 to 10 (0 - Very Poor, 10 - Excellent).
0 1 2 3 4 5 6 7 8 9 10
10. How would you rate your happiness? Please indicate on the scale from 1 to 10 (0 - Not happy, 10 - Very happy).
0 1 2 3 4 5 6 7 8 9 10
11. Would you say you have a good understanding about importance of a balanced diet?
Yes
No
12. Do you train in (can be more than 1 answer):
Cross Fit Gym
TRX Studio
Yoga or Pilates Studio
Commercial Gym
Athletic Club / Harriers
Boxing Club / Martial arts
Fitness classes in local venue/ hall
Your own place indoors / outdoors
I do not exercise

65
13. How many gym/studio based training sessions a week would you engage in (mark one answer)?
0 1 2 3 4 5 6 7 8 9 10
14. How many times a week do you exercise outside the gym/studio (mark one answer)?
0 1 2 3 4 5 6 7 8 9 10
15. How many weeks have you been exercising on your own, in a group or as a part of the gym/studio?
16. How long since you have started to participate in regular exercise as a member, or as a guest in a gym or studio? Please answer in weeks.
17. What type of training/activity do you prefer (You may tick more than one option):
Cardio
Strength
Relaxation/Flexibility ( ie.,Yoga, Pilates)
18. Would you have portion of nuts and seeds per day?
Yes
No
19. How many portions of fruit and vegetables would you have per day?

66
20. On a scale 1 to 10 please indicate, how much you value the level of support offered by your family:
0 1 2 3 4 5 6 7 8 9 10
21. On a scale 1 to 10 please indicate, how much you value the level of support offered by your friends:
0 1 2 3 4 5 6 7 8 9 10
22. On a scale 1 to 10 please indicate, how much you value the level of support offered by those you see and chat to at the gym/studio:
0 1 2 3 4 5 6 7 8 9 10
Please circle or tick(v) the answer that applies to You the most:
23. I often feel I don’t have enough control over the decisions I have to make:
Strongly Agree Agree Neither Disagree Strongly Disagree
24. In general I feel in control of the things that happen to me :
Strongly Agree Agree Neither Disagree Strongly Disagree
25. The pace of work often leaves me with little feeling of control:
Strongly Agree Agree Neither Disagree Strongly Disagree
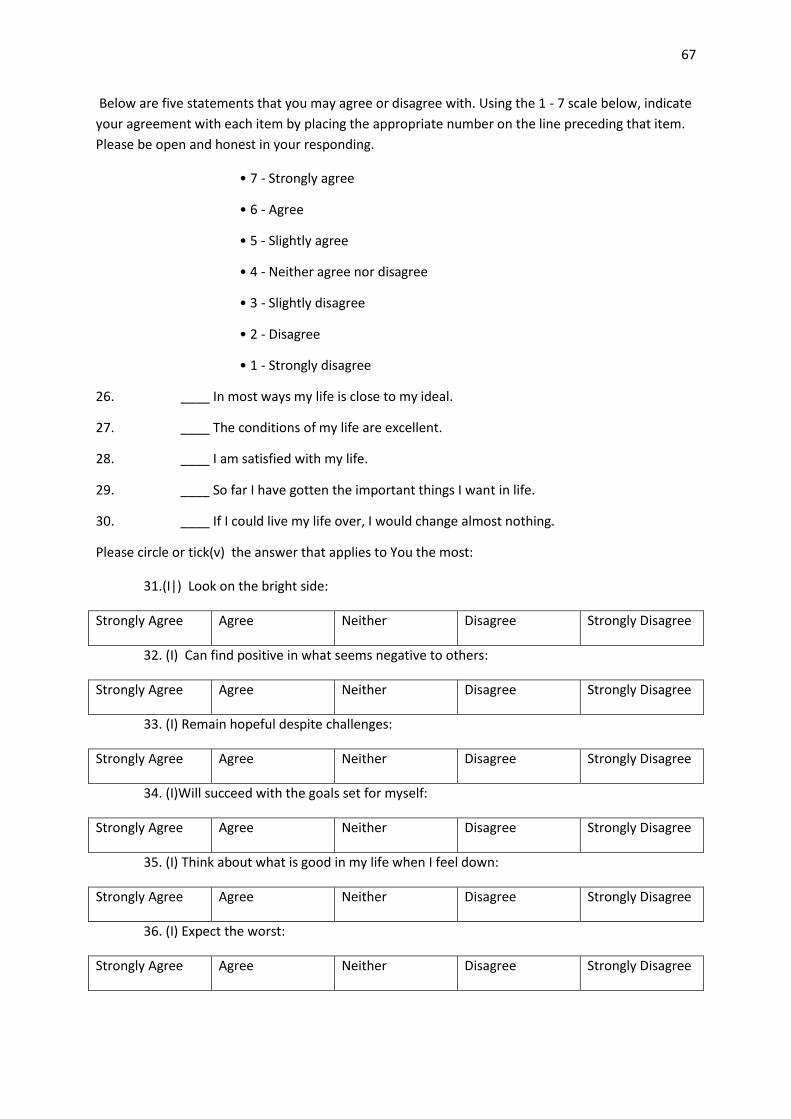
67
Below are five statements that you may agree or disagree with. Using the 1 - 7 scale below, indicate
your agreement with each item by placing the appropriate number on the line preceding that item.
Please be open and honest in your responding.
• 7 - Strongly agree
• 6 - Agree
• 5 - Slightly agree
• 4 - Neither agree nor disagree
• 3 - Slightly disagree
• 2 - Disagree
• 1 - Strongly disagree
26. ____ In most ways my life is close to my ideal.
27. ____ The conditions of my life are excellent.
28. ____ I am satisfied with my life.
29. ____ So far I have gotten the important things I want in life.
30. ____ If I could live my life over, I would change almost nothing.
Please circle or tick(v) the answer that applies to You the most:
31.(I|) Look on the bright side:
Strongly Agree Agree Neither Disagree Strongly Disagree
32. (I) Can find positive in what seems negative to others:
Strongly Agree Agree Neither Disagree Strongly Disagree
33. (I) Remain hopeful despite challenges:
Strongly Agree Agree Neither Disagree Strongly Disagree
34. (I)Will succeed with the goals set for myself:
Strongly Agree Agree Neither Disagree Strongly Disagree
35. (I) Think about what is good in my life when I feel down:
Strongly Agree Agree Neither Disagree Strongly Disagree
36. (I) Expect the worst:
Strongly Agree Agree Neither Disagree Strongly Disagree

68
37. (I) Have no plan for my life five years from now:
Strongly Agree Agree Neither Disagree Strongly Disagree
38. (I) Am not confident that my way of doing things will work out for the best:
Strongly Agree Agree Neither Disagree Strongly Disagree
The following items ask about your general health over the past few weeks. Please answer all
the questions simply by circling or ticking (v) the answer that you think most nearly applies
to you. Remember that we want to know about your present and recent complaints, not those
you had in the past. It is important that you try to answer all the questions.
Have you recently:
39. been able
to concentrate
on whatever
you’re doing?
Better than
usual
Same as usual Less than usual Much less than
usual
40. lost much
sleep over
worry?
Not at all No more than
usual
Rather more
than usual
Much more
than usual
41. felt that
you are
playing a
useful part in
things?
More so than
usual
Same as usual Less useful
than usual
Much less
useful
42. felt capable
of making
decisions about
things?
More so than
usual
Same as usual Less so than
usual
Much less
capable
45. felt
constantly
under strain?
Not at all No more than
usual
Rather more
than usual
Much more
than usual
46. felt you
couldn’t
overcome your
difficulties?
Not at all No more than
usual
Rather more
than usual
Much more
than usual

69
47. been able
to enjoy your
normal day-to-
day activities?
More so than
usual
Same as usual Less so than
usual
Much less than
usual
48. been able
to face up to
your
problems?
More so than
usual
Same as usual Less able than
usual
Much less able
49. been
feeling
unhappy and
depressed?
Not at all No more than
usual
Rather more
than usual
Much more
than usual
50. been losing
confidence in
yourself?
Not at all No more than
usual
Rather more
than usual
Much more
than usual
51. been
thinking of
yourself as a
worthless
person?
Not at all No more than
usual
Rather more
than usual
Much more
than usual
52. been
feeling
reasonably
happy, all
things
considered?
More so than
usual
About same as
usual
Less so than
usual
Much less than
usual
Please answer all the questions simply by circling or ticking (v) the answer that you think most
nearly applies to you.
Not at all true Barely True Moderately
true
Exactly
true
53. I can always manage to
solve difficult problems if I try
hard enough.
1 2 3 4
54. If someone opposes me, I
can find means and ways to
get what I want.
1 2 3 4

70
55. It is easy for me to stick to
my aims and accomplish my
goals.
1 2 3 4
56. I am confident that I could
deal efficiently with
unexpected events.
1 2 3 4
57. Thanks to my
resourcefulness, I know how
to handle unforeseen
situations.
1 2 3 4
58. I can solve most problems
if I invest the necessary effort.
1 2 3 4
59. I can remain calm when
facing difficulties because I
can rely on my coping abilities.
1 2 3 4
60. When I am confronted
with a problem, I can usually
find several solutions.
1 2 3 4
61. If I am in a bind, I can
usually think of something to
do.
1 2 3 4
62. No matter what comes my
way, I’m usually able to handle
it.
1 2 3 4
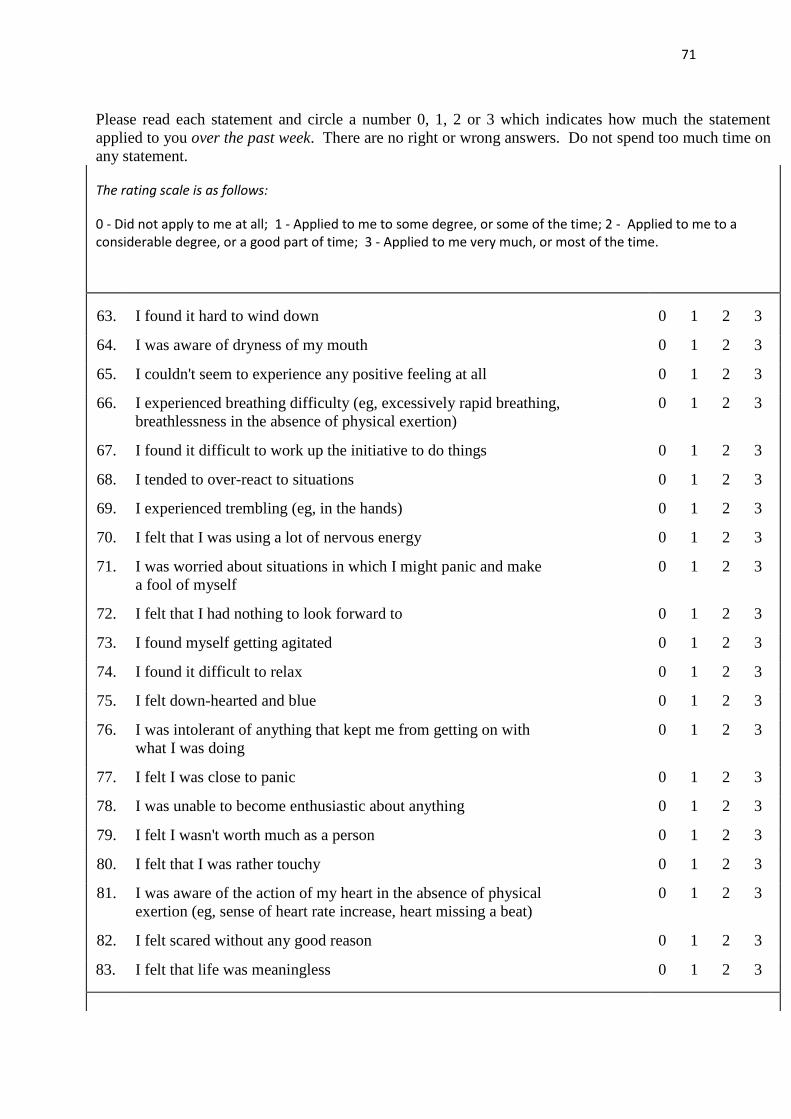
71
Please read each statement and circle a number 0, 1, 2 or 3 which indicates how much the statement
applied to you over the past week. There are no right or wrong answers. Do not spend too much time on
any statement.
The rating scale is as follows:
0 - Did not apply to me at all; 1 - Applied to me to some degree, or some of the time; 2 - Applied to me to a considerable degree, or a good part of time; 3 - Applied to me very much, or most of the time.
63. I found it hard to wind down 0 1 2 3
64. I was aware of dryness of my mouth 0 1 2 3
65. I couldn't seem to experience any positive feeling at all 0 1 2 3
66. I experienced breathing difficulty (eg, excessively rapid breathing,
breathlessness in the absence of physical exertion)
0 1 2 3
67. I found it difficult to work up the initiative to do things 0 1 2 3
68. I tended to over-react to situations 0 1 2 3
69. I experienced trembling (eg, in the hands) 0 1 2 3
70. I felt that I was using a lot of nervous energy 0 1 2 3
71. I was worried about situations in which I might panic and make
a fool of myself
0 1 2 3
72. I felt that I had nothing to look forward to 0 1 2 3
73. I found myself getting agitated 0 1 2 3
74. I found it difficult to relax 0 1 2 3
75. I felt down-hearted and blue 0 1 2 3
76. I was intolerant of anything that kept me from getting on with
what I was doing
0 1 2 3
77. I felt I was close to panic 0 1 2 3
78. I was unable to become enthusiastic about anything 0 1 2 3
79. I felt I wasn't worth much as a person 0 1 2 3
80. I felt that I was rather touchy 0 1 2 3
81. I was aware of the action of my heart in the absence of physical
exertion (eg, sense of heart rate increase, heart missing a beat)
0 1 2 3
82. I felt scared without any good reason 0 1 2 3
83. I felt that life was meaningless 0 1 2 3

72