Embed Size (px)
Citation preview

The influence of anthropogenic surface processes and
inhomogeneities on gridded global climate data
Ross McKitrickDepartment of EconomicsUniversity of GuelphGuelph ON Canada
Presentation to the American Chemical SocietyDenver CO via WebinarAugust 28 2011
ross.mckitrick.weebly.com 2
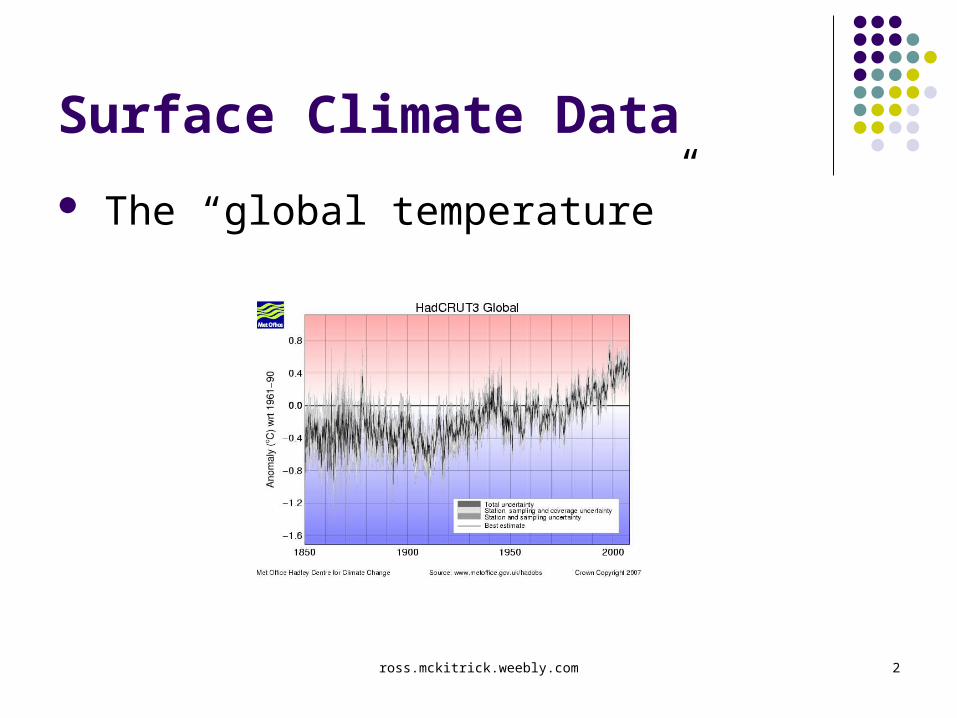
Surface Climate Data
The “global temperature”
ross.mckitrick.weebly.com 3
Summary Climate data is the output of a model
Raw data: daily T-Min and T-Max readings from inhabited places
This isn’t what the climate analyst is interested in: it must be converted into “climate data” using a statistical adjustment model.
How do we know the adjustment model “works”?
Many papers merely describe the adjustment steps in enthusiastic detail
I have focused on devising statistical tests of the results

ross.mckitrick.weebly.com 4
Conclusions Based on analysis of multiple data sets, and after addressing a
long list of statistical rebuttals, I find the evidence convincing that:
The adjustment models are inadequate
The resulting climate record over land is contaminated with patterns of socioeconomic development
This adds a net warming bias to the global trend and may lead to misattribution of spatial patterns to greenhouse gases
A valid empirical model of the spatial pattern of observed warming must include anthropogenic surface processes

ross.mckitrick.weebly.com 5
Papers McKitrick, Ross and Patrick J. Michaels (2004). “A Test of Corrections for
Extraneous Signals in Gridded Surface Temperature Data” Climate Research 26 pp. 159-173.
McKitrick, Ross R. and Patrick J. Michaels. (2007) “Quantifying the influence of anthropogenic surface processes and inhomogeneities on gridded surface climate data.” Journal of Geophysical Research-Atmospheres 112, D24S09, doi:10.1029/2007JD008465.
McKitrick, Ross R. and Nicolas Nierenberg (2010) “Socioeconomic Patterns in Climate Data.” Journal of Economic and Social Measurement, 35(3,4) pp. 149-175. DOI 10.3233/JEM-2010-0336.
McKitrick, Ross R. (2010) “Atmospheric Oscillations do not Explain the Temperature-Industrialization Correlation.” Statistics, Politics and Policy, Vol 1 No. 1, July 2010.
rossmckitrick.weebly.com

ross.mckitrick.weebly.com 6
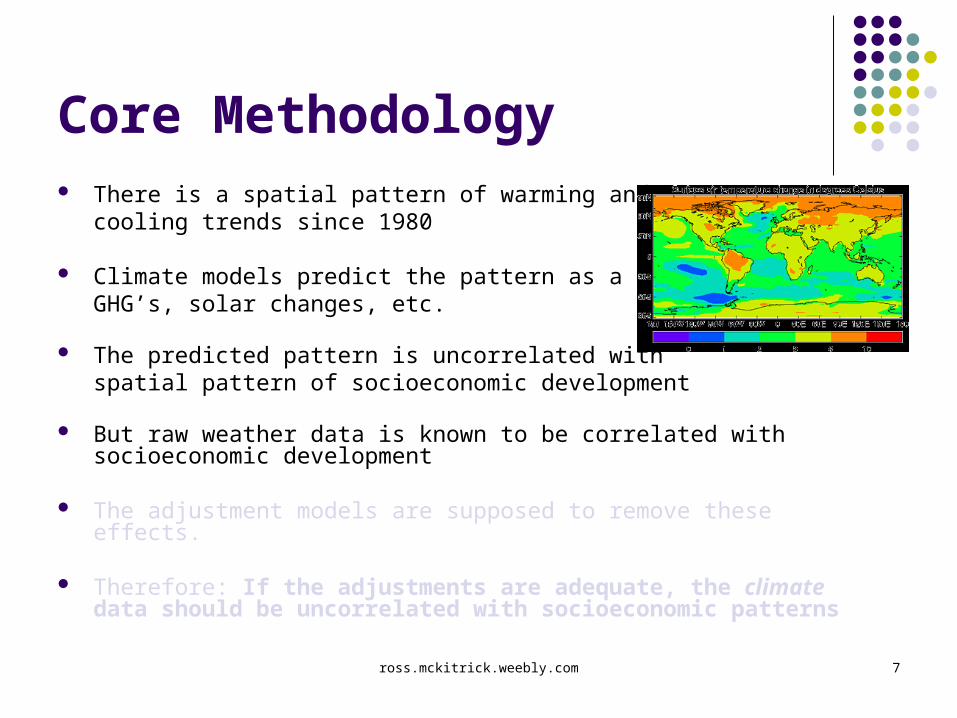
Core Methodology There is a spatial pattern of warming and
cooling trends since 1980
Climate models predict the pattern as a response toGHG’s, solar changes, etc.
The predicted pattern is uncorrelated withspatial pattern of socioeconomic development
But raw weather data is known to be correlated with socioeconomic development
The adjustment models are supposed to remove these effects.
Therefore: If the adjustments are adequate, the climate data should be uncorrelated with socioeconomic patterns
ross.mckitrick.weebly.com 7
Core Methodology There is a spatial pattern of warming and
cooling trends since 1980
Climate models predict the pattern as a response toGHG’s, solar changes, etc.
The predicted pattern is uncorrelated withspatial pattern of socioeconomic development
But raw weather data is known to be correlated with socioeconomic development
The adjustment models are supposed to remove these effects.
Therefore: If the adjustments are adequate, the climate data should be uncorrelated with socioeconomic patterns
ross.mckitrick.weebly.com 8
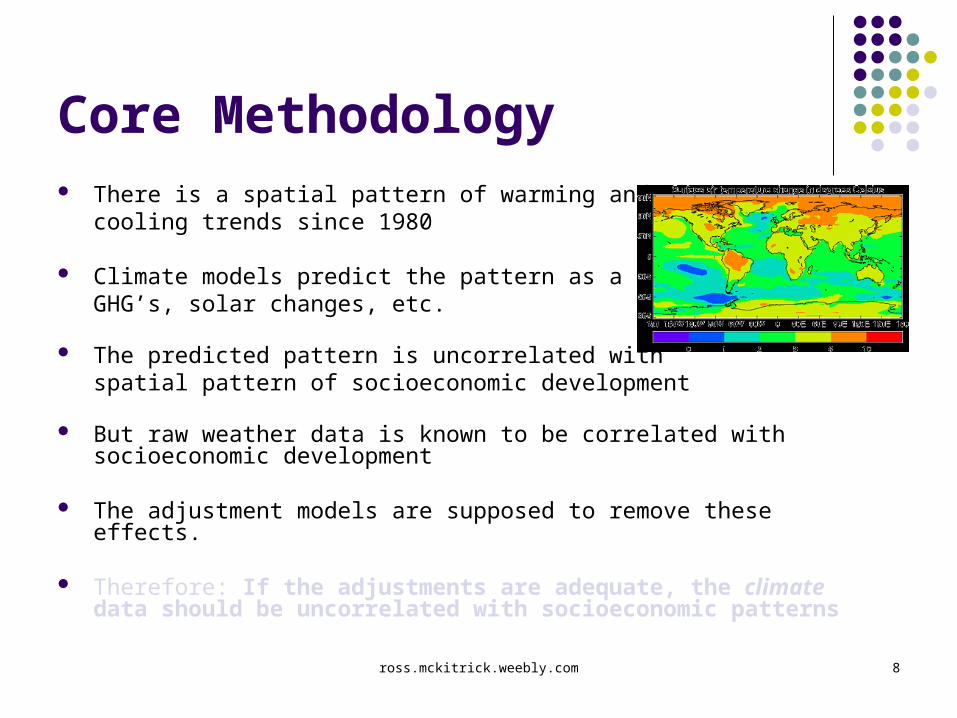
Core Methodology There is a spatial pattern of warming and
cooling trends since 1980
Climate models predict the pattern as a response toGHG’s, solar changes, etc.
The predicted pattern is uncorrelated withspatial pattern of socioeconomic development
But raw weather data is known to be correlated with socioeconomic development
The adjustment models are supposed to remove these effects.
Therefore: If the adjustments are adequate, the climate data should be uncorrelated with socioeconomic patterns

ross.mckitrick.weebly.com 9
Core Methodology There is a spatial pattern of warming and
cooling trends since 1980
Climate models predict the pattern as a response toGHG’s, solar changes, etc.
The predicted pattern is uncorrelated withspatial pattern of socioeconomic development
But raw weather data is known to be correlated with socioeconomic development
The adjustment models are supposed to remove these effects.
Therefore: If the adjustments are adequate, the climate data should be uncorrelated with socioeconomic patterns
ross.mckitrick.weebly.com 10
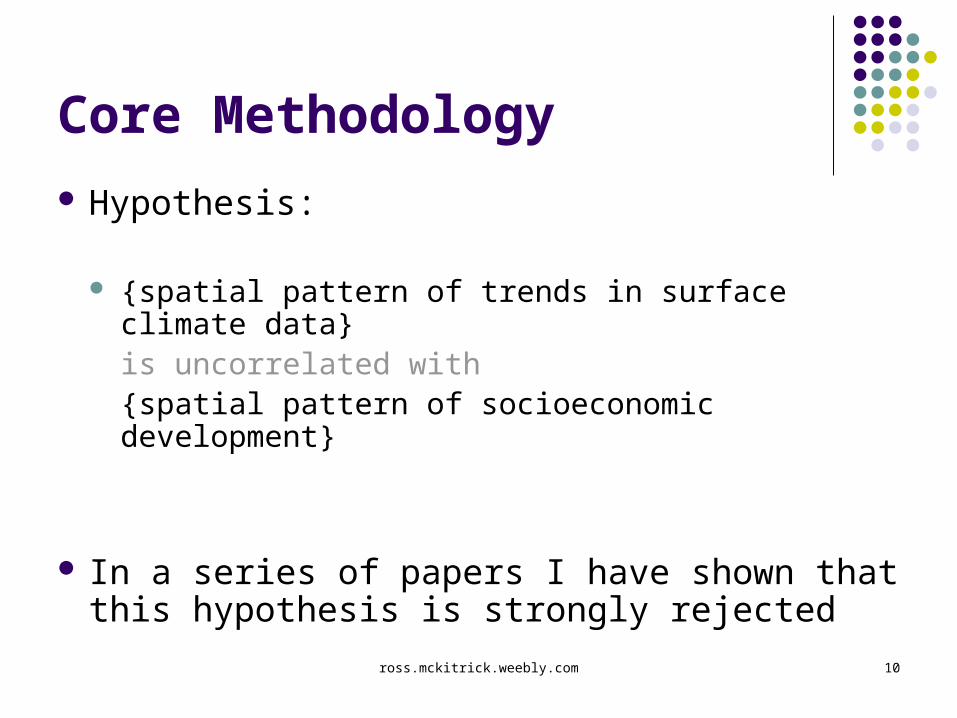
Core Methodology
Hypothesis:
{spatial pattern of trends in surface climate data} is uncorrelated with
{spatial pattern of socioeconomic development}
In a series of papers I have shown that this hypothesis is strongly rejected
ross.mckitrick.weebly.com 11
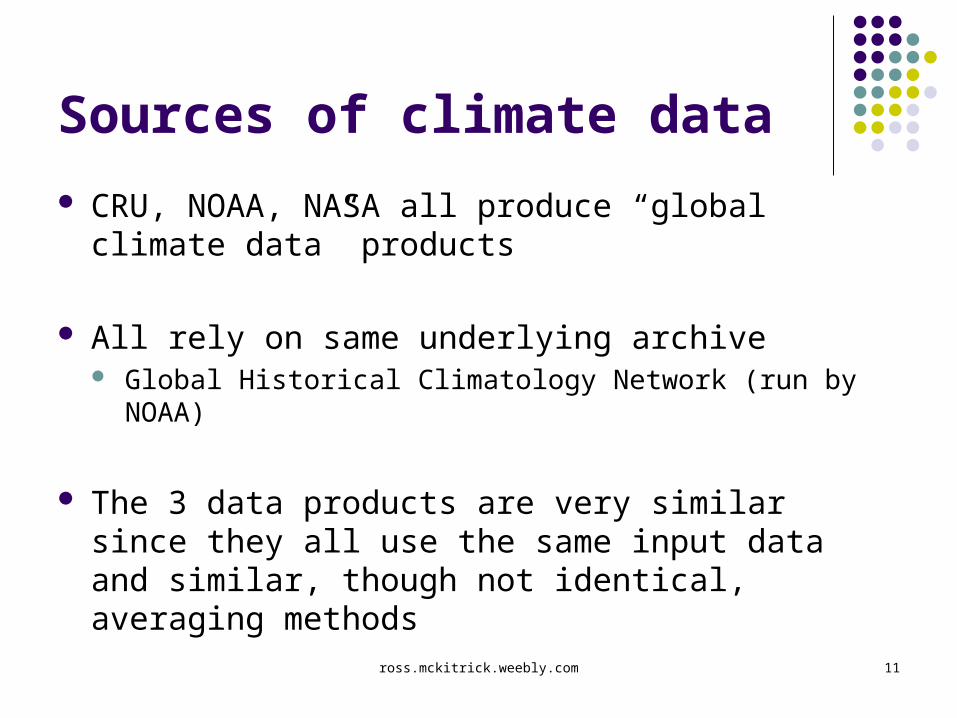
Sources of climate data
CRU, NOAA, NASA all produce “global climate data” products
All rely on same underlying archive Global Historical Climatology Network (run by NOAA)
The 3 data products are very similar since they all use the same input data and similar, though not identical, averaging methods
ross.mckitrick.weebly.com 12
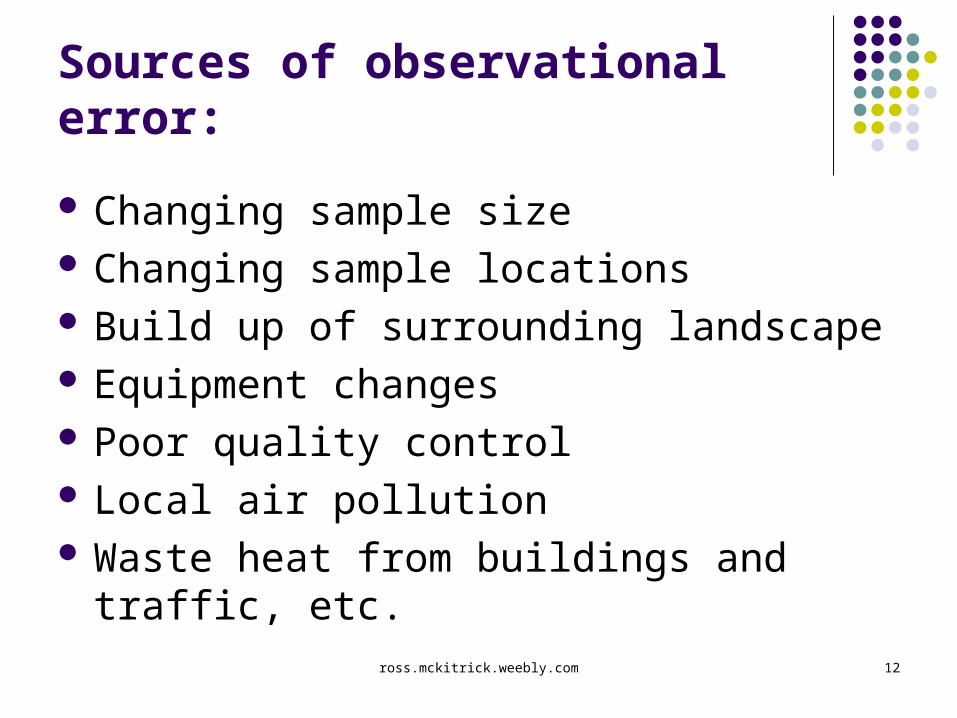
Sources of observational error:
Changing sample size Changing sample locations Build up of surrounding landscape Equipment changes Poor quality control Local air pollution Waste heat from buildings and traffic, etc.

ross.mckitrick.weebly.com 13
GHCN sample 1885
Locations of weather stations
ross.mckitrick.weebly.com 14
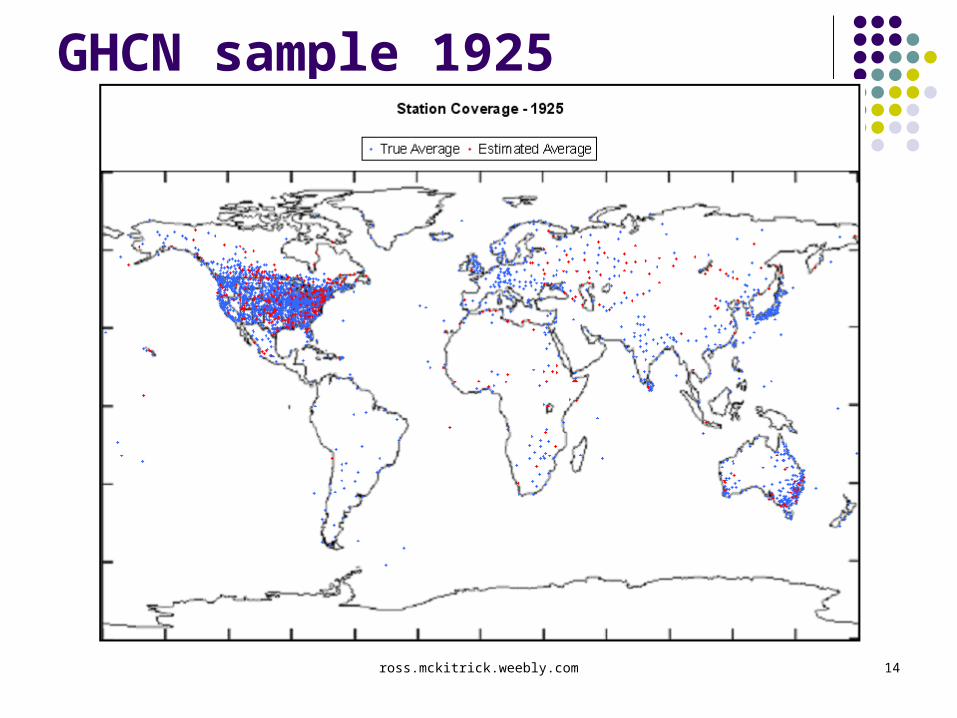
GHCN sample 1925
Locations of weather stations
ross.mckitrick.weebly.com 15
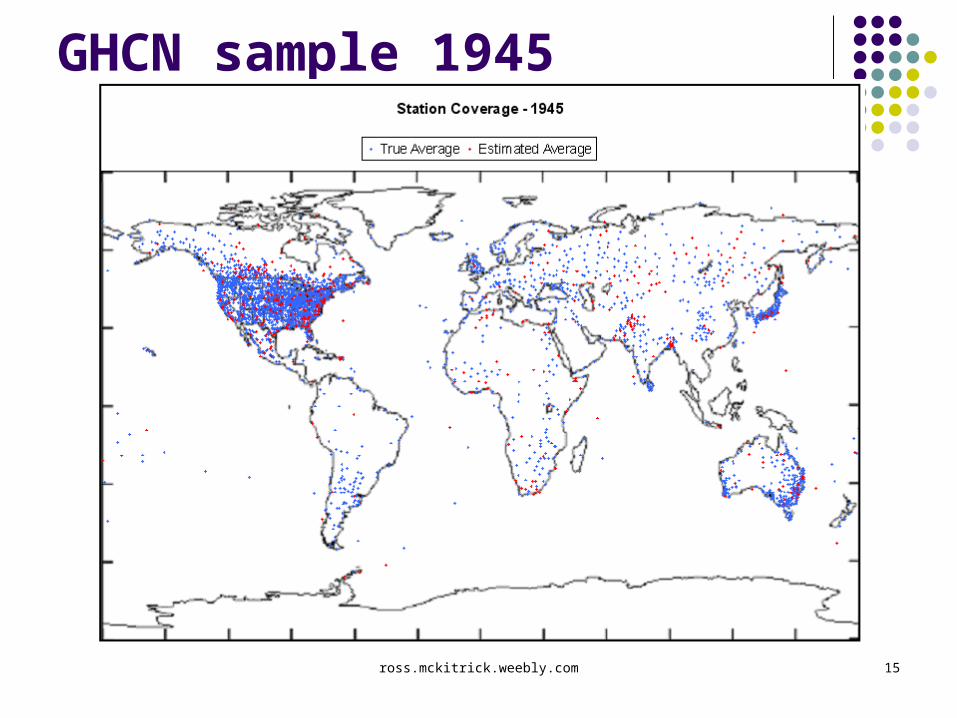
GHCN sample 1945
ross.mckitrick.weebly.com 16
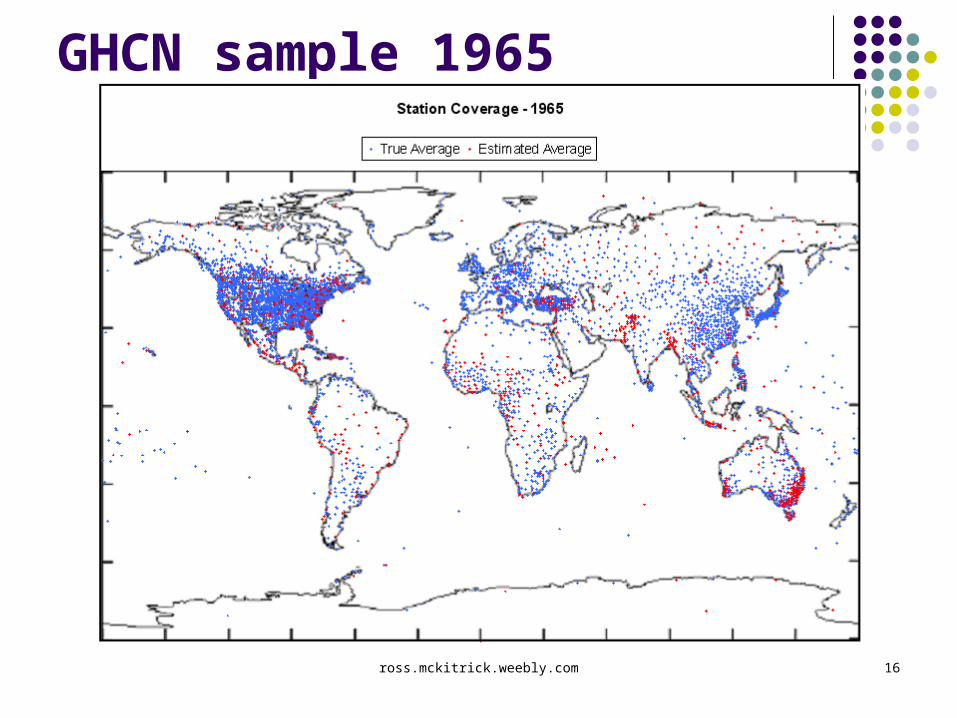
GHCN sample 1965
Locations of weather stations

ross.mckitrick.weebly.com 17
GHCN sample 1985
Locations of weather stations

ross.mckitrick.weebly.com 18
GHCN sample 2005
Locations of weather stations
ross.mckitrick.weebly.com 19
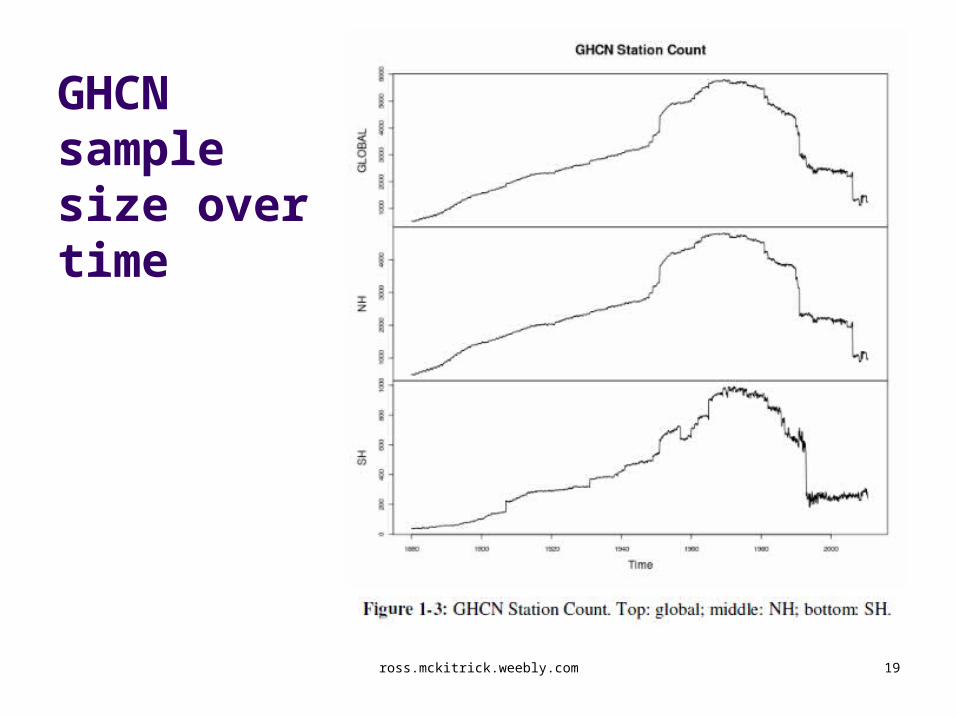
GHCNsamplesize overtime
ross.mckitrick.weebly.com 20
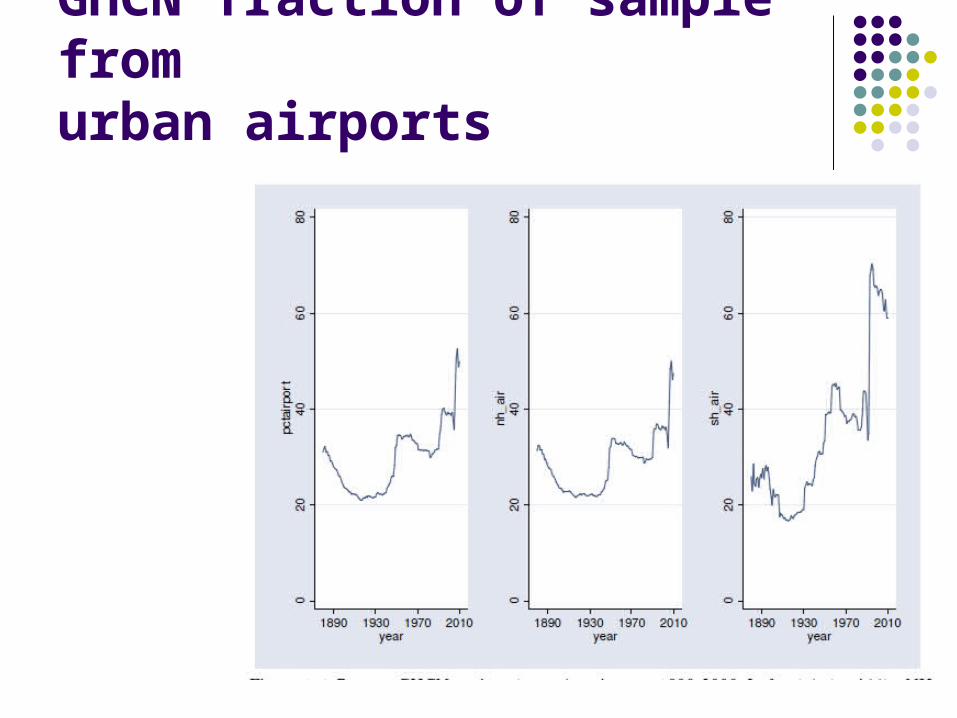
GHCN fraction of sample fromurban airports

ross.mckitrick.weebly.com 21
“Climate” data: the record as if the land surface was never modified and equipment never varied
Temp data from cities adjustment algorithm “True” record
+ =
ross.mckitrick.weebly.com 22
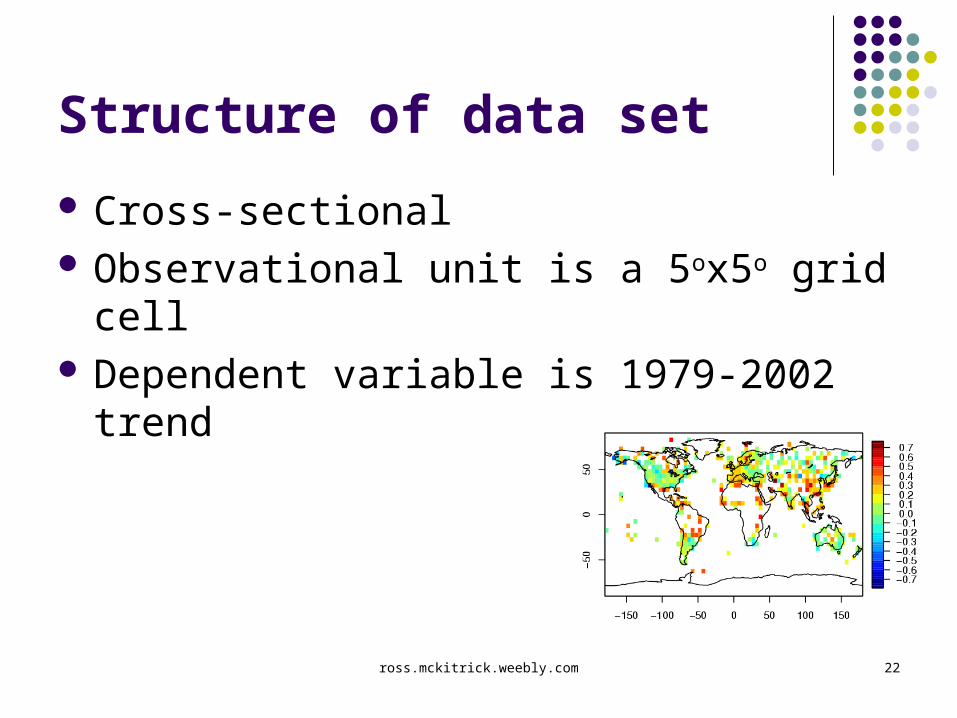
Structure of data set
Cross-sectional Observational unit is a 5ox5o grid cell Dependent variable is 1979-2002 trend
ross.mckitrick.weebly.com 23
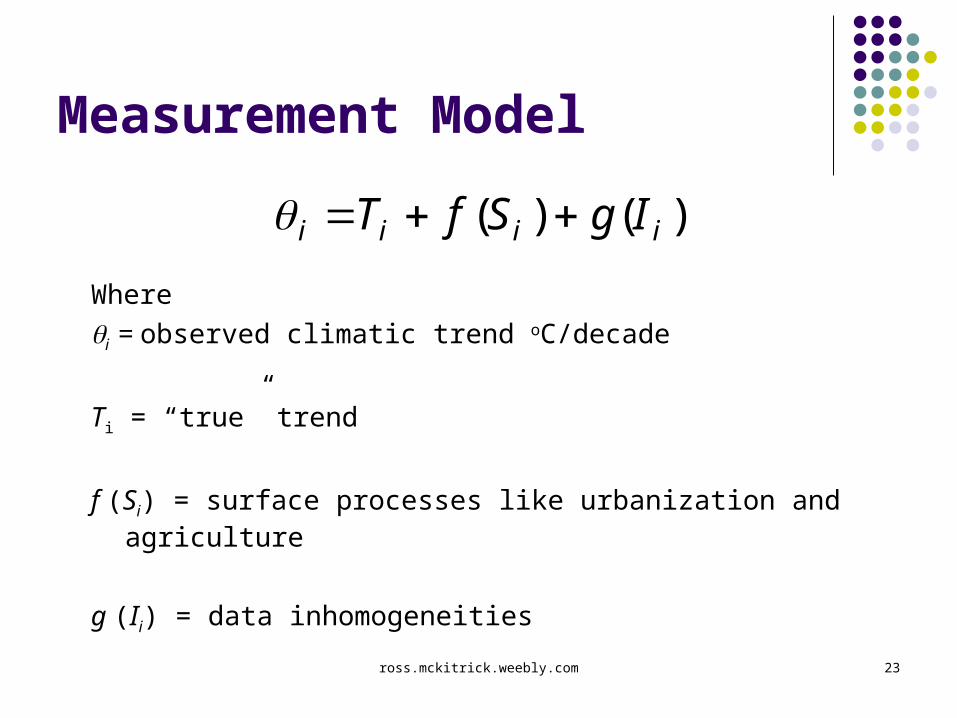
Measurement Model
Where
i = observed climatic trend oC/decade
Ti = “true” trend
f (Si) = surface processes like urbanization and agriculture
g (Ii) = data inhomogeneities
)()( iiii IgSfT

ross.mckitrick.weebly.com 24
For gridcell i
Ti (ideal temperature trend) represented by
TROPi = trend in troposphere over same gridcell as measured by satellites
iiiiii WATERDSLPDRYPRESSTROPT 543210
iABSLAT6

ross.mckitrick.weebly.com 25
For gridcell i
Surface processes f (Si) measured by
pi = % growth in population density
mi = % growth in real average income
yi = % growth in real national GDP
ci = % growth in national coal consumption

ross.mckitrick.weebly.com 26
For gridcell i
Inhomogeneities g (Ii) measured by
gi = GDP density (GDP per square km)
ei = availability of educated workers (sum of literacy + postsecondary education)
xi = rate of missing observations (# missing months in cell)
ross.mckitrick.weebly.com 27
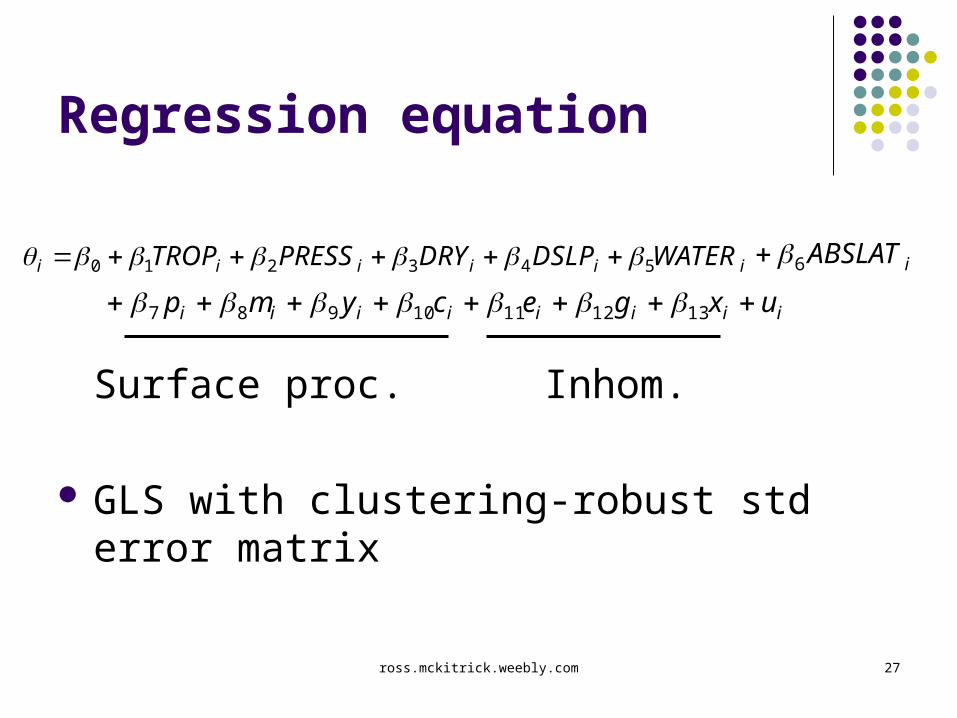
Regression equation
Surface proc. Inhom.
GLS with clustering-robust std error matrix
iiiiii WATERDSLPDRYPRESSTROP 543210 iABSLAT6
iiiiiiii uxgecymp 13121110987

ross.mckitrick.weebly.com 28
First pair of studies: McKitrick and Michaels (2004)
Tested 218 raw series and corresponding CRU gridded data Both exhibited significant imprint of socioeconomic data with v.
similar coefficients ‘Adjustment’ hypothesis rejected at high confidence level
McKitrick and Michaels (2007) Complete sample of (available) surface grid cells ‘Independence’ hypothesis again rejected at high confidence
level
Both studies: nonclimatic signals likely add up to a net warming bias in global average
ross.mckitrick.weebly.com 29
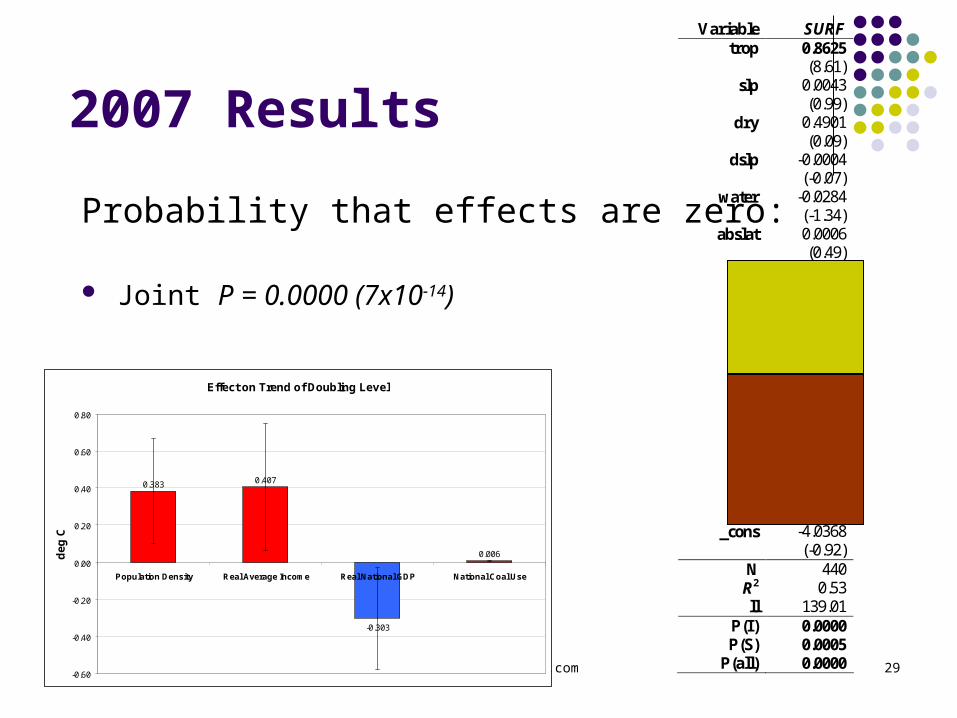
2007 Results
Variable SURF trop 0.8625
(8.61) slp 0.0043
(0.99) dry 0.4901
(0.09) dslp -0.0004
(-0.07) water -0.0284
(-1.34) abslat 0.0006
(0.49) g 0.0434
(3.38) e -0.0027 (-5.11)
x 0.0041 (1.66)
p 0.3831 (2.70)
m 0.4075 (2.37)
y -0.3032 (-2.19)
c 0.0059 (3.25)
_cons -4.0368 (-0.92)
N 440 R2 0.53 ll 139.01
P(I) 0.0000 P(S) 0.0005
P(all) 0.0000
Probability that effects are zero:
Joint P = 0.0000 (7x10-14)
Effect on Trend of Doubling Level
0.383 0.407
-0.303
0.006
-0.60
-0.40
-0.20
0.00
0.20
0.40
0.60
0.80
Population Density Real Average Income Real National GDP National Coal Use
de
g C

ross.mckitrick.weebly.com 30
Specification tests
Bootstrap resampling Remove outliers, re-estimate RESET test Cross-validation tests Hausman endogeneity test (P = 0.9962)

ross.mckitrick.weebly.com 31
Generating ‘clean’ trends Set GDP density and education to US levels Set all other surface and inhomogeneity effects to 0 Use model coeff’s to generate adjusted predicted values
Observed average surface trend: 0.30 oC/decade
MSU average: 0.23
Adjusted average surface trend: 0.17

ross.mckitrick.weebly.com 32
IPCC Report
How did the IPCC deal with this?
IPCC AR4 page 244:
McKitrick and Michaels (2004) and De Laat and Maurellis (2006) attempted to demonstrate that geographical patterns of warming trends over land are strongly correlated with geographical patterns of industrial and socioeconomic development, implying that urbanisation and related land surface changes have caused much of the observed warming. However, the locations of greatest socioeconomic development are also those that have been most warmed by atmospheric circulation changes (Sections 3.2.2.7 and 3.6.4), which exhibit large-scale coherence. Hence, the correlation of warming with industrial and socioeconomic development ceases to be statistically significant.
No supporting citation given
ross.mckitrick.weebly.com 33
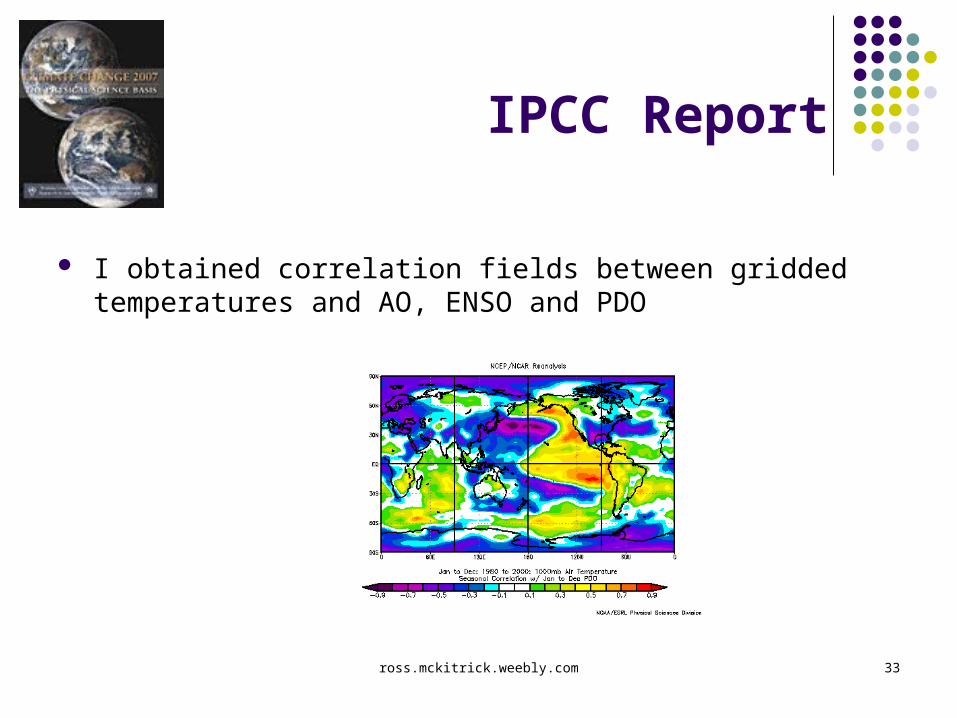
IPCC Report
I obtained correlation fields between gridded temperatures and AO, ENSO and PDO

ross.mckitrick.weebly.com 34
IPCC Report
I augmented data sets for M&M 2004 and M&M 2007 with circulation terms
2004 Model: Circulation index effects are insignificant Including them anyway does not remove the significance of the conclusions
2007 Model Circulation index effects are jointly barely significant Including them increases size and significance of socioecononomic terms
Conclusion: IPCC claim is false.
(McKitrick 2010, Statistics Politics and Policy July 2010)

ross.mckitrick.weebly.com 35
IPCC Report
I augmented data sets for M&M 2004 and M&M 2007 with circulation terms
2004 Model: Circulation index effects are insignificant Including them anyway does not remove the significance of the conclusions
2007 Model Circulation index effects are jointly barely significant Including them increases size and significance of socioecononomic terms
Conclusion: IPCC claim is false.
(McKitrick 2010, Statistics Politics and Policy July 2010)

ross.mckitrick.weebly.com 36
IPCC Report
I augmented data sets for M&M 2004 and M&M 2007 with circulation terms
2004 Model: Circulation index effects are insignificant Including them anyway does not remove the significance of the conclusions
2007 Model Circulation index effects are jointly barely significant Including them increases size and significance of socioecononomic terms
Conclusion: IPCC claim is false.
(McKitrick 2010, Statistics Politics and Policy July 2010)

ross.mckitrick.weebly.com 37
IPCC Report
I augmented data sets for M&M 2004 and M&M 2007 with circulation terms
2004 Model: Circulation index effects are insignificant Including them anyway does not remove the significance of the conclusions
2007 Model Circulation index effects are jointly barely significant Including them increases size and significance of socioecononomic terms
Conclusion: IPCC claim is false.
(McKitrick 2010, Statistics Politics and Policy July 2010)
ross.mckitrick.weebly.com 38
Schmidt (2009) “Spurious correlation between recent warming and indices of local economic activity.” International Journal of Climatology 10.1002/joc.1831
3 arguments against our findings
surface temperature field exhibits spatial autocorrelation (SAC) so results are insignificant
Use of RSS satellite series rather than UAH series removes significance of results
Data generated by climate model yields apparent correlations with socioeconomic data, yet is uncontaminated by construction, so effects must be a fluke
ross.mckitrick.weebly.com 39
Schmidt (2009) “Spurious correlation between recent warming and indices of local economic activity.” International Journal of Climatology 10.1002/joc.1831
3 arguments against our findings
surface temperature field exhibits spatial autocorrelation (SAC) so results are insignificant
Use of RSS satellite series rather than UAH series removes significance of results
Data generated by climate model yields apparent correlations with socioeconomic data, yet is uncontaminated by construction, so effects must be a fluke
ross.mckitrick.weebly.com 40
Schmidt (2009) “Spurious correlation between recent warming and indices of local economic activity.” International Journal of Climatology 10.1002/joc.1831
3 arguments against our findings
surface temperature field exhibits spatial autocorrelation (SAC) so results are insignificant
Use of RSS satellite series rather than UAH series removes significance of results
Data generated by climate model looks correlated with socioeconomic data, yet is uncontaminated by construction, so effects must be a fluke

ross.mckitrick.weebly.com 41
McKitrick & Nierenberg“Socioeconomic patterns in climate data” J Econ Soc Measurement 2010
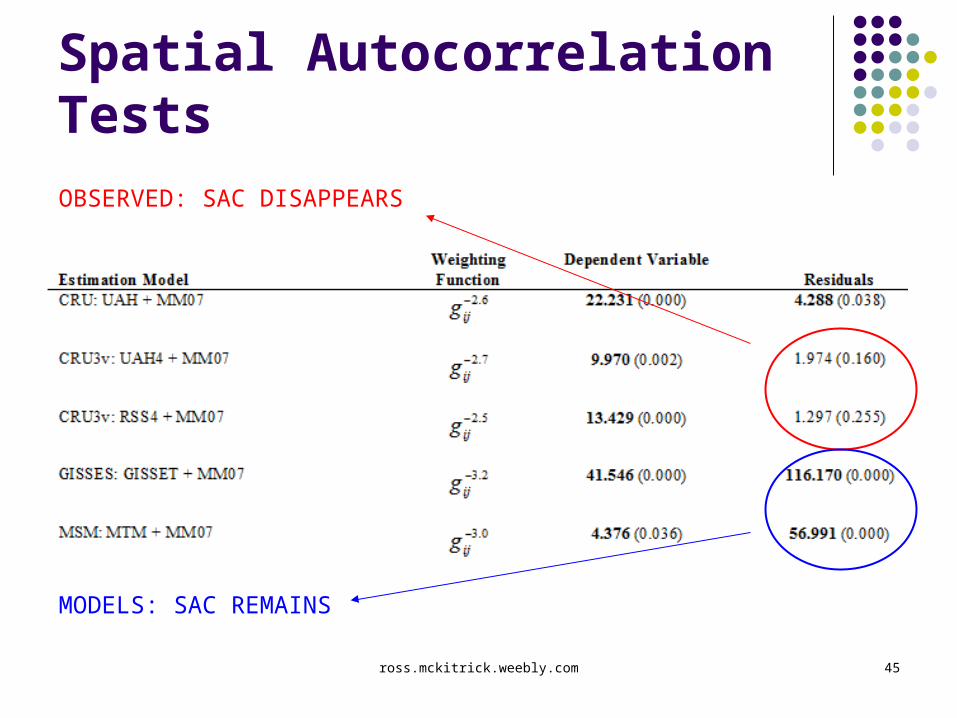
Responses Schmidt did not actually test SAC. We do, and show that while
depvar is AC’d, regression residuals are not, as long as socioecon variables are included in model.
Use of RSS data diminishes individual significance but effect due to a small number of outliers. Once these removed, RSS yields strongest results of all data sets
Model-based data cannot replicate observed patterns; predicts opposite signs

ross.mckitrick.weebly.com 42
McKitrick & Nierenberg“Socioeconomic patterns in climate data” J Econ Soc Measurement 2010
Responses Schmidt did not actually test SAC. We do, and show that while
depvar is AC’d, regression residuals are not, as long as socioecon variables are included in model.
Use of RSS data diminishes individual significance but effect due to a small number of outliers. Once these removed, RSS yields strongest results of all data sets
Model-based data cannot replicate observed patterns; predicts opposite signs

ross.mckitrick.weebly.com 43
McKitrick & Nierenberg“Socioeconomic patterns in climate data” J Econ Soc Measurement 2010
Responses Schmidt did not actually test SAC. We do, and show that while
depvar is AC’d, regression residuals are not, as long as socioecon variables are included in model.
Use of RSS data diminishes individual significance but effect due to a small number of outliers. Once these removed, RSS yields strongest results of all data sets
Model-based data cannot replicate observed patterns; predicts opposite signs

ross.mckitrick.weebly.com 44
Data variations
Surface Observed: CRU, CRU2v, CRU3v Modeled: GISS-E; GCM average
Troposphere Observed: UAH, RSS Modeled: GISS-E; GCM average
ross.mckitrick.weebly.com 45
Spatial Autocorrelation Tests
OBSERVED: SAC DISAPPEARS
MODELS: SAC REMAINS
ross.mckitrick.weebly.com 46
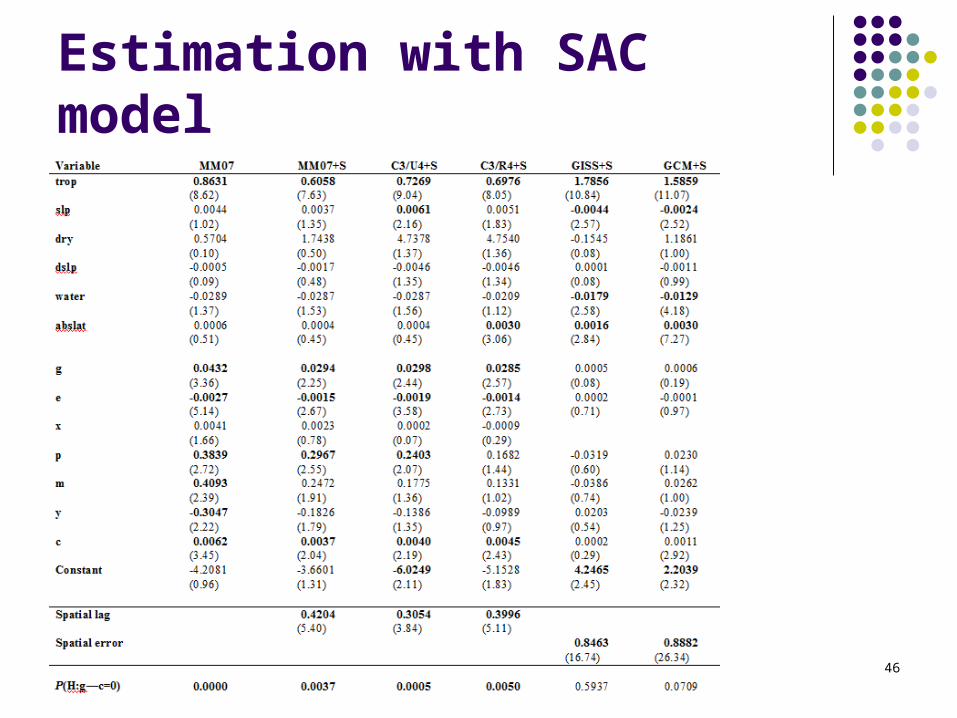
Estimation with SAC model

ross.mckitrick.weebly.com 47
Estimation with SAC model
OBSERVATIONS:
SIGNIFICANT
MODELS:
INSIGNIFICANT

ross.mckitrick.weebly.com 48
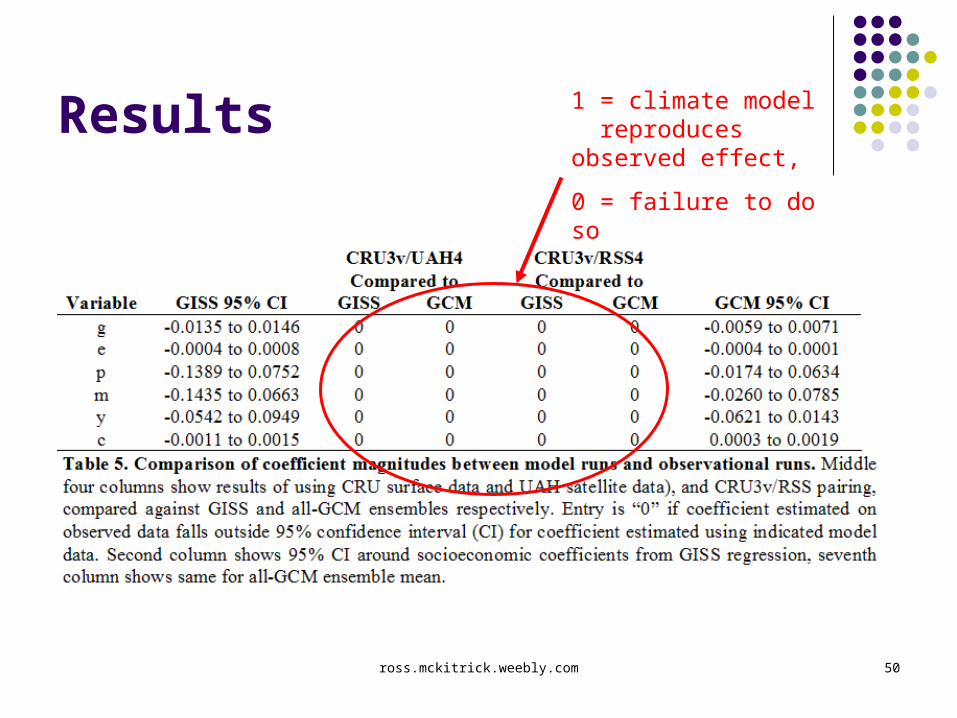
GCM Counterfactual Schmidt 2009, p.2:
There is a relatively easy way to assess whether there is any true significance to these correlations. We can take fully consistent model simulations for the same period and calculate the distribution of the analogous correlations. Those simulations contain no unaccounted-for processes (by definition!) but plenty of internal variability, locally important forcings and spatial correlation. If the distribution encompasses the observed correlations, then the null hypothesis (that there is no contamination) cannot be rejected.

ross.mckitrick.weebly.com 49
Results
ross.mckitrick.weebly.com 50
Results
1 = climate model reproduces observed effect,
0 = failure to do so

ross.mckitrick.weebly.com 51
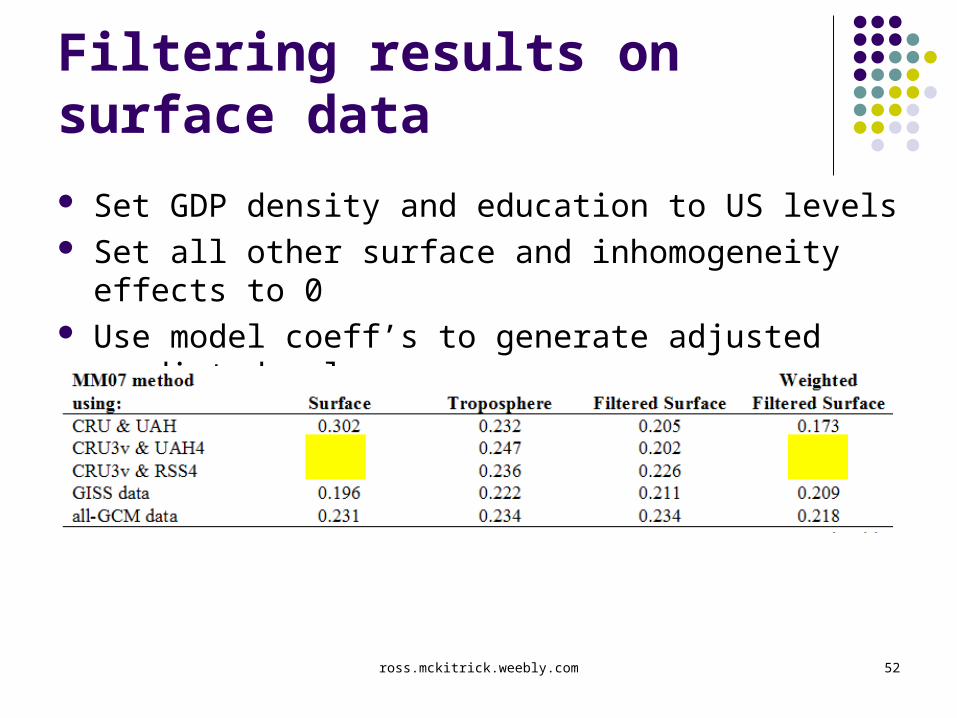
Filtering results on surface data
Set GDP density and education to US levels Set all other surface and inhomogeneity effects to 0 Use model coeff’s to generate adjusted predicted values
ross.mckitrick.weebly.com 52
Filtering results on surface data
Set GDP density and education to US levels Set all other surface and inhomogeneity effects to 0 Use model coeff’s to generate adjusted predicted values
ross.mckitrick.weebly.com 53
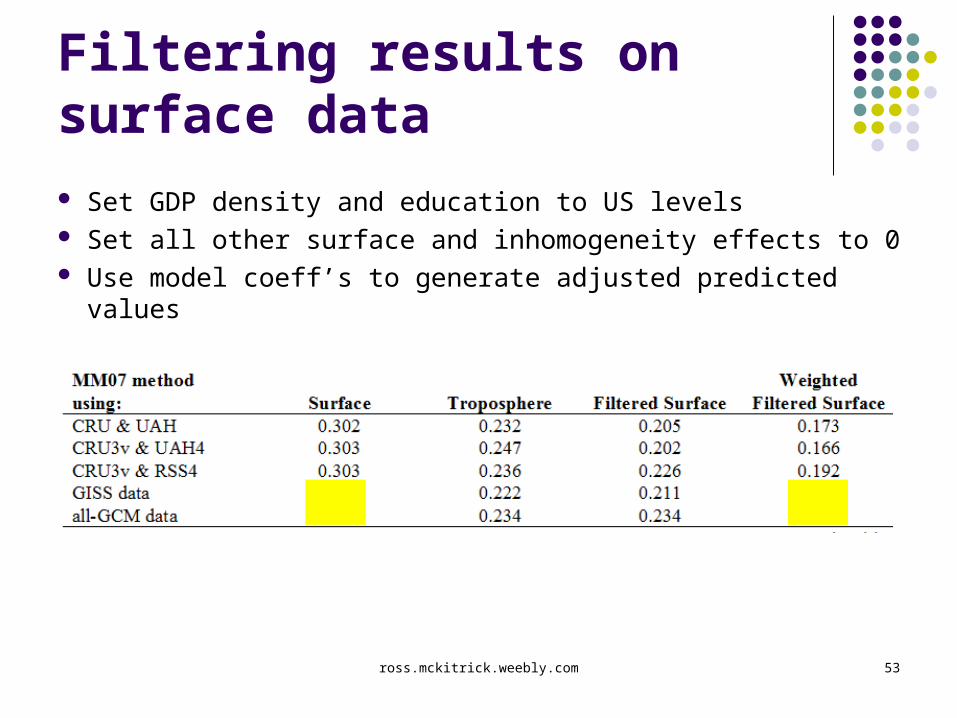
Filtering results on surface data
Set GDP density and education to US levels Set all other surface and inhomogeneity effects to 0 Use model coeff’s to generate adjusted predicted values
This method should not reduce mean trend in GISS data

ross.mckitrick.weebly.com 54
Conclusions
In general, I reject the null hypothesis that adjustment models yield “climate” data
socioeconomic patterns are highly significant across wide variety of specifications and data combinations
socioeconomic data are necessary for well-specified error term
This suggests a causal interpretation of the regression results

ross.mckitrick.weebly.com 55
Responses to critiques:
IPCC claim that the results were statistically insignificant & due to natural circulation patterns was a fabrication
The claim was both unsubstantiated and untrue
Various critiques have not held up SAC is not a source of bias Results hold up across numerous data sets Climate models cannot reproduce results