Embed Size (px)
Citation preview
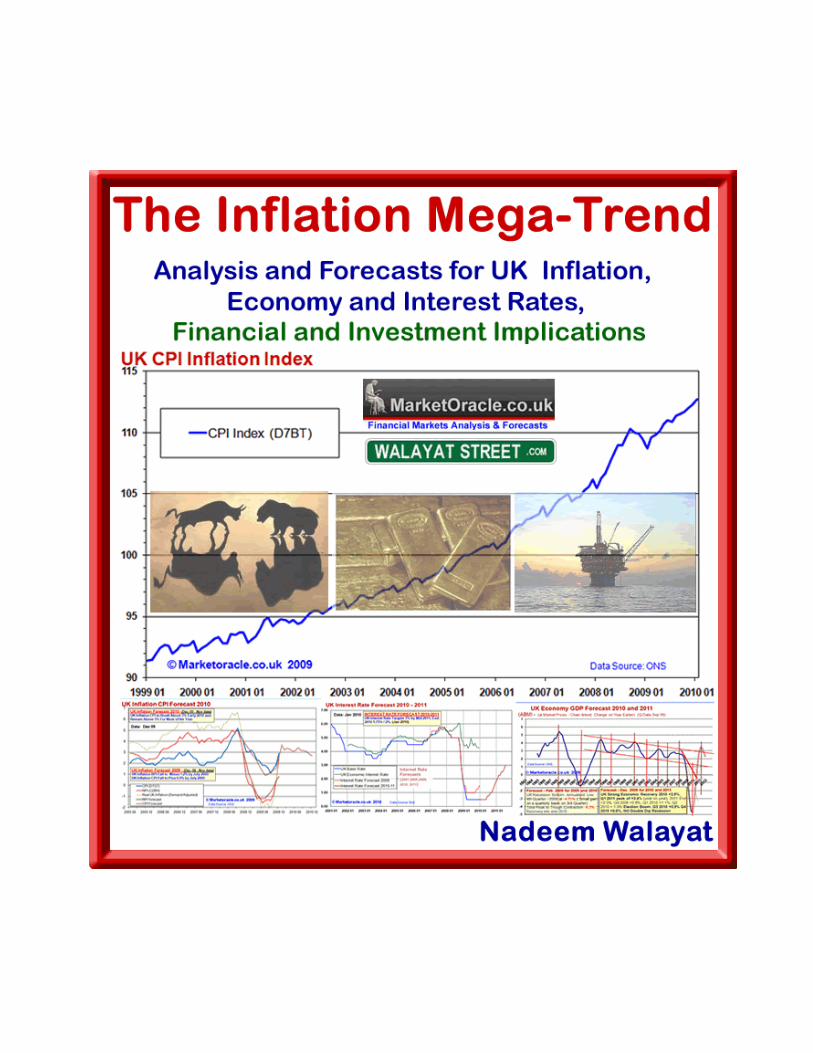
The Inflation Mega-Trend
Analysis and Forecasts for Inflation, Economy and Interest Rates
Financial and Investment Implications
By Nadeem Walayat
Copyright © 2010 All Rights Reserved
Market Oracle Ltd (http://www.marketoracle.co.uk)
For the latest analysis subscribe to our Always Free Newsletter

My family, the best investment I ever made.
Published by Market Oracle Ltd226 Darnall Road Sheffield S9 5AN UK
Copyright © 2010 by Nadeem Walayat and Market Oracle Ltd - All Rights Reserved
PERMISSION GRANTED TO SHARE THIS EBOOKPermission is granted to share The Inflation Mega-trend Ebook (pdf file) on the following conditions:
1. You may Freely share this PDF Ebook as long as the file remains UNCHANGED in its original form.2. You are allowed to share this PDF file from your web server or by email including mailing lists as
long as the PDF file remains UNCHANGED.3. You may include this ebook as part of any FREE promotion for your own services as long as the
PDF file remains UNCHANGED and NO Fee is charged for this ebook.4. You may include this Ebook as part of a bundle of ebook's as long as the whole bundle is FREE.5. You are allowed to Print and Share the Ebook as a hard copy as long as NO pages are omitted or
changes made.6. You are NOT allowed to post the contents of this PDF file as web, email or any other content i.e.
as articles or pages (such as at Scribd).7. You are NOT allowed to EDIT or EXTRACT content from this pdf file.8. You are NOT allowed to SELL or charge ANY Fee for this Ebook.
Again you may share this ebook for FREE as long as the file remains unchanged in its original unaltered state and that yourespect the authors copyright.
DISCLAIMER
While the publisher and author have used their best efforts in preparing this book, they make no representations or warrantieswith respect to the accuracy or completeness of the contents of this book and specifically disclaim any implied warranties ofmerchantability or fitness for a particular purpose. The advice and strategies contained herein may not be suitable for yoursituation. You should consult with a professional where appropriate.
Neither the publisher nor author shall be liable for any loss of profit or any other commercial damages, including but not limitedto special, incidental, consequential, or other damages.
The information contained in this publication is strictly for educational purposes. It is provided as general market commentary,and does not constitute Investment advice. Neither the author nor associates, distributors, heirs or Assigns shall accept liabilityfor any loss or damage, including without Limitation, any loss of profit, which may arise directly or indirectly from use of orreliance on such information. There is no warranty of any kind.
Furthermore the author and publisher do not guarantee any results or investment returns based on the information containedherein. We suggest that you consult with an independent licensed financial advisor or stockbroker prior to embarking on anyinvestment decision.
CONTENTS Introduction 1
CHAPTER 1 - UK Inflation 2
Inflation Forecast 2009 2 The Inflation Mega-trend 3 UK Retail Sales Signal Election Consumer Boom 4 M4 Money Supply Adjusted for the Velocity of Money 5 UK Unemployment 6 Debt Fuelled Economic Recovery 9 Debt and Liabilities 11 UK Interest Rate Being Kept Artificially Low For Bank Profiteering 11 UK House Prices Continue 2010 Debt Fuelled Election Bounce 13 UK Producer Prices 16 Stocks Bull Market Signaling Strong Economy 16 British Pound to Wobble Lower During 2010 17 Conclusion and UK CPI Inflation Forecast 2010 18 U.S. Inflation Forecast 19
CHAPTER 2 - UK Economy 21
UK GDP Forecast 2009 - Britain's Great Depression 21 Labour's 10 Year Economic Boom Bust 22 Stock Market the Key Indicator of Economic Strength of 2009 23 Budget Deficit Cutting Solutions to Britain's Debt Crisis 23 Bank of England Quantitative Easing Smoke and Mirrors Dangerous Game 25 China Leads the Way for Strong Global Growth 27 UK GDP Growth Forecast Conclusion 28 Mainstream UK Growth Forecasts 29
CHAPTER 3 - UK Interest Rates 30
UK Interest Rates Forecast 2009 Recap 30 Inflation and Economy Implications for Interest Rates 31 LIBOR / Base Interest Rate Spread Analysis 33 Banks Profiteering From Artificial Banking System 34 Do UK Interest Rates Lead or Lag CPI Inflation? 35 UK interest Rates and M4 Money Supply Relationship 36 UK Interest Rates and GDP Growth Trend Relationship 37 UK Quantitative Easing Money Printing to Hit £275 Billion 2010 37 Improving UK Mortgage Lending Feeding the House Prices Bounce 40 British Pound Trends and Interest Rates 42 UK, U.S. and Euro Interest Rate Trends Analysis 43 UK Interest Rate Forecast 2010 - 2011 Conclusion 44 Press and Economic Organisation Interest Rate Expectations 45 Inflation Mega-Trend Conclusion and Opportunities From Crisis 46
CHAPTER 4 - Financial and Investment Implications 48
Agricultural Commodities Mega-trend 48 Population Growth 48 Global Warming Mega-trend 48 Agricultural Commodity Trends 48 Borrowers & Savers 50 British Pound 51 U.S. Dollar Bull Market 51 British Pound Trend Forecast 53 Emerging Markets Investing Mega-trend 54 China 55 India 58 Russia, Brazil, Others 60 Gold Analysis and Forecast 62 Gold Trend in Sterling 66 Silver Trend 66 GLD and SLV ETF's 68 Natural Gas Mega-trend 70 Natural Gas in Dollars & Sterling 71 Natural Gas - Crude Oil Relationship 73 UNG ETF Performance Relative to the Natural Gas Price 74 Oil Price Inflationary Mega-Trend 77 Peak Oil 77 Crude Oil Technical's and Forecast 78 Stocks Stealth Bull Market 82 2009 The Year of the Stocks Stealth Bull Market 82 Economic Forecasts Applied to the Stock Market 88 Stock Market Mega-Inflationary Trend 89 Market Manipulation 90 Stock Market Crash Again? 90 Technical Analysis 91 Stock Market 2010 Trend Forecast Conclusion 92 Stocks and Sectors Investing 93 Dividends Value Investing Strategy 93 Heathcare Sector 95 Metals and Mining Sector 96 Oil and Gas Sector 96 Technology Sector 97 Water Utilities Sector 99 Disclaimer of Holdings 99 UK General Election 2010 100 UK Housing Bear Market Election Bounce 101 About the Author 102
INTRODUCTION
The worlds economies swim in an ocean of inflation that is punctuated by occasional ripples of deflation which is illustrated bythe perpetual upward curve of general prices as measured by the Consumer Price Index (CPI). Inflation in the long-run impactson virtually all commodities and asset prices. The Inflation Mega-Trend ebook contains in-depth analysis for the aim ofgenerating accurate forecast trends for Inflation, Interest rates and the Economy for 2010 and beyond, the implications of whichhave been further applied towards generating key financial market and investment trend projections.
The primary purpose for generating the analysis and investment conclusions contained within this ebook is to arrive at asaccurate as possible conclusions for the target of enabling me to make definitive and conclusive long-term investment decisionsfor the management of my own investment portfolio. Analysis which I choose to freely share in an easily accessible anddistributable pdf format. Therefore as you read this ebook, please do bear in mind that I am a trader / investor, not a journalist /writer, so yes, I will have made some grammatical errors that I seek your forgiveness for in advance.
The economic analysis in this ebook was completed between 1st Nov 2009 and 13th January 2010. The implications of whichhas been applied to the financial markets and investment trends which was completed by the 30th of January 2010.
It is important that you are subscribed to my always free newsletter (http://www.marketoracle.info/?p=subscribe&id=1 - onlyrequirement is for a valid email address) to ensure that you get the latest updates, as at the end of the day all forecasts aremade on the basis of the probability of an outcome occurring which undoubtedly requires re-appraisal in the light of subsequentprice action.
The Inflation Mega-Trend Ebook is broken down into 4 chapters. Chapters 1, 2, and 3 deal with fundamentaleconomic analysis that builds towards the Inflation-Mega-trend conclusions. Whilst the fundamental analysis is primarilyfocused on the UK Economy, however the conclusions are just as valid for all of the debt ridden western countries and evenapply towards the major emerging economies.
Chapter 4 takes the Inflation Mega-Trend conclusions and applies them to the financial and commodity markets wherefurther analysis develops into precise forecasts and investment trends for major markets. I had originally planned for this to bethe shortest chapter of the book, however it has grown to encompass half the ebook and thus could have become an ebook inits own right.
My next planned ebook is due to be completed by the end of April 2010, which will be an in-depth analysis of the UK HousingMarket that will conclude in a trend forecast into at least 2013, which follows on from the highly accurate UK housing marketanalysis of August 2007 that called for a 2 year bear market into August 2009 (UK Housing Market Crash of 2007 - 2008 andSteps to Protect Your Wealth ).
Your Inflation Mega-Trend investing analyst.
Nadeem Walayat 31st Jan 2010
The Inflation Mega-Trend Page 1
http://www.marketoracle.co.uk © 2010 Copyright Nadeem Walayat and Market Oracle Ltd

CHAPTER 1
UK INFLATION
The UK inflation analysis and forecast for 2010 and beyond is the first of three parts of in depth analysis that form the basis forthe inflation-mega-trend. The UK economy experienced real price deflation during 2009 as a consequence of economic andcommodity price collapse as measured by the Retail Prices Index (RPI), however the government's preferred measure, theConsumer Price Index (CPI) managed avoid price deflation, which will be the index that this analysis concentrates upon as theprimary measure for UK inflation and similarly for most other economies.
Inflation Forecast 2009
The UK Inflation forecast for 2009 (30 Dec 2008 - UK CPI Inflation, RPI Deflation Forecast 2009) proved remarkably accuratewith the road map contributing towards the generation of many accurate projections for subsequent trends throughout 2009 andnot least for UK savers that for those that followed my cue of fixing savings at rates of above 5% for 1 - 2 years would not havebeen burned by the subsequent crash in UK interest rates to pittance of as low as 0.1% on savings accounts across the bailedout banking sector and later for stock market investors that monetized on the stealth bull market that began in March 2009 thegenesis for which was in the preceding inflation analysis forecast.
Conclusion - UK Inflation Forecast 2009 The UK is heading for real deflation during 2009 as the below graph illustrates in that the RPI inflation measure isexpected to go negative and spike lower around June / July 2009 as the RPI is sensitive to falling mortgage interestrates. The CPI will also continue to fall sharply into May 2009, which is targeting a rate of just below 1%. However themore money the government borrows as the difference between spending and tax revenues then the greater will bethe eventual resulting inflation as there is no such thing as a free lunch, that will reverse many of the trends we haveobserved during the past 6 months and will continue to see during virtually all of 2009. However I am only expecting amild up tick in inflation late 2009 due to the deflationary nature of economic contraction.
The Inflation Mega-Trend Page 2
http://www.marketoracle.co.uk © 2010 Copyright Nadeem Walayat and Market Oracle Ltd
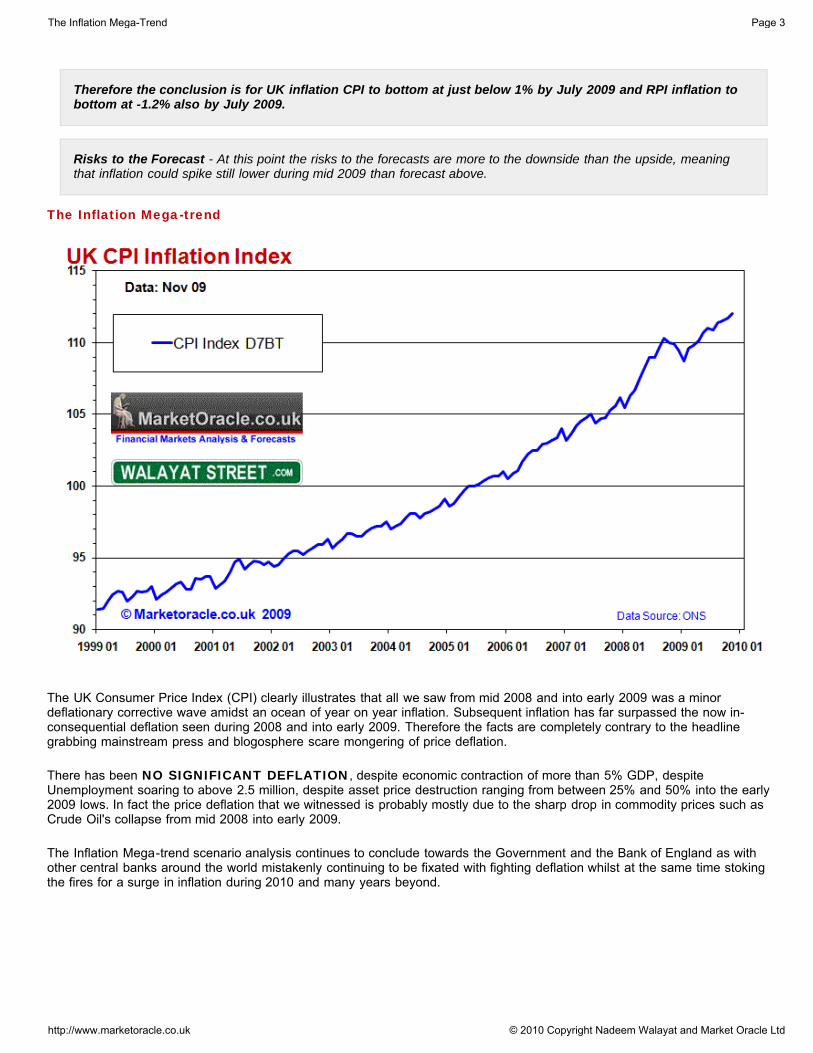
Therefore the conclusion is for UK inflation CPI to bottom at just below 1% by July 2009 and RPI inflation tobottom at -1.2% also by July 2009.
Risks to the Forecast - At this point the risks to the forecasts are more to the downside than the upside, meaningthat inflation could spike still lower during mid 2009 than forecast above.
The Inflation Mega-trend
The UK Consumer Price Index (CPI) clearly illustrates that all we saw from mid 2008 and into early 2009 was a minordeflationary corrective wave amidst an ocean of year on year inflation. Subsequent inflation has far surpassed the now in-consequential deflation seen during 2008 and into early 2009. Therefore the facts are completely contrary to the headlinegrabbing mainstream press and blogosphere scare mongering of price deflation.
There has been NO SIGNIFICANT DEFLATION, despite economic contraction of more than 5% GDP, despiteUnemployment soaring to above 2.5 million, despite asset price destruction ranging from between 25% and 50% into the early2009 lows. In fact the price deflation that we witnessed is probably mostly due to the sharp drop in commodity prices such asCrude Oil's collapse from mid 2008 into early 2009.
The Inflation Mega-trend scenario analysis continues to conclude towards the Government and the Bank of England as withother central banks around the world mistakenly continuing to be fixated with fighting deflation whilst at the same time stokingthe fires for a surge in inflation during 2010 and many years beyond.
The Inflation Mega-Trend Page 3
http://www.marketoracle.co.uk © 2010 Copyright Nadeem Walayat and Market Oracle Ltd

UK Retail Sales Signal Debt Fuelled Election Consumer Boom
The mainstream press and academic economists have been surprised by the most recent headline retail sales data thatshowed a decline of 0.3% against expectations of rise of 0.4% i.e.
BBC News 17th December - http://news.bbc.co.uk/1/hi/business/8417860.stm
UK retail sales fell in November, according to official figures, despite analysts' predictions of a rise.
The figures came as a surprise to many economists, who had hoped for consumer spending to fuel economicrecovery.
However I recognised the inaccuracy in the published retail sales data many years ago which prompted me to generate my ownretail sales data which more accurately reflects the condition of the high street then the official data which typically results in ahighly volatile retail sales series which feeds through into volatile mainstream headlines which are in most cases contrary towhat is actually taking place on Britains high streets as the below graph more clearly illustrates.
The Inflation Mega-Trend Page 4
http://www.marketoracle.co.uk © 2010 Copyright Nadeem Walayat and Market Oracle Ltd

The adjusted retail sales data clearly shows that UK retail sales act as a leading indicator for economic activity and inflationarypressures of as long as 6 months. Retail sales led the price deflation into mid 2009, and now are again acting as a leadingindicator for forward inflation and resurgent economic activity during the first half of 2010. The trend is extremely strong andcontinues to confirm the analysis of June 2009 that stated that Britain had embarked upon a debt fuelled economic recoveryinto a May 2010 General Election.
Very little of this strong retail sales trend is visible in any of the official or academic economic data that continues to look in therear view mirror of what is "old news". The actual trend shows that the Labour party has succeeded in igniting a debt fuelledelection consumer boom that will increasingly become apparent in mainstream press as we approach the May 2010 electiondeadline, but it is also indicative of a steep upward curve in UK inflation and we are talking about inflation hitting the upper endof the Bank of England's 1% to 3% CPI Band early during the first half of 2010 which politically suggests the UK GeneralElection may take place earlier than the consensus view for a May 2010 General Election.
M4 Money Supply Adjusted for the Velocity of Money
Whilst the mainstream press have been obsessed by headline M4 data throughout the past 12 months, however as I voiced inlast years inflation analysis and forecast that the key to interpreting money supply data is to look at M4 adjusted for the velocityof money that implied imminent extreme deflation that has come to pass -
UK Money supply M4 (blue) has risen sharply from the 10% targeted low of mid 2008 to the current level of 16.6%, onface value this is highly inflationary and has been taken by many economists and market commentators to suggestmuch higher forward inflation. However the money supply adjusted for the velocity of money which takes into accountthe state of the economy as a consequence of the credit freeze tells a completely different story. The UK economy isnow in extreme real monetary deflation of approaching -5%. The leading indicator of the implied money supply, issuggesting recent deep interest rate cuts of Novembers 1.5% and Decembers further 1% cut will lift future moneysupply growth out of extreme deflation, however it will still be far from supporting the levels north of 15% whichaccurately forecast forward inflation during 2008.
The Inflation Mega-Trend Page 5
http://www.marketoracle.co.uk © 2010 Copyright Nadeem Walayat and Market Oracle Ltd
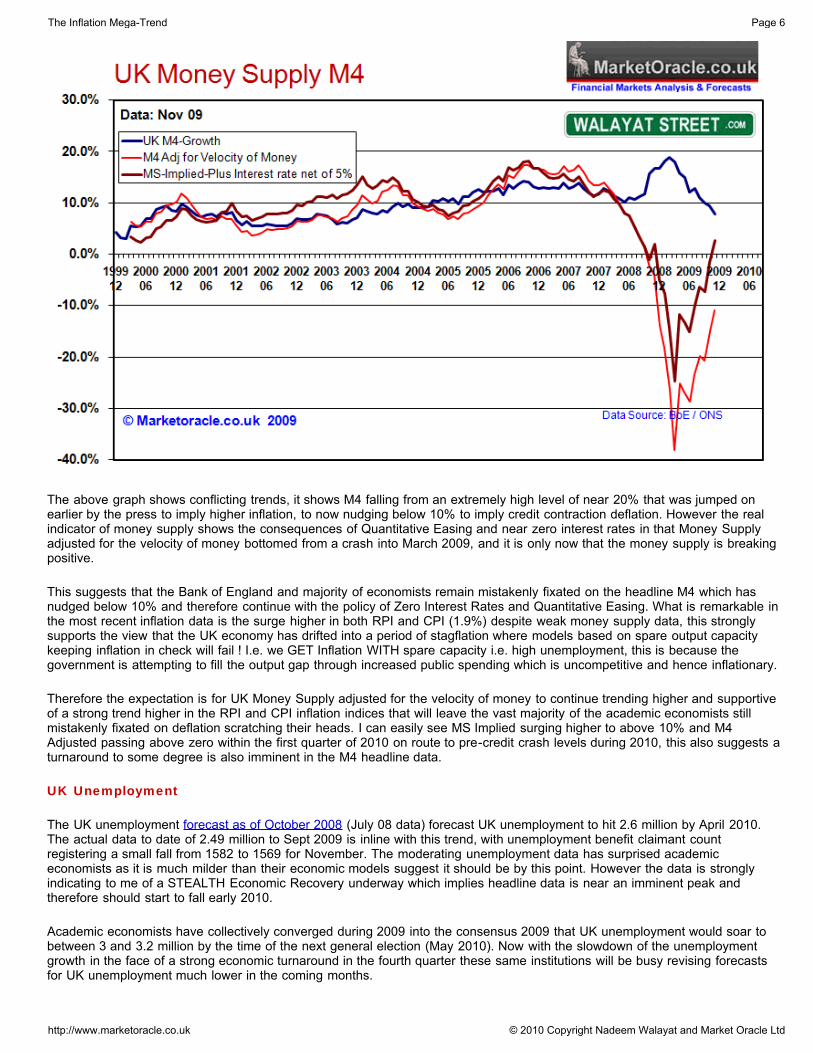
The above graph shows conflicting trends, it shows M4 falling from an extremely high level of near 20% that was jumped onearlier by the press to imply higher inflation, to now nudging below 10% to imply credit contraction deflation. However the realindicator of money supply shows the consequences of Quantitative Easing and near zero interest rates in that Money Supplyadjusted for the velocity of money bottomed from a crash into March 2009, and it is only now that the money supply is breakingpositive.
This suggests that the Bank of England and majority of economists remain mistakenly fixated on the headline M4 which hasnudged below 10% and therefore continue with the policy of Zero Interest Rates and Quantitative Easing. What is remarkable inthe most recent inflation data is the surge higher in both RPI and CPI (1.9%) despite weak money supply data, this stronglysupports the view that the UK economy has drifted into a period of stagflation where models based on spare output capacitykeeping inflation in check will fail ! I.e. we GET Inflation WITH spare capacity i.e. high unemployment, this is because thegovernment is attempting to fill the output gap through increased public spending which is uncompetitive and hence inflationary.
Therefore the expectation is for UK Money Supply adjusted for the velocity of money to continue trending higher and supportiveof a strong trend higher in the RPI and CPI inflation indices that will leave the vast majority of the academic economists stillmistakenly fixated on deflation scratching their heads. I can easily see MS Implied surging higher to above 10% and M4Adjusted passing above zero within the first quarter of 2010 on route to pre-credit crash levels during 2010, this also suggests aturnaround to some degree is also imminent in the M4 headline data.
UK Unemployment
The UK unemployment forecast as of October 2008 (July 08 data) forecast UK unemployment to hit 2.6 million by April 2010.The actual data to date of 2.49 million to Sept 2009 is inline with this trend, with unemployment benefit claimant countregistering a small fall from 1582 to 1569 for November. The moderating unemployment data has surprised academiceconomists as it is much milder than their economic models suggest it should be by this point. However the data is stronglyindicating to me of a STEALTH Economic Recovery underway which implies headline data is near an imminent peak andtherefore should start to fall early 2010.
Academic economists have collectively converged during 2009 into the consensus 2009 that UK unemployment would soar tobetween 3 and 3.2 million by the time of the next general election (May 2010). Now with the slowdown of the unemploymentgrowth in the face of a strong economic turnaround in the fourth quarter these same institutions will be busy revising forecastsfor UK unemployment much lower in the coming months.
The Inflation Mega-Trend Page 6
http://www.marketoracle.co.uk © 2010 Copyright Nadeem Walayat and Market Oracle Ltd
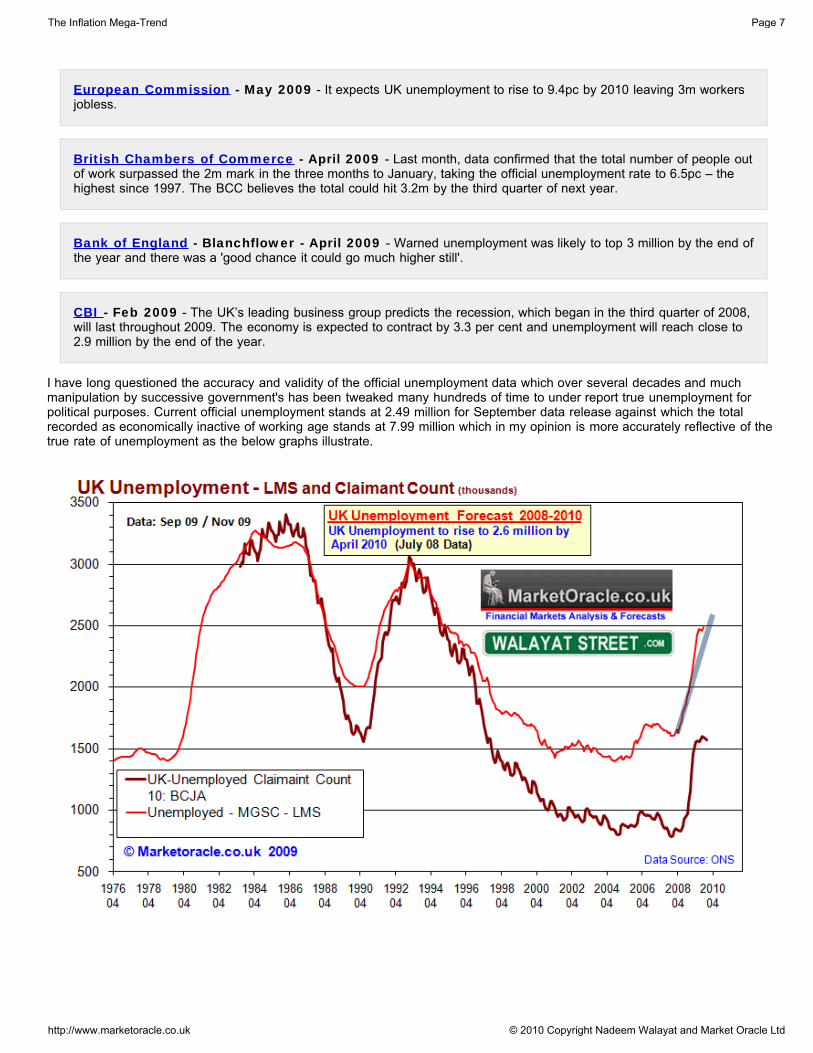
European Commission - May 2009 - It expects UK unemployment to rise to 9.4pc by 2010 leaving 3m workersjobless.
British Chambers of Commerce - April 2009 - Last month, data confirmed that the total number of people outof work surpassed the 2m mark in the three months to January, taking the official unemployment rate to 6.5pc – thehighest since 1997. The BCC believes the total could hit 3.2m by the third quarter of next year.
Bank of England - Blanchflower - April 2009 - Warned unemployment was likely to top 3 million by the end ofthe year and there was a 'good chance it could go much higher still'.
CBI - Feb 2009 - The UK’s leading business group predicts the recession, which began in the third quarter of 2008,will last throughout 2009. The economy is expected to contract by 3.3 per cent and unemployment will reach close to2.9 million by the end of the year.
I have long questioned the accuracy and validity of the official unemployment data which over several decades and muchmanipulation by successive government's has been tweaked many hundreds of time to under report true unemployment forpolitical purposes. Current official unemployment stands at 2.49 million for September data release against which the totalrecorded as economically inactive of working age stands at 7.99 million which in my opinion is more accurately reflective of thetrue rate of unemployment as the below graphs illustrate.
The Inflation Mega-Trend Page 7
http://www.marketoracle.co.uk © 2010 Copyright Nadeem Walayat and Market Oracle Ltd
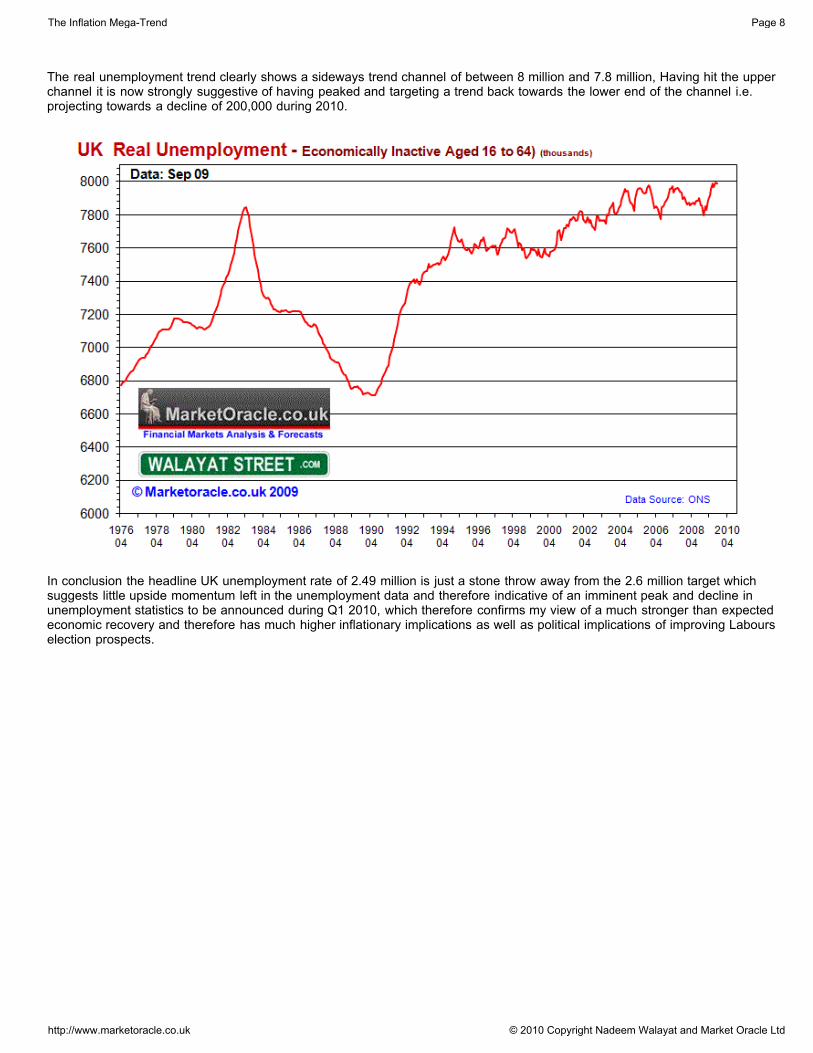
The real unemployment trend clearly shows a sideways trend channel of between 8 million and 7.8 million, Having hit the upperchannel it is now strongly suggestive of having peaked and targeting a trend back towards the lower end of the channel i.e.projecting towards a decline of 200,000 during 2010.
In conclusion the headline UK unemployment rate of 2.49 million is just a stone throw away from the 2.6 million target whichsuggests little upside momentum left in the unemployment data and therefore indicative of an imminent peak and decline inunemployment statistics to be announced during Q1 2010, which therefore confirms my view of a much stronger than expectedeconomic recovery and therefore has much higher inflationary implications as well as political implications of improving Labourselection prospects.
The Inflation Mega-Trend Page 8
http://www.marketoracle.co.uk © 2010 Copyright Nadeem Walayat and Market Oracle Ltd

Debt Fuelled Economic Recovery Heading for Double Dip Recession?
UK GDP for the 3rd Quarter was revised marginally higher to minus 0.2% from the earlier ONS estimate of minus 0.3%. Theyear has witnessed 'think tanks' and academic institutions flailing in all directions as optimistic forecasts of earlier in the yearproceeded to be continuously revised lower in terms of economic contraction and then by late summer in advance of thirdquarter GDP data starting to anticipate an economic recovery in the third quarter with consensus for a 0.3% growth which failedto materialise.
The GDP trend for the UK economy has been accurately mapped out in the in depth analysis and forecast of 17th February2009 (UK Recession Watch- Britain's Great Depression?), that both called for severe peak to trough economic contraction of -6.3% at a time when the likes of the UK Treasury were forecasting contraction of less than half at -3%. The analysis alsoconcluded in a strong debt fuelled economic recovery during 2010 to coincide with a summer 2010 General Election. As of therevised ONS GDP data (ABMI Chain linked at Market Prices) total peak to trough contraction is now 6.23% virtually exactlyinline with the forecast for -6.3%. Annualised contraction for the third quarter is at -4.56% with trend on target for -4.75% for thefourth quarter.
The UK economy remains on track to bounce back strongly during 2010, as indicated by June's in depth analysis, however thiseconomic recovery is based largely on debt as shown by the graph below, as the Labour government's strategy appears to beto deliver the next Conservative government a scorched earth economy.
The Inflation Mega-Trend Page 9
http://www.marketoracle.co.uk © 2010 Copyright Nadeem Walayat and Market Oracle Ltd
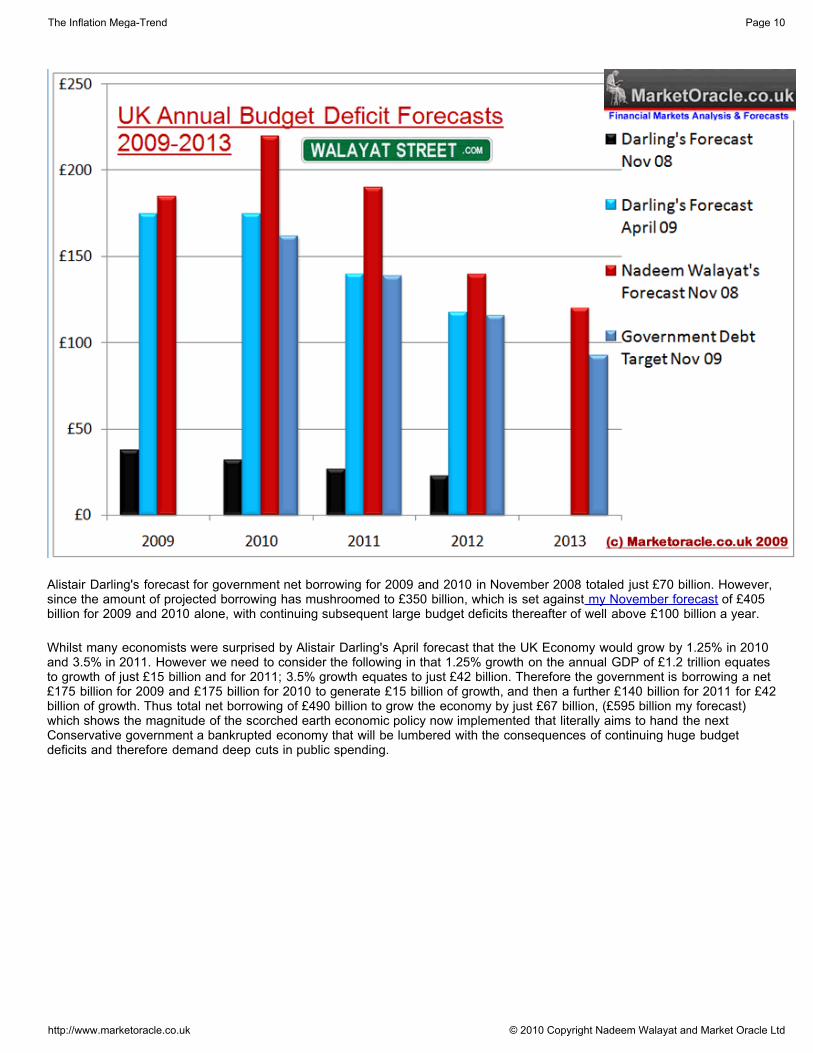
Alistair Darling's forecast for government net borrowing for 2009 and 2010 in November 2008 totaled just £70 billion. However,since the amount of projected borrowing has mushroomed to £350 billion, which is set against my November forecast of £405billion for 2009 and 2010 alone, with continuing subsequent large budget deficits thereafter of well above £100 billion a year.
Whilst many economists were surprised by Alistair Darling's April forecast that the UK Economy would grow by 1.25% in 2010and 3.5% in 2011. However we need to consider the following in that 1.25% growth on the annual GDP of £1.2 trillion equatesto growth of just £15 billion and for 2011; 3.5% growth equates to just £42 billion. Therefore the government is borrowing a net£175 billion for 2009 and £175 billion for 2010 to generate £15 billion of growth, and then a further £140 billion for 2011 for £42billion of growth. Thus total net borrowing of £490 billion to grow the economy by just £67 billion, (£595 billion my forecast)which shows the magnitude of the scorched earth economic policy now implemented that literally aims to hand the nextConservative government a bankrupted economy that will be lumbered with the consequences of continuing huge budgetdeficits and therefore demand deep cuts in public spending.
The Inflation Mega-Trend Page 10
http://www.marketoracle.co.uk © 2010 Copyright Nadeem Walayat and Market Oracle Ltd
Debt and Liabilities
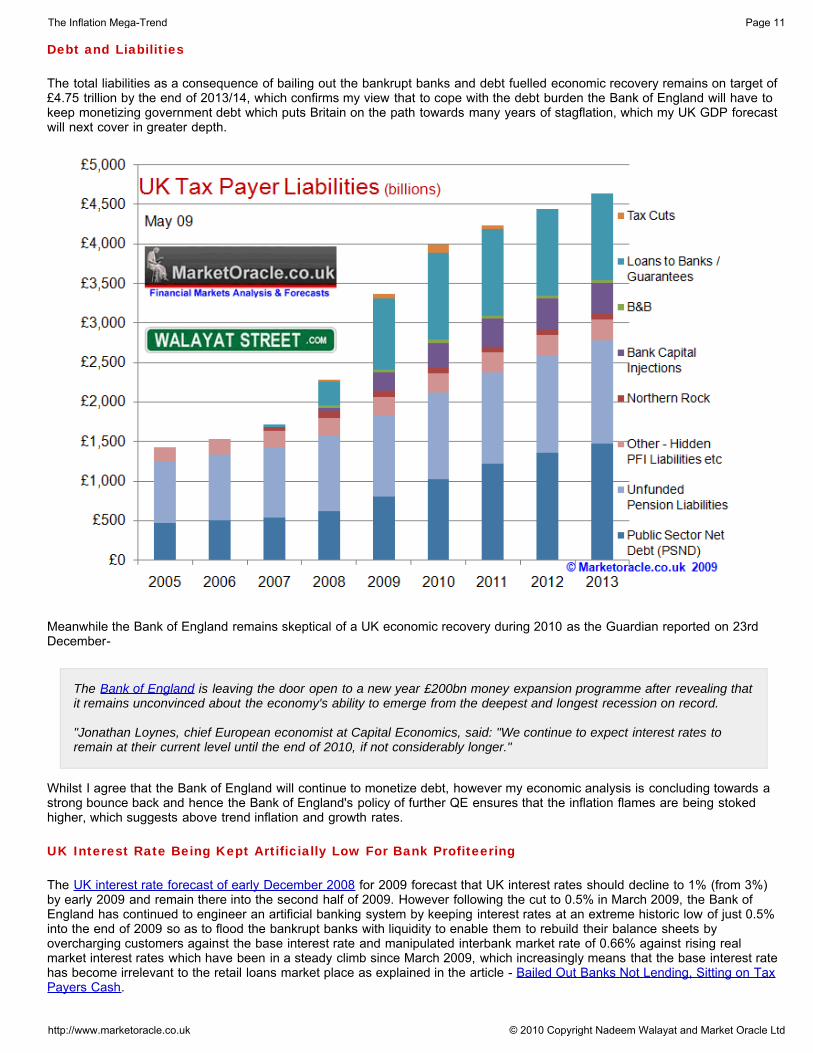
The total liabilities as a consequence of bailing out the bankrupt banks and debt fuelled economic recovery remains on target of£4.75 trillion by the end of 2013/14, which confirms my view that to cope with the debt burden the Bank of England will have tokeep monetizing government debt which puts Britain on the path towards many years of stagflation, which my UK GDP forecastwill next cover in greater depth.
Meanwhile the Bank of England remains skeptical of a UK economic recovery during 2010 as the Guardian reported on 23rdDecember-
The Bank of England is leaving the door open to a new year £200bn money expansion programme after revealing thatit remains unconvinced about the economy's ability to emerge from the deepest and longest recession on record.
"Jonathan Loynes, chief European economist at Capital Economics, said: "We continue to expect interest rates toremain at their current level until the end of 2010, if not considerably longer."
Whilst I agree that the Bank of England will continue to monetize debt, however my economic analysis is concluding towards astrong bounce back and hence the Bank of England's policy of further QE ensures that the inflation flames are being stokedhigher, which suggests above trend inflation and growth rates.
UK Interest Rate Being Kept Artificially Low For Bank Profiteering
The UK interest rate forecast of early December 2008 for 2009 forecast that UK interest rates should decline to 1% (from 3%)by early 2009 and remain there into the second half of 2009. However following the cut to 0.5% in March 2009, the Bank ofEngland has continued to engineer an artificial banking system by keeping interest rates at an extreme historic low of just 0.5%into the end of 2009 so as to flood the bankrupt banks with liquidity to enable them to rebuild their balance sheets byovercharging customers against the base interest rate and manipulated interbank market rate of 0.66% against rising realmarket interest rates which have been in a steady climb since March 2009, which increasingly means that the base interest ratehas become irrelevant to the retail loans market place as explained in the article - Bailed Out Banks Not Lending, Sitting on TaxPayers Cash.
The Inflation Mega-Trend Page 11
http://www.marketoracle.co.uk © 2010 Copyright Nadeem Walayat and Market Oracle Ltd
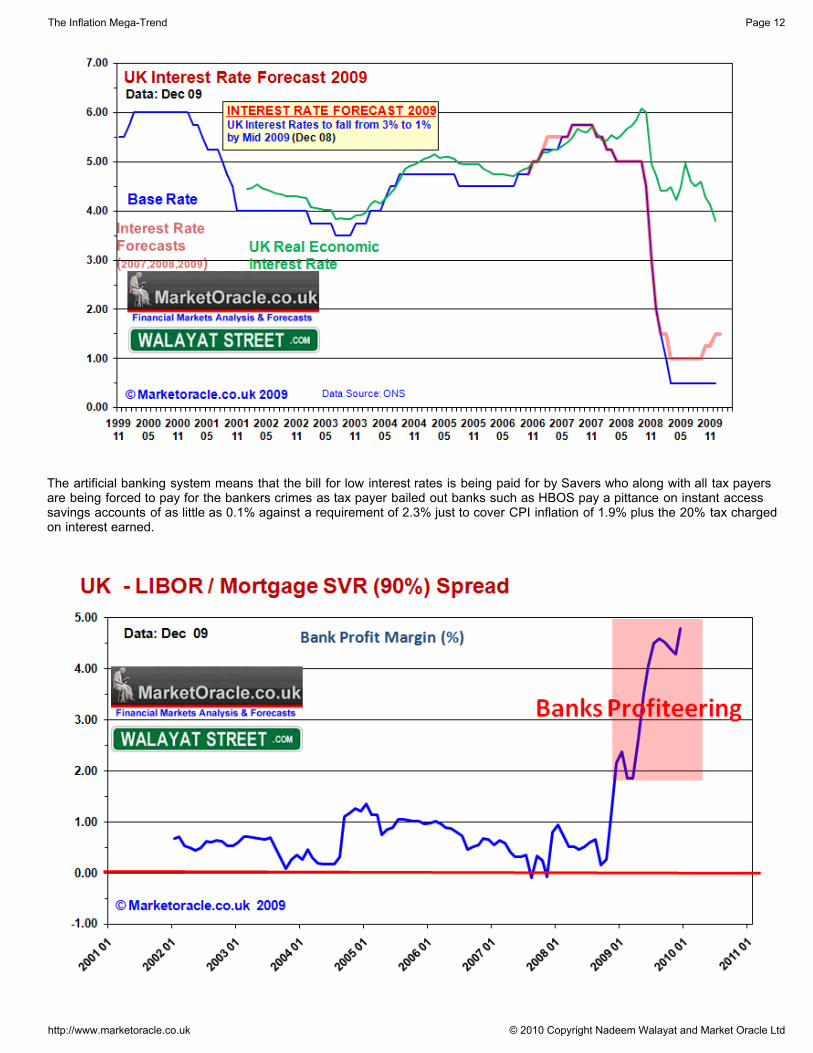
The artificial banking system means that the bill for low interest rates is being paid for by Savers who along with all tax payersare being forced to pay for the bankers crimes as tax payer bailed out banks such as HBOS pay a pittance on instant accesssavings accounts of as little as 0.1% against a requirement of 2.3% just to cover CPI inflation of 1.9% plus the 20% tax chargedon interest earned.
The Inflation Mega-Trend Page 12
http://www.marketoracle.co.uk © 2010 Copyright Nadeem Walayat and Market Oracle Ltd
Money is being sucked out of the pockets of savers and being deposited onto the balance sheet of bailed out banks that haveno incentive to pay a decent rate of interest when they can borrow at 0.5% from the Bank of England and marginally higher fromother UK banks. The artificial banking system is resulting in unprecedented huge profit margins for the banks as market interestrates charged to retail customers continue to rise regardless of the base rate being held at 0.5% well into 2010 which isinflationary in terms of rising mortgage and other debt interest costs as these rising costs will show up to varying degrees in theRPI and CPI inflation indices.
UK House Prices Continue 2010 Government Debt Fuelled Election Bounce
The UK housing market bottomed in March / April 2009 which was recognised in the May analysis and has since continued thedebt fuelled bounce as a consequence of money printing and zero interest rates as the Labour government has succeeded ininflating the UK economy out of recession in time for the 2010 General Election.
As is the case with virtually all market junctures, back in March of this year the Telegraph and other mainstream media ran witha scare story that UK house prices could crash by a FURTHER 55%, this was after UK house prices had already fallen by 22%and whilst house prices had yet to bottom the Telegraph story at the time seemed to be a completely ridiculous scaremongering purely for the purpose of sensational headline grabbing rather than presenting something that their readers couldutilise to their advantage.
12th March 2009 - Telegraph Runs with Improbable UK House Price Crash Forecast of Another 55%
The mainstream press as illustrated by The Telegraph has run with a house price forecast by Numis Securities (NS)that states that UK house prices could fall by a further whopping 55%, that is a rather incredible forecast to make inlight of the of 22% fall to date. NS states that a buy to let investor panic will trigger an avalanche of further selling. Iam not aware of Numis Securities past forecasts, however analysis of the perma-bear Capital Economics that hasconsistently been cropping up with bearish house price forecasts since at least 2002 in the mainstream mediaillustrated the propensity to reprint press releases with-out checking the facts as to whether the forecast is actuallyprobable or not.
The Telegraph wrote: House prices 'could fall by further 55 per cent
"People who bought buy-to-let flats are expected to “begin panic selling” and the average home value could dropbelow £100,000."
“Despite UK house prices already having fallen 21% from the peak, we do not believe that the correction is anywherenear over.
“Our core headline forecast is that UK property prices remain between 17% and 39% overvalued based on fairvaluation. Moreover, history has shown us that when property…which has experienced a price bubble corrects, theprice tends to fall below fair value for a period of time, as confidence in that market remains low. Prices could fall afurther 40-55% if the over-correction was as bad as the early 1990s in our view.”
Subsequently, UK house prices bottomed in April / May 2009 and have embarked upon a debt fuelled bounce into a May 2010General Election that has already seen UK house prices RISE by more than 7% from the April / May low rather than to CRASHtoward another 55% drop.
Whilst many are focused on the headline unemployment data, however back in August 2009 in the analysis (UK House PricesTracking Claimant Count Rather than Unemployment Numbers), the conclusion was that the focus should remain on claimantcount rather than the headline unemployment rate, in this regard the claimant count is turning positive in the most recent dataand is therefore supportive of a continuation of the trend higher in UK house prices.
The Inflation Mega-Trend Page 13
http://www.marketoracle.co.uk © 2010 Copyright Nadeem Walayat and Market Oracle Ltd
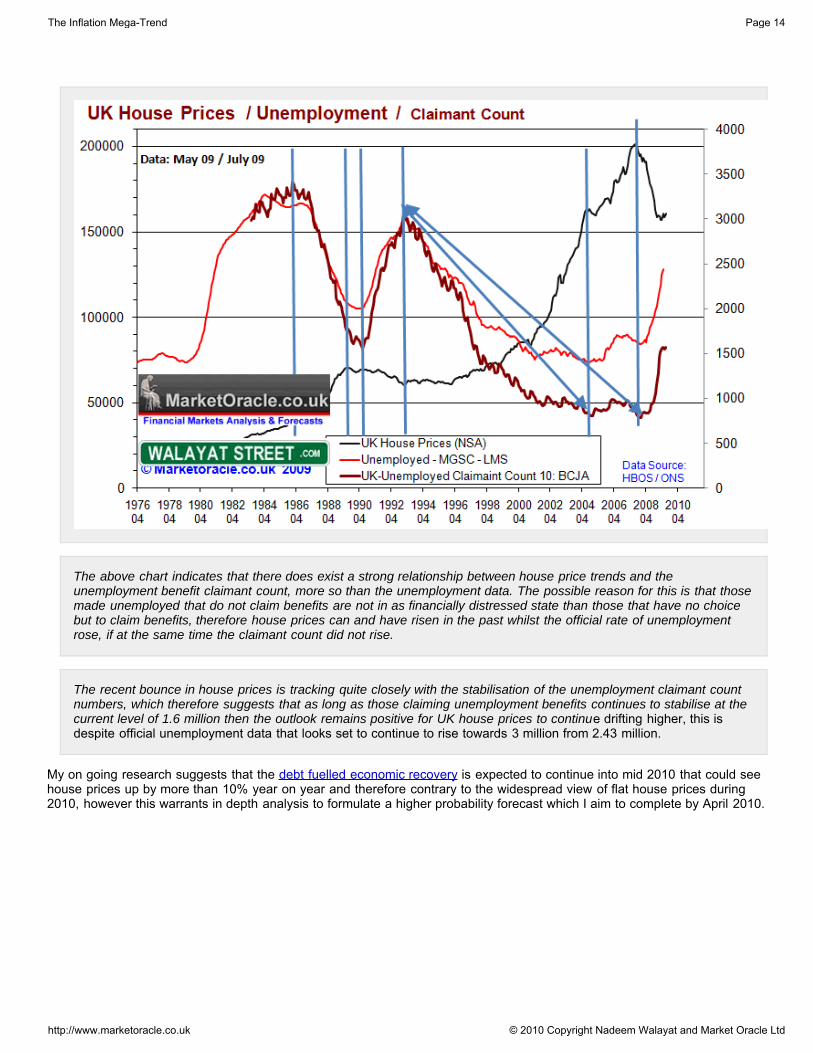
The above chart indicates that there does exist a strong relationship between house price trends and theunemployment benefit claimant count, more so than the unemployment data. The possible reason for this is that thosemade unemployed that do not claim benefits are not in as financially distressed state than those that have no choicebut to claim benefits, therefore house prices can and have risen in the past whilst the official rate of unemploymentrose, if at the same time the claimant count did not rise.
The recent bounce in house prices is tracking quite closely with the stabilisation of the unemployment claimant countnumbers, which therefore suggests that as long as those claiming unemployment benefits continues to stabilise at thecurrent level of 1.6 million then the outlook remains positive for UK house prices to continue drifting higher, this isdespite official unemployment data that looks set to continue to rise towards 3 million from 2.43 million.
My on going research suggests that the debt fuelled economic recovery is expected to continue into mid 2010 that could seehouse prices up by more than 10% year on year and therefore contrary to the widespread view of flat house prices during2010, however this warrants in depth analysis to formulate a higher probability forecast which I aim to complete by April 2010.
The Inflation Mega-Trend Page 14
http://www.marketoracle.co.uk © 2010 Copyright Nadeem Walayat and Market Oracle Ltd
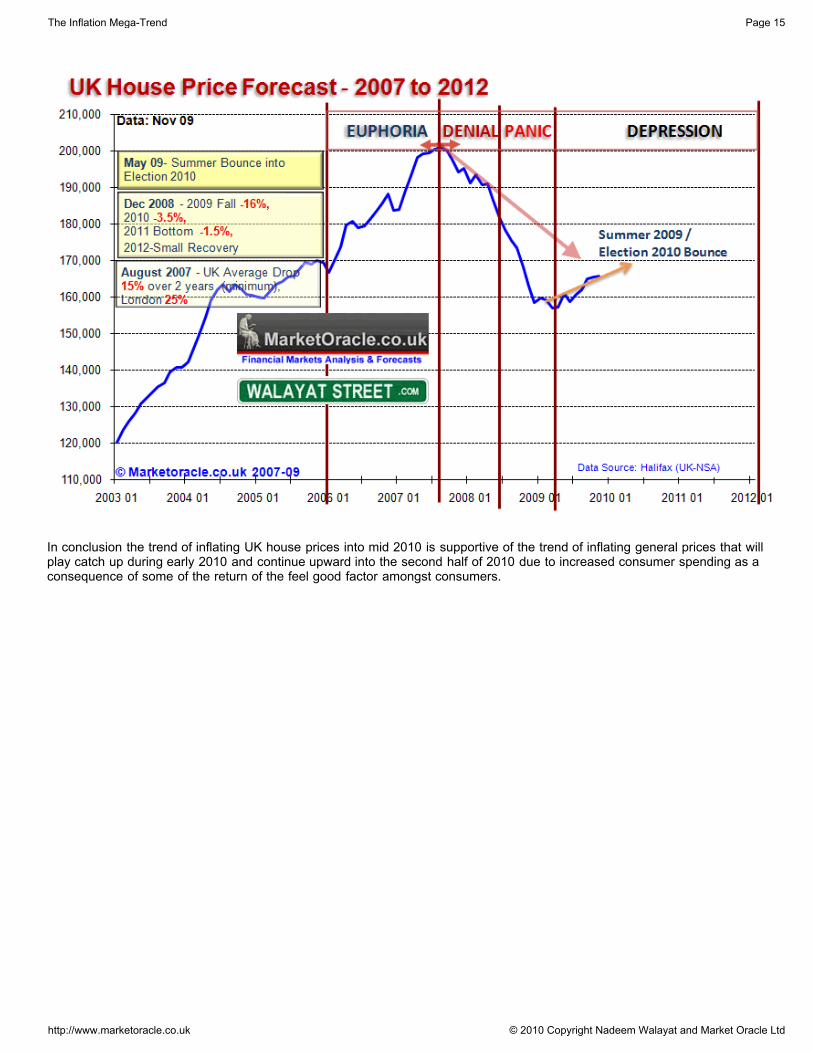
In conclusion the trend of inflating UK house prices into mid 2010 is supportive of the trend of inflating general prices that willplay catch up during early 2010 and continue upward into the second half of 2010 due to increased consumer spending as aconsequence of some of the return of the feel good factor amongst consumers.
The Inflation Mega-Trend Page 15
http://www.marketoracle.co.uk © 2010 Copyright Nadeem Walayat and Market Oracle Ltd
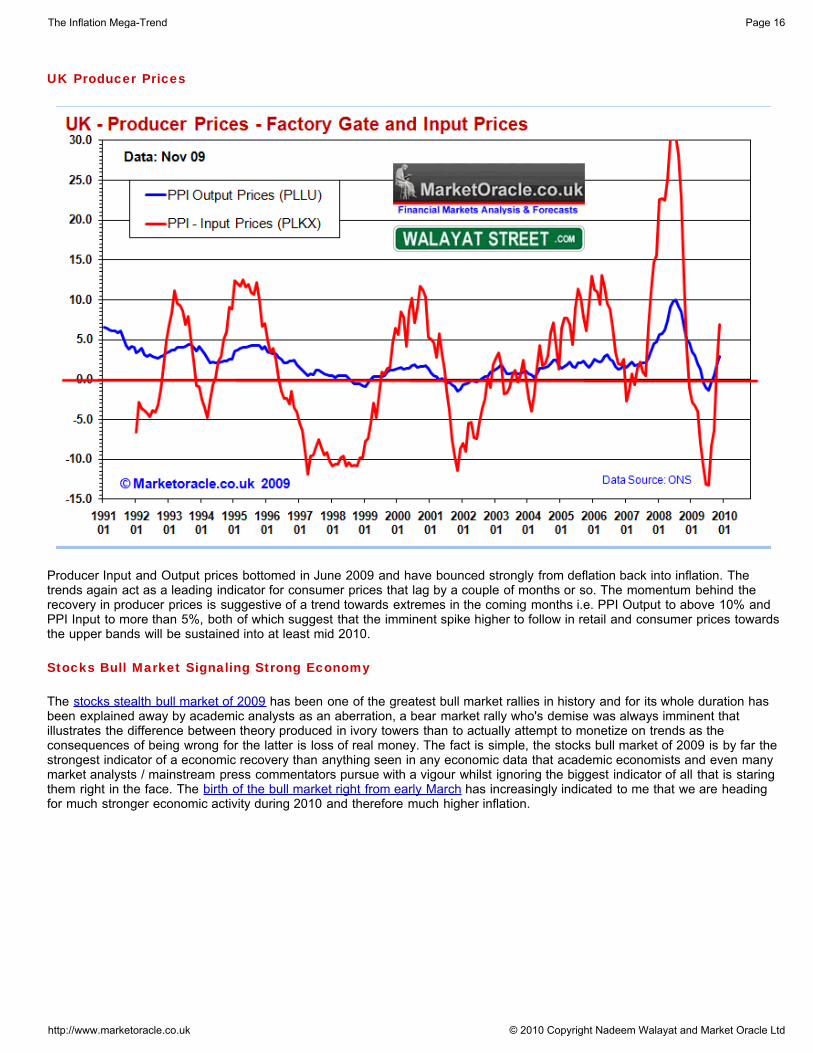
UK Producer Prices
Producer Input and Output prices bottomed in June 2009 and have bounced strongly from deflation back into inflation. Thetrends again act as a leading indicator for consumer prices that lag by a couple of months or so. The momentum behind therecovery in producer prices is suggestive of a trend towards extremes in the coming months i.e. PPI Output to above 10% andPPI Input to more than 5%, both of which suggest that the imminent spike higher to follow in retail and consumer prices towardsthe upper bands will be sustained into at least mid 2010.
Stocks Bull Market Signaling Strong Economy
The stocks stealth bull market of 2009 has been one of the greatest bull market rallies in history and for its whole duration hasbeen explained away by academic analysts as an aberration, a bear market rally who's demise was always imminent thatillustrates the difference between theory produced in ivory towers than to actually attempt to monetize on trends as theconsequences of being wrong for the latter is loss of real money. The fact is simple, the stocks bull market of 2009 is by far thestrongest indicator of a economic recovery than anything seen in any economic data that academic economists and even manymarket analysts / mainstream press commentators pursue with a vigour whilst ignoring the biggest indicator of all that is staringthem right in the face. The birth of the bull market right from early March has increasingly indicated to me that we are headingfor much stronger economic activity during 2010 and therefore much higher inflation.
The Inflation Mega-Trend Page 16
http://www.marketoracle.co.uk © 2010 Copyright Nadeem Walayat and Market Oracle Ltd
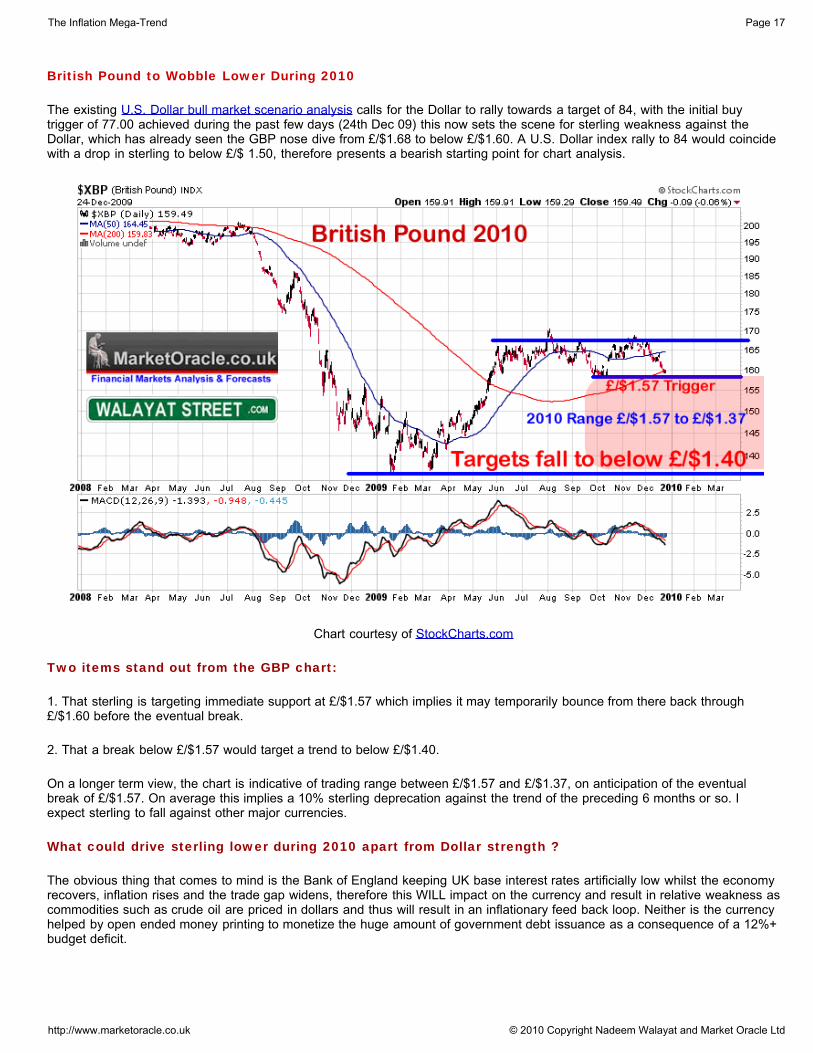
British Pound to Wobble Lower During 2010
The existing U.S. Dollar bull market scenario analysis calls for the Dollar to rally towards a target of 84, with the initial buytrigger of 77.00 achieved during the past few days (24th Dec 09) this now sets the scene for sterling weakness against theDollar, which has already seen the GBP nose dive from £/$1.68 to below £/$1.60. A U.S. Dollar index rally to 84 would coincidewith a drop in sterling to below £/$ 1.50, therefore presents a bearish starting point for chart analysis.
Chart courtesy of StockCharts.com
Two items stand out from the GBP chart:
1. That sterling is targeting immediate support at £/$1.57 which implies it may temporarily bounce from there back through£/$1.60 before the eventual break.
2. That a break below £/$1.57 would target a trend to below £/$1.40.
On a longer term view, the chart is indicative of trading range between £/$1.57 and £/$1.37, on anticipation of the eventualbreak of £/$1.57. On average this implies a 10% sterling deprecation against the trend of the preceding 6 months or so. Iexpect sterling to fall against other major currencies.
What could drive sterling lower during 2010 apart from Dollar strength ?
The obvious thing that comes to mind is the Bank of England keeping UK base interest rates artificially low whilst the economyrecovers, inflation rises and the trade gap widens, therefore this WILL impact on the currency and result in relative weakness ascommodities such as crude oil are priced in dollars and thus will result in an inflationary feed back loop. Neither is the currencyhelped by open ended money printing to monetize the huge amount of government debt issuance as a consequence of a 12%+budget deficit.
The Inflation Mega-Trend Page 17
http://www.marketoracle.co.uk © 2010 Copyright Nadeem Walayat and Market Oracle Ltd
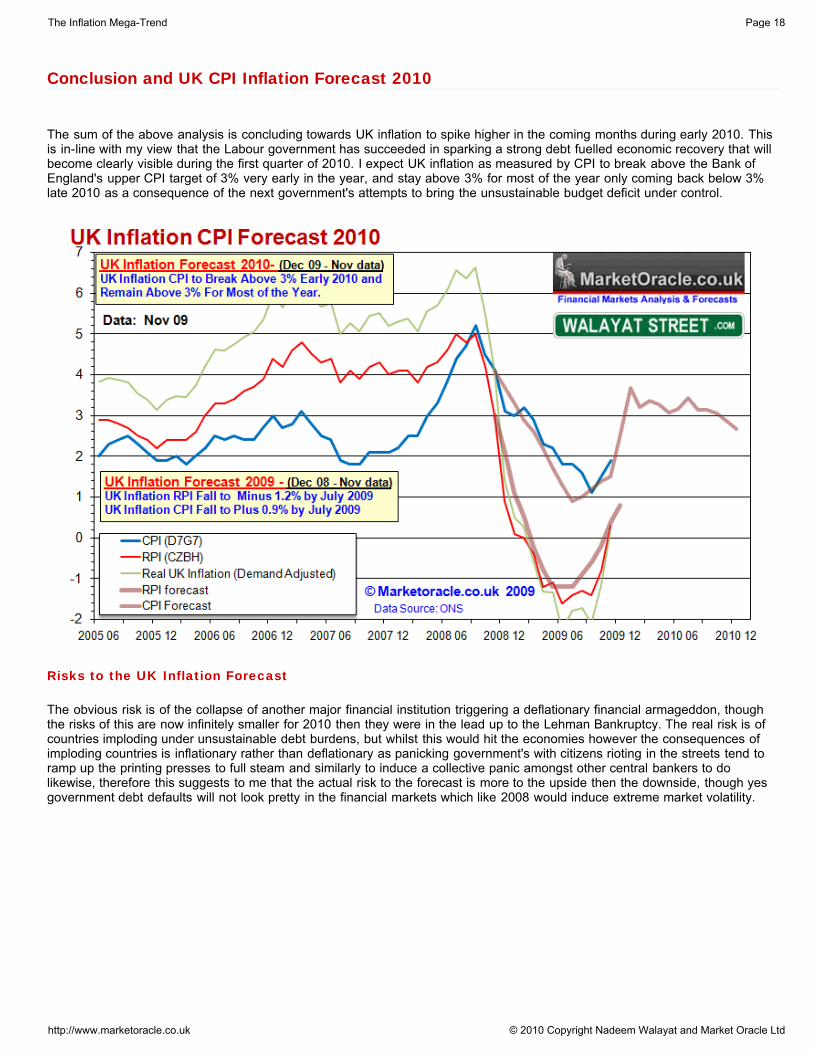
Conclusion and UK CPI Inflation Forecast 2010
The sum of the above analysis is concluding towards UK inflation to spike higher in the coming months during early 2010. Thisis in-line with my view that the Labour government has succeeded in sparking a strong debt fuelled economic recovery that willbecome clearly visible during the first quarter of 2010. I expect UK inflation as measured by CPI to break above the Bank ofEngland's upper CPI target of 3% very early in the year, and stay above 3% for most of the year only coming back below 3%late 2010 as a consequence of the next government's attempts to bring the unsustainable budget deficit under control.
Risks to the UK Inflation Forecast
The obvious risk is of the collapse of another major financial institution triggering a deflationary financial armageddon, thoughthe risks of this are now infinitely smaller for 2010 then they were in the lead up to the Lehman Bankruptcy. The real risk is ofcountries imploding under unsustainable debt burdens, but whilst this would hit the economies however the consequences ofimploding countries is inflationary rather than deflationary as panicking government's with citizens rioting in the streets tend toramp up the printing presses to full steam and similarly to induce a collective panic amongst other central bankers to dolikewise, therefore this suggests to me that the actual risk to the forecast is more to the upside then the downside, though yesgovernment debt defaults will not look pretty in the financial markets which like 2008 would induce extreme market volatility.
The Inflation Mega-Trend Page 18
http://www.marketoracle.co.uk © 2010 Copyright Nadeem Walayat and Market Oracle Ltd
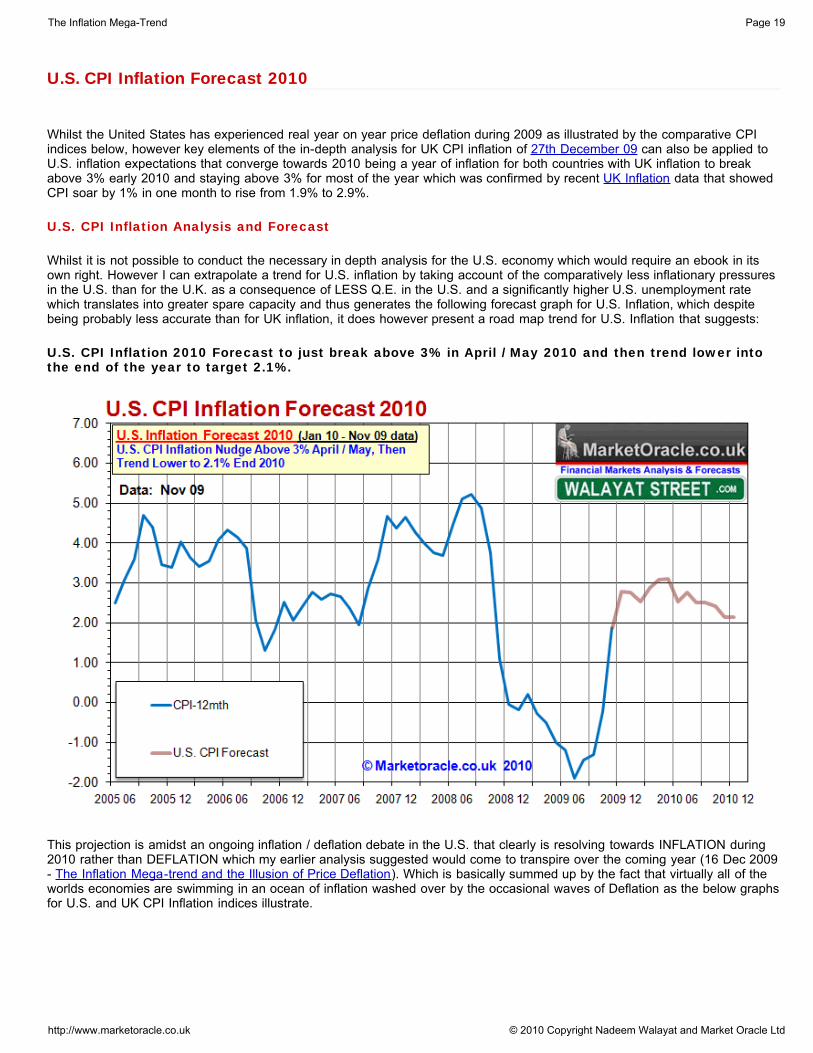
U.S. CPI Inflation Forecast 2010
Whilst the United States has experienced real year on year price deflation during 2009 as illustrated by the comparative CPIindices below, however key elements of the in-depth analysis for UK CPI inflation of 27th December 09 can also be applied toU.S. inflation expectations that converge towards 2010 being a year of inflation for both countries with UK inflation to breakabove 3% early 2010 and staying above 3% for most of the year which was confirmed by recent UK Inflation data that showedCPI soar by 1% in one month to rise from 1.9% to 2.9%.
U.S. CPI Inflation Analysis and Forecast
Whilst it is not possible to conduct the necessary in depth analysis for the U.S. economy which would require an ebook in itsown right. However I can extrapolate a trend for U.S. inflation by taking account of the comparatively less inflationary pressuresin the U.S. than for the U.K. as a consequence of LESS Q.E. in the U.S. and a significantly higher U.S. unemployment ratewhich translates into greater spare capacity and thus generates the following forecast graph for U.S. Inflation, which despitebeing probably less accurate than for UK inflation, it does however present a road map trend for U.S. Inflation that suggests:
U.S. CPI Inflation 2010 Forecast to just break above 3% in April / May 2010 and then trend lower intothe end of the year to target 2.1%.
This projection is amidst an ongoing inflation / deflation debate in the U.S. that clearly is resolving towards INFLATION during2010 rather than DEFLATION which my earlier analysis suggested would come to transpire over the coming year (16 Dec 2009- The Inflation Mega-trend and the Illusion of Price Deflation). Which is basically summed up by the fact that virtually all of theworlds economies are swimming in an ocean of inflation washed over by the occasional waves of Deflation as the below graphsfor U.S. and UK CPI Inflation indices illustrate.
The Inflation Mega-Trend Page 19
http://www.marketoracle.co.uk © 2010 Copyright Nadeem Walayat and Market Oracle Ltd

It will be interesting to see how the deflationists explain away real year on year CPI inflation over the coming 12 months.
The Inflation Mega-Trend Page 20
http://www.marketoracle.co.uk © 2010 Copyright Nadeem Walayat and Market Oracle Ltd

CHAPTER 2
UK ECONOMY
UK GDP Forecast 2009 - Britain's Great Depression
Britains Great Depression is expected to have ended in the third quarter of 2009, the trend for which has been accuratelymapped out in the in depth analysis and forecast of 17th February 2009 (UK Recession Watch- Britain's Great Depression),that called for both a severe peak to trough economic contraction of -6.3% for 2009 at a time when the likes of the UK Treasurywere forecasting contraction of less than half at -3%. The analysis also concluded in a strong debt fuelled economic recoveryfor 2010 to coincide with a summer 2010 General Election. As of the revised ONS GDP data (ABMI Chain linked at MarketPrices) total peak to trough contraction is now 6.23% virtually exactly inline with the forecast for -6.3%. Annualised contractionfor the third quarter is at -4.56% with trend on target for -4.75% for the fourth quarter.
UK Recession Projection / Forecast Conclusion
In the final analysis, the projected course of the recession over the next 2 years is as illustrated by the below graph inthat the severe recession is expected to bottom at an annualised rate of -4.75% GDP in the fourth quarter of 2009(small quarterly gain on the 3rd quarter), which will be followed by a recovery as the rate of annualised GDPcontraction improves as government stimulus measures announced to date and deep interest rate cuts as well asfuture stimulus during 2009 kick into gear. The UK economic recovery is expected to continue into the fourth quarter of2010 i.e. after the general election. The total recession from peak to trough is expected to see GDP contract by 6.3%and therefore this will be the worst recession since the 1930's Great Depression.
Therefore this analysis seeks to update the prospects for 2010 GDP growth forecast of 2.1%, as well as project the trend out forat least 2011 and possibly further out, which is in the face of over bearing mainstream press commentary that has jumped ontothe double dip recession band wagon.
The Inflation Mega-Trend Page 21
http://www.marketoracle.co.uk © 2010 Copyright Nadeem Walayat and Market Oracle Ltd
Labour's 10 Year Economic Boom Evaporated into an Even Bigger Bust
John Majors Conservative government handed the New Labour government a lean mean economic growth machine back in1997, which during the first 2 years of the new government, the Labour party managed to restrain its traditional tendencies forwasting money by sticking to strict limits on government spending. However, increasingly following the first two years, theLabour party let rip with out of control public sector spending with a vengeance on the back of North Sea Oil revenues and theCasino Banking Sector profits that ensured that Britain skipped the Dot Com / Sept 11th recession of 2001-2002 that hit manyother countries including the United States.
Unfortunately both Tony Blair and Gordon Brown took this as a sign that they had acquired the midas touch, thus furtherescalated spending on the public sector that despite booming revenues from what turned out to be fictitious profits from themark to market banking sector (for the purpose of paying huge bonuses) the Labour Government repeatedly broke its ownGolden rules of balancing the countries finances over an economic cycle. If Labour had stuck to its own rules during the goodtimes as they had repeatedly promised the electorate at each election then Britain would now not be peering over the financialabyss of an hyper-inflationary debt spiral.
NHS Spending Black Hole
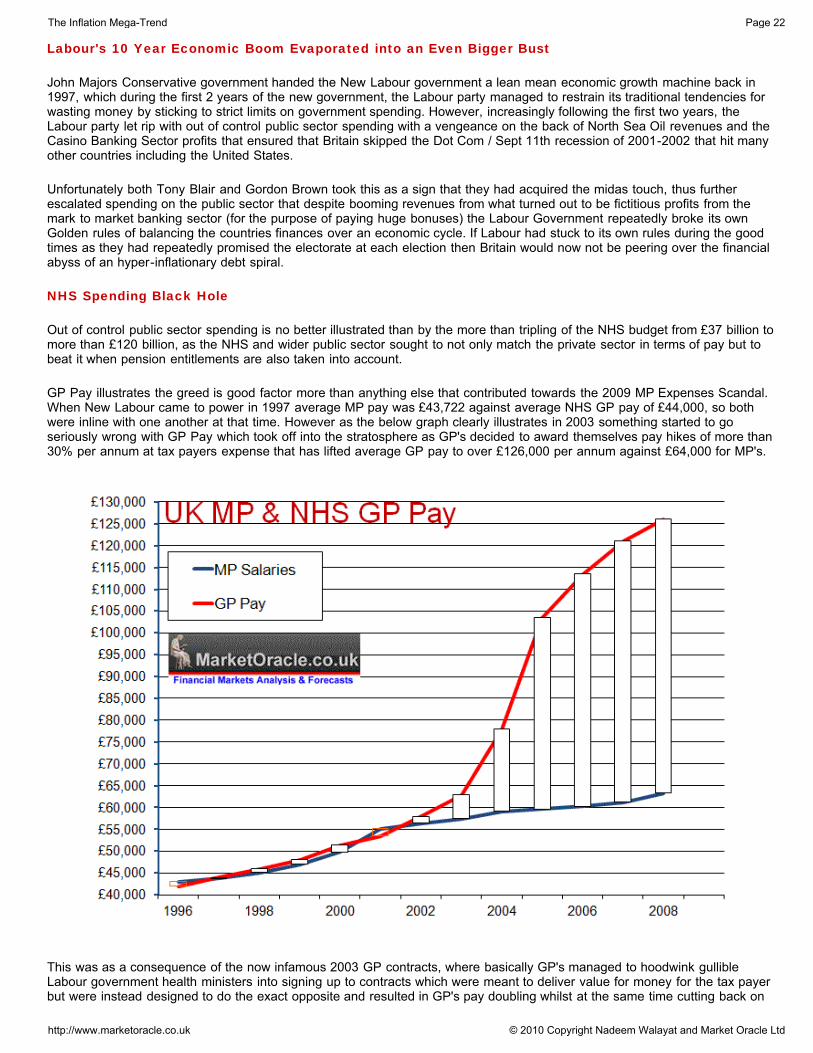
Out of control public sector spending is no better illustrated than by the more than tripling of the NHS budget from £37 billion tomore than £120 billion, as the NHS and wider public sector sought to not only match the private sector in terms of pay but tobeat it when pension entitlements are also taken into account.
GP Pay illustrates the greed is good factor more than anything else that contributed towards the 2009 MP Expenses Scandal.When New Labour came to power in 1997 average MP pay was £43,722 against average NHS GP pay of £44,000, so bothwere inline with one another at that time. However as the below graph clearly illustrates in 2003 something started to goseriously wrong with GP Pay which took off into the stratosphere as GP's decided to award themselves pay hikes of more than30% per annum at tax payers expense that has lifted average GP pay to over £126,000 per annum against £64,000 for MP's.
This was as a consequence of the now infamous 2003 GP contracts, where basically GP's managed to hoodwink gullibleLabour government health ministers into signing up to contracts which were meant to deliver value for money for the tax payerbut were instead designed to do the exact opposite and resulted in GP's pay doubling whilst at the same time cutting back on
The Inflation Mega-Trend Page 22
http://www.marketoracle.co.uk © 2010 Copyright Nadeem Walayat and Market Oracle Ltd
hours worked. This was not only a total fiasco for the nations health and finances but also ignited jealousy amongst MP's thatdirectly led to the adoption of the policy of claiming dubious expenses up to the allowed for limits so as to fill the ever wideninggap between MP's and NHS GP's, as MP's could not get away with awarding themselves pay hikes of 30% per annum withoutvoter discontent at elections. Therefore across the board systematic abuse of expenses started to take place which basicallymeans the real average MP pay is currently approx. £98,000 per annum.
This example illustrates why the Labour party appears destined to leave office with the economy left in the worst state since atany time since the Second World War. No British Government since WW2 has ran an annual budget deficit at 15% of GDP andit is this deficit as a consequence of the public sector spending black hole that the next Government will have to come to gripswith which implies near immediate and deep spending cuts of as much as 10% of the public sector or £65 billion.
Stock Market the Key Indicator of Economic Strength of 2009
Key conclusion of the inflation analysis projected towards a strong bounce back in the economy which implies higher inflation,all of which was strongly indicated by the stock market that began a stealth stocks bull market back in March, that only nownearly 9 months and 60%+ later are most analysts are starting to drop the bear market rally mantra and recognising the factthat the stock market is THE LEADING ECONOMIC INDICATOR . The article 2009 The Year of the Stocks Stealth Bull Marketrecaps my analysis that began with the birth of the Stocks Stealth Bull Market in March, all the way into a year end target of10,500+ on the Dow. My analysis and outlook for the stock market for 2010 follows in Chapter 4.
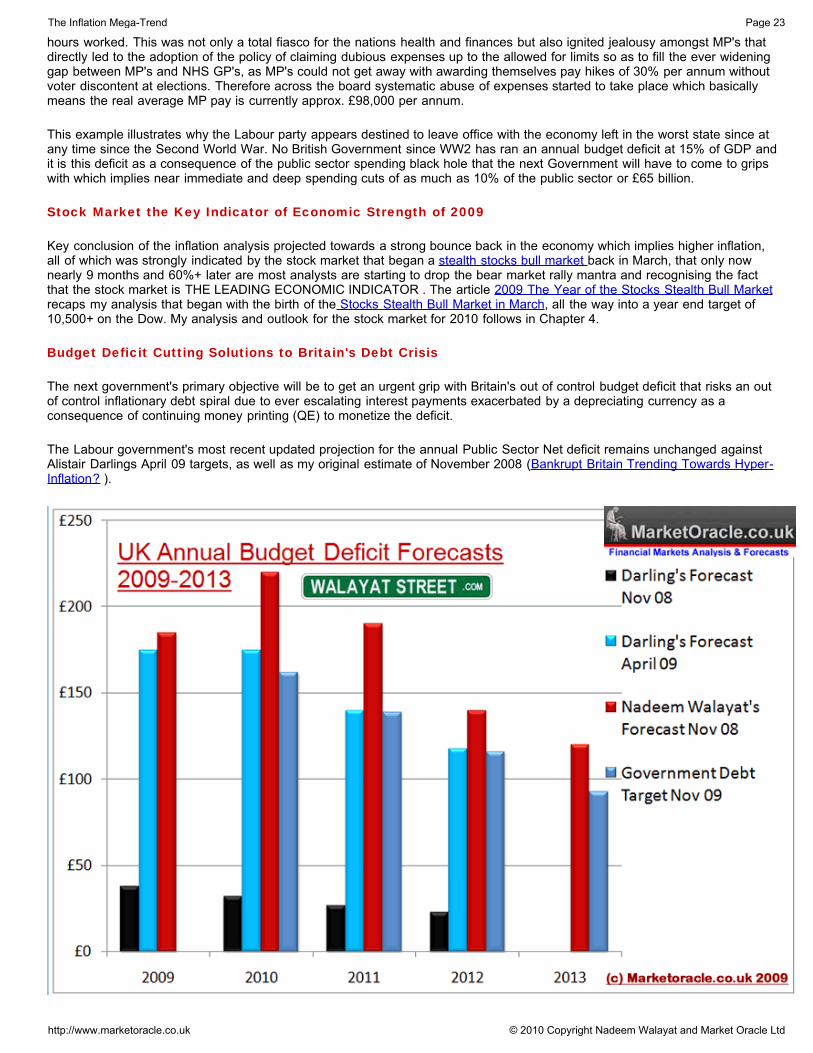
Budget Deficit Cutting Solutions to Britain's Debt Crisis
The next government's primary objective will be to get an urgent grip with Britain's out of control budget deficit that risks an outof control inflationary debt spiral due to ever escalating interest payments exacerbated by a depreciating currency as aconsequence of continuing money printing (QE) to monetize the deficit.
The Labour government's most recent updated projection for the annual Public Sector Net deficit remains unchanged againstAlistair Darlings April 09 targets, as well as my original estimate of November 2008 (Bankrupt Britain Trending Towards Hyper-Inflation? ).
The Inflation Mega-Trend Page 23
http://www.marketoracle.co.uk © 2010 Copyright Nadeem Walayat and Market Oracle Ltd
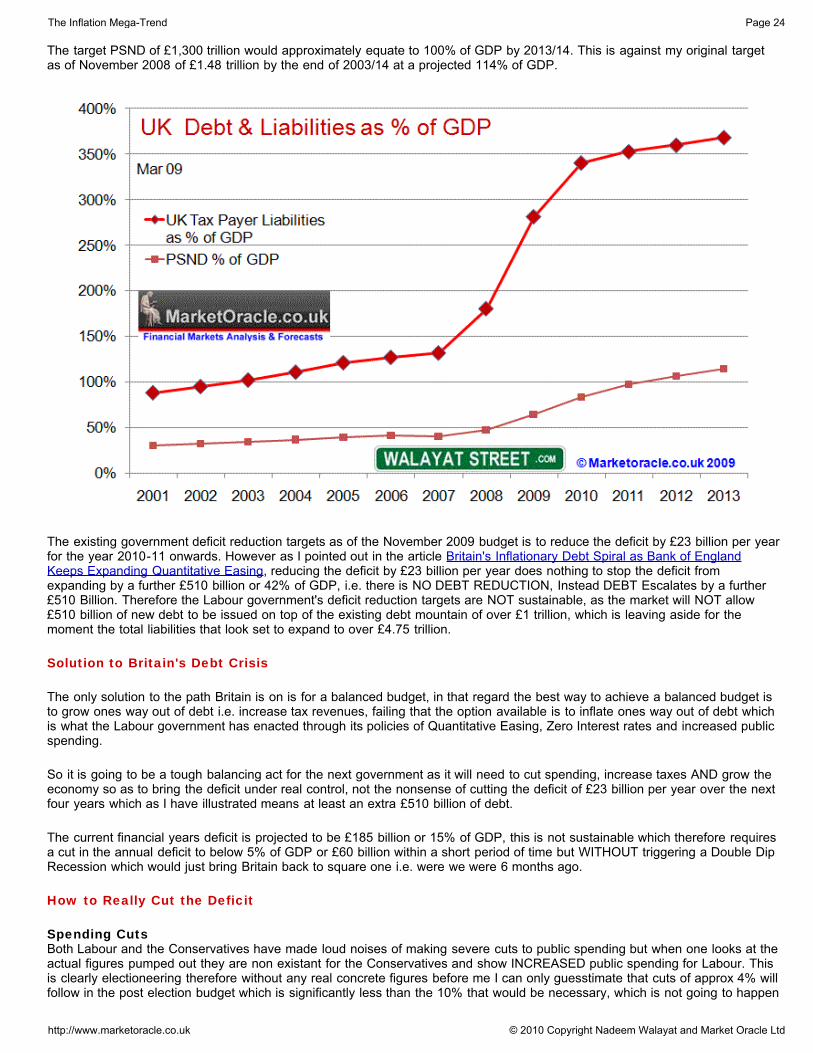
The target PSND of £1,300 trillion would approximately equate to 100% of GDP by 2013/14. This is against my original targetas of November 2008 of £1.48 trillion by the end of 2003/14 at a projected 114% of GDP.
The existing government deficit reduction targets as of the November 2009 budget is to reduce the deficit by £23 billion per yearfor the year 2010-11 onwards. However as I pointed out in the article Britain's Inflationary Debt Spiral as Bank of EnglandKeeps Expanding Quantitative Easing, reducing the deficit by £23 billion per year does nothing to stop the deficit fromexpanding by a further £510 billion or 42% of GDP, i.e. there is NO DEBT REDUCTION, Instead DEBT Escalates by a further£510 Billion. Therefore the Labour government's deficit reduction targets are NOT sustainable, as the market will NOT allow£510 billion of new debt to be issued on top of the existing debt mountain of over £1 trillion, which is leaving aside for themoment the total liabilities that look set to expand to over £4.75 trillion.
Solution to Britain's Debt Crisis
The only solution to the path Britain is on is for a balanced budget, in that regard the best way to achieve a balanced budget isto grow ones way out of debt i.e. increase tax revenues, failing that the option available is to inflate ones way out of debt whichis what the Labour government has enacted through its policies of Quantitative Easing, Zero Interest rates and increased publicspending.
So it is going to be a tough balancing act for the next government as it will need to cut spending, increase taxes AND grow theeconomy so as to bring the deficit under real control, not the nonsense of cutting the deficit of £23 billion per year over the nextfour years which as I have illustrated means at least an extra £510 billion of debt.
The current financial years deficit is projected to be £185 billion or 15% of GDP, this is not sustainable which therefore requiresa cut in the annual deficit to below 5% of GDP or £60 billion within a short period of time but WITHOUT triggering a Double DipRecession which would just bring Britain back to square one i.e. were we were 6 months ago.
How to Really Cut the Deficit
Spending Cuts Both Labour and the Conservatives have made loud noises of making severe cuts to public spending but when one looks at theactual figures pumped out they are non existant for the Conservatives and show INCREASED public spending for Labour. Thisis clearly electioneering therefore without any real concrete figures before me I can only guesstimate that cuts of approx 4% willfollow in the post election budget which is significantly less than the 10% that would be necessary, which is not going to happen
The Inflation Mega-Trend Page 24
http://www.marketoracle.co.uk © 2010 Copyright Nadeem Walayat and Market Oracle Ltd
when the mega spending departments of NHS, Education and Welfare have been ring fenced for growth, which would mean a10% budget cut would be impossible. Public sector spending cut by 4% would equate to about £24 billion.
Economic Growth My existing forecast for the UK economy is on track for 2%+ growth for 2010, therefore this should like for like imply a 2% cutin the annual deficit or £24 billion by means of increased tax revenues due to economic growth.
Tax Rises Tax rises have already been scheduled by the Labour party to start kicking in during 2010, with the first on 1st of Jan 2010when VAT goes back up from 15% to 17.5% and with NI scheduled to follow in April 2010. Add to this the projected postelection tax hikes of an increase in the basic rate of income tax to 24p and higher upper band increased from 40p to45p.Though a further VAT hike to 20% may be overkill and could trigger the feared double dip recession that would be adisaster, so I doubt if 20% VAT will follow, but it is a tough call as it could raise a further £12 billion per year. In conclusion totaltax revenues could increase by a sizeable £30 billion a year and contribute to a significant dent in the annual budget deficit.
Cutting the Deficit
Therefore putting all of the probable spending cuts, tax rises and increased revenues from economic growth all together, thenby the start of financial year 2011 the budget deficit could be cut by £78 billion to approx £100 billion instead of the Labourgovernment's target of £162 billion. A deficit of £100 billion would still equate to about 8% of GDP, so would still require moremoney printing to monetize government debt, but the cuts would not be so severe as to trigger a double dip recession andtherefore allow the government to both grow and inflate its way out of debt during the subsequent years i.e. the country willexperience below trend growth coupled with higher inflation that would target a rate above the Bank of England's 3% limit,which suggests that the next UK Government may set a NEW Inflation band of 2% to 4%, which is inline withthe outlook being painted by the inflation forecast.
On this basis the deficit could be cut to about 4% of GDP by the end of the third year of the next government, so hope forsaving Britain from the debt spiral is not lost, but it does require urgent action as the longer the country accrues budget deficitsof approaching £200 billion per year, the greater will be the price paid in terms of debt interest payments that are already at £44billion per year and could easily pass £80 billion if the Labour party's current 5 year deficit reduction plan is followed.
Learn the Lessons from the Financial Crisis
I hope the next Government will have learned the primary lesson from last years Financial Crisis, which is that the longer youleave a crisis to fester the greater will be the eventual crash. With regards Britains Debt Spiral, that crash would be for UKGovernment Bonds and Sterling, which would trigger panic reactive measures. So it is infinitely better to grab the debt bull bythe horns BEFORE the inevitable sovereign debt triggered collapse occurs.
The Election Cycle
The next government will have 5 years to prepare for the next general election of 2015. Therefore it has at its disposal thevaluable asset of time to engineer an economic boom into 2015. This suggests two harsh years of economic activity i.e. belowtrend growth, followed by two years of above trend economic recovery into the 2015 election.
Bank of England Quantitative Easing Gilts Market Smoke and Mirrors Dangerous Game
The Bank of England's actions throughout 2008 and 2009 have shown that it's primary objective is to massage the UKGovernment Bond market. The evidence for this is in the fact that the vast majority of the £200 billion of Q,E, has been utilisedfor the purpose of monetizing government debt i.e. buying gilts to prevent Gilt auction failures and higher yields.
The original story of Quantitative Easing or Money Printing in statements made by the Governor of the Bank of England duringFebruary 2009 was that QE would be utilised primarily for the purchase of corporate bonds to help companies that were unableto sell debt / bonds to the banks. This is NOT what has transpired as most of the QE to date of £200 billion has been utilisedfor the purchase of Gilts, where even what little corporate bonds that have been bought are expected to be sold in the comingmonths.
This tells me that those analysts that look to the Bank of England for possible answers for the UK economic growth indicatorsare following a red herring, as that is NOT the BoE's primary administrative function, the number 1 priority is massaging the Giltmarket, yes inflation and economy come 2nd and third but only in so far as they impact the Gilt market. So the Bank of Englandcould be a problem during 2010 as it continues to adopt a blinkered attitude towards the economy much as it did during theGreat Recession of 2008-2009, in that the Bank of England sat twiddling its thumbs whilst the economy burned and it was onlyafter the Prime Minister effectively took control of interest rates away from the Bank of England on 8th of October by
The Inflation Mega-Trend Page 25
http://www.marketoracle.co.uk © 2010 Copyright Nadeem Walayat and Market Oracle Ltd
announcing the first of a series of cuts in UK interest rates from the Prime Ministers Despatch box rather than by the Bank ofEngland as I mentioned around the time.
UK 1% Interest Rate Cut
The MPC meeting is widely expected by the consensus to cut UK interest rates by 0.5% today, however as my recentarticles (Credit Quake Persists Ahead of UK Interest Rate Cut of 1%?) have concluded that effectively Gordon Browncracked the MPC round table in half when he stood up at the House of Commons despatch box on 8th October toannounce the interest rate cut of 0.5%, which was followed by the Bank of England's announcement. This suggeststhat the Monetary Policy Committee is now no longer totally in the control of setting UK interest rates and therefore inmany aspects control has been transferred back into the government's hands.
At the end of the day the Bank of England will first look after fellow bankers and then placate the government by giving lipservice to the wider economy for were it the institution that many think it is then it would not have contributed in a big waytowards pushing the UK economy over the edge of the cliff during 2008 by sitting on interest rates of 5% for a whole yearAFTER the credit crisis broke and the UK housing market peaked. The Bank of England coupled with the FSA contributed totowards the creation of the financial crisis by means of the de-regulation of the banking sector that ensured that bank officersturned their banks into hollow husks for the purpose of maximising bonuses on the basis of fictitious profits, with all of theliabilities at the end of day being dumped onto the tax payers backs. Had the Bankers that run the Bank of England done whatthe people thought they were there to do, then the banking crisis would not have happened! For we are not talking about a newinstitution on a learning curve that is just a few years old, but rather a 300 year institution that knows full well the ins and outs ofthe banking system that it created over the centuries that exists primarily to turn everyone, including the government into debtslaves. The mainstream press instead of holding the Bank of England to account is praising the bank for its actions inpreventing an Economic Depression.
The Bank of England whilst talking about halting QE several times throughout 2009 that the mainstream press lapped up inJuly 2009, which at the time I mentioned was NOT possible, as the BoE will continue with QE to ensure that Gilt Auctions donot fail. The BoE will also put increasing pressure on the government to cut the deficit asap so that the Gilt market is under lesspressure, regardless of the impact of a too severe cut in the deficit i.e. triggering a double dip recession.
The Bank of England embarked upon a programme of printing money or Quantitative Easing during March 2009 with an initialprint run of £75 billion of a total limit set at £150 billion in an attempt to wave the central bank magic wand to increase thesupply of credit. However as I warned at the time (5th March 2009: Bank of England Ignites Quantitative Inflation) that oncestarted the Bank of England would continue printing money right into the May 2010 General Election targeting an print run of asmuch as £450 billion and therefore igniting Quantitative Inflation during 2010.
Virtually all of the mainstream press swallowed the Bank of England's hints and winks that Quantitative Easing had ended at£125 billion during the summer months, which at the time I stated was not possible (8th July 2009: Irrelevant UK Base InterestRate on Hold as Real Rates have Already Begun to Rise)
This confirms my view that the Bank of England will continue printing money into year end to beyond the currentarrangement of £150 billion and probably as high as £250 billion.
I projected a Quantitative Easing total towards £250 billion by the end of 2009 with the current tally now standing at £200 billionof money printed as a direct consequence of the Labour Government's objective of both aiming to maximise the number ofseats retained at the next General Election as well as to deliver a scorched earth economy to the next ConservativeGovernment. Therefore the Labour Government also wins because it gets to hide this Quantitative Easing debt as theoreticallypurchases and sales cancel each other out in the fantasy land of central bank accounting and feeble government auditing. I.e.by magic approx £200 billion of new government debt has vanished into thin air, for if had not been hidden under the carpetthen UK Gilt interest rates would be much higher due to the increase in supply of approx 33%.
The real damage of this game of smoke and mirrors is that the markets are not stupid and when they eventually do react to theprogressive trend of QE it will be Earthquake style and that is to dump UK assets, bonds, stocks, cash and therefore hit sterlinghard in a matter of hours let alone days or weeks which would send interest rates sky rocketing i.e. to discount the £200 billionof new hidden Q.E. debt.
In the final analysis money printing as I have repeatedly pointed out over the past year is a scam perpetuated upon existingcurrency holders, i.e. savers. The Bank of England's actions of the past 12 months amount to alleged theft of the value ofsavings from savers by means of zero interest rates and the printing of money that seeks to destroy the value of capital /
The Inflation Mega-Trend Page 26
http://www.marketoracle.co.uk © 2010 Copyright Nadeem Walayat and Market Oracle Ltd

savings both gradually through the process of inflation AND at the point of time of a currency crisis triggering a severedevaluation.
What this means for the UK Economy is that a. serious efforts will be implemented by the next Government to cut the deficit,and b. whilst the deficit is above £80 billion per year then Quantitative Easing will remain and continue to expand whichsuggests several more years of QE rather than several more months as the BoE officially continues to always allude to, whichgiven its actual primary objective is not going to happen.
China Leads the Way for Strong Global Growth 2010 and Beyond
China is leading the way to the return of global growth with expectations for GDP growth for 2010 of as much as 10%, whichfurther confirms expectations for the potential of a global growth story surprise to the upside for 2010. Whilst at the present timemany analysts / commentators worry about China market bubbles, much as they worried about the "stocks bear market rally"that was always destined for an imminent demise during 2009 which instead was one of the greatest bull markets in history.
I don't see why China is not going to keep growing strongly for 2010, 2011 and beyond especially as domestic consumptionbecomes an ever larger part of China's growth story with other emerging markets not far behind. Having originally called theChina stock market as a Great Buy at SSEC 2,000, with the index now at 3,200 up 92% from its bear market low just continuesto prove how wrong the China doom mongers have been found out to be as they continue harping on about how China has toat some point withdraw the huge economic stimulus of 2009, though without understanding that with growing reserves of over$2 trillion they do not have to as I pointed out back in June 2009. China Mega-trend Stocks Stealth Bull Market Update, SSECUp 47%. Many of the comments I made at the time of China boosting World trade and commerce is coming to pass and willincreasingly do so during 2010.
Chart courtesy of StockCharts.com
The Inflation Mega-Trend Page 27
http://www.marketoracle.co.uk © 2010 Copyright Nadeem Walayat and Market Oracle Ltd
So regardless of volatility during 2010, China will continue to notch up a further gains during 2010 AND 2011, We could see theChinese stock market end 2010 above SSEC 4,000 which 'should' help elevate all major stock markets higher, just as theChinese economy helps elevate the major economies higher (See Chapter 4 for more precise analysis on China Stock Market).
China's thirst for resources and energy also sets the scene for the continuing commodities bull markets right across the boardas part of the inflation mega-trend scenario, which ensures mineral producing countries such as Australia and Canada and oilexporting countries will see China lift their economies higher as prices are driven higher.
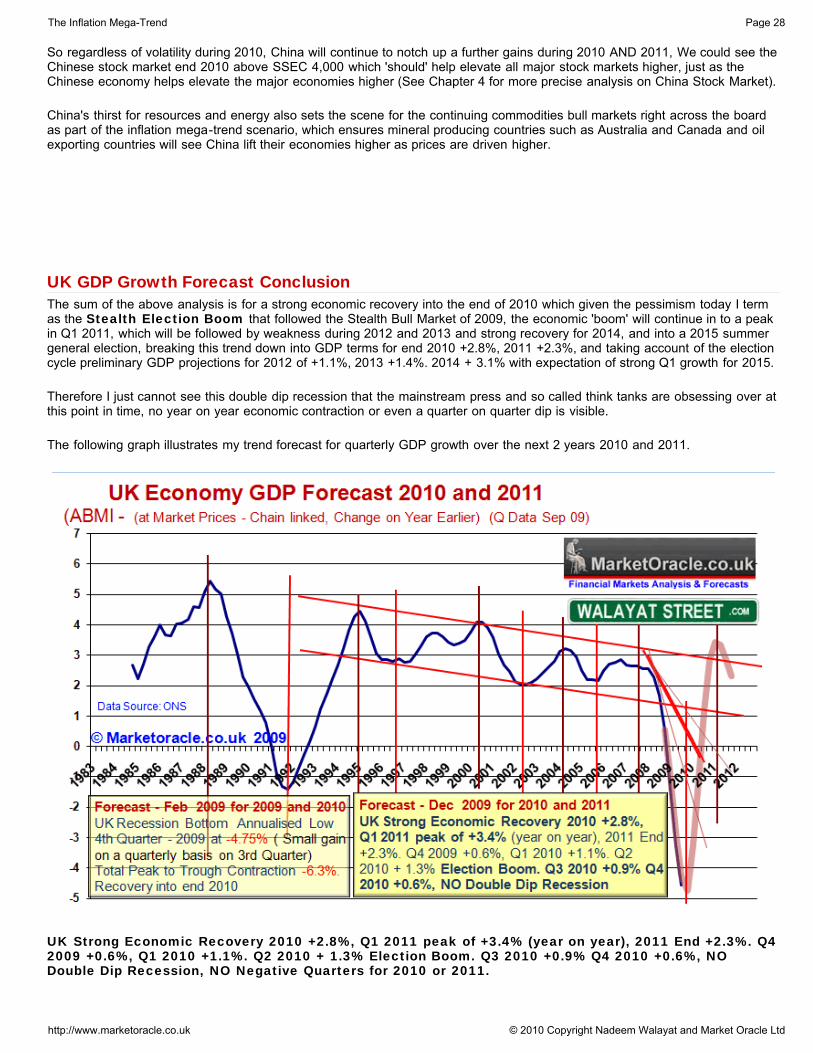
UK GDP Growth Forecast ConclusionThe sum of the above analysis is for a strong economic recovery into the end of 2010 which given the pessimism today I termas the Stealth Election Boom that followed the Stealth Bull Market of 2009, the economic 'boom' will continue in to a peakin Q1 2011, which will be followed by weakness during 2012 and 2013 and strong recovery for 2014, and into a 2015 summergeneral election, breaking this trend down into GDP terms for end 2010 +2.8%, 2011 +2.3%, and taking account of the electioncycle preliminary GDP projections for 2012 of +1.1%, 2013 +1.4%. 2014 + 3.1% with expectation of strong Q1 growth for 2015.
Therefore I just cannot see this double dip recession that the mainstream press and so called think tanks are obsessing over atthis point in time, no year on year economic contraction or even a quarter on quarter dip is visible.
The following graph illustrates my trend forecast for quarterly GDP growth over the next 2 years 2010 and 2011.
UK Strong Economic Recovery 2010 +2.8%, Q1 2011 peak of +3.4% (year on year), 2011 End +2.3%. Q42009 +0.6%, Q1 2010 +1.1%. Q2 2010 + 1.3% Election Boom. Q3 2010 +0.9% Q4 2010 +0.6%, NODouble Dip Recession, NO Negative Quarters for 2010 or 2011.
The Inflation Mega-Trend Page 28
http://www.marketoracle.co.uk © 2010 Copyright Nadeem Walayat and Market Oracle Ltd
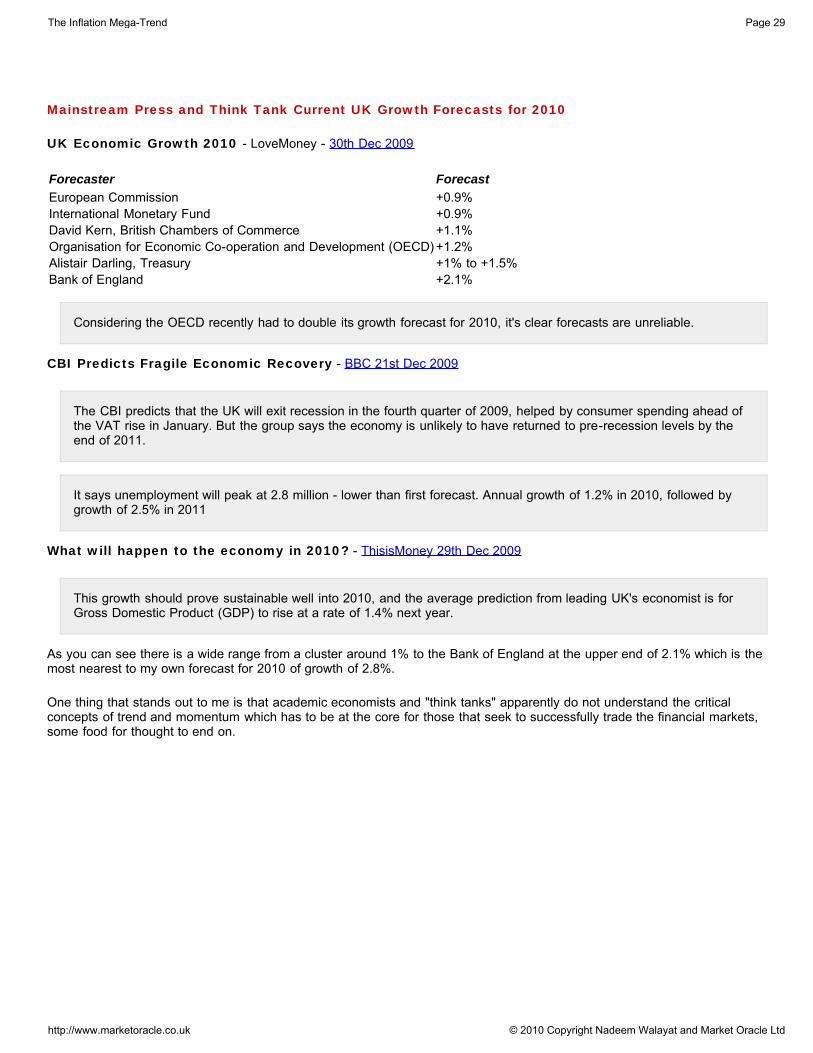
Mainstream Press and Think Tank Current UK Growth Forecasts for 2010
UK Economic Growth 2010 - LoveMoney - 30th Dec 2009
Forecaster ForecastEuropean Commission +0.9%International Monetary Fund +0.9%David Kern, British Chambers of Commerce +1.1%Organisation for Economic Co-operation and Development (OECD) +1.2%Alistair Darling, Treasury +1% to +1.5%Bank of England +2.1%
Considering the OECD recently had to double its growth forecast for 2010, it's clear forecasts are unreliable.
CBI Predicts Fragile Economic Recovery - BBC 21st Dec 2009
The CBI predicts that the UK will exit recession in the fourth quarter of 2009, helped by consumer spending ahead ofthe VAT rise in January. But the group says the economy is unlikely to have returned to pre-recession levels by theend of 2011.
It says unemployment will peak at 2.8 million - lower than first forecast. Annual growth of 1.2% in 2010, followed bygrowth of 2.5% in 2011
What will happen to the economy in 2010? - ThisisMoney 29th Dec 2009
This growth should prove sustainable well into 2010, and the average prediction from leading UK's economist is forGross Domestic Product (GDP) to rise at a rate of 1.4% next year.
As you can see there is a wide range from a cluster around 1% to the Bank of England at the upper end of 2.1% which is themost nearest to my own forecast for 2010 of growth of 2.8%.
One thing that stands out to me is that academic economists and "think tanks" apparently do not understand the criticalconcepts of trend and momentum which has to be at the core for those that seek to successfully trade the financial markets,some food for thought to end on.
The Inflation Mega-Trend Page 29
http://www.marketoracle.co.uk © 2010 Copyright Nadeem Walayat and Market Oracle Ltd
CHAPTER 3
UK INTEREST RATES
The British Economy as with other developed economies entered 2009 in recession and on the brink of depression whichtriggered a series of panic interest rate cuts all the way to 0.5% by March 2009 and they have stayed there right into the start of2010.
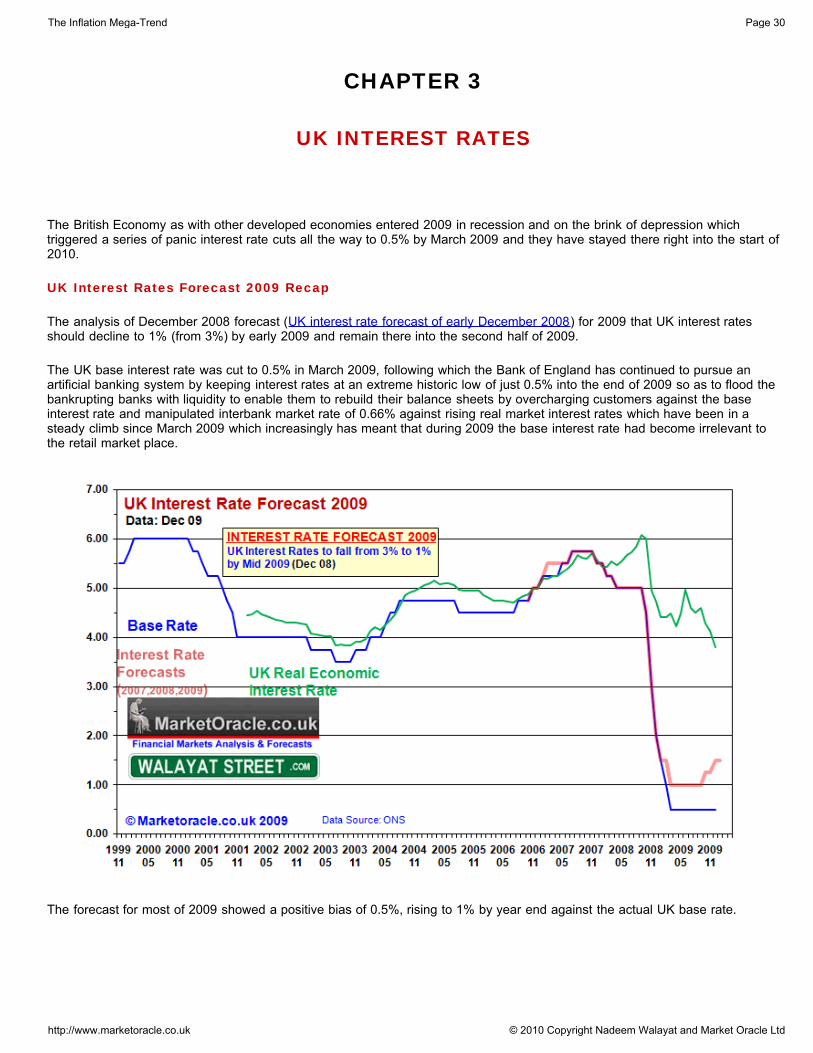
UK Interest Rates Forecast 2009 Recap
The analysis of December 2008 forecast (UK interest rate forecast of early December 2008) for 2009 that UK interest ratesshould decline to 1% (from 3%) by early 2009 and remain there into the second half of 2009.
The UK base interest rate was cut to 0.5% in March 2009, following which the Bank of England has continued to pursue anartificial banking system by keeping interest rates at an extreme historic low of just 0.5% into the end of 2009 so as to flood thebankrupting banks with liquidity to enable them to rebuild their balance sheets by overcharging customers against the baseinterest rate and manipulated interbank market rate of 0.66% against rising real market interest rates which have been in asteady climb since March 2009 which increasingly has meant that during 2009 the base interest rate had become irrelevant tothe retail market place.
The forecast for most of 2009 showed a positive bias of 0.5%, rising to 1% by year end against the actual UK base rate.
The Inflation Mega-Trend Page 30
http://www.marketoracle.co.uk © 2010 Copyright Nadeem Walayat and Market Oracle Ltd
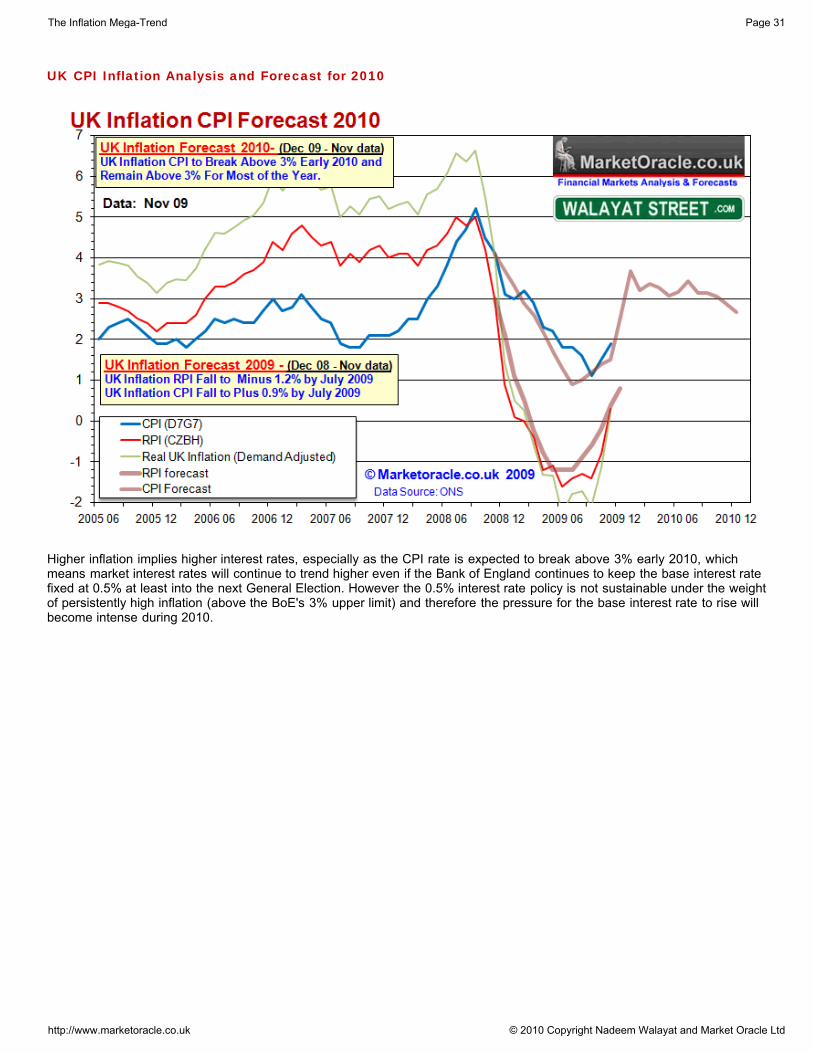
UK CPI Inflation Analysis and Forecast for 2010
Higher inflation implies higher interest rates, especially as the CPI rate is expected to break above 3% early 2010, whichmeans market interest rates will continue to trend higher even if the Bank of England continues to keep the base interest ratefixed at 0.5% at least into the next General Election. However the 0.5% interest rate policy is not sustainable under the weightof persistently high inflation (above the BoE's 3% upper limit) and therefore the pressure for the base interest rate to rise willbecome intense during 2010.
The Inflation Mega-Trend Page 31
http://www.marketoracle.co.uk © 2010 Copyright Nadeem Walayat and Market Oracle Ltd
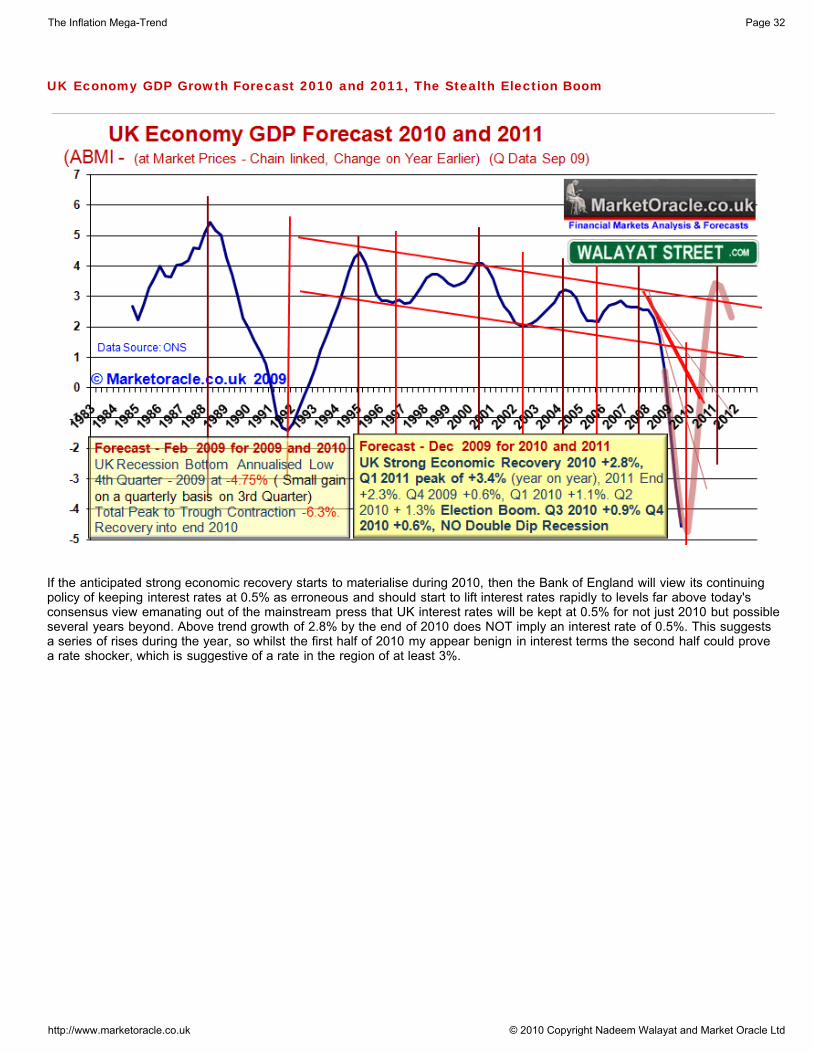
UK Economy GDP Growth Forecast 2010 and 2011, The Stealth Election Boom
If the anticipated strong economic recovery starts to materialise during 2010, then the Bank of England will view its continuingpolicy of keeping interest rates at 0.5% as erroneous and should start to lift interest rates rapidly to levels far above today'sconsensus view emanating out of the mainstream press that UK interest rates will be kept at 0.5% for not just 2010 but possibleseveral years beyond. Above trend growth of 2.8% by the end of 2010 does NOT imply an interest rate of 0.5%. This suggestsa series of rises during the year, so whilst the first half of 2010 my appear benign in interest terms the second half could provea rate shocker, which is suggestive of a rate in the region of at least 3%.
The Inflation Mega-Trend Page 32
http://www.marketoracle.co.uk © 2010 Copyright Nadeem Walayat and Market Oracle Ltd
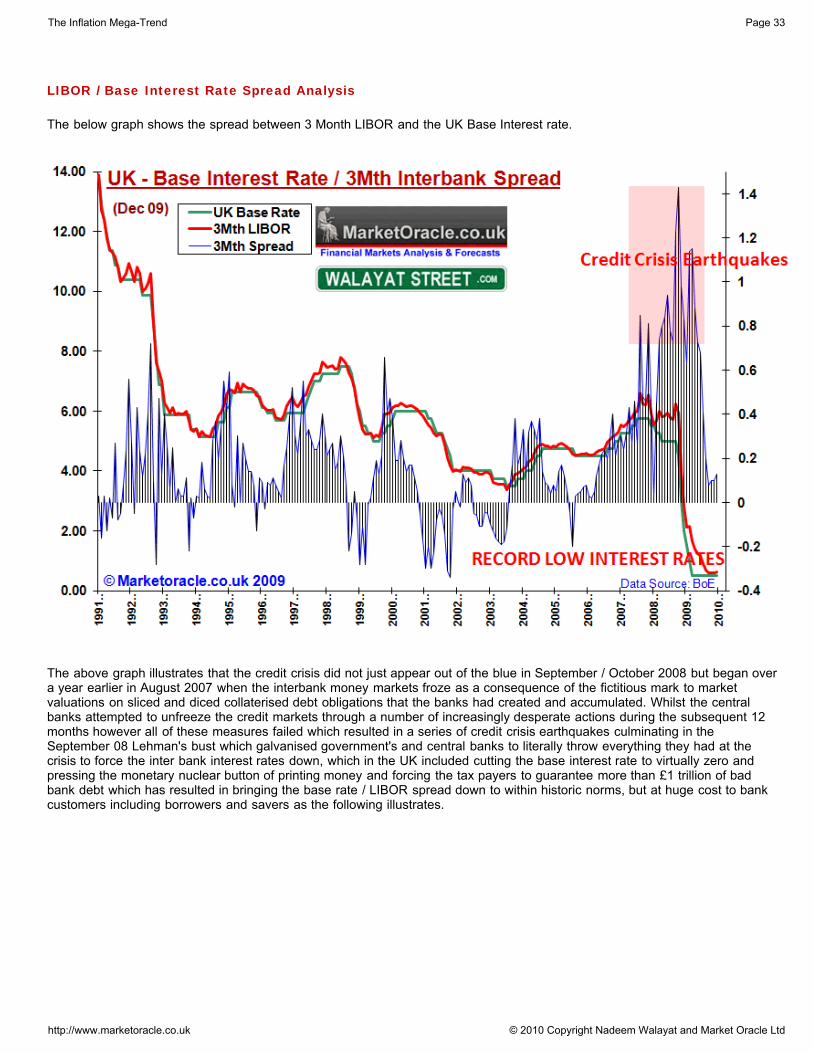
LIBOR / Base Interest Rate Spread Analysis
The below graph shows the spread between 3 Month LIBOR and the UK Base Interest rate.
The above graph illustrates that the credit crisis did not just appear out of the blue in September / October 2008 but began overa year earlier in August 2007 when the interbank money markets froze as a consequence of the fictitious mark to marketvaluations on sliced and diced collaterised debt obligations that the banks had created and accumulated. Whilst the centralbanks attempted to unfreeze the credit markets through a number of increasingly desperate actions during the subsequent 12months however all of these measures failed which resulted in a series of credit crisis earthquakes culminating in theSeptember 08 Lehman's bust which galvanised government's and central banks to literally throw everything they had at thecrisis to force the inter bank interest rates down, which in the UK included cutting the base interest rate to virtually zero andpressing the monetary nuclear button of printing money and forcing the tax payers to guarantee more than £1 trillion of badbank debt which has resulted in bringing the base rate / LIBOR spread down to within historic norms, but at huge cost to bankcustomers including borrowers and savers as the following illustrates.
The Inflation Mega-Trend Page 33
http://www.marketoracle.co.uk © 2010 Copyright Nadeem Walayat and Market Oracle Ltd

Banks Profiteering From Artificial Banking System
The artificial banking system means that the bill for rebuilding the bank balance sheets (and bonuses) is being paid for byBorrowers and Savers who along with all tax payers are being forced to pay for the bankster's crimes as tax payer bailed outbanks such as HBOS pay a pittance on instant access savings accounts of as little as 0.1% against a requirement of 2.3% justto cover CPI inflation of 1.9% plus the 20% tax charged on interest whilst at the same time upping the rate on borrowers farbeyond the illusion of low interest rates as presented by a base rate of 0.5% as the following graph illustrates the spreadbetween the mortgage standard variable rate and interbank market rate resulting in a huge profit margin for the banks.
Money is being sucked out of the pockets of borrowers and savers and being deposited onto the balance sheet of bailed outbanks that have no incentive to pay a decent rate of interest on savings when they can borrow at 0.5% from the Bank ofEngland and marginally higher from other banks. The artificial banking system is resulting in unprecedented huge profitsmargins for the banks as market interest rates charged to retail borrowers continues to rise regardless of the base rate beingheld at 0.5% into 2010.
The big question is when will the Bank of England start to reduce this unprecedented artificial support for the UK banks. Themarginal up tick in the LIBOR spread suggests that this is now underway to a small degree. However we are talking about aminute movement. The key indicator for a series of increases in interest rates will be when the spread rises to above 0.3 fromthe current 0.13, which considering the first graph suggests that this is not on the immediate horizon and therefore implies thatwe are still many months away from the first rate rise i.e. the trend is suggestive of no rate rise during the first half of 2010.
The Inflation Mega-Trend Page 34
http://www.marketoracle.co.uk © 2010 Copyright Nadeem Walayat and Market Oracle Ltd
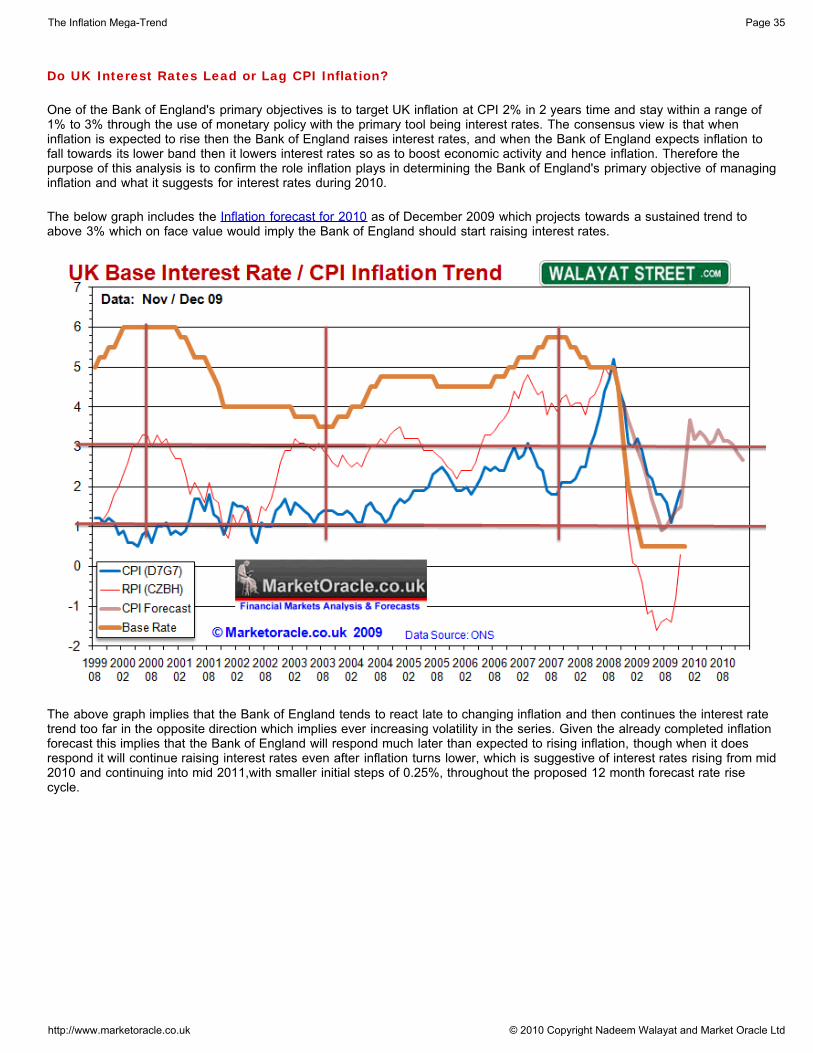
Do UK Interest Rates Lead or Lag CPI Inflation?
One of the Bank of England's primary objectives is to target UK inflation at CPI 2% in 2 years time and stay within a range of1% to 3% through the use of monetary policy with the primary tool being interest rates. The consensus view is that wheninflation is expected to rise then the Bank of England raises interest rates, and when the Bank of England expects inflation tofall towards its lower band then it lowers interest rates so as to boost economic activity and hence inflation. Therefore thepurpose of this analysis is to confirm the role inflation plays in determining the Bank of England's primary objective of managinginflation and what it suggests for interest rates during 2010.
The below graph includes the Inflation forecast for 2010 as of December 2009 which projects towards a sustained trend toabove 3% which on face value would imply the Bank of England should start raising interest rates.
The above graph implies that the Bank of England tends to react late to changing inflation and then continues the interest ratetrend too far in the opposite direction which implies ever increasing volatility in the series. Given the already completed inflationforecast this implies that the Bank of England will respond much later than expected to rising inflation, though when it doesrespond it will continue raising interest rates even after inflation turns lower, which is suggestive of interest rates rising from mid2010 and continuing into mid 2011,with smaller initial steps of 0.25%, throughout the proposed 12 month forecast rate risecycle.
The Inflation Mega-Trend Page 35
http://www.marketoracle.co.uk © 2010 Copyright Nadeem Walayat and Market Oracle Ltd
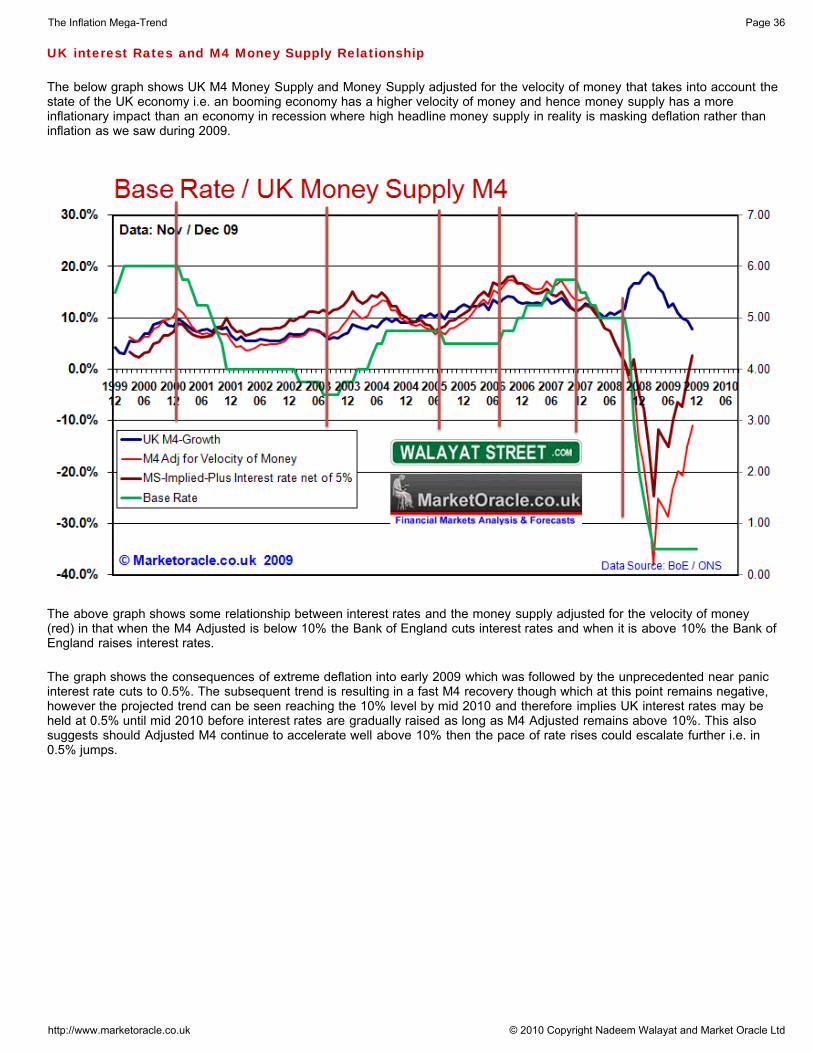
UK interest Rates and M4 Money Supply Relationship
The below graph shows UK M4 Money Supply and Money Supply adjusted for the velocity of money that takes into account thestate of the UK economy i.e. an booming economy has a higher velocity of money and hence money supply has a moreinflationary impact than an economy in recession where high headline money supply in reality is masking deflation rather thaninflation as we saw during 2009.
The above graph shows some relationship between interest rates and the money supply adjusted for the velocity of money(red) in that when the M4 Adjusted is below 10% the Bank of England cuts interest rates and when it is above 10% the Bank ofEngland raises interest rates.
The graph shows the consequences of extreme deflation into early 2009 which was followed by the unprecedented near panicinterest rate cuts to 0.5%. The subsequent trend is resulting in a fast M4 recovery though which at this point remains negative,however the projected trend can be seen reaching the 10% level by mid 2010 and therefore implies UK interest rates may beheld at 0.5% until mid 2010 before interest rates are gradually raised as long as M4 Adjusted remains above 10%. This alsosuggests should Adjusted M4 continue to accelerate well above 10% then the pace of rate rises could escalate further i.e. in0.5% jumps.
The Inflation Mega-Trend Page 36
http://www.marketoracle.co.uk © 2010 Copyright Nadeem Walayat and Market Oracle Ltd
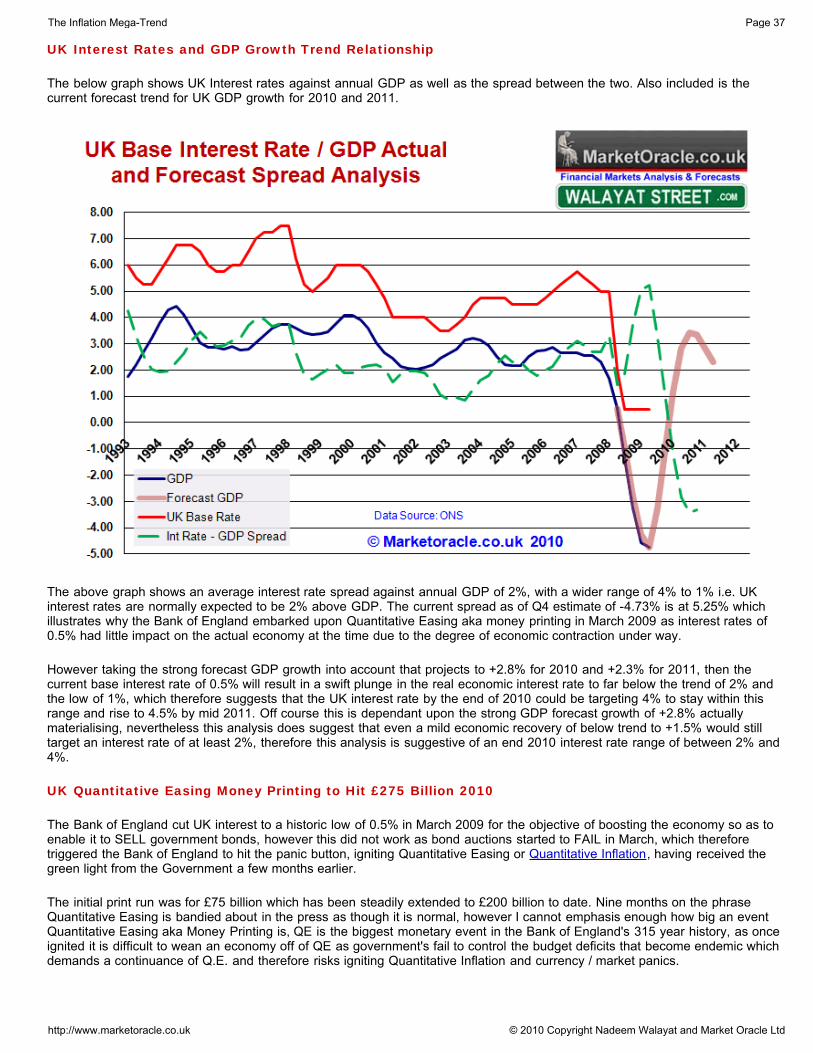
UK Interest Rates and GDP Growth Trend Relationship
The below graph shows UK Interest rates against annual GDP as well as the spread between the two. Also included is thecurrent forecast trend for UK GDP growth for 2010 and 2011.
The above graph shows an average interest rate spread against annual GDP of 2%, with a wider range of 4% to 1% i.e. UKinterest rates are normally expected to be 2% above GDP. The current spread as of Q4 estimate of -4.73% is at 5.25% whichillustrates why the Bank of England embarked upon Quantitative Easing aka money printing in March 2009 as interest rates of0.5% had little impact on the actual economy at the time due to the degree of economic contraction under way.
However taking the strong forecast GDP growth into account that projects to +2.8% for 2010 and +2.3% for 2011, then thecurrent base interest rate of 0.5% will result in a swift plunge in the real economic interest rate to far below the trend of 2% andthe low of 1%, which therefore suggests that the UK interest rate by the end of 2010 could be targeting 4% to stay within thisrange and rise to 4.5% by mid 2011. Off course this is dependant upon the strong GDP forecast growth of +2.8% actuallymaterialising, nevertheless this analysis does suggest that even a mild economic recovery of below trend to +1.5% would stilltarget an interest rate of at least 2%, therefore this analysis is suggestive of an end 2010 interest rate range of between 2% and4%.
UK Quantitative Easing Money Printing to Hit £275 Billion 2010
The Bank of England cut UK interest to a historic low of 0.5% in March 2009 for the objective of boosting the economy so as toenable it to SELL government bonds, however this did not work as bond auctions started to FAIL in March, which thereforetriggered the Bank of England to hit the panic button, igniting Quantitative Easing or Quantitative Inflation, having received thegreen light from the Government a few months earlier.
The initial print run was for £75 billion which has been steadily extended to £200 billion to date. Nine months on the phraseQuantitative Easing is bandied about in the press as though it is normal, however I cannot emphasis enough how big an eventQuantitative Easing aka Money Printing is, QE is the biggest monetary event in the Bank of England's 315 year history, as onceignited it is difficult to wean an economy off of QE as government's fail to control the budget deficits that become endemic whichdemands a continuance of Q.E. and therefore risks igniting Quantitative Inflation and currency / market panics.
The Inflation Mega-Trend Page 37
http://www.marketoracle.co.uk © 2010 Copyright Nadeem Walayat and Market Oracle Ltd

QE Huge Boost to GDP I have received a few emails critical of my strong UK growth forecast for 2010 of +2.8%, mostly from those that expect / hopefor a double dip recession that would allow them a second opportunity to buy into the stocks bull market at near the bearmarket lows having missed the birth of the stocks stealth bull market last March, in that light the following may enlighten readerson the huge boost to GDP during the past 9 months:
Whilst approx £190 billion of the £200 billion of QE authorised to date has been deployed over the past 9 months. However thetrue implication of QE on the economy can be better appreciated when setting it against the recession that has seen acontraction of some 6.2%, as QE of £180 to £200 billion is equivalent to GDP of 14% to 16% i.e. far greater than the loss ofGDP during the 15 month recession, and not forgetting that QE is just one part of the programme of huge Government deficitspending (14% of GDP) and near ZERO interest rates (Savers subsidised bailouts) and the over £1 trillion of bailed out banksbad debt liabilities, then direct capital injections of over £80 billion (6% of GDP) illustrates the extreme lengths to which theauthorities have gone to, to bring the recession to a halt, which sows the seeds for above trend growth during 2010.
The Bank of England's Route towards £200 billion QEThe Bank of England embarked upon a programme of printing money or Quantitative Easing during March 2009 with an initialprint run of £75 billion of a total set at £150 billion in an attempt to wave the central bank magic wand to increase the supply ofcredit. However as I warned at the time (5th March 2009: Bank of England Ignites Quantitative Inflation) that once started theBank of England would continue printing money right into the May 2010 General Election targeting an print run of as much as£450 billion and therefore igniting Quantitative Inflation during 2010.
Virtually all of the mainstream press swallowed the Bank of England's hints and winks that Quantitative Easing had ended at£125 billion during the summer months, which at the time I stated was not possible (8th July 2009: Irrelevant UK Base InterestRate on Hold as Real Rates have Already Begun to Rise)
This confirms my view that the Bank of England will continue printing money into year end to beyond the currentarrangement of £150 billion and probably as high as £250 billion.
I projected a Quantitative Easing total towards £250 billion by the end of 2009 with the actual total of £200 billion of moneyprinted as a direct consequence of the Labour Government's objective of both aiming to maximise the number of seats retainedat the next General Election as well as to deliver a scorched earth economy to the next Conservative Government. Thereforethe Labour Government also wins because it gets to hide this Quantitative Easing debt as theoretically purchases and salescancel each other out in the fantasy land of central banking accounting and feeble government auditing. I.e. by magic approx£200 billion of new government debt has vanished into thin air, for if had not been hidden under the carpet then UK Gilt interestrates would be much higher due to the increase in supply of approx 33%.
Asset Price Implications of the Potential End of Q.E.Quantitative Easing being brought to an halt / unwinding of purchases would hit asset prices hard, i.e. we would see the Giltbond market impacted as instead of purchasing 'most' of the government bonds the Bank of England would become its biggestseller with a lot of supply overhanging the market which would send the bond market into a tailspin and immediately hit thestock market that has soared in good part as a consequence of Q.E., similarly the bounce in UK house prices would soonevaporate.
This suggests whilst the BoE will repeatedly talk about ending Q.E. I just don't see it happening whilst the Government runs abudget deficit anywhere near as large as 15% even half of this would not be enough to end Q.E. So it looks like Q.E. will behere for many years as I originally voiced before Q.E. began. However as the asset markets stabilise at higher levels, the Bankof England rather than printing new money may force / entice banks and financial institutions to purchase more UK governmentbonds rather than further drive up stocks which is therefore suggestive of a tough year for asset prices.
Bank of England Forcing Banks to Buy GiltsThe official line of QE was to boost bank lending, however Q.E. is apparently having the opposite effect at the commercialbanks as the Bank of England's twin objectives of monetizing government debt and for the bailed out banks to improve theirbalance sheets is in effect forcing the banks to BUY government bonds as Gilts are seen as the safest asset class andtherefore boosts the Banking sectors credit worthiness in terms of capital ratios so instead of lending tax payer money loanedto the banks, the banks are using tax payer money to buy UK government bonds and put on short-term deposit at the Bank ofEngland.
Surely this must be by design as the Bank of England's primary purpose is for the orderly management of the Government debtmarket, hence this is ensuring the maximum demand for a huge amount of debt issuance estimated at £225 billion for thecurrent financial year, which includes new debt and maturing debt rolled over.
The Inflation Mega-Trend Page 38
http://www.marketoracle.co.uk © 2010 Copyright Nadeem Walayat and Market Oracle Ltd
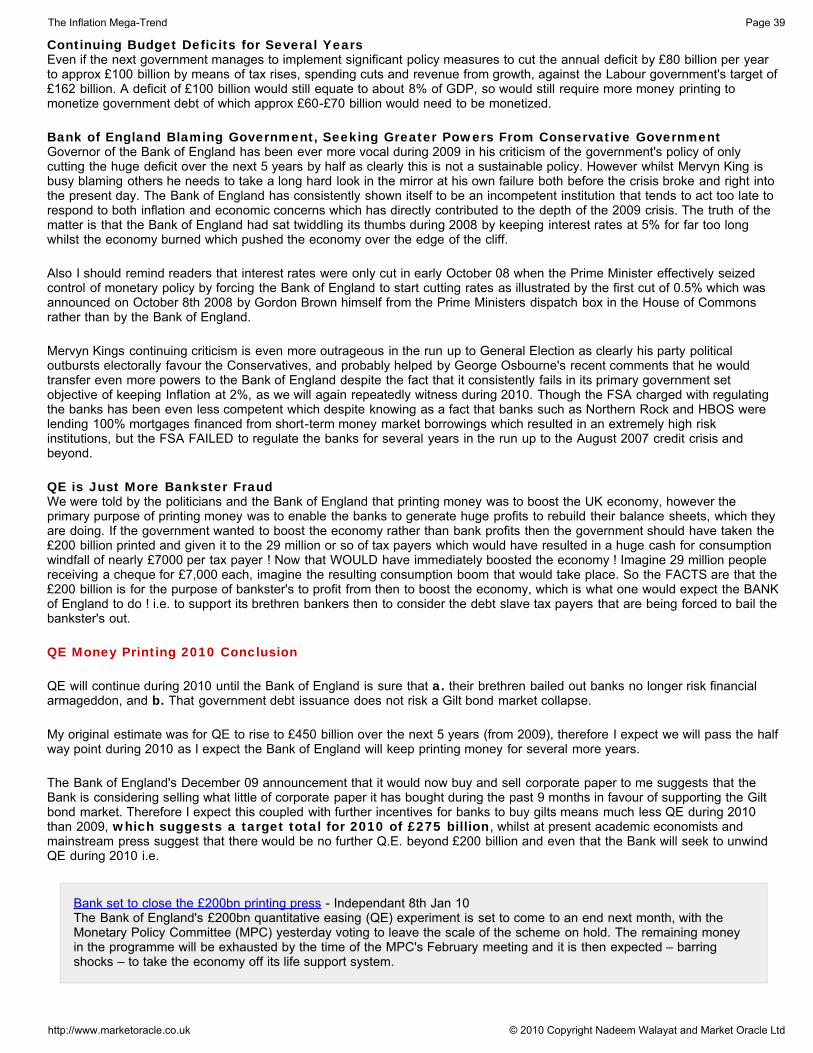
Continuing Budget Deficits for Several YearsEven if the next government manages to implement significant policy measures to cut the annual deficit by £80 billion per yearto approx £100 billion by means of tax rises, spending cuts and revenue from growth, against the Labour government's target of£162 billion. A deficit of £100 billion would still equate to about 8% of GDP, so would still require more money printing tomonetize government debt of which approx £60-£70 billion would need to be monetized.
Bank of England Blaming Government, Seeking Greater Powers From Conservative GovernmentGovernor of the Bank of England has been ever more vocal during 2009 in his criticism of the government's policy of onlycutting the huge deficit over the next 5 years by half as clearly this is not a sustainable policy. However whilst Mervyn King isbusy blaming others he needs to take a long hard look in the mirror at his own failure both before the crisis broke and right intothe present day. The Bank of England has consistently shown itself to be an incompetent institution that tends to act too late torespond to both inflation and economic concerns which has directly contributed to the depth of the 2009 crisis. The truth of thematter is that the Bank of England had sat twiddling its thumbs during 2008 by keeping interest rates at 5% for far too longwhilst the economy burned which pushed the economy over the edge of the cliff.
Also I should remind readers that interest rates were only cut in early October 08 when the Prime Minister effectively seizedcontrol of monetary policy by forcing the Bank of England to start cutting rates as illustrated by the first cut of 0.5% which wasannounced on October 8th 2008 by Gordon Brown himself from the Prime Ministers dispatch box in the House of Commonsrather than by the Bank of England.
Mervyn Kings continuing criticism is even more outrageous in the run up to General Election as clearly his party politicaloutbursts electorally favour the Conservatives, and probably helped by George Osbourne's recent comments that he wouldtransfer even more powers to the Bank of England despite the fact that it consistently fails in its primary government setobjective of keeping Inflation at 2%, as we will again repeatedly witness during 2010. Though the FSA charged with regulatingthe banks has been even less competent which despite knowing as a fact that banks such as Northern Rock and HBOS werelending 100% mortgages financed from short-term money market borrowings which resulted in an extremely high riskinstitutions, but the FSA FAILED to regulate the banks for several years in the run up to the August 2007 credit crisis andbeyond.
QE is Just More Bankster FraudWe were told by the politicians and the Bank of England that printing money was to boost the UK economy, however theprimary purpose of printing money was to enable the banks to generate huge profits to rebuild their balance sheets, which theyare doing. If the government wanted to boost the economy rather than bank profits then the government should have taken the£200 billion printed and given it to the 29 million or so of tax payers which would have resulted in a huge cash for consumptionwindfall of nearly £7000 per tax payer ! Now that WOULD have immediately boosted the economy ! Imagine 29 million peoplereceiving a cheque for £7,000 each, imagine the resulting consumption boom that would take place. So the FACTS are that the£200 billion is for the purpose of bankster's to profit from then to boost the economy, which is what one would expect the BANKof England to do ! i.e. to support its brethren bankers then to consider the debt slave tax payers that are being forced to bail thebankster's out.
QE Money Printing 2010 Conclusion
QE will continue during 2010 until the Bank of England is sure that a. their brethren bailed out banks no longer risk financialarmageddon, and b. That government debt issuance does not risk a Gilt bond market collapse.
My original estimate was for QE to rise to £450 billion over the next 5 years (from 2009), therefore I expect we will pass the halfway point during 2010 as I expect the Bank of England will keep printing money for several more years.
The Bank of England's December 09 announcement that it would now buy and sell corporate paper to me suggests that theBank is considering selling what little of corporate paper it has bought during the past 9 months in favour of supporting the Giltbond market. Therefore I expect this coupled with further incentives for banks to buy gilts means much less QE during 2010than 2009, which suggests a target total for 2010 of £275 billion, whilst at present academic economists andmainstream press suggest that there would be no further Q.E. beyond £200 billion and even that the Bank will seek to unwindQE during 2010 i.e.
Bank set to close the £200bn printing press - Independant 8th Jan 10 The Bank of England's £200bn quantitative easing (QE) experiment is set to come to an end next month, with theMonetary Policy Committee (MPC) yesterday voting to leave the scale of the scheme on hold. The remaining moneyin the programme will be exhausted by the time of the MPC's February meeting and it is then expected – barringshocks – to take the economy off its life support system.
The Inflation Mega-Trend Page 39
http://www.marketoracle.co.uk © 2010 Copyright Nadeem Walayat and Market Oracle Ltd

Though the mainstream press said basically the same thing last July when Q.E. was at £125 billion, as mentioned earlier.
Money Printing Theft of the Value From Holders of Existing Currency
Quantitative Easing is not a free lunch, the price of which is being paid for by savers as the supply of money increases so doesit decrease the value of all currency, this is most clearly evident by two indices,
1. Sterling exchange rate against other currencies, though all currencies are engaged in competitive devaluation so probablysomething like gold is a better indicator, in this case 2009 saw a devaluation of about 20% with more to come during 2010.
2. The inflation indices of which the Consumer Price Index is the government's preferred measure. Throughout 2009 and into2010 we have seen the base interest rate BELOW the rate of CPI inflation which means NEGATIVE real interest rates i.e. yourrate of interest is below the rate of inflation. This means that the bill for low / negative interest rates is being paid for by Saverswho along with all tax payers are being forced to pay for the bankster's crimes as tax payer bailed out banks such as HBOSpay a pittance on instant access savings accounts of as little as 0.1% against a requirement of 2.3% just to cover CPI inflationof 1.9% plus the 20% tax charged on interest.
Implications for Interest Rates
The Bank of England is likely to be reluctant to raise interest rates whilst Q.E. continues. Which therefore suggests rates willonly rise when the Bank of England is forced to raise rates by the markets as a consequence of risks of bond purchases. Whichsuggests 2010 is going to be a difficult year to forecast interest rates.
Improving UK Mortgage Lending Feeding the House Prices Bounce
The below graph shows UK Mortgage lending for House Purchases and Equity Withdrawals
The Government and Bank of England have succeeded in their primary objective of increasing both the supply of mortgagesand lowering the interest rate burden on borrowers so as to bring the UK house price crash to a halt, which suggests that interms of supply, the credit markets are starting to return to a LOW NORMAL state.
The Inflation Mega-Trend Page 40
http://www.marketoracle.co.uk © 2010 Copyright Nadeem Walayat and Market Oracle Ltd
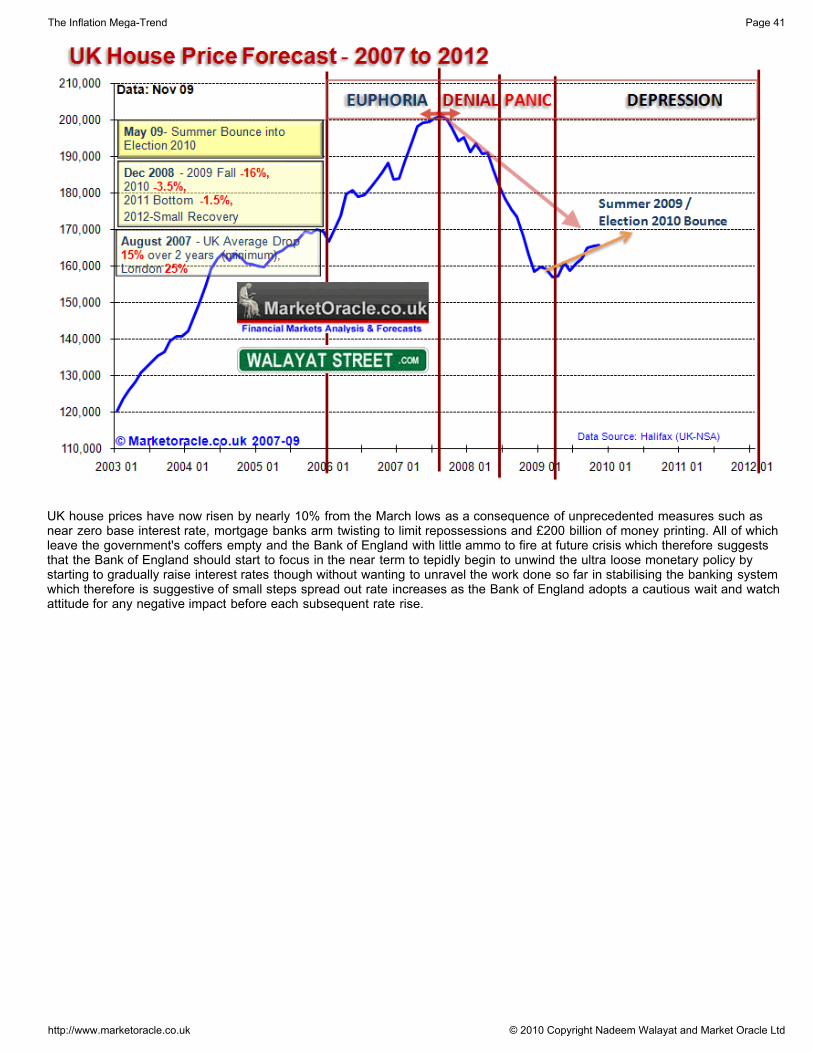
UK house prices have now risen by nearly 10% from the March lows as a consequence of unprecedented measures such asnear zero base interest rate, mortgage banks arm twisting to limit repossessions and £200 billion of money printing. All of whichleave the government's coffers empty and the Bank of England with little ammo to fire at future crisis which therefore suggeststhat the Bank of England should start to focus in the near term to tepidly begin to unwind the ultra loose monetary policy bystarting to gradually raise interest rates though without wanting to unravel the work done so far in stabilising the banking systemwhich therefore is suggestive of small steps spread out rate increases as the Bank of England adopts a cautious wait and watchattitude for any negative impact before each subsequent rate rise.
The Inflation Mega-Trend Page 41
http://www.marketoracle.co.uk © 2010 Copyright Nadeem Walayat and Market Oracle Ltd

British Pound Trends and Interest Rates
The below graph shows the UK base rate and sterling trends against the U.S. Dollar and Euro to test the widely heldhypothesis that Rising UK interest rates results in a rise in the exchange rate and conversely cuts in UK interest rates results ina fall in sterling.
The Pound / Dollar trend suggests that GBP tends to lead UK interest rates i.e. sterling has a tendency to rise against theDollar ahead of UK interest rate hikes and a tendency to fall against the Dollar ahead of UK interest rate cuts. The most recentprice action has seen sterling rally from £/$1.40 in early 2009 to above £/$1.60 as of the present which therefore implies thatthe currency markets are discounting future interest rate hikes.
The Pound / Euro trend suggests that the objective is aimed towards a stable exchange rate against the Euro i.e. less volatility,hence interest rates are used in an attempt to limit fluctuations as we saw between 1999 and 2007, as when the £/Euro ratewas high at 1.60 interest rates were cut, and when the £/Euro was below the floor of about 1.40 then interest rates had beensteadily increased so as to maintain the 1.40 floor. This is part of the Bank of England's objective of ensuring price stability bytracking the Euro.
However during 2008 and 2009 we saw a crash in sterling that traded to below 1.10 to near parity with the Euro as the Bank ofEngland abandoned everything in the interests of preventing financial and economic armageddon. However as the bankingsystem gradually stabilises, it is highly likely that Bank of England's focus will again shift towards price stability which meanskeeping sterling with-in a tight range against the Euro.
The £/Euro has managed to trend higher from near parity 12 months ago to today stand at 1.10. This is suggestive of a higherrange then seen over the past 12 months i.e. a probable wide target range of between 1.10 to 1.30 against the Euro, thereforethe current rate is at the floor which suggests a rise towards the target mid range of 1.20 which on face value suggests furtherdownside trend is limited and more than likely that the Pound will rise against the Euro towards 1.20, which therefore suggestsUK interest rates should be relatively higher than the ECB interest rate to reinforce this trading range.
In summary, the sterling trend is suggestive of the Bank of England targeting a £/Euro trading range of between 1.10 and1.30, which is therefore suggestive of relatively higher UK interest rates against the Euro-zones which my next analysis will lookat.
The Inflation Mega-Trend Page 42
http://www.marketoracle.co.uk © 2010 Copyright Nadeem Walayat and Market Oracle Ltd

UK, U.S. and Euro Interest Rate Trends Analysis
The below graph shows the key interest rates for the U.K., U.S. and E.U. so as to determine any advance trend change signalsfor UK base interest rates during 2010.
Fed Funds - The above graph clearly shows that the U.S. Fed Funds rate usually acts as a leading indicator for U.K. interestrates both in terms of timing and in terms of trend. The current trend shows no sign of an imminent increase in the Fed Fundsrate and therefore implies a UK base interest rate increase is not imminent either.
ECB - The European key interest rate trend shows a less volatile dataset then either that for the U.K. and U.S. which suggestsa more cautious response to economic events, this is borne out by the tendency for European interest rate trend changes to lagboth the U.S. and U.K. and therefore not particularly useful in signaling UK interest rate trend changes. However Europeaninterest rates are usually significantly below that of the UK interest rate due to less perceived risk, with a normal UK rate usuallyat least 1% above the European rate therefore at present would indicate a interest rate of 2% as a minimum.
Summary, U.S. Rate changes tend to lead UK rate changes, with UK rates usually at least at a 1% premium to eitherEuropean or U.S. rates which therefore illustrates the current state of an artificial heavily subsidised banking system with novisible sign that the central banks are willing to return to a normal market at this point in time and therefore implying that thefirst UK interest rate hike still remains many months away.
The Inflation Mega-Trend Page 43
http://www.marketoracle.co.uk © 2010 Copyright Nadeem Walayat and Market Oracle Ltd

UK Interest Rate Forecast 2010 - 2011 Conclusion
The difficulty in arriving at an interest rate forecast conclusion for 2010 is that we have a heavily supported artificial bankingsystem for the primary purpose of the near unlimited bailout of the banking sector. The problem in arriving at the forecast is thatI need to look beyond economic indicators and put myself into the mindset of the scared officials at the helm of the Bank ofEngland, who having tasted financial and economic armageddon are now so terrified by what they saw that they would rathercontinue to support the bankrupt banking sector for far too long and thereby allowing the bankster's to continue effectivelystealing billions of tax payer cash as 'bonuses' and also allow price inflation to let rip as a consequence of printing money.
But against the petrified Bank of England, reluctant to do anything that may risk a return to financial armageddon, we have themarket in the wake of a flood of government debt issuance that despite ever increasing quantitative easing demands higherinterest rates, otherwise the Bank of England risks Gilt Auction failures which could trigger a sterling crisis during 2010. So it isboth a tough balancing act for the Bank of England and a tough call for anyone to attempt to forecast UK interest rates for2010.
So why forecast if it's so difficult this year ?
Well, because finance and investing IS all about forecasting the future, perhaps if the bankster's had registered this fact thenthey would not have been caught up in generating short-term fictitious profit reports to bank huge bonuses, when at the end ofthe day today's decisions should boil down to what one thinks is a probable future outcome so as to allow investment decisionsto be made in the present.
The primary message from my accumulative analysis of inflation, economy and interest rates is that the Bank of EnglandWANTS to swim in the warm waters of Inflation after the deep freeze of Deflation, which strongly implies that the Bank ofEngland will IGNORE soaring inflation early 2010 and instead DELAY raising interest rates until it sees actual evidence of astrong economic recovery which my analysis suggests should transpire during the first half of 2010. Therefore the BoE will befocused on the quarterly GDP data, first Q1 to be released at the end of April 2010 and then Q2 to be released late July 2010.Which means that there is a high probability that the first rate rise may not materialise until August 2010. After which rates willbe increased not in line with inflation but in line with improving GDP and other indicators of economic activity into the end of2010.
As a final conclusion, I expect a presently petrified Bank of England to be gradually forced by the market to start raisingthe UK Base interest rate in small steps of 0.25%, with the first rate rise probably coming just before release of Q2 GDP Data(July) in June 2010 i.e. after the next general election deadline and then followed in August and September 2010 on furtherindications of improving economic activity. My concluding target is 3% by mid 2011, the difficulty is in saying where rates will beat the end of 2010 as the range is 1.5% to 2%.
UK Interest Rates Forecast 2010-11: UK interest Rates to Start Rising From Mid 2010 and Continueinto end of 2010 to Target 1.75% / 2%, Continue Higher into Mid 2011 to Target 3%.
The Inflation Mega-Trend Page 44
http://www.marketoracle.co.uk © 2010 Copyright Nadeem Walayat and Market Oracle Ltd
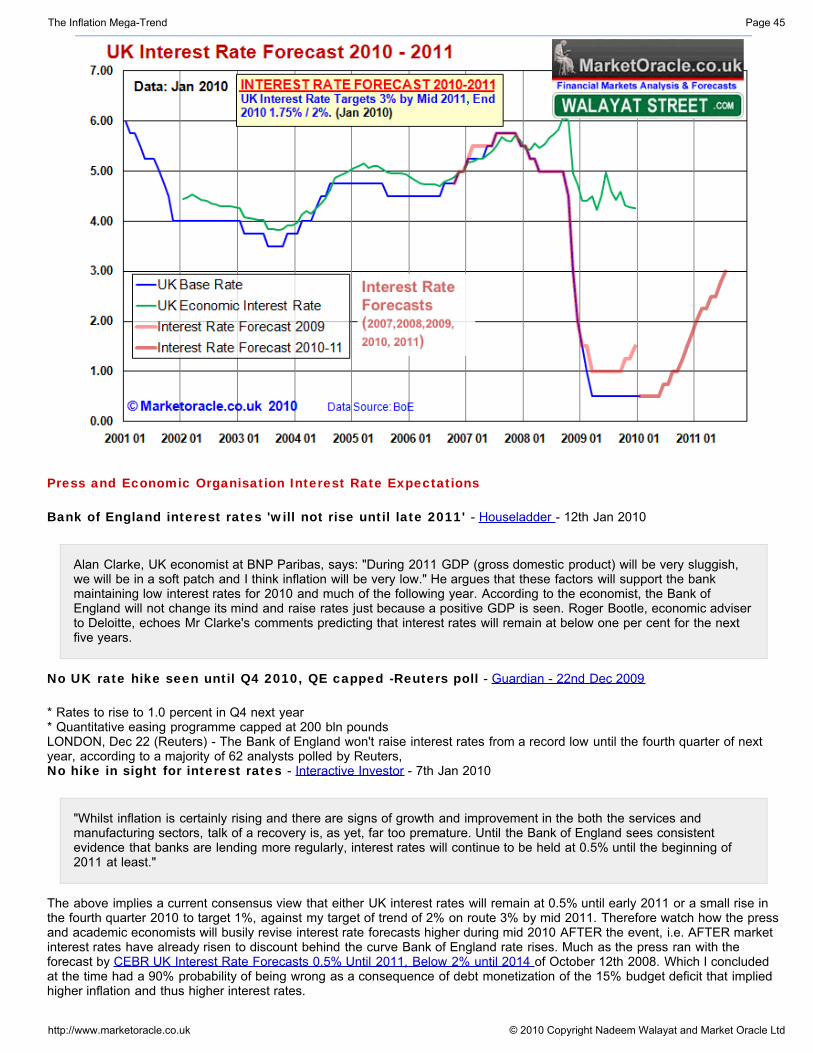
Press and Economic Organisation Interest Rate Expectations
Bank of England interest rates 'will not rise until late 2011' - Houseladder - 12th Jan 2010
Alan Clarke, UK economist at BNP Paribas, says: "During 2011 GDP (gross domestic product) will be very sluggish,we will be in a soft patch and I think inflation will be very low." He argues that these factors will support the bankmaintaining low interest rates for 2010 and much of the following year. According to the economist, the Bank ofEngland will not change its mind and raise rates just because a positive GDP is seen. Roger Bootle, economic adviserto Deloitte, echoes Mr Clarke's comments predicting that interest rates will remain at below one per cent for the nextfive years.
No UK rate hike seen until Q4 2010, QE capped -Reuters poll - Guardian - 22nd Dec 2009
* Rates to rise to 1.0 percent in Q4 next year* Quantitative easing programme capped at 200 bln poundsLONDON, Dec 22 (Reuters) - The Bank of England won't raise interest rates from a record low until the fourth quarter of nextyear, according to a majority of 62 analysts polled by Reuters,No hike in sight for interest rates - Interactive Investor - 7th Jan 2010
"Whilst inflation is certainly rising and there are signs of growth and improvement in the both the services andmanufacturing sectors, talk of a recovery is, as yet, far too premature. Until the Bank of England sees consistentevidence that banks are lending more regularly, interest rates will continue to be held at 0.5% until the beginning of2011 at least."
The above implies a current consensus view that either UK interest rates will remain at 0.5% until early 2011 or a small rise inthe fourth quarter 2010 to target 1%, against my target of trend of 2% on route 3% by mid 2011. Therefore watch how the pressand academic economists will busily revise interest rate forecasts higher during mid 2010 AFTER the event, i.e. AFTER marketinterest rates have already risen to discount behind the curve Bank of England rate rises. Much as the press ran with theforecast by CEBR UK Interest Rate Forecasts 0.5% Until 2011, Below 2% until 2014 of October 12th 2008. Which I concludedat the time had a 90% probability of being wrong as a consequence of debt monetization of the 15% budget deficit that impliedhigher inflation and thus higher interest rates.
The Inflation Mega-Trend Page 45
http://www.marketoracle.co.uk © 2010 Copyright Nadeem Walayat and Market Oracle Ltd
Inflation Mega-Trend Conclusion and Opportunities From Crisis
The inflation mega-trend continues to gather momentum, fed by literally out of control budget deficits that are being monetizedby the printing of money (electronically) by ALL developed countries, for example this year the UK government will issue £225billion of debt or £3,750 per every man women and child in the country, this IS out of control borrowing that risks nationalbankruptcy that will manifest itself as ever higher inflation that looks set to accelerate over the coming years.
All of the developed countries are running huge budget deficits in the order of 10-15% of annual GDP which is resulting in theloss of value of all fiat currencies against which people MUST seek to protect their wealth. The huge official debtburdens of approaching and passing 100% of GDP (Real debt is many times higher than official debt) are not going to go away,the only way government's can respond to such debt is through competitive currency devaluations i.e. INFLATION.
The government's of the world have been busy writing unlimited cheque's to bailout the bankster's who they primarily serve, theonly problem is ALL of the pain will be felt by ordinary tax payers and NOT the politicians, who as we saw in the UK during2009 have been busy burrowing their snouts in the expenses troughs so as to ensure that virtually every day to day livingexpense is a freebie at tax payers expense whilst tax payers are about to be hit by huge taxes.
Meanwhile Deflationists continue to look to Japan as the example of what is to transpire, however all Japan has done is to setitself up for an ever bigger inflationary BUST, Japanese public debt is now over 200% of GDP, this debt will resolve into highinflation. The Japanese government's response instead of addressing inflation will be pour more petrol onto the inflationary firesand could spark HYPERINFLATION. That is where Japan is heading and we SHOULD NOT MAKE THE SAME MISTAKE.However that is what academics and journalists that delude themselves that they are economists continuously advocate i.e.Keynesian deficit spending without end.
Furthermore, low interest rates plus rising inflation amounts to THEFT FROM SAVERS and WORKERS and all existingcurrency holders, including bond investors, therefore the best strategy to protect ones wealth is to diversifying OUT of fiatcurrencies. This strategy must remain in force as long as government's continue to run budget deficits that results in moreaccumulated debt resulting in higher debt to GDP ratios and hence more money printing and inflation as part of a perpetualinflationary debt spiral.
People have been conditioned by politicians and the mainstream press to think that inflation is not only normal but it is good, itis NOT GOOD nor NORMAL, Inflation is a stealth tax on your savings and earnings that over time seeks toSTEAL the value of all that you have accumulated during a life time of hard work which is why mostpensioners in Britain retire with savings that have little real value, whereas if there were NO inflation ALL of your savings wouldretain the SAME value throughout your life.
Inflation is created by government's and the banking cartel by a number of means but primarily as a consequence of thefractional reserve banking system that effectively allows the banks to continuously conjure new money out of thin air thatcontinues to erode the value of all existing money as manifested by near continuous year on year high growth in the moneysupply far beyond that which is necessary as a consequence of economic growth.
Furthermore whilst people are forced to link their earnings against the official inflation indices such as the CPI and RPI, the realrate of inflation is usually significantly higher due to the fact that over time successive government's have sought to raise thestealth tax on their citizens by means of manipulating the official inflation indices lower. This has been illustrated earlier in thisebook which shows that the real UK inflation rate usually tends to be between 1.5% and 3.5% above theofficial CPI rate.
You are reading this at the very beginning of the inflationary mega-trend that will probably culminatein an inflationary super spike many years from now, whilst many commodities have rebounded somewhat from thecrash of 2008-2009, however we have yet to see the inflation mega-trend manifest itself in the various manipulated inflationindices of the world, especially as the consensus view amongst academic economists and the mainstream press is still that ofDEFLATION. However once inflation manifest itself in these manipulated indices then watch as the wage price spiral kicks inand pushes fixed assets and scarce resource prices such as commodities to unimaginable heights over the coming decade.
The Inflation Mega-Trend Page 46
http://www.marketoracle.co.uk © 2010 Copyright Nadeem Walayat and Market Oracle Ltd

Opportunities From Crisis
The financial crisis that led to the stock and commodity market crash of 2008 - 2009 presented stock and commodity marketinvestors with a golden opportunity to buy at bargain basement prices. Similarly the global sovereign debt crisis of 2010 looksset to generate enormous profit potentials to again buy assets at bargain basement prices, as of writing the headlines areconcerned with the risk of a Greece debt default and a break up of the Euro. In my opinion investors should view crisis such asthese as new potential opportunities to accumulate at rock bottom prices on any short-term price plunges against the long-terminflation mega-trend sensitive investments.
The current sovereign debt crisis is manifesting itself in those developed countries at greatest risk of default, namely Greece,Spain and Portugal which are showing an extremely wide yield spread against German bonds on the basis of one or more ofthese countries being ejected out of the Euro which in my opinion is not going to happen because the primary purpose for thecreation of the Eurozone and Euro single currency is to avoid World War III by keeping Germany firmly locked into a EuropeanUnion, therefore economic and financial considerations are of secondary importance which implies the risk of booting out any ofthe EU members due to economic factors is extremely low, thus the yield spreads present a huge current profit potential, this isbut one example of how crisis present great opportunities to accumulate into.
Therefore Investors need to always keep in the back of their minds the potential investmentopportunity whenever they see doom and gloom headlines of financial and economic armageddon inthe mainstream press.
The next chapter seeks to give clear conclusions and precise forecasts for many key markets impacted by the inflation mega-trend, on how to protect and grow ones wealth for 2010 and many years beyond as a starting point for your own research,starting with the Agricultural commodities as the grains appear to be trading at ideal levels for long-term mega-trendaccumulation right now!
To keep updated on the unfolding Inflation Mega-Trend, ensure you are subscribed to my always free newsletter (onlyrequirement is a valid email address). You may also visit my extensive article and regularly updated analysis archive athttp://walayatstreet.com
Your Inflation Mega-trend analyst.
Nadeem Walayat31st Jan 2010
The Inflation Mega-Trend Page 47
http://www.marketoracle.co.uk © 2010 Copyright Nadeem Walayat and Market Oracle Ltd
CHAPTER 4
Financial and Investment Implications
Agricultural CommoditiesStocks and Commodities have boomed following the March 2009 lows, but grains have NOT ! They are STILL trading near thelows and therefore the grains are presenting one of those once in a life time mega-trend buying opportunities right now ! Readon....
Population Growth
The world population now stands at 7 billion, an increase of 50% over the past 50 years and is expected to increase again byanother 50% over the next 50 years towards a target of 10.5 billion. However the forces that are expected to drive food andcommodity prices ever higher are even more notable when one considers the growing size of the middle classes of emergingmarket countries such as India and China that will demand a similar standard of living to that enjoyed in the west that will resultin the doubling of the worlds middle class within much shorter space of time and therefore resulting in a far greater impact oncommodity prices than which is implied by the overall rate of population growth.
Whilst the population growth will continue to drive the price for all scarce commodities inexorably higher (allowing for seasonalvariations), however the agri-food's sector in particular is expected manifest the inflationary mega-trend to a greater degree overthe coming years, as no matter what happens to the worlds economies during the next decade as recessions come and go, anoverall growing and more affluent world population will continue to increasingly favour a more varied and costly food diet. Thistherefore brings my first focus of the inflation mega-trend to agri-food's. Especially as wages tend to be far more sensitive tofood prices than that for other goods and services, therefore world government's are expected to adopt inflationary responsesto any future food crisis which will continue to feed the overall long-term wage / food price growth spiral at a higher velocityespecially for the developing countries which is a strong contributory factor towards the inflation mega-trend.
Global Warming Mega-trend
The earth is not only warming but it has ALREADY increased by an average temperature of 1 degree ! a near unprecedentedrate that continues to accelerate, this mega-trend is being borne out by changing weather patterns and severe impact onagriculture right across the world as deserts expand. Global warming is showing itself in rising foods prices. What this suggestsis that the inflationary mega trend can be strongly exhibited in near across the board annual food price rises and therefore agri-food's should form an important part of the inflationary mega trend investing for the next decade.
On top of the global warming impact on commodities, we have the inflationary impact of increasing natural disasters as wewitnessed with Hurricane Katrina, as government's respond to $100+ billion disasters by printing money as the world moves intoa new generation of super storms more powerful than Cat 5.
Methane Hydrates Ticking Time BombWhilst I in no way claim to be a climate scientist, however the threat posed from the release of methane hydrate deposits(mostly formed from dead plankton) situated around the world that is 20 times more potent a green house gas that co2 doesrequire the world to sit up and take notice of the serious risks that Man made global warming could trigger a release of at leastsome of these methane deposits that could at the very LEAST DOUBLE the temperature increase upto that point as the gas isonly stable at low temperatures.
However I cannot resist the being intrigued by the investment opportunity from a Natural Gas supply point of view, with themethane hydrate deposits situated right across the worlds coastal regions, especially clustering in Siberia, North and CentralAmerica, as well as to the North of Britain, which could literally supply Natural Gas for at least another thousand years.
Agricultural Commodity Trends
Therefore the expectations of continual year on year increase in demand against the extreme difficulty of expanding supplysupports the view that the food sector will be most likely to experience significant inflation over most other commodity groups.On top of demand for human consumption we are also witnessing existing food production being increasingly utilised towardsthe production of bio fuels such as ethanol, which further supports my mega-trend view that this is one of the key sectors thatwill experience serious and sustained price inflation.
The Inflation Mega-Trend Page 48
http://www.marketoracle.co.uk © 2010 Copyright Nadeem Walayat and Market Oracle Ltd
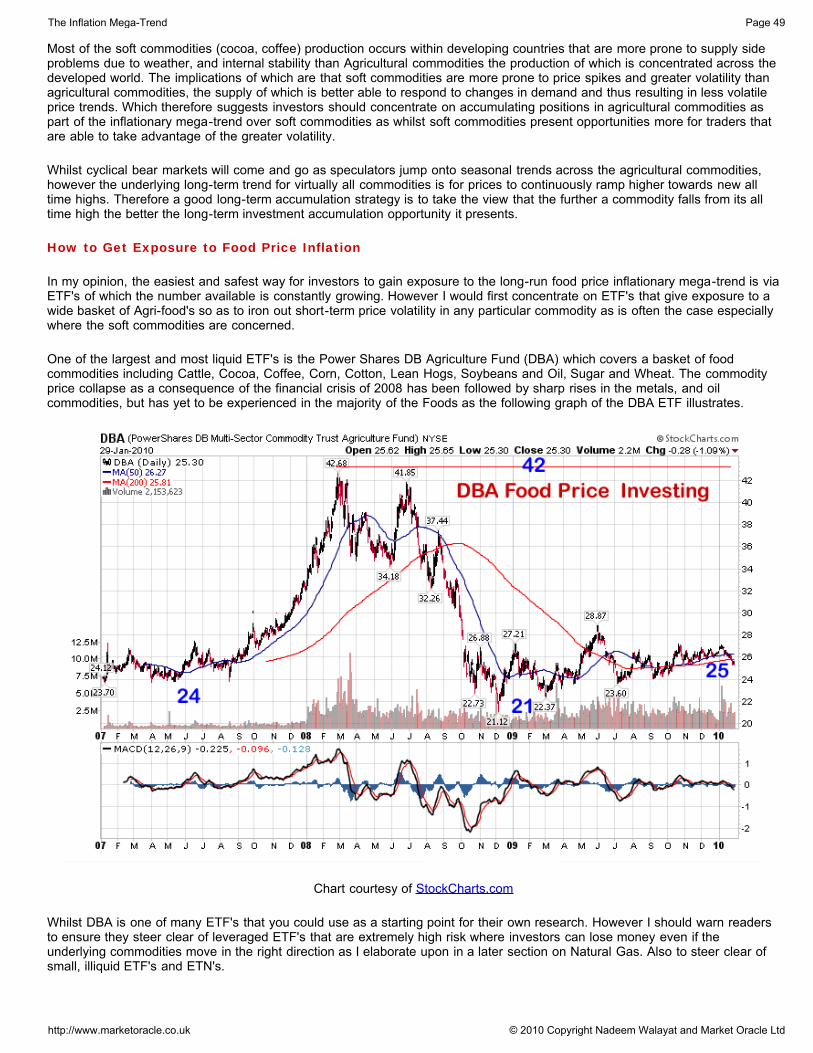
Most of the soft commodities (cocoa, coffee) production occurs within developing countries that are more prone to supply sideproblems due to weather, and internal stability than Agricultural commodities the production of which is concentrated across thedeveloped world. The implications of which are that soft commodities are more prone to price spikes and greater volatility thanagricultural commodities, the supply of which is better able to respond to changes in demand and thus resulting in less volatileprice trends. Which therefore suggests investors should concentrate on accumulating positions in agricultural commodities aspart of the inflationary mega-trend over soft commodities as whilst soft commodities present opportunities more for traders thatare able to take advantage of the greater volatility.
Whilst cyclical bear markets will come and go as speculators jump onto seasonal trends across the agricultural commodities,however the underlying long-term trend for virtually all commodities is for prices to continuously ramp higher towards new alltime highs. Therefore a good long-term accumulation strategy is to take the view that the further a commodity falls from its alltime high the better the long-term investment accumulation opportunity it presents.
How to Get Exposure to Food Price Inflation
In my opinion, the easiest and safest way for investors to gain exposure to the long-run food price inflationary mega-trend is viaETF's of which the number available is constantly growing. However I would first concentrate on ETF's that give exposure to awide basket of Agri-food's so as to iron out short-term price volatility in any particular commodity as is often the case especiallywhere the soft commodities are concerned.
One of the largest and most liquid ETF's is the Power Shares DB Agriculture Fund (DBA) which covers a basket of foodcommodities including Cattle, Cocoa, Coffee, Corn, Cotton, Lean Hogs, Soybeans and Oil, Sugar and Wheat. The commodityprice collapse as a consequence of the financial crisis of 2008 has been followed by sharp rises in the metals, and oilcommodities, but has yet to be experienced in the majority of the Foods as the following graph of the DBA ETF illustrates.
Chart courtesy of StockCharts.com
Whilst DBA is one of many ETF's that you could use as a starting point for their own research. However I should warn readersto ensure they steer clear of leveraged ETF's that are extremely high risk where investors can lose money even if theunderlying commodities move in the right direction as I elaborate upon in a later section on Natural Gas. Also to steer clear ofsmall, illiquid ETF's and ETN's.
The Inflation Mega-Trend Page 49
http://www.marketoracle.co.uk © 2010 Copyright Nadeem Walayat and Market Oracle Ltd

For UK Investors who may not be able be to invest in some U.S. ETF's, alternatives are available such as AIGA which tracksthe DJ-AIGCI commodities index and has shown a similar performance to the DBA, again when selecting ETF's ensure tocheck the actual performance of the ETF against the underlying index and ensure that the ETF is liquid.
In conclusion, as mentioned earlier and in the context of a long-term investment, the grains in my opinion are presenting just asgood a opportunity to buy now as the metals and stocks were during early 2009. Now I am not saying that they will immediatelyrocket higher, and may even not respond for the whole of 2010, BUT they will at some point over the next few years PASStheir all time highs.
Borrowers and Savers
BORROWERS
Firstly do not forget that the primary purpose of the banking sector is to turn everyone (including government's) into debt slaves.So the first objective is for people to implement a plan to FREE themselves from DEBT SLAVERY. The artificial bankingsystem is currently running on a huge profit margin which means borrowers are paying through the nose despite a 0.5% baseinterest rate and 0.63% interbank rate i.e. borrowers are paying many multiple of times in excess of the rates banks borrow at,from mortgages with SVR's hovering around 6%, to personal loans of 10% to 15% to credit cards of 20%+, which aregenerating huge profits for the tax payer bailed out banks supposedly for the purpose for the banks to rebuild their balancesheets but as we are again witnessing is in significant part being pocketed by bankster's as bonuses for profits that ONLY existbecause of the tax payer cash.
So given the fact that the banks are already running on huge profit margins, therefore I do not see much change in rates formost borrowers during the year as the interest rates charged are already excessively high which effectively discount a muchhigher base interest rate north of 4%, which means there is plenty of scope for borrowing rates to actually fall during the yearrather than to rise.
Mortgages - Most people can only get on housing ladder with a mortgage, therefore the prime consideration for borrowers isin able to service the loan, in this regard the long standing but often broken rule of not borrowing more than X3.5 salariesshould be at the forefront of ones mind. This rule is not to prevent you from buying a bigger house, but to prevent you fromLOSING your current home. That, coupled with a minimum deposit of 25% should signal when someone is ready to buy. Ifsomeone only has a 5% deposit or not enough income, then to be blunt you should NOT be considering to buy a house. I willcover the UK housing market in depth in my next ebook. I expect mortgage interest rates to be little changed for mostborrowers. However those that are the most desirable customers in terms of credit risk are likely to see the rates on the bestproducts rise marginally.
Pay Day Loans - During the great recession many pay day loan outfits have sprung up that offer to fill the gap between eachpay cheque with near instant small loans of upto £1000 that borrowers are further enticed to roll over into the next pay day. Tobe blunt, if you are considering these types of loans then you might as well put a gun to your head for all of the distress theywill eventually cause you. Whilst the base rate is at 0.5%, pay day loan outfits are charging over 2,000% APR. These types ofloans should be illegal in Britain but they are not, which just illustrates how inept the financial regulator is in allowing ordinarycitizens to fall victim to 'legal' loan sharks. If the FSA had the best interests of the general public at heart then it would lobby thegovernment to introduce legislation to CAP ALL interest rates at base rate plus 10%. Yes it would mean that the financiallyilliterate presently taking on extremely high risk loans would usually be denied loans due to the risk / reward factor, but that ishow it should be.
SAVERS
After the wipeout of 2009 when savers subsidised the bailout of the banking sector through ultra low interest rates of as little as0.1%, 2010 should see some decent recovery in nominal savings rates and hopefully in real rates of interest as well (afterinflation and taxes). The best variable rates are usually 1% to 1.5% above the base rate. Fixed rates offer a premium of approx2 to 3% depending on the term fixed. So by the end of 2010, this is suggestive of a variable interest rate in the region of 2.75%to 3.5% and fixed rates of between 4% to 5%, which should take place BEFORE the first base interest rate hike as marketcompetition will move ahead of the curve to discount future interest rates mid year. This suggests savers are probably better offNOT fixing now in advance of rising market savings rates by the time of the first base rate hike.
Cash ISA's - Whilst NOT an inflation hedge, however they do allow savers to receive interest payments tax free in perpetuity(until death) and provide a hedge against future tax rises which will soon hit all income brackets. Currently, the equivalenttaxable return on a 3% cash ISA for standard rate tax payers is 3.6%. For higher rate tax payers it is 4.2%.
The Inflation Mega-Trend Page 50
http://www.marketoracle.co.uk © 2010 Copyright Nadeem Walayat and Market Oracle Ltd
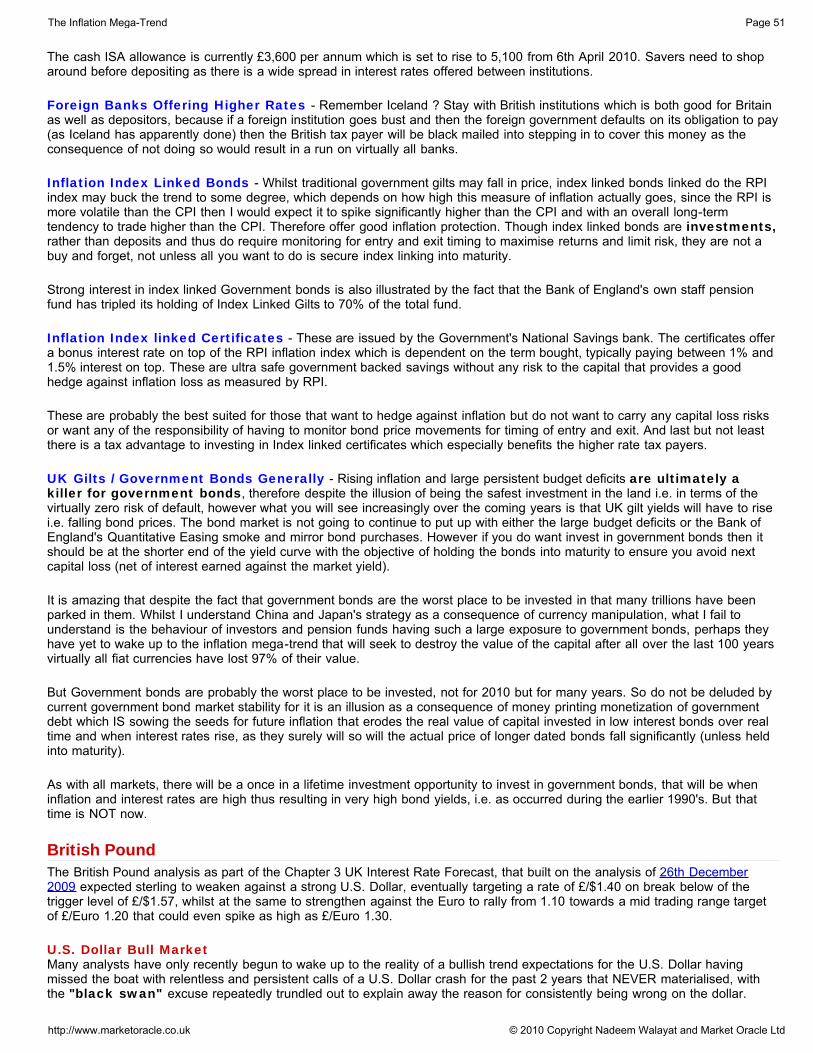
The cash ISA allowance is currently £3,600 per annum which is set to rise to 5,100 from 6th April 2010. Savers need to shoparound before depositing as there is a wide spread in interest rates offered between institutions.
Foreign Banks Offering Higher Rates - Remember Iceland ? Stay with British institutions which is both good for Britainas well as depositors, because if a foreign institution goes bust and then the foreign government defaults on its obligation to pay(as Iceland has apparently done) then the British tax payer will be black mailed into stepping in to cover this money as theconsequence of not doing so would result in a run on virtually all banks.
Inflation Index Linked Bonds - Whilst traditional government gilts may fall in price, index linked bonds linked do the RPIindex may buck the trend to some degree, which depends on how high this measure of inflation actually goes, since the RPI ismore volatile than the CPI then I would expect it to spike significantly higher than the CPI and with an overall long-termtendency to trade higher than the CPI. Therefore offer good inflation protection. Though index linked bonds are investments,rather than deposits and thus do require monitoring for entry and exit timing to maximise returns and limit risk, they are not abuy and forget, not unless all you want to do is secure index linking into maturity.
Strong interest in index linked Government bonds is also illustrated by the fact that the Bank of England's own staff pensionfund has tripled its holding of Index Linked Gilts to 70% of the total fund.
Inflation Index linked Certificates - These are issued by the Government's National Savings bank. The certificates offera bonus interest rate on top of the RPI inflation index which is dependent on the term bought, typically paying between 1% and1.5% interest on top. These are ultra safe government backed savings without any risk to the capital that provides a goodhedge against inflation loss as measured by RPI.
These are probably the best suited for those that want to hedge against inflation but do not want to carry any capital loss risksor want any of the responsibility of having to monitor bond price movements for timing of entry and exit. And last but not leastthere is a tax advantage to investing in Index linked certificates which especially benefits the higher rate tax payers.
UK Gilts / Government Bonds Generally - Rising inflation and large persistent budget deficits are ultimately akiller for government bonds, therefore despite the illusion of being the safest investment in the land i.e. in terms of thevirtually zero risk of default, however what you will see increasingly over the coming years is that UK gilt yields will have to risei.e. falling bond prices. The bond market is not going to continue to put up with either the large budget deficits or the Bank ofEngland's Quantitative Easing smoke and mirror bond purchases. However if you do want invest in government bonds then itshould be at the shorter end of the yield curve with the objective of holding the bonds into maturity to ensure you avoid nextcapital loss (net of interest earned against the market yield).
It is amazing that despite the fact that government bonds are the worst place to be invested in that many trillions have beenparked in them. Whilst I understand China and Japan's strategy as a consequence of currency manipulation, what I fail tounderstand is the behaviour of investors and pension funds having such a large exposure to government bonds, perhaps theyhave yet to wake up to the inflation mega-trend that will seek to destroy the value of the capital after all over the last 100 yearsvirtually all fiat currencies have lost 97% of their value.
But Government bonds are probably the worst place to be invested, not for 2010 but for many years. So do not be deluded bycurrent government bond market stability for it is an illusion as a consequence of money printing monetization of governmentdebt which IS sowing the seeds for future inflation that erodes the real value of capital invested in low interest bonds over realtime and when interest rates rise, as they surely will so will the actual price of longer dated bonds fall significantly (unless heldinto maturity).
As with all markets, there will be a once in a lifetime investment opportunity to invest in government bonds, that will be wheninflation and interest rates are high thus resulting in very high bond yields, i.e. as occurred during the earlier 1990's. But thattime is NOT now.
British PoundThe British Pound analysis as part of the Chapter 3 UK Interest Rate Forecast, that built on the analysis of 26th December2009 expected sterling to weaken against a strong U.S. Dollar, eventually targeting a rate of £/$1.40 on break below of thetrigger level of £/$1.57, whilst at the same to strengthen against the Euro to rally from 1.10 towards a mid trading range targetof £/Euro 1.20 that could even spike as high as £/Euro 1.30.
U.S. Dollar Bull MarketMany analysts have only recently begun to wake up to the reality of a bullish trend expectations for the U.S. Dollar havingmissed the boat with relentless and persistent calls of a U.S. Dollar crash for the past 2 years that NEVER materialised, withthe "black swan" excuse repeatedly trundled out to explain away the reason for consistently being wrong on the dollar.
The Inflation Mega-Trend Page 51
http://www.marketoracle.co.uk © 2010 Copyright Nadeem Walayat and Market Oracle Ltd
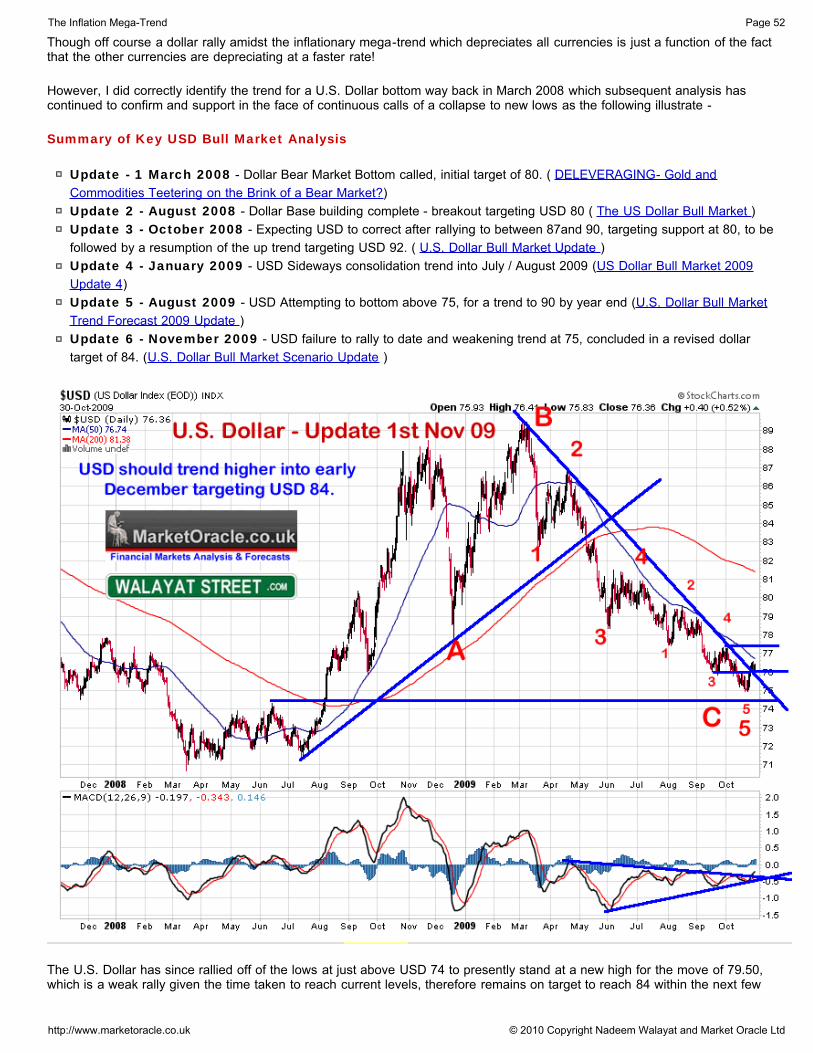
Though off course a dollar rally amidst the inflationary mega-trend which depreciates all currencies is just a function of the factthat the other currencies are depreciating at a faster rate!
However, I did correctly identify the trend for a U.S. Dollar bottom way back in March 2008 which subsequent analysis hascontinued to confirm and support in the face of continuous calls of a collapse to new lows as the following illustrate -
Summary of Key USD Bull Market Analysis
Update - 1 March 2008 - Dollar Bear Market Bottom called, initial target of 80. ( DELEVERAGING- Gold andCommodities Teetering on the Brink of a Bear Market?)Update 2 - August 2008 - Dollar Base building complete - breakout targeting USD 80 ( The US Dollar Bull Market )Update 3 - October 2008 - Expecting USD to correct after rallying to between 87and 90, targeting support at 80, to befollowed by a resumption of the up trend targeting USD 92. ( U.S. Dollar Bull Market Update )Update 4 - January 2009 - USD Sideways consolidation trend into July / August 2009 (US Dollar Bull Market 2009Update 4)Update 5 - August 2009 - USD Attempting to bottom above 75, for a trend to 90 by year end (U.S. Dollar Bull MarketTrend Forecast 2009 Update )Update 6 - November 2009 - USD failure to rally to date and weakening trend at 75, concluded in a revised dollartarget of 84. (U.S. Dollar Bull Market Scenario Update )
The U.S. Dollar has since rallied off of the lows at just above USD 74 to presently stand at a new high for the move of 79.50,which is a weak rally given the time taken to reach current levels, therefore remains on target to reach 84 within the next few
The Inflation Mega-Trend Page 52
http://www.marketoracle.co.uk © 2010 Copyright Nadeem Walayat and Market Oracle Ltd
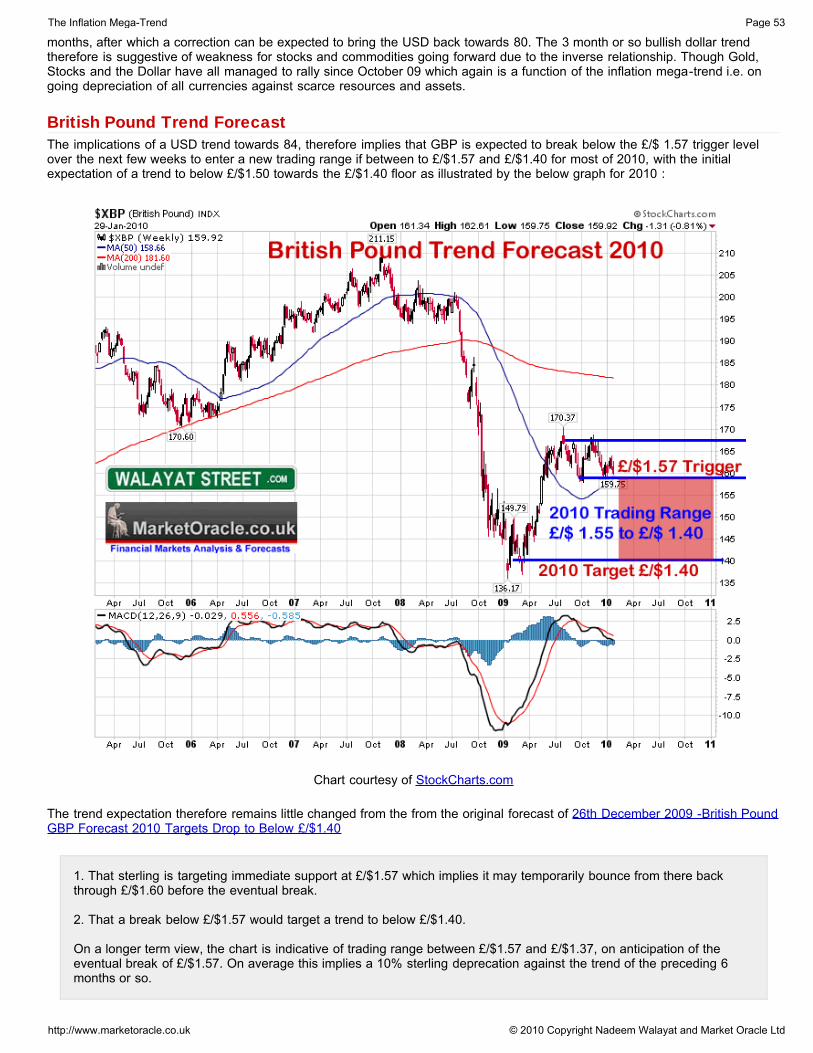
months, after which a correction can be expected to bring the USD back towards 80. The 3 month or so bullish dollar trendtherefore is suggestive of weakness for stocks and commodities going forward due to the inverse relationship. Though Gold,Stocks and the Dollar have all managed to rally since October 09 which again is a function of the inflation mega-trend i.e. ongoing depreciation of all currencies against scarce resources and assets.
British Pound Trend ForecastThe implications of a USD trend towards 84, therefore implies that GBP is expected to break below the £/$ 1.57 trigger levelover the next few weeks to enter a new trading range if between to £/$1.57 and £/$1.40 for most of 2010, with the initialexpectation of a trend to below £/$1.50 towards the £/$1.40 floor as illustrated by the below graph for 2010 :
Chart courtesy of StockCharts.com
The trend expectation therefore remains little changed from the from the original forecast of 26th December 2009 -British PoundGBP Forecast 2010 Targets Drop to Below £/$1.40
1. That sterling is targeting immediate support at £/$1.57 which implies it may temporarily bounce from there backthrough £/$1.60 before the eventual break.
2. That a break below £/$1.57 would target a trend to below £/$1.40.
On a longer term view, the chart is indicative of trading range between £/$1.57 and £/$1.37, on anticipation of theeventual break of £/$1.57. On average this implies a 10% sterling deprecation against the trend of the preceding 6months or so.
The Inflation Mega-Trend Page 53
http://www.marketoracle.co.uk © 2010 Copyright Nadeem Walayat and Market Oracle Ltd
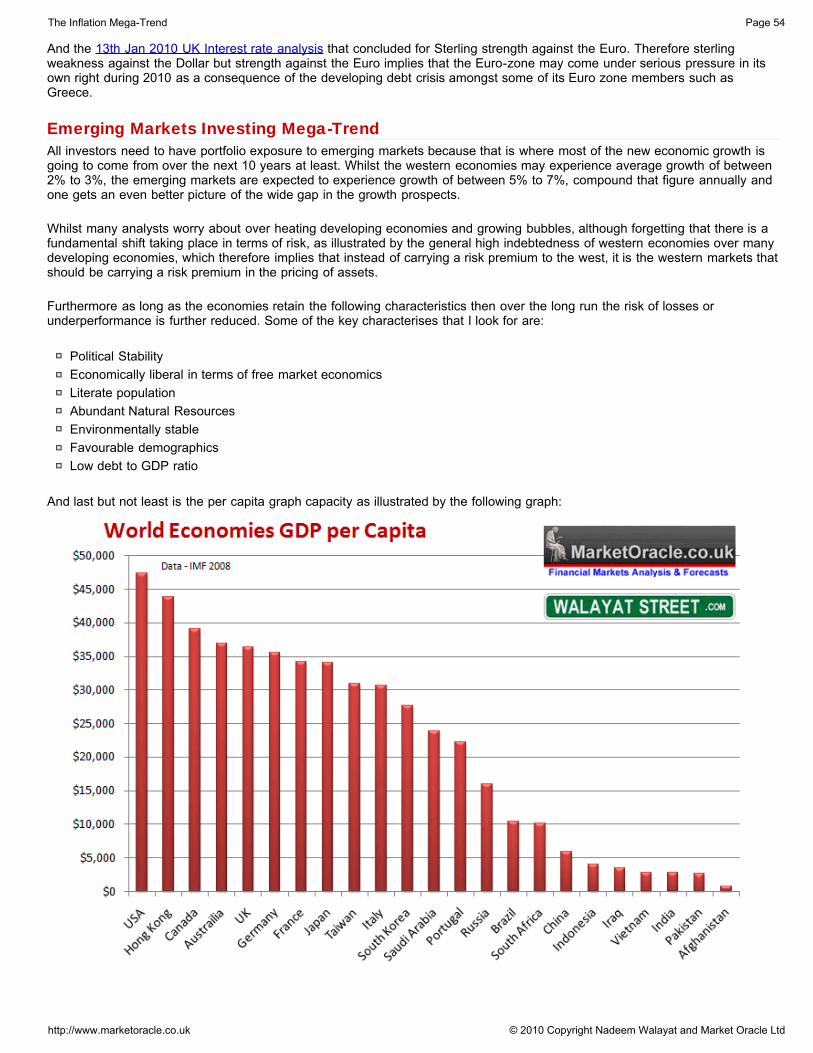
And the 13th Jan 2010 UK Interest rate analysis that concluded for Sterling strength against the Euro. Therefore sterlingweakness against the Dollar but strength against the Euro implies that the Euro-zone may come under serious pressure in itsown right during 2010 as a consequence of the developing debt crisis amongst some of its Euro zone members such asGreece.
Emerging Markets Investing Mega-TrendAll investors need to have portfolio exposure to emerging markets because that is where most of the new economic growth isgoing to come from over the next 10 years at least. Whilst the western economies may experience average growth of between2% to 3%, the emerging markets are expected to experience growth of between 5% to 7%, compound that figure annually andone gets an even better picture of the wide gap in the growth prospects.
Whilst many analysts worry about over heating developing economies and growing bubbles, although forgetting that there is afundamental shift taking place in terms of risk, as illustrated by the general high indebtedness of western economies over manydeveloping economies, which therefore implies that instead of carrying a risk premium to the west, it is the western markets thatshould be carrying a risk premium in the pricing of assets.
Furthermore as long as the economies retain the following characteristics then over the long run the risk of losses orunderperformance is further reduced. Some of the key characterises that I look for are:
Political StabilityEconomically liberal in terms of free market economicsLiterate populationAbundant Natural ResourcesEnvironmentally stableFavourable demographicsLow debt to GDP ratio
And last but not least is the per capita graph capacity as illustrated by the following graph:
The Inflation Mega-Trend Page 54
http://www.marketoracle.co.uk © 2010 Copyright Nadeem Walayat and Market Oracle Ltd
At the present, the mainstream press is busy worrying about the credit bubble in China, however the economic growth to datehas barely bridged the huge gap between the emerging market giants and established western economies which implies a hugepotential for the gap to narrow as manifested by strong growth in the emerging markets and below trend growth or eveneconomic stagnation by many of the western economies which means that capital investments made today can be expected toreturn significant real capital growth over the next 10 years on the basis of real GDP growth that typically targets a growthincrease of 100%.
Global Warming Impact on Emerging MarketsThe most immediate impact of global warming is on agricultural production due to desert expansion and variability of freshwater supplies. This will most likely impact the 2.5+ billion people across China and India where the share of imported foodsupplies will continue to increase, thus highly inflationary domestically which will undoubtedly be exported abroad in terms ofhigher costs of production and supply of services.
With the continuing sea level rise spelling even worse disasters for low lying countries such as Bangladesh which will haveincreasing inflationary consequences due to millions of people becoming climate change refugees.
DemographicsMany analysts are mistakenly fixated on the so called deflation of Japan being replicated especially in the West whilstcompletely forgetting the fact that what is driving Japanese stagnation is demographics i.e. the large ageing population that isnot as apparent to anywhere near the same extent in either the UK or US, as both have active and favourable policies forIMPORTING young and productive populations from abroad. Though this does put an investment time frame limit on thedeveloping economies such as China which will eventually hit their own demographic time bombs similar to that of Japans,where China's working age population is expected to peak by 2020 and then decline as the burden of the elderly grows. Butstill offer a good 10 to 15 years of strong growth before economic activity can be expected to taper off as a consequence ofdemographics.
CHINAThe Chinese fast growing economy with consistent annual growth rates of 10% per annum is on course towards becoming theworlds dominant economy over the next 10 - 15 years, with GDP per capita at just $6,000, China's economy retains thecapacity to keep doubling in size several more times before growth rates seriously start to diminish, therefore despite thegrowth to date the economy still has a long way to go towards even reaching half the per capita income of that of the westerneconomies.
The financial crisis had afforded investors with a great once in a life time buying opportunity to buy into China's growth story atless than SSEC 2000. Maybe we will get some more chances over the coming year though probably nowhere near the depthsof what we saw during 2009, therefore the best strategy is to scale into China over a period of time as I mentioned as part ofmy bear market accumulation strategy way back in October 2008 (Stocks Bear Market Long-term Investing Strategy).
With over $2.4 trillion of reserves and growing by some $400 billion per year, little debt and a very high savings rate of over30%, China can afford to keep going on highly expansive inflationary stimulus spending sprees so as to buffer its economy fromany future economic and financial crisis, whilst in the west each new stimulus will be financed by ever more debt that will haveto serviced by means of interest payments in large part PAID to CHINA.
Chinas first growth phase was led by export growth that is gradually feeding into domestic consumption growth which in turn isbeing followed by the financial growth phase. Which means as long as China does not make the same mistakes as westerneconomies by putting a debt noose around their necks then China remains the investment destination.
The ultimate impact of the Chinese economic super power is that the world will increasingly turn Chinese, as more wealthyChinese travel abroad so will tens of millions of wealthy Chinese choose to become expats living abroad, especially in thewestern english speaking world which will likely promote greater economic ties and economic dominance of China across theworld as a new economic empire is born, therefore make room for the next big wave of human migration from east to west thatwill seek to buy up large tracts of the remaining means of production and probably be invited in by desperate government'seager for foreign investment to spark life into stagnating regions.
China Government CompetentWhilst no one in the west would want to live under a totalitarian one party state. However the Chinese government has shownitself to be fairly competent in managing the economy, far better than many western democratic government's which continuesto surprise many people that look to the experience of the last communist giant, the Soviet Union which collapsed intohyperinflation. It could be said that being a totalitarian state enables decisions to be implemented far more quickly and similarlyany mistakes made can be far more easily brushed under the carpet.
The Inflation Mega-Trend Page 55
http://www.marketoracle.co.uk © 2010 Copyright Nadeem Walayat and Market Oracle Ltd
Whilst the western government's have been engaged in piling debt upon debt for consumption, the Chinese have been busyutilising hundreds of billions of dollars of stimulus spending to build up China's infrastructure by building new cities, roads andrailways, all of which generates capacity for future economic growth.
China Blowing BubblesYes strong economic growth and high liquidity i.e. bank lending is leading to bubbles that will burst, but the Chinese fiscalposition is such that the government can keep blowing bubbles as long as it continues to import foreign currency reserves thatcan be utilised to cushion the blows which therefore means that the post bubble crashes remain long-term buying opportunities,as the crash of the Chinese stock market to SSEC 1,600 in October 2008 proved.
China to Export Inflation AbroadChina's fast growing and overheating economy is inevitably going to experience significant price inflation. However at themoment China actively intervenes to keep its currency pegged to the U.S. Dollar, that has contributed to an enormous tradeimbalance with the U.S. resulting in huge currency reserves that are a natural boost to the Chinese currency were it not for thehigh level of currency market intervention.
As the inflation mega-trend unfolds and inflation rises in China, then China can with ease let the Yuan appreciate against theother debt ridden currencies over time which has the effect of exporting inflation abroad as the costs of imports into China falls.This will increasingly become the case as the size of the domestic consumer sector grows over the coming years which willfeed higher inflation in western economies.
An appreciating Yuan will have the effect of boosting profits for foreign investors when converted back into their owndepreciating currencies.
China to Drive Foreign Stock Markets HigherChina is drowning in a sea of dollars that it cannot sell as that would undermine its dollar currency peg objective. HoweverChina can achieve the same thing whilst at the same time reducing its risk to a depreciating dollar by investing in dollar assetssuch as stocks, ETF's and commodities. Therefore those that continue to seek a bear market in U.S. and other western stockmarkets fail to recognise the huge potential pool of investment funds that are expected to continue to flow into western andother emerging market stock markets over the coming decade and hence contributing towards driving the stocks stealth bullmarkets higher.
Though it is not necessary to know which stocks China is buying as it is obvious that a resources hungry China is clearlytargeting the resources, and energy sectors, where stock buying would tend to lift the whole sector. China will also be seekingto invest in the large liquid stocks and ETF's with strong cash-flows and profit potentials which the stocks investment sectionseeks to illustrate.
China Intellectual Growth ProblemsOne possible fly in the ointment is future political stability, as so far the 'communist' in all but name one party state in China hasbeen able to keep its peoples eyes focused on economic prosperity and not to stray into political activism, whether at somepoint in time a crunch point comes when a more wealthy educated people demand more openness and freedom of expression.
Another problem that follows on from the authoritarian government structure is that China's access to the information age isvery limited, i.e. web searches are usually blocked and user access to the internet closely monitored. This implies that China isunlikely to replicate the global growth in the production of consumer durable goods on to the internet technologies, which willstill largely remain something in the hands of the democratic relatively free English speaking world as long as they do not erodetheir own countries freedoms by means of the states misapplication of technology to prevent free thought.
Chinese 10 Year Stock Market Outlook A sustained average growth rate for the Chinese economy over the next 10 years of 8% per annum implies a GDP compoundadvance of 115%. China's Price / Earnings ratio currently stands at approx 30, which whilst still high is down from the eyewatering days of the bull market peak that had the P/E as high as 70. Still 30 is NOT cheap and therefore despite the highgrowth potential of the Chinese economy, this is expected to narrow over the coming decade towards an average of 18.
Therefore taking a P/E of 18, and GDP advance of 115% and applying this to the current SSEC level of 2990, this wouldtherefore suggest a fair value for the Chinese Stock market of approx SSEC 9,200 in 10 years time. Off course the actual trendis expected to function as a consequence of speculative runs to over valuation and subsequent corrections into states of undervaluation as we saw with the 2007 peak of 6,250, a stock market boom into a bubble in 10 years time could see the SSEC ashigh as 17,000 against the current price of 2,990.
The Inflation Mega-Trend Page 56
http://www.marketoracle.co.uk © 2010 Copyright Nadeem Walayat and Market Oracle Ltd

Chinese Stock Market 2010The Chinese stock market has doubled after the powerful rally off of the October 2008 low of 1664 to a high of 3,478.Subsequent price action clearly indicated a period of consolidation is underway with the last close at 2990, the price patternbeing painted is that of an ABC correction of which we have just embarked upon a C wave decline that implies the SSEC iscurrently targeting a correction towards a range of 2750 to 2600 which in my opinion would present a further good long-termaccumulation opportunity. As for the end 2010 target ? I expect the SSEC to target an end 2010 level of 3,750 as illustrated bythe below graph.
Chart courtesy of StockCharts.com
In conclusion the more I analyse China the more it comes back to me as a screaming long-term buy, China remains oneof my KEY investment destinations with an over-weight rating as by far the single greatest source for future worldeconomic growth will be from China. Not only is the country swimming in cash but foreign investors will be ever eager toplow more of their own money into China. So I am firmly putting my money where my mouth is by remainingfully invested in China. Therefore I will let others worry about the potential black swans and stay scared of investing inChina.
China Stocks Crash ?2008 and 2009 have shown us that the markets are extremely volatile, so yes the speculative Chinese stock market couldcrash, but as long as the fundamentals remain in place i.e. that the Chinese economy continues to grow strongly as it didthroughout the recession then market crashes are excellent long-term buying opportunities. Think of it this way, instead ofbuying the market at 30X earnings a 33% stocks crash offers you the opportunity to buy the same market at X20 earnings. Justas the crash to below SSEC 2k presented a golden opportunity to buy China in 2008.
The Inflation Mega-Trend Page 57
http://www.marketoracle.co.uk © 2010 Copyright Nadeem Walayat and Market Oracle Ltd
Foreign Investors Currency AdvantageForeign investors should also take note of the strong currency advantage of investing in China, as the Yuan will eventuallyappreciate against all fiat currencies. This means that over 10 years investors in say sterling could see their returns increase byas much as a further 50%, as the current trade imbalances are not sustainable, i.e. last year China exported $338 billion to theU.S. whilst importing $69 billion, which should have resulted in a significant Yuan appreciation, but the exchange rate has notbudged for the past 18 months which strongly suggests intense currency market intervention to hold the peg to the dollar thatwill culminate in a series of rapid revaluations, thus driving the value of Chinese investments higher in currencies such assterling and the dollar. Therefore foreign investors into China are effectively buying an inflation hedge on top of capital growthas a consequence of economic growth.
China ETF'sThere are several liquid China ETF's available including iShares China Index Fund (XCH), iShares FTSE/Xinhua China 25 (FXI)and SPDR S&P China ETF (GXC) as a starting point for your own research.
India
Indian GrowthIndia presents a higher risk than China, but also a higher potential for profit with GDP at less than $3,000 per capita. Thereexists the potential should the Indian government continue to seek to pull its people out of poverty for even a longer run ofconsistently high economic growth than for China.
India's economy is presently growing at 7% per annum which could be sustained for the next 10 years resulting in ancompound growth of 96% on current GDP, which will undoubtedly be reflected in the stock market indices that could extend tothree times the GDP growth rate, therefore despite the 2009 bounce back, the Indian stock market still presents a goodopportunity over a 10 year time frame.
India RisksThe primary risk to India is lack of competency in its governance which yields poorly thought out economic decisions that hasculminated in the countries persistently high overall budget deficit of 10% of GDP resulting in a high and growing debt burdenthat is not keeping pace with GDP growth i.e. overtime this will gradually squeeze economic growth lower unless addressed,thus shaving several % points from India's annual growth potential by the end of the decade to instead of a 100% real termsincrease in GDP to a more probable 80% increase.
India's inability to control the exploding population which coupled with the impact of climate change that will hit India particularlyhard as the inflationary mega-trend will manifest itself more in India than China which sows the seeds of future populationdriven food price crisis, that even now is already manifesting itself in a high food price inflation of over 15% which generatesmuch discontent amongst India's hundreds of millions of poor that forces the government to maintain the budget deficit ratherthan to introduce austerity measures.
Therefore investors in India are likely to have bumpier ride and a potentially shorter window of opportunity for profit frominvestments than from China, as India's greater risk implies perhaps a decade of high growth before population growth, debtand climate change evaporate the high growth potential of the Indian economy towards a period of stagflation especiallyconsidering the already eye watering high inflation rate of more than 10% for 2009.
Indian Stock Market 10 Year Growth ProspectsThe Indian stock market is priced at about 20 times earnings, which against GDP growth expectations of 80% compoundedover the next 10 years implies if stocks remained at current price levels the P/E would be at just 3.7. Whilst in 10 years time amore maturing and environmental sensitive economy may not be able to demand a P/E of 20, it should still be able to muster aPE in the region of 12 to 16 which therefore suggests a stock market advance of between 300% and 450% onto the currentlevel of 16,350 i.e. implying that the BSE could be trading at a level of between 50,000 and 73,000 in 10 years time, if nothigher if the budget deficit problems and total debt problems can be addressed.
The Inflation Mega-Trend Page 58
http://www.marketoracle.co.uk © 2010 Copyright Nadeem Walayat and Market Oracle Ltd
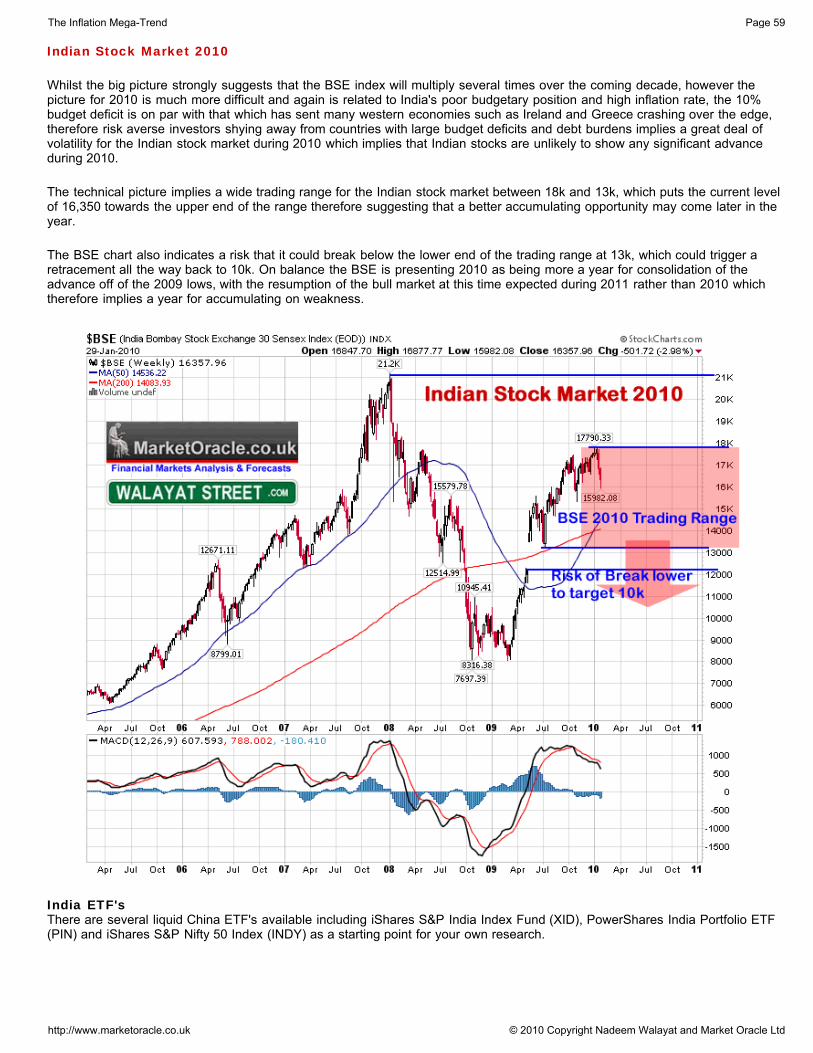
Indian Stock Market 2010
Whilst the big picture strongly suggests that the BSE index will multiply several times over the coming decade, however thepicture for 2010 is much more difficult and again is related to India's poor budgetary position and high inflation rate, the 10%budget deficit is on par with that which has sent many western economies such as Ireland and Greece crashing over the edge,therefore risk averse investors shying away from countries with large budget deficits and debt burdens implies a great deal ofvolatility for the Indian stock market during 2010 which implies that Indian stocks are unlikely to show any significant advanceduring 2010.
The technical picture implies a wide trading range for the Indian stock market between 18k and 13k, which puts the current levelof 16,350 towards the upper end of the range therefore suggesting that a better accumulating opportunity may come later in theyear.
The BSE chart also indicates a risk that it could break below the lower end of the trading range at 13k, which could trigger aretracement all the way back to 10k. On balance the BSE is presenting 2010 as being more a year for consolidation of theadvance off of the 2009 lows, with the resumption of the bull market at this time expected during 2011 rather than 2010 whichtherefore implies a year for accumulating on weakness.
India ETF'sThere are several liquid China ETF's available including iShares S&P India Index Fund (XID), PowerShares India Portfolio ETF(PIN) and iShares S&P Nifty 50 Index (INDY) as a starting point for your own research.
The Inflation Mega-Trend Page 59
http://www.marketoracle.co.uk © 2010 Copyright Nadeem Walayat and Market Oracle Ltd
RUSSIARussia is rich in resources but remains politically unstable. The country has all the potential in terms of resources to achievefirst world status, the only seriously limiting factor is the tendency of its leaders to seek out conflicts with bordering states andhence squander accumulated wealth. That coupled with GDP per capita of $16,000 does not support the view of strong growthin relative terms over the coming decade, despite the potential that is pending internal reforms to capitalise upon.
The Russian economy has a strong commodities driven cash-flow with a sizeable foreign currency reserves that can and havebeen utilised to help weather financial crisis. Where investing is concerned the equity market is far more volatile than manyother large emerging markets but it is far more cheaply priced than other markets therefore presents a good risk / rewardpotential. The banking sector as with developed countries banking sectors is saddled with a lot of bad debt hence this will needto be inflated away so higher inflation in Russia is likely to help devalue the bad debts of its banking sector.
Russia may one day follow the other emerging market BIC economies of China, India and Brazil, in terms of industrialisation,but for now it remains mostly a commodities play therefore especially susceptible to the oil price.
Russian Stock MarketThe Russian stock market is definitely not for the faint hearted. The RTSI peaked in May 2008 at 2498 and then completelycollapsed over the next 6 months to a low of 492, or by 80%, a truly spectacular collapse on par with that of the 1930's GreatDepression. But this is not the 1930's and the subsequent bounce back has been equally remarkable with the RTSI rallying to arecent high of 1590, a more than tripling of the index from the low, which illustrates that investing in the Russian market doesrequire close monitoring and thus greater investor experience.
Russian ETF'sA Russian ETF as a starting point for your own research is Market Vector Russia ETF Trust (RSX),
BRAZIL - Rich in ResourcesBrazil continues to gather momentum towards becoming a developed state over the next 20 years, of the three major emergingmarkets it is the most distant from capacity restraints of population demographics, environment and resources. thereforeprobably presents the highest potential growth prospect of the three for several decades.
Resource wise, Brazil has virtually everything going for it, from oil, gas, minerals and metals to land and water, many of whichboth India and China are deficient in requiring importing of raw materials.
The strong long-term trends are reflected in the Brazilian stock market indices which whilst not far behind Russia in terms ofprice volatility, have recently recovered close all time highs prior to the current correction. The Brazilian stock market at 66k ismore fully valued trading on a P/E Ratio of 23, when compared against other emerging giants for at least the next 12 months,therefore I would view to accumulate exposure to Brazil on any further corrections to below 56k, and as is the case for China,investors in Brazil are expected to experience the added benefits of a strong Brazilian currency given the high real-term interestrates, low debt and a small current account deficit.
Vietnam - The Next China in GDP per capita terms ?Vietnam is a country that remains invisible to most investors radar, which appears to be following the path of China i.e. turningitself into an export based economy growing in the order of 6-8% GDP per annum. Today's Vietnam is perhaps where Chinawas some 10-15 years ago therefore for the very long-term investors it could present an ideal opportunity to get into the nextmini-china near the ground floor.
As China continues to grow more wealthy then gradually over time the means of production will be exported abroad to cheaperlabour countries such as Vietnam, that coupled with very positive demographics for several decades means that Vietnam mostdefinitely does have the potential to follow China's lead.
Investors seeking exposure to Vietnam will need to show patience and tolerance for wild price swings as can be expected fromsmall less liquid markets such as Vietnam so truly would have to be long-term investments aiming at a decade time frame.
The Inflation Mega-Trend Page 60
http://www.marketoracle.co.uk © 2010 Copyright Nadeem Walayat and Market Oracle Ltd

Iraq and Afghanistan - High Risk Gamble EconomiesIraq and Afghanistan present a golden opportunity to get in near the ground floor in broken economies that are pending internalstability and infrastructure development. The potential is for both economies to grow at least three fold over the next decade inGDP terms if peace and stability can be established.
Iraq by far presents the greater opportunity of the two given its large proven oil reserves that rank 3rd in the world. Westerncountries such as the U.S. and U.K. have also heavily committed themselves towards turning both countries around. Whereinvestments are concerned then for Iraq, clearly the oil sector is the most favoured then construction of Iraqi infrastructurewhich allows exposure to Iraq to be gained from oil companies holding Iraqi oil contracts such as Shell and BP.
AFRICAIf crisis breeds opportunities than sub-Saharan Africa is awash with huge potential. Starting from a low per capita GDP base, alarge % of young population and resource rich countries such as Congo and South Africa present great long-term opportunities.However on the negative side we have the question of political stability, weak corrupt government's and civil unrest / warfare.
It is beyond the scope of this ebook to analyse Africa in depth, therefore probably the best way to participate from future Africangrowth would be to follow China's lead by concentrating on the resources sector such as metals and mining funds and ETF'sthat spread exposure across several African countries such as Van Eck Market Vectors Africa Index ETF (AFK).
Emerging Markets ETFWhilst virtually all of the emerging markets represent good long-term risks in terms of growth. However the financial crisis hasillustrated that individual markets can come under greater stress due to particular domestic concerns. Therefore one way toreduce the risk of investing in single emerging markets is to invest in an ETF that spreads the risk across several emergingmarkets. The i-shares MSCI Emerging Markets Index Fund (EEM) does just the that by spreading the risk across 10 emergingmarkets with the greatest weighting given to Brazil, China, Taiwan, South Korea, South Africa, India and Russia.
Emerging Market Debt Defaults and Market CrashesInvestors in Emerging markets need to ensure they get one thing straight, and that is for the higher return they are taking onhigher risk. Whilst we may all enjoy riding the emerging markets boom, however we have to be aware that they can and havegone bust in spectacular style by defaulting on their debts resulting in an hyperinflationary collapse i.e. Brazil defaulted on itsdebt in 1983 and then again in 2000, not to mention the intervening period of hyperinflation. So investing in emerging marketsshould NOT be a case of putting all of your eggs in one basket.
So all emerging markets are HIGH risk for this reason, as they have a far higher potential for screwing up their economies inspectacular style than is usually the case for the developed economies and markets. Though looking at the commentarysurrounding the Greece that 'may' now be changing.
The Inflation Mega-Trend Page 61
http://www.marketoracle.co.uk © 2010 Copyright Nadeem Walayat and Market Oracle Ltd
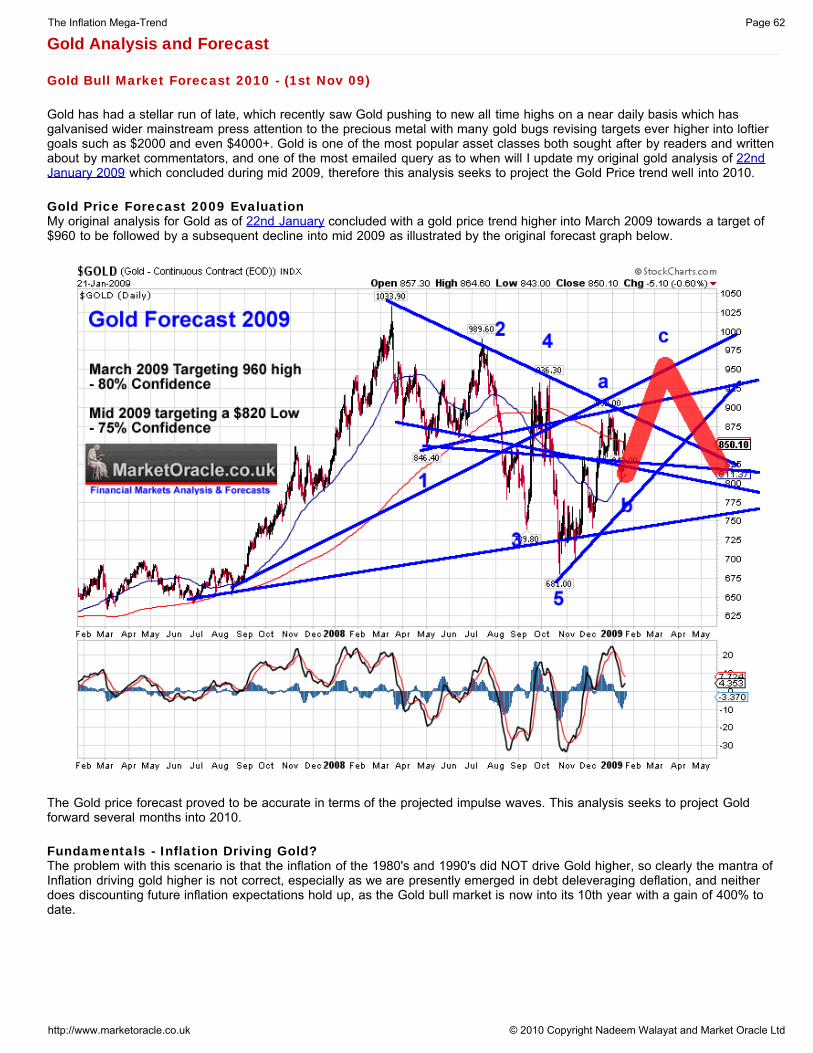
Gold Analysis and Forecast
Gold Bull Market Forecast 2010 - (1st Nov 09)
Gold has had a stellar run of late, which recently saw Gold pushing to new all time highs on a near daily basis which hasgalvanised wider mainstream press attention to the precious metal with many gold bugs revising targets ever higher into loftiergoals such as $2000 and even $4000+. Gold is one of the most popular asset classes both sought after by readers and writtenabout by market commentators, and one of the most emailed query as to when will I update my original gold analysis of 22ndJanuary 2009 which concluded during mid 2009, therefore this analysis seeks to project the Gold Price trend well into 2010.
Gold Price Forecast 2009 EvaluationMy original analysis for Gold as of 22nd January concluded with a gold price trend higher into March 2009 towards a target of$960 to be followed by a subsequent decline into mid 2009 as illustrated by the original forecast graph below.
The Gold price forecast proved to be accurate in terms of the projected impulse waves. This analysis seeks to project Goldforward several months into 2010.
Fundamentals - Inflation Driving Gold? The problem with this scenario is that the inflation of the 1980's and 1990's did NOT drive Gold higher, so clearly the mantra ofInflation driving gold higher is not correct, especially as we are presently emerged in debt deleveraging deflation, and neitherdoes discounting future inflation expectations hold up, as the Gold bull market is now into its 10th year with a gain of 400% todate.
The Inflation Mega-Trend Page 62
http://www.marketoracle.co.uk © 2010 Copyright Nadeem Walayat and Market Oracle Ltd
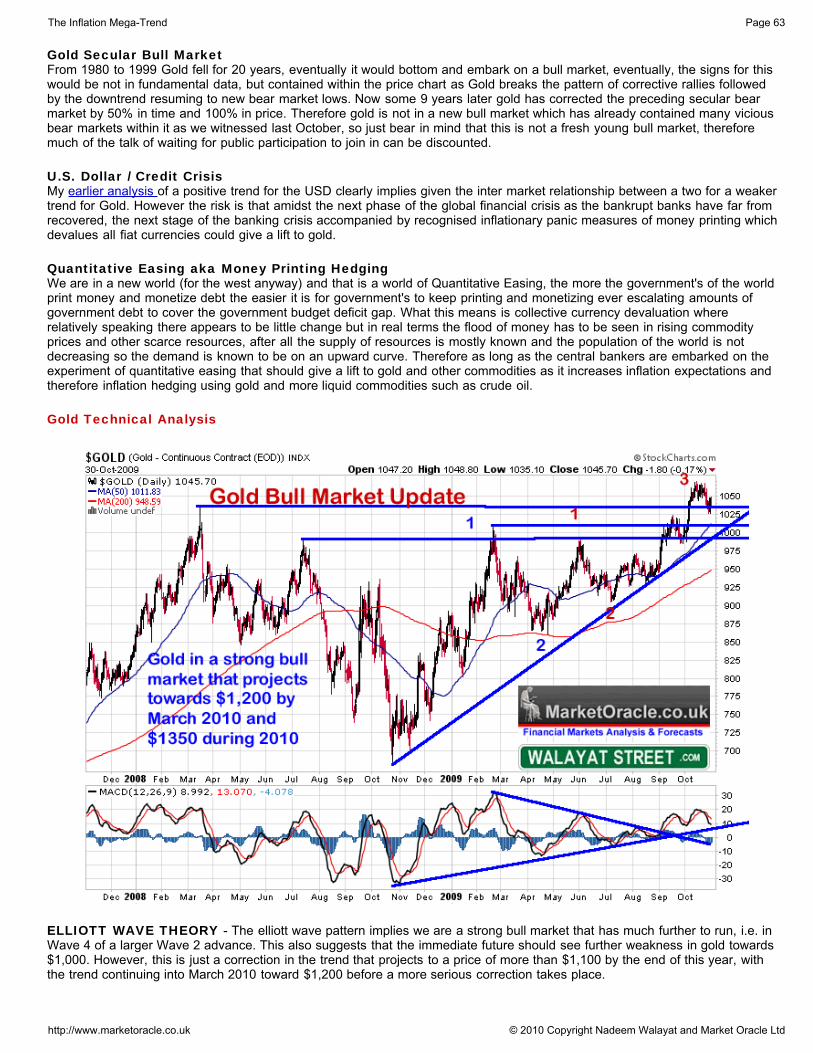
Gold Secular Bull MarketFrom 1980 to 1999 Gold fell for 20 years, eventually it would bottom and embark on a bull market, eventually, the signs for thiswould be not in fundamental data, but contained within the price chart as Gold breaks the pattern of corrective rallies followedby the downtrend resuming to new bear market lows. Now some 9 years later gold has corrected the preceding secular bearmarket by 50% in time and 100% in price. Therefore gold is not in a new bull market which has already contained many viciousbear markets within it as we witnessed last October, so just bear in mind that this is not a fresh young bull market, thereforemuch of the talk of waiting for public participation to join in can be discounted.
U.S. Dollar / Credit CrisisMy earlier analysis of a positive trend for the USD clearly implies given the inter market relationship between a two for a weakertrend for Gold. However the risk is that amidst the next phase of the global financial crisis as the bankrupt banks have far fromrecovered, the next stage of the banking crisis accompanied by recognised inflationary panic measures of money printing whichdevalues all fiat currencies could give a lift to gold.
Quantitative Easing aka Money Printing HedgingWe are in a new world (for the west anyway) and that is a world of Quantitative Easing, the more the government's of the worldprint money and monetize debt the easier it is for government's to keep printing and monetizing ever escalating amounts ofgovernment debt to cover the government budget deficit gap. What this means is collective currency devaluation whererelatively speaking there appears to be little change but in real terms the flood of money has to be seen in rising commodityprices and other scarce resources, after all the supply of resources is mostly known and the population of the world is notdecreasing so the demand is known to be on an upward curve. Therefore as long as the central bankers are embarked on theexperiment of quantitative easing that should give a lift to gold and other commodities as it increases inflation expectations andtherefore inflation hedging using gold and more liquid commodities such as crude oil.
Gold Technical Analysis
ELLIOTT WAVE THEORY - The elliott wave pattern implies we are a strong bull market that has much further to run, i.e. inWave 4 of a larger Wave 2 advance. This also suggests that the immediate future should see further weakness in gold towards$1,000. However, this is just a correction in the trend that projects to a price of more than $1,100 by the end of this year, withthe trend continuing into March 2010 toward $1,200 before a more serious correction takes place.
The Inflation Mega-Trend Page 63
http://www.marketoracle.co.uk © 2010 Copyright Nadeem Walayat and Market Oracle Ltd
TREND ANALYSIS - Gold's breakout to a new all time high is a clear signal of further strong advances. The support trendlineis at $1,000 and therefore fits in nicely with the elliott wave correction projection target. After the uptrend resumes this trendlineis unlikely to be revisited until the second quarter of 2010.
SUPPORT / RESISTANCE - Resistance lies at the last high of $1071, Immediate support lies across the string of previoushighs of $1033 and $1007, therefore there is very heavy support whilst very light resistance overhead, which again issuggestive of a mild correction in the current phase of the trend.
PRICE TARGETS - The measuring move off of the $681 2008 low projects all the way to $1,350, which looks set to be anachievable price during 2010. Nearer term immediate targets extend to $1,100 then $1,200.
MACD - The MACD indicator signaled a Gold breakout at $960, with a firm established uptrend. The current correction is inlinewith that of a mild correction within a strong uptrend.
SEASONAL TREND - There is a strong seasonal tendency for gold to rally from November through January i.e. for the next 3months. This is suggestive that the current correction is living on borrowed time and may not last much longer
Gold Conclusion (1st Nov 09)I started off this analysis skeptical of the prospects for gold given the 10 year bull run to date, but the price that is talking off thecharts is pretty bullish! enough for me to consider accumulating a position. In the immediate future Gold appears to be targetinga continuing correction towards $1,000, after which it targets $1,200 by March 2010 and a price of $1,350 later during 2010.
Gold Long-term - Gold has broken out to a new high and it does look as though it is going much higher in the long run, thereare multiple measuring moves that one can consider, such as 133%, 150%, 1.618% etc. However given the gap in timebetween the all time peaks, Gold of $2000 plus would now not surprise me.
Gold Update - 30th Jan 2010The Gold bull market remains intact which is supported by strong fundamentals of record high investment demand coupled withshrinking mine production. I expect the Gold bull market to run for several more years. and as with all scarce resources /commodities, the price of Gold is bring driven higher by increasingly out of control money printing and huge deficit spendingfeeding the inflationary mega-trend i.e. ultimately money printing just increases the supply of money which will eventually forceprices ever higher as the increased fiat money exchanges hands for what remains a limited commercial and investmentresources.
GOLD Elliot Wave ABC Correction - The recent Peak in the Gold price at 1225 can be interpreted as a Wave 3 thatsuggests gold is under going a relatively minor ABC correction that extends towards a target of $1050 i.e. along the previousresistance area. Gold presently has completed Waves A and B, with the C wave well underway which suggests that the targetcould be reached by mid February.
GOLD Mega-trend - Those that are looking for a FINAL peak in the gold price will be greatly disappointed because Gold willNEVER peak, yes it will experience cyclical bear markets (buying opportunities), especially after powerful bull runs but as longas the worlds central banks continue to debase their currencies then the upward inflationary spiral in the gold price, as withvirtually all commodities is an inevitable mega-trend for the duration of human civilisation, which is based on the premise that a.The worlds population will continue to increase, and b. That technological alchemy that is able to produce new 'cheap' gold willremain out of reach for at least another 50 years.
GOLD - Dollar Relationship - There does exist an important Dollar / Gold inverse relationship which given that my analysisprojects towards USD 84 during the first half of 2010 suggests that Gold will find it difficult to break above the $1225 highduring this time period.
GOLD Technical Analysis - After the Gold correction bottoms at the target of $1050 or lower, Gold will initially target theformer $1225 peak and then 1.618% of the swing from $1225 to $1050 (anticipated low), which projects towards an 2010 targetof $1,333, which amazingly is precisely in line with my 1st November 2009 target of $1350.
Furthermore, a trendline extending through the current correction illustrates a probable trend path around which gold can expectto gyrate towards its target of $1333 by late 2010, and continue further on into 2011 as the Gold price continues to look set totrend towards $2,000 which should be easily achievable within the next 3 years.
The Inflation Mega-Trend Page 64
http://www.marketoracle.co.uk © 2010 Copyright Nadeem Walayat and Market Oracle Ltd
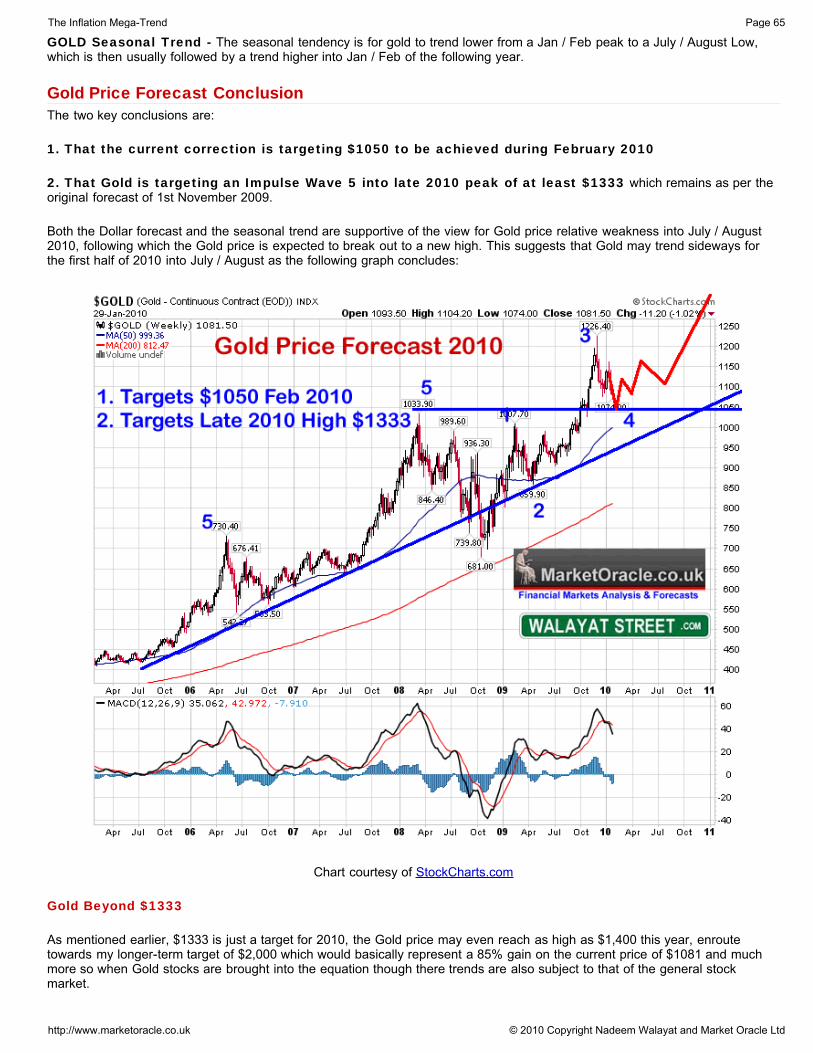
GOLD Seasonal Trend - The seasonal tendency is for gold to trend lower from a Jan / Feb peak to a July / August Low,which is then usually followed by a trend higher into Jan / Feb of the following year.
Gold Price Forecast ConclusionThe two key conclusions are:
1. That the current correction is targeting $1050 to be achieved during February 2010
2. That Gold is targeting an Impulse Wave 5 into late 2010 peak of at least $1333 which remains as per theoriginal forecast of 1st November 2009.
Both the Dollar forecast and the seasonal trend are supportive of the view for Gold price relative weakness into July / August2010, following which the Gold price is expected to break out to a new high. This suggests that Gold may trend sideways forthe first half of 2010 into July / August as the following graph concludes:
Chart courtesy of StockCharts.com
Gold Beyond $1333
As mentioned earlier, $1333 is just a target for 2010, the Gold price may even reach as high as $1,400 this year, enroutetowards my longer-term target of $2,000 which would basically represent a 85% gain on the current price of $1081 and muchmore so when Gold stocks are brought into the equation though there trends are also subject to that of the general stockmarket.
The Inflation Mega-Trend Page 65
http://www.marketoracle.co.uk © 2010 Copyright Nadeem Walayat and Market Oracle Ltd

Gold Trend in SterlingGold price in Sterling is showing a similar trend pattern and price expectation of the current correction having a little further torun before Gold hits its major support trendlines as indicated on the below graph. Therefore currency movements have onlymarginal impact on the trend as the Gold price volatility is far greater than the expectations that the British Pound will fall byapprox 10% over the next 12 months. Still this 10% will further extend gains for sterling on top of that forecast for the Gold inDollars.
Chart courtesy of StockCharts.com
Silver Price TrendOn face value a Gold price target to a new high of at least $1333 during 2010 is undoubtedly bullish for Silver also, however theprice trend exhibited by silver is not as healthy as that for Gold as Silver during the recent precious metals bull run FAILED tobreak above its 21.44 2008 high, which is a sign of relative weakness.
Key technical support is at 16, then next way down at 11. Whilst upside resistance lies at 19.45 and then 21.44. The currentsharp correction is at support of 16, which if breached could trigger a sharp decline or spike as low as $11, which if it happenedwould be a great long-term buying opportunity. However on the basis of support holding, the upside looks limited, as silver firstneeds to overcome $19.45 and then $21.44, whilst of if $16 breaks then that will become the next resistance level to overcome.
On the plus side due to the sideways trend, Silver lacks any speculative froth that may be building in the Gold market whichimplies that should silver manage to breakout to the upside, i.e. above $21.44 then we may witness a particularly strong spikehigher that could carry Silver to $30 in a short period of time.
The Inflation Mega-Trend Page 66
http://www.marketoracle.co.uk © 2010 Copyright Nadeem Walayat and Market Oracle Ltd

The relative weakness between Silver and Gold is attributable to the fact that Gold is clearly seen as an alternative currencyagainst paper fiat money, whereas silver is seen more as an industrial metal which means it is more subject to economic trendsthan Gold.
Silver Conclusion
Silver is boxed in a very wide trading range of between $21.45 and $11, the bullish Gold outlook should push silver during 2010towards the upper end of the range which if breached would trigger a powerful rally towards $30. Immediate term Support of$16 looks set to give way for a trend that targets the long-term support zone of $14 to $11 which in my opinion would be both agreat long-term and range trading buying opportunity. Where will silver be by late 2010 ? I would say at a priceabove $20.
The Inflation Mega-Trend Page 67
http://www.marketoracle.co.uk © 2010 Copyright Nadeem Walayat and Market Oracle Ltd

GLD and SLV ETF'sThis analysis continues the study of the price trend relationship between Gold : GLD and Silver : SLV as part of the inflationarymega-trend investing as the following graphs illustrate:
Chart courtesy of StockCharts.com
The Inflation Mega-Trend Page 68
http://www.marketoracle.co.uk © 2010 Copyright Nadeem Walayat and Market Oracle Ltd
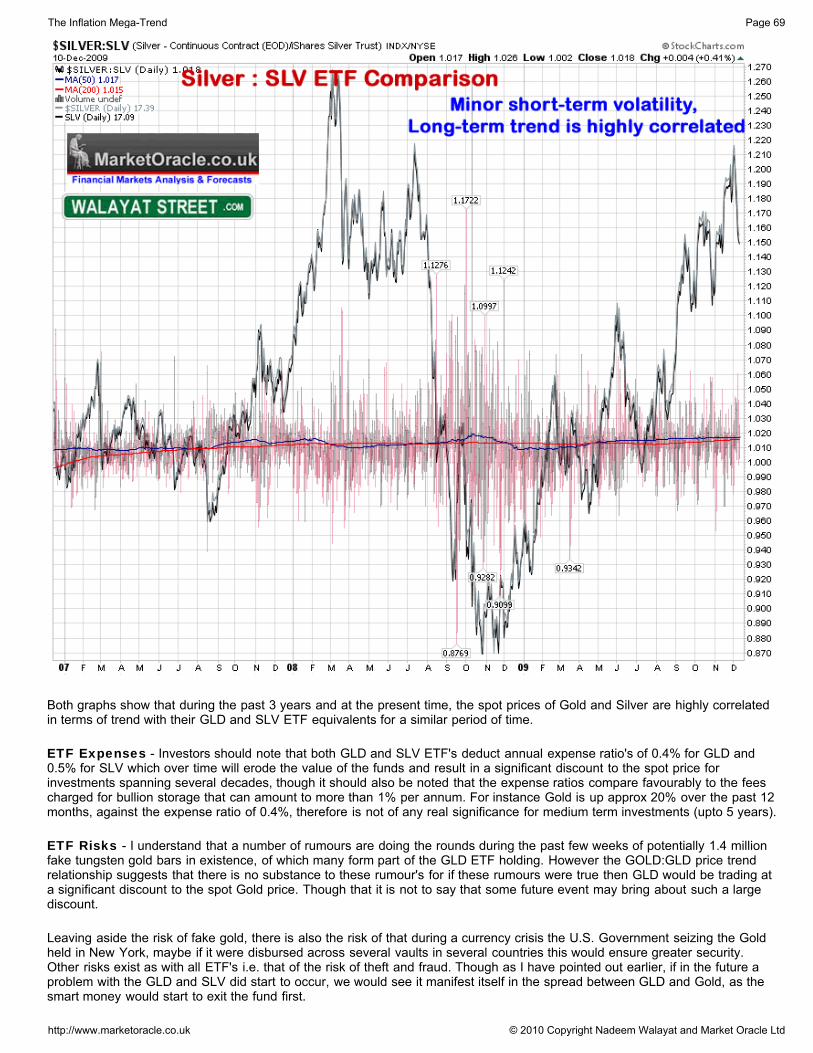
Both graphs show that during the past 3 years and at the present time, the spot prices of Gold and Silver are highly correlatedin terms of trend with their GLD and SLV ETF equivalents for a similar period of time.
ETF Expenses - Investors should note that both GLD and SLV ETF's deduct annual expense ratio's of 0.4% for GLD and0.5% for SLV which over time will erode the value of the funds and result in a significant discount to the spot price forinvestments spanning several decades, though it should also be noted that the expense ratios compare favourably to the feescharged for bullion storage that can amount to more than 1% per annum. For instance Gold is up approx 20% over the past 12months, against the expense ratio of 0.4%, therefore is not of any real significance for medium term investments (upto 5 years).
ETF Risks - I understand that a number of rumours are doing the rounds during the past few weeks of potentially 1.4 millionfake tungsten gold bars in existence, of which many form part of the GLD ETF holding. However the GOLD:GLD price trendrelationship suggests that there is no substance to these rumour's for if these rumours were true then GLD would be trading ata significant discount to the spot Gold price. Though that it is not to say that some future event may bring about such a largediscount.
Leaving aside the risk of fake gold, there is also the risk of that during a currency crisis the U.S. Government seizing the Goldheld in New York, maybe if it were disbursed across several vaults in several countries this would ensure greater security.Other risks exist as with all ETF's i.e. that of the risk of theft and fraud. Though as I have pointed out earlier, if in the future aproblem with the GLD and SLV did start to occur, we would see it manifest itself in the spread between GLD and Gold, as thesmart money would start to exit the fund first.
The Inflation Mega-Trend Page 69
http://www.marketoracle.co.uk © 2010 Copyright Nadeem Walayat and Market Oracle Ltd
Natural Gas Mega-trend
Whist most commodities have soared during the year, however Natural Gas has been one of the few commodities laggingbehind and therefore may present an opportunity to scale in at rock bottom prices for the Long-run as have mentioned severaltimes during the divergence between Crude Oil and Natural Gas over the summer months.
Do You Wish You Had Bought Crude Oil at $35 ? Stocks at Dow 6600 ? Gold at $700 ?
Much as past great market opportunities, at the low no one wants to buy for a multitude of reasons. However taking a look atthe long-term charts, you do not have to be a genius to arrive at the conclusion that Natural Gas is cheap, the only way a futureNatural Gas spike to the upper ranges of many multiples of the current price is not possible is if Natural Gas suddenly becamean redundant energy resource, which given that it is a far cleaner form of energy than other fossil fuels seems extremelyimprobable!
Remember Natural gas is not a stock therefore its not going to go out of business to ZERO, nor is it likely to be displaced fromthe market place by new technology during the next decade at least.
Natural Gas FundamentalsHigh prices bring on stream new supply, low prices bring about reduction in supply and investment, the longer Natural Gastrades at higher prices the greater will be the eventual new supply and subsequent crash in prices. The longer Natural gastrades at ultra low prices the less the forward supply investment and thus the greater will be the eventual spike higher in NaturalGas prices. What this suggests is the best type of price action for commodities is that of highly volatile highs and lows wheresustained trends tend to resolve to extraordinary spikes in the opposite direction. The current Natural Gas price trend has beenthat of a sustained downtrend, which is primed to resolve to much higher prices to eventually more than the normal range. Offcourse this would also require Natural Gas position holders to ensure they are ready to distribute INTO such a spike else likemany novice investors they may end up giving back most of the gains on the way down!
Natural Gas is CLEAN ENERGYNatural gas is the dream fossil fuel of global warming proponents, as it is by far the cleanest of the three major fossil fuels ofgas, oil and coal. Developed countries could cut their electricity generation green house gasses by at least 33%by making theswitch to natural gas, whilst at the same time saving money.
The Inflation Mega-Trend Page 70
http://www.marketoracle.co.uk © 2010 Copyright Nadeem Walayat and Market Oracle Ltd

Natural Gas in Dollars
Chart courtesy of StockCharts.com
Natural Gas price range is typically between $9 and $6. Last close was at $4.66. Natural Gas is in short-term downtrendtherefore suggesting lower immediate term natural gas prices. The price collapse form $13.7 to a low of $2.62 in Septemberresulted in a powerful bounce to 5.83 that now brings Natural gas to its present day downtrend at a much shallower velocitythan the preceding uptrend, Natural Gas.
However Natural Gas HAS given a Buy Signal and therefore now targets a higher low (than the Sept low). Once the higher lowis in then that will mark a strong stepping board for a sharp rally higher to significantly above the September peak takingNatural Gas into the Normal range, in the meantime my opinion is that of a great long-term accumulation opportunity withNatural Gas trading below the normal range.
The Inflation Mega-Trend Page 71
http://www.marketoracle.co.uk © 2010 Copyright Nadeem Walayat and Market Oracle Ltd
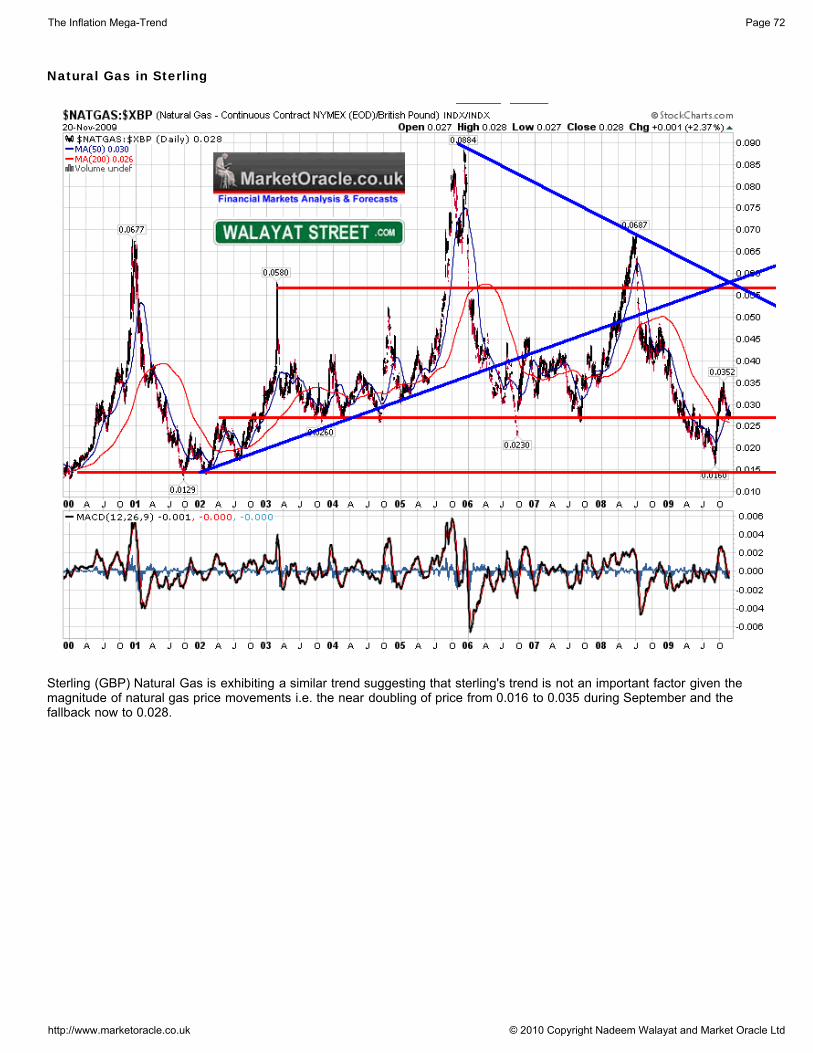
Natural Gas in Sterling
Sterling (GBP) Natural Gas is exhibiting a similar trend suggesting that sterling's trend is not an important factor given themagnitude of natural gas price movements i.e. the near doubling of price from 0.016 to 0.035 during September and thefallback now to 0.028.
The Inflation Mega-Trend Page 72
http://www.marketoracle.co.uk © 2010 Copyright Nadeem Walayat and Market Oracle Ltd
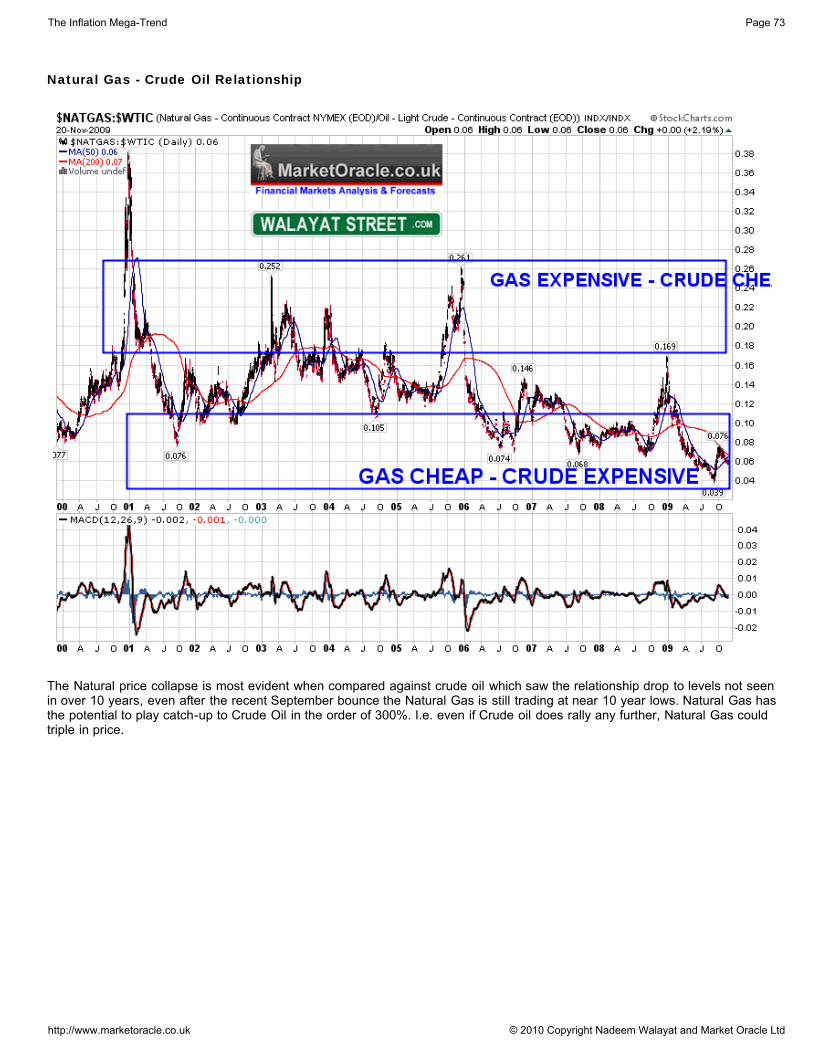
Natural Gas - Crude Oil Relationship
The Natural price collapse is most evident when compared against crude oil which saw the relationship drop to levels not seenin over 10 years, even after the recent September bounce the Natural Gas is still trading at near 10 year lows. Natural Gas hasthe potential to play catch-up to Crude Oil in the order of 300%. I.e. even if Crude oil does rally any further, Natural Gas couldtriple in price.
The Inflation Mega-Trend Page 73
http://www.marketoracle.co.uk © 2010 Copyright Nadeem Walayat and Market Oracle Ltd
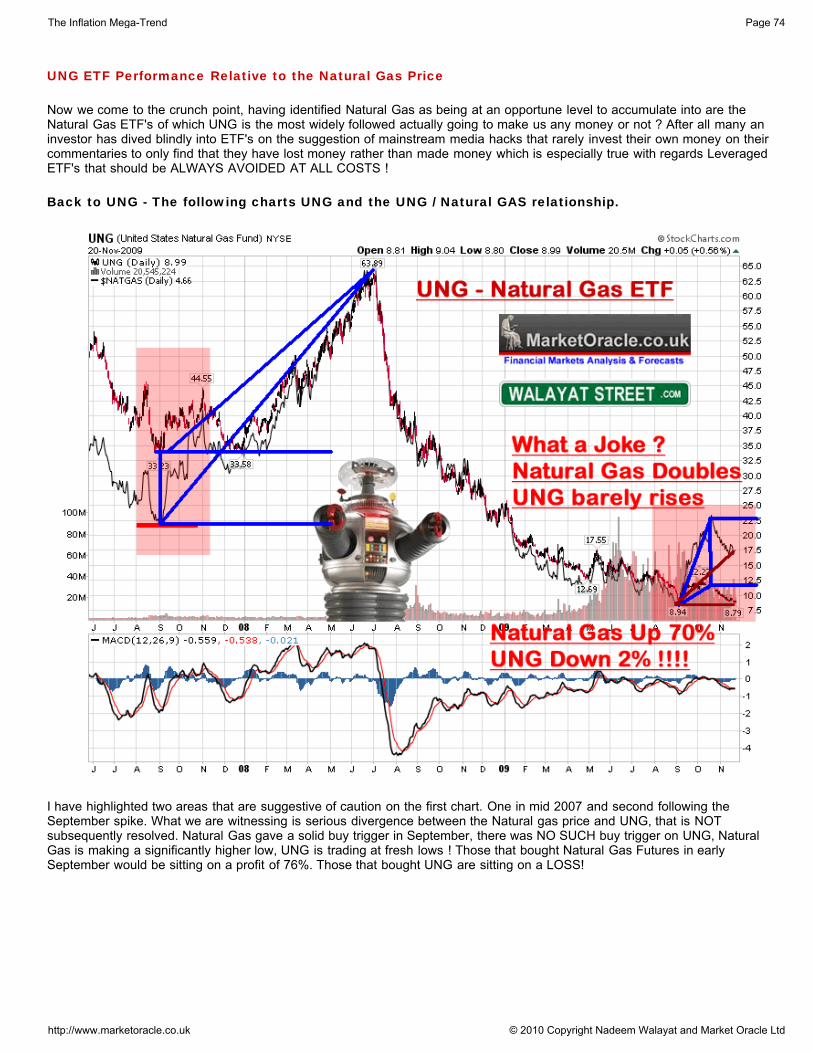
UNG ETF Performance Relative to the Natural Gas Price
Now we come to the crunch point, having identified Natural Gas as being at an opportune level to accumulate into are theNatural Gas ETF's of which UNG is the most widely followed actually going to make us any money or not ? After all many aninvestor has dived blindly into ETF's on the suggestion of mainstream media hacks that rarely invest their own money on theircommentaries to only find that they have lost money rather than made money which is especially true with regards LeveragedETF's that should be ALWAYS AVOIDED AT ALL COSTS !
Back to UNG - The following charts UNG and the UNG / Natural GAS relationship.
I have highlighted two areas that are suggestive of caution on the first chart. One in mid 2007 and second following theSeptember spike. What we are witnessing is serious divergence between the Natural gas price and UNG, that is NOTsubsequently resolved. Natural Gas gave a solid buy trigger in September, there was NO SUCH buy trigger on UNG, NaturalGas is making a significantly higher low, UNG is trading at fresh lows ! Those that bought Natural Gas Futures in earlySeptember would be sitting on a profit of 76%. Those that bought UNG are sitting on a LOSS!
The Inflation Mega-Trend Page 74
http://www.marketoracle.co.uk © 2010 Copyright Nadeem Walayat and Market Oracle Ltd
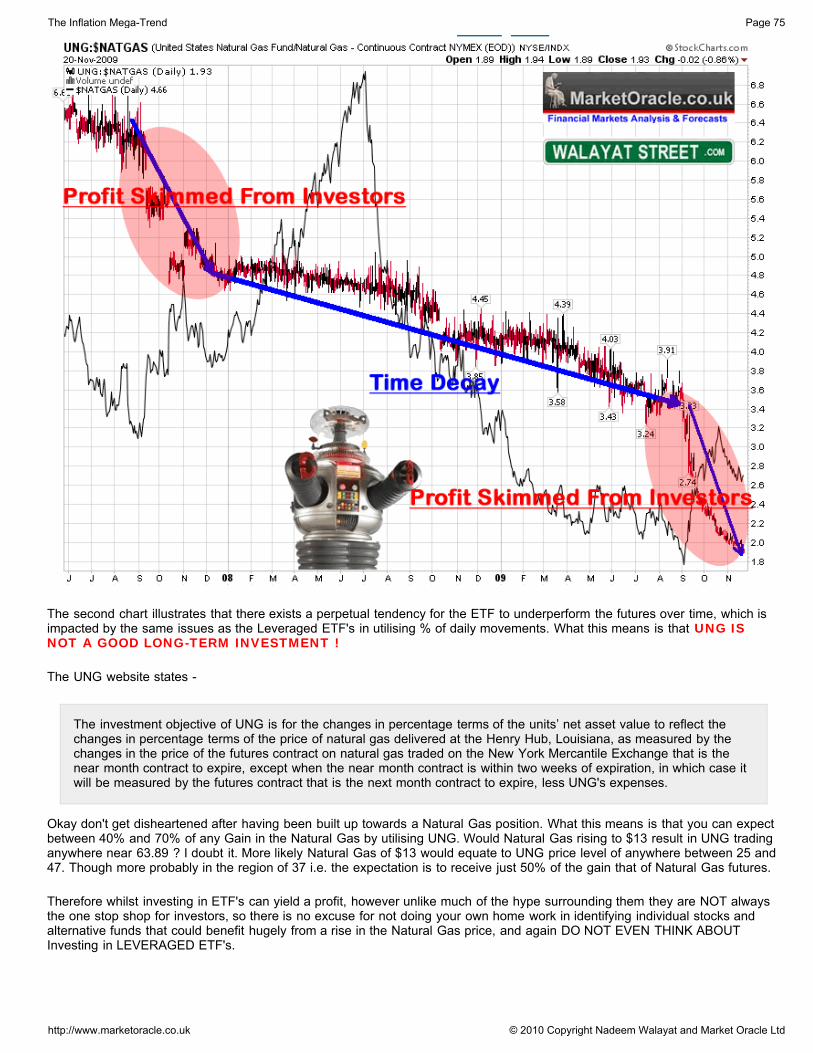
The second chart illustrates that there exists a perpetual tendency for the ETF to underperform the futures over time, which isimpacted by the same issues as the Leveraged ETF's in utilising % of daily movements. What this means is that UNG ISNOT A GOOD LONG-TERM INVESTMENT !
The UNG website states -
The investment objective of UNG is for the changes in percentage terms of the units’ net asset value to reflect thechanges in percentage terms of the price of natural gas delivered at the Henry Hub, Louisiana, as measured by thechanges in the price of the futures contract on natural gas traded on the New York Mercantile Exchange that is thenear month contract to expire, except when the near month contract is within two weeks of expiration, in which case itwill be measured by the futures contract that is the next month contract to expire, less UNG's expenses.
Okay don't get disheartened after having been built up towards a Natural Gas position. What this means is that you can expectbetween 40% and 70% of any Gain in the Natural Gas by utilising UNG. Would Natural Gas rising to $13 result in UNG tradinganywhere near 63.89 ? I doubt it. More likely Natural Gas of $13 would equate to UNG price level of anywhere between 25 and47. Though more probably in the region of 37 i.e. the expectation is to receive just 50% of the gain that of Natural Gas futures.
Therefore whilst investing in ETF's can yield a profit, however unlike much of the hype surrounding them they are NOT alwaysthe one stop shop for investors, so there is no excuse for not doing your own home work in identifying individual stocks andalternative funds that could benefit hugely from a rise in the Natural Gas price, and again DO NOT EVEN THINK ABOUTInvesting in LEVERAGED ETF's.
The Inflation Mega-Trend Page 75
http://www.marketoracle.co.uk © 2010 Copyright Nadeem Walayat and Market Oracle Ltd

INVESTING LESSON - Before you invest a single penny in any ETF, make sure you check its performance against theunderlying market, better to find out the truth now then wake up one morning to find that you have not made any money whilstthe underlying security soared in price! Unfortunately many analysts FAIL to perform this exercise after having performedanalysis of the underlying market then jump straight into recommend an ETF. I don't want excuses or explanations of why theexpected return never materialised. There is no point in investing in an fund that only generates profits only for fund managers!
Natural Gas ConclusionYes you missed the September low, but the recent correction gives you another bite at the cherry AFTER the initial trendchange buy trigger has already occurred. I.e. the risk of a loss is far lower now than accumulating before the September buytrigger occurred. Now I am NOT saying that Natural Gas is going to rocket higher in the coming days or weeks, or even monthsbut what I am saying is that it is not unreasonable to assume that Natural Gas will spike higher at some point during the next 1-2 years that would lift Natural Gas to at least $13 from the present $4.66. Especially as many commodities are busting OUT oftheir upper ranges which could conclude in an eventual spike significantly higher than $13.
Natural Gas ExposureUNG has shown itself to mot be a good short or long-term investment vehicle, however the stocks investment section features afew Natural Gas exposure plays.
The Inflation Mega-Trend Page 76
http://www.marketoracle.co.uk © 2010 Copyright Nadeem Walayat and Market Oracle Ltd
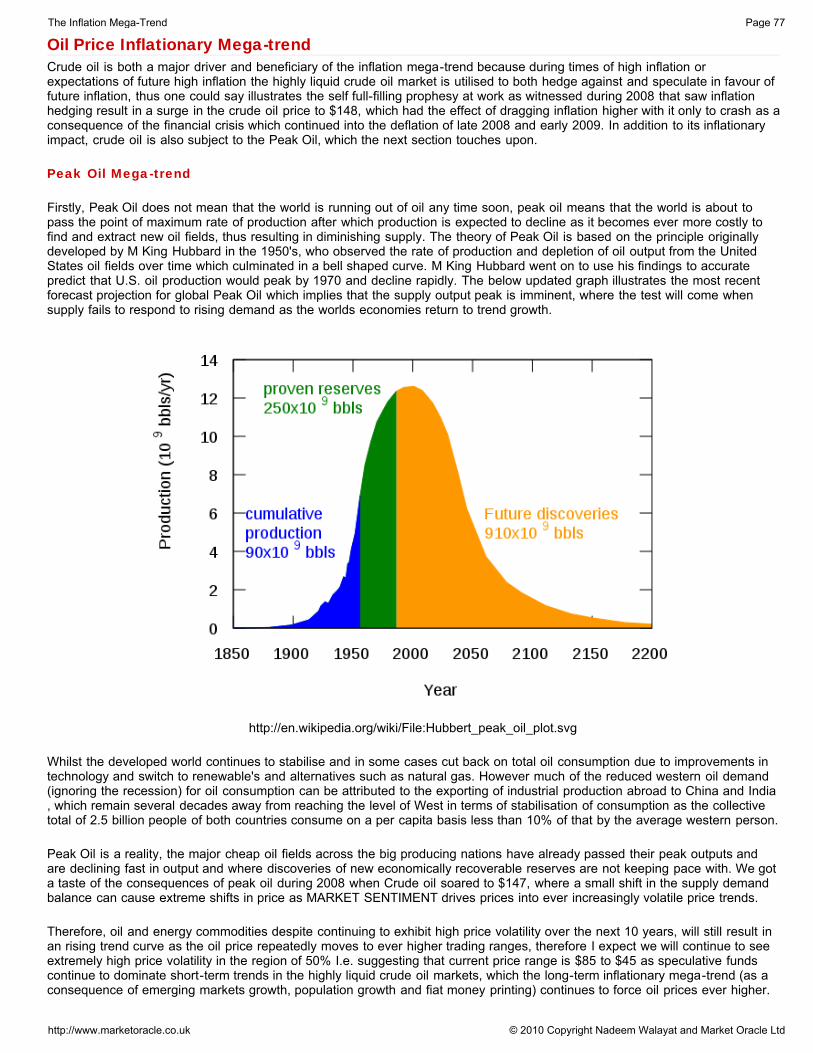
Oil Price Inflationary Mega-trendCrude oil is both a major driver and beneficiary of the inflation mega-trend because during times of high inflation orexpectations of future high inflation the highly liquid crude oil market is utilised to both hedge against and speculate in favour offuture inflation, thus one could say illustrates the self full-filling prophesy at work as witnessed during 2008 that saw inflationhedging result in a surge in the crude oil price to $148, which had the effect of dragging inflation higher with it only to crash as aconsequence of the financial crisis which continued into the deflation of late 2008 and early 2009. In addition to its inflationaryimpact, crude oil is also subject to the Peak Oil, which the next section touches upon.
Peak Oil Mega-trend
Firstly, Peak Oil does not mean that the world is running out of oil any time soon, peak oil means that the world is about topass the point of maximum rate of production after which production is expected to decline as it becomes ever more costly tofind and extract new oil fields, thus resulting in diminishing supply. The theory of Peak Oil is based on the principle originallydeveloped by M King Hubbard in the 1950's, who observed the rate of production and depletion of oil output from the UnitedStates oil fields over time which culminated in a bell shaped curve. M King Hubbard went on to use his findings to accuratepredict that U.S. oil production would peak by 1970 and decline rapidly. The below updated graph illustrates the most recentforecast projection for global Peak Oil which implies that the supply output peak is imminent, where the test will come whensupply fails to respond to rising demand as the worlds economies return to trend growth.
http://en.wikipedia.org/wiki/File:Hubbert_peak_oil_plot.svg
Whilst the developed world continues to stabilise and in some cases cut back on total oil consumption due to improvements intechnology and switch to renewable's and alternatives such as natural gas. However much of the reduced western oil demand(ignoring the recession) for oil consumption can be attributed to the exporting of industrial production abroad to China and India, which remain several decades away from reaching the level of West in terms of stabilisation of consumption as the collectivetotal of 2.5 billion people of both countries consume on a per capita basis less than 10% of that by the average western person.
Peak Oil is a reality, the major cheap oil fields across the big producing nations have already passed their peak outputs andare declining fast in output and where discoveries of new economically recoverable reserves are not keeping pace with. We gota taste of the consequences of peak oil during 2008 when Crude oil soared to $147, where a small shift in the supply demandbalance can cause extreme shifts in price as MARKET SENTIMENT drives prices into ever increasingly volatile price trends.
Therefore, oil and energy commodities despite continuing to exhibit high price volatility over the next 10 years, will still result inan rising trend curve as the oil price repeatedly moves to ever higher trading ranges, therefore I expect we will continue to seeextremely high price volatility in the region of 50% I.e. suggesting that current price range is $85 to $45 as speculative fundscontinue to dominate short-term trends in the highly liquid crude oil markets, which the long-term inflationary mega-trend (as aconsequence of emerging markets growth, population growth and fiat money printing) continues to force oil prices ever higher.
The Inflation Mega-Trend Page 77
http://www.marketoracle.co.uk © 2010 Copyright Nadeem Walayat and Market Oracle Ltd
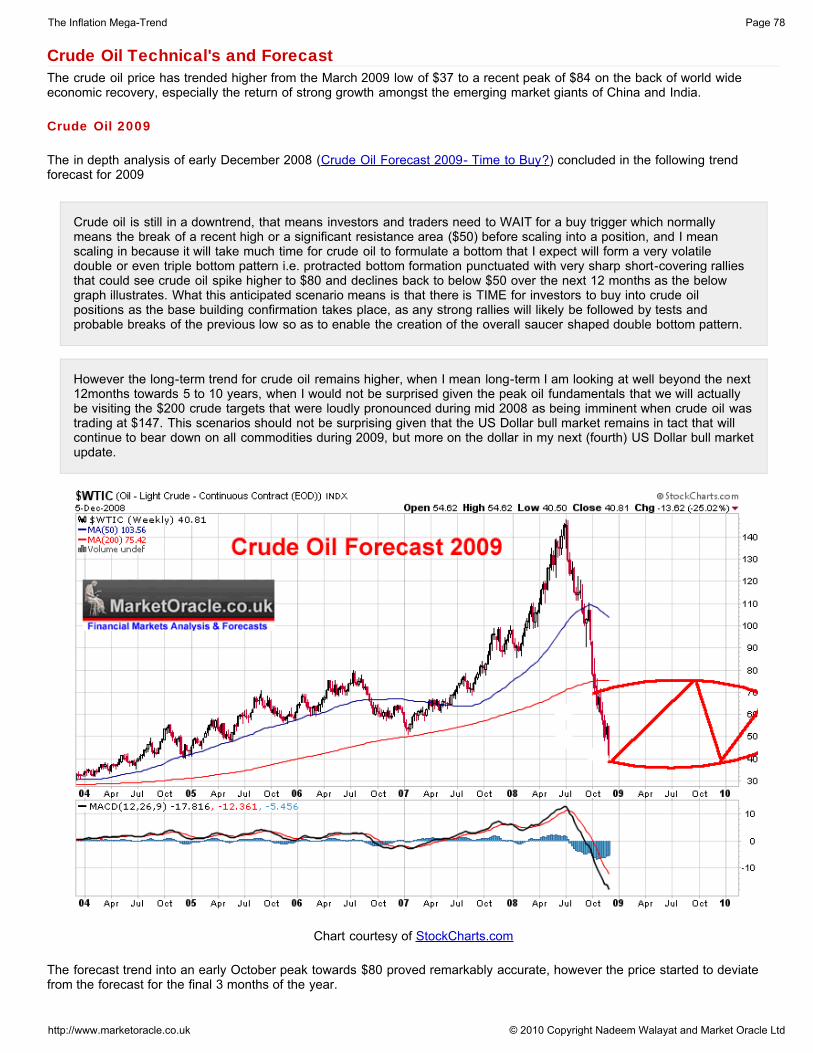
Crude Oil Technical's and ForecastThe crude oil price has trended higher from the March 2009 low of $37 to a recent peak of $84 on the back of world wideeconomic recovery, especially the return of strong growth amongst the emerging market giants of China and India.
Crude Oil 2009
The in depth analysis of early December 2008 (Crude Oil Forecast 2009- Time to Buy?) concluded in the following trendforecast for 2009
Crude oil is still in a downtrend, that means investors and traders need to WAIT for a buy trigger which normallymeans the break of a recent high or a significant resistance area ($50) before scaling into a position, and I meanscaling in because it will take much time for crude oil to formulate a bottom that I expect will form a very volatiledouble or even triple bottom pattern i.e. protracted bottom formation punctuated with very sharp short-covering ralliesthat could see crude oil spike higher to $80 and declines back to below $50 over the next 12 months as the belowgraph illustrates. What this anticipated scenario means is that there is TIME for investors to buy into crude oilpositions as the base building confirmation takes place, as any strong rallies will likely be followed by tests andprobable breaks of the previous low so as to enable the creation of the overall saucer shaped double bottom pattern.
However the long-term trend for crude oil remains higher, when I mean long-term I am looking at well beyond the next12months towards 5 to 10 years, when I would not be surprised given the peak oil fundamentals that we will actuallybe visiting the $200 crude targets that were loudly pronounced during mid 2008 as being imminent when crude oil wastrading at $147. This scenarios should not be surprising given that the US Dollar bull market remains in tact that willcontinue to bear down on all commodities during 2009, but more on the dollar in my next (fourth) US Dollar bull marketupdate.
Chart courtesy of StockCharts.com
The forecast trend into an early October peak towards $80 proved remarkably accurate, however the price started to deviatefrom the forecast for the final 3 months of the year.
The Inflation Mega-Trend Page 78
http://www.marketoracle.co.uk © 2010 Copyright Nadeem Walayat and Market Oracle Ltd

Crude Oil Analysis 2010
Economic Fundamentals - During 2010, all of the major economies of the world are expected to recover to some extentand thus put upward pressure on crude oil demand in advance of which the oil price has already responded by rising to therecent high of 84. Which illustrates that despite the recession and weak recovery to date crude oil is trading near historic highsthat were only really significantly beaten during the 2008 speculative oil price spike to $148.
CRUDE OIL FUNDEMENTALS - The current supply demand balance stands at 86 million barrels per day for supply and 86million for demand which follows the crash in demand to 84 million during 2009 Q2. Demand is expected to rise to 87 mb/dduring 2010 which the worlds supply capacity of upto 88 mb/d is able to cope with as OPEC is expected to increase output tocover. This therefore implies that for 2010 at least, oil prices can be expected to trend sideways within a range.
The worlds total known oil reserves are being depleted at the rate of 2 barrels for every 1 new discovery, and each new barrelis estimated to cost an average of $65 to discover, therefore a lower oil price would result in lack of exploration for new fieldstherefore sowing the seeds for a future oil price spike. These fundamentals are therefore supportive of a $60 - $65 floor and thelonger-term peak oil uptrend.
TREND ANALYSIS - Crude oil has trended higher following the December 2008 and February 2009 lows, making higherhighs and higher lows along the way with the most recent price action managing to keep the up trendline intact. Howeverhaving entered the seasonally weakest period of the year implies that this trendline should break which would first target $72and then $65. The overall trend picture being painted for crude oil during 2010 is that for a period of consolidation between arange of $85 and $60.
SEASONAL TREND - Crude oil's seasonal tendency is by and large linked with that of its largest consumer, the UnitedStates, which suggests oil prices are expected to trend higher from a February low into the summer vacation season andcontinue towards late in the hurricane season i.e. October, before trending lower again into a February low. Last year theseasonal trend only extended to the extent of a rally into October after which the correction failed to materialise until this month,which has seen crude oil correct towards $72.
MACD - The MACD indicator is painting a neutral picture for crude oil which is supportive of the uptrend.
ELLIOTT WAVE THEORY - Elliott Wave is warning that the rally off of the March lows may have been corrective in naturei.e. a B wave rally as the price action at the low was not significant enough to generate an ABC pattern into the low thusimplying that it marked the end of a A wave decline. However given the extent of the decline, I cannot see $35 being revisitedduring 2010, which therefore is suggestive of significantly higher B wave, though that would change the wave pattern from an B-C wave pattern to a 1-2 wave pattern. Therefore at this point in time Elliott Wave theory is generating conflicting wavescenarios. Therefore I am concluding towards a more significant correction for crude oil than experienced during the past 10months, but not one that would take crude oil to anywhere near the $35 low but probably more in the region of $60.
SUPPORT / RESISTANCE - Resistance for crude oil lies at $80, then $86 which contained the most recent high, then $100.Meanwhile support lies at $60. This suggests an immediate term trading range for crude oil between $80 and $60 and a widerrange of $100 to $60.
PRICE TARGETS - Downside targets for the current correction resolve to $70, then $65. Upside shows a target range of $80to $86 which again supports the view that 2010 could be a year of a trading range which is contrary to what we haveexperienced during past 5 years, something more akin to the trends experienced during the 1990's.
The Inflation Mega-Trend Page 79
http://www.marketoracle.co.uk © 2010 Copyright Nadeem Walayat and Market Oracle Ltd
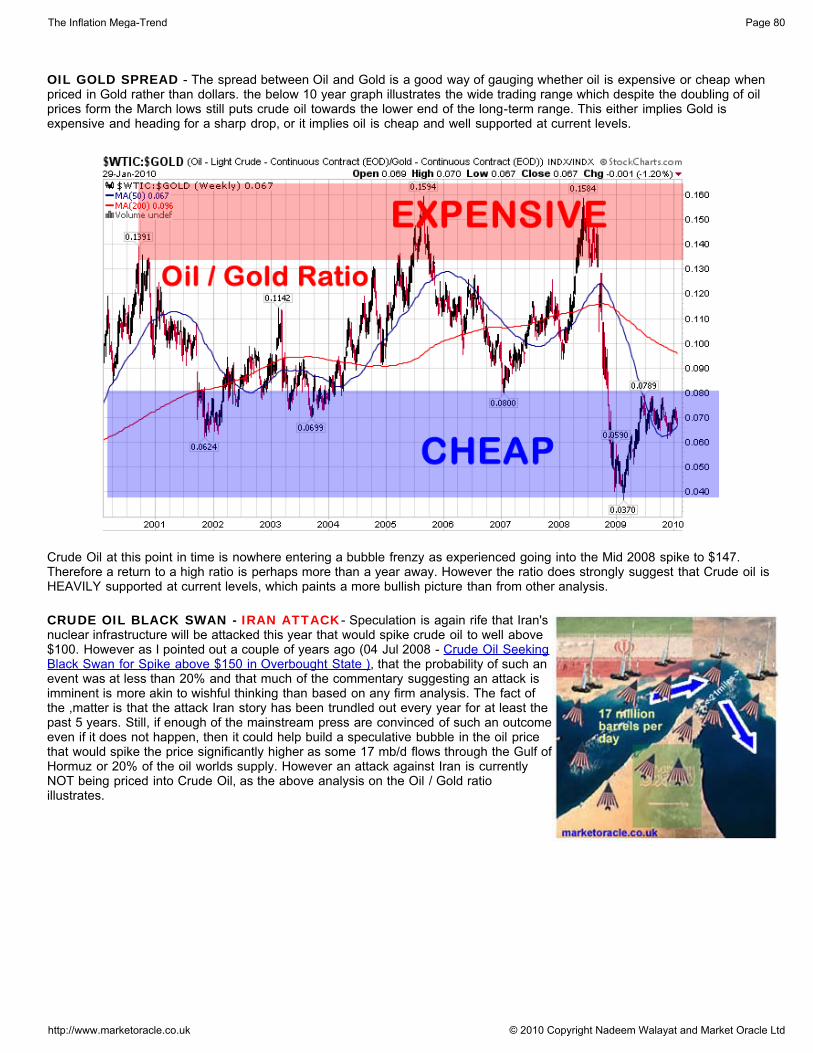
OIL GOLD SPREAD - The spread between Oil and Gold is a good way of gauging whether oil is expensive or cheap whenpriced in Gold rather than dollars. the below 10 year graph illustrates the wide trading range which despite the doubling of oilprices form the March lows still puts crude oil towards the lower end of the long-term range. This either implies Gold isexpensive and heading for a sharp drop, or it implies oil is cheap and well supported at current levels.
Crude Oil at this point in time is nowhere entering a bubble frenzy as experienced going into the Mid 2008 spike to $147.Therefore a return to a high ratio is perhaps more than a year away. However the ratio does strongly suggest that Crude oil isHEAVILY supported at current levels, which paints a more bullish picture than from other analysis.
CRUDE OIL BLACK SWAN - IRAN ATTACK- Speculation is again rife that Iran'snuclear infrastructure will be attacked this year that would spike crude oil to well above$100. However as I pointed out a couple of years ago (04 Jul 2008 - Crude Oil SeekingBlack Swan for Spike above $150 in Overbought State ), that the probability of such anevent was at less than 20% and that much of the commentary suggesting an attack isimminent is more akin to wishful thinking than based on any firm analysis. The fact ofthe ,matter is that the attack Iran story has been trundled out every year for at least thepast 5 years. Still, if enough of the mainstream press are convinced of such an outcomeeven if it does not happen, then it could help build a speculative bubble in the oil pricethat would spike the price significantly higher as some 17 mb/d flows through the Gulf ofHormuz or 20% of the oil worlds supply. However an attack against Iran is currentlyNOT being priced into Crude Oil, as the above analysis on the Oil / Gold ratioillustrates.
The Inflation Mega-Trend Page 80
http://www.marketoracle.co.uk © 2010 Copyright Nadeem Walayat and Market Oracle Ltd
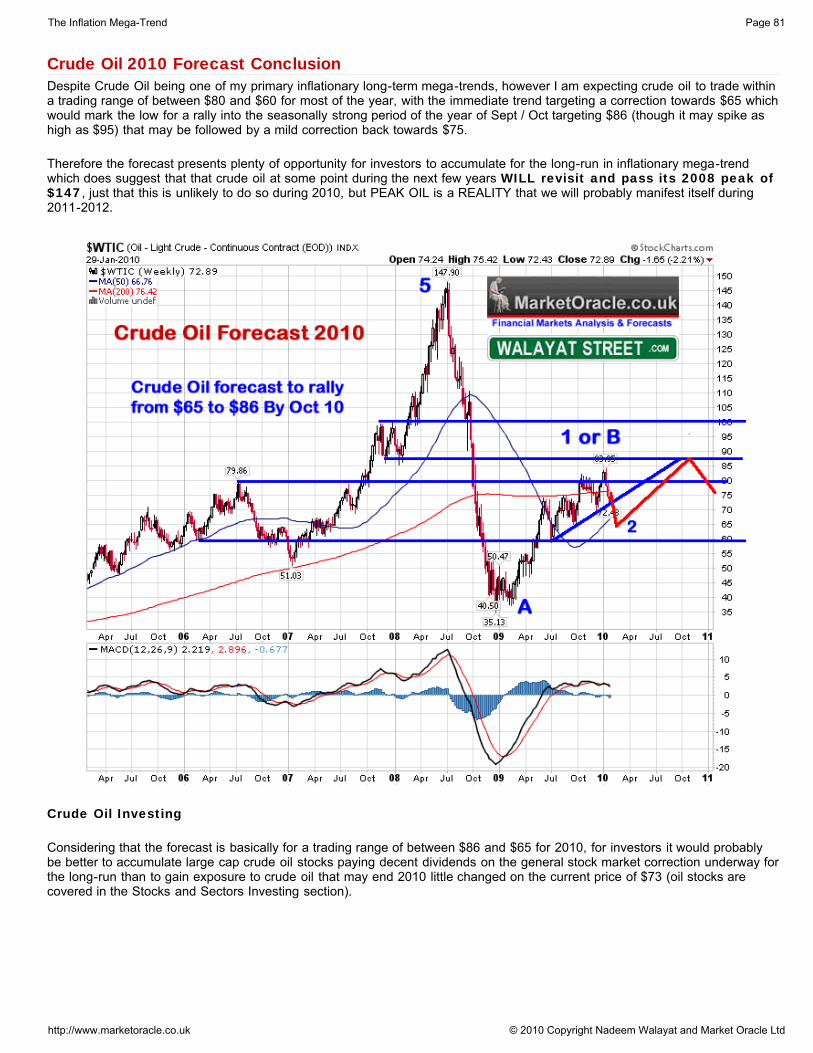
Crude Oil 2010 Forecast ConclusionDespite Crude Oil being one of my primary inflationary long-term mega-trends, however I am expecting crude oil to trade withina trading range of between $80 and $60 for most of the year, with the immediate trend targeting a correction towards $65 whichwould mark the low for a rally into the seasonally strong period of the year of Sept / Oct targeting $86 (though it may spike ashigh as $95) that may be followed by a mild correction back towards $75.
Therefore the forecast presents plenty of opportunity for investors to accumulate for the long-run in inflationary mega-trendwhich does suggest that that crude oil at some point during the next few years WILL revisit and pass its 2008 peak of$147, just that this is unlikely to do so during 2010, but PEAK OIL is a REALITY that we will probably manifest itself during2011-2012.
Crude Oil Investing
Considering that the forecast is basically for a trading range of between $86 and $65 for 2010, for investors it would probablybe better to accumulate large cap crude oil stocks paying decent dividends on the general stock market correction underway forthe long-run than to gain exposure to crude oil that may end 2010 little changed on the current price of $73 (oil stocks arecovered in the Stocks and Sectors Investing section).
The Inflation Mega-Trend Page 81
http://www.marketoracle.co.uk © 2010 Copyright Nadeem Walayat and Market Oracle Ltd

Stocks Stealth Bull Market Trend ForecastThe reason why my analysis is focused on the Dow and not the FTSE index is because the Dow has been my primary tradingvehicle for some 25 years, as at the start of my trading career back in 1986 the FTSE was the new kid on the block with littleprice history behind it, whereas the DJIA had relatively easily obtainable data dating back over a hundred years (via bulletinsboards, a precursor for the internet).
Whilst this analysis attempts to accurately project a road map trend for the Dow for the whole of 2010, however readers shouldensure that they read my regular in depth updates on the Dow trend (approximately every 2 months) which are emailed out andalso at walayatstreet.com
2009 The Year of the Stocks Stealth Bull Market
For stock market Investors and traders there were two key events during the year.
1. The Stocks Bear Market Bottom of early March 2009 (Dow 6470).2. The birth of the Stocks Stealth Bull Market that saw many indices soar by more than 60% over the next 9 months.
The primary purpose of analysis is to generate market scenario's that have a high probability of success for the primary purposeof monetizing on these trends that are usually contrary to the consensus view.
In this regard the stock market bottom of early March fulfills this as the whole subsequent rally has been called by the vastmajority of analysts across the board a bear market rally to SELL into, virtually every correction has been followed by calls thatthe market has topped and the resumption of bear market lows as imminent. The most notable crescendo of the crash iscoming calls was during the October correction when widespread commentary spread forth of an imminent crash that AGAINFAILED to materialise.
Dow Jones Stock Market Forecast 2009 - 20th Jan 2009
Dow Jones Mid 2009 Low 6600 - 70% Confidence; End 2009 at 8,600 (During December 2009) - 65% Confidence
Chart courtesy of StockCharts.com
The Inflation Mega-Trend Page 82
http://www.marketoracle.co.uk © 2010 Copyright Nadeem Walayat and Market Oracle Ltd

Stealth Bull Market Follows Stocks Bear Market Bottom at Dow 6,470 - 14th March 2009
Now watch ! How this STEALTH bull market will consistently be recognised as just a bear market rally to sell into andNOT to accumulate into. All the way from 6,600 to 7,600 to 8,600 and even beyond, the move will be missed by mostas consistently bearish rhetoric and data will ensure only the smart money accumulates, for the small investor has nowbecome Conditioned to the Bear Market Rallies of 20% and subsequently plunges to fresh lows. Many, many monthsfrom now, with stocks up 30%, investors will then WAIT for THE BIG CORRECTION, THE RE-TEST to buy into theapparent BULL Market , Well these investors will still be waiting as stocks pass the 50% advance mark, AGAIN onlythose that will have profited are the hedge funds and fund investors (Smart Money) WHO HAVE BEENACCUMULATING , as I elaborate upon next.
In Summary - We have in all probability seen THE stocks bear market bottom at 6470, which is evident in the fact thatfew are taking the current rally seriously instead viewing it as an opportunity to SELL INTO , Which is exactly what themarket manipulators and smart money desires. They do not want the small investors carrying heavy losses of the past18 months to accumulate here, No they want the not so smart money to SELL into the rally so that more canaccumulated at near rock bottom prices! Therefore watch for much more continuous commentary of HOW this isBEAR MARKET RALLY THAT IS TO BE SOLD INTO as the Stealth Bull Market gathers steam.
The Inflation Mega-Trend Page 83
http://www.marketoracle.co.uk © 2010 Copyright Nadeem Walayat and Market Oracle Ltd

Stealth Stocks Bull Market, Sell in May and Go Away? - 26th April 2009
Conclusion - Immediate term conflicting analysis, will there be a continuing rally into early May or not ? Clearly earlyweek will be weak and a lot now depends on whether the support of 7,800 holds, the 280 point gap between the lastclose and support should give the market plenty of swine flu room to breath, it is a tough call but after that early weekwobble, I would go with a continuation into early May to set up for the main move which is for the significant correctionthat targets a decline of about 14% or Dow 7,500 from 8750. If 7800 fails early week that implies Dow 7,100. So justas the herd is starting to pile in the smart money will be positioning for a significant correction and importantly themove will be TRADEABLE, none of these 1 or 2 day falls that have suckered the bears in during the rally, but for asustained down trend though swine flu may bring this forward to the start of the week. Note this is an interim update,my in depth analysis will attempt to more accurately map out the Dow swings of several months so make sure yoursubscribed to my always FREE newsletter to get this on the day of publication.
The Inflation Mega-Trend Page 84
http://www.marketoracle.co.uk © 2010 Copyright Nadeem Walayat and Market Oracle Ltd

Vicious Stocks Stealth Bull Market Eats the Bears Alive!, What's Next? - 23rd July 2009
CONCLUSION - My earlier fears about a bull trap appear to be unfounded, the stock chart is talking that we are in astocks bull market, and is suggestive of a trend higher towards a 2009 target of between 9750 and 10,000, with a highprobability that we may get there before the end of October!. Key danger areas for this scenario are a. for the trendline to contain corrections, and b. that 8080, MUST HOLD.
The Inflation Mega-Trend Page 85
http://www.marketoracle.co.uk © 2010 Copyright Nadeem Walayat and Market Oracle Ltd
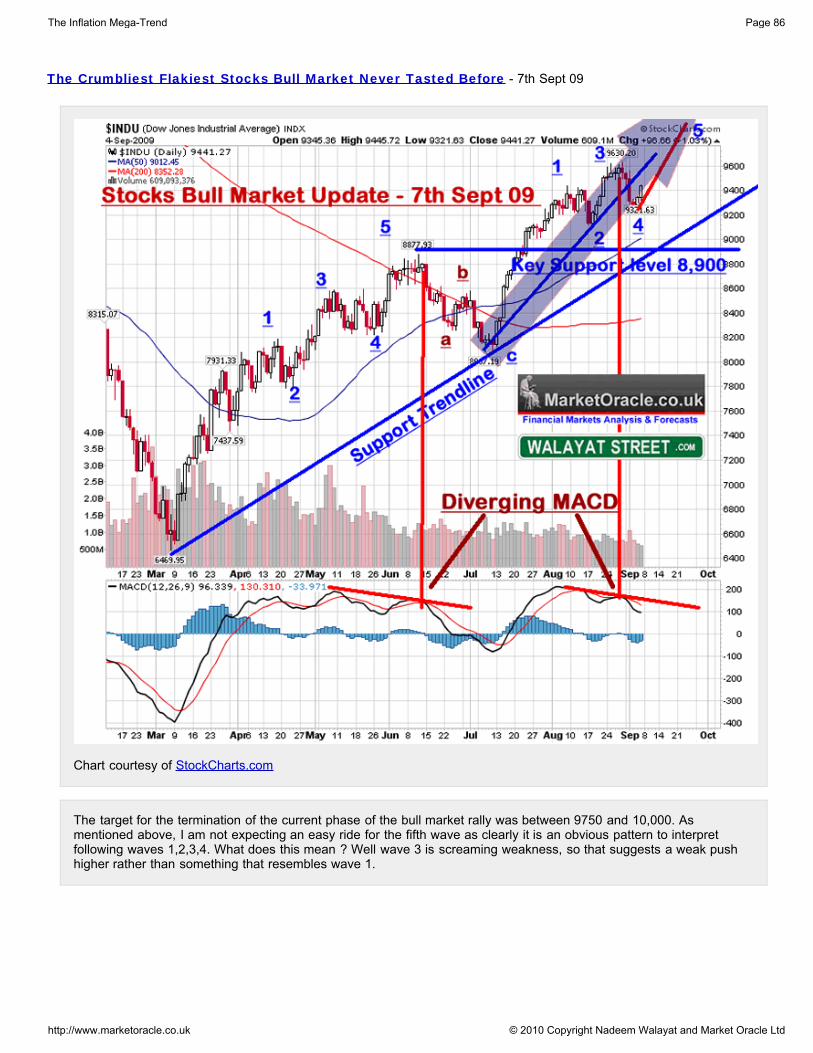
The Crumbliest Flakiest Stocks Bull Market Never Tasted Before - 7th Sept 09
Chart courtesy of StockCharts.com
The target for the termination of the current phase of the bull market rally was between 9750 and 10,000. Asmentioned above, I am not expecting an easy ride for the fifth wave as clearly it is an obvious pattern to interpretfollowing waves 1,2,3,4. What does this mean ? Well wave 3 is screaming weakness, so that suggests a weak pushhigher rather than something that resembles wave 1.
The Inflation Mega-Trend Page 86
http://www.marketoracle.co.uk © 2010 Copyright Nadeem Walayat and Market Oracle Ltd

Stocks Bull Market Correction Continues, U.S. Dollar Bears Running Out of Time? - 4th Oct 09
Stocks Bull Market Forecast Update Into Year End - 2nd Nov 09
The Inflation Mega-Trend Page 87
http://www.marketoracle.co.uk © 2010 Copyright Nadeem Walayat and Market Oracle Ltd
There is nothing to suggest at this point in time that the stocks bull market is over which means that that correctionsare for accumulating into, the overall trend is for stocks is to continue climbing a wall of worry whilst investors arescared by the vocal crash is coming crowd that will continue to re-write history to always be right in hindsight to againcome out with more crash calls over the next few months as the Dow chart of the 1930's gets it's start / end datemanipulated again so as to fit fresh crash calls.
The stocks bull market that has raged since the March low has fulfilled the original objective for a 50% advance,therefore upside for the next two months looks limited with greater risk of downside in the coming weeks thoughpending a break of the major support trendline which implies a rally in the immediate future. All in all this is suggestiveof a downtrend towards 9,400 into Mid November with a year end rally to back above 10,000 targeting a rally high inthe region of 10,350 to 10,500 during December.
Stock Market Santa Rally and Election Weapons of Mass Deception - 13th Dec 09
My concluding thought, we get the santa rally to a new 2009 high for the Dow into the last few days of December andthen the market starts the significant correction.
Economy, Inflation and Interest Rate Forecasts Conclusions Applied to the Stock Market
The in depth economic analysis (inflation, economy, interest rates) has resolved towards the conclusion for a strong abovetrend economic recovery and rising inflation (UK early spike higher) during 2010 with a relatively mild up tick in interest ratesduring the second half of the year which will allow government's the opportunity to get a grip with the deficits under themomentum of economic growth and the return of consumer / investor confidence. However, I also do expect both the Bank ofEngland and U.S. Fed to continue quantitative easing aka money printing to monetize the huge budget deficits, without whichmarket interest rates would be significantly higher.
The analysis conclusions are highly supportive for the stock market during 2010 and probably beyond as corporate earningscontinue to play catch up to the stock market price trends with institutions and large speculative funds continuing to dumpcheap money into the stock market and other speculative assets having been driven out of low yield assets, therefore drivingprices higher whilst the small investors are left to follow the perma bear crowd that are perpetually expecting a break of theMarch 2010 lows as though it is a done deal.
The Inflation Mega-Trend Page 88
http://www.marketoracle.co.uk © 2010 Copyright Nadeem Walayat and Market Oracle Ltd

Stock Market Mega-Inflationary Trend
The Above graph illustrates the stock market inflationary mega-trend or growth spiral which basically implies that the further ageneral stock market index such as the Dow, S&P or FTSE deviates from its peak in terms of price and time, then the greaterthe long-term potential it presents for investors. Which highlights why the early 2009 stock market plunge into the March lowswas literally a once in a life time buying opportunity, as I warned investors to prepare towards in October 2008 - Stocks BearMarket Long-term Investing Strategy
Whilst I don't like to transpose past price action onto the present as it is not reliable, however I do recall at the time of the rallyoff of the 1991 decline everyone had their eyeballs fixated on the 1987 crash lows as though they would be revisited, when infact it was another great buying opportunity of a lifetime as the subsequent price action illustrated. All you folks may not realisethis now but the period from 1991 to 1996 was ALL followed by perpetual extremely bearish commentary of the end is nigh.Few BOUGHT This rally ! Even Greenspan appeared to play the bearish card at about Dow 6,000 with his famous Irrationalexuberance speech at the end of 2006 to frighten and keep weak small investors out of the market that would only returntowards the end of the dot com boom. The Dow doubled from 1996 to 2000.
Where do we stand today ? Well we have not even reached the stage that demands another Irrational Exuberancespeech. We are in the overwhelming bearish commentary phase that frightens and keeps all but the smartest money out of themarket much as the occurred following the 1987 crash rally, much as occurred from 1991 to 2006. Presently this commentaryappears as an avalanche of bearishness on EVERY correction, the consequences of which is reflected in the volume data thatshows most people are NOT buying the rally but SELLING, which is why I termed this a stealth stocks bull market back inMarch 2009.
What we are witnessing today is pretty much similar behaviour that I suspect will persist for many years! whilst the bullmarket rages on!
Yes, for 2010 the best of the gains in terms of price / time are behind us, however the Dow is a long way from reaching anoverbought / expensive state, therefore still presents a good long-term accumulating level.
The Inflation Mega-Trend Page 89
http://www.marketoracle.co.uk © 2010 Copyright Nadeem Walayat and Market Oracle Ltd
Market Manipulation
I came to the conclusion a couple some time a couple of decades ago that the markets were manipulated, therefore takingaccount of market manipulation in terms of what direction will the dark pools of capital deployed by the worlds investment banksand speculative funds take the markets next as part of its psychological make up i.e. Mr Market, is a very importantcomponent of the tripartite of analysis in addition to technical & inter-market analysis and the sum of all fundamental analysis.Put all three together and one has a higher probability of profiting from today's investment decisions. Apart from working within adark pool institution such as Goldman Sachs, the only way to get an insight into their behaviour is to evaluate which trend wouldthe dark pools most profit from at any particular point in time i.e. market psychology which usually means the opposite action tothe consensus view.
This is one of the key contributory reasons why I called the birth of the stocks stealth bull market of March 2009 that has sinceconsistently been called a bear market rally despite the fact it has seen a phenomenal 65% gain in 10 months. I mean that is aDREAM return for investors, one cannot hope for or expect anything better, but instead of enjoying a hugely profitable bull run,most small investors have been convinced to WAIT for evidence of economic and corporate earnings recovery by which time asoccurs it will be TOO LATE as the market will have already moved, precisely as I warned of in Mid March 2009.
So what does my interpretation of the dark pools or market psychology telling me today ?
It is telling me for the stock market as a whole that the dark pools are still engaged in accumulating into a stock market multi-year mega-trend which at present is in the motion of shaking out the temporary weak longs along. Which means we are STILLin a stealth bull market where the vocal media-sphere view it as a BEAR MARKET RALLY that has ENDED, consistentlyWRONG market calls by popular perma-bears are a god send for the market manipulating dark pools of capital as theycontinue to accumulate and profit from the stealth mega-trend.
Stock Market Crash Again?
Forget swine flu, the pandemic that has been doing the rounds for the past 6months is that of another Crash with the 1930'schart dusted down and presented as near fact of what is to transpire on every correction. However the markets response hasso far always been to eventually push to a new high for the move.
What happens to the crash calls ? They get amended and rolled out again on the NEXT correction! Don't believe me go checkout what I wrote on 2nd November.
However the damage has been done as short stops are hit and losses accrued that no broker will refund for the next crash call.
Stock Market Crash Calls
1. You CANNOT know with any reliability that the stock market is going to crash until AFTER it has actually peaked and entereda downtrend. Anyone that tells you a bull market pushing to new highs is going to crash is going to lose you all your money, asthe market rallying significantly from the crash call NEGATES THAT CALL where trading is concerned, because any shortpositions enacted upon the call are stopped out!
2. You can only enter a Crash TRADE barely a day or hours before the crash event. Crash calls made weeks, months or yearsin advance are WORTHLESS where trading is concerned, and where investing is concerned, all investors should have stopson their positions based on technical considerations of where they would admit their analysis is wrong on a particular stock.
Crash calls are dangerous in that bring emotions into play which instead of staying focused on reacting to price action,adrenaline gets traders to commit to positions that will soon most probably bust their accounts where EVEN if the marketeventually does CRASH, they will have been wiped out by the intervening rally SINCE the crash call! It is this fact that that isalways forgotten.
Don't believe me ? Go check ALL of the hyped stock and other market crash calls that in actual fact WERE FOLLOWED bymoves that would have wiped out REAL trades had those calls been acted up on.
The Inflation Mega-Trend Page 90
http://www.marketoracle.co.uk © 2010 Copyright Nadeem Walayat and Market Oracle Ltd

During 2009 I have shared some of my trading ideas that may go towards a future ebook-
Get in Synch with the MarketForecasting and TradingThe Holy Grail of TradingHow to Learn to TradeDon't Think Too Much
Economic Depression, What Depression ? - US GDP soared in the fourth quarter at an annualised 5.7%, yes, the rateof accent is probably NOT sustainable, but the debt fuelled bounce will continue a while before it peter's out into. The key pointis as I pointed out in the analysis of October 2008. That we are NOT heading for another 1930's GREAT DEPRESSION, andtherefore readers should scrub the notion of following the 1930's chart pattern towards anything like a 90% stocks crash. So farthe analysis is proving correct.
Corporate Earnings - Corporate earnings have FOLLOWED the stock market higher, despite continuous doom orientatedcommentary of the past 10 months that has repeatedly stated that corporate earnings forecasts implied stocks could NOT rally.
ELLIOTT WAVE THEORY - The elliott wave pattern resolves to an easily recognisable wave 4 correction which implies afurther 5th impulse wave higher will follow that could take the Dow significantly higher. Clearly the alternative more bearishcount is that Wave 3 was a Wave C of an ABC move which would imply that the rally to date corrected the preceding bearmarket from the 2007 high. My interpretation is that we get something in the middle, i.e. that BOTH interpretations are now FARTOO EASILY discernable from the price charts which suggests to me we get a volatile 5th wave higher, rather than a strongwave similar to Wave 1 and Wave 3. On a shorter term basis the immediate trend should resemble an ABC correction of whichwe are presently in the wave A decline that should shortly resolve towards a B wave rally before a C wave decline to end thecorrection.
TREND ANALYSIS - The Dow is falling towards major support at 10k. Given the strength of the downtrend to date, theprobability favours a break of 10k that would target approx 9,600. The bull market trendline has been breached which suggeststhat the stock market has entered a new character of behaviour that will be significantly different to that which followedthe March 2009 low. I.e. greater volatility, which suggests it will take the market some time to break the 10,729 high, which willprobably now not occur until the second half of 2010.
SUPPORT / RESISTANCE - There is a series of strong support in the region of 10,000 to 9,800. and then 9,500. Should9,500 break then the Dow could tumble all the way to 50% of the rally at 8,600. Overhead resistance lies at 10,300, then10,400. With strong resistance in the region of the 10,600 to the high of 10,726. It will probably take some time for thisresistance to be overcome. Next resistance above is at 11,250 that may mark a pause in the uptrend if it breaks higher enroutetowards the target for 2010.
PRICE TARGETS - Downside price targets resolve into the 9,500 to 9,800 zone, therefore this should contain the currentcorrection, a failure here would negate this analysis and probably mark the end of the bull market which initially targets adecline to 8,600. Upside projections show difficulty in breaking above the 10,729 high, though once overcome the Dow wouldtarget a level north of 12k.
MACD - The MACD confirms both the significant correction currently underway and the expectation of difficulty for the Dow toovercome its recent high for some time i.e. until it has been able to work out the overbought state. This suggests that it maytake the Dow several attempts to break above 10,729 during 2010, with the eventual break out higher probably not taking placeuntil the third quarter of 2010.
VOLUME - Volume has been WEAK throughout the rally, which has been one of the main reasons why so much commentaryhas been bearish during the rally. However it is perfectly inline with that of a stealth bull market and also implies that this rallyhas NOT been bought into. So all of the talk of hyper bullishness investor sentiment is basically rubbish as there is no sign ofsuch sentiment in the volume, which remains heavier on the declines than the rallies and thus suggestive of SELLING ratherthan buying into the rally.
SEASONAL TREND - There is a strong seasonal tendency for stocks to rally into Summer then correct in October followedby a sharp rally into December. This is contrary to my growing expectations of a tough first half of 2010. In fact we may see inlarge part the opposite trend during 2010.
PRESIDENT CYCLE YEAR 2- The impact of the 2nd year of the presidential cycle on the stock market is for a weak trendinto September, and a rally in the fourth quarter into the end of the year for a small average gain for the year. This much moreclosely resembles my growing expectations for 2010 then the seasonal trend.
The Inflation Mega-Trend Page 91
http://www.marketoracle.co.uk © 2010 Copyright Nadeem Walayat and Market Oracle Ltd
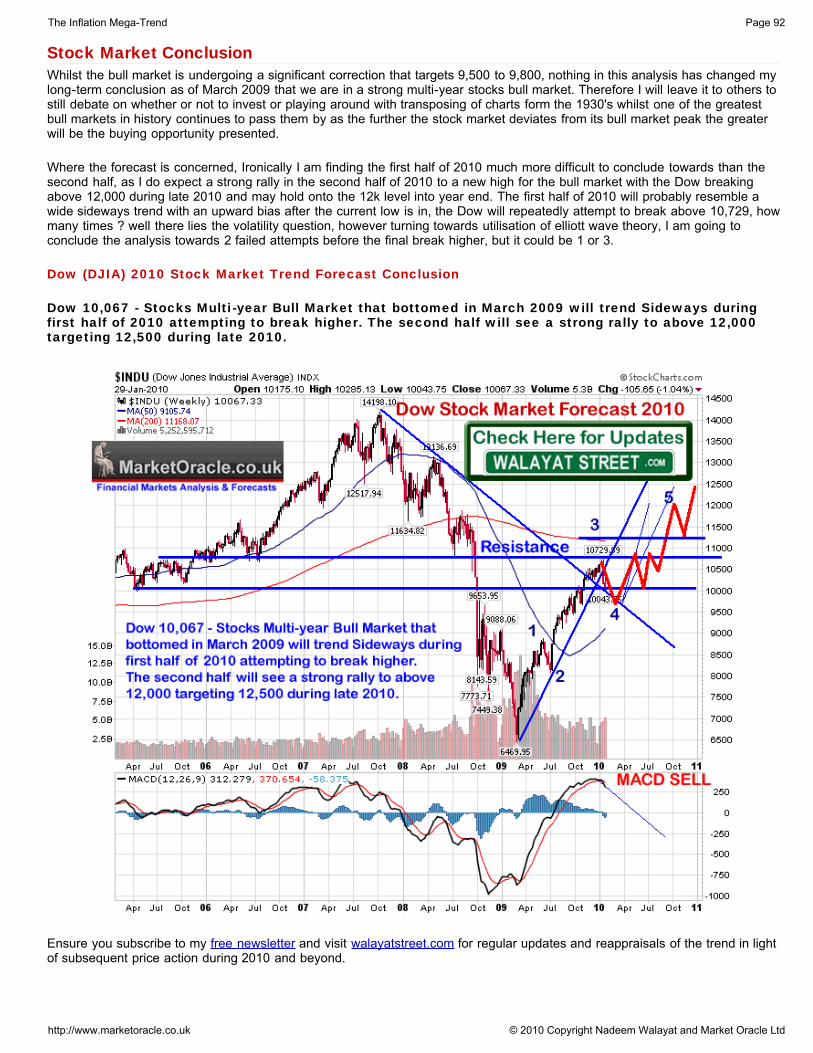
Stock Market ConclusionWhilst the bull market is undergoing a significant correction that targets 9,500 to 9,800, nothing in this analysis has changed mylong-term conclusion as of March 2009 that we are in a strong multi-year stocks bull market. Therefore I will leave it to others tostill debate on whether or not to invest or playing around with transposing of charts form the 1930's whilst one of the greatestbull markets in history continues to pass them by as the further the stock market deviates from its bull market peak the greaterwill be the buying opportunity presented.
Where the forecast is concerned, Ironically I am finding the first half of 2010 much more difficult to conclude towards than thesecond half, as I do expect a strong rally in the second half of 2010 to a new high for the bull market with the Dow breakingabove 12,000 during late 2010 and may hold onto the 12k level into year end. The first half of 2010 will probably resemble awide sideways trend with an upward bias after the current low is in, the Dow will repeatedly attempt to break above 10,729, howmany times ? well there lies the volatility question, however turning towards utilisation of elliott wave theory, I am going toconclude the analysis towards 2 failed attempts before the final break higher, but it could be 1 or 3.
Dow (DJIA) 2010 Stock Market Trend Forecast Conclusion
Dow 10,067 - Stocks Multi-year Bull Market that bottomed in March 2009 will trend Sideways duringfirst half of 2010 attempting to break higher. The second half will see a strong rally to above 12,000targeting 12,500 during late 2010.
Ensure you subscribe to my free newsletter and visit walayatstreet.com for regular updates and reappraisals of the trend in lightof subsequent price action during 2010 and beyond.
The Inflation Mega-Trend Page 92
http://www.marketoracle.co.uk © 2010 Copyright Nadeem Walayat and Market Oracle Ltd

Risks to the Forecast
Technically we have had a major sell signal on break of the main uptrend line which means the current correction has YET tobottom, my target is eventually a bottom at 9,500 to 9,800 after a corrective B wave rally towards 10,300, the C wave declineshould hold at this, however if 9,500 goes then this at least implies a bear market that initially targets 8,600.
The primary risk for the end to the bull market is that the central banks pull the plug on easy money as a consequence of aseries of sovereign debt crisis. I.e. forced to push interest rates much higher than forecast to prevent a bond market / monetarycollapse. In reality the government's have a window of opportunity to benefit from the strong economic recovery currentlyunderway to CUT the budget deficits and get a grip on debt to GDP ratios. If they waste this opportunity then this forecast couldfail as it resolves towards a bear market trend back towards the March 2009 lows.
However I put this risk at this point in time at about 25%, small but significant. It really depends on the economic bounce beingas strong as I forecast it to be which will carry the markets AHEAD of it, and inflation and consumer confidence along with ittherefore allowing deficits to be cut along side economic growth.
FTSE 100 Forecast 2010
I expect the FTSE to follow a similar trend to the Dow in terms of price pattern which resolves towards a target for FTSE 6,250to 6,600 by late 2010, with similar downside risks.
Stock Market Sectors and Stocks For the Mega-trend
This section aims to generate a selection of stocks as examples of what could be expected to perform well during theinflationary mega-trend as revenues and profits are inflated ever higher. My focus in the selection process has been towardssafety over risk therefore concentrating on elements of value investing, therefore the list contains mainly large cap stocks withstrong cash-flows, low debt and paying healthy dividends as well as being geared more towards a UK based investors. Againthis should act as a starting point for your own research into which stocks as part of the mega-trend sectors are likely toprosper on the basis of your own risk profile.
Dividends Value Investing Strategy
Investors were hit hard during 2008 by the collapse of the banking sectors high dividend paying stocks such as HBOS andLloyds TSB in the UK which had consistently paid a dividend in the region of 7% per year. This has left many investors batteredand bruised as they seek to rebuild their high dividend yield portfolios. However despite the banking sectors spectacularcollapse, my long-term investment strategy is still geared towards a model that aims to accumulate stakes in high dividendpaying low risk high probability return stock investments. Therefore where individual stocks are concerned I continue toconcentrate on the more boring big cap sector leaders with strong cash flows, low debt ratios and usually paying a gooddividend yield.
Yes capital growth is limited but so is price volatility, which is especially illustrated by the past 2 years across virtually allsectors excluding banking. The actual growth comes from the fact that dividends can be expected to be INCREASED year onyear, this coupled with the second half of the strategy which is geared towards REINVESTING dividends back into thecompanies results in growth of ones holding over time, even if the stock price underperforms against the general stock marketor sector indices.
The inflation mega-trend implies that the focus of investors should be towards real assets which favours the likes of thecommodities and energy sectors that are more likely to grow due to price increases and emerging markets demand for scarceresources.
So putting all things together one has a low risk portfolio diversified across several sectors geared towards inflation proofinglong-term growth and dividend income reinvestment strategy.
The Inflation Mega-Trend Page 93
http://www.marketoracle.co.uk © 2010 Copyright Nadeem Walayat and Market Oracle Ltd
In Summary the strategy is -
Select Medium to Large Caps, Focus on Sector leadersHigh Dividend YieldsStrong and Consistent Cash flowLow Market Cap to Net Asset Values.High and consistent Return on EquitySizeable cash reserves, strong balance sheetsLow Debt Ratios
Investors can further reduce the risk posed by individual stocks by selecting mega-trend sector ETF's
Check Your ETF's and ETC's Before You Invest
Whilst ETF's and ETC's potentially give an excellent opportunity to spread ones risk across a sector rather than investing in 1or 2 stocks within a sector, however as my earlier analysis of natural gas and UNG pointed out, after having identified a sector,market or commodity to invest in, one needs to check the performance of the various ETF's and ETC's to ensure that you areNOT going to be short changed due to the way they are constructed. I.e. my analysis has shown that GLD and SLV are goodETF's that do closely track the underlying commodities whereas my research indicates that many ETF's and ETC's do NOTtrack the underlying securities closely (especially commodities) and consistently underperform.
The easiest way to check if you do not have a comparison tool is to eyeball a 5 year chart of the underlying market and theETF and write down the highs and lows, work out the % movements by dividing the high against the preceding low and thenyou will see to what degree the market tends to underperform.
Again, CHECK BEFORE YOU INVEST! Also steer clear of ANY leveraged ETF or ETC.
Monitor Your Portfolios
There are two fundamental parts of investing - a. Entry and b Exit. Whilst the majority of investors spend most of the timefocused on the process of stock selection and entry, how many actually take the time to monitor their investments or if notmonitor enter conditional exit orders.
The key to long-term successful investing IS in having an exit mechanism for a stock, commodity or ETF. Without an exitmechanism then bull market profits will inevitable be wiped out by bear market losses.
The most simplest mechanism for an exit strategy is to seek to update a SELL order with your broker every month at 20% fromthe high on the price chart. In today's internet trading world such SELL STOP order facilities are routine.
A slightly more intensive mechanism is to eyeball on the price chart a significant support level under which the price shouldNOT fall for you to be right in your investment decision.
Once SELL STOP orders are placed then you should seek to monitor your portfolio AT LEAST once a month, if a SELL STOPis hit then you need to take the time to re-evaluate your point of view on your decision making process for entering into theposition.
Self Select ISA's
Self select ISA's are part of the UK annual tax free ISA allowance of £7,100 which comprises two components, the Cash ISAand the Shares ISA, which for the current tax year for most people is £3,600 in each part, rising to £5,100 each from 6th April2010 (total £10,200).
Self select ISA's as the name suggests allow investors to select their own stocks and bonds i.e. they are basically ordinaryshare dealing accounts encased in an ISA wrapper.
All capital and income gains accrued within a self select ISA are tax free (dividends are still taxed at 10% at source).
For those that want to invest more than the component part i.e. £3,600 then if you do not open a cash ISA you can utilise the
The Inflation Mega-Trend Page 94
http://www.marketoracle.co.uk © 2010 Copyright Nadeem Walayat and Market Oracle Ltd
full annual allowance of £7,200 towards a shares self select ISA.
Virtually all self select ISA providers charge a small annual fee, usually a fixed amount in the range of £30 - £50 on top ofdealing costs.
Healthcare Sector
Japan is leading the way for the West towards an increasingly elderly population which sows the seeds of below trend growthand ever higher healthcare costs. However it is not all gloom and doom, as many western countries such as the U.S. and UKare easily able to import bright, young labour from abroad from the large population pools of the emerging markets as well asattracting populations from emerging european countries which should offset the demographic consequences that have beenhitting Japan's economy for at least a decade.
government's of Both the UK and U.S. have recognised the need for increased healthcare spending demanded by theirrespective ageing populations as the baby boomers increasingly enter into retirement, demanding greater healthcare provisionand have thus embarked on initiatives which ensure that the healthcare sector will continue to expand as a % of the economy.For instance the NHS in the UK as a consequence of the Labour government's tripling of the healthcare budget over the past10 years now stands at approx 9.5% of GDP which is destined to increase to 12% of GDP over the next 5 years.
Meanwhile the United States is engaged in the process of bringing universal health care coverage to all of its citizens asPresident Obama attempts to implement the first of many steps along the path that will ultimately drive many more extra trillionsof dollars into the U.S. healthcare sector that already stands at 17% of GDP.
Whilst the focus is on the west's ageing populations, however it should not to forgotten that an increasingly prosperousemerging markets middle class will increasingly pay for a developed world quality of health care thus a lot of demand is going toflow from the emerging markets.
Therefore the healthcare sector despite some discounting of future expansion and the strong rally off the bear market lows, stillpresents an excellent long-term investment mega-trend as healthcare spending can only go up regardless of what happens tothe wider economy therefore I expect the healthcare sector to outperform other sectors over the coming decade.
Clearly the safest exposure to the healthcare sector is via the large drug companies such as Pfizer and Merc in the U.S. orGlaxo in the UK.
Furthermore exposure to the related biotech sector is warranted, especially as the big cash rich drug companies seek to takeover the smaller bio-tech companies to replace their ageing and expiring existing drug patents. To reduce risk to the bio-techsector, an ETF or fund is probable the better option such as SPDR Biotech ETF (XBI)
Pfizer- Low Risk- Low GrowthDividend Yield = 4%P/E Ratio = 11 / Forward 8Market Cap = $143bnReturn on Equity = 30
Glaxo - Low Risk- Low GrowthDividend Yield = 5%P/E Ratio = 11.5 / Forward Market Cap = £64bnReturn on Equity = 60
iShares S&P Global Healthcare (IXJ) ETF - Medium Risk - Medium GrowthDividend Yield = 1.2%P/E Ratio = - Market Cap = $550mn
The Inflation Mega-Trend Page 95
http://www.marketoracle.co.uk © 2010 Copyright Nadeem Walayat and Market Oracle Ltd
Metals and Mining Sector
China's thirst for minerals and metals ensures that the big miners that are able to meet China's needs remain the key long-termstocks to be invested in as the inflation mega-trend unfolds. Off all the miners, at the top of the list is BHP Billinton whichmanages to deliver low risk growth potential with a decent dividend payment.
A number of ETF's are available that spread the risk across several miners such as the SPDR S&P Metals & Mining (XME) thatoffers a yield of 1.1%.
BHP Billiton - Low Risk - Medium GrowthDividend Yield = 2.3%P/E Ratio = 23 / Forward 17Market Cap = $205 billionReturn on Equity = 21
Vale - Medium Risk - Medium GrowthDividend Yield = 1.7%P/E Ratio = 26 / Forward 19Market Cap = $142 billionReturn on Equity = 8
RIO Tinto - Medium Risk- Medium GrowthDividend Yield = -P/E Ratio = 20 / Forward 17Market Cap = $51 billionReturn on Equity = 16
Oil & Gas SectorThe oil, gas and energy sector are expected to be one of the main beneficiaries of inflation mega-trend as energy pricesconsistently rise to new highs over the coming years i.e. crude oil will at some point over the next decade pass $200.
The dominant UK global oil players are BP and Shell, which despite the rally off of March lows are trading relatively cheaply inprice earnings terms, especially if the crude oil mega-trend continues to manifest itself towards a price north of $150. The bigbonuses for big cap oil stock holders is the high consistent dividend growth payments as long as crude oil stays above $60,which ensures a less volatile and slowly growing share price.
The riskier stocks are smaller caps involved in exploration and services such as Tullow Oil and Cairn Energy.
In my view the oil majors present a solid long-term investment i.e. sizeable increasing dividend income plus some capitalgrowth potential, yes their share price won't fly to the moon, but nor are you likely to wake up to a total wipeout.
Where Natural Gas is concerned in the UK, the gas suppliers have near monopoly powers with little competition that isreflected in the high prices charged to domestic customers despite low natural gas market prices, this is reflected in the profitsgenerated by the likes of Centrica operating under the brand name British Gas not to be confused with British Gas Plc whichconcentrates on exploration and production. My earlier Natural Gas mega-trend analysis concluded that the UNG ETF is not agood investment vehicle, however after hunting high and low for exposure to the Natural Gas price I settled upon The San JuanRoyalty Trust, a relatively small cap ETF stock quoted on the NYSE that pays a 8% dividend, which gives plenty of time for aninvestor to sit tight waiting for the inevitable spike higher whilst collecting an excellent sized dividend.
Renewable's - Another sector to participate in as a consequence of Peak Oil and the looming energy crisis is renewableenergy, however many of the companies are far too small and speculative to select between them, therefore a fund or ETF isprobably the best way to gain exposure to renewable energy such as the PowerShares Global Wind Energy ETF as one of apossible number.
The Inflation Mega-Trend Page 96
http://www.marketoracle.co.uk © 2010 Copyright Nadeem Walayat and Market Oracle Ltd
Oil Stocks
BP - Low Risk - Low GrowthDividend Yield = 4.8% P/E Ratio = 10 / Forward 7Market Cap = £108 billion Return on Equity = 17
Royal Dutch Shell A - Low Risk - Low GrowthDividend Yield = 6.2%P/E Ratio = 8 / Forward 7.5Market Cap = £62 billionReturn on Equity = 10
Tullow Oil - High Risk - High GrowthDividend Yield = 0.5%P/E Ratio = 40Market Cap = £11 billionReturn on Equity = 12
CAIRN ENERGY - Very High Risk - High GrowthDividend Yield = -P/E Ratio = 26Market Cap = £5 billionReturn on Equity = -5
Natural Gas
British Gas - Low Risk - Low GrowthDividend Yield = 1%P/E Ratio = 18Market Cap = £40 billionReturn on Equity = 16
Centrica - Low Risk - Low GrowthDividend Yield = 4.5%P/E Ratio = 14 / Forward Market Cap = £14 billionReturn on Equity = -35
The San Juan Royalty Trust - Medium Risk - Low GrowthDividend Yield = 8%P/E Ratio = 19Market Cap = $800mln
Technology SectorRecessions come and go but technology marches on ever further and at an increasingly accelerating pace. New technologiesrepresent new investment opportunities. The dot com bubble burst some 10 years ago and still the tek stocks as an overallgroup remain some distance from attaining their former heights, the past 10 years technological developments have enabledmany tek stocks to actually deliver what they were promising 10 years ago in terms of revenues and profits, so the sector ismany years from attaining a bubble state again and therefore primed for accumulating into.
One things for sure the next decade will see new technologies appear that will be just as world changing as the internet hasbeen,and in that respect the world leader in technological innovation remains the United States. Whilst most write about the shiftof power from West to East, which as I have pointed out is as a consequence of the East being so far behind the West in termsof development and GDP per capital, therefore has plenty of room to play catch-up. However new technology such as artificialintelligence could make much of the cheap asian labour obsolete as the new technology allows for the manufacturing base toonce more return to within Western countries.
Whilst we wait for the next Google to emerge, we can still reap mega rewards from the existing Google and the other Teksector leaders.
The Inflation Mega-Trend Page 97
http://www.marketoracle.co.uk © 2010 Copyright Nadeem Walayat and Market Oracle Ltd
There are a number of ETF's available to spread the risk amongst the tek sector giants such as iShares S&P North AmericanTechnology Sector Index ETF (IGM)
Google - Low Risk - Medium Growth
Dividend Yield = 0%P/E Ratio = 26 / Forward 19Market Cap = $169bn Return on Equity = 20
Google is operating what amounts to an internet monopoly, therefore if the internet continues to grow rapidly then so willGoogle's earnings and profits. Neither is Google resting on its laurels with a plethora of new developments seeking to expandGoogle's reach out of the computer monitors and literally into everyone's hands as illustrated by the Nexus One mobile devicewhich is a direct competitor for Apples i-phone, a development which follows on from Google's Android smart phone operatingsystem.
So Google should rank as a key element of any tek stocks portfolio as the safest play is in the strongest stock in any sector.The only lingering issue is that Google has never paid a dividend and nor is it likely to do for some time. However Google is amoney printing machine which suggests investors can expect strong capital gains in the long-run.
Vodafone - Low Risk - Low Growth
Dividend Yield = 6%P/E Ratio = 26 / Forward 10Market Cap =£72bnReturn on Equity = 7
A UK telecom rather than a tek stock. Vodafone is the sector leader in the UK and generates a strong cash flow and sits on acash mountain. The company pays a healthy dividend and unlike other telecom's such as BT is not saddled by crippling debt.
Intel - Low Risk - Low Growth
Dividend Yield = 3%P/E Ratio = 18 / Forward 12Market Cap = $112bnReturn on Equity = 10
When the chips are down the big player has to be Intel which dates back more than 40 years and has shown consistently that itis able to retain leadership of the chip sector for the whole of those four decades through innovation, as highlighted by its mostrecent microprocessor that contains more than 1 billion transistors against the some 2000, of its first microprocessor. Iremember in the early 1990's as the chips were passing the 1 million transistor mark there was much commentary that surelythere must be a limit, now some 20 years on with 1 billion transistors we can only imagine that in 10 years time, Intel chips willhave more than 10 billion transistors with exponentially greater processing power. Therefore another long-term tek stock has tobe Intel that is able to ramp up its prices and dividends inline with rising inflation.
Microsoft - Low Risk - Low Growth
Dividend Yield = 1.7%P/E Ratio = 16 / Forward 13Market Cap = $248bnReturn on Equity = 40
Microsoft is another monopoly giant in the software and operating system sector which ensures continued ramping up ofdividends and earnings and profits and as for Google and Intel, Microsoft will still expected to be the sector leading giant in 10years time, however I do see less growth as it loses some market share to the internet. Include Microsoft in a portfolio ? Yes.
Microsoft is a great long-term buy, especially on any market plunges as it is remains a monster cash flow generator that allowsit pac man style to gobble up the competition.
The Inflation Mega-Trend Page 98
http://www.marketoracle.co.uk © 2010 Copyright Nadeem Walayat and Market Oracle Ltd

Cisco - Low Risk - Low Growth
Dividend Yield = NoneP/E Ratio = 23 / Forward 16Market Cap = $138bnReturn on Equity = 15
Cisco is another company that is sitting on a mountain of cash ($35bn). The company is the back bone of the internet withmore than a 50% share of both the network switching and router markets, that looks set to grow with the internet. Though onthe negative side, Cisco does not pay a dividend despite its huge cash mountain which is necessary for especially low growthcompanies.
Water Utilities SectorWater companies whilst being subject to the whims of the regulator in determining the scope for price rises, they do howeveroperate natural monopolies with little competition that have stable cash-flows which enable then to continue to pay highdividends. Water demand is in a perpetual upward curve whilst the supply of water is becoming more problematic both as aconsequence of climate change and as a consequence of under investment which the regulator is attempting to rectify byforcing the companies to upgrade infrastructure.
Virtually all of the water companies pay high consistently high dividend yields, which therefore represent low risk, low growth,income earning opportunities that can be expected to grow their dividends for most years in real terms i.e. after inflation.
Severn Trent - Low Risk - Low GrowthDividend Yield = 6%P/E Ratio = 11Market Cap = £2.5bnReturn on Equity = 18
United Utilities - Medium Risk - Low GrowthDividend Yield = 6.4%P/E Ratio = 20Market Cap = £3.5bnReturn on Equity = 25
Disclaimer of HoldingsCurrently as of the 31st of Jan 2010, Nadeem Walayat has holdings in the following stocks and ETF's that have beenspecifically mentioned within this ebook - BHP Billinton, RDSA, BP, HSBC, British Gas, Google, DBA, FXI, SLV, United Utilities,Vodafone, Centrica, UK Index linked Bonds.
The Inflation Mega-Trend Page 99
http://www.marketoracle.co.uk © 2010 Copyright Nadeem Walayat and Market Oracle Ltd

UK General Election 2010The anticipated date of an early May 2010 General Election remains, my original projection on the number of seats as per theUK election forecast of June 2009 was for the Conservatives on 343 seats, Labour 225 and Lib Dems on 40 as illustrated bythe below graph.
The continuing low interest rates and economic recovery by the time of the next general election which is already beingreflected in the unemployment data that has surprised many of the academic economists suggests that there could be somenarrowing between the two parties.
Apart from the economy, the major significant factor impacting all three major political parties is the MP expenses scandal thatbroke in May 2009. Which had revealed that more than 50% of MP's to some degree had allegedly submitted fraudulent claimsof which a small number face a possible criminal investigation. This has had the effect of giving support to the lunatic fringe farright parties as voters were turned off from the main parties, therefore suggesting that the 2010 General Election will bedecided on the basis of which party do the voters least despise.
Another factor is the bailout of the banks, which despite being the actions of a Labour government, actually impacts morenegatively on the Conservatives who are seen as the bankster's kindred spirits, therefore the bank bailouts controversy favoursthe Labour Party over the Conservatives.
A minor but still significant factor remains the Iraq war which will again hurt both major political parties and benefit the LibDems due to their stance against the illegal war the case for which was built in totality on a dodgy dossier full of bare faced lies.
The degree to which the election result could narrow between the parties is dependant on the economic data released lateApril, i.e. primarily GDP Data. That 'SHOULD' show an strong recovery in the order of an annualised rate of more than 5%,which will swing some voters in the direction of Labour. That coupled with the fact that the Labour party has an inbuilt bias of atleast 4% for the same number of seats suggests that Labour's position suggests that a large conservative victory is highlyunlikely.
The Inflation Mega-Trend Page 100
http://www.marketoracle.co.uk © 2010 Copyright Nadeem Walayat and Market Oracle Ltd

Similarly the growing prevailing expectations for a hung parliament also seem unlikely as historically hung parliaments havebeen few and far between and the fact is that government's that have been in power for several terms in office are moresusceptible to decisive election losses. Labours long string of disasters starting from the Iraq war and ending with worstdepression since the World War 2, ensures that at the end of the Day Labour will lose the next election, therefore I see littlereason to change my original forecast as of June 2009 that still projects towards a small majority Conservative government inthe order of 343 seats against Labour on 225 seats.
UK Housing Bear Market Election BounceThe UK housing market peaked in August 2007 and entered into a 2 year bear market exactly as forecast at the time (22 Aug2007 - UK Housing Market Crash of 2007 - 2008 and Steps to Protect Your Wealth ), analysis which projected towards a fall inUK house prices from August 2007 to August 2009 of between 15% and 25% that has subsequently came to pass as UKhouse prices bottomed in March 2009 after having fallen by 23% from the 2007 peak.
The UK housing bear market has experienced a strong bounce off of the March 2009 lows and now stands up approx 10% offof the low as a consequence of unprecedented measures as mentioned in this ebook, the Labour government has succeeded intemporarily bringing UK house price falls to a halt and triggering an Election Bounce.
The impact of the inflation mega-trend on the UK housing market will be for UK house price to be supported in nominal terms,however this it does NOT ignite the feel good factor that triggers housing market booms which only follow when house pricesbegin to significantly rise in REAL terms i.e. after inflation.
Whilst the current corrective bounce looks set continue into the middle of 2010 (allowing for a potential one month blip as aconsequence of the bad January weather), this rally is still seen as a correction within a housing bear market that is expected toremain in a depression for many years, before house prices succumb to the effect of the inflation mega-trend and start to rise.
A full in depth analysis and trend projection for the UK housing market will follow in my next ebook due to be completed by theend of April 2010 that aims to analyse the UK housing market from every angle possible so as to arrive at an accurate trendforecast that seeks to replicate the accurate analysis of August 2007. Ensure you are subscribed to my always free newsletterto keep updated on this and regular ongoing analysis.
The Inflation Mega-Trend Page 101
http://www.marketoracle.co.uk © 2010 Copyright Nadeem Walayat and Market Oracle Ltd
About the AuthorBorn in 1968 in the city of Rotherham, UK. Nadeem Walayat became one of the original computer geek's of the late 1970'sbefore the term was applied to computer enthusiasts, owning his first computer a ZX80 in 1980 and soon thereafter set up hisfirst software company in 1983 at the age of 15, writing machine code utilities for the Dragon 32 computer under the companyname of Pegasus Software Services, which he later changed to Walayat Software and Network Systems (Walsoft).
Nadeem went on to discover the financial markets during 1985 and began trading the stock market in 1986, having discoveredthe means to trade commodity futures and more importantly stock indices such as the Dow Jones via spread bet trading in late1986 thus triggering a 25 year trading career which has seen many highs and lows including having beaten the 1987 StockMarket Crash.
Apart from being an active trader, Nadeem continued his professional development and worked as a corporate accountant for15 years until 2008, as well as remaining an active programmer for more than 30 years, hopping from programming language toprogramming language as information technologies have evolved.
By 2005, Nadeem's 20 year trading experience and 30 year programming experience afforded him the opportunity to developthe Market Oracle website with the primary objective of freely sharing his analysis, trading ideas and methodologies, which hasgone on to become one Britain's most popular totally Free quality resource for economic & financial markets analysis anddebate on the internet that continues to constantly evolve towards becoming one of the worlds key quality free financial marketanalysis hubs.
He currently resides in the city of Sheffield with his wife and three children and remains fully focused on trading and sharing ofhis analysis as a firmly private person who shuns the media spot light. His most recent analysis can be viewed atwalayatstreet.com
The Inflation Mega-Trend Page 102
http://www.marketoracle.co.uk © 2010 Copyright Nadeem Walayat and Market Oracle Ltd

Published by Market Oracle Ltd226 Darnall Road Sheffield S9 5AN UK
Copyright © 2010 by Nadeem Walayat and Market Oracle Ltd - All Rights Reserved