Embed Size (px)
Citation preview

The Centre for Global Food and Resources
The IndoDairy Smallholder Household Survey
From Farm-to-Fact
Factsheet 3: Overview of Household and Farm Characteristics
Background
The IndoDairy Smallholder Household Survey (ISHS) collected information from 600 dairy farming households across four districts in West Java. Data collection took place between August and September 2017. The sample included 300
households from the Bandung district, 140 from the Garut district, 80 from the Cianjur district and 80 from Bogor district. The map in Figure 1. shows the location of each of the districts across West Java.
Figure 1. Sample size and district location of farm in the IndoDairy Smallholder Household Survey (ISHS).
2
Sampling
A purposive proportional random sampling method was utilised to select households in order to have a data set that represented the population of dairy farmers in these districts. A list of active farmer members was collected from the dairy cooperatives (KUDs) of each district, and a proportional sampling method was used to determine the number of farmers that were interviewed from each KUD. This ensured that the sample would be representative of smallholder dairy farmers in West Java.
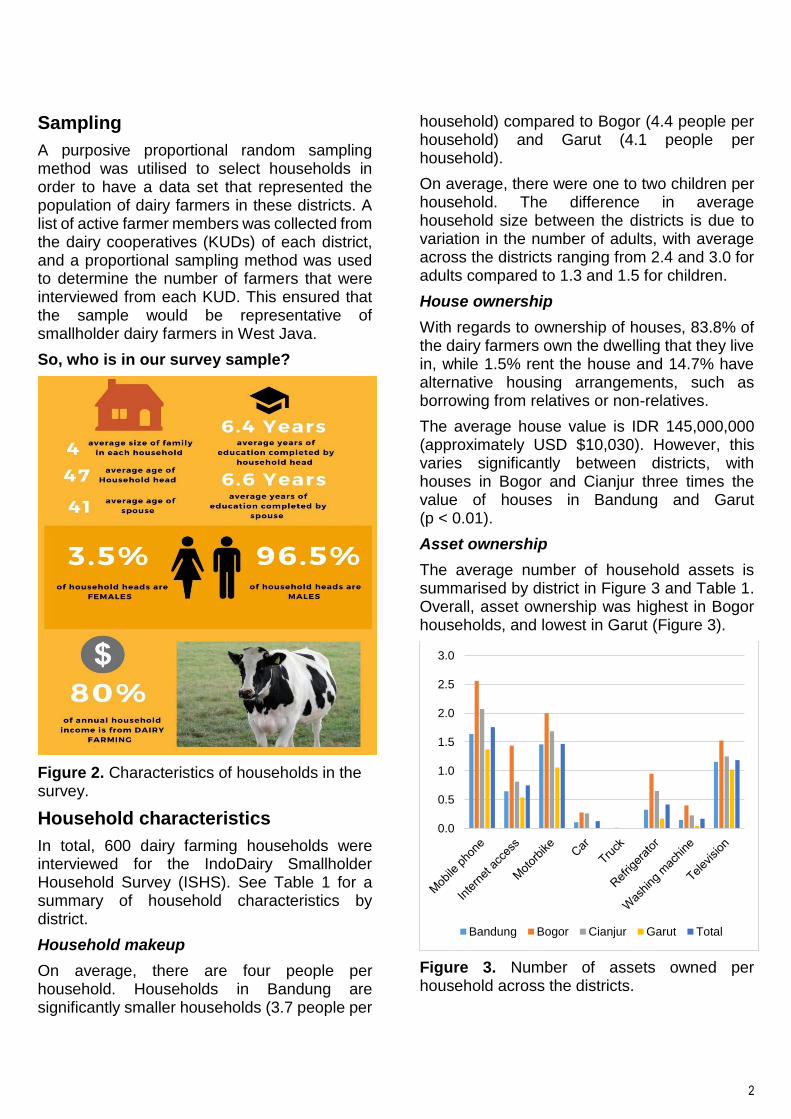
So, who is in our survey sample?
Figure 2. Characteristics of households in the survey.
Household characteristics
In total, 600 dairy farming households were interviewed for the IndoDairy Smallholder Household Survey (ISHS). See Table 1 for a summary of household characteristics by district.
Household makeup
On average, there are four people per household. Households in Bandung are significantly smaller households (3.7 people per
household) compared to Bogor (4.4 people per household) and Garut (4.1 people per household).
On average, there were one to two children per household. The difference in average household size between the districts is due to variation in the number of adults, with average across the districts ranging from 2.4 and 3.0 for adults compared to 1.3 and 1.5 for children.
House ownership
With regards to ownership of houses, 83.8% of the dairy farmers own the dwelling that they live in, while 1.5% rent the house and 14.7% have alternative housing arrangements, such as borrowing from relatives or non-relatives.
The average house value is IDR 145,000,000 (approximately USD $10,030). However, this varies significantly between districts, with houses in Bogor and Cianjur three times the value of houses in Bandung and Garut (p < 0.01).
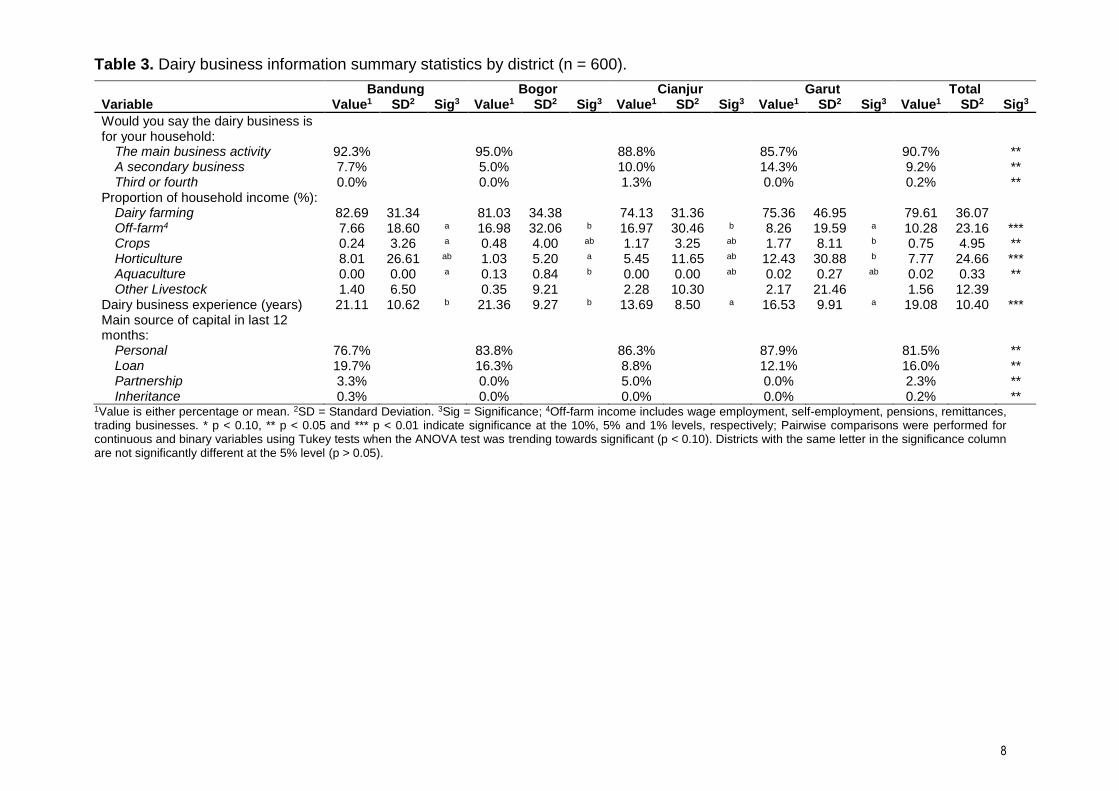
Asset ownership
The average number of household assets is summarised by district in Figure 3 and Table 1. Overall, asset ownership was highest in Bogor households, and lowest in Garut (Figure 3).
Figure 3. Number of assets owned per household across the districts.
0.0
0.5
1.0
1.5
2.0
2.5
3.0
Bandung Bogor Cianjur Garut Total

3
Telecommunication – The average number of mobile phones was 1.8, while the number of types was forms of internet, such as smart phones or laptops, was 0.8 per household.
Transport – On average, households owned 1.5 motorbikes and 0.1 cars. The average number of trucks owned was 0.0.
Household appliances – there were 1.2 televisions, 0.4 refrigerators and 0.2 washing machines owned.
Household decision makers
Overall, approximately 97% of the households’ primary decision makers (PDM) are male. 94% of households have a secondary decision maker (SDM) and nearly all are female (99%).
Age
The average age of the PDM is 47.0 years, while the average age of the SDM is 41.2 years.
Education
Both PDMs and SDMs have completed formal education of up to an average of six years, which is equivalent to elementary school education.
Main occupation
The main income activity, determined by the amount of time spent, for the majority (85%) of the PDMs is dairy farming. Off-farm income activity through wage/salaried employment is the main source of income for only 8% of PDMs. The rate of off-farm employment highest in the district of Garut at 16% as compared to the other three districts. The main activity for the SDMs is unpaid work or unemployed (> 50%), followed by dairy farming (23%).
In addition to dairy farming, households receive, on average 10% of their income from off-farm activities, 8% from horticultural production, 2% from other livestock (e.g. beef cattle, small ruminants or poultry) and 1% from crop production.
Off-farm income includes wage employment, self-employment, pensions, remittances and trading businesses.
Dairy business information
Approximately 91% of households consider dairy farming to be the main business activity. Dairy business information summary statistics are presented in Table 3.
Income sources
Of the households surveyed, dairy-related income, which includes the sale of raw milk, processed milk and dairy cattle, contributes an average of 77% of total household income. The share is highest in the district of Bandung (83%) and lowest in the district of Cianjur (74%) although the shares are not significantly different.
Experience in dairy farming
Dairy farmers on average have 19 years of experience in the dairy business, with farmers in Cianjur having the least amount of experience at 14 years and farmers in Bogor with the highest amount of experience at 21 years.
Sources of capital
During the interviews, respondents were asked about the main source of capital for their dairy business in the past 12 months. 82% of the farmers used personal funds for capital for their dairy business. These personal funds include savings from previous business activities or earnings from other sources of income. The remaining households have either loans (16%), partnerships (2%) or inheritance (0.2%) as their main source of capital.
Farm characteristics
Table 4 summarises farm characteristics by district.
Altitude
GPS coordinates and altitude were recorded for each household. The average altitude of dairy farms across the four districts is 1,280 metres above sea level. Between the districts altitude varied. Farmers in Bogor and Cianjur had the lowest altitude (900 metres) while farmers in Bandung had the highest (1,520 metres).
Milk production

4
Average total farm milk production is 39.0 litres per day. Milk production per cow was 14.9 litres per cow per day. The highest production is observed in Bandung district (15.2 litres) and the lowest in Cianjur district (14.1 litres).
Dairy herd size
Dairy herd size is illustrated in Figure 4. On average, there were 5.6 cattle per farm. Between districts, dairy herd size is highest in Bogor (7.7) and lowest in Garut (3.1); less than half the size of Bogor farms.
The average number of lactating cows per farm is 2.8. Variation between districts follows a similar trend to total herd size, with the highest number in Bogor (3.6) and lowest in Garut (1.8). Despite this, dairy farms across the four districts are, on average, operating small herd sizes.
Total land area
On average, total land area managed by households is 0.49 hectares (ha) with an average of 2-3 plots per household. However, this is significantly higher in Cianjur (1.41ha).
The total managed land dedicated to dairy farming (for grazing or growing forages) is 0.22ha. This is highest in Bogor (0.33ha) and lowest in Bandung (0.17ha).
Figure 4. Average dairy herd size, including number of lactating cows.
Land ownership
The average land owned by households is 0.19ha, which is approximately 39% of total land managed.
Households in Cianjur on average own significantly more land (0.52ha) than Bandung (0.09ha).
Distances
Respondents were asked to indicate the amount of time it takes to reach certain destinations that are critical to the dairy farm businesses.
Dairy co-operatives – On an average, dairy farms are located 8 minutes from their nearest milk collection point and 33 minutes from their dairy co-operative head office.
Free grass – Time to land with freely accessible grass is 22 minutes across the four districts. This is significantly different with households in Cianjur travelling significantly less time (12 minutes), compared to other districts (between 20 and 24 minutes).
Agricultural plots – The average time taken to reach the land plots managed/owned by households is 10 minutes. This would suggest that majority of the land plots are not located immediately next to or behind the house of the farmers.
Veterinary and technical services – It takes on average 26 minutes to travel to the livestock clinic/veterinary doctor and 19 minutes to reach the house of the inseminator. Farmers in Bogor had less than half the travel time to reach these services compared to Garut, which had the longest travel time.
Other key characteristics such as profitability, use of inputs, technology adoption, marketing of dairy products, attitudes, perception of change and aspirations of the dairy farmers will be discussed in other factsheets.
5.8
7.77.3
3.1
5.6
2.8
3.63.3
1.8
2.8
0
1
2
3
4
5
6
7
8
9
Bandung Bogor Cianjur Garut Total
Num
ber
of
cattle
Dairy cattle Lactating cows

5
Appendix to Factsheet 3
The tables included in this Appendix provide summary statistics related to household and farm characteristics for the entire sample grouped by districts. Standard deviations (SD) are included where relevant.
Statistical significance between districts were determined using ANOVA (for binary and continuous variables) and Pearson’s Chi-squared test (for categorical variables). For categorical variables with small observations (n < 5), Fisher’s exact test was used to confirm the Chi-squared test. ANOVA and Chi-squared tests results are shown in the right-hand column, under the Total. Pairwise comparisons were performed for continuous and binary variables using Tukey tests when the ANOVA test was trending towards significant (p < 0.10). Districts with the same letter are not significantly different at the 5% level (p > 0.05).

6
Table 1. Household summary statistics and socio-demographic characteristics by district (n = 600).
Bandung Bogor Cianjur Garut Total Variable Value1 SD2 Sig3 Value1 SD2 Sig3 Value1 SD2 Sig3 Value1 SD2 Sig3 Value1 SD2 Sig3
Number of households 300 80 80 140 600 Number of people per household: 3.72 1.24 a 4.36 1.77 b 4.08 1.59 ab 4.11 1.44 b 3.95 1.44 ***
Adults4 2.40 0.73 a 3.00 1.26 c 2.79 1.04 bc 2.61 0.89 ab 2.58 0.92 ***
Children 1.34 0.95 1.38 1.08 1.31 1.09 1.50 1.12 1.38 1.03 House ownership:
Owned 78.0% 92.5% 83.8% 91.4% 83.8% Rented 2.0% 0.0% 3.8% 0.0% 1.5% Other 20.0% 7.5% 12.5% 8.6% 14.7% ***
House value (n=498): Indonesian Rupiah (in millions) 97.70 96.10 a 293.0 334.0 b 292.0 1230 b 69.70 65.70 a 145.0 478.0 ***
US Dollars (in thousands)5 6.76 6.65 a 20.26 23.1 b 20.19 85.1 b 4.82 4.54 a 10.03 33.1 ***
Number of assets owned: Mobile phone 1.64 1.12 a 2.56 1.80 b 2.08 1.38 b 1.37 0.98 a 1.76 1.29 ***
Internet access 0.64 0.86 a 1.44 1.40 0.81 1.04 a 0.54 0.75 a 0.75 0.99 ***
Motorbike 1.46 0.94 a 2.00 1.30 b 1.69 1.24 ab 1.06 0.90 1.47 1.07 ***
Car 0.11 0.38 a 0.28 0.71 b 0.26 0.63 b 0.01 0.08 a 0.13 0.45 ***
Truck 0.00 0.00 a 0.01 0.11 a 0.00 0.00 a 0.00 0.00 a 0.00 0.04 *
Television 1.15 0.42 ab 1.53 0.86 1.25 0.72 b 1.02 0.33 a 1.19 0.55 ***
Refrigerator 0.32 0.48 0.95 0.65 0.65 0.80 0.17 0.40 0.42 0.59 ***
Washing machine 0.15 0.35 a 0.40 0.52 0.23 0.42 a 0.04 0.20 0.17 0.38 *** 1Value is either percentage or mean; 2SD = Standard Deviation; 3Sig = Significance; 4Adults are ≥ 18 years of age; 5Exchange rate 1 USD = 14,459.50 Indonesian Rupiah on 27 July 2018. * p < 0.10, ** p < 0.05 and *** p < 0.01 indicate significance at the 10%, 5% and 1% levels, respectively; Pairwise comparisons were performed for continuous and binary variables using Tukey tests when the ANOVA test was trending towards significant (p < 0.10). Districts with the same letter in the significance column are not significantly different at the 5% level (p > 0.05).

7
Table 2. Primary and secondary decision maker summary statistics by district.
Bandung Bogor Cianjur Garut Total
Variable Value1 SD2 Sig3 Value1 SD2 Sig3 Value1 SD2 Sig3 Value1 SD2 Sig3 Value1 SD2 Sig3
Primary Decision Maker Information (n = 600)
Gender:
Male 96.3% 97.5% 97.5% 95.7% 96.5%
Female 3.7% 2.5% 2.5% 2.5% 3.5%
Age 45.93 12.00 a 49.06 11.64 a 47.44 11.00 a 48.04 10.81 a 47.04 11.59 *
Education (years) 6.49 2.70 a 6.93 3.81 a 7.10 3.78 a 5.44 2.91 6.38 3.12 ***
Main Occupation: Dairy farming 89.7% 86.3% 80.0% 77.9% 85.2% ***
Farmer or fishermen 2.3% 1.3% 8.8% 5.0% 3.7% ***
Self-employed/employer 1.3% 0.0% 1.3% 0.0% 0.8% ***
Wage/salaried employee 5.0% 8.8% 6.3% 16.4% 8.3% *** Unpaid family/community worker 0.7% 1.3% 1.3% 0.0% 0.7% ***
Unemployed 0.7% 1.3% 1.3% 0.7% 0.8% ***
Secondary Decision Maker Information (n = 563)
Number of households with a ‘Secondary decision maker’ 280 76 74 133 563 Gender:
Male 0.0% 1.0% 0.0% 0.0% 0.0% Female 100% a 98.7% a 100% a 100% a 99.8% *
Age 40.08 10.37 a 42.34 10.25 ab 41.42 9.87 ab 42.89 9.60 b 41.23 10.16 **
Education (years) 6.96 2.39 b 6.03 3.30 a 6.82 3.74 ab 6.16 2.64 a 6.63 2.81 ***
Main Occupation: Dairy farming 25.4% 13.2% 21.9% 25.6% 23.3% **
Farmer or fishermen 1.8% 2.6% 4.1% 5.3% 3.0% **
Self-employed/employer 9.3% 9.2% 19.2% 7.5% 10.1% **
Wage/salaried employee 12.5% 5.3% 9.6% 12.8% 11.2% ** Unpaid family/community worker 36.1% 50.0% 39.7% 37.6% 38.8% **
Unemployed 13.2% 19.7% 5.5% 9.0% 12.1% **
Retired 1.1% 0.0% 0.0% 0.0% 0.5% **
Other 0.7% 0.0% 0.0% 2.3% 0.9% ** 1Value is either percentage or mean; 2SD = Standard Deviation; 3Sig = Significance; * p < 0.10, ** p < 0.05 and *** p < 0.01 indicate significance at the 10%, 5% and 1% levels, respectively; Pairwise comparisons were performed for continuous and binary variables using Tukey tests when the ANOVA test was trending towards significant (p < 0.10). Districts with the same letter in the significance column are not significantly different at the 5% level (p > 0.05).
8
Table 3. Dairy business information summary statistics by district (n = 600).
Bandung Bogor Cianjur Garut Total Variable Value1 SD2 Sig3 Value1 SD2 Sig3 Value1 SD2 Sig3 Value1 SD2 Sig3 Value1 SD2 Sig3
Would you say the dairy business is for your household:
The main business activity 92.3% 95.0% 88.8% 85.7% 90.7% ** A secondary business 7.7% 5.0% 10.0% 14.3% 9.2% ** Third or fourth 0.0% 0.0% 1.3% 0.0% 0.2% **
Proportion of household income (%): Dairy farming 82.69 31.34 81.03 34.38 74.13 31.36 75.36 46.95 79.61 36.07 Off-farm4 7.66 18.60 a 16.98 32.06 b 16.97 30.46 b 8.26 19.59 a 10.28 23.16 *** Crops 0.24 3.26 a 0.48 4.00 ab 1.17 3.25 ab 1.77 8.11 b 0.75 4.95 ** Horticulture 8.01 26.61 ab 1.03 5.20 a 5.45 11.65 ab 12.43 30.88 b 7.77 24.66 *** Aquaculture 0.00 0.00 a 0.13 0.84 b 0.00 0.00 ab 0.02 0.27 ab 0.02 0.33 ** Other Livestock 1.40 6.50 0.35 9.21 2.28 10.30 2.17 21.46 1.56 12.39
Dairy business experience (years) 21.11 10.62 b 21.36 9.27 b 13.69 8.50 a 16.53 9.91 a 19.08 10.40 *** Main source of capital in last 12 months:
Personal 76.7% 83.8% 86.3% 87.9% 81.5% ** Loan 19.7% 16.3% 8.8% 12.1% 16.0% ** Partnership 3.3% 0.0% 5.0% 0.0% 2.3% ** Inheritance 0.3% 0.0% 0.0% 0.0% 0.2% **
1Value is either percentage or mean. 2SD = Standard Deviation. 3Sig = Significance; 4Off-farm income includes wage employment, self-employment, pensions, remittances, trading businesses. * p < 0.10, ** p < 0.05 and *** p < 0.01 indicate significance at the 10%, 5% and 1% levels, respectively; Pairwise comparisons were performed for continuous and binary variables using Tukey tests when the ANOVA test was trending towards significant (p < 0.10). Districts with the same letter in the significance column are not significantly different at the 5% level (p > 0.05).

9
Table 4. Farm summary statistics by district (n = 600).
Bandung Bogor Cianjur Garut Total
Variable Value1 SD2 Sig3 Value1 SD2 Sig3 Value1 SD2 Sig3 Value1 SD2 Sig3 Value1 SD2 Sig3
Altitude (km) 1.52 0.12 0.90 0.23 a 0.89 0.12 a 1.20 0.15 1.28 0.31 ***
Daily milk production:
Total farm (L/day) 41.05 31.03 a 51.05 56.48 a 43.09 40.00 a 25.50 16.50 39.02 35.24 ***
Per lactating cow (L/cow/day) 15.17 4.59 b 14.78 4.75 ab 14.11 4.95 a 15.00 3.89 ab 14.92 4.59 **
No. of livestock (ruminants): Dairy cattle 5.84 4.48 a 7.66 6.89 b 7.30 6.46 ab 3.07 2.03 5.63 5.02 ***
Beef cattle 0.06 0.36 a 0.04 0.34 ab 0.80 5.61 b 0.02 0.25 a 0.15 2.08 **
Buffalo 0.10 0.62 a 0.30 1.34 ab 1.51 11.22 b 0.27 1.22 ab 0.35 4.19 *
Goats/sheep 0.06 0.43 0.14 1.03 0.26 1.95 0.11 0.61 0.11 0.91 No. of dairy cattle managed:
Lactating cows 2.84 2.21 a 3.60 4.02 a 3.28 2.97 a 1.79 1.33 2.75 2.55 ***
Dry cows 0.29 0.66 a 0.59 1.15 b 0.58 1.06 b 0.13 0.41 a 0.33 0.78 ***
Replacement cows 1.10 1.27 a 1.51 1.52 a 1.48 1.83 a 0.44 0.55 1.05 1.33 *** Other dairy cattle (calves and bulls) 1.59 1.80 a 1.99 2.26 a 1.99 2.30 a 0.72 0.91 1.50 1.84 ***
Proportion of milking cows of total herd (%) 51.79 19.47 a 48.66 20.13 a 47.59 17.66 a 62.20 23.11 53.24 20.85 ***
Number of land plots per farm 1.94 1.22 a 2.04 1.05 ab 2.41 1.60 bc 2.64 1.38 c 2.18 1.32 *** Land tenure ownership and usage (ha):
Total managed 0.27 0.52 a 0.42 0.84 a 1.41 4.98 0.49 0.72 a 0.49 1.94 ***
Total owned 0.09 0.37 a 0.17 0.70 ab 0.52 3.20 b 0.25 0.48 ab 0.19 1.25 **
Total used for dairy production4 0.17 0.46 a 0.33 0.55 b 0.30 0.65 ab 0.22 0.43 ab 0.22 0.50 **
Distances in minutes to: Traditional market (n=598) 22.96 14.88 a 23.19 18.71 ab 24.75 12.32 ab 27.46 20.59 b 24.29 16.70 *
Milk collection point (n=592) 9.01 6.57 b 5.49 4.96 a 7.00 6.16 ab 8.26 6.66 b 8.12 6.45 ***
Dairy co-operatives (n=593) 37.19 27.90 b 23.84 25.94 a 32.41 17.67 ab 30.98 22.06 ab 33.35 25.51 ***
Free grass (n=588) 23.21 19.21 a 20.32 21.21 a 12.44 9.60 23.94 19.36 a 21.53 18.87 ***
Your agricultural plots (n=582) 9.24 12.13 11.85 15.80 7.47 9.52 10.07 10.53 9.53 12.03 House of inseminator (n=439) 16.63 14.48 10.39 7.63 23.85 15.54 a 26.73 24.93 a 18.61 17.22 *** Livestock clinic/veterinary doctor (n=381) 28.36 23.46 a 13.00 11.61 28.24 16.15 a 29.90 23.52 a 26.59 22.15 ***
1Value is either percentage or mean; 2SD = Standard Deviation; 3Sig = Significance; 4Land for dairy production includes grazing dairy cattle and growing forages. * p < 0.10, ** p < 0.05 and *** p < 0.01 indicate significance at the 10%, 5% and 1% levels, respectively. Pairwise comparisons were performed for continuous and binary variables using Tukey tests when the ANOVA test was trending towards significant (p < 0.10). Districts with the same letter in the significance column are not significantly different at the 5% level (p > 0.05).