Embed Size (px)
Citation preview

Indonesian Journal of Geology, Vol. 8 No. 3 September 2013: 127-133
127
Extensional Tectonic Regime of Garut Basin based on Magnetotelluric Analysis
Rejim Tektonik Ekstensi di Cekungan Garut
berdasarkan Analisis Magnetotelurik
L. Handayani, Kamtono, and d. d. WardHana
Pusat Penelitian Geoteknologi - LIPIJln. Sangkuriang, Bandung
Corresponding Author: [email protected] is accepted: March 07, 2013, revised: June 14, 2013, approved: August 28, 2013
AbstrAct
Garut Basin are is part of Bandung-Garut Greater Basin (Bandung Zone) characterized by a large basin surrounded by mountain ranges. Active volcanoes had distributed their material as pyroclastic deposits around the outer border of the zone and as lava flow deposit separating the two basins. Bouguer gravity anomaly data had also indicated the presence of several low anomaly closures at about the area of Bandung and Garut Basins that were surrounded by high gravity anomaly zones. Two magnetotelluric surveys were completed to acquire the subsurface model that might explain the tectonic evolution of studied area. The first stage was characterized sby the presence of horst - graben structures that might imply an extensional regime of the area. The next stage of evolutionwas indicated by the horizontal layering correlated to the relative non-active tectonic. In addition, a most recent structure that appeared near the surface might suggest a possible extension force as the current stage.
Keywords: Garut Basin, Bandung zone, extension, magnetotelluric, resistivity, subsurface model
AbstrAk
Cekungan Garut merupakan bagian dari Cekungan Besar Bandung-Garut (Zona Bandung) yang me-miliki karakteristik sebagai cekungan besar yang dikelilingi oleh pegunungan. Produk kegiatan gunung-gunung api aktif seperti endapan piroklastik yang tersebar di tepi Zona Bandung dan deposit aliran lava memisahkan Cekungan Bandung dan Cekungan Garut. Data anomali gayaberat Bouguer juga menunjukkan adanya beberapa zona anomali rendah di sekitar kedua cekungan yang dikelilingi oleh zona anomali tinggi. Dua survey pengukuran magnetotelurik (MT) telah dilakukan di Cekungan Garut untuk memetakan area bawah permukaan yang dapat menjelaskan proses evolusi tektonik daerah penelitian ini. Model tahanan jenis bawah permukaan menunjukan adanya kemungkinan dua tahap evolusi tektonik di daerah ini. Tahap pertama yang ditandai oleh adanya struktur horst dan graben menunjukan adanya rejim ekstensi. Tahap evolusi selanjutnya ditunjukkan oleh perlapisan horizontal yang berkorelasi dengan tektonik yang relatif tidak aktif. Selanjutnya, tampak beberapa struktur di dekat permukaan yang menunjukan adanya gaya ekstensi yang kembali aktif di daerah ini.
Kata kunci: Cekungan Garut, Zona Bandung, ekstensi, magnetotelurik (MT), tahanan jenis, model bawah permukaan

128 Indonesian Journal of Geology, Vol. 8 No. 3 September 2013: 127-133
IntroductIon
Java Island is an island arc produced by the subduction of Indian-Australian Plate beneath Eurasian Plate. General feature of Java Island is the presence of volcanoes chain along the island. However, a closer observation shows that the tec-tonics of Western Java is not entirely similar to the rest of Java Island. The different characteristic is indicated mainly by the spreading of mountainous region. Figure 1 clearly shows the wide area of high elevation at the Western Java area (Southern Moun-tain), which is a remnant of ancient volcanoes (Van Bemellen, 1949). At the rest of the island, in general, small circular high elevations spread sporadically along the middle of the island. This distribution of volcanoes and mountainous region might indicate possible variation in tectonic processes along the Java Island. More detailed tectonic studies at every part of the island are needed to understand the whole evolution history. Therefore, subsurface studies are essential to obtain more information of the tectonic of the region. The subsurface information is ex-pected to give some new insights toward the tectonic
evolution that accountable for current geological and morphological condition. In this research, we initiated the geophysical study in the western Java region, by focusing at Bandung and Garut Basins. Magnetotelluric method was employed due to its ability to explore a wide and deep regional area.
regIonAl geology And Morphology
Bandung and Garut Basins are two large adja-cent depression zones that are actually main parts of the Bandung Zone (Van Bemellen, 1949). These basins are intra-mountain depressions formed naturally between several active volcanoes. The hills and valleys of this area might indicate some strong tectonic forces that formed great folds and faults (Dam, 1994). The tectonic evolution might involve some extensional force that possibly formed pull-apart basins as a product of at least two parallel strike slip faults (Titus et al., 2002; Handayani and Harjono, 2012).
Figure 1 shows the geological interpretation from Landsat Image of the studied area. Textures, colours
Figure 1. Geological interpretation from Landsat Image (Suwijanto, pers. comm.) Insert: Topography Map of Java Island with red box showing the studied area. (Data source: Smith and Sandwell, 1997)
o107 30' E
o 6 4
2' S
o108 12' E106'
-6'
-8'
108' 110' 112' 114'
o 7 2
4' S
LEGENDS
Pyroclastics
Lava Flow/Young Volcanics
Tertiary Sediments
Tertiary-QuaternaryVolcanics
Alluvium/Lake Deposits
Faults
N
0 10 km

Extensional Tectonic Regime of Garut Basin based on Magnetotelluric Analysis (L. Handayani et al.) 129
and pattern analyses of the Landsat Image were used for its effectiveness in lithology and structural identification. As shown in that geological map, the area was divided into five main zones based on their lithologies. A combination of the Garut and Bandung Basins forms a horse-shoe shape with the opening at the west. This horse shoe configuration is outlined by pyroclastic deposits that cover mountain slopes (brown region in Figure 1). These pyroclastic mountainous ranges encircle Bandung and Garut Basins (blue region) of which most volcanoes at this mountainous region are active. At the north, the basin is bordered by Burangrang - Tangkubanparahu - Bukittunggul - Manglayang Volcanoes. At the east side, there are Cikuray - Talagabodas - Galunggung Volcanoes. Papandayan, Malabar, and Cikuray Vol-canoes are three of several volcano chains bordered the southern boundary of the basin. Bandung and Garut Basins are separated by a relatively younger
lava flow deposit (purple region in Figure 1) that covers a volcanic complex of Guntur-Kamojang Volcanoes.
Figure 2 shows a Bouger gravity anomaly map (modified from Untung and Sato, 1978). This gravity anomaly map was obtained from a gravity survey by Untung and Sato (1978) on the main roads with 5 km interval between the stations. Altough the data were widely dispersed, the map is still very useful for regional studies. Here, the gravity anomaly map was compared with the Landsat Image interpretation (Figure 1). The gravity anomaly map indicates the dense contours with high anomaly values that framed both basins (orange region). These high anomaly region ‘frames’ were roughly coincident with the pyroclastic deposits that encircle both Bandung and Garut Basins. Inside those high anomaly ‘frames’, there are several low anomaly depressions, which might be coincident with the location of the basins.
Figure 2. Bouguer gravity anomaly map (modified from Untung and Sato, 1978) and two lines of Magnetotelluric mea-surements.
G41
G35
G15 G14G13 G12
G33
G11 G10G9
G31 G29 G27
G8G7G6
G5G3
G4 G2G1
G25G23
G22 G20 G18 G16
0 10 15 km
5
40
120
o7 00' S
G39 G37
o10
8 0
0' E
o
107
30' E
3020
-0.3
mgal
N

130 Indonesian Journal of Geology, Vol. 8 No. 3 September 2013: 127-133
Most of the Bandung Zone is covered by young volcanic and alluvial deposits except at the western boundary of the area, where there are some Tertiary sedimentary rocks. The oldest volcanic rock that had been identified as Middle Paleocene age was found at Cupunagara, Subang, north of Sunda Volcanic Complex (Kartadinata et al., 2002), where there was also found some younger volcanic rocks were also found from Oligo-Miocene to Quarternary (Indarto et al., 2006). The younger volcanic rocks (mostly Quarternary) are more common and found in most of the area, such as at Tangkubanparahu, Guntur, and Malabar Volcanoes (Bronto and Hartono, 2006; Dam, 1994; Koesoemadinata and Hartono, 1981).
The general pattern from gravity anomaly and lithology above had led us to postulate that there were at least two main periods of tectonic evolu-tions at this area. First, there was a formation of the ‘frame’ or ‘outer ring’, which was characterized by pyroclastic sediments and high gravity anomaly area. The second period was represented by the formation of Guntur volcano complex that separated Bandung and Garut Basins. This area was covered by lava flow deposits. However, its correlation with the gravity anomalies was not clear.
Methods
A subsurface modeling is necessary for further research of the Bandung Zone tectonics. The infor-mation of rock layers beneath the area might give some indications on events during a range of time, as the deeper the information obtained, the farther back in time the process could be identified. In this research, a combination of magnetotelluric (MT) and audio-magnetotelluric (AMT) methods were employed due to its simplicity and cost effective to examine this substantially wide area. Furthermore, its ability to penetrate deeply make MT is a method of our choice for the tectonic study.
Magnetotelluric (MT) method is a geophysi-cal passive measurement of the natural magnetic and electricity contained in the earth, which has frequency between 10000 and 0.00001 Hz. Wide range of frequency allows this method for subsurface investigation from near surface (tens of meters) to thousands of meters beneath the surface. Conduc-tivity of subsurface information is obtained from
the ratio of electric to magnetic fields. Ratio of a high frequency range gives information of shal-low sub-surface, while the lower frequency gives a deeper penetration. The ratio is then represented as MT-apparent resistivity with phase as the function of frequency.
Due to the limited resources, the surveys were only completed within the Garut Basin. Magneto-telluric soundings were conducted along two west - east lines located at the Great Garut Basin (Figure 2). The first deployment worked along the southern line (SL) that consisted of 15 stations spaced about 4 km apart. Then, the second deployment ran through the northern line (NL) that comprised 26 stations with about 2 km distance between each stations. Magnetotelluric data were collected in two stations a day using two units of Magnetotelluric Instruments Phoenix MTU-5a with 2 minutes sampling rate. During the second deployment, the AMT was also measured (Audio-Magnetotelluric) at each station of NL to obtain a near surface information.
result
Data obtained from the surveys are apparent resistivities from each station from the two lines of surveys. Editing processes by MT-Editor were carried out to eliminate noises and to create smooth resistivity curve. Inversion processes were com-pleted with the WinGLink software. Figures 3 and 4 are the resistivity section models for Northern and Southern Lines, respectively.
The Northern Line was extended at about 50 km from Cimonce (Soreang) to Leuwi Goong (Leles). The subsurface layering can be grouped into three groups of resistivity values: low (less than 100 Ohm.m), medium (between 100 and 1000 Ohm.m), and high (more than 1000 Ohm.m). The low resistiv-ity appears on the surface between stations 41 and 40 (west end) and between stations 24 and 22. The medium resistivity exists across the line to the depth of about 2 km, and high resistivity appears to form two basins at the depth of more than 2 km.
The Southern Line has a lower resolution model since the distances between stations are twice of those at the north. Nonetheless, the information generally much the same: there are three groups of resistivity layers. Three small areas near the surface

Extensional Tectonic Regime of Garut Basin based on Magnetotelluric Analysis (L. Handayani et al.) 131
have the lowest resistivity. A layer of medium resis-tivity appears along the line to the depth of about 2 km and fills the basin shapes that were formed by high resistivity layers. One feature that appears on both models is the present of near surface low resistivity areas correspond to the top of the high resistivity parts beneath them.
dIscussIon
Garut Basin is one of the two depressions in Bandung Zone surrounded by a chain of active volcanoes. A preliminary deduction from gravity anomaly and lithology interpretation from Landsat
Image indicated two possible stages of evolution. The first stage was the one related to the older pyro-clastic spreading, and the second stage was the one related to the basin structure and younger volcanic activity. Magnetotelluric measurement was executed in this area to find a better subsurface data to support those account.
In general, both subsurface models (Figures 3 and 4) have indicated the existence of basins. The low resistivity areas (less than 100 Ohm.m or yellow to red areas in the figures) that appear at several places near the surface could be associated with loose sediment (Dobrin and Savit, 1988). The intermediate resistivity rocks (100 to 1000 Ohm.m or green areas in the figures) could be sediment de-
Figure 3. Two dimensional model of resistivity (West-East) of Northern Line section.
Figure 4. Two dimensional model of resistivity (West-East) of Southern Line section.
10 100 1000 10000 Ohm.m
G15 G13 G12 G11 G10 G09 G08 G07G06
G05 G04G03 G02 G01
G14
meter2000
1000
0
-1000
-2000
-30000 5 10 15 20 25 30 35 40 45 km
meter2000
1000
0
-1000
-2000
-30000 4 8 12 16 20 24 28 32 36 40 44 48 km
10 100 1000 10000 Ohm.m
G41G40
G39 G38 G37G36
G35 G34G33G32G31 G30G29G28G27
G26G25 G24G23
G22G22G21
G20 G19 G18 G17G16
132 Indonesian Journal of Geology, Vol. 8 No. 3 September 2013: 127-133
posit and/or felsic igneous rock (Dobrin and Savit, 1988). And high resistivity rocks (more than 1000 ohm.m or blue-purple areas) could be hard sediment deposit or igneous rock (Dobrin and Savit, 1988). This highest resistivity layer (purple) could be older igneous rock or basement.
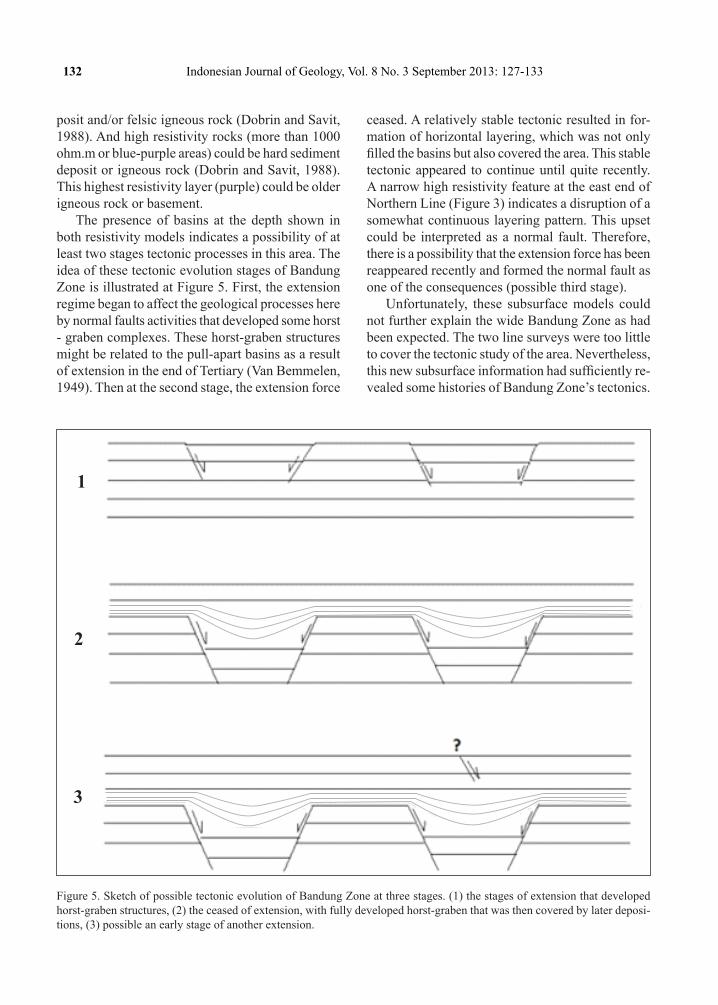
The presence of basins at the depth shown in both resistivity models indicates a possibility of at least two stages tectonic processes in this area. The idea of these tectonic evolution stages of Bandung Zone is illustrated at Figure 5. First, the extension regime began to affect the geological processes here by normal faults activities that developed some horst - graben complexes. These horst-graben structures might be related to the pull-apart basins as a result of extension in the end of Tertiary (Van Bemmelen, 1949). Then at the second stage, the extension force
ceased. A relatively stable tectonic resulted in for-mation of horizontal layering, which was not only filled the basins but also covered the area. This stable tectonic appeared to continue until quite recently. A narrow high resistivity feature at the east end of Northern Line (Figure 3) indicates a disruption of a somewhat continuous layering pattern. This upset could be interpreted as a normal fault. Therefore, there is a possibility that the extension force has been reappeared recently and formed the normal fault as one of the consequences (possible third stage).
Unfortunately, these subsurface models could not further explain the wide Bandung Zone as had been expected. The two line surveys were too little to cover the tectonic study of the area. Nevertheless, this new subsurface information had sufficiently re-vealed some histories of Bandung Zone’s tectonics.
1
2
3
Figure 5. Sketch of possible tectonic evolution of Bandung Zone at three stages. (1) the stages of extension that developed horst-graben structures, (2) the ceased of extension, with fully developed horst-graben that was then covered by later deposi-tions, (3) possible an early stage of another extension.
Extensional Tectonic Regime of Garut Basin based on Magnetotelluric Analysis (L. Handayani et al.) 133
conclusIons
Magnetotelluric surveys across the Garut Basin (in Bandung Zone) confirmed the presence of basins at more than 1 km depth, beneath a thick horizontal layering of sedimentary deposit. The subsurface models might indicate at least two stages of tectonic processes of the region. The first stage was the exten-sion process that developed horst-graben structures. The second stage was horizontal layering that indi-cates a stable regime of tectonic. In addition, there is a possible third stage that might have been occurring recently. The extension regime has appeared to be re-activated as was indicated by a normal fault that reach the surface at one of the models.
Acknowledgements---We would like to gratefully acknowl-edge financial support from Research Center for Geotechnol-ogy LIPI during fiscal year of 2010 and 2011. This work was only possible with assistance from Yayat Sudrajat, Suyatno, Sunardi, Karit L. Gaol, and Djupriono during the fieldwork.
references
Bronto, S. and Hartono, U., 2006. Potensi Sumber Daya Geologi di Daerah Cekungan Bandung dan sekitarnya. Jurnal Geologi Indonesia, 1 (1), p.9-18.
Dam, A.A.C., 1994. The Late Quarternary Evolution of the Bandung Basin, West-Java, Indonesia. Dissertation. Universiteit Amsterdam. The Netherlands.
Dobrin, M.B. and Savit, C. H., 1988. Introduction to Geo-physical Prospecting. McGraw-Hill, Singapore, 867pp.
Handayani, L. and Harjono, H., 2012. Analisa Tektonik Jawa bagian Barat dan Implikasinya Terhadap Bencana Kegempaan di Daerah Bandung dan Sekitarnya. In: An-war et al. (eds), Menyingkap Tabir Fenomena Bencana Seismik di Indonesia: Prespektif Pengurangan Resiko Bencana Gempabumi dan Tsunami. Buku Bunga Rampai Penelitian Kompetitif LIPI Sub Kegiatan Kebencanaan dan Lingkungan, Penerbit Andira dan LIPI, p.41-56.
Indarto, S., Sudarsono, Setiawan, I., and Sumantri, T.A.F., 2006. Model Genesa Mineralisasi Hidrotermal di Daerah Cupunagara, Subang-Jawa Barat. Prosiding “Pelu-ang dan Peran Ilmu Kebumian Dalam Pembangunan Berkelanjutan”. Pusat Penelitian Geoteknologi LIPI, p.231-242.
Kartadinata, M.N., Okuno, M., Nakamura, T., Kobayashi, T., 2002. Eruptive History of Tangkubanparahu Volcano, West Java, Indonesia: A Preliminary Report. Journal of Geography, 111(3), p.404-409.
Koesoemadinata, R.P., and Hartono, J., 1981. Stratigrafi dan Sedimentasi Daerah Bandung. PIT X Ikatan Ahli Geologi Indonesia, Bandung.
Smith, W.H., and Sandwell, D.T., 1997. Global seafloor to-pography from satellite altimery and ship depth sounding. Science, 277. p.1956-1962.
Titus, S.J., Fossen, H., Pedersen, R.B., Vigneresse, J.L., and Tikoff, B., 2002. Pull-apart formation and strike-slip partitioning in an obliquely divergent setting, Leka Ophiolite, Norway. Tectonophysics, 354, p.101-119.
Untung, M. and Sato, Y., 1978. Gravity and Geological Stud-ies in Jawa, Indonesia. Geological Survey of Indonesia & Geological Survey of Japan.
Van Bemmelen, R.W., 1949. The Geology of Indonesia, 1A, General Geology of Indonesia and Adjacent Archipela-goes. Government Printing Office, The Hague.