Embed Size (px)
Citation preview
Living Standards in the UK; PSE UK first summary report Page 1
The Impoverishment of the UK
PSE UK first results: Living Standards David Gordon, Joanna Mack, Stewart Lansley, Gill Main, Shailen Nandy, Demi Patsios, Marco Pomati and the PSE team from the University of Bristol, Heriot-Watt University, National Centre for Social Research, Northern Ireland Statistics & Research Agency, The Open University, Queen's University Belfast, University of Glasgow and University of York
EMBARGOED TO MARCH 28th 2013 All figures are provisional and may be subject to small changes
ESRC Grant RES-060-25-0052
Living Standards in the UK; PSE UK first summary report Page 2
Overview The Poverty and Social Exclusion research project, funded by the Economic and Social Research Council, is the largest ever study of poverty conducted in the UK. The research identifies people falling below what the public agrees is a minimum standard of living and measures poverty and exclusion using a wide range of rigorous methods. The results show that: • Over 30 million people (almost half the population) are suffering to some
degree from financial insecurity. • Almost 18 million in the UK today cannot afford adequate housing conditions. • Roughly 14 million cannot afford one or more essential household goods. • Almost 12 million people are too poor to engage in common social activities
considered necessary by the majority of the population • About 5.5 million adults go without essential clothing. • Around 4 million children and adults are not properly fed by today’s
standards. • Almost 4 million children go without at least two of the things they need. • Around 2.5 million children live in homes that are damp • Around 1.5 million children live in households that cannot afford to heat their
home
Around one third of people in the UK suffer significant difficulties and about a quarter have an unacceptably low standard of living. Specifically, one in three people could not afford to adequately heat their homes last winter and 29% had to turn the heating down or off or only heat part of their homes. A third of adults considered themselves to be genuinely poor ‘all the time’ or ‘sometimes’. More than one in four adults (28%) skimped on their own food last year so that others in their households could eat. A quarter of adults said their incomes were below that needed to avoid poverty and 22% had felt embarrassed by their low income. More than one in five adults had to borrow money last year to pay for their day to day expenses and similar numbers find it a constant struggle to pay their bills or simply cannot keep up with their bill payments. The situation is worse today than it has been for the past thirty years. Independent surveys of poverty using modern scientific methods were first conducted in 1983 and again in 1990, 1999, 2002/03 and 2012. Comparing the surveys shows that, in Britain:
• The number of people falling below the minimum standards of the day has doubled since 1983
• More children lead impoverished and restricted lives today than in 1999
Living Standards in the UK; PSE UK first summary report Page 3
In this report Section 1: The research method Section 2: The necessities chosen by the public Section 3: The numbers of people lacking necessities today Section 4: Trends since 1983, 1990 and 1999 Section 5: Overall multiple deprivation Section 6: Conclusion Section 7: Survey details Section 8: The PSE research team Further details and tables can be found on the PSE UK project website: www.poverty.ac.uk

Living Standards in the UK; PSE UK first summary report Page 4
1: The research method Official definitions of poverty are largely based on the proportion of the population falling below particular levels of income (for example 60% of the median income after adjusting for household size and composition). The Poverty and Social Exclusion (PSE) research, by contrast, measures the numbers of people who fall below what the population as a whole think should be a minimum standard of living. This is the only measure based on looking at both:
• what the majority agree are necessities for life in the UK today, and • people’s actual living standards (rather than just income).
There are three steps involved:
1. An attitudes survey identifies what the population as a whole think are ‘necessities’: things that everyone should be able to afford and which no one should have to go without.
2. A living standards survey finds out who has and who does not have each necessity. It allows a distinction to be drawn between those lacking individual necessities by choice (preference) and those who lack them because they cannot afford them. Only those who cannot afford a necessity are included as being deprived.
3. Deprivation counts identify how many people cannot afford groups of
these necessities and an overall multiple-deprivation count identifies how many cannot afford these necessities to the point that affects their whole way of life. Only items seen as a necessity by the majority of the population are included.
The 1983 Breadline Britain survey pioneered this approach. It was used again in Breadline Britain 1990, PSE Britain 1999, Bare Necessities Northern Ireland 2002/02 and the latest PSE: UK 2012 research.

Living Standards in the UK; PSE UK first summary report Page 5
2: The necessities chosen by the public In the 2012 attitudes survey, respondents were asked which, of a list of 76 items (46 for adults and 30 for children), they thought were necessary and which nobody should have to do without and which items may be desirable but are not necessary. The list of items tested was drawn up both to allow for comparability with past surveys and for changes over time in what the public thinks is important. The 'necessities of life' items were first discussed at length and in depth in 14 'focus group' interviews involving 114 members of the general public from across the UK1 and a range of scientific methods were used to ensure the quality of the survey questions (expert review, cognitive interviews, pilot interviews, etc.). Items and activities thought to be necessary by 50% or more of people are classed as ‘necessities’. Twenty five items and activities for adults and twenty four for children were found to be essential by a majority of people. Top of the list, with the over 90% thinking the item was a necessity, are: For adults
• Heating to warm living areas of the home 96% • Damp-free home 94% • Two meals a day 91%
And for children:
• Warm winter coat 97% • Fresh fruit and vegetables once a day 96% • New, properly fitting shoes 93%
The public also chose items beyond these basic needs. These include consumer items like a washing machine and a telephone and ones that allow for social participation, such as: For adults
• Visiting friends/family in hospital 90% • Celebrations on special occasions 80% • A hobby or leisure activity 70%
And for children
1 For further info see: http://www.poverty.ac.uk/system/files/WP_Analysis_No3_Focus-groups_Fahmy-Pemberton-Sutton.pdf
Living Standards in the UK; PSE UK first summary report Page 6
• A garden or outdoor space to play safely 92% • Children’s clubs or activities 74% • Going on a school trip at least once a term 55%
The public clearly takes a relative rather than an absolute view of poverty and believes that a minimum standard is not simply about subsistence. They back the view that measures of poverty should reflect contemporary standards and should enable people to participate fully in the society in which they live. The 2012 survey uses an identical methodology to the four earlier surveys run in 1983, 1990, 1999 and 2002/03. Taken together, these surveys show that, while there is a core group of items and activities considered necessities across all five surveys, changes happen and some items become necessities while others decline in importance. Some consumer items – such as a washing machines, phones and computers – have become much more widespread over the last thirty years. The proportions of people selecting these as necessities have also risen substantially. Other items which weren’t available to the ordinary consumer thirty years ago – such as mobile phones and internet access – are now close to being considered necessities for everyone. Indeed, two-thirds of UK adults now believe that children need a computer and internet access for homework. The trends also show that what items society thinks of as necessities broadly follow wider improvements (and declines) in living standards. For nearly all items common to both the 1983 and 1990 surveys there were increases in the proportion of people who classed that item as a necessity. Between 1990 and 1999, there was a more varied pattern – with both increases and declines in the numbers of people classing items as necessities. The latest survey suggests that people are less generous than in 1999. In the more constrained economic conditions of 2012, the public have adjusted their views of what constitutes a minimum living standard. This change reflects the wider mood of austerity and pessimism – in a year when many households both were poorer and felt poorer than a few years before. The current long recession and austerity measures have taken their toll and people in the UK now consider many things which in the past were viewed as essential to no longer be necessities of life. For example, in all previous surveys over the past thirty years, being able to afford to give presents to family and friends once a year (such as on birthdays or at Christmas) was considered to be a necessity by the majority of people. In 2012, the majority of people no longer believe this is a necessity. The minimum expectations of the population have fallen. Similarly, being able to spend a small amount of money on yourself or having a one week holiday away from home –

Living Standards in the UK; PSE UK first summary report Page 7
are no longer considered necessities for adults, whereas they were considered to be necessities in the past. Harsh economic times have resulted in reduced minimum expectations of a social life for both adults and children. In 1999, nearly two thirds of the population believed that being able to have friends or family for a meal or a drink once a month was a necessity but this had dropped to under a half by 2012. Similarly, for children, being able to have their friends to visit for tea or a snack once a fortnight was seen as a necessity by the majority in 1999 but it now just falls short of the 50% approval mark. Falls in support also occurred with clothing items for adults - a majority of people no longer considering having a ‘best’ outfit for special occasions or being able to afford to replace worn out clothes with new (not second hand) ones, to be necessities. Replacing worn out furniture is also no longer considered to be a necessity by a majority of people. Some consumer items – such as access to the internet and a computer – did increase their level of support. A number of others items – such as being able to have a roast joint once a week - have also dropped out, as tastes, fashions and habits have changed. The 2012 PSE survey shows (as did the surveys in 1983, 1990 and 1999) that there is general consensus about what constitutes a minimum standard of living in the UK. ‘Consensus’ is used here to mean that there is widespread agreement across all groups in society. Across gender, ethnicity, occupation, income level, geography and age group, there are very similar views on the relative importance of different items and activities. Even among those supporting different political parties, there were very few differences. For all the items and activities considered, there are almost no instances where the majority of one group in society considers a necessity an item which is not also seen as a necessity by all other groups. If the majority of women think something is a necessity then so do the majority of men, older and younger people, Labour and Conservative Party supporters, people living in Scotland, etc. As a society, we generally agree what constitutes a minimum living standard.
3: The numbers lacking necessities today The living standards survey finds out how many fall below the public’s minimum standard of living because of a lack of money. People were asked which necessities they lacked and why. All the percentages and numbers below exclude those who choose not to have a necessity out of personal preference and also, for activities, people who want to take part but do not do so for reasons
Living Standards in the UK; PSE UK first summary report Page 8
other than money (for example, lack of time due to work, caring responsibilities, or poor health). The numbers and percentages below refer to the UK as a whole and include only those who lack necessities because they can’t afford them. Housing and heating The survey found that significant percentages of people and households were going without key aspects of housing and heating – items which virtually everyone thinks are necessities. In the UK today:
• 9% of households (2.3 million) cannot afford to heat the living areas of their home
• 10% of households live in a damp home – that is about 2.7 million households
• 19% of adults (8.5 million) don’t have enough money to keep their home in a decent state of decoration
Overcrowding Children are living in overcrowded conditions with inadequate space for work and play.
• 11% of children over 10 live in households which don’t have enough bedrooms for every child aged 10 or over of a different sex to have their own room – that’s 600,000 children over 10
• 5% of children over 5 have no place to study – that’s 500,000 children over 5
• 5% of children do not have a safe place to play outside – that’s 600,000 children
Looking at the two vital housing necessities, of damp and heating:
• 17% of people (about 11 million) live in inadequate housing, unable to afford either sufficient heating or damp free homes
• 14% of people (9 million) experience one of these problems • 3% of people (about 2 million) experience both these problems
Food There is widespread agreement on what constitutes a minimally acceptable diet. Over 90% of people agree that for children this means: three meals a day; fresh fruit and vegetables every day; and meat, fish or a vegetarian equivalent at least once a day. For adults, over 75% of people agree this means: two meals a day; fresh fruit and vegetables every day; and meat, fish or a vegetarian equivalent every other day.

Living Standards in the UK; PSE UK first summary report Page 9
However, very large numbers of people lack at least one of these items:
• Well over half a million children (4%) live in families who cannot afford to feed them properly
• Over three and a half million adults (8%) cannot afford to eat properly In nearly all of the households where there are children going without one or more of the food items, adults in the household are cutting back on their own food.
• In 41% (100,000) of these households at least one adult ‘sometimes’ skimps on food to ensure others have enough to eat.
• In 52% (200,000) of these households at least one adult ‘often’ skimps on food to ensure others have enough to eat.
In households which cannot afford an adequate diet for their children, 93% have at least one adult who ‘skimps’ on their own food to try to protect the children. Half a million children are not adequately fed in the UK today, not as a result of negligence but due to a lack of money. Clothing The numbers going without basic clothing necessities are up.
• Over 1 million children (9%) go without one or more items of basic clothing such as a warm winter coat, new, properly fitting shoes, some new (not second-hand) clothes and at least four pairs of trousers, leggings, jeans or jogging bottoms
• Over 4 million adults (9%) cannot afford one of, or both of, these two
essential clothing items: a warm, waterproof coat and two pairs of all-weather shoes.
Most people also agree that people need clothes for job interviews. Yet:
• 9 % of adults of working age (3 million), 12% of young people aged 18 to 25 (over 500,000) and 21% of those who are unemployed and looking for work cannot afford appropriate clothes for a job interview.
Looking at all three of the adult clothing necessities (warm coat, two pairs of all-weather shoes, and clothes for a job interview), 13% of adults (over 5.5 million) cannot afford one or more clothing necessity.
Living Standards in the UK; PSE UK first summary report Page 10
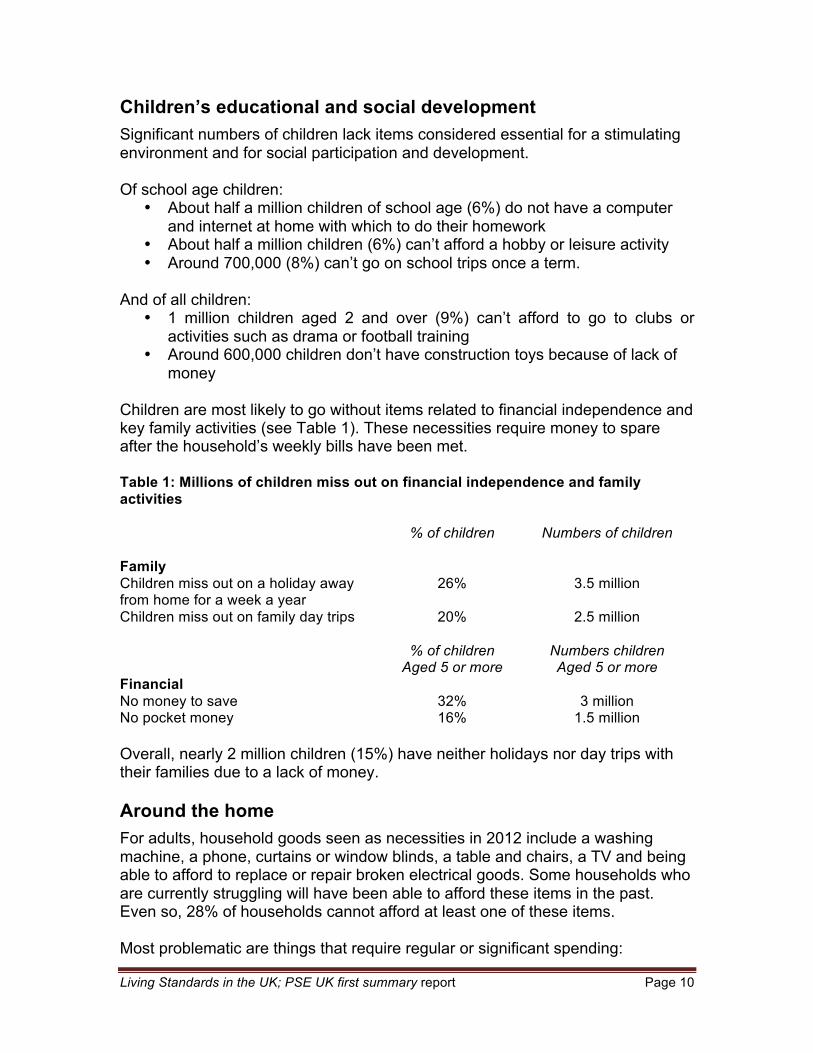
Children’s educational and social development Significant numbers of children lack items considered essential for a stimulating environment and for social participation and development. Of school age children:
• About half a million children of school age (6%) do not have a computer and internet at home with which to do their homework
• About half a million children (6%) can’t afford a hobby or leisure activity • Around 700,000 (8%) can’t go on school trips once a term.
And of all children:
• 1 million children aged 2 and over (9%) can’t afford to go to clubs or activities such as drama or football training
• Around 600,000 children don’t have construction toys because of lack of money
Children are most likely to go without items related to financial independence and key family activities (see Table 1). These necessities require money to spare after the household’s weekly bills have been met. Table 1: Millions of children miss out on financial independence and family activities % of children Numbers of children Family Children miss out on a holiday away from home for a week a year
26%
3.5 million
Children miss out on family day trips 20% 2.5 million
% of children Aged 5 or more
Numbers children Aged 5 or more
Financial No money to save
32%
3 million
No pocket money 16% 1.5 million Overall, nearly 2 million children (15%) have neither holidays nor day trips with their families due to a lack of money. Around the home For adults, household goods seen as necessities in 2012 include a washing machine, a phone, curtains or window blinds, a table and chairs, a TV and being able to afford to replace or repair broken electrical goods. Some households who are currently struggling will have been able to afford these items in the past. Even so, 28% of households cannot afford at least one of these items. Most problematic are things that require regular or significant spending:

Living Standards in the UK; PSE UK first summary report Page 11
• 26% of adults (about 11.5 million) cannot afford to replace or repair broken
electrical goods Financial insecurity The necessities most likely to be out of reach are those requiring either ready cash for emergencies or regular amounts of money for longer term financial planning.
• 33% of adults (16.5 million) can’t pay unexpected costs of £500 • 31% of adults (almost 14 million) cannot afford to save at least £20 each
month for rainy days • 30% of adults of working age (about 11 million) cannot afford to make
regular payments into a pension • 12% of households (about 3 million) cannot afford household insurance
Overall, levels of financial insecurity are now extremely high: almost half of all adults (24 million) cannot afford one of these financial necessities. Significant proportions of the population feel their current incomes are too little to cope:
• 22% of households (almost 6 million) have incomes they consider below that needed to avoid poverty
• 21% of adults (about 10 million) have had to borrow in the last year to pay for day to day needs
This lack of income is having detrimental effects on people’s sense of worth and health:
• 22% (about 10 million) have felt embarrassed due to low income • 15% of disabled people have had their health affected ‘a lot’ or ‘quite a lot’
by lack of money Lack of income also has a very direct effect on people’s dental health:17% of adults (about 7.5 million) can’t afford all recommended dental care.
4. Trends since 1983, 1990 and 1999 The proportions of the population falling below the standards set by society at the time across a range of items and activities are higher today than in 1983, 1990 and 1999. This is true for some of the core, basic items that have been seen to be necessities by large majorities in all the surveys since 1983 as well as for some of the areas where standards and fashions have changed. To enable

Living Standards in the UK; PSE UK first summary report Page 12
comparisons with earlier years, the figures and percentage below are for Britain (not the UK) and comparable methods have been used so as to measure the changes in living conditions over the past 30 years. Housing conditions have deteriorated A damp-free home and heating to keep living areas warm have been the top two necessities in all four surveys. However, more households today lack these basics than in 1983 or in the 1990s. The proportions going without both first fell and then rose (see Table 2). So, while things improved in the 1990s, there has been a sharp decline since. Table 2: How many households can’t afford a warm, damp-free home? Housing standards 1983 1990 1999 2012 Heating to keep home adequately warm 5% 3% 3% 9% Damp-free home 6% 2% 7% 10% The sharp rise in fuel costs since the early 2000s partly explains why heating is harder to afford. The costs of fuel (and light) have more than doubled since 2000 (up by 234%). The overall rise in consumer prices has been much lower, at 134%. Being able to keep your home in a decent state of decoration is also seen as a necessity and the numbers unable to afford to do this are also up from 15% of adults in the 1990s to 19% today.
Taking all three housing necessities of heating, a damp free home and adequate decoration (all seen as necessities in both 1999 and 2012):
• Around 13 million people (aged 16 and over) in Britain today cannot afford adequate housing conditions compared to around 9.5 million in 1999 and 10 million in 1990. That’s an increase of over 3 million people living in inadequate housing on this basis since 1999.
In addition, overcrowding due to poverty is back to the levels found in 1983. In 2012, 9% of households (11% of children) couldn’t afford enough bedrooms for every child aged 10 or over of a different sex to have their own bedroom. This is roughly the same percentage as in 1983 (10%) having dropped during the 1990s to 3% in 1999. Housing benefit changes due to be implemented in April 2013 (the ‘bedroom tax’) are likely to make this dismal situation even worse.
Living Standards in the UK; PSE UK first summary report Page 13
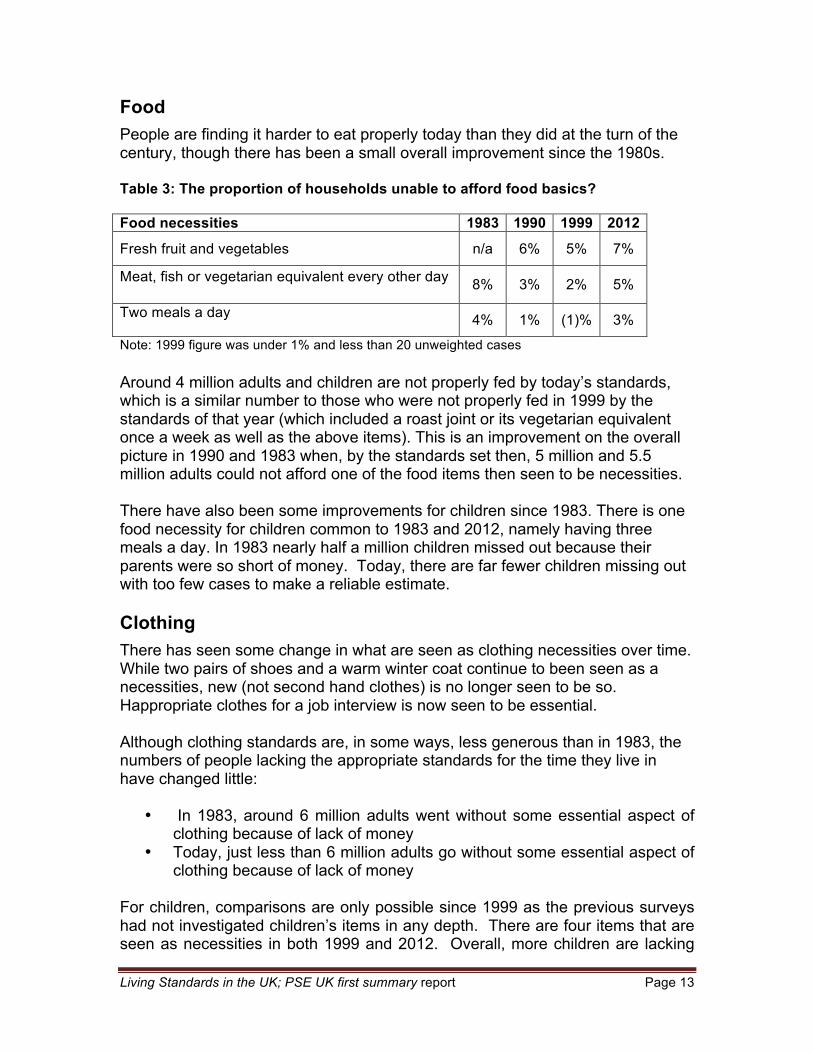
Food People are finding it harder to eat properly today than they did at the turn of the century, though there has been a small overall improvement since the 1980s. Table 3: The proportion of households unable to afford food basics? Food necessities 1983 1990 1999 2012
Fresh fruit and vegetables n/a 6% 5% 7%
Meat, fish or vegetarian equivalent every other day 8% 3% 2% 5%
Two meals a day 4% 1% (1)% 3%
Note: 1999 figure was under 1% and less than 20 unweighted cases Around 4 million adults and children are not properly fed by today’s standards, which is a similar number to those who were not properly fed in 1999 by the standards of that year (which included a roast joint or its vegetarian equivalent once a week as well as the above items). This is an improvement on the overall picture in 1990 and 1983 when, by the standards set then, 5 million and 5.5 million adults could not afford one of the food items then seen to be necessities. There have also been some improvements for children since 1983. There is one food necessity for children common to 1983 and 2012, namely having three meals a day. In 1983 nearly half a million children missed out because their parents were so short of money. Today, there are far fewer children missing out with too few cases to make a reliable estimate. Clothing There has seen some change in what are seen as clothing necessities over time. While two pairs of shoes and a warm winter coat continue to been seen as a necessities, new (not second hand clothes) is no longer seen to be so. Happropriate clothes for a job interview is now seen to be essential. Although clothing standards are, in some ways, less generous than in 1983, the numbers of people lacking the appropriate standards for the time they live in have changed little:
• In 1983, around 6 million adults went without some essential aspect of clothing because of lack of money
• Today, just less than 6 million adults go without some essential aspect of clothing because of lack of money
For children, comparisons are only possible since 1999 as the previous surveys had not investigated children’s items in any depth. There are four items that are seen as necessities in both 1999 and 2012. Overall, more children are lacking
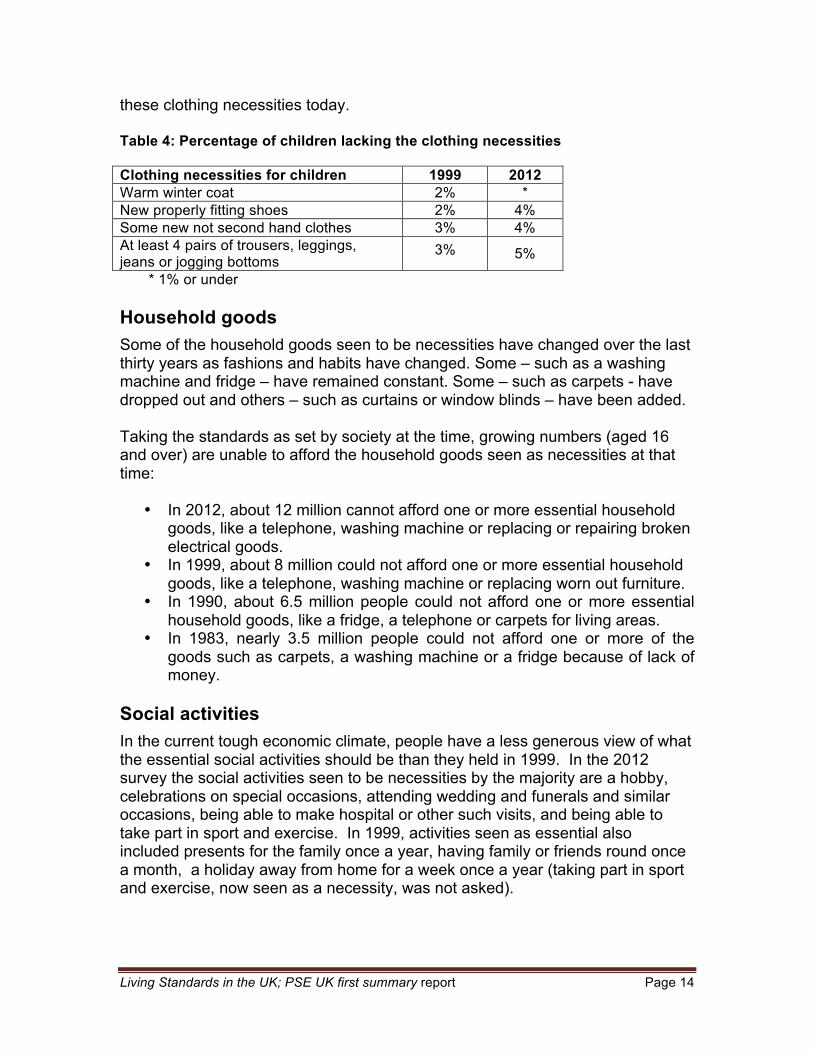
Living Standards in the UK; PSE UK first summary report Page 14
these clothing necessities today. Table 4: Percentage of children lacking the clothing necessities Clothing necessities for children 1999 2012 Warm winter coat 2% * New properly fitting shoes 2% 4% Some new not second hand clothes 3% 4% At least 4 pairs of trousers, leggings, jeans or jogging bottoms
3% 5%
* 1% or under Household goods Some of the household goods seen to be necessities have changed over the last thirty years as fashions and habits have changed. Some – such as a washing machine and fridge – have remained constant. Some – such as carpets - have dropped out and others – such as curtains or window blinds – have been added. Taking the standards as set by society at the time, growing numbers (aged 16 and over) are unable to afford the household goods seen as necessities at that time:
• In 2012, about 12 million cannot afford one or more essential household goods, like a telephone, washing machine or replacing or repairing broken electrical goods.
• In 1999, about 8 million could not afford one or more essential household goods, like a telephone, washing machine or replacing worn out furniture.
• In 1990, about 6.5 million people could not afford one or more essential household goods, like a fridge, a telephone or carpets for living areas.
• In 1983, nearly 3.5 million people could not afford one or more of the goods such as carpets, a washing machine or a fridge because of lack of money.
Social activities In the current tough economic climate, people have a less generous view of what the essential social activities should be than they held in 1999. In the 2012 survey the social activities seen to be necessities by the majority are a hobby, celebrations on special occasions, attending wedding and funerals and similar occasions, being able to make hospital or other such visits, and being able to take part in sport and exercise. In 1999, activities seen as essential also included presents for the family once a year, having family or friends round once a month, a holiday away from home for a week once a year (taking part in sport and exercise, now seen as a necessity, was not asked).
Living Standards in the UK; PSE UK first summary report Page 15
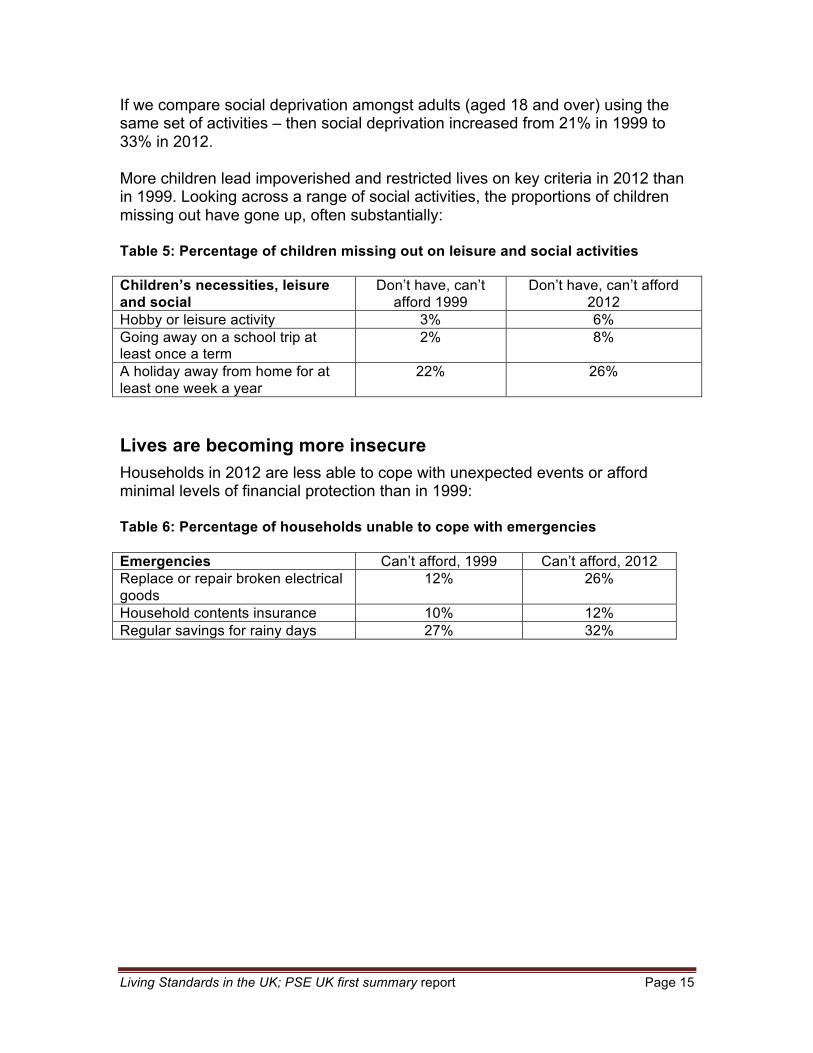
If we compare social deprivation amongst adults (aged 18 and over) using the same set of activities – then social deprivation increased from 21% in 1999 to 33% in 2012. More children lead impoverished and restricted lives on key criteria in 2012 than in 1999. Looking across a range of social activities, the proportions of children missing out have gone up, often substantially: Table 5: Percentage of children missing out on leisure and social activities Children’s necessities, leisure and social
Don’t have, can’t afford 1999
Don’t have, can’t afford 2012
Hobby or leisure activity 3% 6% Going away on a school trip at least once a term
2% 8%
A holiday away from home for at least one week a year
22% 26%
Lives are becoming more insecure Households in 2012 are less able to cope with unexpected events or afford minimal levels of financial protection than in 1999: Table 6: Percentage of households unable to cope with emergencies Emergencies Can’t afford, 1999 Can’t afford, 2012 Replace or repair broken electrical goods
12% 26%
Household contents insurance 10% 12% Regular savings for rainy days 27% 32%
Living Standards in the UK; PSE UK first summary report Page 16
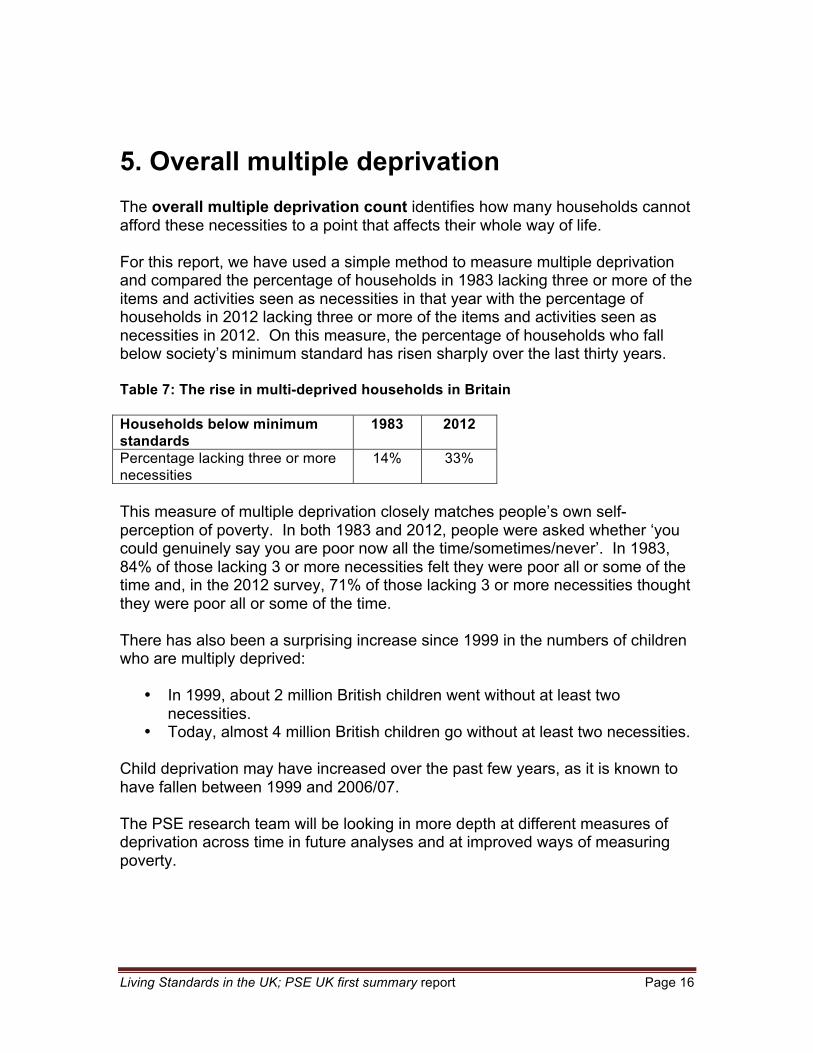
5. Overall multiple deprivation The overall multiple deprivation count identifies how many households cannot afford these necessities to a point that affects their whole way of life. For this report, we have used a simple method to measure multiple deprivation and compared the percentage of households in 1983 lacking three or more of the items and activities seen as necessities in that year with the percentage of households in 2012 lacking three or more of the items and activities seen as necessities in 2012. On this measure, the percentage of households who fall below society’s minimum standard has risen sharply over the last thirty years. Table 7: The rise in multi-deprived households in Britain Households below minimum standards
1983 2012
Percentage lacking three or more necessities
14% 33%
This measure of multiple deprivation closely matches people’s own self-perception of poverty. In both 1983 and 2012, people were asked whether ‘you could genuinely say you are poor now all the time/sometimes/never’. In 1983, 84% of those lacking 3 or more necessities felt they were poor all or some of the time and, in the 2012 survey, 71% of those lacking 3 or more necessities thought they were poor all or some of the time. There has also been a surprising increase since 1999 in the numbers of children who are multiply deprived:
• In 1999, about 2 million British children went without at least two necessities.
• Today, almost 4 million British children go without at least two necessities. Child deprivation may have increased over the past few years, as it is known to have fallen between 1999 and 2006/07. The PSE research team will be looking in more depth at different measures of deprivation across time in future analyses and at improved ways of measuring poverty.

Living Standards in the UK; PSE UK first summary report Page 17
6. Conclusion Millions of people in the United Kingdom today are living below the standards set by society. Despite the fact that the UK is a much wealthier country, levels of deprivation are going back to the levels found thirty years ago. Long term trends in inequality Underlying these trends is a growing income divide. Over the last thirty years, Britain has become increasingly unequal. While the size of the economy has doubled since 1983, the fruits of growth have been increasingly captured by those on the highest incomes, leaving those on middle and low incomes further and further behind. Households dependent on low wages have increasingly found their pay packets squeezed and their jobs insecure. Since 2000, incomes have risen even more slowly. As a result, increasing numbers of people have found that their living standards have not kept up with the changing standards of society. The impact of the economic crisis Although real incomes at the bottom initially rose during the crisis of 2008-9, they have fallen sharply since 2009/10. This is largely because wage increases have lagged behind inflation. As a result, low-income households are on average (after allowing for inflation) no better off today than they were in 1999 (see IFS Commentary 124). The UK’s faltering economic prospects have also had an impact on the public’s view of minimum standards. The views expressed in 2012 are less generous than those in 1999. Even so, the numbers of people lacking a range of items is higher today than in 1999. The impact of austerity has hit those on low incomes hard. These results reflect the situation before the majority of proposed benefit changes come into place and before benefits payments are revised to increase at less than the level of inflation. The impacts of the current government austerity measures are set to hit hard those whose standard of living is already well below that seen by a majority to be minimal.

Living Standards in the UK; PSE UK first summary report Page 18
7. Survey details The Poverty and Social Exclusion study is based on two surveys conducted in 2012. Necessities of Life survey The ‘Necessities of Life’ survey was carried out between May and June 2012 and is based on a sample of 1,447 adults aged 16 or over in the Britain and 1,015 in Northern Ireland. The survey was carried out by the National Centre for Social Research (NatCen) in Britain and by the Northern Ireland Statistics and Research Agency (NISRA) in Northern Ireland as part of their Omnibus surveys. The full Necessities of life questionnaire can be downloaded from the PSE website at www.poverty.ac.uk. Living standards survey The Living Standards survey was carried out between March and December 2012 by the National Centre for Social Research (NatCen) in Britain and by the Northern Ireland Statistics and Research Agency (NISRA) in Northern Ireland. The survey re-interviewed respondents to the 2010/11 Family Resources Survey (FRS) who said they could be contacted again. Every adult living at each address was interviewed. The sampling frame was designed so as to give a minimum sample in Britain of 4,220 households (including 1,000 households in Scotland overall and an additional 220 households in rural Scotland) and a minimum sample in Northern Ireland of 1,000 households. The final sample size achieved was 5,193 households (4,205 in Britain and 988 in Northern Ireland) in which 12,097 people were living (9,786 in Britain and 2,311 in Northern Ireland). The full Living Standards questionnaire can be downloaded from the PSE website: www.poverty.ac.uk. 8. The research team The PSE: UK research was financed by the Economic and Social Research Council. It is a major collaboration between the University of Bristol, Heriot-Watt University, The Open University, Queen's University Belfast, University of Glasgow and the University of York working with the National Centre for Social Research and the Northern Ireland Statistics and Research Agency. Further details of the PSE: UK 2012 research including the members of the project team and working papers on the development of the survey and the questionnaires can be found on the PSE website: www.poverty.ac.uk.
ESRC Grant RES-060-25-000052