Embed Size (px)
Citation preview
Innocenti Working Papers
No. 84
CHILDREN IN BULGARIA:
GROWING IMPOVERISHMENT
AND UNEQUAL OPPORTUNITIES
Roumiana Gantcheva and Alexandre Kolev

Innocenti Working Paper
No.84
Children in Bulgaria: Growing Impoverishmentand Unequal Opportunities
ROUMIANA GANTCHEVA* AND ALEXANDRE KOLEV**
January 2001
*UNICEF Innocenti Research Centre, Florence.**The World Bank, Washington D.C.
AcknowledgementsThe authors owe special thanks to John Micklewright, Head of Research atIRC, for his numerous comments and suggestions aimed at improvement andfor the editing of the paper. Colleagues from the National Statistical Institute,Sofia must also be thanked for the provision of data. Responsibility for thedata use and interpretation rests however with the authors.
The opinions expressed in this publication are those of the authors and do notnecessarily reflect the policies or views of UNICEF.
Copyright UNICEF, 2001
Cover design: Miller, Craig and Cocking, Oxfordshire – UK
Printed on recycled paper by: Tipografia Giuntina, Florence, Italy
ISSN: 1014-7837
Readers citing this document are asked to use the following form of words:
Gantcheva, Roumiana and Alexandre Kolev (2001), ‘Children in Bulgaria –Growing Impoverishment and Unequal Opportunities’. Innocenti WorkingPaper No. 84. Florence: UNICEF Innocenti Research Centre.
UNICEF INNOCENTI RESEARCH CENTRE
The UNICEF Innocenti Research Centre in Florence, Italy, wasestablished in 1988 to strengthen the research capability of the UnitedNations Children's Fund (UNICEF) and to support its advocacy forchildren worldwide. The Centre (formally known as the InternationalChild Development Centre) helps to identify and research current andfuture areas of UNICEF's work. Its prime objectives are to improveinternational understanding of issues relating to children's rights and tohelp facilitate the full implementation of the United Nations Conventionon the Rights of the Child in both industrialized and developingcountries.
The Centre's publications are contributions to a global debate onchild rights issues and include a wide range of opinions. For thatreason, the Centre may produce publications that do not necessarilyreflect UNICEF policies or approaches on some topics. The viewsexpressed are those of the authors and are published by the Centre inorder to stimulate further dialogue on child rights.
The Centre collaborates with its host institution in Florence, theIstituto degli Innocenti, in selected areas of work. Core funding for theCentre is provided by the Government of Italy, while financial supportfor specific projects is also provided by other governments,international institutions and private sources, including UNICEFNational Committees.
The opinions expressed are those of the authors and do notnecessarily reflect the policies or views of UNICEF.

AbstractThe social and economic changes in Bulgaria since the beginning of transitionnaturally raise concern about their impact on child well-being. To someextent, the problems of child rights and child development have started to beinvestigated in a number of recent studies. However, most of them focus onspecific groups of children and do not address the overall deterioration of thesocial environment that may have disproportionately affected all children inthe country. The paper investigates the changes that occurred over the lastdecade in three dimensions of child welfare recognised as fundamental childrights – economic well-being, health and education. Then it concentrates onparticularly vulnerable groups of children – those born of teenage and singlemothers and those living in institutions. The data show that the human cost ofeconomic transition has been high and children have been among the mostvulnerable groups of the society.
Key words: child welfare, poverty, health, education, children in institutions,Bulgaria, transition.
1. IntroductionThe past ten years in Bulgaria have brought enormous social and economicchanges. in the late 1980s the country started a difficult period of transitionfrom totalitarian and command driven economy to democracy and marketoriented relations. Gross domestic product (GDP) fell continuously during thefirst years of the transition period. The cumulative decline by 1993 reached27 per cent – the deepest fall in GDP registered among Central and EasternEuropean (CEE) countries apart from Albania and some of the countries fromthe former Yugoslavia.1 Although output grew in 1994 and 1995, it was notbased on fundamental structural changes in the economy and could not besustained. Contrary to other CEE countries, with the notable exception ofRomania, the situation in Bulgaria continued to deteriorate and in the late1990s, the level of production was still far below its 1989 level.
In the context of the deep economic crisis there was a sharp fall in livingstandards. Real household incomes declined dramatically, by 76 per cent over1989-97. The reversed trend from 1998 was still far from enough to offset thehuge drop over the decade. The general decrease in incomes wasaccompanied by increasing income inequality. In the late 1990s the Ginicoefficient in Bulgaria was the highest among all CEE and Baltic countries.
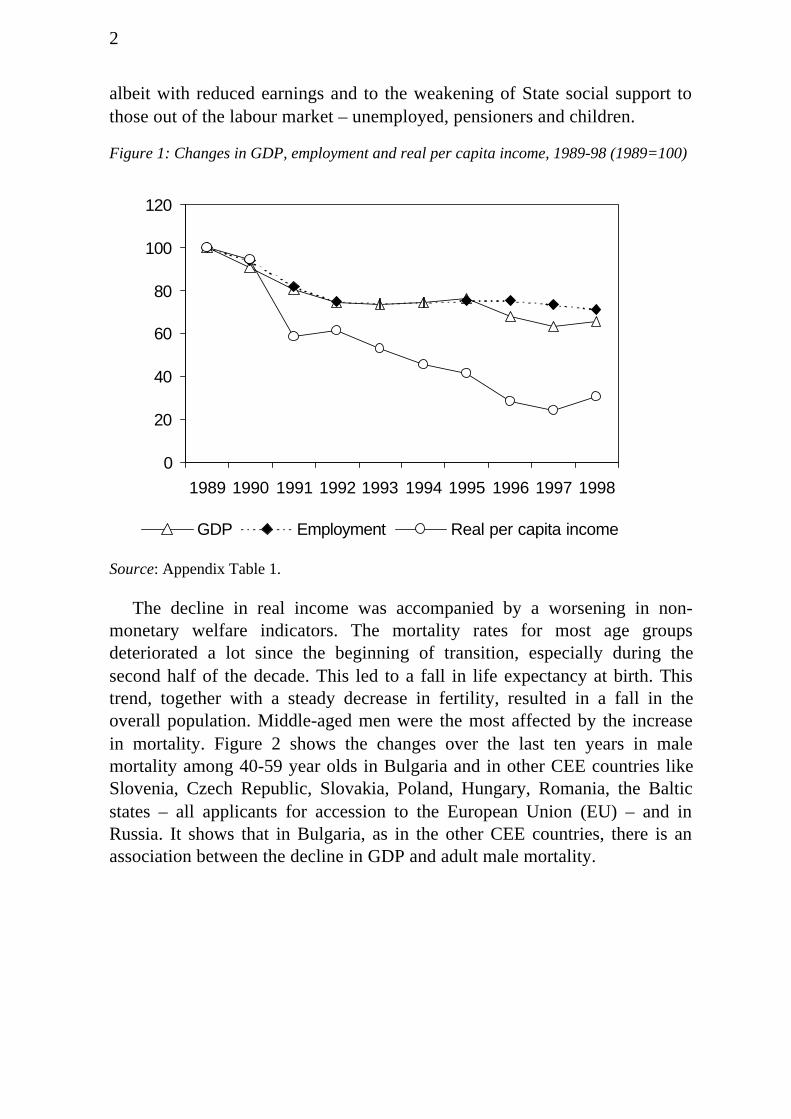
Figure 1 shows the changes in several principal economic indicators over1989-98. GDP and employment fell together. Incomes droppeddisproportionately. This was due both to policies to maintain employment
1 The countries from the former Soviet Union are not considered here.
2
albeit with reduced earnings and to the weakening of State social support tothose out of the labour market – unemployed, pensioners and children.
Figure 1: Changes in GDP, employment and real per capita income, 1989-98 (1989=100)
Source: Appendix Table 1.
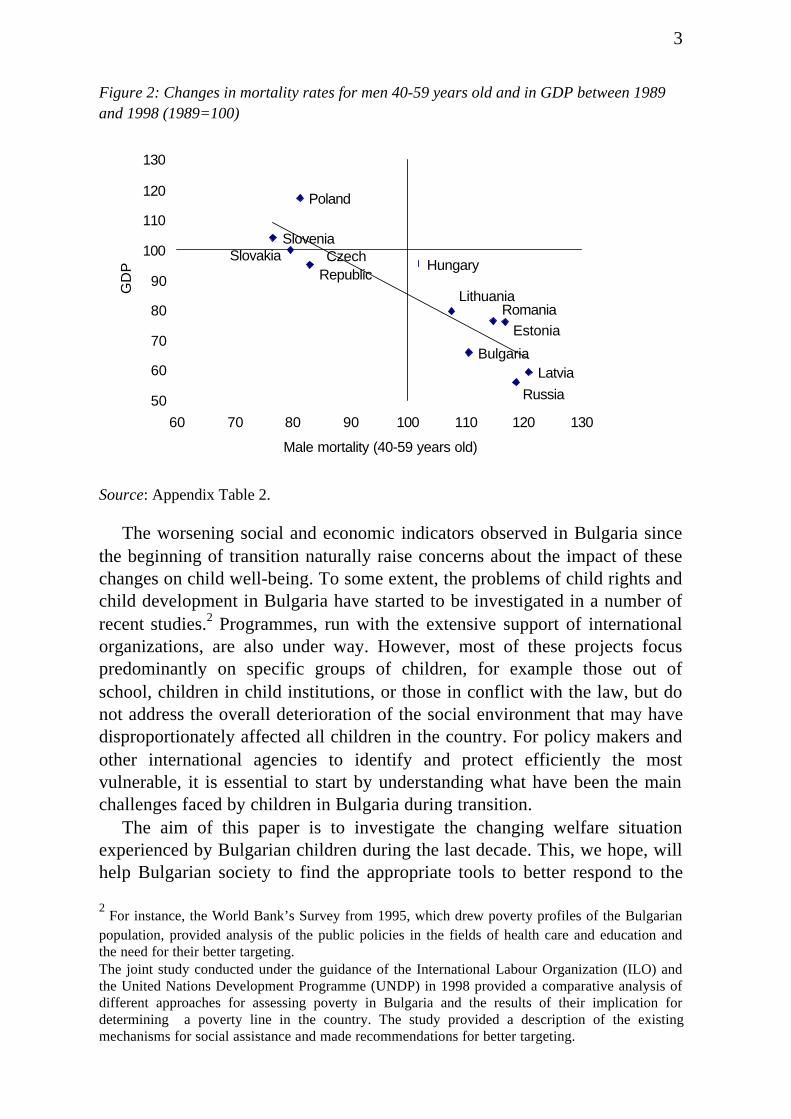
The decline in real income was accompanied by a worsening in non-monetary welfare indicators. The mortality rates for most age groupsdeteriorated a lot since the beginning of transition, especially during thesecond half of the decade. This led to a fall in life expectancy at birth. Thistrend, together with a steady decrease in fertility, resulted in a fall in theoverall population. Middle-aged men were the most affected by the increasein mortality. Figure 2 shows the changes over the last ten years in malemortality among 40-59 year olds in Bulgaria and in other CEE countries likeSlovenia, Czech Republic, Slovakia, Poland, Hungary, Romania, the Balticstates – all applicants for accession to the European Union (EU) – and inRussia. It shows that in Bulgaria, as in the other CEE countries, there is anassociation between the decline in GDP and adult male mortality.
0
20
40
60
80
100
120
1989 1990 1991 1992 1993 1994 1995 1996 1997 1998
GDP Employment Real per capita income
3
Figure 2: Changes in mortality rates for men 40-59 years old and in GDP between 1989and 1998 (1989=100)
Source: Appendix Table 2.
The worsening social and economic indicators observed in Bulgaria sincethe beginning of transition naturally raise concerns about the impact of thesechanges on child well-being. To some extent, the problems of child rights andchild development in Bulgaria have started to be investigated in a number ofrecent studies.2 Programmes, run with the extensive support of internationalorganizations, are also under way. However, most of these projects focuspredominantly on specific groups of children, for example those out ofschool, children in child institutions, or those in conflict with the law, but donot address the overall deterioration of the social environment that may havedisproportionately affected all children in the country. For policy makers andother international agencies to identify and protect efficiently the mostvulnerable, it is essential to start by understanding what have been the mainchallenges faced by children in Bulgaria during transition.
The aim of this paper is to investigate the changing welfare situationexperienced by Bulgarian children during the last decade. This, we hope, willhelp Bulgarian society to find the appropriate tools to better respond to the
2 For instance, the World Bank’s Survey from 1995, which drew poverty profiles of the Bulgarian
population, provided analysis of the public policies in the fields of health care and education andthe need for their better targeting.The joint study conducted under the guidance of the International Labour Organization (ILO) andthe United Nations Development Programme (UNDP) in 1998 provided a comparative analysis ofdifferent approaches for assessing poverty in Bulgaria and the results of their implication fordetermining a poverty line in the country. The study provided a description of the existingmechanisms for social assistance and made recommendations for better targeting.
Poland
SloveniaCzech
RepublicHungary
LithuaniaRomania
Estonia
Bulgaria
Russia
Latvia
Slovakia
50
60
70
80
90
100
110
120
130
60 70 80 90 100 110 120 130
Male mortality (40-59 years old)
GD
P
4
needs of its children. By reducing the adverse impact of transition on childwell-being, the country would also substantially improve its readiness for EUaccession.
The paper is organized as follows. Section 2 describes the methodologyand the main welfare indicators used in this analysis. Sections 3 to 5investigate the changes that occurred over the last decade in economic well-being, health and education of children, three dimensions of child welfare thathave been recognised as fundamental child rights with the ratification byBulgaria of the UN Convention on the Rights of the Child (CRC) in 1991.Section 6 concentrates on particularly vulnerable groups of children – thoseborn of teenage and single mothers and those living in institutions. The lastsection summarises the main findings and concludes with a number of policyrecommendations.
2. MethodologyOur analysis of child welfare in Bulgaria relies primarily on statistical datathat are gathered annually by the National Statistical Institute and that coverthree dimensions of child welfare: economic well-being – namely – incomeand expenditure, health and education. Of course, these dimensions are notindependent. Children from high-income families are more likely to havebetter access to health and education, especially when access to these servicesis being monetised. And those with good health are more likely to remain ineducation. But the way these dimensions are being affected by the social andeconomic changes may diverge quite substantially. Thus, an analysis of theseeconomic and non-economic indicators appears essential for a thoroughunderstanding of the changing welfare situation of children.
We start the analysis by looking at the changes in the real level of incomeand expenditures, their changing structure, and the impact of falling incomeon the consumption of basic goods. Our analysis is nonetheless constrainedby the fact that we observe only the changing economic situation of familieswith different numbers of children. In other words, we measure only thecapacity of families to finance the needs of their children, but we do notobserve directly how the resources are reallocated to these children.
The discussion then turns to children’s health. We first report on thechanges in infant and child mortality and the developments of low-weightbirths before examining the contribution of specific diseases to childmorbidity. The latter refers to typical child diseases like those of therespiratory system but also to other diseases namely neoplasm diseases(cancer), diseases of blood and blood-forming organs (mainly anaemia) andof the digestive system (gastritis, ulcer). It is not our intention, however, toexplain the rising incidence of these diseases.
5
Another important dimension of child welfare, education, is theninvestigated. We start by looking at the trends in enrolment rates byeducational levels and key age groups, before examining the impact of familyincome on access to education. We also provide some evidence on schoolachievements in Bulgaria and draw some international comparison, relying onan international survey conducted in 1994 on achievements in the fields ofmathematics and science.
The rest of the analysis concentrates on particularly vulnerable groups ofchildren, namely those with teenage or single mothers, with a high risk ofpoverty and social exclusion, and those living in institutions. We first provideevidence on the trends in teenage and single-mother births and childinstitutionalization rates. We then address the worsening financial situation ofchild institutions and the impact of this on child development usingsociological data and finance data on child institutions. However, otherchildren at risk, such as street children or young drug abusers, are notinvestigated here. The main reason is the lack of information on these specificgroups of children, which would require special surveys and special attentionfrom State programmes and NGOs.
The list of the statistical indicators used in this paper to assess thechanging welfare situation of children in Bulgaria during the past ten years isgiven below.
Economic well-being
§ Real per capita income by households with different numbers of children
§ Share of monthly family allowances in the total cash income
§ Percentage share of children by income deciles
§ Consumption of basic foods – milk, meat, fresh fruits, bread and cereals,etc. – by households with different numbers of children
§ Calorie per capita intake by households with different numbers ofchildren.
Health
§ Infant mortality rate
§ Percentage share of low-weight births
§ Mortality rate of 5-19 year-olds
§ Incidence of neoplasm diseases (cancer) among children
§ Incidence of diseases of blood and blood forming organs (anaemia) amongchildren
§ Incidence of diseases of the digestive system (gastritis, ulcer) amongchildren.
6
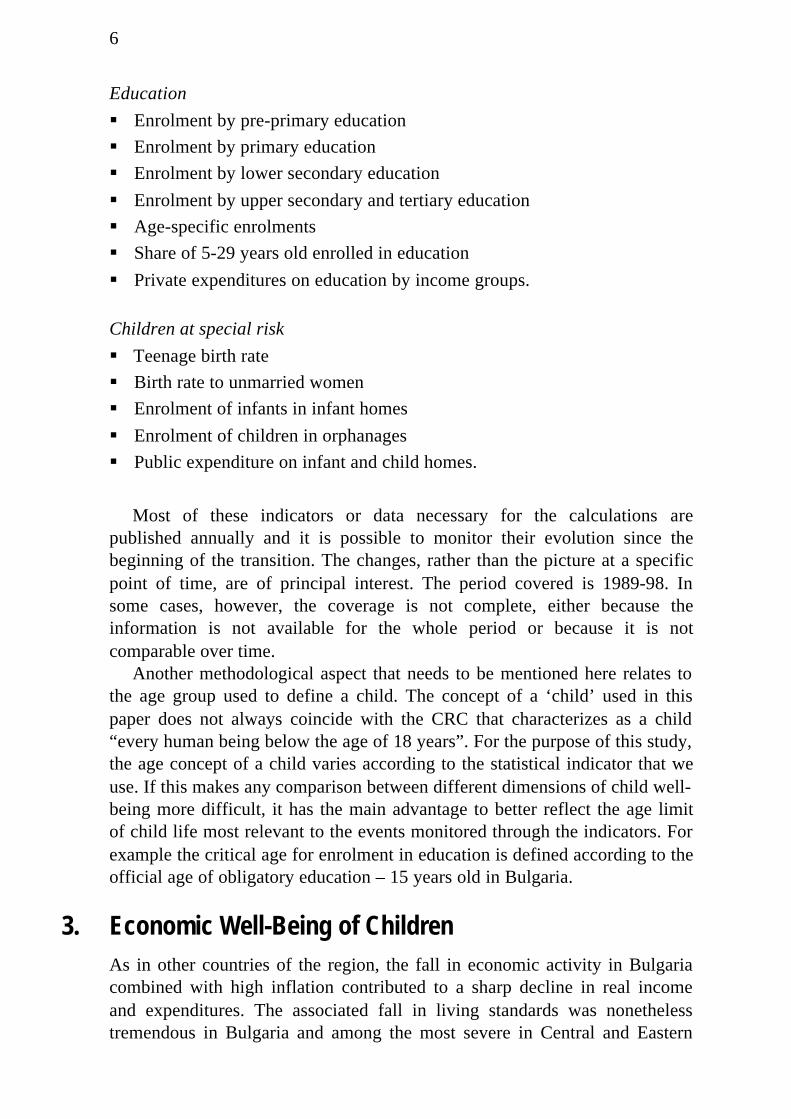
Education
§ Enrolment by pre-primary education
§ Enrolment by primary education
§ Enrolment by lower secondary education
§ Enrolment by upper secondary and tertiary education
§ Age-specific enrolments
§ Share of 5-29 years old enrolled in education
§ Private expenditures on education by income groups.
Children at special risk
§ Teenage birth rate
§ Birth rate to unmarried women
§ Enrolment of infants in infant homes
§ Enrolment of children in orphanages
§ Public expenditure on infant and child homes.
Most of these indicators or data necessary for the calculations arepublished annually and it is possible to monitor their evolution since thebeginning of the transition. The changes, rather than the picture at a specificpoint of time, are of principal interest. The period covered is 1989-98. Insome cases, however, the coverage is not complete, either because theinformation is not available for the whole period or because it is notcomparable over time.
Another methodological aspect that needs to be mentioned here relates tothe age group used to define a child. The concept of a ‘child’ used in thispaper does not always coincide with the CRC that characterizes as a child“every human being below the age of 18 years”. For the purpose of this study,the age concept of a child varies according to the statistical indicator that weuse. If this makes any comparison between different dimensions of child well-being more difficult, it has the main advantage to better reflect the age limitof child life most relevant to the events monitored through the indicators. Forexample the critical age for enrolment in education is defined according to theofficial age of obligatory education – 15 years old in Bulgaria.
3. Economic Well-Being of ChildrenAs in other countries of the region, the fall in economic activity in Bulgariacombined with high inflation contributed to a sharp decline in real incomeand expenditures. The associated fall in living standards was nonethelesstremendous in Bulgaria and among the most severe in Central and Eastern
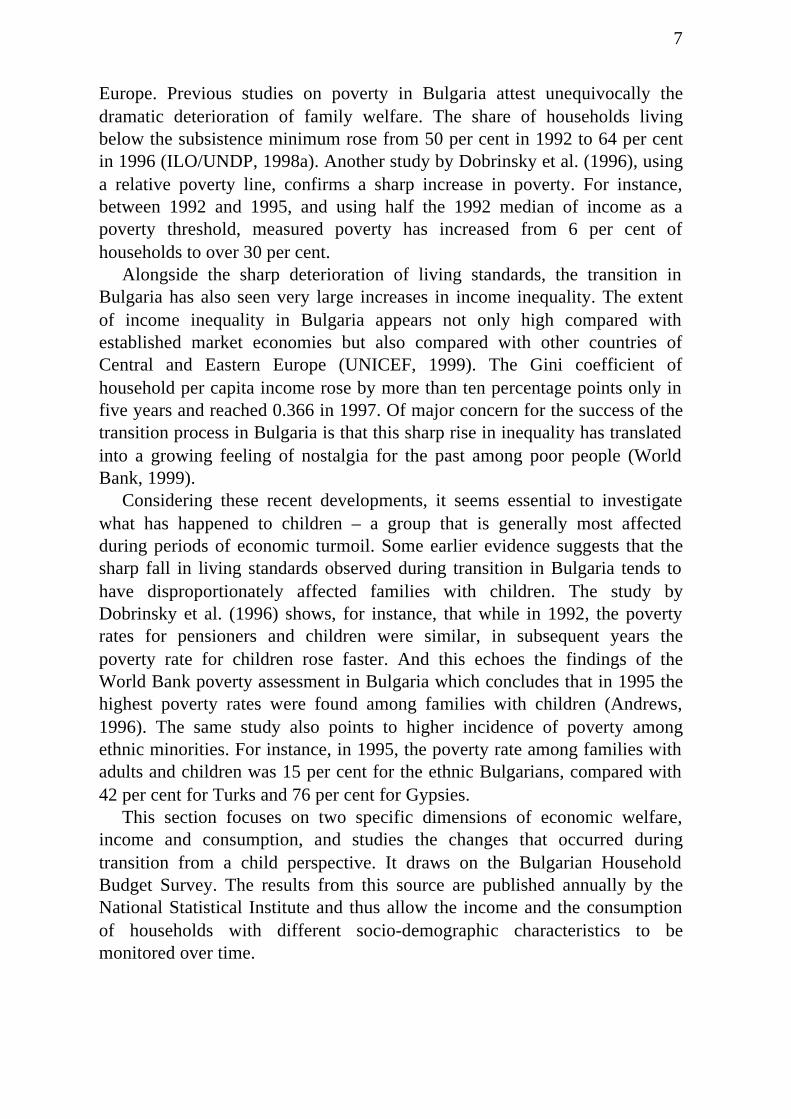
7
Europe. Previous studies on poverty in Bulgaria attest unequivocally thedramatic deterioration of family welfare. The share of households livingbelow the subsistence minimum rose from 50 per cent in 1992 to 64 per centin 1996 (ILO/UNDP, 1998a). Another study by Dobrinsky et al. (1996), usinga relative poverty line, confirms a sharp increase in poverty. For instance,between 1992 and 1995, and using half the 1992 median of income as apoverty threshold, measured poverty has increased from 6 per cent ofhouseholds to over 30 per cent.
Alongside the sharp deterioration of living standards, the transition inBulgaria has also seen very large increases in income inequality. The extentof income inequality in Bulgaria appears not only high compared withestablished market economies but also compared with other countries ofCentral and Eastern Europe (UNICEF, 1999). The Gini coefficient ofhousehold per capita income rose by more than ten percentage points only infive years and reached 0.366 in 1997. Of major concern for the success of thetransition process in Bulgaria is that this sharp rise in inequality has translatedinto a growing feeling of nostalgia for the past among poor people (WorldBank, 1999).
Considering these recent developments, it seems essential to investigatewhat has happened to children – a group that is generally most affectedduring periods of economic turmoil. Some earlier evidence suggests that thesharp fall in living standards observed during transition in Bulgaria tends tohave disproportionately affected families with children. The study byDobrinsky et al. (1996) shows, for instance, that while in 1992, the povertyrates for pensioners and children were similar, in subsequent years thepoverty rate for children rose faster. And this echoes the findings of theWorld Bank poverty assessment in Bulgaria which concludes that in 1995 thehighest poverty rates were found among families with children (Andrews,1996). The same study also points to higher incidence of poverty amongethnic minorities. For instance, in 1995, the poverty rate among families withadults and children was 15 per cent for the ethnic Bulgarians, compared with42 per cent for Turks and 76 per cent for Gypsies.
This section focuses on two specific dimensions of economic welfare,income and consumption, and studies the changes that occurred duringtransition from a child perspective. It draws on the Bulgarian HouseholdBudget Survey. The results from this source are published annually by theNational Statistical Institute and thus allow the income and the consumptionof households with different socio-demographic characteristics to bemonitored over time.
8
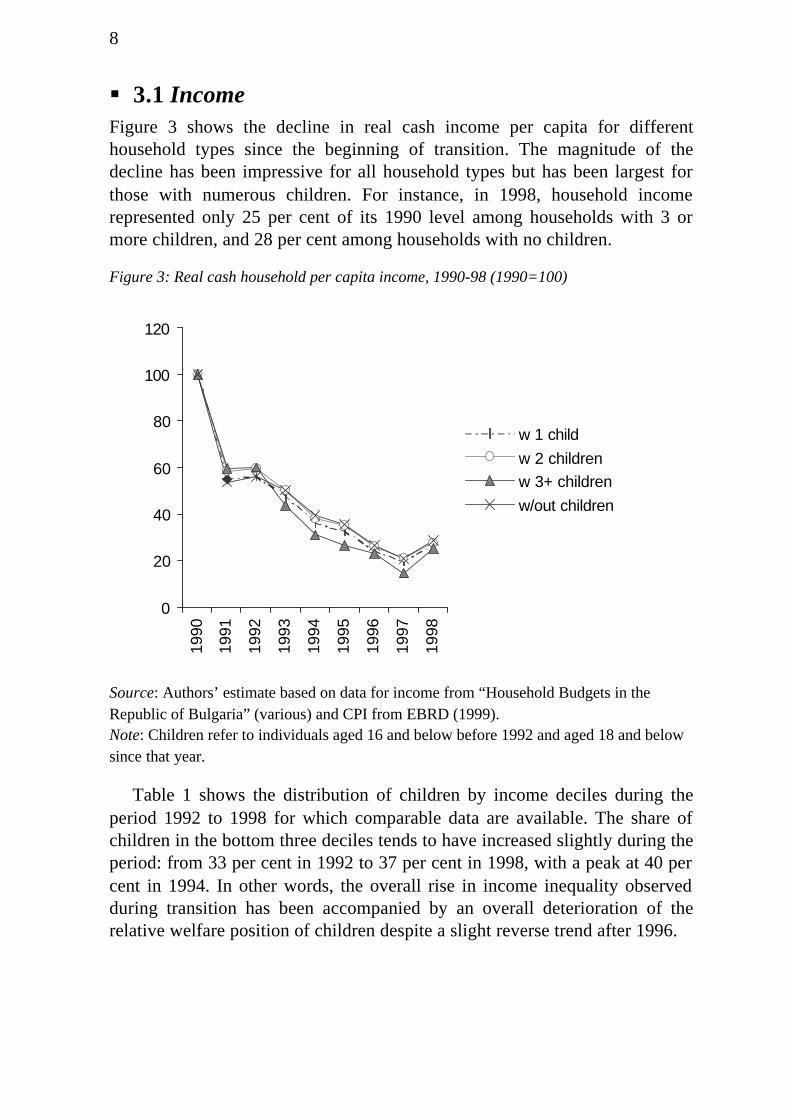
§ 3.1 IncomeFigure 3 shows the decline in real cash income per capita for differenthousehold types since the beginning of transition. The magnitude of thedecline has been impressive for all household types but has been largest forthose with numerous children. For instance, in 1998, household incomerepresented only 25 per cent of its 1990 level among households with 3 ormore children, and 28 per cent among households with no children.
Figure 3: Real cash household per capita income, 1990-98 (1990=100)
Source: Authors’ estimate based on data for income from “Household Budgets in theRepublic of Bulgaria” (various) and CPI from EBRD (1999).Note: Children refer to individuals aged 16 and below before 1992 and aged 18 and belowsince that year.
Table 1 shows the distribution of children by income deciles during theperiod 1992 to 1998 for which comparable data are available. The share ofchildren in the bottom three deciles tends to have increased slightly during theperiod: from 33 per cent in 1992 to 37 per cent in 1998, with a peak at 40 percent in 1994. In other words, the overall rise in income inequality observedduring transition has been accompanied by an overall deterioration of therelative welfare position of children despite a slight reverse trend after 1996.
0
20
40
60
80
100
120
1990
1991
1992
1993
1994
1995
1996
1997
1998
w 1 child
w 2 children
w 3+ children
w/out children
9
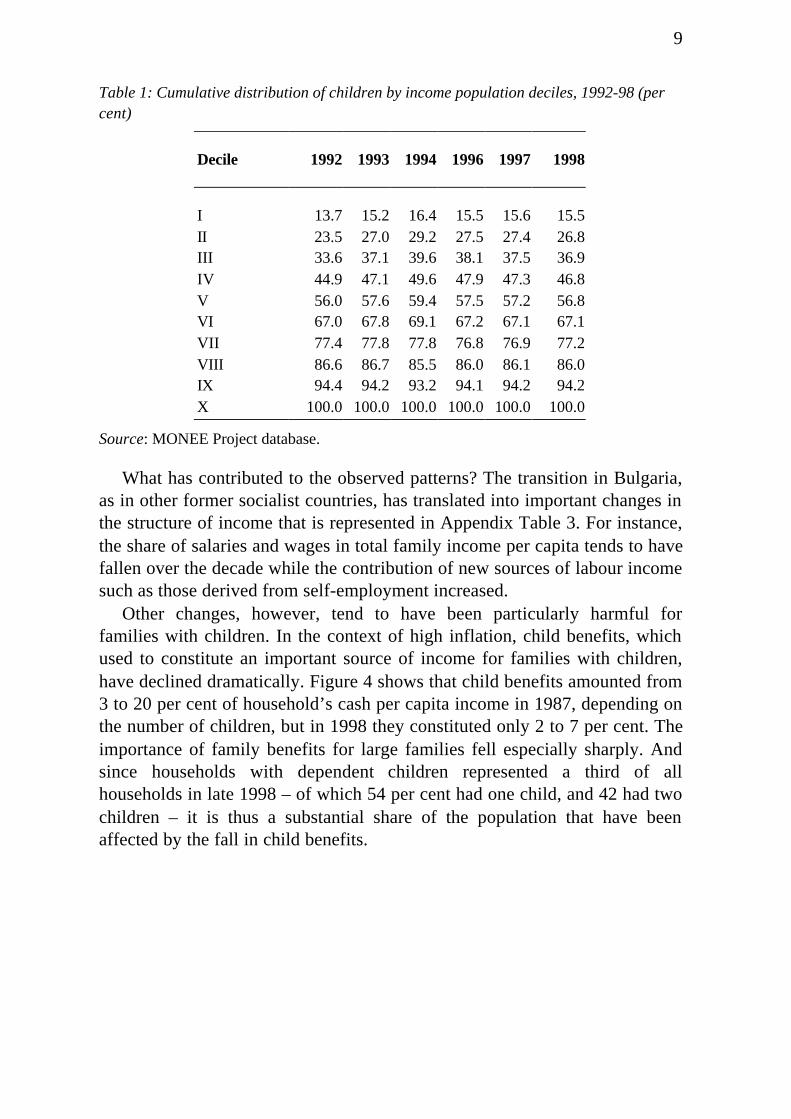
Table 1: Cumulative distribution of children by income population deciles, 1992-98 (percent)
Decile 1992 1993 1994 1996 1997 1998
I 13.7 15.2 16.4 15.5 15.6 15.5II 23.5 27.0 29.2 27.5 27.4 26.8III 33.6 37.1 39.6 38.1 37.5 36.9IV 44.9 47.1 49.6 47.9 47.3 46.8V 56.0 57.6 59.4 57.5 57.2 56.8VI 67.0 67.8 69.1 67.2 67.1 67.1VII 77.4 77.8 77.8 76.8 76.9 77.2VIII 86.6 86.7 85.5 86.0 86.1 86.0IX 94.4 94.2 93.2 94.1 94.2 94.2X 100.0 100.0 100.0 100.0 100.0 100.0
Source: MONEE Project database.
What has contributed to the observed patterns? The transition in Bulgaria,as in other former socialist countries, has translated into important changes inthe structure of income that is represented in Appendix Table 3. For instance,the share of salaries and wages in total family income per capita tends to havefallen over the decade while the contribution of new sources of labour incomesuch as those derived from self-employment increased.
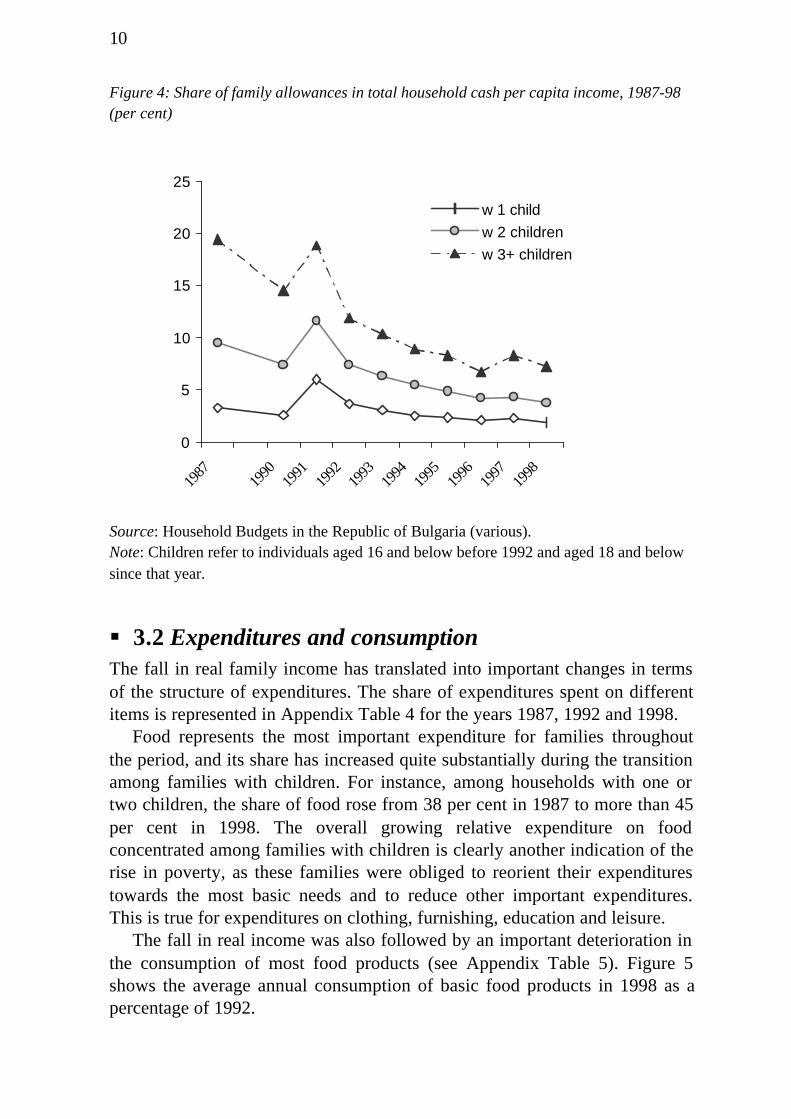
Other changes, however, tend to have been particularly harmful forfamilies with children. In the context of high inflation, child benefits, whichused to constitute an important source of income for families with children,have declined dramatically. Figure 4 shows that child benefits amounted from3 to 20 per cent of household’s cash per capita income in 1987, depending onthe number of children, but in 1998 they constituted only 2 to 7 per cent. Theimportance of family benefits for large families fell especially sharply. Andsince households with dependent children represented a third of allhouseholds in late 1998 – of which 54 per cent had one child, and 42 had twochildren – it is thus a substantial share of the population that have beenaffected by the fall in child benefits.
10
Figure 4: Share of family allowances in total household cash per capita income, 1987-98(per cent)
Source: Household Budgets in the Republic of Bulgaria (various).Note: Children refer to individuals aged 16 and below before 1992 and aged 18 and belowsince that year.
§ 3.2 Expenditures and consumptionThe fall in real family income has translated into important changes in termsof the structure of expenditures. The share of expenditures spent on differentitems is represented in Appendix Table 4 for the years 1987, 1992 and 1998.
Food represents the most important expenditure for families throughoutthe period, and its share has increased quite substantially during the transitionamong families with children. For instance, among households with one ortwo children, the share of food rose from 38 per cent in 1987 to more than 45per cent in 1998. The overall growing relative expenditure on foodconcentrated among families with children is clearly another indication of therise in poverty, as these families were obliged to reorient their expenditurestowards the most basic needs and to reduce other important expenditures.This is true for expenditures on clothing, furnishing, education and leisure.
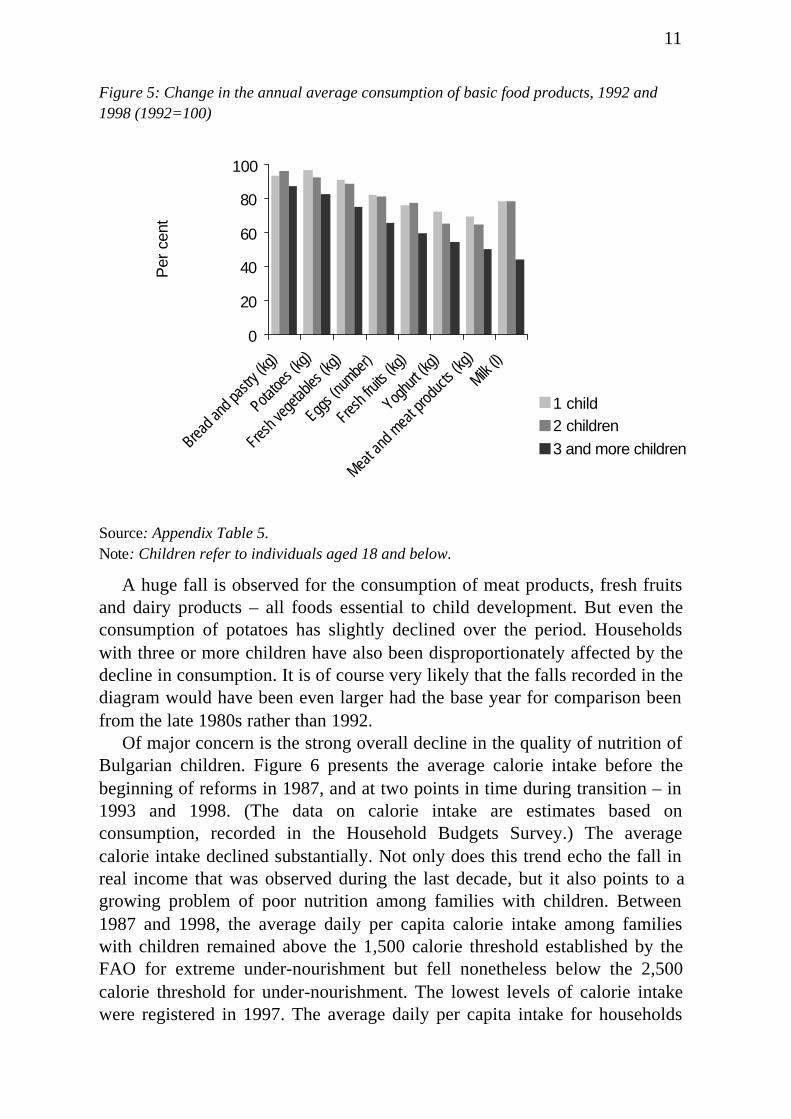
The fall in real income was also followed by an important deterioration inthe consumption of most food products (see Appendix Table 5). Figure 5shows the average annual consumption of basic food products in 1998 as apercentage of 1992.
0
5
10
15
20
25
1987
1990
1991
1992
1993
1994
1995
1996
1997
1998
w 1 child
w 2 children
w 3+ children
11
Figure 5: Change in the annual average consumption of basic food products, 1992 and1998 (1992=100)
Source: Appendix Table 5.Note: Children refer to individuals aged 18 and below.
A huge fall is observed for the consumption of meat products, fresh fruitsand dairy products – all foods essential to child development. But even theconsumption of potatoes has slightly declined over the period. Householdswith three or more children have also been disproportionately affected by thedecline in consumption. It is of course very likely that the falls recorded in thediagram would have been even larger had the base year for comparison beenfrom the late 1980s rather than 1992.
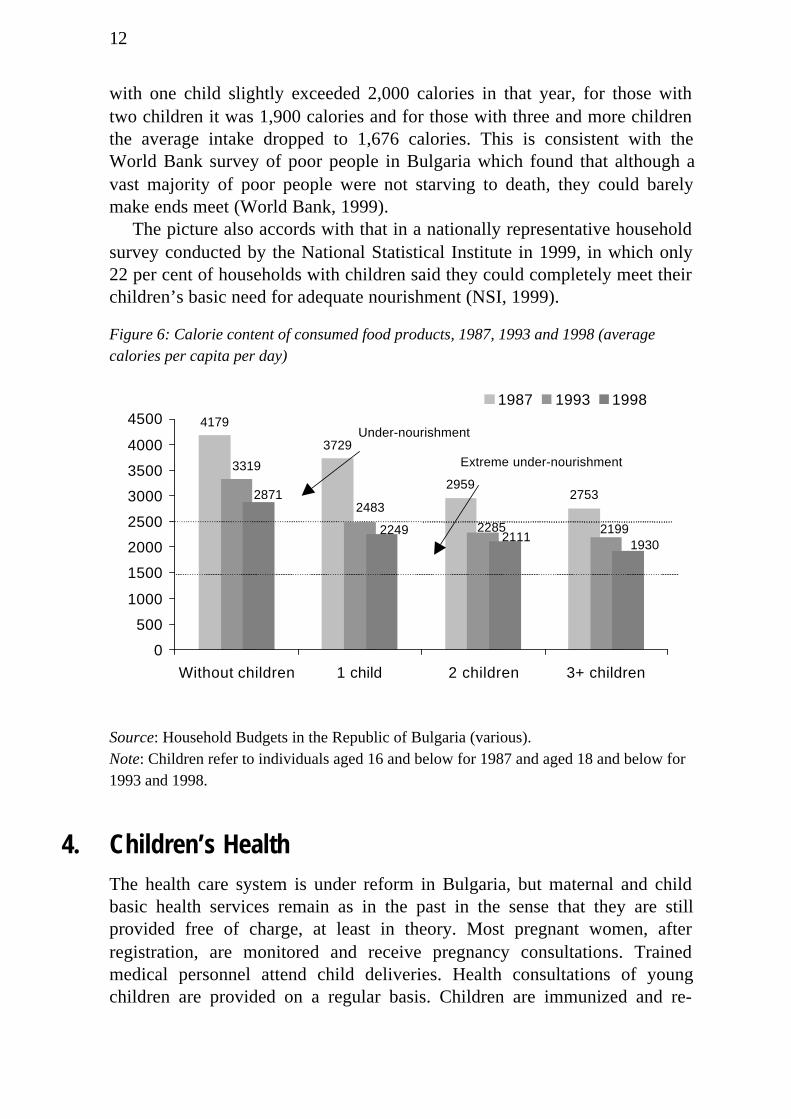
Of major concern is the strong overall decline in the quality of nutrition ofBulgarian children. Figure 6 presents the average calorie intake before thebeginning of reforms in 1987, and at two points in time during transition – in1993 and 1998. (The data on calorie intake are estimates based onconsumption, recorded in the Household Budgets Survey.) The averagecalorie intake declined substantially. Not only does this trend echo the fall inreal income that was observed during the last decade, but it also points to agrowing problem of poor nutrition among families with children. Between1987 and 1998, the average daily per capita calorie intake among familieswith children remained above the 1,500 calorie threshold established by theFAO for extreme under-nourishment but fell nonetheless below the 2,500calorie threshold for under-nourishment. The lowest levels of calorie intakewere registered in 1997. The average daily per capita intake for households
0
20
40
60
80
100
Bread a
nd pa
stry (
kg)
Potatoe
s (kg
)
Fresh v
egeta
bles (
kg)
Eggs (
numbe
r)
Fresh f
ruits
(kg)
Yoghu
rt (kg
)
Meat a
nd m
eat p
roduc
ts (kg
)
Milk (l)
Per
cen
t
1 child2 children
3 and more children
12
with one child slightly exceeded 2,000 calories in that year, for those withtwo children it was 1,900 calories and for those with three and more childrenthe average intake dropped to 1,676 calories. This is consistent with theWorld Bank survey of poor people in Bulgaria which found that although avast majority of poor people were not starving to death, they could barelymake ends meet (World Bank, 1999).
The picture also accords with that in a nationally representative householdsurvey conducted by the National Statistical Institute in 1999, in which only22 per cent of households with children said they could completely meet theirchildren’s basic need for adequate nourishment (NSI, 1999).
Figure 6: Calorie content of consumed food products, 1987, 1993 and 1998 (averagecalories per capita per day)
Source: Household Budgets in the Republic of Bulgaria (various).Note: Children refer to individuals aged 16 and below for 1987 and aged 18 and below for1993 and 1998.
4. Children’s HealthThe health care system is under reform in Bulgaria, but maternal and childbasic health services remain as in the past in the sense that they are stillprovided free of charge, at least in theory. Most pregnant women, afterregistration, are monitored and receive pregnancy consultations. Trainedmedical personnel attend child deliveries. Health consultations of youngchildren are provided on a regular basis. Children are immunized and re-
4179
3729
29592753
21992285
2483
3319
193021112249
2871
0
500
1000
1500
2000
2500
3000
3500
4000
4500
Without children 1 child 2 children 3+ children
1987 1993 1998
Under-nourishment
Extreme under-nourishment
13
immunized against diseases like tuberculosis, diphtheria, tetanus, pertussis,measles and polio according to the adopted immunization calendar.
However, despite the fact that immunizations are supposed to be providedfree of charge and to cover all children under the control of the local andschool medical establishments, the rates of immunization during the secondhalf of the decade fell by three to six percentage points on average. This fact,combined with worsening nutrition documented in the previous section,contributed to a weakening of the immune system and to increasing morbidityof children. This section looks at children’s health, using some standardindicators for child mortality and morbidity. The results point to increasinghealth risks over the last decade.
§ 4.1 Infant mortalityThe interpretation of infant mortality rates is strongly influenced by theconcept of live birth that any country follows. The WHO defines a live-birthas “a complete exclusion or extraction from its mother of a product ofconception, irrespective of the duration of pregnancy, which after suchseparation breaths or shows any other evidence of life”. The national conceptadopted by Bulgaria in 1970 is close to the WHO definition but a child bornwith weight less than 1000 grams with any sign of life is considered as a live-born child only if he or she survives the sixth day from the day of birth (if thebaby dies before the sixth day, then an abortion, not an infant’s death, isregistered). This national definition tends to give a lower registered infantmortality rate (IMR) compared to that based on the WHO concept.
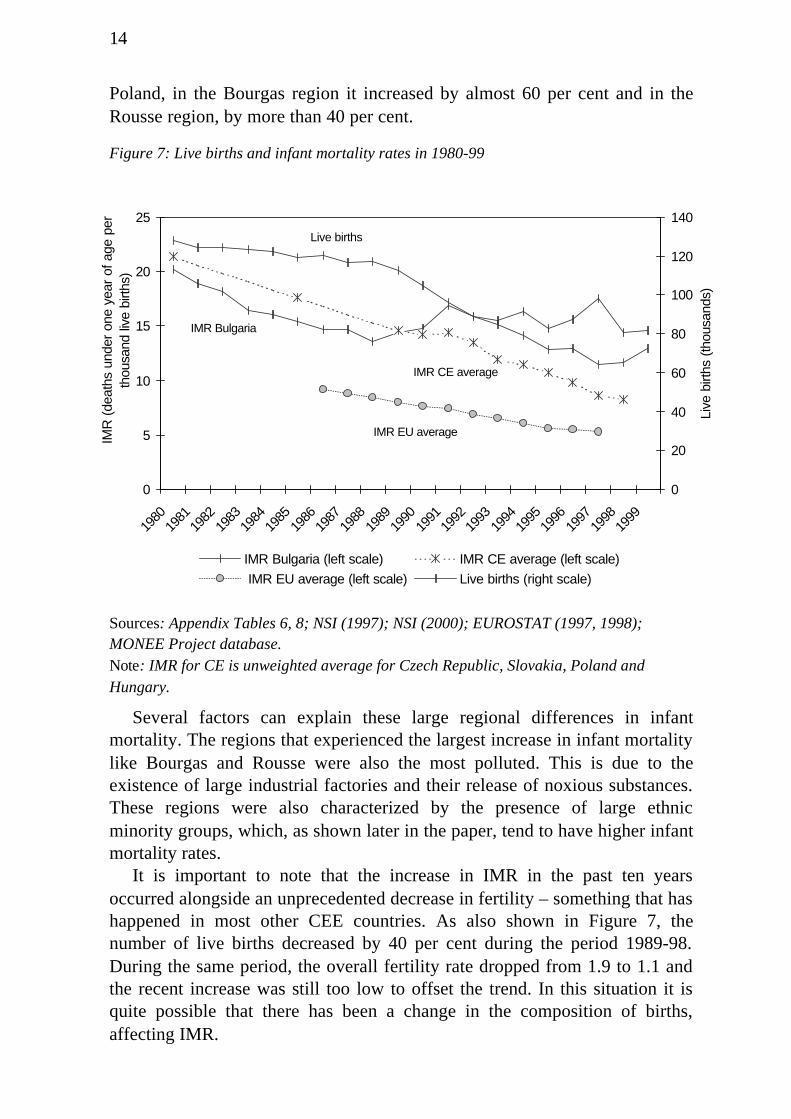
During the second half of the 20th century infant mortality in Bulgariafollowed a stable negative trend. It fell from about 100 per 1000 live births atthe beginning of the 1950s to 13.6 in 1988. For comparison the EU averagerate in 1988 stood at 8.4 (EUROSTAT, 1997). Not only was this trendstopped at the beginning of the transition but it was even reversed – a featurenot observed in other CEE countries. In fact, as shown in Figure 7, IMRstarted to increase in Bulgaria after 1989 while it continued to decline inalmost all other CEE countries. Even in the Baltic countries, where the dropin output was similar to that of Bulgaria, infant mortality continued todecrease throughout the transition period and reached lower levels in the late1990s. In 1998, infant mortality declined again in Bulgaria, but the decreaseshould be treated with care: data for 1999 show a renewed increase in infantmortality, suggesting that the 1998 drop was only temporary. IMR in 1999was 14.6 per thousand live births compared to the value of 13.6 in 1988.
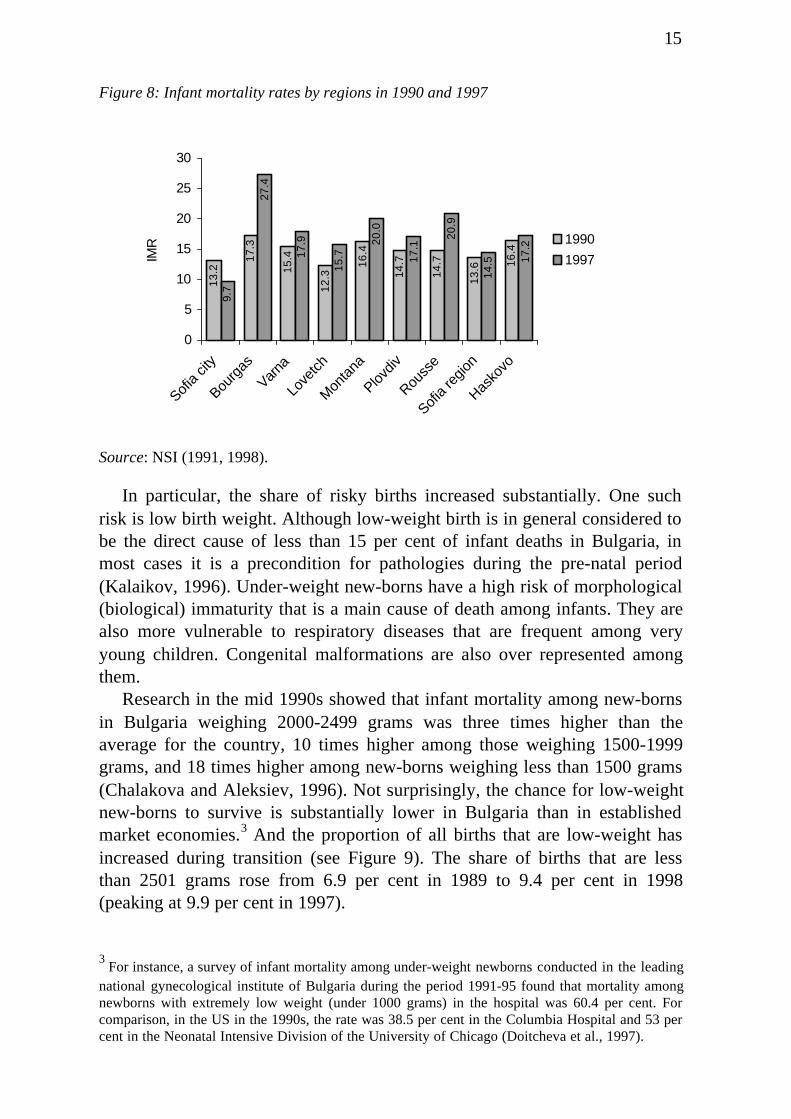
The overall rise in infant mortality was observed in all regions of thecountry, with the exception of the capital city of Sofia. Figure 8 shows IMRby regions in 1990 and 1997. While in Sofia, infant mortality declined bymore than 25 per cent and reached a level similar to that of Hungary or
14
Poland, in the Bourgas region it increased by almost 60 per cent and in theRousse region, by more than 40 per cent.
Figure 7: Live births and infant mortality rates in 1980-99
Sources: Appendix Tables 6, 8; NSI (1997); NSI (2000); EUROSTAT (1997, 1998);MONEE Project database.Note: IMR for CE is unweighted average for Czech Republic, Slovakia, Poland andHungary.
Several factors can explain these large regional differences in infantmortality. The regions that experienced the largest increase in infant mortalitylike Bourgas and Rousse were also the most polluted. This is due to theexistence of large industrial factories and their release of noxious substances.These regions were also characterized by the presence of large ethnicminority groups, which, as shown later in the paper, tend to have higher infantmortality rates.
It is important to note that the increase in IMR in the past ten yearsoccurred alongside an unprecedented decrease in fertility – something that hashappened in most other CEE countries. As also shown in Figure 7, thenumber of live births decreased by 40 per cent during the period 1989-98.During the same period, the overall fertility rate dropped from 1.9 to 1.1 andthe recent increase was still too low to offset the trend. In this situation it isquite possible that there has been a change in the composition of births,affecting IMR.
0
5
10
15
20
25
1980
1981
1982
1983
1984
1985
1986
1987
1988
1989
1990
1991
1992
1993
1994
1995
1996
1997
1998
1999
IMR
(de
aths
und
er o
ne y
ear
of a
ge p
er
thou
sand
live
birt
hs)
0
20
40
60
80
100
120
140
Live
birt
hs (
thou
sand
s)
IMR Bulgaria (left scale) IMR CE average (left scale)
IMR EU average (left scale) Live births (right scale)
IMR Bulgaria
IMR EU average
Live births
IMR CE average
15
Figure 8: Infant mortality rates by regions in 1990 and 1997
Source: NSI (1991, 1998).
In particular, the share of risky births increased substantially. One suchrisk is low birth weight. Although low-weight birth is in general considered tobe the direct cause of less than 15 per cent of infant deaths in Bulgaria, inmost cases it is a precondition for pathologies during the pre-natal period(Kalaikov, 1996). Under-weight new-borns have a high risk of morphological(biological) immaturity that is a main cause of death among infants. They arealso more vulnerable to respiratory diseases that are frequent among veryyoung children. Congenital malformations are also over represented amongthem.
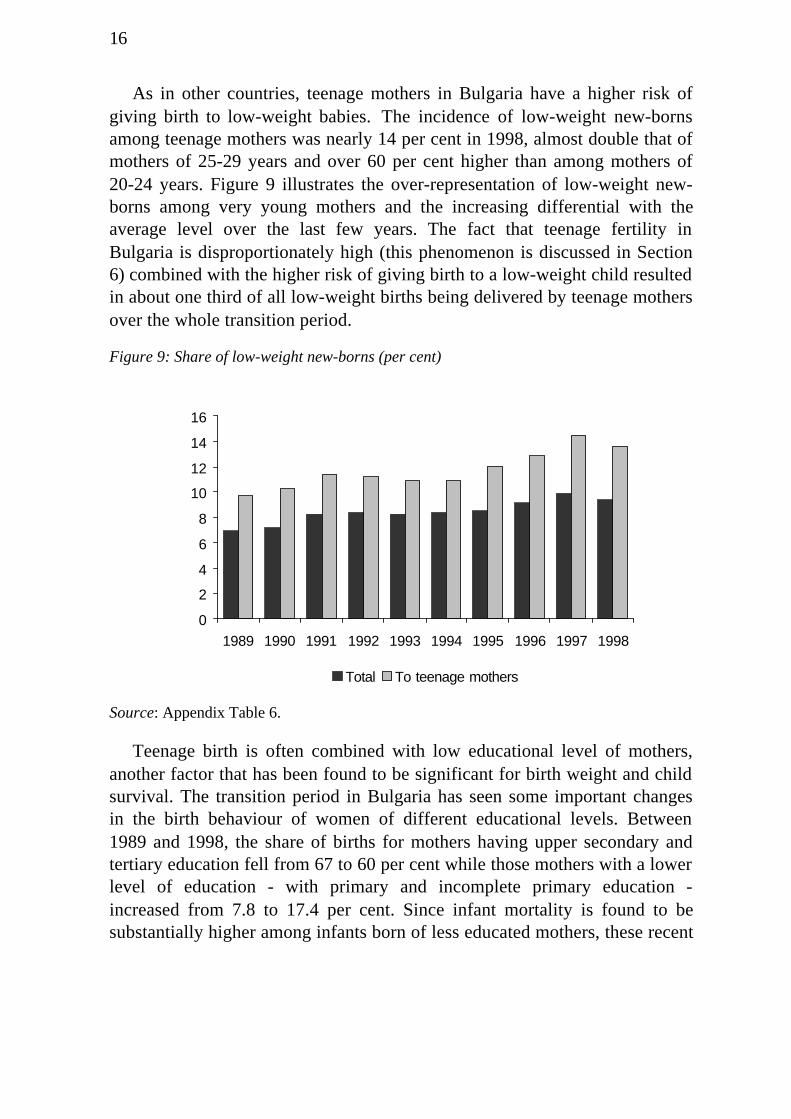
Research in the mid 1990s showed that infant mortality among new-bornsin Bulgaria weighing 2000-2499 grams was three times higher than theaverage for the country, 10 times higher among those weighing 1500-1999grams, and 18 times higher among new-borns weighing less than 1500 grams(Chalakova and Aleksiev, 1996). Not surprisingly, the chance for low-weightnew-borns to survive is substantially lower in Bulgaria than in establishedmarket economies.3 And the proportion of all births that are low-weight hasincreased during transition (see Figure 9). The share of births that are lessthan 2501 grams rose from 6.9 per cent in 1989 to 9.4 per cent in 1998(peaking at 9.9 per cent in 1997).
3 For instance, a survey of infant mortality among under-weight newborns conducted in the leading
national gynecological institute of Bulgaria during the period 1991-95 found that mortality amongnewborns with extremely low weight (under 1000 grams) in the hospital was 60.4 per cent. Forcomparison, in the US in the 1990s, the rate was 38.5 per cent in the Columbia Hospital and 53 percent in the Neonatal Intensive Division of the University of Chicago (Doitcheva et al., 1997).
13.2
17.3
15.4
12.3
16.4
14.7
14.7
13.6 16
.4
9.7
27.4
17.9
15.7
20.0
17.1
20.9
14.5 17
.2
0
5
10
15
20
25
30
Sofia
city
Bourg
as
Varna
Love
tch
Mon
tana
Plovdiv
Rouss
e
Sofia
regio
n
Hasko
vo
IMR 1990
1997
16
As in other countries, teenage mothers in Bulgaria have a higher risk ofgiving birth to low-weight babies. The incidence of low-weight new-bornsamong teenage mothers was nearly 14 per cent in 1998, almost double that ofmothers of 25-29 years and over 60 per cent higher than among mothers of20-24 years. Figure 9 illustrates the over-representation of low-weight new-borns among very young mothers and the increasing differential with theaverage level over the last few years. The fact that teenage fertility inBulgaria is disproportionately high (this phenomenon is discussed in Section6) combined with the higher risk of giving birth to a low-weight child resultedin about one third of all low-weight births being delivered by teenage mothersover the whole transition period.
Figure 9: Share of low-weight new-borns (per cent)
Source: Appendix Table 6.
Teenage birth is often combined with low educational level of mothers,another factor that has been found to be significant for birth weight and childsurvival. The transition period in Bulgaria has seen some important changesin the birth behaviour of women of different educational levels. Between1989 and 1998, the share of births for mothers having upper secondary andtertiary education fell from 67 to 60 per cent while those mothers with a lowerlevel of education - with primary and incomplete primary education -increased from 7.8 to 17.4 per cent. Since infant mortality is found to besubstantially higher among infants born of less educated mothers, these recent
0
2
4
6
8
10
12
14
16
1989 1990 1991 1992 1993 1994 1995 1996 1997 1998
Total To teenage mothers
17
changes in the reproductive behaviour of women by educational level had anon-negligible impact on the rise in infant mortality.4
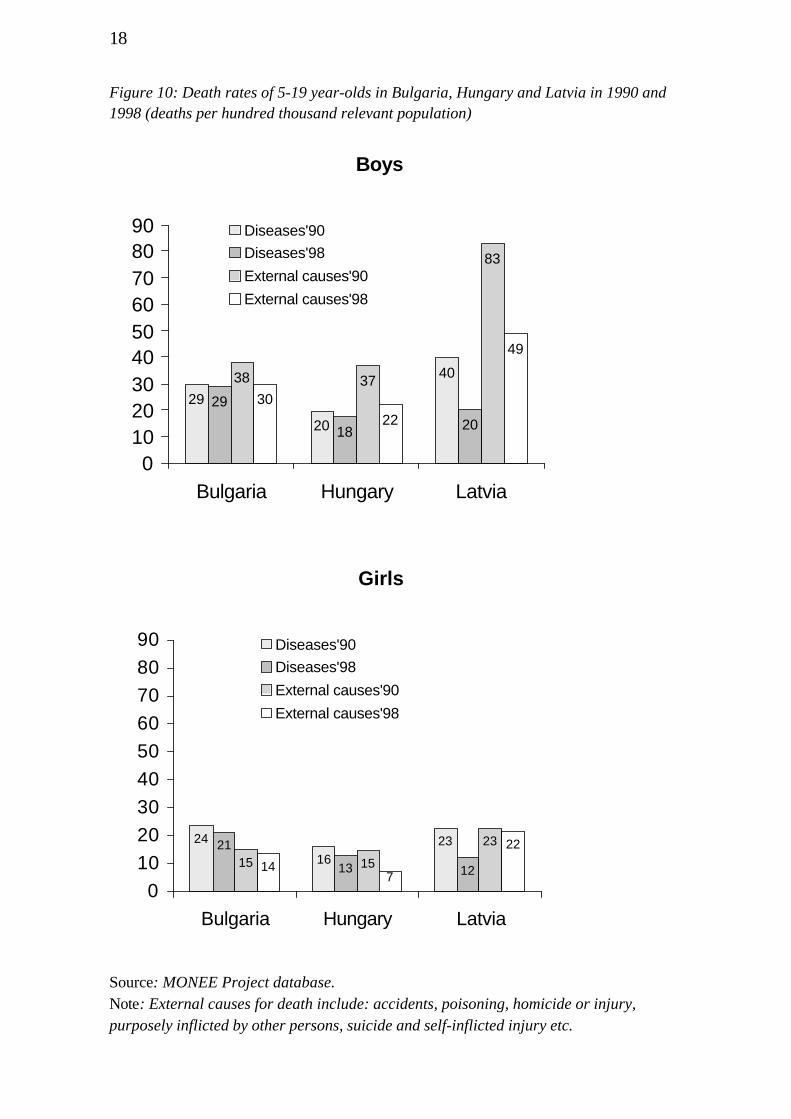
§ 4.2 Child mortalityUnlike infant mortality, mortality among children 5-19 years of age inBulgaria fell somewhat during the transition. After 1990 when the highest rateduring the period of 53 deaths per 100,000 of the relevant population wasregistered, child mortality tended to decrease during the subsequent years. Anew peak was registered in 1997, followed by some decrease. But theprevalence of child deaths remained high compared to other CEE countries.The rates were significantly higher, for example, with 15-20 more deaths perhundred thousand of the relevant child population, than in Central Europethroughout the period.
Figure 10 shows how the rates of child mortality in Bulgaria comparedwith those in Hungary and Latvia, two applicants for joining the EU, in 1990and 1998. Hungary already had lower child mortality at the start of thetransition and continued to experience falling rates during the whole periodexamined. The Baltic country Latvia, with higher child mortality rates in thelate 1980s, made good progress. The rates here almost halved in ten years,mainly due to the significant fall in deaths caused by diseases and the declineof deaths due to external causes.
Unlike Hungary and Latvia, Bulgaria has not seen a substantial decline inchild mortality during the transition period. Deaths due to external causessuch as accidents, poisoning, violence or suicides, which affect primarilyboys, declined somewhat. However deaths caused by diseases both amongboys and girls practically did not change over time and remaineddisproportionately high, suggesting that children’s health was not improving.In the late 1990s disease-caused mortality among both boys and girls was athird higher than in the other comparison countries.
4 The absolute number of births among women of primary and incomplete primary education
actually rose by 30 per cent between 1989 and 1998 despite the huge fall in overall fertility, aphenomenon that would be worthy of further investigation.
18
Figure 10: Death rates of 5-19 year-olds in Bulgaria, Hungary and Latvia in 1990 and1998 (deaths per hundred thousand relevant population)
Source: MONEE Project database.Note: External causes for death include: accidents, poisoning, homicide or injury,purposely inflicted by other persons, suicide and self-inflicted injury etc.
Girls
24
16
2321
13 1215 15
23
147
22
0
10
20
30
40
50
60
70
80
90
Bulgaria Hungary Latvia
Diseases'90
Diseases'98
External causes'90
External causes'98
Boys
29
20
40
29
18 20
38 37
83
30
22
49
0102030405060708090
Bulgaria Hungary Latvia
Diseases'90
Diseases'98
External causes'90
External causes'98
19
§ 4.3 MorbidityRegistered child morbidity has tended to decrease with some oscillation in thepast ten years. Morbidity incidence5 among children aged 0-14 yearsregistered in primary health care units fell from 2,861 per thousand relevantpopulation in 1989 to 2,396 per thousand in 1995 (see Appendix Table 9).The overall child morbidity incidence was maintained at that level also inrecent years, when the methodology of the statistics was changed and childmorbidity was recorded for the age group 0-17 years. The incidence ofrespiratory diseases, which represented more than 70 per cent of all childvisits in primary health care units, fell by more than 20 per cent throughoutthe period.
These figures on morbidity should be treated with great care, however.There is some evidence that with the rising cost of medicines and the acutenarrowing of eligibility to subsidised medicines, a growing number of parentsfail to visit doctors and try to cure their children themselves. According to the1995 World Bank household survey of Bulgaria, for instance, in 75 per centof cases of children affected by influenza and respiratory diseases help wasnot sought from professional doctors. (Influenza and respiratory diseasesaccounted for 60 per cent of all declared illness among children in thesurvey.) This had led to a systematic underestimation of child morbidity.
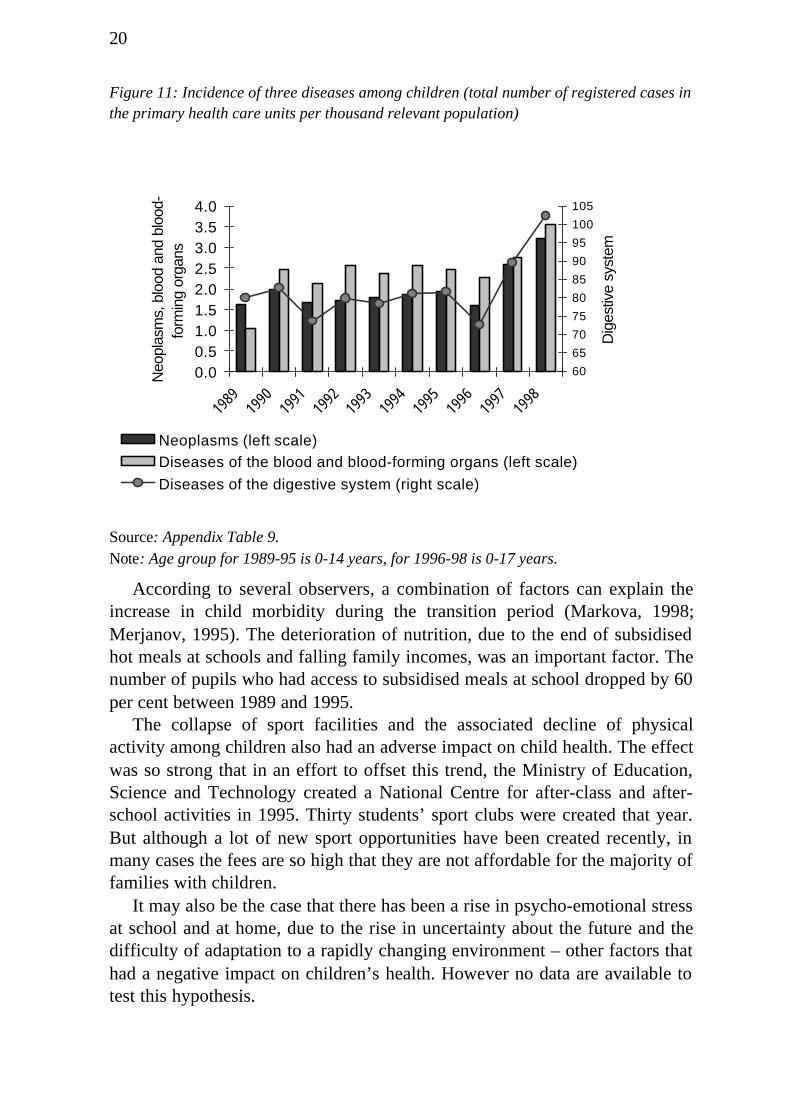
The overall decrease in registered child morbidity was accompanied by arise in serious diseases, considered as non-typical for children, which hasbeen alarming especially during recent years. The incidence of neoplasmdiseases (cancer) increased more quickly among children than among adults.While the total registered cases among adults varied between 8.1 (in 1991)and 11.4 (in 1998) per thousand persons the rate among children doubled -from 1.6 to 3.2 per thousand in only ten years with most of the increase takingplace in the last two years. These rates seem remarkably high. For examplethey mean that in 1998 there was roughly one registered case of cancer atprimary health care units in every 300 children.6
The increase in diseases of blood and blood-forming organs, mainlyanaemia, followed a similar trend. As shown in Figure 11, the number ofcases exceeded 3.6 per thousand children in 1998. The incidence of diseasesof the digestive system, mainly gastritis and ulcer also increased substantially.
5 Morbidity incidence was calculated as the total number of registered cases at primary health care
units per thousand mid-year population of the relevant age group.6 In Ukraine, the country which was hardest hit by the nuclear catastrophe of Chernobyl in the late
1980s, the incidence of neoplasm diseases among children was, for example, 1.05 per thousandrelevant population in 1990, 1.34 in 1995, 1.41 in 1996, 1.72 in 1997 (State Committee of Statisticsof Ukraine, 1998). The rates for Russia were 1.0 per thousand children aged less than 15 years in1990, 1.6 in 1995, 1.9 in 1997 (MLSDRF, 1995, 1997).
20
Figure 11: Incidence of three diseases among children (total number of registered cases inthe primary health care units per thousand relevant population)
Source: Appendix Table 9.Note: Age group for 1989-95 is 0-14 years, for 1996-98 is 0-17 years.
According to several observers, a combination of factors can explain theincrease in child morbidity during the transition period (Markova, 1998;Merjanov, 1995). The deterioration of nutrition, due to the end of subsidisedhot meals at schools and falling family incomes, was an important factor. Thenumber of pupils who had access to subsidised meals at school dropped by 60per cent between 1989 and 1995.
The collapse of sport facilities and the associated decline of physicalactivity among children also had an adverse impact on child health. The effectwas so strong that in an effort to offset this trend, the Ministry of Education,Science and Technology created a National Centre for after-class and after-school activities in 1995. Thirty students’ sport clubs were created that year.But although a lot of new sport opportunities have been created recently, inmany cases the fees are so high that they are not affordable for the majority offamilies with children.
It may also be the case that there has been a rise in psycho-emotional stressat school and at home, due to the rise in uncertainty about the future and thedifficulty of adaptation to a rapidly changing environment – other factors thathad a negative impact on children’s health. However no data are available totest this hypothesis.
0.00.51.01.52.02.53.03.54.0
1989
1990
1991
1992
1993
1994
1995
1996
1997
1998
Neo
plas
ms,
blo
od a
nd b
lood
-fo
rmin
g or
gans
60
65
70
75
80
85
90
95
100
105
Dig
estiv
e sy
stem
Neoplasms (left scale)Diseases of the blood and blood-forming organs (left scale)
Diseases of the digestive system (right scale)
21
5. EducationThe enrolment rates in education are calculated on both a gross and a netbasis. The former refers to the total number of children enrolled at a givenlevel of education as a percentage of the number of population from thetypical age group for this level. The latter corresponds to the number ofchildren from the typical age group enrolled in a given level of education as apercentage of the number of population from the same age group. Otherenrolment rates are computed on an age specific basis (total enrolment), thatis the number of children of given age or age group enrolled at any level ofeducation as a percentage of the total number of population from the sameage or age group. The typical age groups by levels of education are thefollowing:
§ 3-6 years of age – pre-primary education
§ 7-9 (up to 1992/93 school year) or 7-10 years of age – primary education
§ 10-14 (up to 1992/93 school year) or 11-14 years of age – lower secondaryeducation
§ 15-18 years of age – upper secondary education
§ 8th grade or 15 years of age – compulsory education.
§ 5.1 Trends in enrolmentIn the late 1980s, pre-primary enrolment stood at about 68 per cent on a grossbasis and at around 66 per cent on a net basis. It fell dramatically by about 10percentage points in 1991, just after the price liberalization. This was largelybecause many families could not afford the rising cost of kindergartens. As aresult, and as seen from Figure 12, the utilization of kindergartens declined.After the initial transitional shock, however, children were gradually sentback to kindergartens. In 1998, enrolment rates in pre-primary educationalmost reached their pre-transition levels but capacity available was stillunder-utilized.

22
Figure 12: Pre-primary enrolment and kindergarten capacity (as per cent of all childrenaged 3-6 years)
Source: Appendix Table 10.
Bulgaria has nonetheless experienced a large fall in gross enrolment ratesin basic education, although it is compulsory. The drop in enrolment was oneof the biggest in the CEE countries: from 98.4 to 94.3 per cent in only tenyears. The overall decline can mainly be explained by a fall in lowersecondary enrolment rates rather than a fall in primary education. In fact,while net enrolment in primary education was high and stable all over theperiod examined, lower secondary enrolment dropped by almost 9 percentagepoints between 1990-91 and 1995-96, as seen in Figure 13. And since then,the rates remain below their pre-transition levels.
There is evidence that some negative changes have occurred in attitudestowards schooling. Ability to read and write, but not to obtain the necessaryminimum of knowledge through the full course of compulsory education,seems to be considered sufficient for part of the population. This changingattitude is strongly influenced by the lack of means to maintain a student athome and explains the rise in dropout rates after the first 3-4 grades ofschooling, observed during recent years. This may be especially true amongchildren of ethnic minorities, in particular for those of Gypsy origin.
50
55
60
65
70
75
80
1989 1990 1991 1992 1993 1994 1995 1996 1997 1998
Net enrolment Gross enrolment Capacity
23
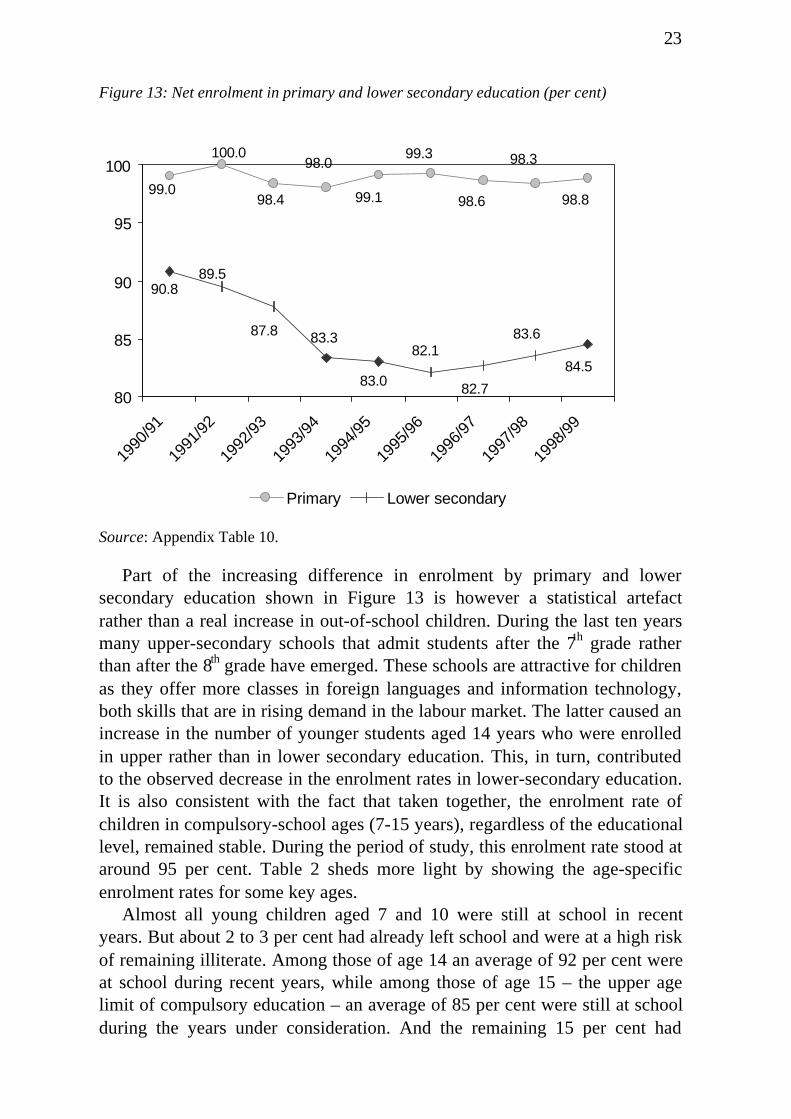
Figure 13: Net enrolment in primary and lower secondary education (per cent)
Source: Appendix Table 10.
Part of the increasing difference in enrolment by primary and lowersecondary education shown in Figure 13 is however a statistical artefactrather than a real increase in out-of-school children. During the last ten yearsmany upper-secondary schools that admit students after the 7th grade ratherthan after the 8th grade have emerged. These schools are attractive for childrenas they offer more classes in foreign languages and information technology,both skills that are in rising demand in the labour market. The latter caused anincrease in the number of younger students aged 14 years who were enrolledin upper rather than in lower secondary education. This, in turn, contributedto the observed decrease in the enrolment rates in lower-secondary education.It is also consistent with the fact that taken together, the enrolment rate ofchildren in compulsory-school ages (7-15 years), regardless of the educationallevel, remained stable. During the period of study, this enrolment rate stood ataround 95 per cent. Table 2 sheds more light by showing the age-specificenrolment rates for some key ages.
Almost all young children aged 7 and 10 were still at school in recentyears. But about 2 to 3 per cent had already left school and were at a high riskof remaining illiterate. Among those of age 14 an average of 92 per cent wereat school during recent years, while among those of age 15 – the upper agelimit of compulsory education – an average of 85 per cent were still at schoolduring the years under consideration. And the remaining 15 per cent had
99.0
100.0
98.4
98.0
99.1
99.3
98.6
98.3
98.8
82.1
82.7
83.6
84.583.0
83.3
89.590.8
87.8
80
85
90
95
100
199
0/91
199
1/92
1992
/93
1993
/94
1994
/95
1995
/96
1996
/97
1997
/98
1998
/99
Primary Lower secondary

24
generally already entered the labour market without any particular knowledgeor skills.
Table 2: Age-specific enrolment rates for compulsory school age
1990/91 1991/92 1992/93 1993/94 1994/95 1995/96 1996/97 1997/98 1998/99
Average(7 to 15years ofage)
95.6 95.5 95.2 94.4 95.7 96.1 95.7 95.5 96.1
Age 7 100.0 100.0 98.3 96.7 97.4 97.5 96.1 96.7 97.3
Age 10 97.0 97.4 97.7 98.6 98.8 99.6 99.1 98.8 99.2
Age 14 95.5 92.4 91.5 90.0 90.9 92.0 91.2 91.9 91.9
Age 15 84.0 85.0 86.6 84.0 86.0 86.3 86.8 86.1 87.7
Source: Authors’ estimates based on MONEE Project database and direct communicationwith NSI.
Not surprisingly, post-compulsory enrolment rates remained lower thantheir pre-transition level for quite a long time after the initial shock. Bothupper secondary net enrolment rates (calculated for the age group 15-18) andage-specific enrolment rates of children of post-compulsory age (16-18 years)in any level stood at around 62-65 per cent for most of the period. After thedecrease during the first half of the decade the rates somewhat recovered andrecently reached their pre-transition levels. This occurred alongside a changein the structure of secondary education. Although enrolment in technicalschools dominated throughout the period, its share decreased from 60.0 to56.8 per cent of students. This occurred together with an increase in generalsecondary enrolment.
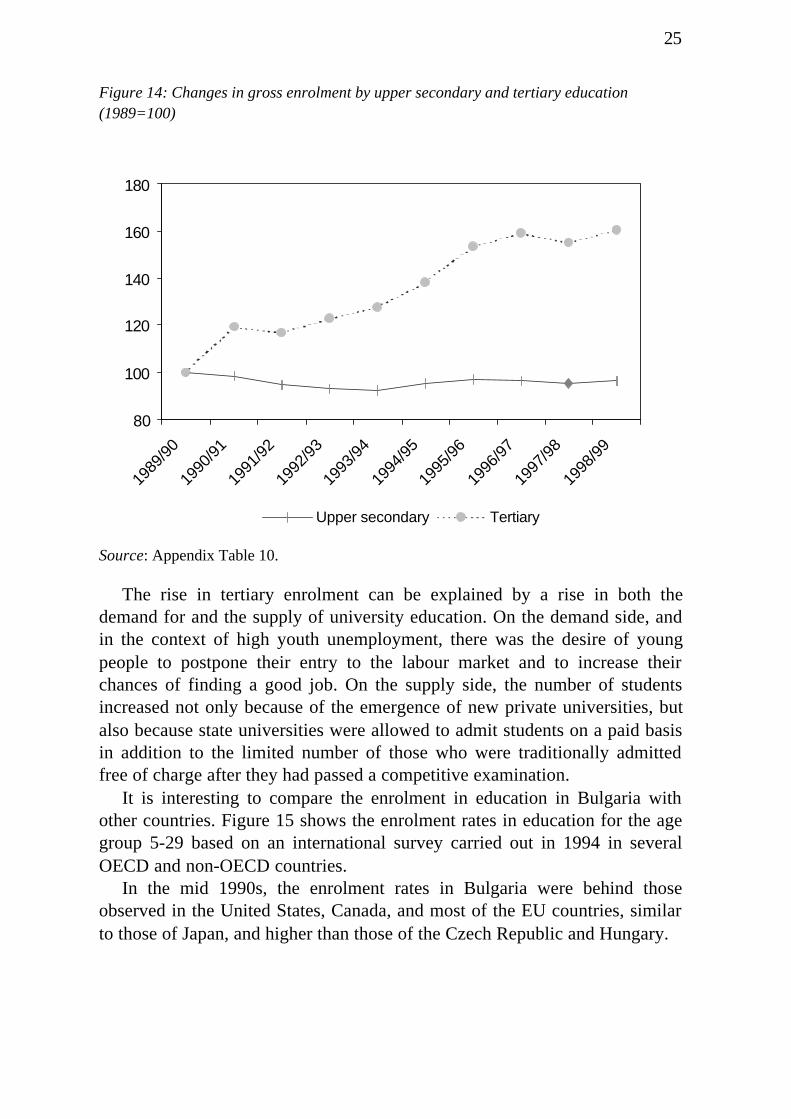
Figure 14 shows the diverging patterns of changes in upper secondary andtertiary enrolment. In contrast with the decline in the number of students inbasic and upper secondary levels, the number of students following tertiarycourses – non-university and university degree – increased from over 153,000in the late 1980s to over 267,000 in 1999. And the enrolment rate in educationfor the age group 19-24 increased by 60 per cent during the period. In 1999, itstood at 35.2 per cent.
25
Figure 14: Changes in gross enrolment by upper secondary and tertiary education(1989=100)
Source: Appendix Table 10.
The rise in tertiary enrolment can be explained by a rise in both thedemand for and the supply of university education. On the demand side, andin the context of high youth unemployment, there was the desire of youngpeople to postpone their entry to the labour market and to increase theirchances of finding a good job. On the supply side, the number of studentsincreased not only because of the emergence of new private universities, butalso because state universities were allowed to admit students on a paid basisin addition to the limited number of those who were traditionally admittedfree of charge after they had passed a competitive examination.
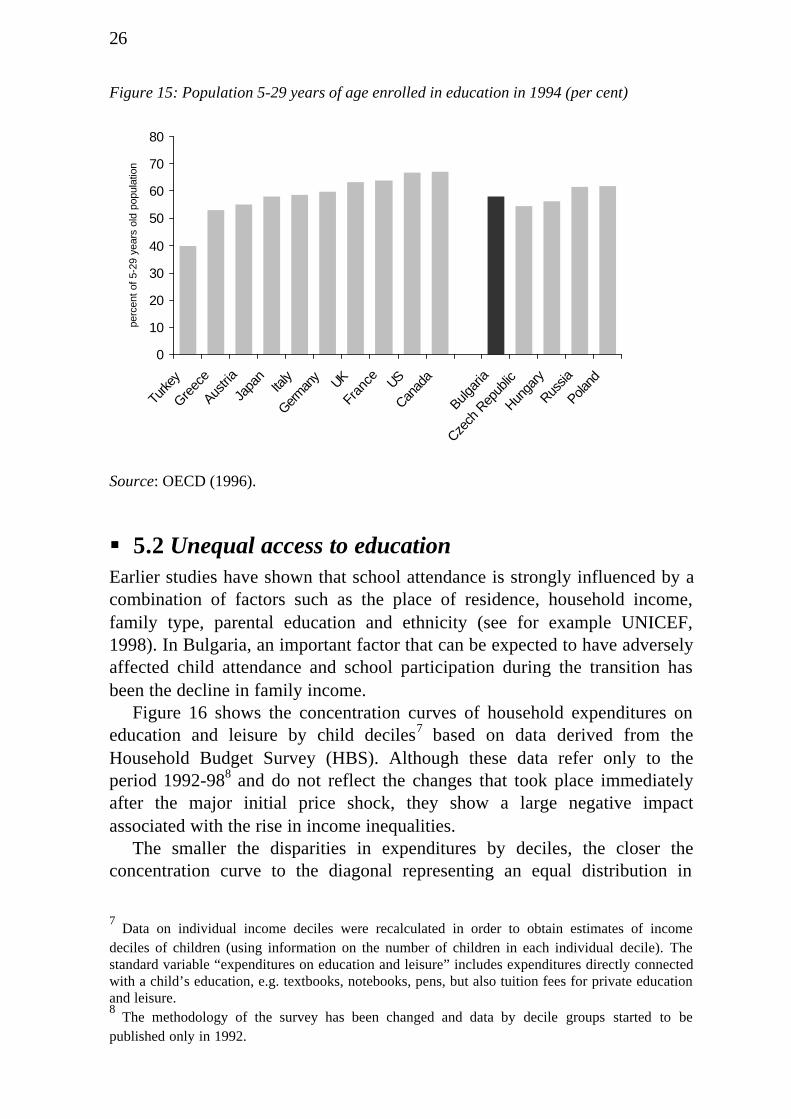
It is interesting to compare the enrolment in education in Bulgaria withother countries. Figure 15 shows the enrolment rates in education for the agegroup 5-29 based on an international survey carried out in 1994 in severalOECD and non-OECD countries.
In the mid 1990s, the enrolment rates in Bulgaria were behind thoseobserved in the United States, Canada, and most of the EU countries, similarto those of Japan, and higher than those of the Czech Republic and Hungary.
80
100
120
140
160
180
1989
/90
1990
/91
1991
/92
1992
/93
1993
/94
1994
/95
1995
/96
1996
/97
1997
/98
1998
/99
Upper secondary Tertiary
26
Figure 15: Population 5-29 years of age enrolled in education in 1994 (per cent)
Source: OECD (1996).
§ 5.2 Unequal access to educationEarlier studies have shown that school attendance is strongly influenced by acombination of factors such as the place of residence, household income,family type, parental education and ethnicity (see for example UNICEF,1998). In Bulgaria, an important factor that can be expected to have adverselyaffected child attendance and school participation during the transition hasbeen the decline in family income.
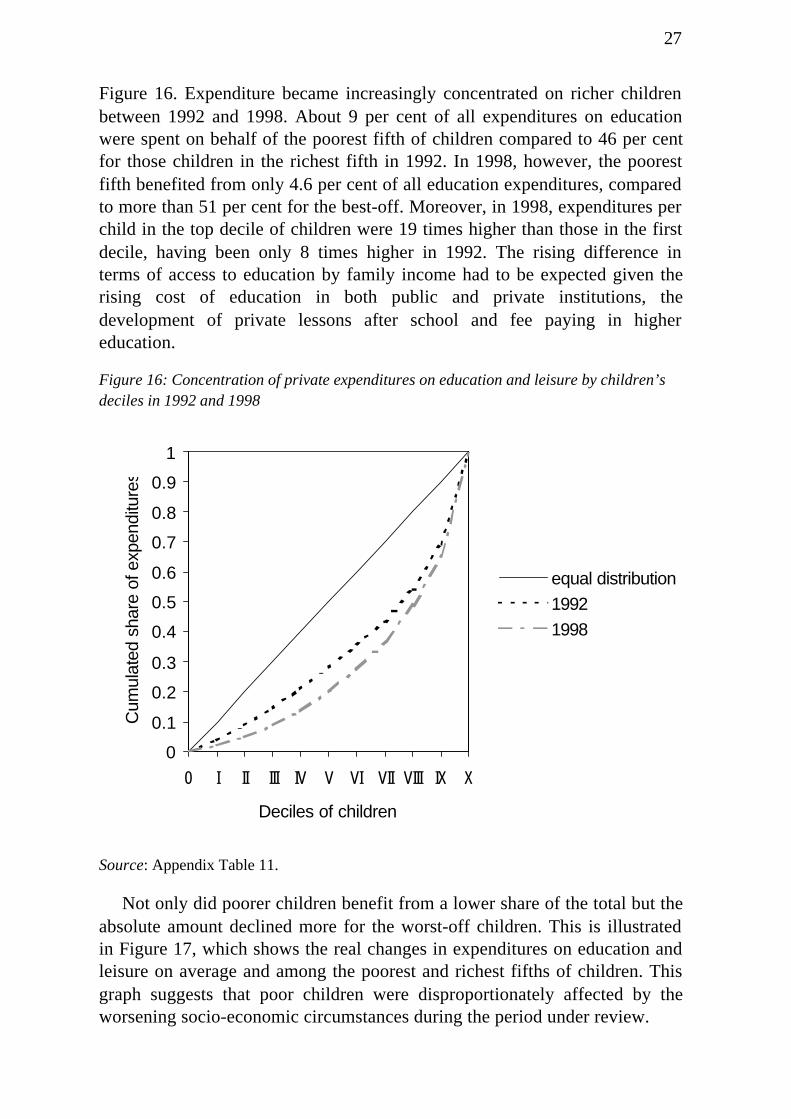
Figure 16 shows the concentration curves of household expenditures oneducation and leisure by child deciles7 based on data derived from theHousehold Budget Survey (HBS). Although these data refer only to theperiod 1992-988 and do not reflect the changes that took place immediatelyafter the major initial price shock, they show a large negative impactassociated with the rise in income inequalities.
The smaller the disparities in expenditures by deciles, the closer theconcentration curve to the diagonal representing an equal distribution in
7 Data on individual income deciles were recalculated in order to obtain estimates of income
deciles of children (using information on the number of children in each individual decile). Thestandard variable “expenditures on education and leisure” includes expenditures directly connectedwith a child’s education, e.g. textbooks, notebooks, pens, but also tuition fees for private educationand leisure.8 The methodology of the survey has been changed and data by decile groups started to be
published only in 1992.
0
10
20
30
40
50
60
70
80Tu
rkey
Greec
eAus
tria
Japa
nIta
lyGer
many UK
Franc
e
USCan
ada
Bulgar
ia
Czech
Rep
ublic
Hunga
ryRus
siaPola
nd
perc
ent
of 5
-29
year
s ol
d po
pula
tion
27
Figure 16. Expenditure became increasingly concentrated on richer childrenbetween 1992 and 1998. About 9 per cent of all expenditures on educationwere spent on behalf of the poorest fifth of children compared to 46 per centfor those children in the richest fifth in 1992. In 1998, however, the poorestfifth benefited from only 4.6 per cent of all education expenditures, comparedto more than 51 per cent for the best-off. Moreover, in 1998, expenditures perchild in the top decile of children were 19 times higher than those in the firstdecile, having been only 8 times higher in 1992. The rising difference interms of access to education by family income had to be expected given therising cost of education in both public and private institutions, thedevelopment of private lessons after school and fee paying in highereducation.
Figure 16: Concentration of private expenditures on education and leisure by children’sdeciles in 1992 and 1998
Source: Appendix Table 11.
Not only did poorer children benefit from a lower share of the total but theabsolute amount declined more for the worst-off children. This is illustratedin Figure 17, which shows the real changes in expenditures on education andleisure on average and among the poorest and richest fifths of children. Thisgraph suggests that poor children were disproportionately affected by theworsening socio-economic circumstances during the period under review.
0
0.1
0.2
0.3
0.4
0.5
0.6
0.7
0.8
0.9
1
0 I II III IV V VI VII VIII IX X
Deciles of children
Cum
ulat
ed s
hare
of e
xpen
ditu
res
equal distribution
1992
1998
28
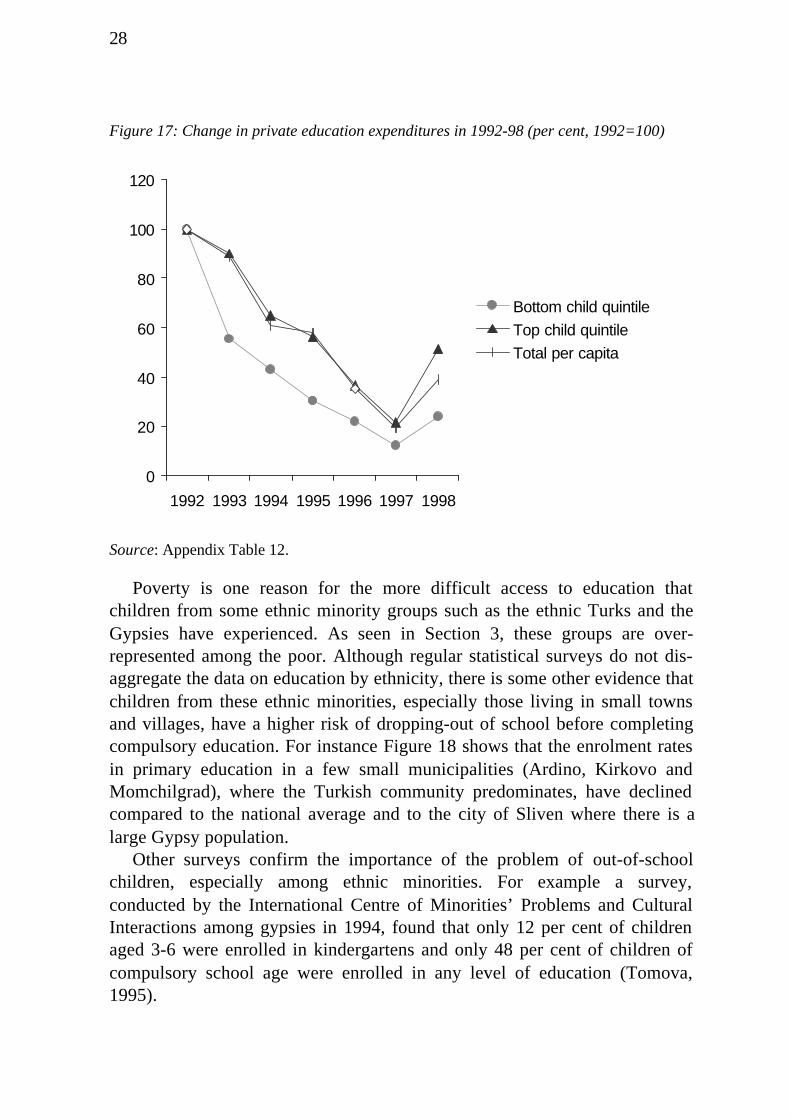
Figure 17: Change in private education expenditures in 1992-98 (per cent, 1992=100)
Source: Appendix Table 12.
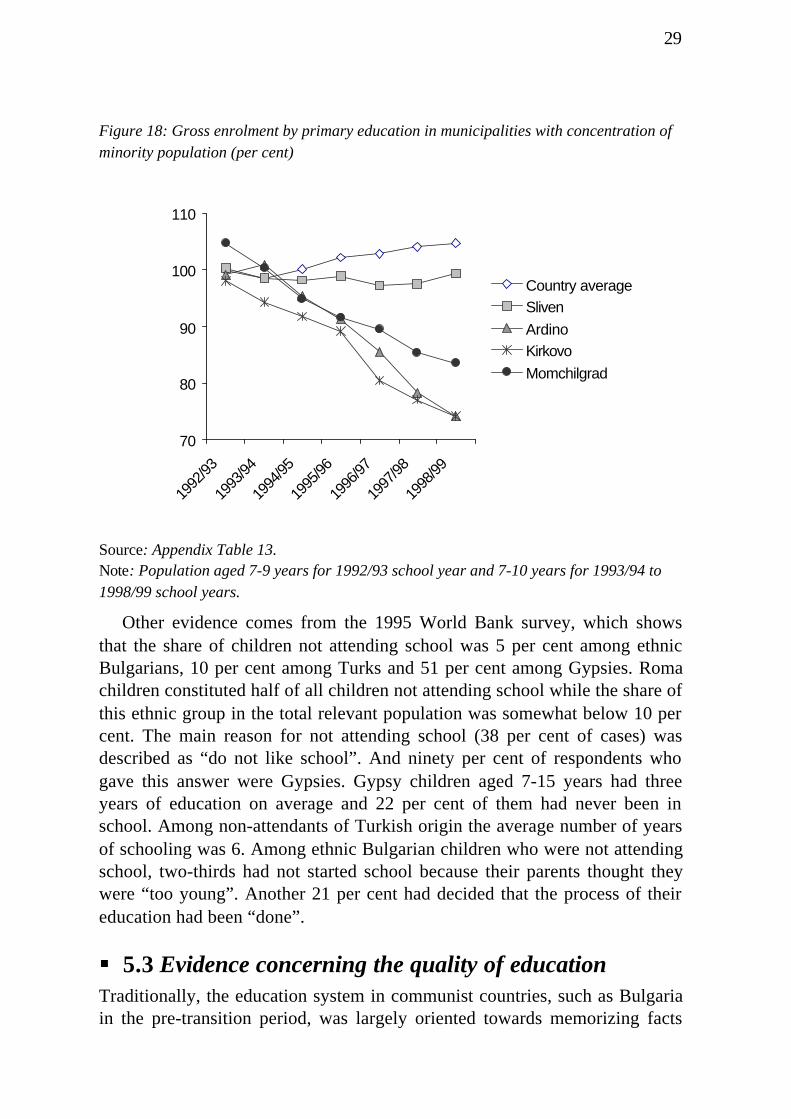
Poverty is one reason for the more difficult access to education thatchildren from some ethnic minority groups such as the ethnic Turks and theGypsies have experienced. As seen in Section 3, these groups are over-represented among the poor. Although regular statistical surveys do not dis-aggregate the data on education by ethnicity, there is some other evidence thatchildren from these ethnic minorities, especially those living in small townsand villages, have a higher risk of dropping-out of school before completingcompulsory education. For instance Figure 18 shows that the enrolment ratesin primary education in a few small municipalities (Ardino, Kirkovo andMomchilgrad), where the Turkish community predominates, have declinedcompared to the national average and to the city of Sliven where there is alarge Gypsy population.
Other surveys confirm the importance of the problem of out-of-schoolchildren, especially among ethnic minorities. For example a survey,conducted by the International Centre of Minorities’ Problems and CulturalInteractions among gypsies in 1994, found that only 12 per cent of childrenaged 3-6 were enrolled in kindergartens and only 48 per cent of children ofcompulsory school age were enrolled in any level of education (Tomova,1995).
0
20
40
60
80
100
120
1992 1993 1994 1995 1996 1997 1998
Bottom child quintile
Top child quintile
Total per capita
29
Figure 18: Gross enrolment by primary education in municipalities with concentration ofminority population (per cent)
Source: Appendix Table 13.Note: Population aged 7-9 years for 1992/93 school year and 7-10 years for 1993/94 to1998/99 school years.
Other evidence comes from the 1995 World Bank survey, which showsthat the share of children not attending school was 5 per cent among ethnicBulgarians, 10 per cent among Turks and 51 per cent among Gypsies. Romachildren constituted half of all children not attending school while the share ofthis ethnic group in the total relevant population was somewhat below 10 percent. The main reason for not attending school (38 per cent of cases) wasdescribed as “do not like school”. And ninety per cent of respondents whogave this answer were Gypsies. Gypsy children aged 7-15 years had threeyears of education on average and 22 per cent of them had never been inschool. Among non-attendants of Turkish origin the average number of yearsof schooling was 6. Among ethnic Bulgarian children who were not attendingschool, two-thirds had not started school because their parents thought theywere “too young”. Another 21 per cent had decided that the process of theireducation had been “done”.
§ 5.3 Evidence concerning the quality of educationTraditionally, the education system in communist countries, such as Bulgariain the pre-transition period, was largely oriented towards memorizing facts
70
80
90
100
110
1992
/93
1993
/94
1994
/95
1995
/96
1996
/97
1997
/98
1998
/99
Country averageSliven
ArdinoKirkovo
Momchilgrad

30
with little place given to the development of general life skills. With thecollapse of the old regime, Bulgaria has engaged in a move towardsenhancing broader skills that are generally seen as more appropriate for amarket economy. The attitude of parents towards education is also changing,at least according to a number of sociological surveys (Parapulska, 1998).
In the context of rising competition in the labour market, the role ofeducation is becoming more and more important. In order to increase theirchance of finding a good job, many young people are trying to remain ineducation longer. However, faced with the worsening of teaching in publicschools, there is some evidence that the necessity to take private lessons inorder to succeed is gaining importance. This has an adverse impact on poorchildren who do not have the means to finance the access to this informaleducation system.
Despite the rising difficulties experienced by Bulgarian children, there issome evidence that Bulgarian students were doing quite well at school. This,at least, is what emerged from the results of the Third InternationalMathematics and Science Study (TIMSS) carried out in 1994 by theInternational Association for the Evaluation of Educational Achievements in41 countries, including Bulgaria. According to this survey, Bulgarian childrenaged 13 and 14 years who were studying in 7th and 8th grades showed highachievement rates in mathematics and science. For instance, in mathematicsBulgarian children stood at the eighth position for those in 7th grade and ineleventh position for those in 8th grade.
Notwithstanding the good results for average achievement, Bulgariashowed one of the highest rates of dispersion in achievements. Unfortunatelythe background data submitted were not deemed internationally comparableand were not included in the international TIMSS database. Hence there areno data about variables such as household size, income, number ofemployed/unemployed, urban/rural location, ethnicity, parental education etc.Thus which children performed badly and which children performed wellcannot be identified – an issue that obviously needs further investigation.
The recent TIMSS-repeat, carried out in 1999 showed, however, that therelative position of Bulgarian students worsened over time. Eighth gradestudents were ranked seventeenth in both mathematics and science. They,together with their peers from the Czech Republic, also showed significantworsening of the absolute scores in the two fields.
6. Children at Special RiskGrowing up healthy and surrounded by a warm family environment is crucialfor child development. A number of factors, however, put children at specialrisk. In Section 4, we saw the negative impact on children’s health of teenage

31
births and births to unmarried women. Those children with very young orsingle mothers are also disproportionately more exposed to the risk ofplacement in public institutions, the latter still being the main alternative forfamily care, with all the negative consequences for their physical andemotional development. The aim of this section is to evaluate these riskfactors by examining trends in teenage births and births to unmarried womenand by looking at the extent of child institutionalization.
§ 6.1 Teenage birth rateOne major problem of teenage birth, as seen earlier, is that teenagemotherhood in Bulgaria appears as a correlate of low-weight births, the latterbeing associated with higher infant mortality. Available data show that at thestart of the transition Bulgaria stood in first position among CEE countries interms of teenage fertility. In 1989, the birth rate among 15-19 year old womenwas over 75 per 1000 women in Bulgaria, compared with 45 per 1000 inCentral European countries and 63 in the former Soviet Union. In establishedmarket economies, the figure was far lower, with an EU average teenage birthrate of 16 per 1000 women. The high teenage fertility in Bulgaria is evenmore striking given that it was not associated with higher overall fertility –the total fertility rates in the above-mentioned countries were the same oreven higher than that of Bulgaria.
The immediate reaction of women in the most active reproductive age (20-29 years of age) to the deep impoverishment at the beginning of the transitionwas to delay having children and to plan their first and often their only childfor later. In ten years fertility among women aged 20-24 years more thanhalved and that of 25-29 years old decreased by a third. Teenage fertility alsofell substantially but constitutes a significant share of all childbirth. In the late1990s the birth rate of women aged 15-19 stood at 45 per 1000 and the shareof children born to them represented 20 per cent of all new-borns.
Looking at birth rates by exact age among the teenage years confirms thatteenage birth remains a problem in Bulgaria. For instance, in 1998, theteenage birth rates were respectively 5.4 per 1000 among women aged 14, 15per 1000 among those aged 15, 28 per 1000 among those aged 16, and over40 per 1000 among women aged 17. And although these rates have tended todecrease in the past ten years, they remained far higher than in establishedmarket economies. For instance, in 1994, the average birth rate among 16year-old girls was 5.3 per 1000 in the EU, compared with 36.8 in the sameyear in Bulgaria (Micklewright and Stewart, 1999).
32
§ 6.2 Children born to unmarried womenWhile the overall number of births has declined substantially during thetransition in Bulgaria, there was a large increase in the share of children bornout of marriage, almost tripling in only ten years. To some extent, the rise inout-of-marriage births was observed in all countries from the CEE/CISregion, especially in the Baltic States. More specific to Bulgaria, however, isthat a predominant share of children born out of marriage belong to the lowestincome groups. And contrary to many established economies, wherecohabiting is widespread, in Bulgaria out-of-marriage birth generally meansliving in an incomplete family with a higher risk of the child being placed inpublic institution.9
A number of studies have drawn attention to the welfare disadvantageexperienced by single-parent families (see for instance Klugman and Kolev,2000, for the case of Russia). In Bulgaria, the 1995 World Bank survey foundthat more than 26 per cent of single-parent families (almost exclusivelyheaded by single women) were poor, compared with 19 per cent for marriedcouples with children (ILO, UNDP, 1998a). To some extent, children bornout-of-wedlock suffer similar disadvantage to children with very youngmothers. They tend to suffer disproportionately from under nutrition andineffective food balance, with long-term negative effects on their health, andhave a higher risk of being placed in institutions.
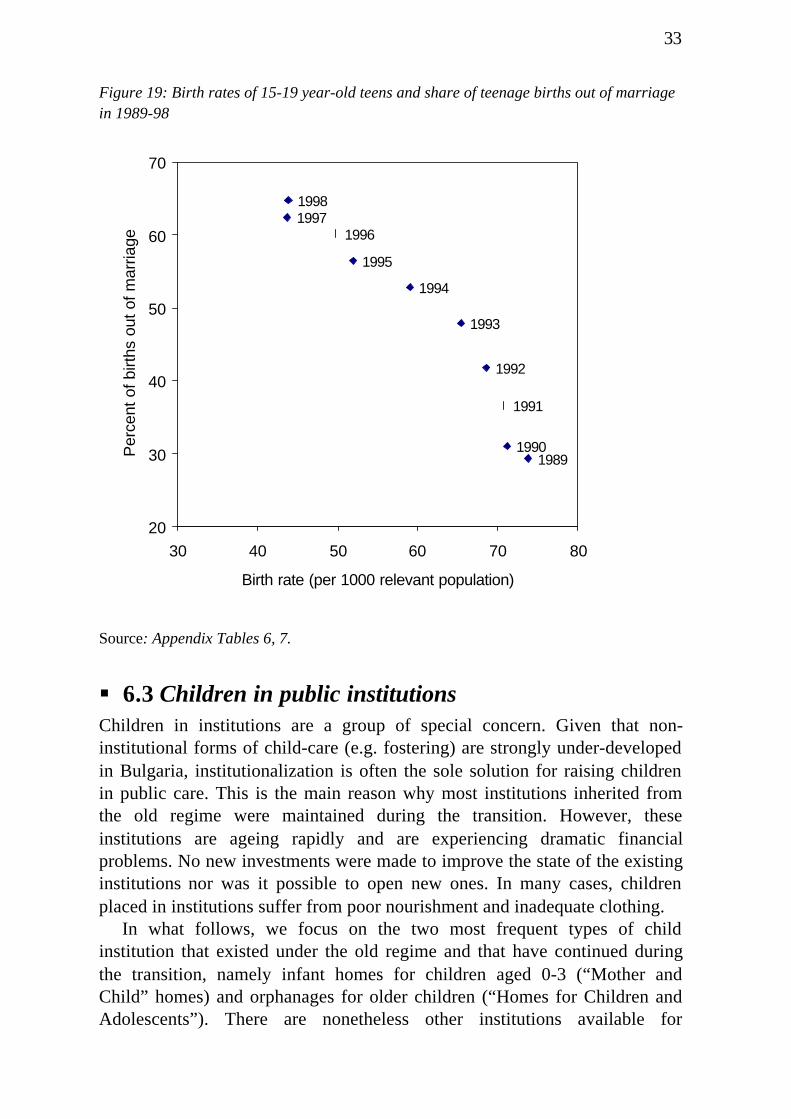
Figure 19 shows the trends in teenage births and its changing pattern overthe transition. Although on the decrease, teenage birth rates remained high inthe international perspective. Moreover, there was an increase in the numberand the share of out-of-marriage births among teenage mothers. In 1989children born to teenage mothers out of wedlock constituted about 30 per centof all births in this age group. Ten years after, their share had more thandoubled.
9 Evidence suggests, nonetheless, that cohabiting was known in Bulgaria among Gypsies even in
the pre-transition period. According to a survey carried out in 1992 (see UNICEF NationalCommittee, 1992) about one third of births out of marriage were to women of Gypsy origin, whoactually lived with their partners. A more recent study suggests (Tomova, 1995) that sexual activityamong Gypsies starts earlier (in 73 per cent of cases, before 15 years of age) than among ethnicBulgarians, Turks and young people of other ethnic origin. Considering that births of unmarriedwomen are over-represented among Gypsy women, one may assume that many of their childrenlive, in fact, with two parents. However, these children remain at a higher risk of being placed ininstitutions, mostly for economic reasons.
33
Figure 19: Birth rates of 15-19 year-old teens and share of teenage births out of marriagein 1989-98
Source: Appendix Tables 6, 7.
§ 6.3 Children in public institutionsChildren in institutions are a group of special concern. Given that non-institutional forms of child-care (e.g. fostering) are strongly under-developedin Bulgaria, institutionalization is often the sole solution for raising childrenin public care. This is the main reason why most institutions inherited fromthe old regime were maintained during the transition. However, theseinstitutions are ageing rapidly and are experiencing dramatic financialproblems. No new investments were made to improve the state of the existinginstitutions nor was it possible to open new ones. In many cases, childrenplaced in institutions suffer from poor nourishment and inadequate clothing.
In what follows, we focus on the two most frequent types of childinstitution that existed under the old regime and that have continued duringthe transition, namely infant homes for children aged 0-3 (“Mother andChild” homes) and orphanages for older children (“Homes for Children andAdolescents”). There are nonetheless other institutions available for
19981997
1996
1995
1994
1993
1992
19891990
1991
20
30
40
50
60
70
30 40 50 60 70 80
Birth rate (per 1000 relevant population)
Per
cent
of
birt
hs o
ut o
f m
arria
ge

34
physically and mentally disabled children and children in conflict with thelaw. Although these are not investigated here, they raise specific problemsand would need special attention.
As shown in Figure 20, Bulgaria is the country with the highest rate ofchildren in infant homes among all CEE/CIS and Baltic countries. In 1998about 3600 children aged 0-3 years lived in infant homes, more than one percent of the total number of children of that age.
Figure 20: Rates of infants in public institutions in 1998 (per hundred thousand 0-3 year-old population)
Source: MONEE Project database.Notes: Data for Slovenia refer to 1995, for Poland to 1993, for Slovakia to 1996. Data forEstonia refer to children aged 0-7 years in 1997.
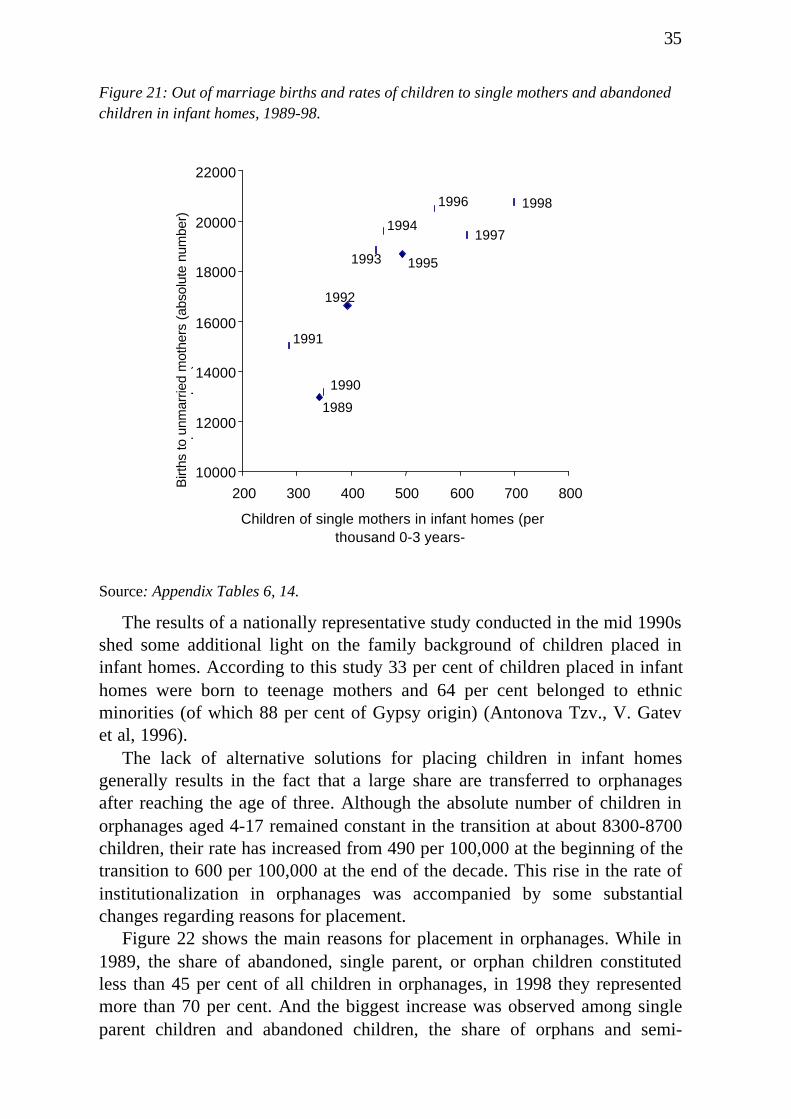
A large share of these institutionalized children comes from single parentfamilies. As seen in Figure 21, the number of children of unmarried mothersand abandoned children in public institutions increased over time. Theassociation between the increasing number of out-of-marriage births and theincreasing rate of placement in institutions is clearly suggestive of the higherrisk of institutionalization among single parent children and abandonedchildren. Still, the majority of children born to unmarried mothers is growingup in families, and not in institutions. More attention to and support for thesechildren is needed.
24
193261 273 324 379
572
836
997
1300
0
200
400
600
800
1000
1200
1400
Sloven
ia
Poland
Estonia
Slovak
ia
Lithu
ania
Hunga
ry
Czech
Rep
ublic
Roman
iaLa
tvia
Bulgari
a
35
Figure 21: Out of marriage births and rates of children to single mothers and abandonedchildren in infant homes, 1989-98.
Source: Appendix Tables 6, 14.
The results of a nationally representative study conducted in the mid 1990sshed some additional light on the family background of children placed ininfant homes. According to this study 33 per cent of children placed in infanthomes were born to teenage mothers and 64 per cent belonged to ethnicminorities (of which 88 per cent of Gypsy origin) (Antonova Tzv., V. Gatevet al, 1996).
The lack of alternative solutions for placing children in infant homesgenerally results in the fact that a large share are transferred to orphanagesafter reaching the age of three. Although the absolute number of children inorphanages aged 4-17 remained constant in the transition at about 8300-8700children, their rate has increased from 490 per 100,000 at the beginning of thetransition to 600 per 100,000 at the end of the decade. This rise in the rate ofinstitutionalization in orphanages was accompanied by some substantialchanges regarding reasons for placement.
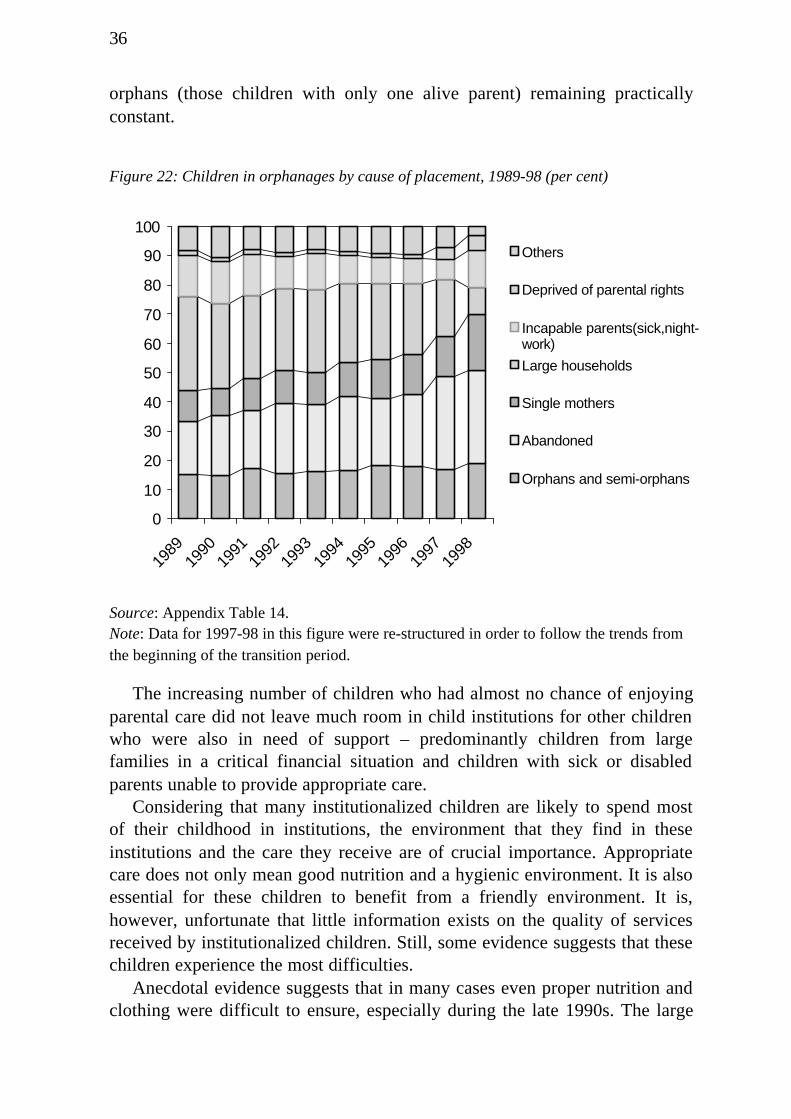
Figure 22 shows the main reasons for placement in orphanages. While in1989, the share of abandoned, single parent, or orphan children constitutedless than 45 per cent of all children in orphanages, in 1998 they representedmore than 70 per cent. And the biggest increase was observed among singleparent children and abandoned children, the share of orphans and semi-
1990
1989
1991
1992
1993
1994
1995
1996
1997
1998
10000
12000
14000
16000
18000
20000
22000
200 300 400 500 600 700 800
Children of single mothers in infant homes (perhundred thousand 0-3 years-
old)
Birt
hs to
unm
arrie
d m
othe
rs (
abso
lute
num
ber)
nnnn
umbe
rnum
bers
)
36
orphans (those children with only one alive parent) remaining practicallyconstant.
Figure 22: Children in orphanages by cause of placement, 1989-98 (per cent)
Source: Appendix Table 14.Note: Data for 1997-98 in this figure were re-structured in order to follow the trends fromthe beginning of the transition period.
The increasing number of children who had almost no chance of enjoyingparental care did not leave much room in child institutions for other childrenwho were also in need of support – predominantly children from largefamilies in a critical financial situation and children with sick or disabledparents unable to provide appropriate care.
Considering that many institutionalized children are likely to spend mostof their childhood in institutions, the environment that they find in theseinstitutions and the care they receive are of crucial importance. Appropriatecare does not only mean good nutrition and a hygienic environment. It is alsoessential for these children to benefit from a friendly environment. It is,however, unfortunate that little information exists on the quality of servicesreceived by institutionalized children. Still, some evidence suggests that thesechildren experience the most difficulties.
Anecdotal evidence suggests that in many cases even proper nutrition andclothing were difficult to ensure, especially during the late 1990s. The large
0
10
20
30
40
50
60
70
80
90
100
1989
1990
1991
1992
1993
1994
1995
1996
1997
1998
Others
Deprived of parental rights
Incapable parents(sick,night-work)
Large households
Single mothers
Abandoned
Orphans and semi-orphans
37
fall in social expenditures has been particularly harmful for child institutions,and the withdrawal of the State has not entirely been taken over by NGOs.
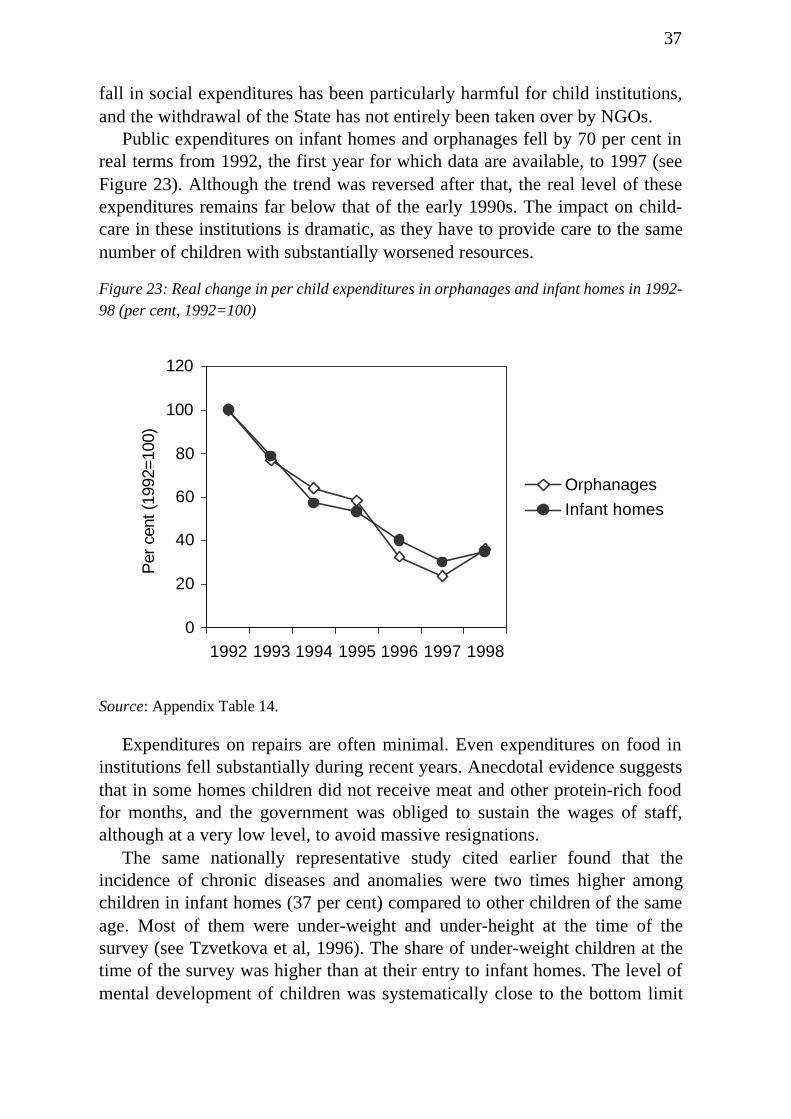
Public expenditures on infant homes and orphanages fell by 70 per cent inreal terms from 1992, the first year for which data are available, to 1997 (seeFigure 23). Although the trend was reversed after that, the real level of theseexpenditures remains far below that of the early 1990s. The impact on child-care in these institutions is dramatic, as they have to provide care to the samenumber of children with substantially worsened resources.
Figure 23: Real change in per child expenditures in orphanages and infant homes in 1992-98 (per cent, 1992=100)
Source: Appendix Table 14.
Expenditures on repairs are often minimal. Even expenditures on food ininstitutions fell substantially during recent years. Anecdotal evidence suggeststhat in some homes children did not receive meat and other protein-rich foodfor months, and the government was obliged to sustain the wages of staff,although at a very low level, to avoid massive resignations.
The same nationally representative study cited earlier found that theincidence of chronic diseases and anomalies were two times higher amongchildren in infant homes (37 per cent) compared to other children of the sameage. Most of them were under-weight and under-height at the time of thesurvey (see Tzvetkova et al, 1996). The share of under-weight children at thetime of the survey was higher than at their entry to infant homes. The level ofmental development of children was systematically close to the bottom limit
0
20
40
60
80
100
120
1992 1993 1994 1995 1996 1997 1998
Per
cen
t (19
92=1
00)
Orphanages
Infant homes
38
of the normal range and the share of retarded children was found to be higherin institutions than elsewhere.
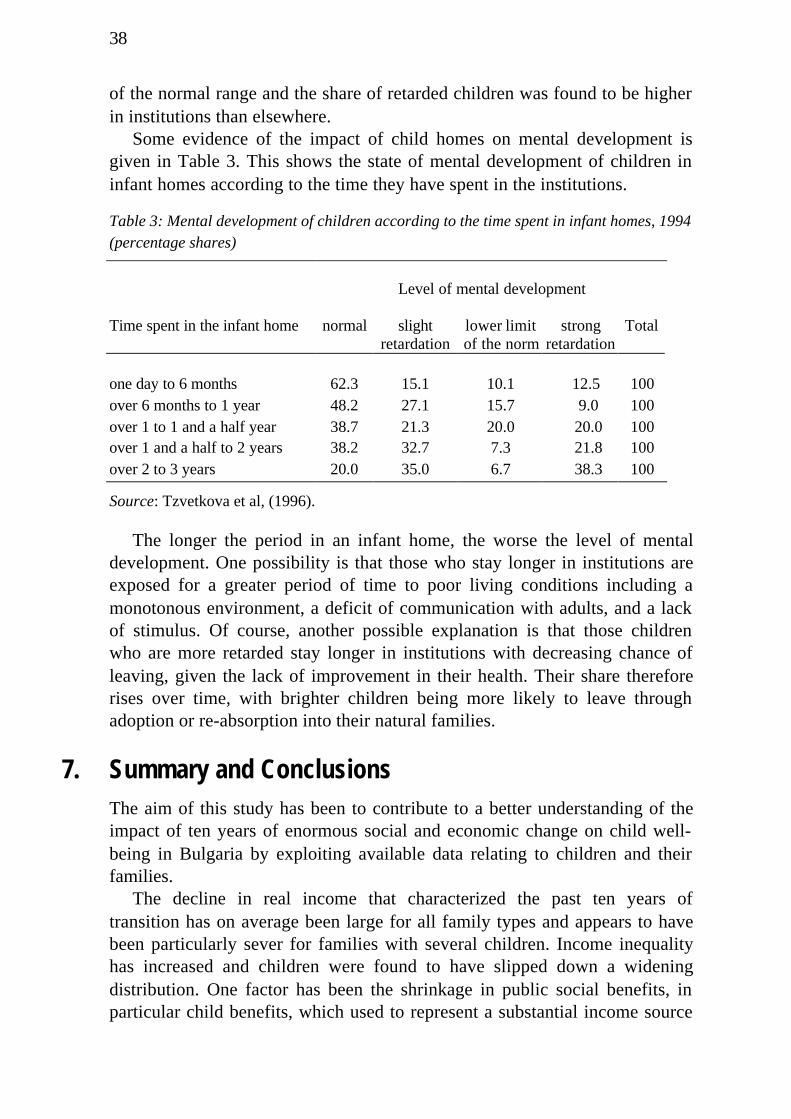
Some evidence of the impact of child homes on mental development isgiven in Table 3. This shows the state of mental development of children ininfant homes according to the time they have spent in the institutions.
Table 3: Mental development of children according to the time spent in infant homes, 1994(percentage shares)
Level of mental development
Time spent in the infant home normal slightretardation
lower limitof the norm
strongretardation
Total
one day to 6 months 62.3 15.1 10.1 12.5 100over 6 months to 1 year 48.2 27.1 15.7 9.0 100over 1 to 1 and a half year 38.7 21.3 20.0 20.0 100over 1 and a half to 2 years 38.2 32.7 7.3 21.8 100over 2 to 3 years 20.0 35.0 6.7 38.3 100
Source: Tzvetkova et al, (1996).
The longer the period in an infant home, the worse the level of mentaldevelopment. One possibility is that those who stay longer in institutions areexposed for a greater period of time to poor living conditions including amonotonous environment, a deficit of communication with adults, and a lackof stimulus. Of course, another possible explanation is that those childrenwho are more retarded stay longer in institutions with decreasing chance ofleaving, given the lack of improvement in their health. Their share thereforerises over time, with brighter children being more likely to leave throughadoption or re-absorption into their natural families.
7. Summary and ConclusionsThe aim of this study has been to contribute to a better understanding of theimpact of ten years of enormous social and economic change on child well-being in Bulgaria by exploiting available data relating to children and theirfamilies.
The decline in real income that characterized the past ten years oftransition has on average been large for all family types and appears to havebeen particularly sever for families with several children. Income inequalityhas increased and children were found to have slipped down a wideningdistribution. One factor has been the shrinkage in public social benefits, inparticular child benefits, which used to represent a substantial income source

39
for families with children. The fall in income has translated into a sharpdeterioration of nutrition. By 1998 the daily per capita calorie intake averagedless than 2,500 calories in all household types with children.
The deterioration in child economic well-being was accompanied by aworsening in some measured aspects of children’s health. Infant mortalitystopped falling during the 1990s and child mortality, especially disease-related, remained at a high level. The incidence of several severe illnessesrose. The cost of health care is often reported by families as a reason for notseeking medical help for children.
The impact on education was mixed. After the initial shock, the enrolmentrate in pre-school education almost reached its pre-transition level in the late1990s. There was a decline in the enrolment rate in compulsory basiceducation, partly due to an increase in early school drop-out, although itseems that the changes are in part a statistical artefact. The picture for tertiaryeducation is somehow different, as increasing numbers of young Bulgarianswere studying at university in the hope of finding a good job more easily. It isa matter of concern that access to education is becoming more difficult for thepoorest members of the society. This is due to the rising private costs ofeducation. Changes in the quality of education remain unclear.
The final part of this study focused on children at special risk – those withvery young or single mothers and those placed in institutions. The resultsshowed that although teenage fertility fell in the 1990s, it is still high inBulgaria and the share of births to unmarried mothers rose dramatically.Bulgaria comes in first place in terms of placement in infant homes among allCEE countries and the rate of children placed in orphanages has also tendedto increase during the transition. This is consistent with the finding that alarge share of institutionalized children were born to very young or singlemothers. At the same time, the sharp deterioration of living conditions ininfant homes and orphanages during the transition raises obvious concernsabout the capacity of these institutions to fulfil their social role and topromote the development of vulnerable children.
What, then, can be the scope for Bulgarian policy makers to better protectthe fate of the country’s children? Our feeling is that although the resourcesof the government are very limited, a lot can be done. First, the Bulgarianauthorities, with the help of international organizations and NGOs, shouldpromote the development of more research on child welfare in order toidentify better the needs of children. The few public resources available couldthen be reallocated with priority to the most vulnerable groups.
Second, further information on the situation of children could be obtainedby a more extensive use of existing household data and by conducting, on aregular basis, new surveys with a strong focus on child-related issues. It isalso likely that the development of educational campaigns on sexual

40
behaviour and family planning, which are relatively cheap to carry out, wouldsubstantially reduce high risk births and the associated negative effects onchildren’s health and development.
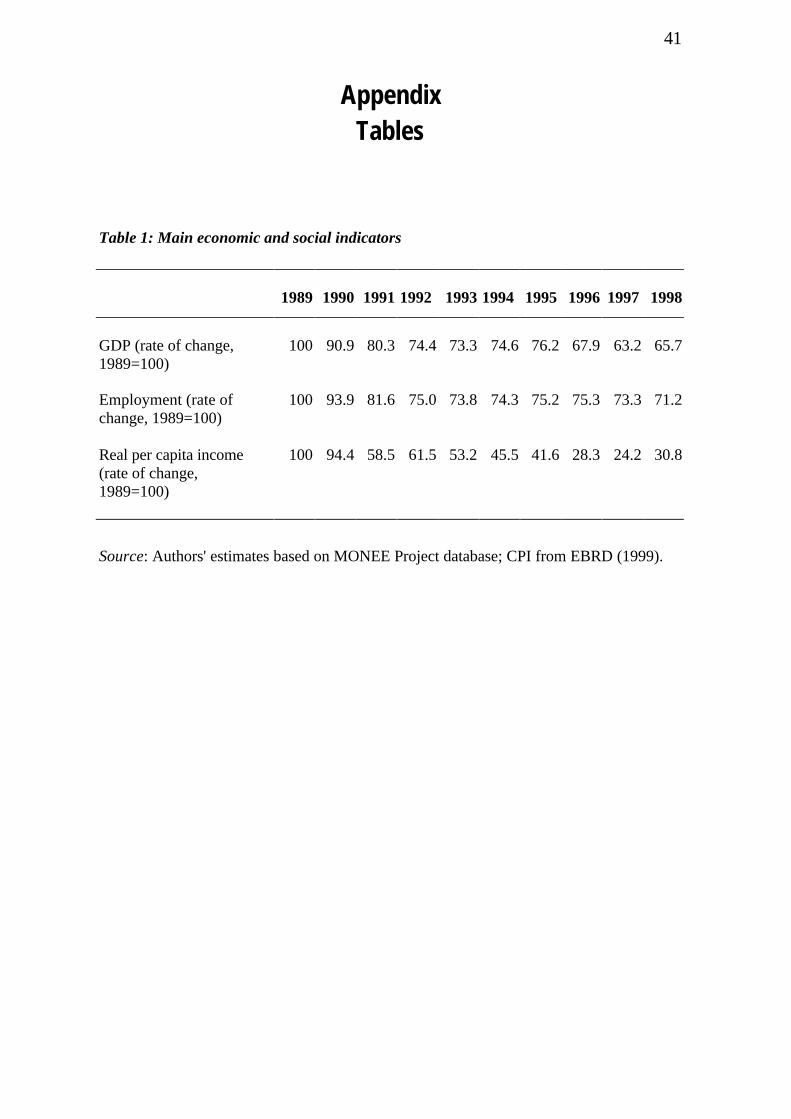
41
AppendixTables
Table 1: Main economic and social indicators
1989 1990 1991 1992 1993 1994 1995 1996 1997 1998
GDP (rate of change,1989=100)
100 90.9 80.3 74.4 73.3 74.6 76.2 67.9 63.2 65.7
Employment (rate ofchange, 1989=100)
100 93.9 81.6 75.0 73.8 74.3 75.2 75.3 73.3 71.2
Real per capita income(rate of change,1989=100)
100 94.4 58.5 61.5 53.2 45.5 41.6 28.3 24.2 30.8
Source: Authors' estimates based on MONEE Project database; CPI from EBRD (1999).
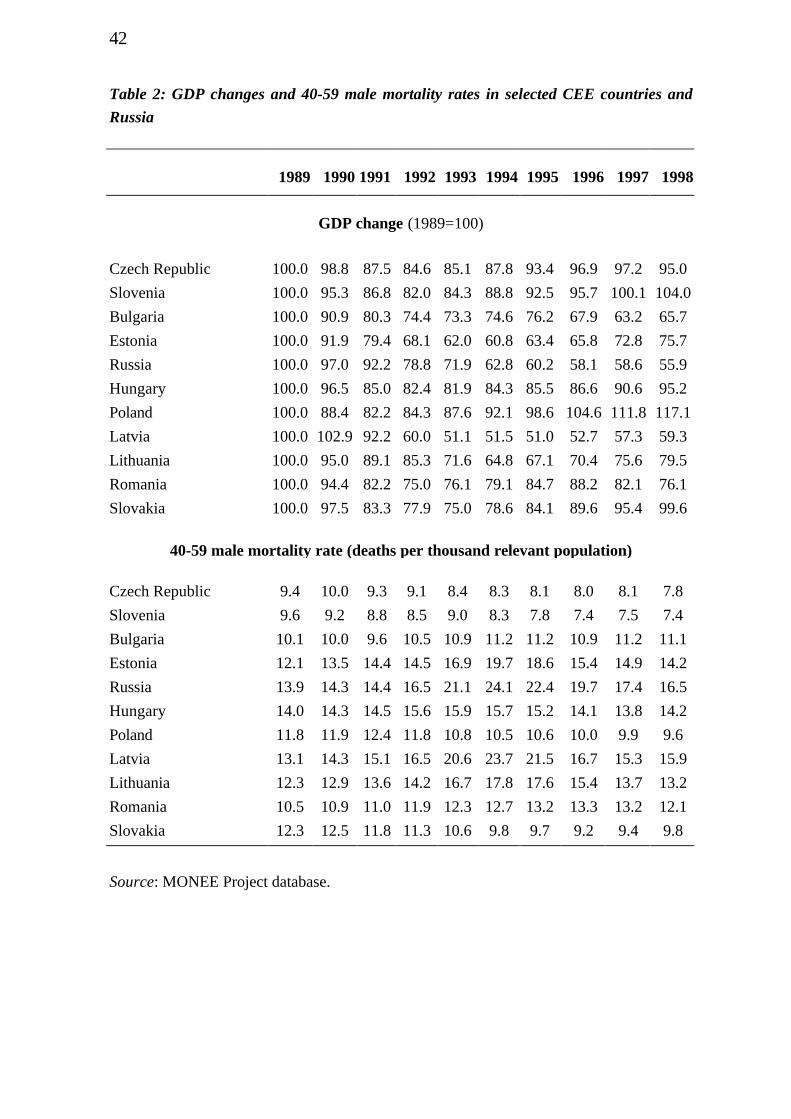
42
Table 2: GDP changes and 40-59 male mortality rates in selected CEE countries and
Russia
1989 1990 1991 1992 1993 1994 1995 1996 1997 1998
GDP change (1989=100)
Czech Republic 100.0 98.8 87.5 84.6 85.1 87.8 93.4 96.9 97.2 95.0
Slovenia 100.0 95.3 86.8 82.0 84.3 88.8 92.5 95.7 100.1 104.0
Bulgaria 100.0 90.9 80.3 74.4 73.3 74.6 76.2 67.9 63.2 65.7
Estonia 100.0 91.9 79.4 68.1 62.0 60.8 63.4 65.8 72.8 75.7
Russia 100.0 97.0 92.2 78.8 71.9 62.8 60.2 58.1 58.6 55.9
Hungary 100.0 96.5 85.0 82.4 81.9 84.3 85.5 86.6 90.6 95.2
Poland 100.0 88.4 82.2 84.3 87.6 92.1 98.6 104.6 111.8 117.1
Latvia 100.0 102.9 92.2 60.0 51.1 51.5 51.0 52.7 57.3 59.3
Lithuania 100.0 95.0 89.1 85.3 71.6 64.8 67.1 70.4 75.6 79.5
Romania 100.0 94.4 82.2 75.0 76.1 79.1 84.7 88.2 82.1 76.1
Slovakia 100.0 97.5 83.3 77.9 75.0 78.6 84.1 89.6 95.4 99.6
40-59 male mortality rate (deaths per thousand relevant population)
Czech Republic 9.4 10.0 9.3 9.1 8.4 8.3 8.1 8.0 8.1 7.8
Slovenia 9.6 9.2 8.8 8.5 9.0 8.3 7.8 7.4 7.5 7.4
Bulgaria 10.1 10.0 9.6 10.5 10.9 11.2 11.2 10.9 11.2 11.1
Estonia 12.1 13.5 14.4 14.5 16.9 19.7 18.6 15.4 14.9 14.2
Russia 13.9 14.3 14.4 16.5 21.1 24.1 22.4 19.7 17.4 16.5
Hungary 14.0 14.3 14.5 15.6 15.9 15.7 15.2 14.1 13.8 14.2
Poland 11.8 11.9 12.4 11.8 10.8 10.5 10.6 10.0 9.9 9.6
Latvia 13.1 14.3 15.1 16.5 20.6 23.7 21.5 16.7 15.3 15.9
Lithuania 12.3 12.9 13.6 14.2 16.7 17.8 17.6 15.4 13.7 13.2
Romania 10.5 10.9 11.0 11.9 12.3 12.7 13.2 13.3 13.2 12.1
Slovakia 12.3 12.5 11.8 11.3 10.6 9.8 9.7 9.2 9.4 9.8
Source: MONEE Project database.
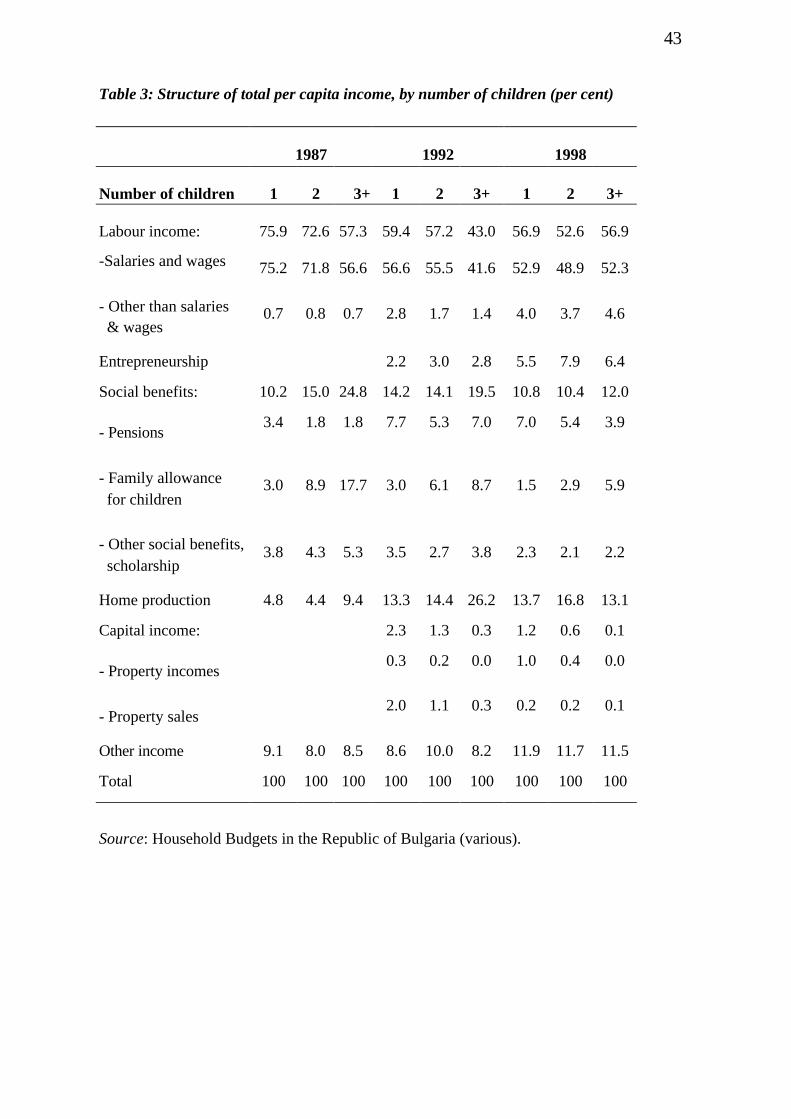
43
Table 3: Structure of total per capita income, by number of children (per cent)
1987 1992 1998
Number of children 1 2 3+ 1 2 3+ 1 2 3+
Labour income: 75.9 72.6 57.3 59.4 57.2 43.0 56.9 52.6 56.9
-Salaries and wages 75.2 71.8 56.6 56.6 55.5 41.6 52.9 48.9 52.3
- Other than salaries & wages
0.7 0.8 0.7 2.8 1.7 1.4 4.0 3.7 4.6
Entrepreneurship 2.2 3.0 2.8 5.5 7.9 6.4
Social benefits: 10.2 15.0 24.8 14.2 14.1 19.5 10.8 10.4 12.0
- Pensions3.4 1.8 1.8 7.7 5.3 7.0 7.0 5.4 3.9
- Family allowance for children
3.0 8.9 17.7 3.0 6.1 8.7 1.5 2.9 5.9
- Other social benefits, scholarship
3.8 4.3 5.3 3.5 2.7 3.8 2.3 2.1 2.2
Home production 4.8 4.4 9.4 13.3 14.4 26.2 13.7 16.8 13.1
Capital income: 2.3 1.3 0.3 1.2 0.6 0.1
- Property incomes0.3 0.2 0.0 1.0 0.4 0.0
- Property sales2.0 1.1 0.3 0.2 0.2 0.1
Other income 9.1 8.0 8.5 8.6 10.0 8.2 11.9 11.7 11.5
Total 100 100 100 100 100 100 100 100 100
Source: Household Budgets in the Republic of Bulgaria (various).
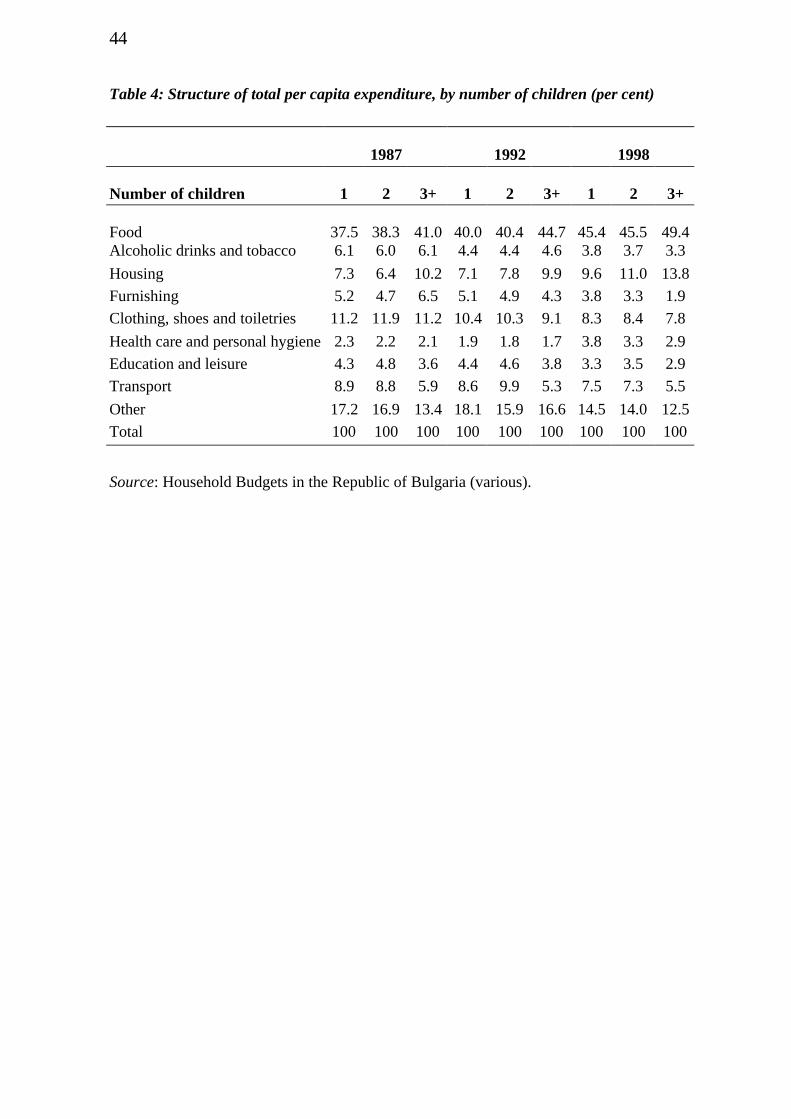
44
Table 4: Structure of total per capita expenditure, by number of children (per cent)
1987 1992 1998
Number of children 1 2 3+ 1 2 3+ 1 2 3+
Food 37.5 38.3 41.0 40.0 40.4 44.7 45.4 45.5 49.4Alcoholic drinks and tobacco 6.1 6.0 6.1 4.4 4.4 4.6 3.8 3.7 3.3
Housing 7.3 6.4 10.2 7.1 7.8 9.9 9.6 11.0 13.8
Furnishing 5.2 4.7 6.5 5.1 4.9 4.3 3.8 3.3 1.9
Clothing, shoes and toiletries 11.2 11.9 11.2 10.4 10.3 9.1 8.3 8.4 7.8
Health care and personal hygiene 2.3 2.2 2.1 1.9 1.8 1.7 3.8 3.3 2.9
Education and leisure 4.3 4.8 3.6 4.4 4.6 3.8 3.3 3.5 2.9
Transport 8.9 8.8 5.9 8.6 9.9 5.3 7.5 7.3 5.5
Other 17.2 16.9 13.4 18.1 15.9 16.6 14.5 14.0 12.5
Total 100 100 100 100 100 100 100 100 100
Source: Household Budgets in the Republic of Bulgaria (various).
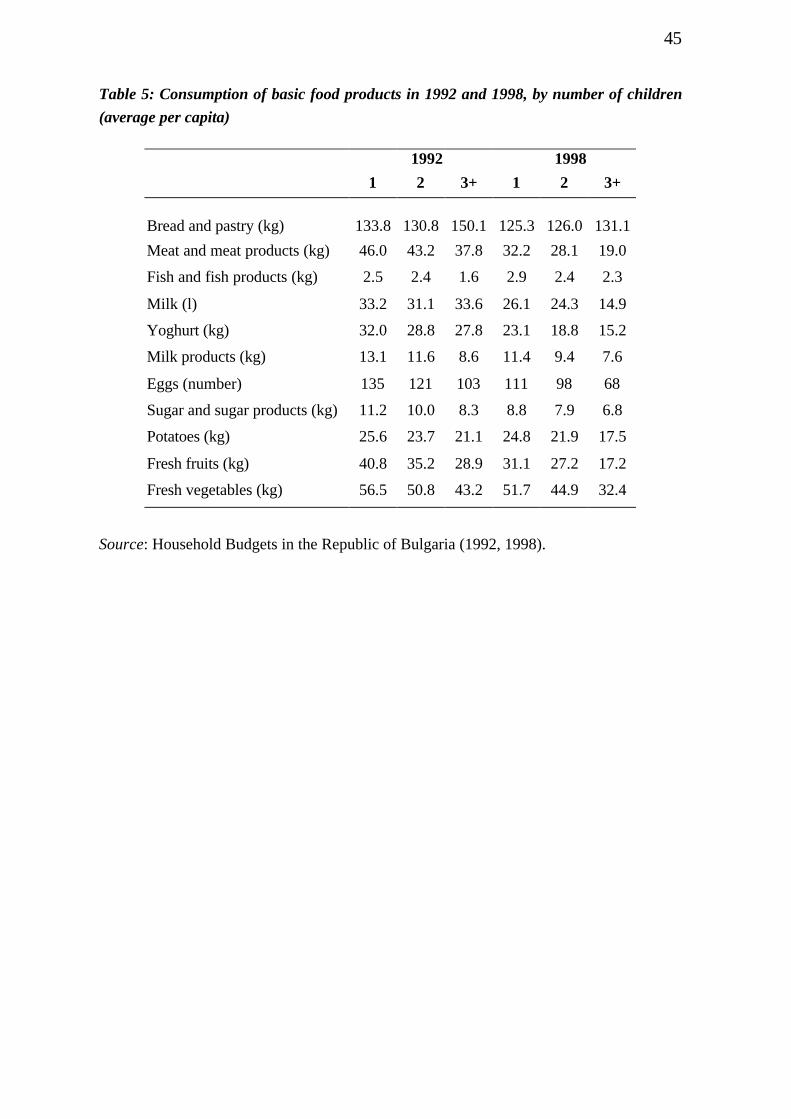
45
Table 5: Consumption of basic food products in 1992 and 1998, by number of children
(average per capita)
1992 1998
1 2 3+ 1 2 3+
Bread and pastry (kg) 133.8 130.8 150.1 125.3 126.0 131.1
Meat and meat products (kg) 46.0 43.2 37.8 32.2 28.1 19.0
Fish and fish products (kg) 2.5 2.4 1.6 2.9 2.4 2.3
Milk (l) 33.2 31.1 33.6 26.1 24.3 14.9
Yoghurt (kg) 32.0 28.8 27.8 23.1 18.8 15.2
Milk products (kg) 13.1 11.6 8.6 11.4 9.4 7.6
Eggs (number) 135 121 103 111 98 68
Sugar and sugar products (kg) 11.2 10.0 8.3 8.8 7.9 6.8
Potatoes (kg) 25.6 23.7 21.1 24.8 21.9 17.5
Fresh fruits (kg) 40.8 35.2 28.9 31.1 27.2 17.2
Fresh vegetables (kg) 56.5 50.8 43.2 51.7 44.9 32.4
Source: Household Budgets in the Republic of Bulgaria (1992, 1998).
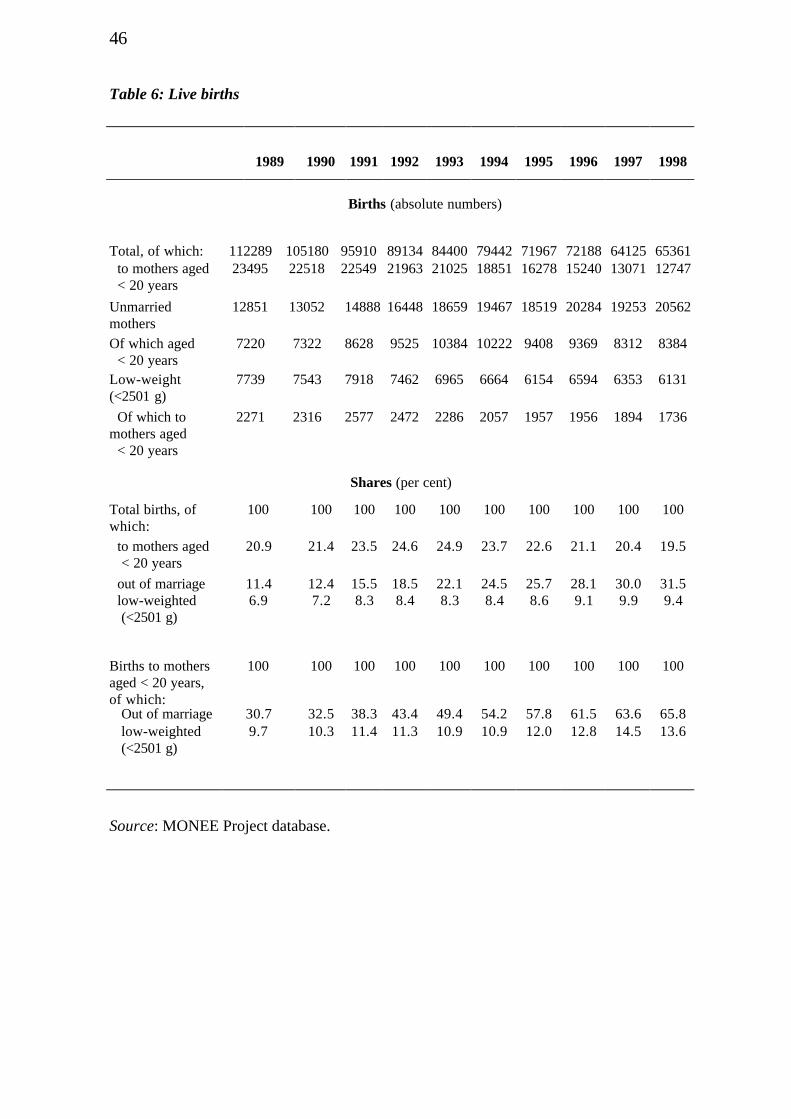
46
Table 6: Live births
1989 1990 1991 1992 1993 1994 1995 1996 1997 1998
Births (absolute numbers)
Total, of which: 112289 105180 95910 89134 84400 79442 71967 72188 64125 65361 to mothers aged < 20 years
23495 22518 22549 21963 21025 18851 16278 15240 13071 12747
Unmarriedmothers
12851 13052 14888 16448 18659 19467 18519 20284 19253 20562
Of which aged < 20 years
7220 7322 8628 9525 10384 10222 9408 9369 8312 8384
Low-weight(<2501 g)
7739 7543 7918 7462 6965 6664 6154 6594 6353 6131
Of which tomothers aged < 20 years
2271 2316 2577 2472 2286 2057 1957 1956 1894 1736
Shares (per cent)
Total births, ofwhich:
100 100 100 100 100 100 100 100 100 100
to mothers aged < 20 years
20.9 21.4 23.5 24.6 24.9 23.7 22.6 21.1 20.4 19.5
out of marriage 11.4 12.4 15.5 18.5 22.1 24.5 25.7 28.1 30.0 31.5 low-weighted (<2501 g)
6.9 7.2 8.3 8.4 8.3 8.4 8.6 9.1 9.9 9.4
Births to mothersaged < 20 years,of which:
100 100 100 100 100 100 100 100 100 100
Out of marriage 30.7 32.5 38.3 43.4 49.4 54.2 57.8 61.5 63.6 65.8 low-weighted (<2501 g)
9.7 10.3 11.4 11.3 10.9 10.9 12.0 12.8 14.5 13.6
Source: MONEE Project database.
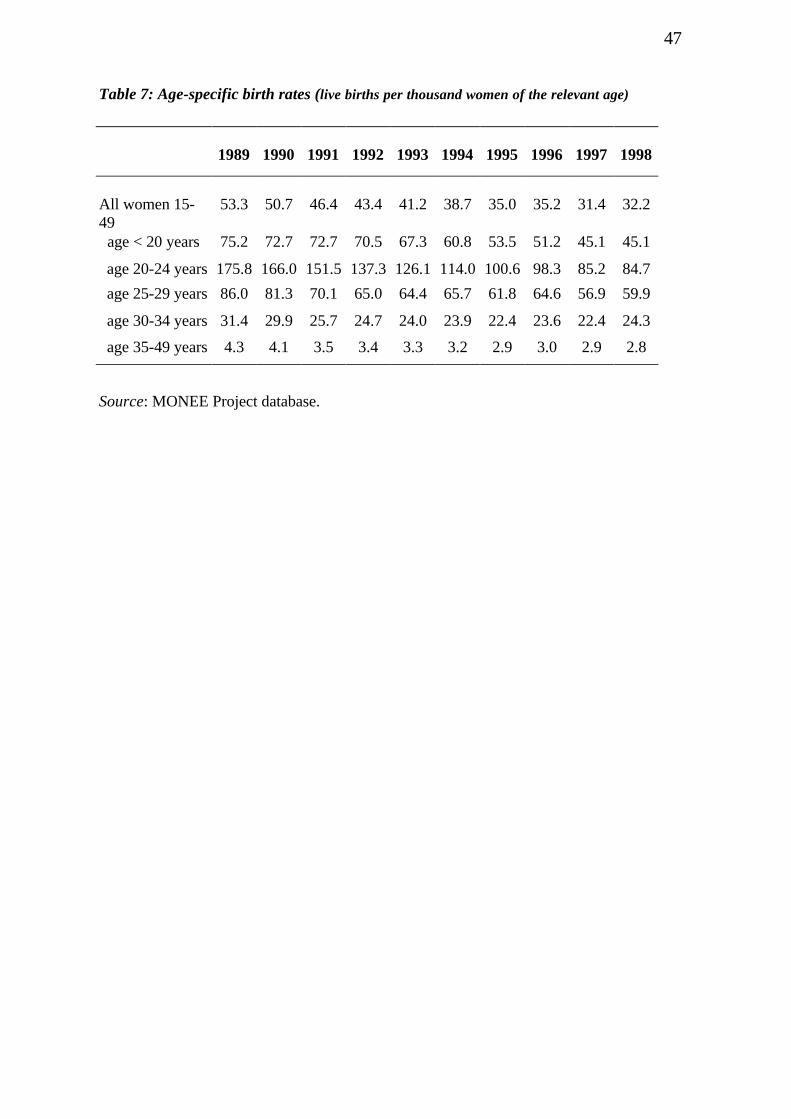
47
Table 7: Age-specific birth rates (live births per thousand women of the relevant age)
1989 1990 1991 1992 1993 1994 1995 1996 1997 1998
All women 15-49
53.3 50.7 46.4 43.4 41.2 38.7 35.0 35.2 31.4 32.2
age < 20 years 75.2 72.7 72.7 70.5 67.3 60.8 53.5 51.2 45.1 45.1
age 20-24 years 175.8 166.0 151.5 137.3 126.1 114.0 100.6 98.3 85.2 84.7
age 25-29 years 86.0 81.3 70.1 65.0 64.4 65.7 61.8 64.6 56.9 59.9
age 30-34 years 31.4 29.9 25.7 24.7 24.0 23.9 22.4 23.6 22.4 24.3
age 35-49 years 4.3 4.1 3.5 3.4 3.3 3.2 2.9 3.0 2.9 2.8
Source: MONEE Project database.
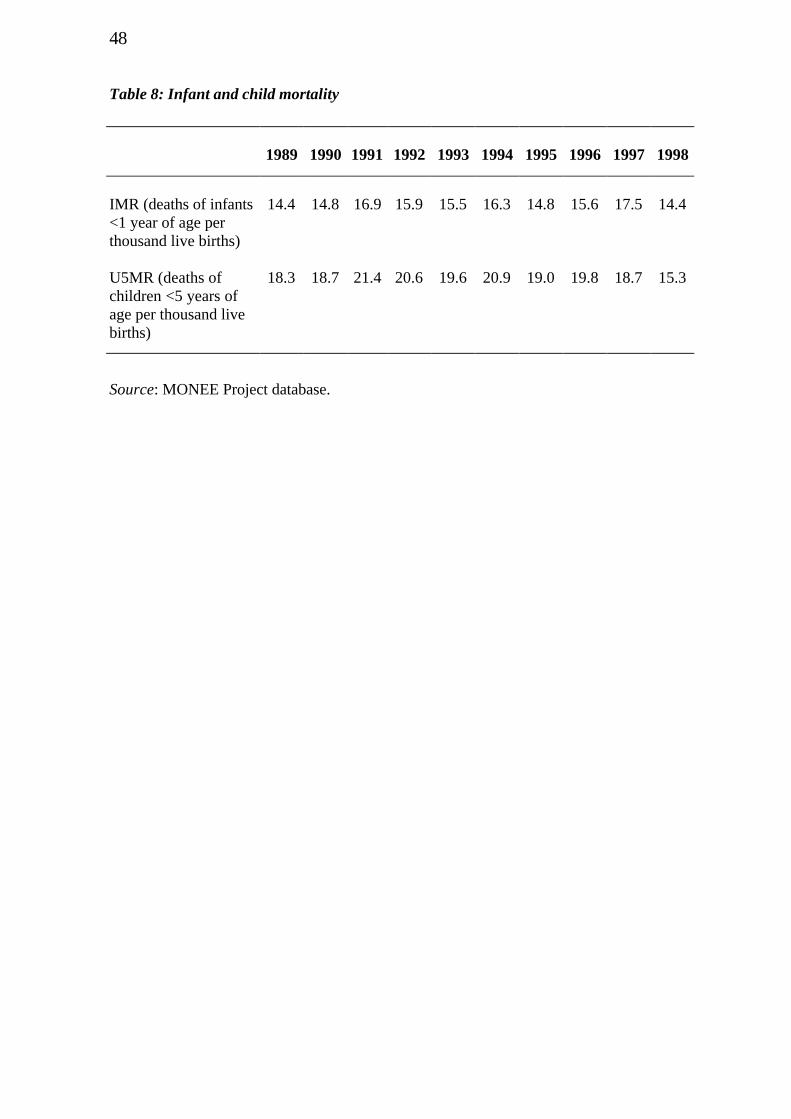
48
Table 8: Infant and child mortality
1989 1990 1991 1992 1993 1994 1995 1996 1997 1998
IMR (deaths of infants<1 year of age perthousand live births)
14.4 14.8 16.9 15.9 15.5 16.3 14.8 15.6 17.5 14.4
U5MR (deaths ofchildren <5 years ofage per thousand livebirths)
18.3 18.7 21.4 20.6 19.6 20.9 19.0 19.8 18.7 15.3
Source: MONEE Project database.
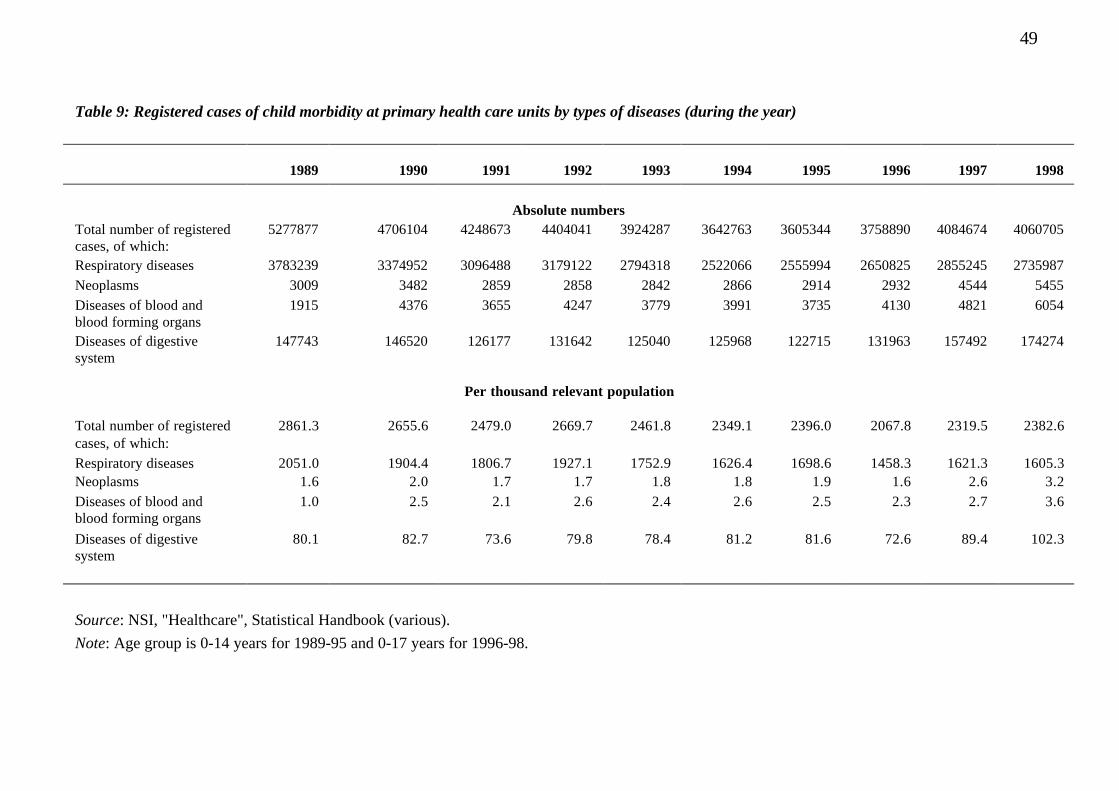
49
Table 9: Registered cases of child morbidity at primary health care units by types of diseases (during the year)
1989 1990 1991 1992 1993 1994 1995 1996 1997 1998
Absolute numbersTotal number of registeredcases, of which:
5277877 4706104 4248673 4404041 3924287 3642763 3605344 3758890 4084674 4060705
Respiratory diseases 3783239 3374952 3096488 3179122 2794318 2522066 2555994 2650825 2855245 2735987
Neoplasms 3009 3482 2859 2858 2842 2866 2914 2932 4544 5455
Diseases of blood andblood forming organs
1915 4376 3655 4247 3779 3991 3735 4130 4821 6054
Diseases of digestivesystem
147743 146520 126177 131642 125040 125968 122715 131963 157492 174274
Per thousand relevant population
Total number of registeredcases, of which:
2861.3 2655.6 2479.0 2669.7 2461.8 2349.1 2396.0 2067.8 2319.5 2382.6
Respiratory diseases 2051.0 1904.4 1806.7 1927.1 1752.9 1626.4 1698.6 1458.3 1621.3 1605.3Neoplasms 1.6 2.0 1.7 1.7 1.8 1.8 1.9 1.6 2.6 3.2
Diseases of blood andblood forming organs
1.0 2.5 2.1 2.6 2.4 2.6 2.5 2.3 2.7 3.6
Diseases of digestivesystem
80.1 82.7 73.6 79.8 78.4 81.2 81.6 72.6 89.4 102.3
Source: NSI, "Healthcare", Statistical Handbook (various).
Note: Age group is 0-14 years for 1989-95 and 0-17 years for 1996-98.
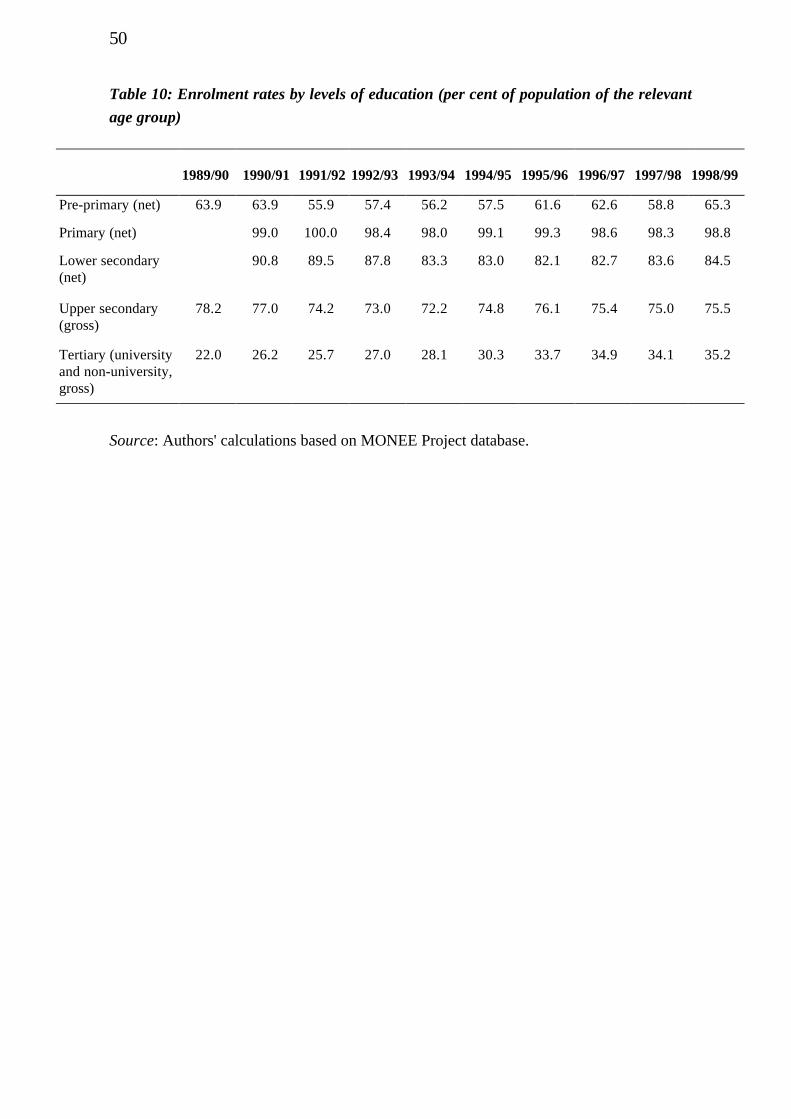
50
Table 10: Enrolment rates by levels of education (per cent of population of the relevant
age group)
1989/90 1990/91 1991/92 1992/93 1993/94 1994/95 1995/96 1996/97 1997/98 1998/99
Pre-primary (net) 63.9 63.9 55.9 57.4 56.2 57.5 61.6 62.6 58.8 65.3
Primary (net) 99.0 100.0 98.4 98.0 99.1 99.3 98.6 98.3 98.8
Lower secondary(net)
90.8 89.5 87.8 83.3 83.0 82.1 82.7 83.6 84.5
Upper secondary(gross)
78.2 77.0 74.2 73.0 72.2 74.8 76.1 75.4 75.0 75.5
Tertiary (universityand non-university,gross)
22.0 26.2 25.7 27.0 28.1 30.3 33.7 34.9 34.1 35.2
Source: Authors' calculations based on MONEE Project database.
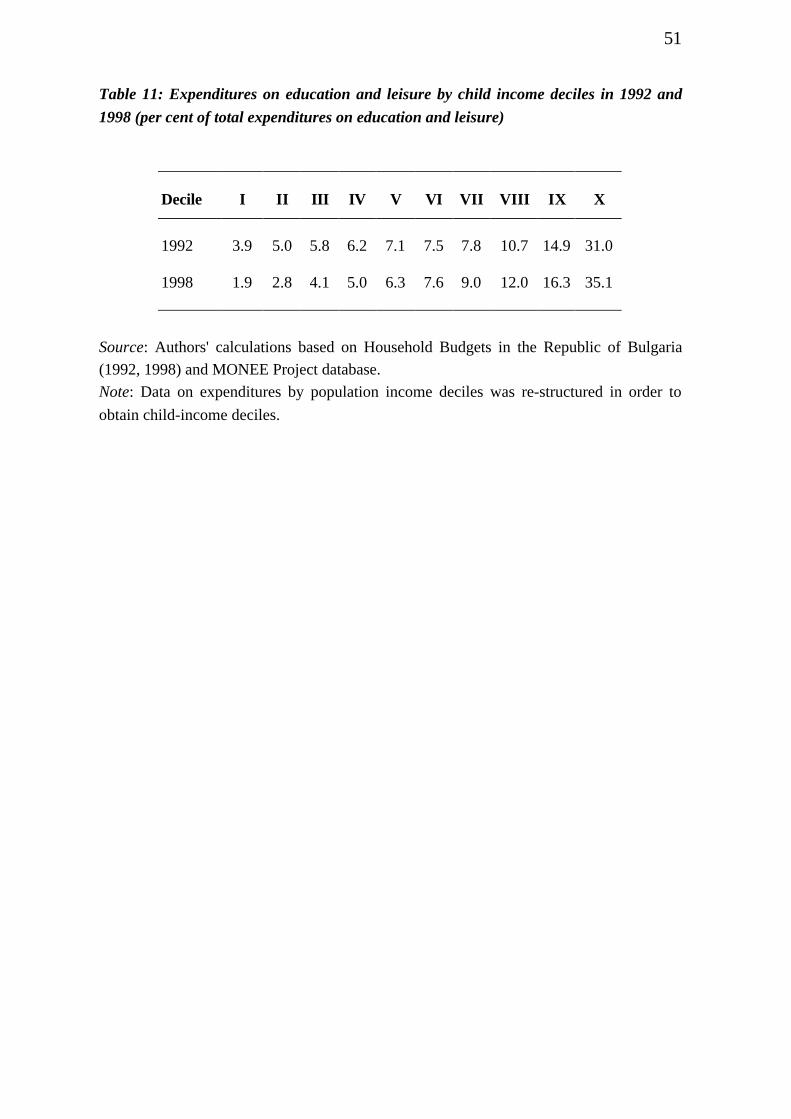
51
Table 11: Expenditures on education and leisure by child income deciles in 1992 and
1998 (per cent of total expenditures on education and leisure)
Decile I II III IV V VI VII VIII IX X
1992 3.9 5.0 5.8 6.2 7.1 7.5 7.8 10.7 14.9 31.0
1998 1.9 2.8 4.1 5.0 6.3 7.6 9.0 12.0 16.3 35.1
Source: Authors' calculations based on Household Budgets in the Republic of Bulgaria
(1992, 1998) and MONEE Project database.
Note: Data on expenditures by population income deciles was re-structured in order to
obtain child-income deciles.
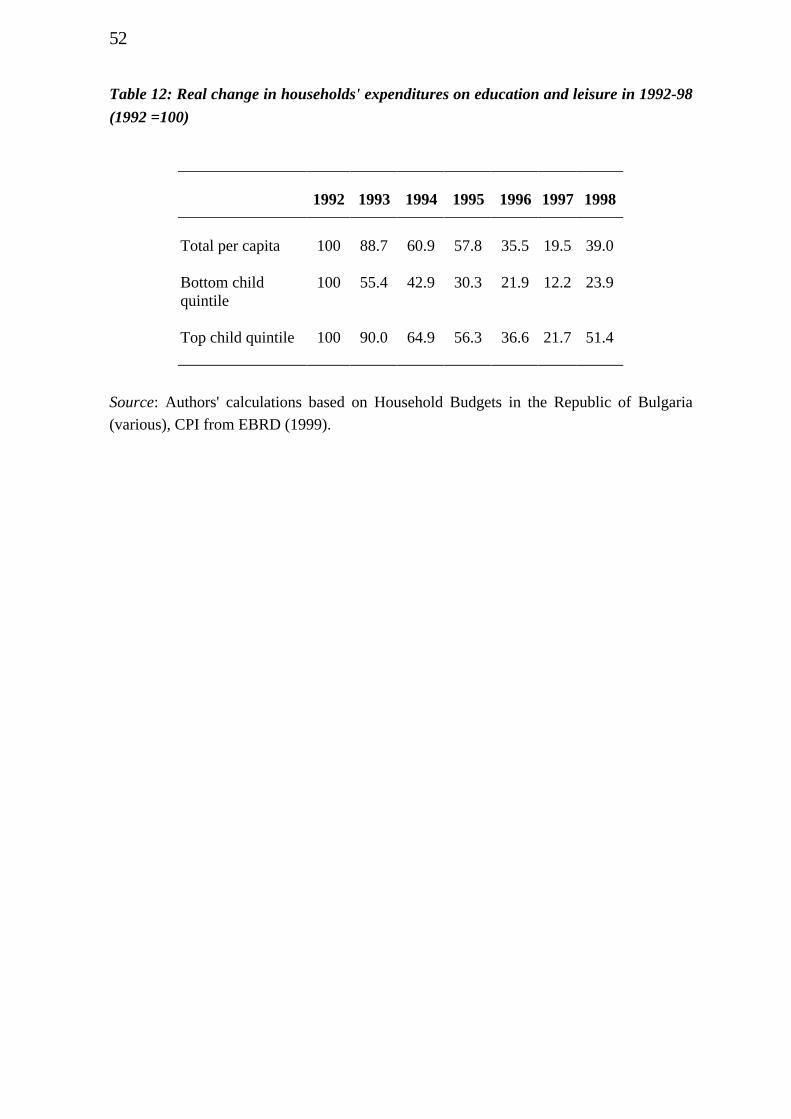
52
Table 12: Real change in households' expenditures on education and leisure in 1992-98
(1992 =100)
1992 1993 1994 1995 1996 1997 1998
Total per capita 100 88.7 60.9 57.8 35.5 19.5 39.0
Bottom childquintile
100 55.4 42.9 30.3 21.9 12.2 23.9
Top child quintile 100 90.0 64.9 56.3 36.6 21.7 51.4
Source: Authors' calculations based on Household Budgets in the Republic of Bulgaria
(various), CPI from EBRD (1999).
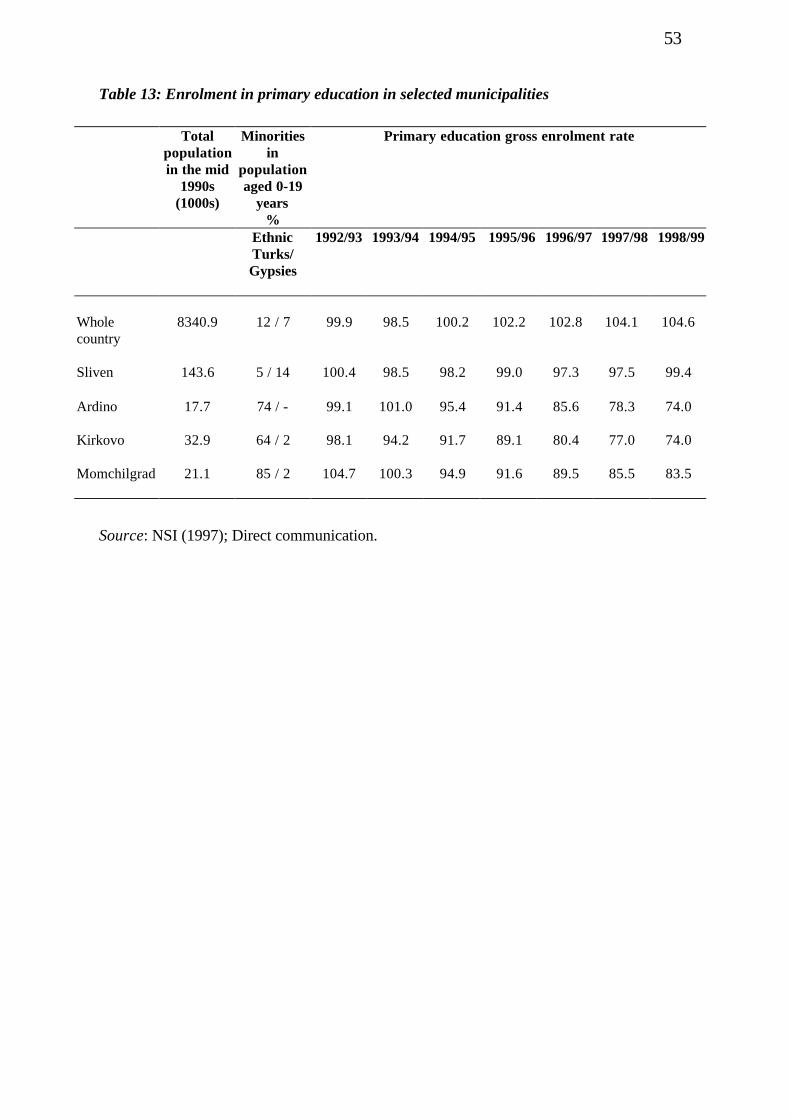
53
Table 13: Enrolment in primary education in selected municipalities
Totalpopulationin the mid
1990s(1000s)
Minoritiesin
populationaged 0-19
years%
Primary education gross enrolment rate
EthnicTurks/Gypsies
1992/93 1993/94 1994/95 1995/96 1996/97 1997/98 1998/99
Wholecountry
8340.9 12 / 7 99.9 98.5 100.2 102.2 102.8 104.1 104.6
Sliven 143.6 5 / 14 100.4 98.5 98.2 99.0 97.3 97.5 99.4
Ardino 17.7 74 / - 99.1 101.0 95.4 91.4 85.6 78.3 74.0
Kirkovo 32.9 64 / 2 98.1 94.2 91.7 89.1 80.4 77.0 74.0
Momchilgrad 21.1 85 / 2 104.7 100.3 94.9 91.6 89.5 85.5 83.5
Source: NSI (1997); Direct communication.
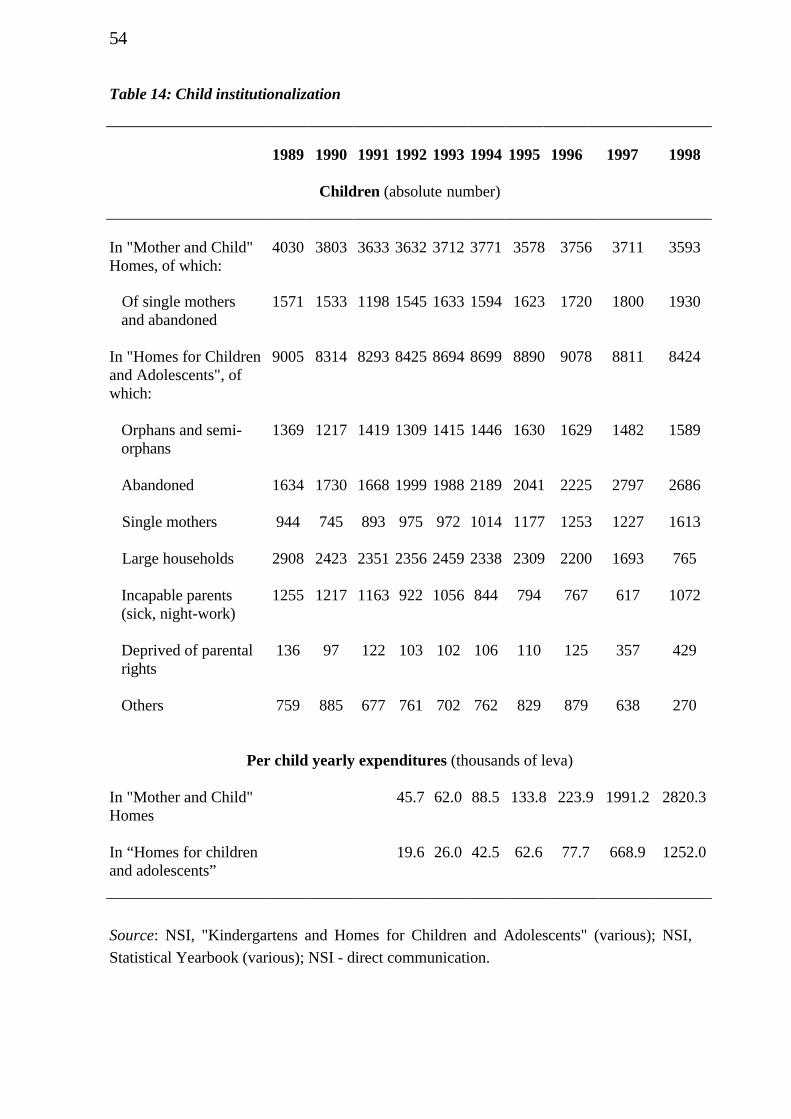
54
Table 14: Child institutionalization
1989 1990 1991 1992 1993 1994 1995 1996 1997 1998
Children (absolute number)
In "Mother and Child"Homes, of which:
4030 3803 3633 3632 3712 3771 3578 3756 3711 3593
Of single mothers and abandoned
1571 1533 1198 1545 1633 1594 1623 1720 1800 1930
In "Homes for Childrenand Adolescents", ofwhich:
9005 8314 8293 8425 8694 8699 8890 9078 8811 8424
Orphans and semi- orphans
1369 1217 1419 1309 1415 1446 1630 1629 1482 1589
Abandoned 1634 1730 1668 1999 1988 2189 2041 2225 2797 2686
Single mothers 944 745 893 975 972 1014 1177 1253 1227 1613
Large households 2908 2423 2351 2356 2459 2338 2309 2200 1693 765
Incapable parents (sick, night-work)
1255 1217 1163 922 1056 844 794 767 617 1072
Deprived of parental rights
136 97 122 103 102 106 110 125 357 429
Others 759 885 677 761 702 762 829 879 638 270
Per child yearly expenditures (thousands of leva)
In "Mother and Child"Homes
45.7 62.0 88.5 133.8 223.9 1991.2 2820.3
In “Homes for childrenand adolescents”
19.6 26.0 42.5 62.6 77.7 668.9 1252.0
Source: NSI, "Kindergartens and Homes for Children and Adolescents" (various); NSI,
Statistical Yearbook (various); NSI - direct communication.
55
ReferencesAndrews, E. (1996), “Income Maintenance Programs and Poverty in Bulgaria”. A
background paper prepared for the Bulgaria Poverty Assessment Study ofthe World Bank.
Antonova, Tzv. (1996), “Influence of the Conditions and the Organization in‘Mother and Child’ Homes on the Health Status and PsychicalDevelopment of Children”, Paediatrics, 2/1996, (in Bulgarian).
Antonova, Tzv., V. Gatev, T. Tatyozov, A. Doychinova, M. Tzvetkova and V.Pravchev (1996), “Some Medical and Social Characteristics of ChildrenBrought up in ‘Mother and Child’ Homes”, Social Medicine, 4/1996 (inBulgarian).
Antonova, Tzv., V. Pravchev, V. Gatev, T. Tatyozov and M. Petkova (1998),“Physical Development of Children Brought Up in “Mother and Child”Homes, Paediatrics, 3/1998, (in Bulgarian).
Atkinson, A.B. and J. Micklewright (1992), Economic Transformation in EasternEurope and the Distribution of Income. Cambridge: Cambridge UniversityPress.
Belcheva, M. (1996), “Extramarital Birth Rate in Bulgaria”, Statistics, 3/1996 (inBulgarian).
Chalacova, D., L. Yadkova and E. Tasheva (1995), “Births and Abortions inBulgaria and Europe During the Second Half of the 20th Century”, SocialMedicine, 4/1995 (in Bulgarian).
Chalacova, D. and V. Aleksiev (1996), “Infant Mortality of Early Births”, SocialMedicine, 4/1996 (in Bulgarian).
Dobrinsky, R., N. Markov and S. Pudney (1996), “Poverty and Social Security inBulgaria during Transition”, University of Leicester.
Doitcheva, E., L. Vakrilova and Z. Emilova (1997), “Dynamics and Structure of theNeonatal Mortality of Newborns with Low Weight for the Period 1991-1995 in the State University Hospital ‘Mother’s Home’”, Paediatrics,2/1997, (in Bulgarian).
Doichinova, A., G. Todorova, L. Georgieva and P. Salchev (1996), “Medico-SocialFactors Coercing Women to Leave Their Children in ‘Mother and Child’Homes”, Social Medicine, 2/1996 (in Bulgarian).
EUROSTAT (1997, 1998), Statistical Yearbook.
Feschieva, N., St. Popova and S. Tzwetarski (1996), “Socio-economic Transition inBulgaria and Birthweight Changes (1986-1994)”, Social Medicine, 1/1996(in Bulgarian).
Flemming, J. and J. Micklewright (1999), “Income Distribution, Economic Systemsand Transition”, Innocenti Working Papers, no. 70. Florence: UNICEFInnocenti Research Centre.
56
Gantcheva, R. (1997),“Will Education in Bulgaria Lose its High Value andPrestige”. Florence: UNICEF Innocenti Research Centre, Mimeo.
ILO, UNDP (1998a), “Poverty in Transition”, Republic of Bulgaria, GED Ltd.,Bulgaria.
ILO, UNDP (1998b), “Strengthening the National Policies and Strategies forPoverty Reduction in Bulgaria”.
International Association for the Evaluation of Educational Achievement (1996),“Mathematics Achievement in the Middle School Years: IEA’s ThirdMathematics and Science Study” (TIMSS).
Kalaikov, D. (1996), “Pre-maturity of Births – an Important Medico-socialProblem”, Paediatrics, 1/1997, (in Bulgarian).
Kalaikov, D. (1998), “Infant Mortality in Cities with Population Over 30,000 andtheir Municipalities in Bulgaria for 1990-1996”, Paediatrics, 3/1998, (inBulgarian).
Kaloianov, T. (1999), “Reproductive Behaviour of Bulgarian Women by AgeGroups in the Period 1985-1996”, Statistics, 1/1999, (in Bulgarian).
Klugman, J. and A. Kolev (2001), “The Welfare Repercussion of Single Parenthoodin Russia during Transition”, in J. Klugman and A. Motivans, FamilyStructure in the New Russia, Basingstoke, UK: Palgrave.
Manolova, A. and A. Doichinova (1998), “Blood Pressure and Physical ActivityDuring Adolescence”, Paediatrics, 3/1998 (in Bulgarian).
Manolova, A., S. Serdeva, A. Doichinova and N. Semova (1998), “Ethnic-socialCharacteristics of Children and Adolescents Brought Up in Homes forChildren and Adolescents”, Pedagogy, No 6-7, 1998 (in Bulgarian).
Markova, St. (ed.) (1998), Social Medicine and Public Health, Znanie Ltd.Publisher (in Bulgarian).
ME (Ministry of Education) (1996), “Development of Education in 1994-1996”,National Report of Republic of Bulgaria. Sofia: Ministry of Education.
Merjanov, Ch. (1995), One Compromising Leadership (in Bulgarian). Sofia:University Press, “St. Kliment Ohridski”.
Micklewright, J. (2000), “Macroeconomics and Data on Children”, InnocentiWorking Papers no. 73. Florence: UNICEF Innocenti Research Centre.
Micklewright, J. (2000), “Education, Inequality and Transition”, Innocenti WorkingPapers, no. 74, Florence: UNICEF Innocenti Research Centre.
Micklewright, J. and K. Stewart (1999), “Is Child Welfare Converging in theEuropean Union?”, Innocenti Working Papers, no. 69. Florence: UNICEFInnocenti Research Centre.
Micklewright, J. and K. Stewart (2000), “Child Well-Being in the EU andEnlargement to the East”, Innocenti Working Papers, no. 75. Florence:UNICEF Innocenti Research Centre.
57
MLSDRF (Ministry of Labour and Social Development of the Russian Federation)(1995, 1997), “The Situation of Children in the Russian Federation”, StateReports (in Russian).
Noncheva, T., (1995),“The Winding Road to the Market: Transition and theSituation of Children in Bulgaria”, Innocenti Occasional Papers No. 51.Florence: UNICEF Innocenti Research, Florence.
NSI (National Statistical Institute) (1991), Statistical Yearbook. Sofia: NationalStatistical Institute.
NSI (National Statistical Institute) (1993), Educational Changes in the Upper-Secondary School. Sofia: National Statistical Institute.
NSI (National Statistical Institute) (1994), The Child, the Family, the Society.Bulgaria 1989-1994 (in Bulgarian). Sofia: National Statistical Institute.
NSI (National Statistical Institute) (1997), “Population”, Statistical Handbook, (inBulgarian). Sofia: National Statistical Institute.
NSI (National Statistical Institute) (1998), Statistical Yearbook. Sofia: NationalStatistical Institute.
NSI (National Statistical Institute) (1999), “Living Standards – Economic andSocial Indicators” (Sociological Survey). Sofia: National StatisticalInstitute.
NSI (National Statistical Institute) (2000), Statistical Reference Book of theRepublic of Bulgaria. Sofia: National Statistical Institute.
NSI (National Statistical Institute), “Healthcare”, Statistical Handbook, variouseditions, (in Bulgarian). Sofia: National Statistical Institute.
NSI (National Statistical Institute), “Household Budgets in the Republic ofBulgaria”, Statistical Handbook, various editions, (in Bulgarian). Sofia:National Statistical Institute.
NSI (National Statistical Institute), Kindergartens and Homes for Children andAdolescents, various editions, (in Bulgarian). Sofia: National StatisticalInstitute.
NSI (National Statistical Institute) and Bulgarian National Committee for UNICEF(1994), The Child, the Family, the Society: Bulgaria 1989-1994 (inBulgarian). Sofia: National Statistical Institute.
OECD (1996), “Education at a Glance”, OECD Indicators. Paris: OECD.
Parapulska, J. (1998), “School Education of Children in the Expectations of theirParents”, Primary School, 5/1998 (in Bulgarian).
Sen, A. (1995), “Mortality as an Indicator of Economic Success and Failure”,Innocenti Lectures, Florence: UNICEF Innocenti Research Centre.
State Committee of Statistics of Ukraine (1998), “Children, Women and Families inUkraine”, Statistical Handbook (in Ukrainian).
Third International Mathematics and Science Study (TIMSS) – Repeat (2000),http://uces.ed.gov/timss/timss-r/
58
Tomova, I. (1995), The Gypsies in the Transition Period, (in Bulgarian). Sofia:International Centre for the Problems of Minorities and CulturalInteractions.
Tzvetkova, M., Tzv. Antonova, T. Tatyozov, A. Doychinova, V. Pravchev and V.Gatev (1996), “Psychical Development of Children Brought Up in ‘Motherand Child’ Homes”, Paediatrics, 2/1996 (in Bulgarian).
UN (1999), Demographic Yearbook 1997, Forty-ninth issue. New York: UnitedNations.
UNDP (1997), Human Development Report: Bulgaria 1997.
UNDP (1998), “The State of Transition and Transition of the State: Bulgaria 1998”,National Human Development Report.
UNDP (1999), Human Development Report, Bulgaria 1999, Volume I: “Trends andOpportunities for Regional Human Development”.
UNDP, UNESCO, UNFPA, UNICEF, WHO, World Bank (1998), “Implementingthe 20/20 Initiative. Achieving Universal Access to Basic Social Services.”
UNICEF (1989), Convention on the Rights of the Child. New York: UNICEF.
UNICEF (1998), “Education for All?”, Regional Monitoring Report, No. 5.Florence: UNICEF Innocenti Research Centre.
UNICEF National Committee (1992), “Bulgaria’s Children and Families 1992”, ANation-wide Situation Analysis. Sofia: Bulgarian Committee for UNICEF.
UNICEF (1999), “Out-of-school Youth in Bulgaria”, Mission Report. Geneva:UNICEF Regional Office for CEE/CIS and the Baltic States.
WHO (1992), International Statistical Classification of Diseases and RelatedHealth Problems, Tenth Revision. Geneva: World Health Organization.
World Bank (1995), Living Standard Measurement Survey Database, Washington:The World Bank.
World Bank (1999), “Bulgaria Consultation with the Poor”, prepared for GlobalSynthesis Workshop, September, Poverty Group, PREM. Washington: TheWorld Bank.
59
Economic and Social Policy Series
The papers in the series (ISSN 1014-7837) are all available in English. Papers EPS 63onwards are available for download as .pdf files from the IRC web site(http://www.unicef-icdc.org). Individual copies are available from: Distribution Unit,UNICEF-IRC, Piazza SS. Annunziata 12, 50122 Florence, Italy ([email protected] fax +39 055-24-48-17).
EPS 1 Economic Decline and Child Survival: The Plight of Latin America in theEighties. Teresa Albanez, Eduardo Bustelo, Giovanni Andrea Cornia andEva Jespersen. (March 1989).
EPS 2 Child Poverty and Deprivation in Industrialized Countries: Recent Trendsand Policy Options. Giovanni Andrea Cornia. (March 1990). Also availablein French and Spanish.
EPS 3 Education, Skills and Industrial Development in the StructuralTransformation of Africa. Sanjaya Lall. (July 1990).
EPS 4 Rural Differentiation, Poverty and Agricultural Crisis in Sub-SaharanAfrica: Toward An Appropriate Policy Response. Giovanni Andrea Corniaand Richard Strickland. (July 1990).
EPS 5 Increased Aid Flows and Human Resource Development in Africa. PaulMosley. (August 1990).
EPS 6 Child Poverty and Deprivation in Italy: 1950 to the Present. ChiaraSaraceno. (September 1990). Also available in Italian.
EPS 7 Toward Structural Transformation with a Human Focus: The EconomicProgrammes and Policies of Zambia in the 1980s. Venkatesh Seshamani.(October 1990).
EPS 8 Child Poverty and Deprivation in the UK. Jonathan Bradshaw. (October1990).
EPS 9 Adjustment Policies in Tanzania, 1981-1989: The Impact on Growth,Structure and Human Welfare. Jumanne H. Wagao. (October 1990).
EPS10 The Causes and Consequences of Child Poverty in the United States.Sheldon Danziger and Jonathan Stern. (November 1990).
EPS 11 The Fiscal System, Adjustment and the Poor. Giovanni Andrea Cornia andFrances Stewart. (November 1990).
EPS 12 The Health Sector and Social Policy Reform in the Philippines since 1985.Wilfredo G. Nuqui. (January 1991).
EPS 13 The Impact of Economic Crisis and Adjustment on Health Care in Mexico.Carlos Cruz Rivero, Rafael Lozano Ascencio and Julio Querol Vinagre.(February 1991).
60
EPS 14 Structural Adjustment, Growth and Welfare: The Case of Niger, 1982-1989. Kiari Liman-Tinguiri. (March 1991).
EPS 15 The Impact of Self-Imposed Adjustment: The Case of Burkina Faso, 1983-1989. Kimseyinga Savadogo and Claude Wetta. (April 1991).
EPS 16 Liberalization for Development: Zimbabwe’s Adjustment without the Fund.Robert Davies, David Sanders and Timothy Shaw. (May 1991).
EPS 17 Fiscal Shock, Wage Compression and Structural Reform: MexicanAdjustment and Educational Policy in the 1980s. Fernando Valerio. (June1991).
EPS 18 Patterns of Government Expenditure in Developing Countries during the1980s: The Impact on Social Services. Beth Ebel. (July 1991).
EPS 19 Ecuador: Crisis, Adjustment and Social Policy in the 1980s. TheEcuadorian Centre of Social Research. (August 1991).
EPS 20 Government Expenditures for Children and Their Families in AdvancedIndustrialized Countries, 1960-85. Sheila B. Kamerman and Alfred J.Kahn. (September 1991).
EPS 21 Is Adjustment Conducive to Long-term Development?: The Case of Africain the 1980s. Giovanni Andrea Cornia. (October 1991).
EPS 22 Children in the Welfare State: Current Problems and Prospects in Sweden.Sven E. Olsson and Roland Spånt. (December 1991).
EPS 23 Eradicating Child Malnutrition: Thailand’s Health, Nutrition and PovertyAlleviation Policy in the 1980s. Thienchay Kiranandana and KraisidTontisirin. (January 1992).
EPS 24 Child Welfare and the Socialist Experiment: Social and Economic Trendsin the USSR, 1950-90. Alexandr Riazantsev, Sándor Sipos and OlegLabetsky. (February 1992).
EPS 25 Improving Nutrition in Tanzania in the 1980s: The Iringa Experience.Olivia Yambi and Raphael Mlolwa. (March 1992).
EPS 26 Growth, Income Distribution and Household Welfare in the IndustrializedCountries since the First Oil Shock. Andrea Boltho. (April 1992).
EPS 27 Trends in the Structure and Stability of the Family from 1950 to thePresent: The Impact on Child Welfare. Chiara Saraceno. (May 1992).
EPS 28 Child Poverty and Deprivation in Portugal: A National Case Study.Manuela Silva. (June 1992).
EPS 29 Poverty Measurement in Central and Eastern Europe before the Transitionto the Market Economy. Sándor Sipos. (July 1992).
EPS 30 The Economics of Disarmament: Prospects, Problems and Policies for theDisarmament Dividend. Saadet Deger. (August 1992).
EPS 31 External Debt, Fiscal Drainage and Child Welfare: Trends and PolicyProposals. Stephany Griffith-Jones. (September 1992).

61
EPS 32 Social Policy and Child Poverty: Hungary since 1945. Júlia Szalai.(October 1992).
EPS 33 The Distributive Impact of Fiscal and Labour Market Policies: Chile’s1990-91 Reforms. Mariana Schkolnik. (November 1992).
EPS 34 Changes in Health Care Financing and Health Status: The Case of Chinain the 1980s. Yu Dezhi. (December 1992).
EPS 35 Decentralization and Community Participation for Improving Access toBasic Services: An Empirical Approach. Housainou Taal. (January 1993).
EPS 36 Two Errors of Targeting. Giovanni Andrea Cornia and Frances Stewart.(March 1993).
EPS 37 Education and the Market: Which Parts of the Neoliberal Solution areCorrect? Christopher Colclough. (July 1993).
EPS 38 Policy and Capital Market Constraints to the African Green Revolution: AStudy of Maize and Sorghum Yields in Kenya, Malawi and Zimbabwe,1960-91. Paul Mosley. (December 1993).
EPS 39 Tax Reforms and Equity in Latin America: A Review of the 1980s andProposals for the 1990s. Ricardo Carciofi and Oscar Cetrángolo. (January1994).
EPS 40 Macroeconomic Policy, Poverty Alleviation and Long-term Development:Latin America in the 1990s. Giovanni Andrea Cornia. (February 1994).
EPS 41 Réformes Fiscales, Génération de Ressources et Equité en AfriqueSubsaharienne durant les Années 1980. Kiari Liman-Tinguiri. (March1994).
EPS 42 Tax Reform and Equity in Asia: The Experience of the 1980s. AndreaManuelli. (April 1994).
EPS 43 Family Support Policies in Transitional Economies: Challenges andConstraints . Gáspár Fajth. (August 1994).
EPS 44 Income Distribution, Poverty and Welfare in Transitional Economies: AComparison between Eastern Europe and China. Giovanni Andrea Cornia.(October 1994).
EPS 45 Death in Transition: The Rise in the Death Rate in Russia since 1992.Jacob Nell and Kitty Stewart. (December 1994).
EPS 46 Child Well-being in Japan: The High Cost of Economic Success. Martha N.Ozawa and Shigemi Kono. (March 1995).
EPS 47 Ugly Facts and Fancy Theories: Children and Youth during the Transition.Giovanni Andrea Cornia. (April 1995).
EPS 48 East Joins West: Child Welfare and Market Reforms in the “Special Case”of the Former GDR. Bernhard Nauck and Magdalena Joos. (June 1995).
EPS 49 The Demographic Impact of Sudden Impoverishment: Eastern Europeduring the 1989-94 Transition. Giovanni Andrea Cornia and RenatoPaniccià. (July 1995).
62
EPS 50 Market Reforms and Social Welfare in the Czech Republic: A True SuccessStory? Miroslav Hiršl, Jiøí Rusnok and Martin Fassmann. (August 1995).
EPS 51 The Winding Road to the Market: Transition and the Situation of Childrenin Bulgaria. Theodora Ivanova Noncheva. (August 1995).
EPS 52 Child Institutionalization and Child Protection in Central and EasternEurope. Mary Anne Burke. (September 1995).
EPS 53 Economic Transition in the Baltics: Independence, Market Reforms andChild Well-being in Lithuania. Romas Lazutka and Zita Sniukstiene.(September 1995).
EPS 54 Economic Reforms and Family Well-being in Belarus: Caught betweenLegacies and Prospects. Galina I. Gasyuk and Antonina P. Morova.(December 1995).
EPS 55 The Transition in Georgia: From Collapse to Optimism. TeimurazGogishvili, Joseph Gogodze and Amiran Tsakadze. (September 1996).
EPS 56 Children at Risk in Romania: Problems Old and New. Elena Zamfir andCãtãlin Zamfir. (September 1996).
EPS 57 Children in Difficult Circumstances in Poland. Stanislawa Golinowska,Bo¿ena Balcerzak-Paradowska, Bo¿ena Ko³aczek and Dorota G³ogosz.(December 1996).
EPS 58 The Implications of Exhausting Unemployment Insurance Entitlement inHungary. John Micklewright and Gyula Nagy. (September 1997).
EPS 59 Are Intergovernmental Transfers in Russia Equalizing? Kitty Stewart.(September 1997).
EPS 60 Marital Splits and Income Changes: Evidence for Britain. Sarah Jarvis andStephen P. Jenkins. (September 1997).
EPS 61 Decentralization: A Survey from a Child Welfare Perspective. JeniKlugman. (September 1997).
EPS 62 Living Standards and Public Policy in Central Asia: What Can Be Learnedfrom Child Anthropometry? Suraiya Ismail and John Micklewright.(November 1997).
EPS 63 Targeting Social Assistance in a Transition Economy: The Mahallas inUzbekistan. Aline Coudouel, Sheila Marnie and John Micklewright.(August 1998).
EPS 64 Income Inequality and Mobility in Hungary, 1992-96. Péter Galasi, (August1998).
EPS 65 Accounting for the Family: The Treatment of Marriage and Children inEuropean Income Tax Systems. Cathal O’Donoghue and Holly Sutherland.(September 1998).
EPS 66 Child Poverty in Spain: What Can Be Said? Olga Cantó-Sánchez andMagda Mercader-Prats. (September 1998).
63
EPS 67 The Education of Children with Special Needs: Barriers and Opportunitiesin Central and Eastern Europe. Mel Ainscow and Memmenasha Haile-Giorgis. (September 1998).
EPS 68 EMU, Macroeconomics and Children. A.B. Atkinson. (December 1998).
EPS 69 Is Child Welfare Converging in the European Union? John Micklewrightand Kitty Stewart. (May 1999).
EPS 70 Income Distribution, Economic Systems and Transition. John Flemmingand John Micklewright. (May 1999).
EPS 71 Child Poverty across Industrialized Nations. Bruce Bradbury and MarkusJäntti. (September 1999).
EPS 72 Regional Monitoring of Child and Family Well-Being: UNICEF’s MONEEProject in CEE and the CIS in a Comparative Perspective. Gáspár Fajth(January 2000).
EPS 73 Macroeconomics and Data on Children. John Micklewright. (January2000). Available as a .pdf file only from http://www.unicef-icdc.org
EPS 74 Education, Inequality and Transition. John Micklewright (January 2000).Available as a .pdf file only from http://www.unicef-icdc.org
EPS 75 Child Well-Being in the EU – and Enlargement to the East. JohnMicklewright and Kitty Stewart. (February 2000).
IWP 76 From Security to Uncertainty: The Impact of Economic Change on ChildWelfare in Central Asia. Jane Falkingham. (May 2000).
IWP 77 How Effective is the British Government’s Attempt to Reduce ChildPoverty? David Piachaud and Holly Sutherland. (June 2000).
IWP 78 Child Poverty Dynamics in Seven Nations. Bruce Bradbury, StephenJenkins and John Micklewright. (June 2000).
IWP 79 What is the Effect of Child Labour on Learning Achievement? Evidencefrom Ghana. Christopher Heady (October 2000).
IWP 80 Integrating Economic and Social Policy: Good Practices from High-Achieving Countries. Santosh Mehrotra (October 2000).
IWP 81 The Impact of the Indonesian Financial Crisis on Children: An AnalysisUsing the 100 Villages Data. Lisa A. Cameron (December 2000).
IWP 82 An Analysis of the Role of Social Safety Net Scholarship in ReducingSchool Drop-Out During the Indonesian Economic Crisis. Lisa A.Cameron (December 2000).
IWP 83 The Family-in-Focus Approach: Developing Policy-Oriented Monitoringand Analysis of Human Development in Indonesia. Friedhelm Betke(January 2001).
IWP 84 Children in Bulgaria – Growing Impoverishment and UnequalOpportunities. Gantcheva, Roumiana and Alexandre Kolev (January 2001).
#
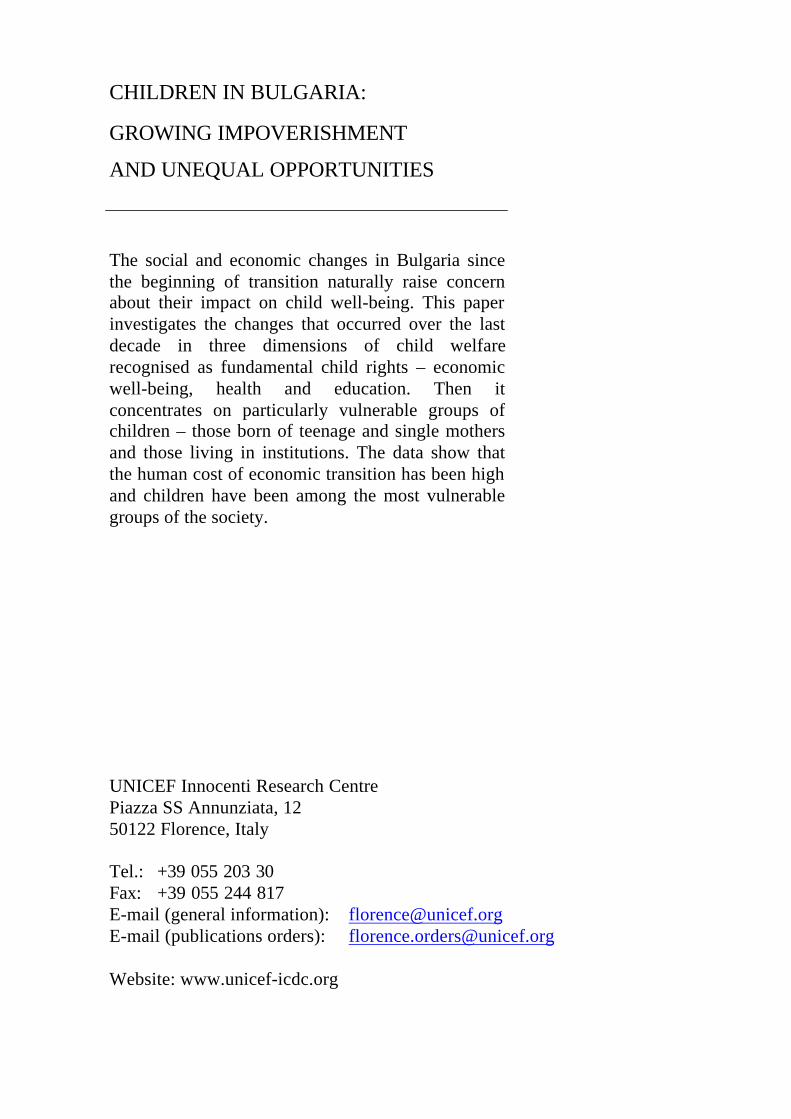
CHILDREN IN BULGARIA:
GROWING IMPOVERISHMENT
AND UNEQUAL OPPORTUNITIES
The social and economic changes in Bulgaria sincethe beginning of transition naturally raise concernabout their impact on child well-being. This paperinvestigates the changes that occurred over the lastdecade in three dimensions of child welfarerecognised as fundamental child rights – economicwell-being, health and education. Then itconcentrates on particularly vulnerable groups ofchildren – those born of teenage and single mothersand those living in institutions. The data show thatthe human cost of economic transition has been highand children have been among the most vulnerablegroups of the society.
UNICEF Innocenti Research CentrePiazza SS Annunziata, 1250122 Florence, Italy
Tel.: +39 055 203 30Fax: +39 055 244 817E-mail (general information): [email protected] (publications orders): [email protected]
Website: www.unicef-icdc.org