Embed Size (px)
Citation preview
99
http://journals.tubitak.gov.tr/earth/
Turkish Journal of Earth Sciences Turkish J Earth Sci(2015) 24: 99-110© TÜBİTAKdoi:10.3906/yer-1405-10
The importance of supersaturated silica deposition for base-metalAu–Ag mineralisation in western Turkey
Gülcan BOZKAYA1,*, David A. BANKS2
1Department of Geological Engineering, Pamukkale University, Denizli, Turkey2School of Earth and Environment, University of Leeds, Leeds, UK
* Correspondence: [email protected]
1. IntroductionWestern Turkey contains numerous economic/sub-economic ore deposits that are classified as low to intermediate sulphidation (LS-IS) epithermal in origin (e.g., Yiğit, 2012). These deposit types are the near-surface manifestations of magmatic fluids rising from depth and mixing with local meteoric water. Ore deposits of this type have a well-defined horizontal, vertical, and temporal structure and the processes responsible for mineralisation are generally similar worldwide and well understood (Arribas Jr, 1995; Hedenquist and Lowenstern, 1995; Richards, 2011). Deposits of this type in Turkey show similar geological characteristics to others around the globe, and studies (Oyman et al., 2003; Örgün et al., 2005; Yılmaz et al., 2010, 2013; Imer et al., 2013) of the fluids show that within the range of epithermal mineralisation types these too are consistent with worldwide deposits. In the epithermal environment, from the surface to approximately 1-km depth, a well-defined set of processes can lead to mineralisation. Mineral deposition, including Au, is promoted by boiling, cooling, dilution with meteoric waters, and mixing with near surficial oxidising ground waters (Henley and McNabb, 1978; Henley and Ellis, 1983; Henley and Brown, 1985; Henley and Berger, 2000).
There have been several fluid inclusion studies (Tufan, 2003; Oyman et al., 2003; Örgün et al., 2005; Yalcinkaya, 2010; Yilmaz et al., 2010; Cicek et al., 2012) describing the temperatures and gross salinity of the fluids of deposits in the west of Turkey. The studies by Bozkaya et al. (2014) and Bozkaya and Banks (2014) on the Tesbihdere and Arapuçandere deposits (Çanakkale) used fluid inclusion data to better understand the processes that controlled the fluid temperature and salinity and how this could be used to constrain the pressure–temperature–depth at the time of vein formation and mineralisation. The present day mining operations, at or approximately 100 m below the present surface, exploit part of the mineralisation that was originally emplaced approximately 600 m beneath the palaeosurface. Cooling due to contact with cool wall rocks and boiling or flashing are the important processes resulting from a decrease in pressure from lithostatic to hydrostatic or, in the case of flashing, sub-hydrostatic in response to tectonic movements. The extent of boiling (White and Hedenquist, 1990) also has implications for the deposition of silica in vein systems and many textures have been described (Moncada et al., 2012a, 2012b) that can be used to define the location of the boiling zone, which is often the most economically productive zone in
Abstract: In the Arapuçandere LS-IS epithermal deposit in western Turkey, either well crystallised euhedral quartz or milky amorphous silica occurrences are associated with the precious and base-metal mineralisation. This study has determined the relative importance of the processes precipitating both of these in relation to the deposition of the ore. Analysis by LA-ICPMS of euhedral quartz and amorphous silica show that the latter is associated with much higher metal concentrations and suggests that the process responsible is more important for deposition of ore in the deposit. Mineralisation at Kumarlar and Koru may be similar. Slow cooling precipitates euhedral quartz and some ore but flashing of hydrothermal fluids causes drastic decreases in both T and P, sufficient to quantitatively deposit base metals and Au. In amorphous silica bands base metals reach concentrations of 1000’s of ppm compared with a few 10’s ppm in euhedral quartz; Au can reach over 1 ppm compared with a few 10’s ppb in quartz. The drastic pressure change from lithostatic to sub-hydrostatic could reasonably be caused by opening of faults and fractures by seismic events.
Key words: Silica, mineralisation, Au, LA-ICPMS, trace metals
Received: 08.05.2014 Accepted/Published Online: 01.12.2014 Printed: 10.04.2015
Research Article
100
BOZKAYA and BANKS / Turkish J Earth Sci
epithermal systems. The different textures are the result of silica being supersaturated and initially precipitating as colloidal gels before recrystallisation. The different pathways followed during recrystallisation and the degree of the initial Si supersaturation (Adams 1920; Sander and Black, 1988; Dong et al., 1995) produce the different textures. A common feature are the “bonanza veins” where several depositional events are associated with high-grade
Au–Ag ores (Saunders, 1990, 1994; Marinova et al., 2013) that clearly illustrate the repetitive nature of ore deposition associated with numerous fluid flow events.
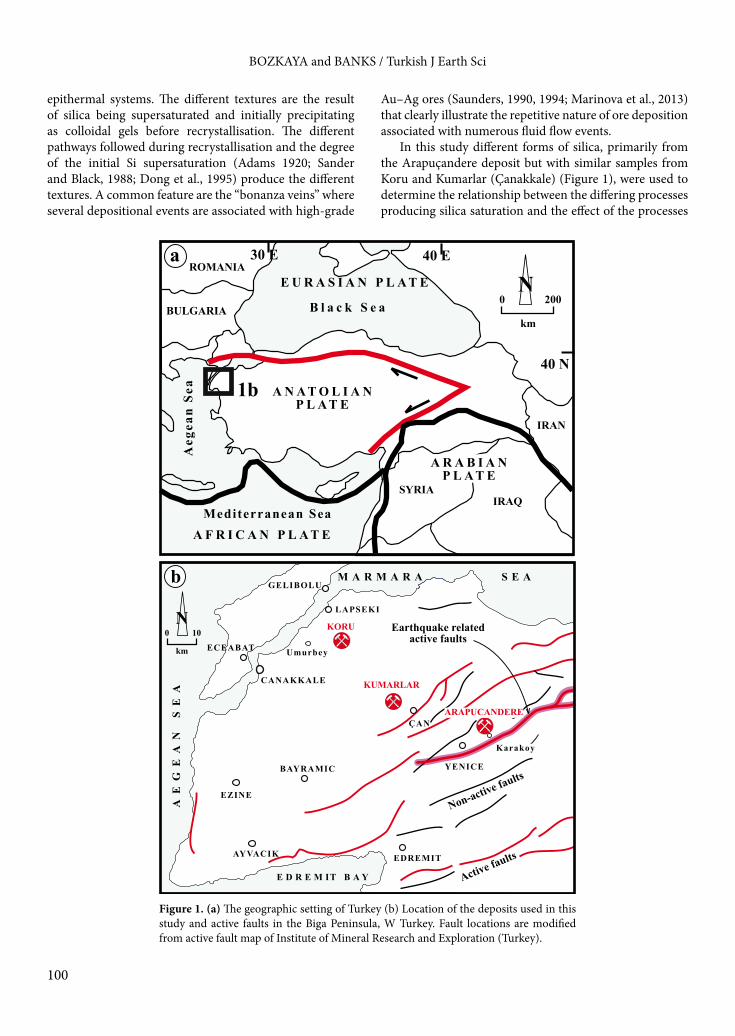
In this study different forms of silica, primarily from the Arapuçandere deposit but with similar samples from Koru and Kumarlar (Çanakkale) (Figure 1), were used to determine the relationship between the differing processes producing silica saturation and the effect of the processes
AE
GE
AN
S
EA
M A R M A R A S E A
E D R E M IT B A Y
BAYRAMIC
CANAKKALE
GELIBOLU
ECEABAT Umurbey
EZINE
EDREMIT
ÇAN
AYVACIK
LAPSEKI
KUMARLAR
0 10
km
N
b
KORU
40 E30 E
40 N
B l a c k S e a
Mediterranean Sea
a
1b
SYRIAIRAQ
IRAN
BULGARIA
ROMANIA
km
N0 200
Aeg
ean
Sea
YENICE
Karakoy
ARAPUCANDERE
Active faults
Non-active faults
Earthquake relatedactive faults
A N A T O L I A NP L A T E
E U R A S I A N P L A T E
A F R I C A N P L A T E
A R A B I A NP L A T E
Figure 1. (a) The geographic setting of Turkey (b) Location of the deposits used in this study and active faults in the Biga Peninsula, W Turkey. Fault locations are modified from active fault map of Institute of Mineral Research and Exploration (Turkey).
101
BOZKAYA and BANKS / Turkish J Earth Sci
on metal deposition. The deposits we have studied are low to intermediate sulphidation (LS-IS) epithermal deposits with some characteristics of carbonate base-metal-Au epithermal mineralisation. A fuller description of the mineralisation is presented in Bozkaya and Banks (2015). Early repetitive euhedral quartz growth contains the highest fluid inclusion temperatures and is not associated with significant mineralisation. This is cut by a later generation of smaller, semi-euhedral quartz and sulphides that is again repetitive. Fluid inclusions in this quartz are lower temperature than the first quartz but the salinities are the same and show no evidence of cooling by dilution. Bands of amorphous silica occur later than the euhedral quartz, but interspersed with both types. Quartz and silica occur on a micron to millimetric scale. Fluid inclusion evidence shows that “gentle” boiling was occurring during the deposition of the euhedral quartz and that this was a repetitive process. There is also evidence of flashing of the fluids (instantaneous conversion of all the liquid to vapour) and this causes the precipitation of the amorphous silica bands (Bozkaya and Banks, 2015; Bozkaya et al., 2014). As silica has a negative surface charge it can readily adsorb cations from solution and the greater surface area when silica is precipitated as colloidal particles could prove effective in accumulation of ore metals. Therefore, this study assesses the effectiveness of the different processes in precipitating metals from the ore fluid. Quartz and amorphous silica bands are observed in many Turkish LS to IS epithermal deposits and our results may be applicable to better understanding the process of mineralisation in these.
2. Analytical proceduresLaser-ablation inductively coupled mass-spectrometry (LA-ICP-MS) using an Agilent 7500c mass spectrometer, combined with a Geolas ablation system, was used to determine the concentration of the elements of interest across the different zones of quartz present in the veins. The Geolas ablation system uses a Compex 103 ArF excimer laser at a wavelength of 193 nm, delivering an energy density of 10–15 J cm–2 on the sample surface at a pulse frequency of typically 5 Hz with spot sizes of 50 µm or occasionally 100 µm. The spot size was determined to give an acceptable level of accuracy and precision combined with spatial resolution for the different quartz bands. The ablated material was transported from the ablation cell to an Agilent 7500c ICP-MS using 99.9999% He flowing at 2 mL min–1 into a cyclone mixer, where it was combined with the Ar carrier gas flowing at 1.02 mL min–1. The function of the mixer is to prolong the signal from the ablated inclusions and improve precision by increasing the number of cycles through the mass range selected and therefore the number of determinations
of the elemental ratios relative to Na. The instrument was operated in reaction cell mode using 2.5 mL min–1 99.9999% H2 to remove interferences from 40Ar on 40Ca and 56ArO on 56Fe. Calibration of the element/Na intensity ratios to weight/weight ratios was achieved using the NIST glass standard SRM-610 and the soda lime standard SRM-1412 (for K/Na ratios that were close to 1). SRM-610 was used to check for instrumental drift, which was found to be insignificant over each day’s analysis. The elements analysed were Na, Al, Si, K, Ca, Ti, Mn, Fe, Cu, Zn, Ge, As, Mo, Ag, Cd, In, Sn, Sb, Au, and Pb. Integration of the standard and sample signals was achieved with the SILLS software package (Guillong et al., 2008). Full details of the analytical protocols and calibration of the instrument are presented in Allan et al. (2005).
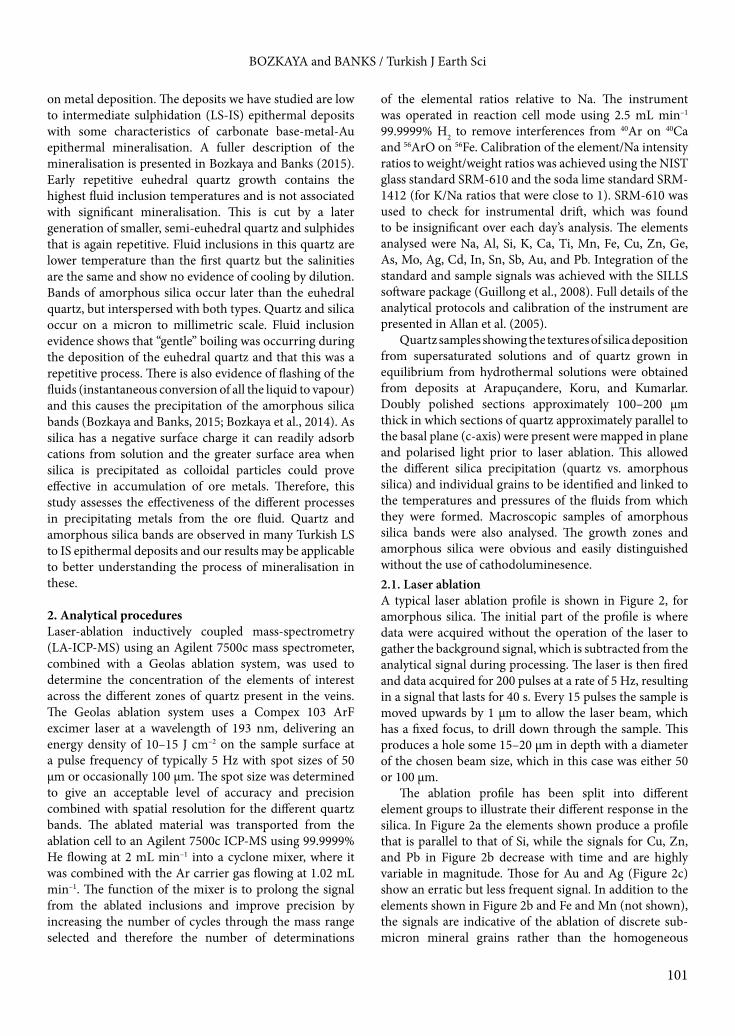
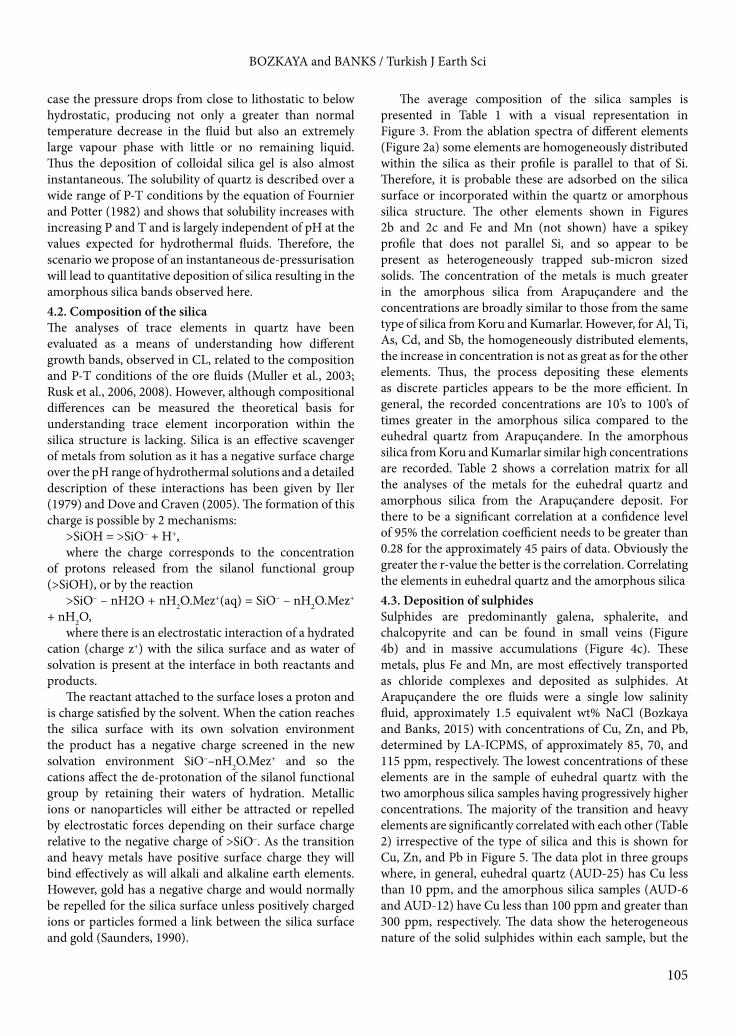
Quartz samples showing the textures of silica deposition from supersaturated solutions and of quartz grown in equilibrium from hydrothermal solutions were obtained from deposits at Arapuçandere, Koru, and Kumarlar. Doubly polished sections approximately 100–200 µm thick in which sections of quartz approximately parallel to the basal plane (c-axis) were present were mapped in plane and polarised light prior to laser ablation. This allowed the different silica precipitation (quartz vs. amorphous silica) and individual grains to be identified and linked to the temperatures and pressures of the fluids from which they were formed. Macroscopic samples of amorphous silica bands were also analysed. The growth zones and amorphous silica were obvious and easily distinguished without the use of cathodoluminesence.2.1. Laser ablationA typical laser ablation profile is shown in Figure 2, for amorphous silica. The initial part of the profile is where data were acquired without the operation of the laser to gather the background signal, which is subtracted from the analytical signal during processing. The laser is then fired and data acquired for 200 pulses at a rate of 5 Hz, resulting in a signal that lasts for 40 s. Every 15 pulses the sample is moved upwards by 1 µm to allow the laser beam, which has a fixed focus, to drill down through the sample. This produces a hole some 15–20 µm in depth with a diameter of the chosen beam size, which in this case was either 50 or 100 µm.
The ablation profile has been split into different element groups to illustrate their different response in the silica. In Figure 2a the elements shown produce a profile that is parallel to that of Si, while the signals for Cu, Zn, and Pb in Figure 2b decrease with time and are highly variable in magnitude. Those for Au and Ag (Figure 2c) show an erratic but less frequent signal. In addition to the elements shown in Figure 2b and Fe and Mn (not shown), the signals are indicative of the ablation of discrete sub-micron mineral grains rather than the homogeneous

102
BOZKAYA and BANKS / Turkish J Earth Sci
incorporation of the elements, in or on the amorphous silica (Figure 2a). During processing the whole of the ablation signal was integrated to produce an average count per second signal for each element after subtraction of the background signal and converted to an absolute concentration.
As the Ag and especially the Au signal indicate heterogeneous trapping of very small particles, Figure 2c
shows that 2 Au particles were ablated, and the samples were re-analysed with a 100-µm spot size determining only Si, Au, and Ag. Therefore, more rapid cycling through the mass range than we did for the data presented in Table 1 should reduce the possibility of the signal for Au and Ag being missed while the mass spectrometer was measuring other elements.
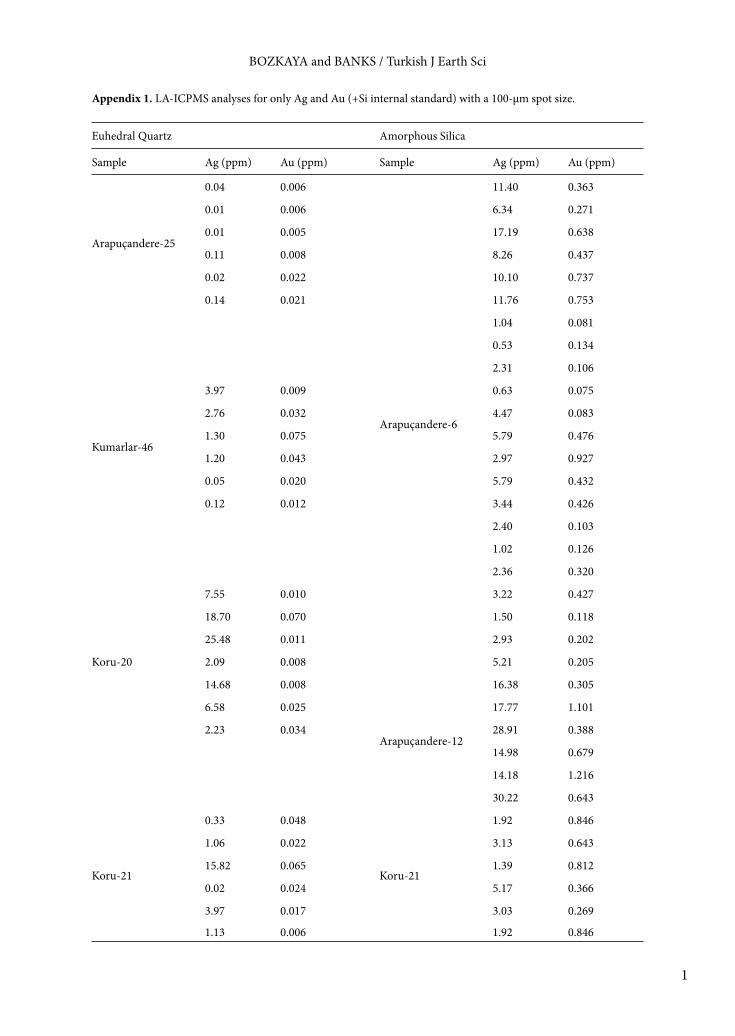
3. ResultsThe results of LA-ICPMS analysis of euhedral and amorphous silica from Arapuçandere and amorphous silica from the geologically similar LS-IS deposits of Koru and Kumarlar are presented in Table 1 and Figure 3. Analyses of Ag and Au from the protocol where these and Si were the only elements analysed and where the ablation spot was increased to 100 µm are presented in Appendix 1 (on the journal’s website). Appendix 2 (on the journal’s website) contains the results of the analysis of sphalerite, chalcopyrite, and galena, which were also ablated with a 100-µm spot. The variability in the analyses is shown by the errors, given here as one standard deviation, but these are not the procedural errors, rather they reflect the heterogeneous nature of some of the elements in the samples. Clearly the euhedral quartz has the lowest concentrations of many of the elements, especially the metallic elements. Some are at the same concentrations in both types of silica, i.e. Na, Al, Ti, and Ge. The ore forming elements Cu, Zn, Pb, Ag, and Au are distinctly different. The analyses of amorphous silica from the deposits at Kumarlar and Koru are broadly similar to the amorphous silica analysed from Arapuçandere. In euhedral quartz the concentrations of the alkali and alkaline elements are 100’s to 1000’s of ppm and these are close to the values from the amorphous silica and from the other deposits. The metallic elements are present at extremely low concentrations of ppm and ppb in euhedral quartz, but in the amorphous silica this increases to 10’s to 1000’s of ppm.
4. Discussion4.1. Silica depositionIn LS and IS epithermal ore systems the deposition of silica occurs in different textures, many of which are diagnostic of and the result of the processes that deposit the Au and Ag ore. Near surface boiling is reported by some researchers (Henley, 1991 and references therein) to account for metal deposition. Boiling destroys the Au(HS)2 complexes that transport metal in Au-dominated deposits, and in Ag-base metal systems, where Cl-complexing is predominant, changes in temperature and pH accompanying boiling also reduce metal solubility. Recognition of these boiling zones is often by the characteristic textures associated with them. One of the most common is bands of amorphous silica, and many LS-deposits have “bonanza veins” that are multiple silica bands with multiple Au–Ag-rich bands as electrum
0 10 20 30 40 50 60 70
SiAlTiAsCdSb
0 10 20 30 40 50 60 70
SiCuZnPb
Time seconds0 10 20 30 40 50 60 70
Coun
ts
100
101
102
103
104
105
106SiAuAg
Coun
ts
100
101
102
103
104
105
106
Coun
ts
100
101
102
103
104
105
106
a
b
c
Figure 2. LA-ICPMS profile of the elements analysed in amorphous silica bands from the Arapuçandere deposit.
103
BOZKAYA and BANKS / Turkish J Earth Sci
or other minerals, commonly termed ginguro bands. The degree of boiling is controlled by the reduction in pressure confining the fluid such that the fluid temperature is above the liquid-vapour curve. This normally occurs when the lithostatic pressure decreases on opening of vein systems and the fluid will boil into the free space. In doing so the fluid also cools by adiabatic expansion. Therefore, in this scenario silica over saturation is achieved by cooling and also by concentrating Si in the liquid phase of the boiling fluid as its solubility in the vapour is negligible. What type of silica is deposited depends on the saturation state of the fluid with respect to Si. Fluids that are slightly saturated may cool slowly to produce well-crystallised quartz, whereas extremely oversaturated fluids tend to produce colloidal aggregates or gels. Numerous quartz and silica textures have been reported from different deposits and a summary of these and their mode of occurrence has been described by Adams (1920), Sander and Black (1988), Dong et al. (1995), and Moncada (2012a, 2012b). These studies provide a description of how the initial conditions of silica deposition relate to the final structure of the different silica forms observed in the epithermal environment.
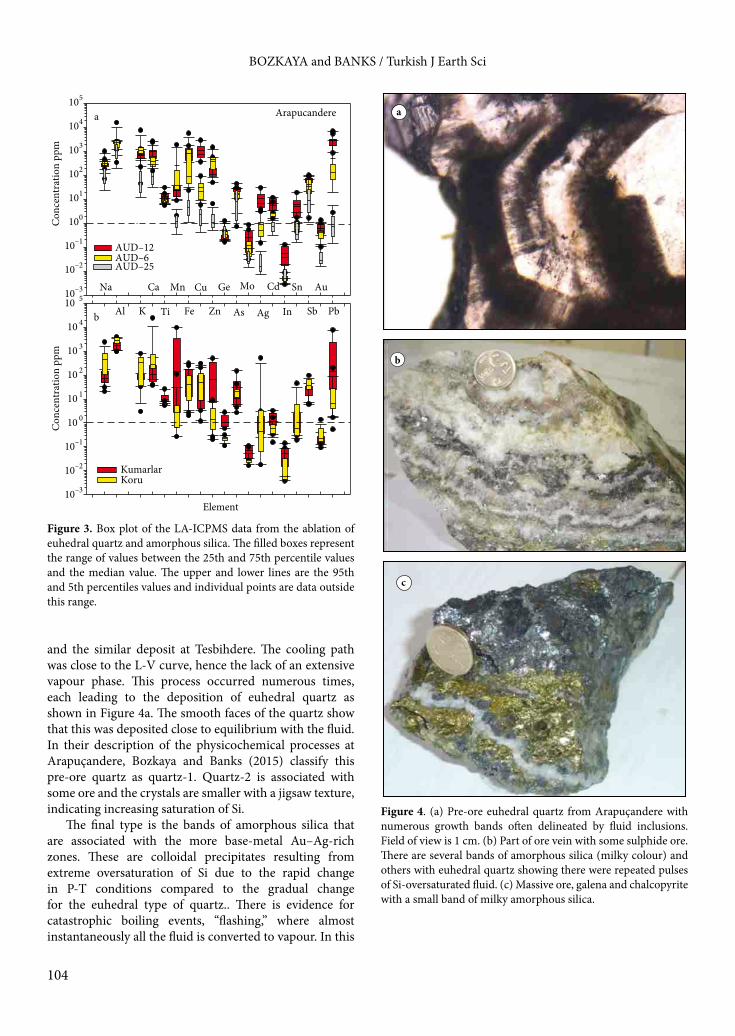
In the Arapuçandere deposit there are different generations of euhedral quartz (Figure 4a) deposition prior to mineralisation, which is replaced by smaller, more anhedral quartz during mineralisation. In addition, the deposition of amorphous silica bands (Figure 4b) is also associated with mineralisation episodic in nature with several discrete pulses evident, although the exact number is impossible to determine. The different styles are the result of the rate of the P-T changes with time, which leads to cooling of the hydrothermal fluid and an increase in the saturation state with respect to Si. The fluid in the Arapuçandere deposit has been shown to have been at approximately 350 °C and lithostatic pressure, based on fluid inclusion studies. There is evidence of boiling, from fluid inclusions that homogenise both to liquid and vapour at the same temperature, but not the generation of an extensive vapour phase, initiated by the change in pressure from lithostatic to near hydrostatic, possibly initiated by tectonic events. There appears to be only limited metal deposition at this stage. The decrease in pressure leads to adiabatic cooling of the fluid, which Bozkaya et al. (2014) and Bozkaya and Banks (2015) propose for this deposit
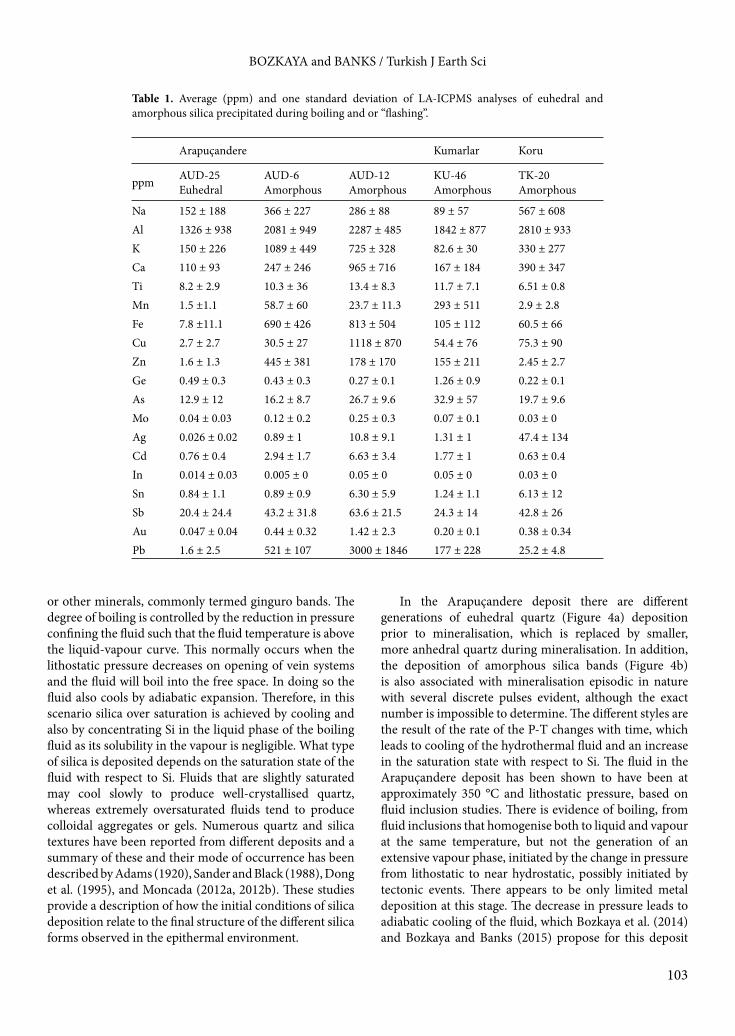
Table 1. Average (ppm) and one standard deviation of LA-ICPMS analyses of euhedral and amorphous silica precipitated during boiling and or “flashing”.
Arapuçandere Kumarlar Koru
ppm AUD-25Euhedral
AUD-6Amorphous
AUD-12Amorphous
KU-46Amorphous
TK-20Amorphous
Na 152 ± 188 366 ± 227 286 ± 88 89 ± 57 567 ± 608Al 1326 ± 938 2081 ± 949 2287 ± 485 1842 ± 877 2810 ± 933K 150 ± 226 1089 ± 449 725 ± 328 82.6 ± 30 330 ± 277Ca 110 ± 93 247 ± 246 965 ± 716 167 ± 184 390 ± 347Ti 8.2 ± 2.9 10.3 ± 36 13.4 ± 8.3 11.7 ± 7.1 6.51 ± 0.8Mn 1.5 ±1.1 58.7 ± 60 23.7 ± 11.3 293 ± 511 2.9 ± 2.8Fe 7.8 ±11.1 690 ± 426 813 ± 504 105 ± 112 60.5 ± 66Cu 2.7 ± 2.7 30.5 ± 27 1118 ± 870 54.4 ± 76 75.3 ± 90Zn 1.6 ± 1.3 445 ± 381 178 ± 170 155 ± 211 2.45 ± 2.7Ge 0.49 ± 0.3 0.43 ± 0.3 0.27 ± 0.1 1.26 ± 0.9 0.22 ± 0.1As 12.9 ± 12 16.2 ± 8.7 26.7 ± 9.6 32.9 ± 57 19.7 ± 9.6Mo 0.04 ± 0.03 0.12 ± 0.2 0.25 ± 0.3 0.07 ± 0.1 0.03 ± 0Ag 0.026 ± 0.02 0.89 ± 1 10.8 ± 9.1 1.31 ± 1 47.4 ± 134Cd 0.76 ± 0.4 2.94 ± 1.7 6.63 ± 3.4 1.77 ± 1 0.63 ± 0.4In 0.014 ± 0.03 0.005 ± 0 0.05 ± 0 0.05 ± 0 0.03 ± 0Sn 0.84 ± 1.1 0.89 ± 0.9 6.30 ± 5.9 1.24 ± 1.1 6.13 ± 12Sb 20.4 ± 24.4 43.2 ± 31.8 63.6 ± 21.5 24.3 ± 14 42.8 ± 26Au 0.047 ± 0.04 0.44 ± 0.32 1.42 ± 2.3 0.20 ± 0.1 0.38 ± 0.34Pb 1.6 ± 2.5 521 ± 107 3000 ± 1846 177 ± 228 25.2 ± 4.8
104
BOZKAYA and BANKS / Turkish J Earth Sci
and the similar deposit at Tesbihdere. The cooling path was close to the L-V curve, hence the lack of an extensive vapour phase. This process occurred numerous times, each leading to the deposition of euhedral quartz as shown in Figure 4a. The smooth faces of the quartz show that this was deposited close to equilibrium with the fluid. In their description of the physicochemical processes at Arapuçandere, Bozkaya and Banks (2015) classify this pre-ore quartz as quartz-1. Quartz-2 is associated with some ore and the crystals are smaller with a jigsaw texture, indicating increasing saturation of Si.
The final type is the bands of amorphous silica that are associated with the more base-metal Au–Ag-rich zones. These are colloidal precipitates resulting from extreme oversaturation of Si due to the rapid change in P-T conditions compared to the gradual change for the euhedral type of quartz.. There is evidence for catastrophic boiling events, “flashing,” where almost instantaneously all the fluid is converted to vapour. In this
Element
Con
cent
ratio
n pp
m
10–3
10–2
10–1
10 0
10 1
10 2
10 3
10 4
10 5
KumarlarKoru
AUD–12AUD–6AUD–25
Na
Al K
Ca
Ti
Mn
Fe
Cu
Zn
Ge
As
Mo
Ag
Cd
In
Sn
Sb
Au
Pb
Arapucandere
Conc
entr
atio
n pp
m
10–3
10–2
10–1
100
101
102
103
104
105
a
b
Figure 3. Box plot of the LA-ICPMS data from the ablation of euhedral quartz and amorphous silica. The filled boxes represent the range of values between the 25th and 75th percentile values and the median value. The upper and lower lines are the 95th and 5th percentiles values and individual points are data outside this range.
a
b
c
Figure 4. (a) Pre-ore euhedral quartz from Arapuçandere with numerous growth bands often delineated by fluid inclusions. Field of view is 1 cm. (b) Part of ore vein with some sulphide ore. There are several bands of amorphous silica (milky colour) and others with euhedral quartz showing there were repeated pulses of Si-oversaturated fluid. (c) Massive ore, galena and chalcopyrite with a small band of milky amorphous silica.
105
BOZKAYA and BANKS / Turkish J Earth Sci
case the pressure drops from close to lithostatic to below hydrostatic, producing not only a greater than normal temperature decrease in the fluid but also an extremely large vapour phase with little or no remaining liquid. Thus the deposition of colloidal silica gel is also almost instantaneous. The solubility of quartz is described over a wide range of P-T conditions by the equation of Fournier and Potter (1982) and shows that solubility increases with increasing P and T and is largely independent of pH at the values expected for hydrothermal fluids. Therefore, the scenario we propose of an instantaneous de-pressurisation will lead to quantitative deposition of silica resulting in the amorphous silica bands observed here.4.2. Composition of the silicaThe analyses of trace elements in quartz have been evaluated as a means of understanding how different growth bands, observed in CL, related to the composition and P-T conditions of the ore fluids (Muller et al., 2003; Rusk et al., 2006, 2008). However, although compositional differences can be measured the theoretical basis for understanding trace element incorporation within the silica structure is lacking. Silica is an effective scavenger of metals from solution as it has a negative surface charge over the pH range of hydrothermal solutions and a detailed description of these interactions has been given by Iler (1979) and Dove and Craven (2005). The formation of this charge is possible by 2 mechanisms:
>SiOH = >SiO– + H+,where the charge corresponds to the concentration
of protons released from the silanol functional group (>SiOH), or by the reaction
>SiO– – nH2O + nH2O.Mez+(aq) = SiO– – nH2O.Mez+ + nH2O,
where there is an electrostatic interaction of a hydrated cation (charge z+) with the silica surface and as water of solvation is present at the interface in both reactants and products.
The reactant attached to the surface loses a proton and is charge satisfied by the solvent. When the cation reaches the silica surface with its own solvation environment the product has a negative charge screened in the new solvation environment SiO––nH2O.Mez+ and so the cations affect the de-protonation of the silanol functional group by retaining their waters of hydration. Metallic ions or nanoparticles will either be attracted or repelled by electrostatic forces depending on their surface charge relative to the negative charge of >SiO–. As the transition and heavy metals have positive surface charge they will bind effectively as will alkali and alkaline earth elements. However, gold has a negative charge and would normally be repelled for the silica surface unless positively charged ions or particles formed a link between the silica surface and gold (Saunders, 1990).
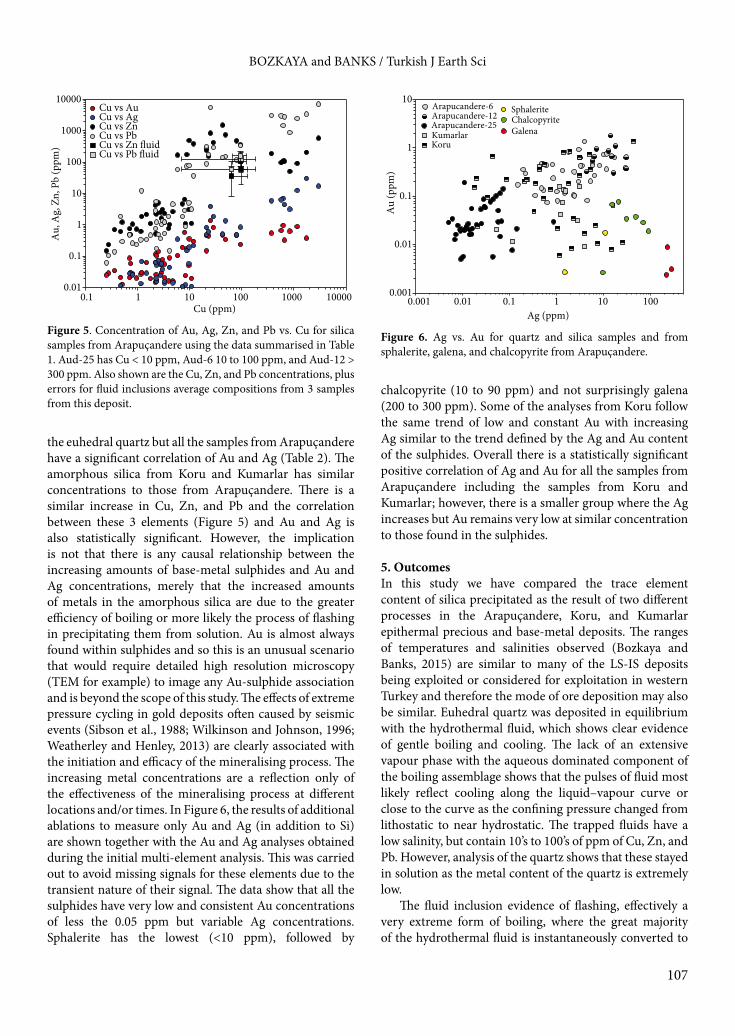
The average composition of the silica samples is presented in Table 1 with a visual representation in Figure 3. From the ablation spectra of different elements (Figure 2a) some elements are homogeneously distributed within the silica as their profile is parallel to that of Si. Therefore, it is probable these are adsorbed on the silica surface or incorporated within the quartz or amorphous silica structure. The other elements shown in Figures 2b and 2c and Fe and Mn (not shown) have a spikey profile that does not parallel Si, and so appear to be present as heterogeneously trapped sub-micron sized solids. The concentration of the metals is much greater in the amorphous silica from Arapuçandere and the concentrations are broadly similar to those from the same type of silica from Koru and Kumarlar. However, for Al, Ti, As, Cd, and Sb, the homogeneously distributed elements, the increase in concentration is not as great as for the other elements. Thus, the process depositing these elements as discrete particles appears to be the more efficient. In general, the recorded concentrations are 10’s to 100’s of times greater in the amorphous silica compared to the euhedral quartz from Arapuçandere. In the amorphous silica from Koru and Kumarlar similar high concentrations are recorded. Table 2 shows a correlation matrix for all the analyses of the metals for the euhedral quartz and amorphous silica from the Arapuçandere deposit. For there to be a significant correlation at a confidence level of 95% the correlation coefficient needs to be greater than 0.28 for the approximately 45 pairs of data. Obviously the greater the r-value the better is the correlation. Correlating the elements in euhedral quartz and the amorphous silica 4.3. Deposition of sulphidesSulphides are predominantly galena, sphalerite, and chalcopyrite and can be found in small veins (Figure 4b) and in massive accumulations (Figure 4c). These metals, plus Fe and Mn, are most effectively transported as chloride complexes and deposited as sulphides. At Arapuçandere the ore fluids were a single low salinity fluid, approximately 1.5 equivalent wt% NaCl (Bozkaya and Banks, 2015) with concentrations of Cu, Zn, and Pb, determined by LA-ICPMS, of approximately 85, 70, and 115 ppm, respectively. The lowest concentrations of these elements are in the sample of euhedral quartz with the two amorphous silica samples having progressively higher concentrations. The majority of the transition and heavy elements are significantly correlated with each other (Table 2) irrespective of the type of silica and this is shown for Cu, Zn, and Pb in Figure 5. The data plot in three groups where, in general, euhedral quartz (AUD-25) has Cu less than 10 ppm, and the amorphous silica samples (AUD-6 and AUD-12) have Cu less than 100 ppm and greater than 300 ppm, respectively. The data show the heterogeneous nature of the solid sulphides within each sample, but the

106
BOZKAYA and BANKS / Turkish J Earth Sci
correlation indicates that the different minerals are co-precipitated and this is perhaps more important than the actually numerical concentration. Also shown in Figure 5 are the Cu, Zn, and Pb average concentrations and variability from individual fluid inclusions hosted by three euhedral quartz samples. These plot close to the correlation of these elements in all the solid samples, implying that this was the ratio in the fluid that precipitated the sulphides in the silica. The absolute concentrations are approximately the same as those for sample AUD-6, but greater than for AUD-25 and less than for AUD-12. The evidence presented in Bozkaya and Banks (2015) indicates that the euhedral quartz (AUD-25) precipitated as a consequence of a gradual change in pressure from lithostatic to hydrostatic and loss of temperature by adiabatic expansion of the fluid. Therefore, the amount of sulphides precipitated would not totally deplete the metals from solution as there would still be a significant solubility at the temperature constrained by the hydrostatic pressure. However, the amorphous silica was precipitated by the sudden and catastrophic decrease in pressure and temperature. Flashing would decrease the pressure very considerably lower than hydrostatic with an associated much greater decrease in temperature. As both these factors will lower the solubility of metals in solution and will also destabilise and HS– complexes to give increased concentrations of S2–, it is likely that most of the metals will be precipitated from the hydrothermal solution. Therefore, it seems clear that the two processes causing the deposition of quartz and amorphous silica
are important in determining the quantity of ore metals being precipitated. Fluid mixing and cooling would also be effective in precipitating metals, but the fluid inclusion evidence (Bozkaya and Banks, 2015) does not support this.4.4. Deposition of gold and silverThe transport of Au in hydrothermal solutions in these deposits is most likely to be as the AuHS0 or Au(HS–)2 complexes depending on the temperature and pH of the fluids (Seward, 1989; Benning and Seward, 1996) and for Ag either as similar hydrosulphide complexes, AgHS0 (Migdisov and Williams-Jones, 2013), or as chloride complexes (Seward, 1976). Destruction of these transporting complexes is efficiently achieved by boiling where the vapour phase contains H2S and the native metals are precipitated. Several authors (Herrington and Wilkinson, 1993; Saunders, 1994) ascribe to the idea that these colloidal Au particles can then be transported in the hydrothermal fluid. From the ablation profiles (Figure 2c) of Au and Ag it is clear that these, like the base metal sulphides, are also heterogeneously distributed in the samples. Au is unlikely in any case to be evenly adsorbed as it has a negative surface charge that would be repelled by the negative charge on the silica surface (Westcott et al., 1998).
The data in Table 1 and in Figure 5 show that the euhedral quartz contains the lowest concentrations with the amorphous silica containing much higher amounts. For these samples the increase in Au is between 10 and 30 and for Ag between 30 and 400 times over the amount in
Table 2. Pearson’s correlation coefficient matrix for metallic elements in silica samples from Arapuçandere.
Mn Fe Cu Zn Ge As Mo Ag Cd In Sn Sb Au Pb
Mn 1Fe 0.64 1Cu 0.10 0.61 1Zn 0.87 0.75 0.18 1Ge -0.19 -0.14 -0.23 0.15 1As 0.23 0.45 0.48 0.21 0.01 1Mo 0.23 0.45 0.74 0.29 -0.11 0.34 1Ag 0.18 0.62 0.86 0.17 -0.23 0.42 0.57 1Cd 0.35 0.70 0.82 0.54 -0.06 0.43 0.64 0.85 1In 0.02 0.39 0.58 0.06 -0.08 0.22 0.44 0.57 0.48 1Sn 0.05 0.54 0.79 0.19 -0.07 0.33 0.67 0.56 0.64 0.57 1Sb 0.31 0.42 0.41 0.22 -0.37 0.84 0.27 0.39 0.37 0.15 0.20 1Au 0.26 0.56 0.82 0.36 -0.12 0.41 0.84 0.51 0.65 0.43 0.82 0.31 1Pb 0.21 0.67 0.93 0.21 -0.21 0.44 0.72 0.80 0.84 0.57 0.87 0.39 0.80 1
The critical r-value for 95% confidence and the number of analyses is approximately 0.28. Above this value the correlation of pairs of elements is considered to be significant.
107
BOZKAYA and BANKS / Turkish J Earth Sci
the euhedral quartz but all the samples from Arapuçandere have a significant correlation of Au and Ag (Table 2). The amorphous silica from Koru and Kumarlar has similar concentrations to those from Arapuçandere. There is a similar increase in Cu, Zn, and Pb and the correlation between these 3 elements (Figure 5) and Au and Ag is also statistically significant. However, the implication is not that there is any causal relationship between the increasing amounts of base-metal sulphides and Au and Ag concentrations, merely that the increased amounts of metals in the amorphous silica are due to the greater efficiency of boiling or more likely the process of flashing in precipitating them from solution. Au is almost always found within sulphides and so this is an unusual scenario that would require detailed high resolution microscopy (TEM for example) to image any Au-sulphide association and is beyond the scope of this study. The effects of extreme pressure cycling in gold deposits often caused by seismic events (Sibson et al., 1988; Wilkinson and Johnson, 1996; Weatherley and Henley, 2013) are clearly associated with the initiation and efficacy of the mineralising process. The increasing metal concentrations are a reflection only of the effectiveness of the mineralising process at different locations and/or times. In Figure 6, the results of additional ablations to measure only Au and Ag (in addition to Si) are shown together with the Au and Ag analyses obtained during the initial multi-element analysis. This was carried out to avoid missing signals for these elements due to the transient nature of their signal. The data show that all the sulphides have very low and consistent Au concentrations of less the 0.05 ppm but variable Ag concentrations. Sphalerite has the lowest (<10 ppm), followed by
chalcopyrite (10 to 90 ppm) and not surprisingly galena (200 to 300 ppm). Some of the analyses from Koru follow the same trend of low and constant Au with increasing Ag similar to the trend defined by the Ag and Au content of the sulphides. Overall there is a statistically significant positive correlation of Ag and Au for all the samples from Arapuçandere including the samples from Koru and Kumarlar; however, there is a smaller group where the Ag increases but Au remains very low at similar concentration to those found in the sulphides.
5. OutcomesIn this study we have compared the trace element content of silica precipitated as the result of two different processes in the Arapuçandere, Koru, and Kumarlar epithermal precious and base-metal deposits. The ranges of temperatures and salinities observed (Bozkaya and Banks, 2015) are similar to many of the LS-IS deposits being exploited or considered for exploitation in western Turkey and therefore the mode of ore deposition may also be similar. Euhedral quartz was deposited in equilibrium with the hydrothermal fluid, which shows clear evidence of gentle boiling and cooling. The lack of an extensive vapour phase with the aqueous dominated component of the boiling assemblage shows that the pulses of fluid most likely reflect cooling along the liquid–vapour curve or close to the curve as the confining pressure changed from lithostatic to near hydrostatic. The trapped fluids have a low salinity, but contain 10’s to 100’s of ppm of Cu, Zn, and Pb. However, analysis of the quartz shows that these stayed in solution as the metal content of the quartz is extremely low.
The fluid inclusion evidence of flashing, effectively a very extreme form of boiling, where the great majority of the hydrothermal fluid is instantaneously converted to
Cu (ppm)0.1 1 10 100 1000 10000
Au,
Ag,
Zn,
Pb
(ppm
)
0.01
0.1
1
10
100
1000
10000Cu vs AuCu vs AgCu vs ZnCu vs PbCu vs Zn �uidCu vs Pb �uid
Figure 5. Concentration of Au, Ag, Zn, and Pb vs. Cu for silica samples from Arapuçandere using the data summarised in Table 1. Aud-25 has Cu < 10 ppm, Aud-6 10 to 100 ppm, and Aud-12 > 300 ppm. Also shown are the Cu, Zn, and Pb concentrations, plus errors for fluid inclusions average compositions from 3 samples from this deposit.
Ag (ppm)0.001 0.01 0.1 1 10 100
Au
(ppm
)
0.001
0.01
0.1
1
10Arapucandere-6Arapucandere-12Arapucandere-25KumarlarKoru
SphaleriteChalcopyriteGalena
Figure 6. Ag vs. Au for quartz and silica samples and from sphalerite, galena, and chalcopyrite from Arapuçandere.
108
BOZKAYA and BANKS / Turkish J Earth Sci
vapour exists at Arapuçandere and the other two deposits. Extremely low density, almost empty inclusions are found as secondary inclusions. To initiate flashing the pressure must decrease to less than hydrostatic and must do so almost instantaneously. The result is a greater decrease in the temperature due to adiabatic expansion and a greater change in pH. Bisulphide complexes of Au will be destabilised, leading to the deposition of Au and releasing H2S to precipitate galena, sphalerite, and chalcopyrite. As Si has extremely low solubility in the vapour (Dolejs, 2010) supersaturation is quickly reached and colloidal silica gels are initially precipitated, later forming the bands of amorphous silica. Within these bands some metals adsorb on the silica surfaces while others form insoluble sulphides that are trapped, rather than adsorbed, within the amorphous silica. Au and Ag are likely to be present as discrete metallic particles. Au like Si has a negative surface charge and so does not adsorb directly on the colloidal silica, but may do so through the action of bridging cations that bind with the silanols and produce a positive outer charge.
The importance of the amorphous silica bands is that they are indicative of a more effective process depositing Au–Ag-base metals than the presence of quartz that, although precipitated due to boiling, was not an aggressive enough process to produce the high grade ore zones. Tectonic activity in this active earthquake zone appears to provide the most likely means of achieving the almost instantaneous pressure, and resultant temperature drop
required for the quantitative deposition of metals and silica from solution. Therefore, the importance of supersaturated silica deposition is that it is indicative of a process that is more effective in precipitating ore than boiling. Cooling and fluid mixing can also be more effective than boiling, but the fluid inclusion evidence (Bozkaya and Banks, 2015) does not support this.
The fluid inclusion evidence suggests that the fluid pressure was not sufficiently high to cause the instantaneous fracture of the rocks as going from lithostatic to hydrostatic pressures was gradual with quartz deposited largely in equilibrium with the changing fluid. The alternative is that sudden onset of earthquakes resulted in the creation of space with large pressure drops and that this mechanism induced deposition of silica and ore metals. The exact age of the mineralisation is unclear, but is likely to be consistent with similar deposits in this area at approximately 30 Ma (Yigit, 2012). This is area of Turkey has a complicated tectonic history before and after this period, summarised by Dilek (2006) and Altunkaynak and Dilek (2006), which show that collision, subduction, and the associated volcanism required to produce porphyry and associated epithermal mineralisation was ongoing. Seismic events would have been numerous and of sufficient magnitude to allow fluid movement in the active fault and fractures.
AcknowledgmentsThanks to Greg Corbett and an unknown reviewer for their reviews of an earlier version of the manuscript.
References
Adams SF (1920). A microscopic study of vein quartz. Econ Geol 15: 623–664.
Allan MM, Yardley BWD, Forbes LJ, Shmulovich KI, Banks DA, Shepherd TJ (2005). Validation of LA-ICP-MS fluid inclusion analysis with synthetic fluid inclusions. Am Mineral 90: 1767–1775.
Altunkaynak S, Dilek Y (2006). Timing and nature of postcollisional volcanism in western Anatolia and geodynamic implications. Geological Society of America Special Paper 409: 321–351.
Arribas Jr A (1995). Characteristics of high-sulfidation epithermal deposits and their relation to magmatic fluid. In: Thompson JFH (Ed.) Magmas, Fluids and Ore Deposits: Mineral Assoc of Canada Short Course 23: 419–454.
Benning LG, Seward TM (1996). Hydrosulphide complexing of Au(1) in hydrothermal solutions from 150-400°C and 500-1500 bar. Geochim Cosmochim Ac 60: 1849–1871.
Bozkaya G, Banks DA, Ozbas F, Wallington J (2014). Fluid processes in the Tesbihdere base-metal-Au deposit: implications for epithermal mineralization in the Biga Peninsula, NW Turkey. Cent Eur J Geosci 6: 148–169.
Bozkaya G, Banks DA (2015). Physico-chemical controls on ore deposition in the Arapucandere Pb-Zn-Cu deposit, Biga Peninsula, NW Turkey. Ore Geology Reviews 66: 65–88.
Cicek M, Oyman T, Ozgenc I, Akbulut M (2012). Fluid evolution of the Koru Pb-Zn deposit, Çanakkale (NW-Turkey), International Earth Science Colloquium on the Aegean Region, IESCA-2012 abstract book, page 158.
Dilek Y (2006). Collisional tectonics of the Mediterranean region: Causes and consequences. Geological Society of America Special paper 409: 1–13.
Dolejs D, Manning CE (2010). Thermodynamic model for mineral solubility in aqueous fluids: Theory, calibration and application to model fluid-flow systems. Geofluids 10: 20–40.
Dove PM, Craven CM (2005). Surface charge density on silica in alkali and alkaline earth chloride electrolyte solutions. Geochim Cosmochim Ac 69: 4963–4970.
Dong G, Morrison G, Jaireth S (1995). Quartz textures in epithermal veins, Queensland-classification, origin and implication. Econ Geol 90: 1841–1856.
109
BOZKAYA and BANKS / Turkish J Earth Sci
Fournier RA, Potter (III) RW (1982). An equation correlating the solubility of quartz in water from 25°C to 900°C at pressures up to 10,000 bars. Geochim Cosmochim Ac 46: 1969–1973.
Guillong M, Meir DL, Allan MM, Heinrich CA, Yardley BWD (2008). SILLS: A Matlab based program for the reduction of Laser Ablation ICP-MS data of homogeneous materials and inclusions. Mineral Assoc of Canada Short Course 40: 328–333.
Hedenquist JW, Lowenstern JB (1994). The role of magmas in the formation of hydrothermal ore deposits. Nature 370: 519–527.
Henley RW (1991). Epithermal gold deposits in volcanic terranes. In Foster RP, editor, Gold Metallogeny and Exploration. Glasgow, UK: Blackie, pp 133–164.
Henley RW, Berger BR (2000). Self-ordering and complexity in epizonal mineral deposits. Ann Rev Earth Pl Sc 28: 669–719.
Henley RW, Brown KL (1985). A practical guide to the chemistry of geothermal and epithermal systems. In Berger BR, Bethke PM, editors. Geology and Geochemistry of Epithermal Systems. Society of Economic Geology, Reviews in Economic Geology 2: 25–44.
Henley RW, Ellis AJ (1983). Geothermal systems ancient and modern: a geothermal review. Earth Sciences Review 19: 1–50.
Henley RW, McNabb A (1978). Magmatic vapour plumes and ground water interaction in porphyry copper emplacement. Econ Geol 73: 1–20.
Herrington RJ, Wilkinson JJ (1993). Colloidal gold and silica in mesothermal vein systems. Geology 21: 539–542.
Iler RK (1979). The Chemistry of Silica: Solubility, Polymerization, Colloid and Surface Properties, and Biochemistry. New York, NY, USA: Wiley, 24: 866 p.
Imer EU, Güleç N, Kuscu I, Fallick AE (2013). Genetic investigation and comparison of Kartaldag and Madendag epithermal gold deposits in Çanakkale, NW Turkey. Ore Geol Rev 53: 204–222.
Marinova IK, Titorenkova RH, Ganev VY (2013). Colloidal origin of the quartz-adularia millimetre-to-submillimetre-wide banding of bonanza electrum grades in the epithermal, low-sulphidsation, sedimentary rock hosted Au-Ag Khan Krum deposit, Bulgaria. CR Acad Bulg Sci 66: 1291–1298.
Migdisov AA, Williams-Jones AE (2013). A predictive model for metal transport of silver chloride by aqueous vapour in ore-forming magmatic-hydrothermal systems. Geochim Cosmochim Ac 104: 123–135.
Moncada D, Bodnar RJ (2012a). Gangue mineral textures and fluid inclusion characteristics of the Santa Margarita Vein in the Guanajuato Mining District, Mexico. Cent Eur J Geosci 4: 300–309.
Moncada D, Mutchler S, Nieto A, Reynolds TJ, Rimstidt JD, Bodnar RJ (2012b). Mineral textures and fluid inclusion petrography of the epithermal Ag-Au deposits at Guanajuato, Mexico: application to exploration. J Geochem Explor 114: 20–35.
Muller A, Wiedenbeck M, Van Den Kerkhof AM, Kronz A, Simon K (2003). Trace elements in quartz – a combined electron microprobe, secondary ion mass spectrometry, laser-ablation ICP-MS, and cathodoluminescence study. Eur J Mineral 15: 747–763.
Oyman T, Minareci F, Piskin O (2003). Efemcukuru B-rich epithermal gold deposit (Izmir, Turkey). Ore Geol Rev 23: 35–53.
Orgun Y, Gultekin AH, Onal A (2005). Geology, mineralogy and fluid inclusion data from the Arapucan Pb-Zn-Cu-Ag deposit, Canakkale, Turkey. J Asian Earth Sci 25: 629–642.
Richards JP (2011). Magmatic to hydrothermal metal fluxes in convergent and collided margins. Ore Geol Rev 40: 1–26.
Rusk BG, Reed MH, Dilles JH, Kent AJR (2006). Intensity of quartz cathodoluminescence and trace-elements content in quartz from the porphyry copper deposit at Butte, Montana. Am Mineral 91: 1300–1312.
Rusk BG, Lowers HA, Reed MH (2008). Trace elements in hydrothermal quartz: Relationships to cathodoluminescent textures and insight into vein formation. Geology 36: 547–550.
Sander MV, Black JE (1988). Crystallization and recrystallization of growth-zoned quartz crystals from epithermal systems-implications for fluid inclusion studies. Econ Geol 83: 1052–1060.
Saunders JA (1990). Colloidal transport of gold and silica in epithermal precious-metal system: evidence from the Sleeper deposit, Nevada. Geology 18: 757–760.
Saunders JA (1994). Silica and gold textures in bonanza ores of the Sleeper deposit, Humbolt County, Nevada: evidence for colloids and implications for epithermal ore-forming processes. Econ Geol 89: 628–638.
Seward TM (1976). The stability of chloride complexes of silver in hydrothermal solutions up to 350°C. Geochim Cosmochim Ac 40: 1329–1341.
Seward TM (1989). The hydrothermal chemistry of gold and its implication for ore formation: boiling and conductive cooling as examples. Economic Geology Monographs 6: 398–404.
Sibson RH, Robert F, Poulsen KH (1988). High-angle reverse faults, fluid-pressure cycling, and mesothermal gold-quartz deposits. Geology 16: 551–555.
Tanner D, Henley RW, Mavrogenes JA, Holden P (2013). Combining in situ isotopic, trace element and textural analyses of quartz from four magmatic-hydrothermal ore deposits. Contrib Miner Petr 166: 1119–1142.
Tufan EA (1993). Geologic and petrographic features of Karaaydın (Yenice-Canakkale) and the study of Pb–Zn mineralizations: Unpublished PhD Thesis, Selçuk University, 158p.
Weatherley DK, Henley RW (2013). Flash vaporization during earthquakes evidenced by gold deposits. Nature Geoscience 6: 294–298.
Westcott SL, Oldenburg SJ, Lee TR, Halas NJ (1998). Formation and adsorption of clusters of gold nanoparticles onto functionalized silica nanoparticle surfaces. Langmuir 14: 5396–5401.
White NC, Hedenquist JW (1990). Epithermal environments and styles of mineralization; variations and their causes, and guidelines for exploration. J Geochem Explor 36: 445–474.
Wilkinson JJ, Johnson JD (1996). Pressure fluctuations, phase separation and gold precipitation during seismic fracture propagation. Geology 24: 395–398.
110
BOZKAYA and BANKS / Turkish J Earth Sci
Yalcinkaya N (2010). Geological, mineralogical and geochemical investigation of the Koru (Lapseki-Canakkale) Pb-Zn-Ag deposit. Master thesis, 181 p., Çanakkale Onsekiz Mart University, unpublished.
Yiğit O (2012). A prospective sector in the Tethyan Metallogenic Belt: Geology and geochronology of mineral deposits in the Biga Peninsula, NW Turkey. Ore Geol Rev 46: 118–148.
Yilmaz H, Sönmez FN, Akay E, Sener AK, Tufan ST (2013). Low-sulfidation epithermal Au-Ag mineralization in the Sindirgi District, Balikesir Province, Turkey. Turkish J Earth Sci 22: 485–522.
Yilmaz H, Oyman T, Sönmez FN, Arehart GB, Billor Z (2010). Intermediate sulfidation epithermal gold-base metal deposits in Tertiary subaeria volcanic rocks, Sahinli/Tespih Dere (Lapseki/Western Turkey). Ore Geol Rev 37: 236–258.
1
BOZKAYA and BANKS / Turkish J Earth Sci
Appendix 1. LA-ICPMS analyses for only Ag and Au (+Si internal standard) with a 100-µm spot size.
Euhedral Quartz Amorphous Silica
Sample Ag (ppm) Au (ppm) Sample Ag (ppm) Au (ppm)
Arapuçandere-25
0.04 0.006
Arapuçandere-6
11.40 0.363
0.01 0.006 6.34 0.271
0.01 0.005 17.19 0.638
0.11 0.008 8.26 0.437
0.02 0.022 10.10 0.737
0.14 0.021 11.76 0.753
1.04 0.081
0.53 0.134
2.31 0.106
Kumarlar-46
3.97 0.009 0.63 0.075
2.76 0.032 4.47 0.083
1.30 0.075 5.79 0.476
1.20 0.043 2.97 0.927
0.05 0.020 5.79 0.432
0.12 0.012 3.44 0.426
2.40 0.103
1.02 0.126
2.36 0.320
Koru-20
7.55 0.010 3.22 0.427
18.70 0.070 1.50 0.118
25.48 0.011 2.93 0.202
2.09 0.008 5.21 0.205
14.68 0.008
Arapuçandere-12
16.38 0.305
6.58 0.025 17.77 1.101
2.23 0.034 28.91 0.388
14.98 0.679
14.18 1.216
30.22 0.643
Koru-21
0.33 0.048
Koru-21
1.92 0.846
1.06 0.022 3.13 0.643
15.82 0.065 1.39 0.812
0.02 0.024 5.17 0.366
3.97 0.017 3.03 0.269
1.13 0.006 1.92 0.846
2
BOZKAYA and BANKS / Turkish J Earth Sci
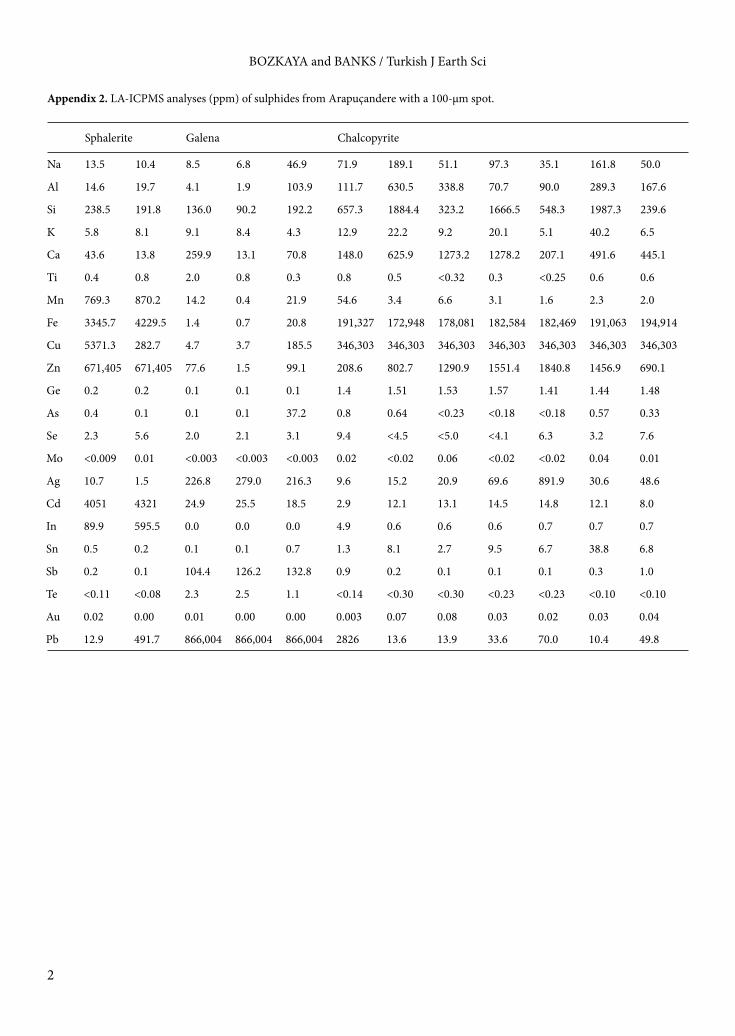
Appendix 2. LA-ICPMS analyses (ppm) of sulphides from Arapuçandere with a 100-µm spot.
Sphalerite Galena Chalcopyrite
Na 13.5 10.4 8.5 6.8 46.9 71.9 189.1 51.1 97.3 35.1 161.8 50.0
Al 14.6 19.7 4.1 1.9 103.9 111.7 630.5 338.8 70.7 90.0 289.3 167.6
Si 238.5 191.8 136.0 90.2 192.2 657.3 1884.4 323.2 1666.5 548.3 1987.3 239.6
K 5.8 8.1 9.1 8.4 4.3 12.9 22.2 9.2 20.1 5.1 40.2 6.5
Ca 43.6 13.8 259.9 13.1 70.8 148.0 625.9 1273.2 1278.2 207.1 491.6 445.1
Ti 0.4 0.8 2.0 0.8 0.3 0.8 0.5 <0.32 0.3 <0.25 0.6 0.6
Mn 769.3 870.2 14.2 0.4 21.9 54.6 3.4 6.6 3.1 1.6 2.3 2.0
Fe 3345.7 4229.5 1.4 0.7 20.8 191,327 172,948 178,081 182,584 182,469 191,063 194,914
Cu 5371.3 282.7 4.7 3.7 185.5 346,303 346,303 346,303 346,303 346,303 346,303 346,303
Zn 671,405 671,405 77.6 1.5 99.1 208.6 802.7 1290.9 1551.4 1840.8 1456.9 690.1
Ge 0.2 0.2 0.1 0.1 0.1 1.4 1.51 1.53 1.57 1.41 1.44 1.48
As 0.4 0.1 0.1 0.1 37.2 0.8 0.64 <0.23 <0.18 <0.18 0.57 0.33
Se 2.3 5.6 2.0 2.1 3.1 9.4 <4.5 <5.0 <4.1 6.3 3.2 7.6
Mo <0.009 0.01 <0.003 <0.003 <0.003 0.02 <0.02 0.06 <0.02 <0.02 0.04 0.01
Ag 10.7 1.5 226.8 279.0 216.3 9.6 15.2 20.9 69.6 891.9 30.6 48.6
Cd 4051 4321 24.9 25.5 18.5 2.9 12.1 13.1 14.5 14.8 12.1 8.0
In 89.9 595.5 0.0 0.0 0.0 4.9 0.6 0.6 0.6 0.7 0.7 0.7
Sn 0.5 0.2 0.1 0.1 0.7 1.3 8.1 2.7 9.5 6.7 38.8 6.8
Sb 0.2 0.1 104.4 126.2 132.8 0.9 0.2 0.1 0.1 0.1 0.3 1.0
Te <0.11 <0.08 2.3 2.5 1.1 <0.14 <0.30 <0.30 <0.23 <0.23 <0.10 <0.10
Au 0.02 0.00 0.01 0.00 0.00 0.003 0.07 0.08 0.03 0.02 0.03 0.04
Pb 12.9 491.7 866,004 866,004 866,004 2826 13.6 13.9 33.6 70.0 10.4 49.8