Embed Size (px)
DESCRIPTION
The Implications of Housing Density and Mix on House Prices. Glen Bramley, Neil Dunse, Sotirios Thanos and David Watkins School of the Built Environment Heriot Watt University Edinburgh Email: [email protected]. Background. - PowerPoint PPT Presentation
Citation preview
The Implications of Housing Density and Mix on House Prices
Glen Bramley, Neil Dunse, Sotirios Thanos and David Watkins
School of the Built Environment
Heriot Watt UniversityEdinburgh
Email: [email protected]
ERES 2009
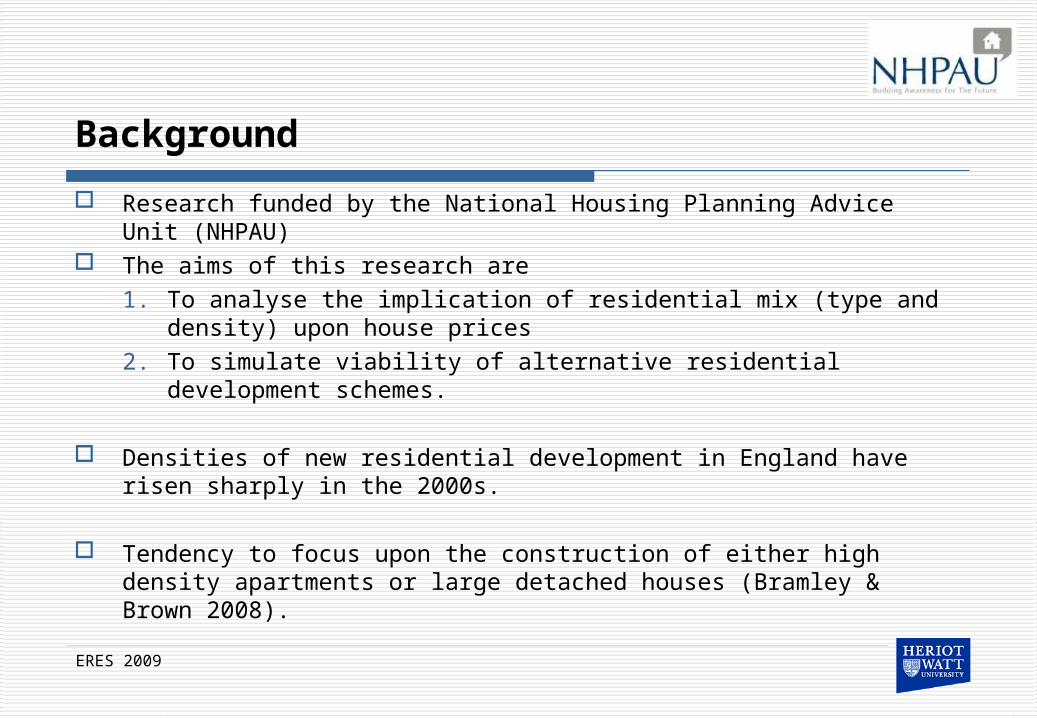
Background
Research funded by the National Housing Planning Advice Unit (NHPAU) The aims of this research are
1. To analyse the implication of residential mix (type and density) upon house prices
2. To simulate viability of alternative residential development schemes.
Densities of new residential development in England have risen sharply in the 2000s.
Tendency to focus upon the construction of either high density apartments or large detached houses (Bramley & Brown 2008).
ERES 2009
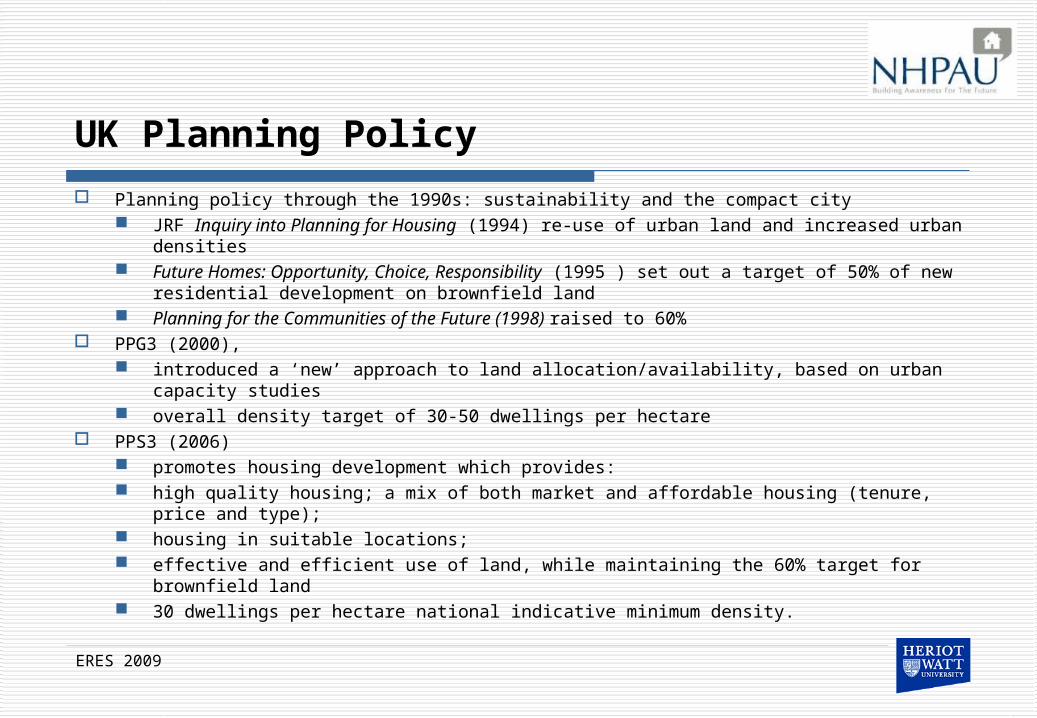
UK Planning Policy
Planning policy through the 1990s: sustainability and the compact city JRF Inquiry into Planning for Housing (1994) re-use of urban land and increased urban
densities Future Homes: Opportunity, Choice, Responsibility (1995 ) set out a target of 50% of new
residential development on brownfield land Planning for the Communities of the Future (1998) raised to 60%
PPG3 (2000), introduced a ‘new’ approach to land allocation/availability, based on urban capacity studies overall density target of 30-50 dwellings per hectare
PPS3 (2006) promotes housing development which provides: high quality housing; a mix of both market and affordable housing (tenure, price and type); housing in suitable locations; effective and efficient use of land, while maintaining the 60% target for brownfield land 30 dwellings per hectare national indicative minimum density.
ERES 2009
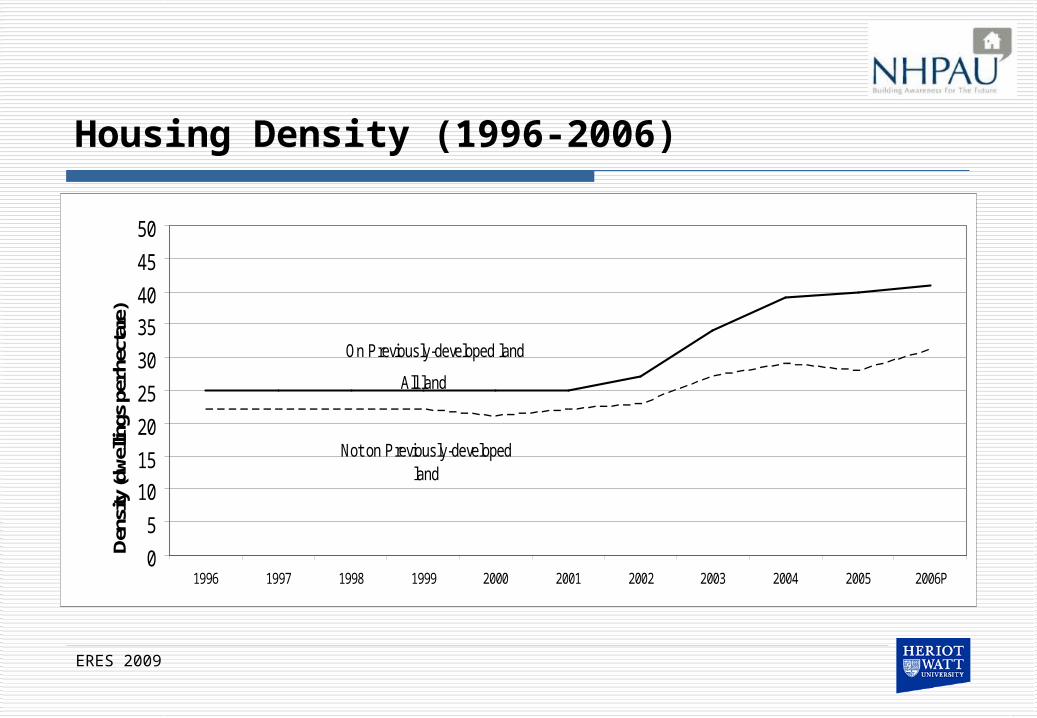
Housing Density (1996-2006)
ERES 2009
On Previously-developed land
Not on Previously-developed land
All land
0
5
10
15
20
25
30
35
40
45
50
1996 1997 1998 1999 2000 2001 2002 2003 2004 2005 2006P
Den
sity
(dw
ellin
gs p
er h
ecta
re)
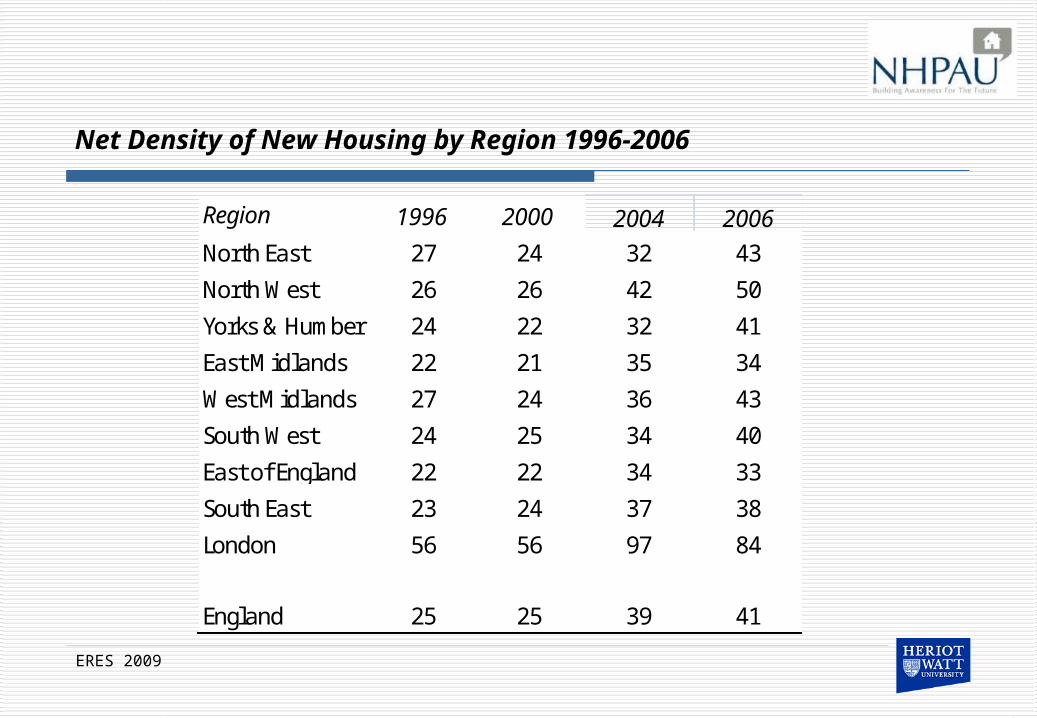
Net Density of New Housing by Region 1996-2006
ERES 2009
Region 1996 2000 2004 2006North East 27 24 32 43
North West 26 26 42 50
Yorks & Humber 24 22 32 41
East Midlands 22 21 35 34
West Midlands 27 24 36 43
South West 24 25 34 40
East of England 22 22 34 33
South East 23 24 37 38
London 56 56 97 84
England 25 25 39 41
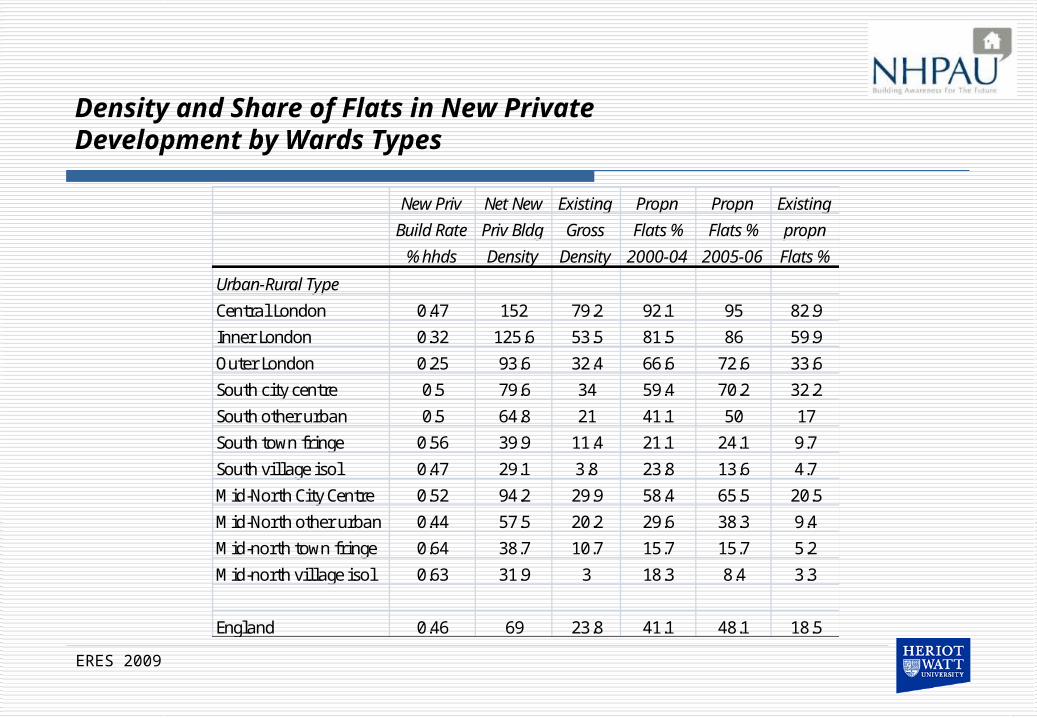
Density and Share of Flats in New Private Development by Wards Types
ERES 2009
New Priv Net New Existing Propn Propn Existing
Build Rate Priv Bldg Gross Flats % Flats % propn
% hhds Density Density 2000-04 2005-06 Flats %
Urban-Rural Type
Central London 0.47 152 79.2 92.1 95 82.9
Inner London 0.32 125.6 53.5 81.5 86 59.9
Outer London 0.25 93.6 32.4 66.6 72.6 33.6
South city centre 0.5 79.6 34 59.4 70.2 32.2
South other urban 0.5 64.8 21 41.1 50 17
South town fringe 0.56 39.9 11.4 21.1 24.1 9.7
South vil lage isol 0.47 29.1 3.8 23.8 13.6 4.7
Mid-North City Centre 0.52 94.2 29.9 58.4 65.5 20.5
Mid-North other urban 0.44 57.5 20.2 29.6 38.3 9.4
Mid-north town fringe 0.64 38.7 10.7 15.7 15.7 5.2
Mid-north vil lage isol 0.63 31.9 3 18.3 8.4 3.3
England 0.46 69 23.8 41.1 48.1 18.5
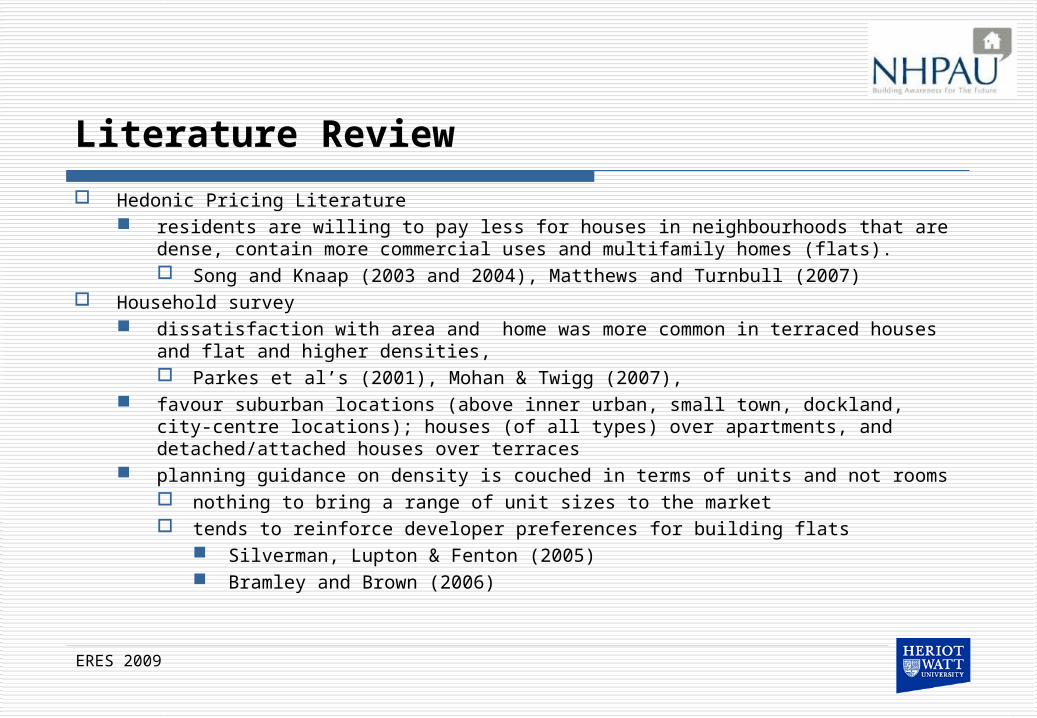
Literature Review
Hedonic Pricing Literature residents are willing to pay less for houses in neighbourhoods that are dense, contain more
commercial uses and multifamily homes (flats). Song and Knaap (2003 and 2004), Matthews and Turnbull (2007)
Household survey dissatisfaction with area and home was more common in terraced houses and flat and
higher densities, Parkes et al’s (2001), Mohan & Twigg (2007),
favour suburban locations (above inner urban, small town, dockland, city-centre locations); houses (of all types) over apartments, and detached/attached houses over terraces
planning guidance on density is couched in terms of units and not rooms nothing to bring a range of unit sizes to the market tends to reinforce developer preferences for building flats
Silverman, Lupton & Fenton (2005) Bramley and Brown (2006)
ERES 2009
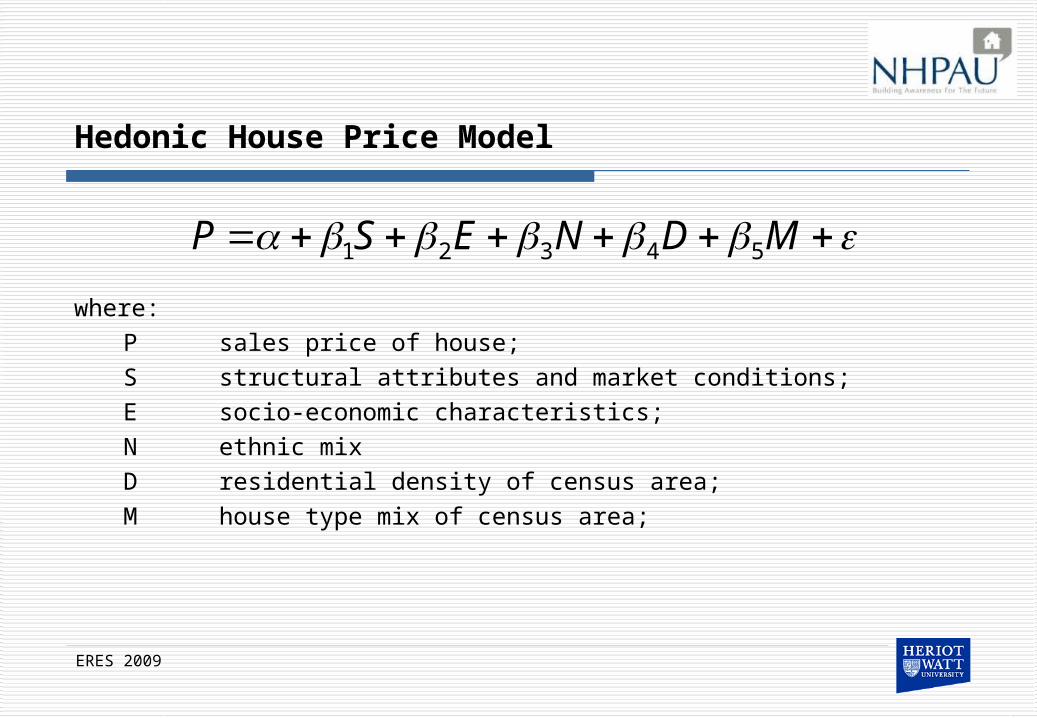
Hedonic House Price Model
where:P sales price of house;S structural attributes and market conditions;E socio-economic characteristics;N ethnic mixD residential density of census area;M house type mix of census area;
ERES 2009
MDNESP 54321
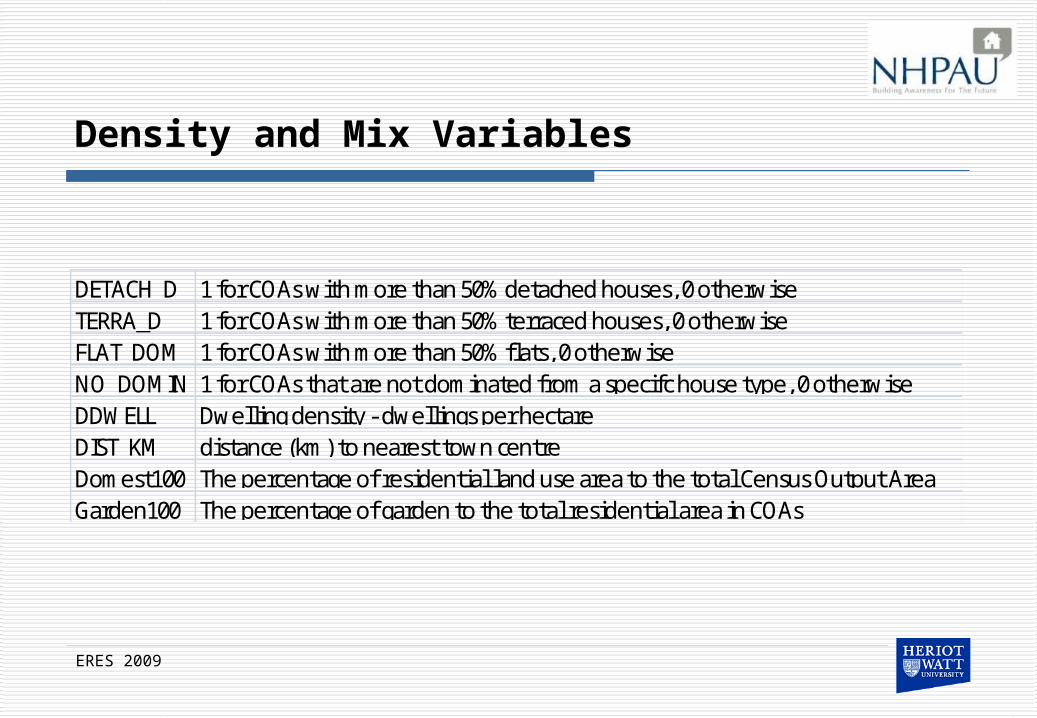
Density and Mix Variables
ERES 2009
DETACH_D 1 for COAs with more than 50% detached houses, 0 otherwiseTERRA_D 1 for COAs with more than 50% terraced houses, 0 otherwiseFLAT_DOM 1 for COAs with more than 50% flats, 0 otherwiseNO_DOMIN 1 for COAs that are not dominated from a specifc house type, 0 otherwiseDDWELL Dwelling density - dwellings per hectareDIST_KM distance (km) to nearest town centreDomest100 The percentage of residential land use area to the total Census Output AreaGarden100 The percentage of garden to the total residential area in COAs
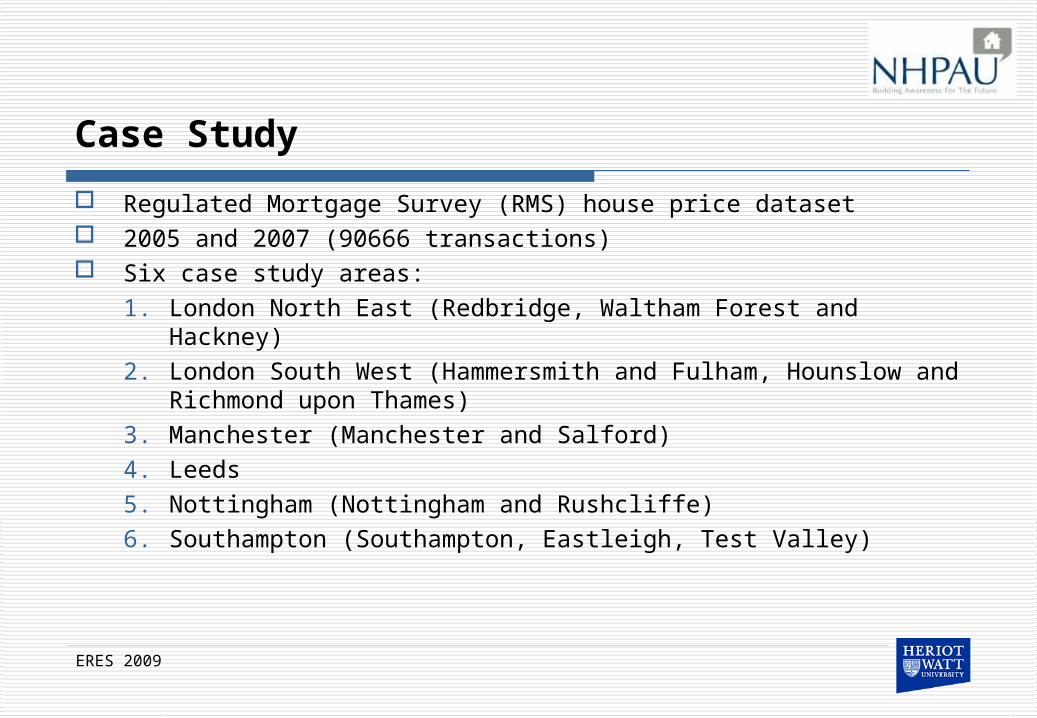
Case Study
Regulated Mortgage Survey (RMS) house price dataset 2005 and 2007 (90666 transactions) Six case study areas:
1. London North East (Redbridge, Waltham Forest and Hackney) 2. London South West (Hammersmith and Fulham, Hounslow and
Richmond upon Thames) 3. Manchester (Manchester and Salford) 4. Leeds 5. Nottingham (Nottingham and Rushcliffe) 6. Southampton (Southampton, Eastleigh, Test Valley)
ERES 2009
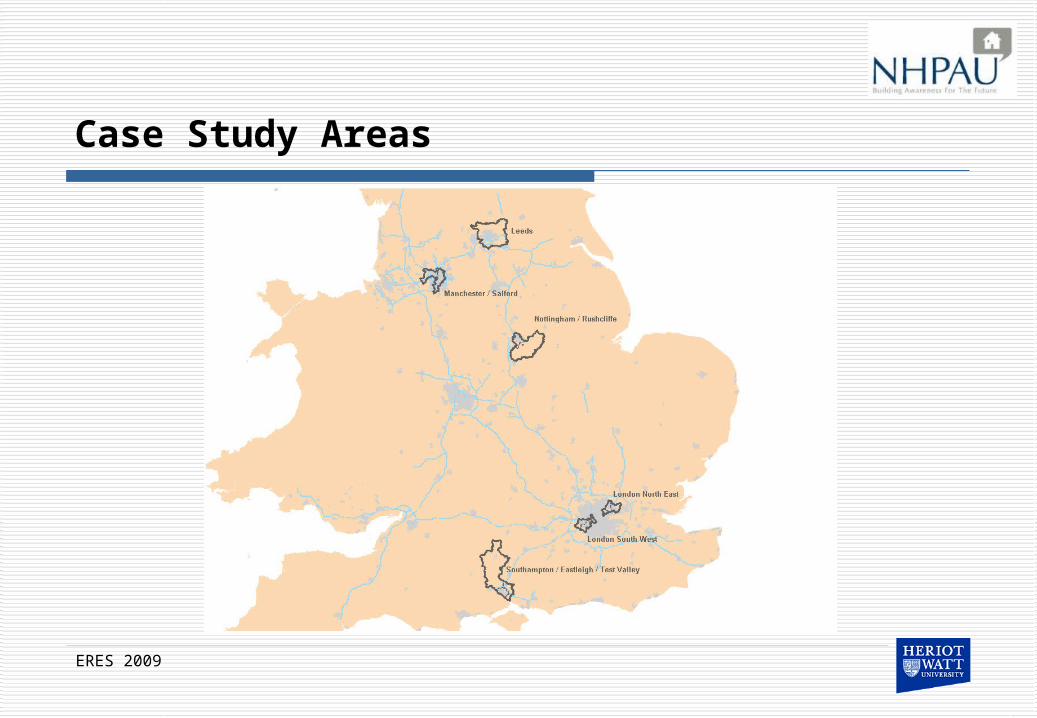
Case Study Areas
ERES 2009
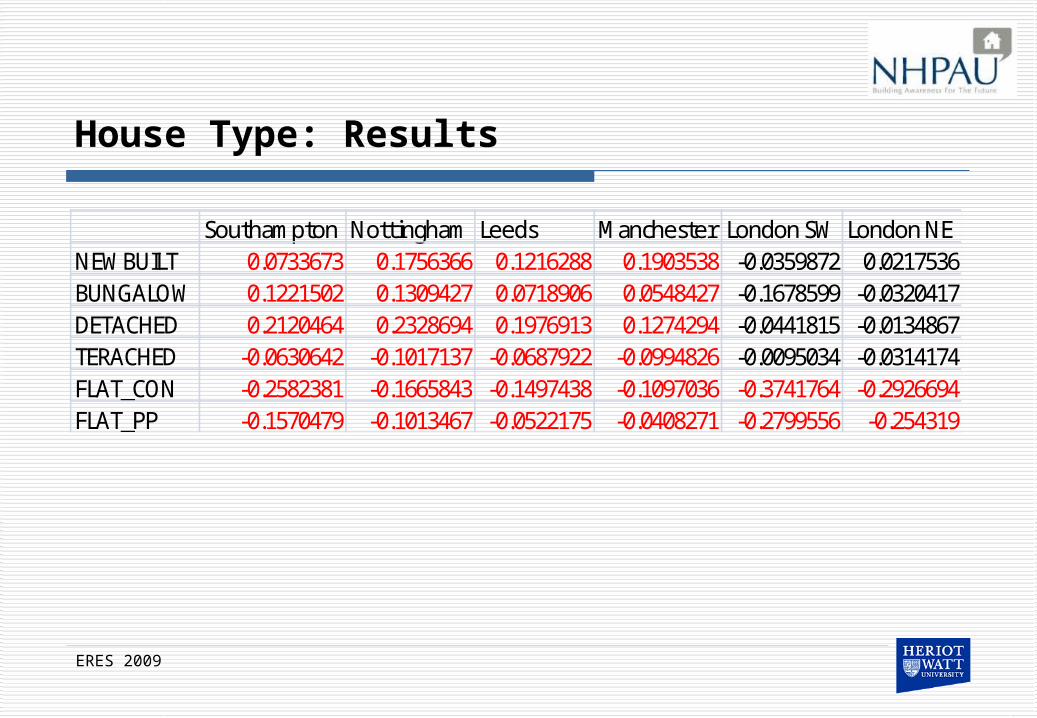
House Type: Results
ERES 2009
Southampton Nottingham Leeds Manchester London SW London NENEWBUILT 0.0733673 0.1756366 0.1216288 0.1903538 -0.0359872 0.0217536BUNGALOW 0.1221502 0.1309427 0.0718906 0.0548427 -0.1678599 -0.0320417DETACHED 0.2120464 0.2328694 0.1976913 0.1274294 -0.0441815 -0.0134867TERACHED -0.0630642 -0.1017137 -0.0687922 -0.0994826 -0.0095034 -0.0314174FLAT_CON -0.2582381 -0.1665843 -0.1497438 -0.1097036 -0.3741764 -0.2926694FLAT_PP -0.1570479 -0.1013467 -0.0522175 -0.0408271 -0.2799556 -0.254319
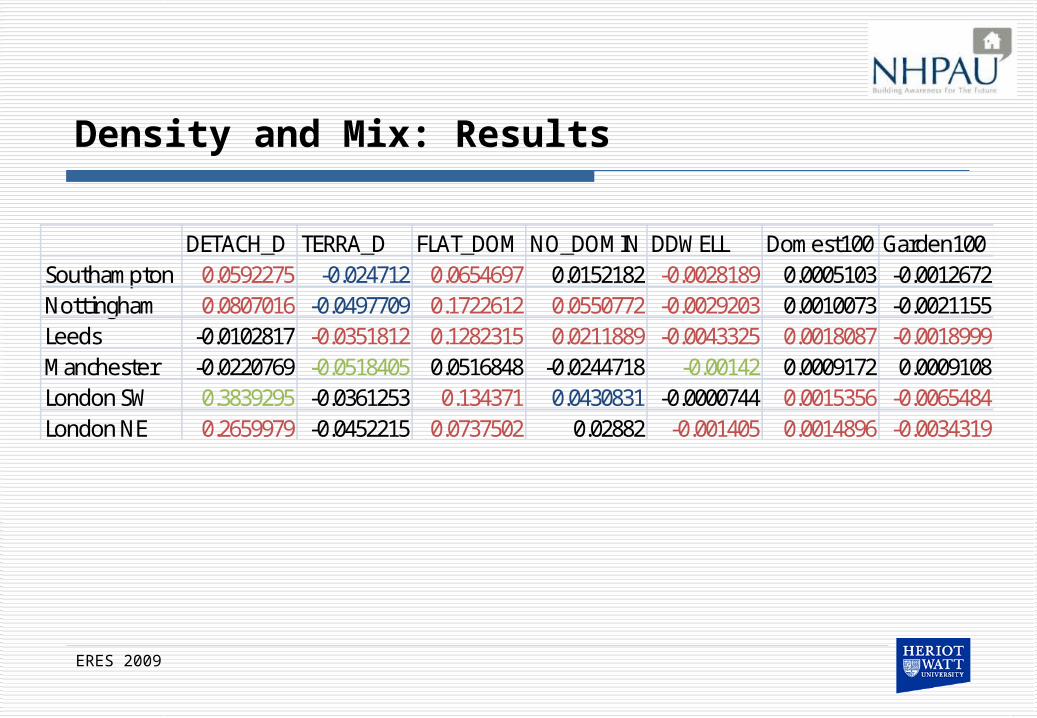
Density and Mix: Results
ERES 2009
DETACH_D TERRA_D FLAT_DOM NO_DOMIN DDWELL Domest100 Garden100Southampton 0.0592275 -0.024712 0.0654697 0.0152182 -0.0028189 0.0005103 -0.0012672Nottingham 0.0807016 -0.0497709 0.1722612 0.0550772 -0.0029203 0.0010073 -0.0021155Leeds -0.0102817 -0.0351812 0.1282315 0.0211889 -0.0043325 0.0018087 -0.0018999Manchester -0.0220769 -0.0518405 0.0516848 -0.0244718 -0.00142 0.0009172 0.0009108London SW 0.3839295 -0.0361253 0.134371 0.0430831 -0.0000744 0.0015356 -0.0065484London NE 0.2659979 -0.0452215 0.0737502 0.02882 -0.001405 0.0014896 -0.0034319
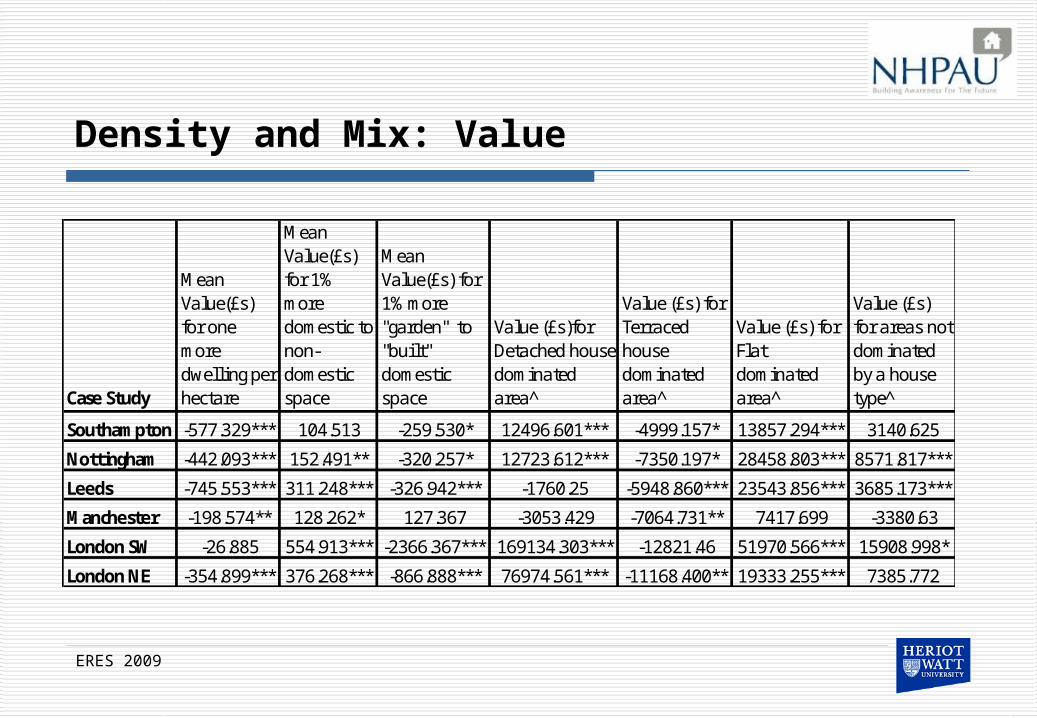
Density and Mix: Value
ERES 2009
Case Study
Mean Value(£s) for one more dwelling per hectare
Mean Value(£s) for 1% more domestic to non-domestic space
Mean Value(£s) for 1% more "garden" to "built" domestic space
Value (£s)for Detached house dominated area^
Value (£s) for Terraced house dominated area ̂
Value (£s) for Flat dominated area ̂
Value (£s) for areas not dominated by a house type ̂
Southampton -577.329*** 104.513 -259.530* 12496.601*** -4999.157* 13857.294*** 3140.625
Nottingham -442.093*** 152.491** -320.257* 12723.612*** -7350.197* 28458.803*** 8571.817***
Leeds -745.553*** 311.248*** -326.942*** -1760.25 -5948.860*** 23543.856*** 3685.173***
Manchester -198.574** 128.262* 127.367 -3053.429 -7064.731** 7417.699 -3380.63
London SW -26.885 554.913*** -2366.367*** 169134.303*** -12821.46 51970.566*** 15908.998*
London NE -354.899*** 376.268*** -866.888*** 76974.561*** -11168.400** 19333.255*** 7385.772
Conclusions
UK planning policy has encouraged high density and polarised house type mix
Evidence to support existing literature High density often associated with a negative premium Preference for detached over other house types Preference for houses over flats(apartments)
First stage: density/mix and residual land values and affordability house price levels and patterns are also relevant to another
social policy concern, namely the concern about affordability.
ERES 2009