Embed Size (px)
Citation preview
THE INFLUENCE OF LAND USE MIX, DENSITY AND URBAN DESIGN ON HEALTH: A CRITICAL LITERATURE REVIEW June 2012 Karen Croucher, Centre for Housing Policy Alison Wallace, Centre for Housing Policy Steven Duffy, Centre for Reviews and Dissemination
1
CONTENTS Page Section 1: Background and introduction to the review 3 Section 2: Density, land use mix and urban design: impacts on health 6 Section 3: Overview and reflection on key findings 22 REFERENCES 26 Appendix A: Review Methods 38 Appendix B: Search Strategies 45
2
Section 1: Background and introduction to the review 1.1 Background In recent years there has been a determined effort by a range of organisations in the UK to ensure that those who make decisions about land use recognise the potential health impact of their decisions. These organisations include: the Department of Health, NHS Health Scotland, the Scottish Health Impact Assessment Network1, the Royal Town Planning Institute, the former Commission for Architecture and the Built Environment, the Kings Fund, the Town and Country Planning Institute, the Healthy Urban Development Unit, and the Spatial Planning and Health Group. The Marmott Review (2010) and public health white paper Healthier Lives, Healthier People (DH, 2010) also emphasised the need for greater integration between planning, transport, housing, and health systems in order to promote health and reduce health inequalities. The National Institute for Clinical Excellence has also undertaken a programme of reviews on health and spatial planning with the aim of integrating health more effectively within the spatial planning process (NICE, 2008). With Good Places, Better Lives (Scottish Government, 2008), the Scottish Government signalled its intention to improve the health of Scotland’s population through a programme of evidence gathering to better understand the environmental determinants of health that would then inform public health policy. This initiative is being supported by a multi-disciplinary collaborative research project, the Environmental Determinants of Public Health in Scotland2. This growing body of work reflects a wider international interest in developing a better understanding of how place impacts on health and individual health behaviours, as well as a concern to shape and design places that sustain and promote human health and wellbeing (Barton, 2009). Decisions about how spaces are used and developed for residential, industrial, retail and other facilities impact on the health of people who live, work and play within these spaces. It has, of course, long been recognised that urban infrastructure impacts on human health, and developments such as Garden Cities, urban parks, measures to address over-crowding, improve sanitation, the introduction of building regulations and standards, the introduction of traffic control measures, and so forth, can all be seen as ways in which spatial planning has had positive influences on human health. In the 21st century, however, there is a growing emphasis on understanding how spatial planning can serve the preventive health agenda by creating environments that promote and enable healthier, more active lifestyles and reduce health inequalities, thus reducing the burden of chronic disease. This recent emphasis on the provision of environments that support people to increase their physical activity is driven by the
1 See: http://www.healthscotland.com/resources/networks/shian.aspx 2 See: http://www.edphis.org/
3
recognition that, in the developed world, lack of physical activity is considered to be the greatest risk factor after smoking for chronic disease (Wendel-Vos et al., 2007)3. Physical activity produces both physical and mental health gains and reduces the risk of all-cause mortality, as well as the risk of obesity4, cardiovascular disease, diabetes, and musculoskeletal disorders. However, as Barton (2009) acknowledges, the relationship between individual health and the environment is complex. Individual health behaviours and lifestyles are mediated by a range of external factors - social and community influences, living and working conditions, and general socioeconomic, and cultural conditions as well as environmental (both built and natural) conditions. Nevertheless these external factors in turn can be mediated to a greater or lesser extent by spatial planning. 1.2 About the review This review of the literature on the influence of land use mix, density and design on health has been commissioned by the Glasgow Centre for Population Health and the Scottish Health Impact Assessment Network. These organisations wish to develop a document that will provide practical guidance about the potential health impacts of planning decisions about layout and design. Similar guidance has already been produced addressing the health impact of greenspace5, the health impact of transport initiatives6, and the health impact of housing improvements7. The aims of
3 To reduce health risks arising from inactivity, the World Health Organisation (WHO) recommends that people undertake 20 minutes of vigorous exercise three times a week or 30 minutes of moderate exercise five times a week. In the UK, the NHS Live Well webpage recommends adults (19-64 years old) should undertake 150 minutes of moderate aerobic activity or 75 minutes of vigorous aerobic activity per week and young people (between 5-18 years old) an hour of activity per day see http://www.nhs.uk/Livewell/fitness/Pages/physical-activity-guidelines-for-adults.aspx Only 37 per cent of men and 24 per cent of women currently meet the 30 minutes exercise target recommended by the Chief Medical Officer in England (Panter and Jones, 2008). The target in Scotland is for 50 per cent of people to meet the recommended targets by 2022 (Scottish Executive, 2003). In 2010, only 45 per cent of men and 33 per cent of women in Scotland met the recommended targets (Scottish Government, 2010). Physical inactivity makes a major contribution to premature deaths from non-communicable diseases in Scotland such as coronary heart disease or strokes.
lthough premature mortality rates in Scotland dropped by 28 per cent between 1995 and 2009, the ate remains the highest in the UK (Scottish Government 2010).
Ar 4 Overweight and obesity are defined as abnormal or excessive body fat accumulation that may impair health. The cause of overweight and obesity is the in-balance between calories consumed and calories expended. Obesity if the fifth leading cause of global deaths. Forty four per cent of the global diabetes burden, 23% of the ischaemic heart disease burden, and between 7 and 41 per cent of certain cancers are attributable to overweight (WHO, 2011 see: http://www.who.int/mediacentre/factsheets/fs311/en/) 5 http://www.greenspacescotland.org.uk/default.asp?page=4626 http://www.healthscotland.com/documents/2124.aspx
4
the review were to build on an earlier review of the influence of the physical characteristics of urban neighbourhoods and health (Croucher et al, 2007), and to explore the health impacts of land use mix, in both urban and rural settings. The design features promoted in two design guides published by the Scottish Executive, Designing Places (Scottish Executive, 2008), and Designing Streets (Scottish Executive, 2010), were used as the starting point of the review. Review methods A total of 98 papers entered the review and a breakdown of the references by study type is included at the end of the report. The methods, overview and discussion of the literature, with the search strategies adopted for the review are presented in Appendix A. Reflections on the literature retrieved The strength of the evidence and robustness of the studies included in the review are a crucial concern. It is also critical to reflect on the more general applicability of the findings of the various studies to different countries and contexts. The literature is overwhelmingly dominated by studies from the United States, with a smaller number from Canada, Australia, and Europe including the UK. A key concern is the extent to which the findings of different studies undertaken in a specific context can be transferred into other locations where settlement patterns, cultures of physical activity, practical means of transportation, attitudes to food, as well as health inequalities, and access to health care may be quite different. Key contextual differences include: the extent and nature of urban sprawl in the USA; different patterns of spatial social and racial segregation in different counties; access to health care; and differences in local climate and weather conditions. Reflections on the literature retrieved are considered in more detail in Appendix A. Structure of the review In the following chapter the evidence drawn from the literature reviews and primary studies is considered under the following main headings:
• Density • Land use mix • Urban design • Interactions between density, life use mix and urban design
Key messages and conclusion that can be drawn from the evidence review are presented in Section 3. 7 http://www.healthscotland.com/documents/1251.aspx
5
Section 2: Density, land use mix and urban design: impacts on health In this section, the evidence base related to density, land use mix, and urban design is considered. Reflecting concerns about the negative health consequences of sedentary lifestyles, the dominant theme of the evidence base is on the exploration of how different aspects the built environment can promote and increase levels of physical activity. 2.1 Density Broadly speaking, ‘density’ refers to the number of units – for example, people, dwellings, buildings of different use - in a given area. In the UK, government guidance on planning offers some broad definitions for density, for example, the Department of Environment, Transport and the Regions (2000) suggested that appropriate density has to respond to specific locations, and offered the following definition of density and mix: “Density and mix…the amount of development on a given piece of land and the range of uses. Density influences the intensity of development, and in combination with the mix of uses, can affect a place’s viability and character “8. There are several ways to define and measure density. Some density data can be collected using Geographic Information Systems, however others are more problematic9. Residential density is particularly difficult to measure. For example, should the measurement be of dwellings per hectare, or habitable rooms per hectare, or the types and size of dwellings, on indeed the ratio of buildings to open space? Numbers of residential properties, or habitable rooms, do not necessarily correlate to numbers of residents. In areas with high numbers of older people, it might be expected that many will live alone or be “under-occupying” family sized properties. In other areas, with different population profiles, overcrowding may occur.10 Neither under occupancy or overcrowding can be attributed to residential density alone. Beyond issues of measuring density, there are also questions of definitions. For example, what constitutes ‘high’, ‘medium’, or ’low’ density?
8 Department of the Environment, Transport, and the Regions. 2000. By Design: Urban Design in the Planning System – Towards Better Practice. DETR/CABE 9 See for example, Forsyth, 2003, Measuring Density: Working Definitions for Residential and Building Density. Design Center for American Urban Landscape Design Brief 8, July 2003, University of Minnesota. 10 For definitions of overcrowding in Scotland, see http://scotland.shelter.org.uk/get_advice/advice_topics/repairs_and_bad_conditions/other_housing_problems/overcrowding
6
For definitions of overcrowding in England, see: http://england.shelter.org.uk/get_advice/repairs_and_bad_conditions/home_safety/overcrowding
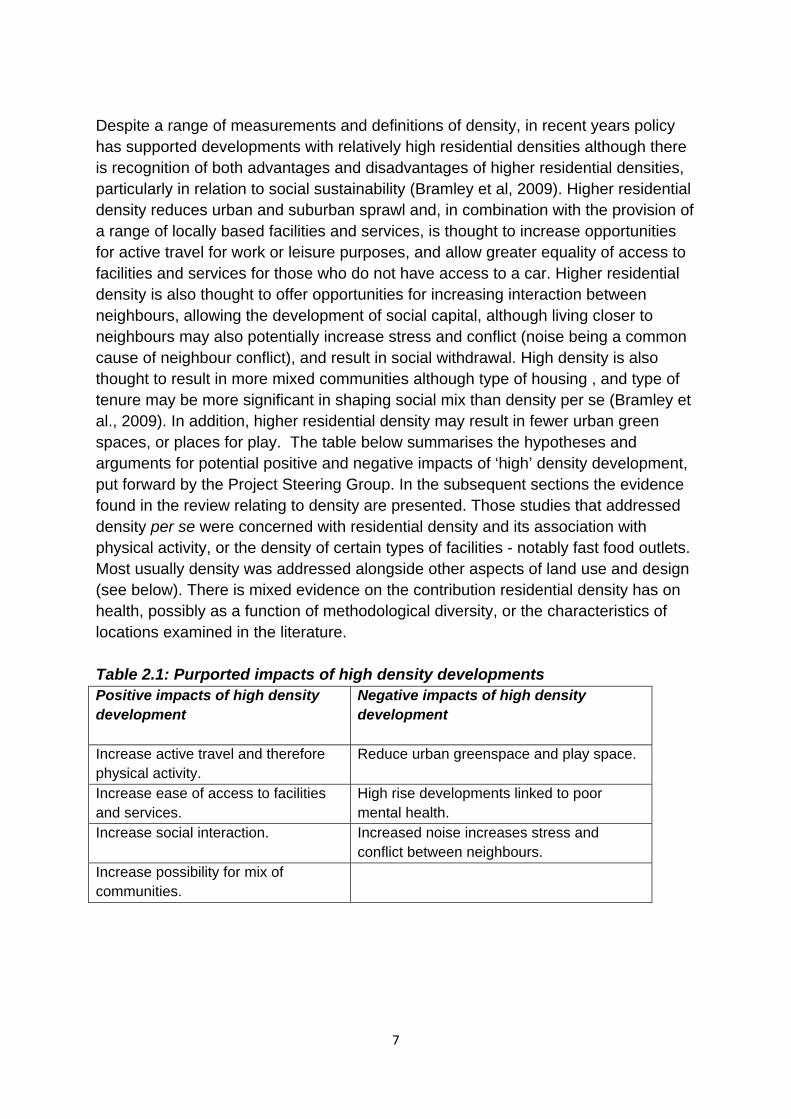
Despite a range of measurements and definitions of density, in recent years policy has supported developments with relatively high residential densities although there is recognition of both advantages and disadvantages of higher residential densities, particularly in relation to social sustainability (Bramley et al, 2009). Higher residential density reduces urban and suburban sprawl and, in combination with the provision of a range of locally based facilities and services, is thought to increase opportunities for active travel for work or leisure purposes, and allow greater equality of access to facilities and services for those who do not have access to a car. Higher residential density is also thought to offer opportunities for increasing interaction between neighbours, allowing the development of social capital, although living closer to neighbours may also potentially increase stress and conflict (noise being a common cause of neighbour conflict), and result in social withdrawal. High density is also thought to result in more mixed communities although type of housing , and type of tenure may be more significant in shaping social mix than density per se (Bramley et al., 2009). In addition, higher residential density may result in fewer urban green spaces, or places for play. The table below summarises the hypotheses and arguments for potential positive and negative impacts of ‘high’ density development, put forward by the Project Steering Group. In the subsequent sections the evidence found in the review relating to density are presented. Those studies that addressed density per se were concerned with residential density and its association with physical activity, or the density of certain types of facilities - notably fast food outlets. Most usually density was addressed alongside other aspects of land use and design (see below). There is mixed evidence on the contribution residential density has on health, possibly as a function of methodological diversity, or the characteristics of locations examined in the literature. Table 2.1: Purported impacts of high density developments Positive impacts of high density development
Negative impacts of high density development
Increase active travel and therefore physical activity.
Reduce urban greenspace and play space.
Increase ease of access to facilities and services.
High rise developments linked to poor mental health.
Increase social interaction.
Increased noise increases stress and conflict between neighbours.
Increase possibility for mix of communities.
7
Active transport and physical activity Some studies suggest that higher residential densities are associated with increased physical activity levels of residents. For example, in the USA, those states with strong urban containment policies (and therefore higher residential densities) display higher rates of leisure time physical activity and active transportation (i.e. cycling or walking for utilitarian purposes rather than recreation) than those without such policies (Aytur et al., 2008). Similarly, studies have shown higher residential density to be associated with increased physical activity (Kirk et al., 2010), and in particular increased walking (Boarnet et al., 2008; Pont et al., 2009). Indeed, sprawling suburbs, less urbanised and more rural locations are associated with inadequate levels of physical activity and increased body weight (Gordon-Larsen et al., 2006; Leal and Chaix, 2011). The evidence is, however, inconsistent. In the USA, where states or metropolitan districts have incentivised developers to increase density in residential developments the evidence of the effectiveness of these measures in increasing physical activity is mixed (McCormack et al., 2010). There were no differences in the levels of physical activity between residents living in developments based on ‘New Urbanist’ principles (where higher build densities are a key element, compared to other typical developments) and those living in more conventional suburbs in North Carolina, although residents of New Urbanist areas did walk more for utilitarian purposes than in other neighbourhoods (Rodriquez et al., 2006). Hou et al. (2010) suggested that other characteristics of the streets were important, in addition to density, as they may facilitate walking or active transportation. Other factors, particularly low incomes, appear to confound the relationship between density and physical activity (and other health indicators). Oakes et al. (2007) found no association between density on total walking and physical activity, but also suggested that there may have been residual confounding effects because of the lower social economic status of the higher density neighbourhoods examined. Furthermore, in a longitudinal prospective study, Hou et al. (2010) found neighbourhood street density positively associated with walking, cycling and jogging in low urbanicity11 areas, but in areas of higher urbanicity this association between physical activity and density was not apparent for men and was inverse for women. Given the inconsistency of evidence regarding density and physical activity, it is unsurprising that evidence around the relationship of residential density and obesity is also mixed. For example, Schuurman et al. (2009) found no clustering of rates of obesity in eight suburban neighbourhoods representing a cross section of high and low income and two levels of residential density. Two longitudinal studies referenced in a systematic review by Feng et al. (2010) found no statistically significant
1
p
1 Urbanicity was defined as low, middle or high, using a combination of urban boundary data and opulation density data).
8
association between residential density and obesity. Other studies, however, have found that not only is urban sprawl associated with higher Body Mass Index (BMI)12 and obesity, but that the relationship works in reverse, as people who moved to denser areas lost weight (Plantinga and Bernell, 2007). However, overweight people were less likely to move to denser “walkable” neighbourhoods. Attending school in a less urbanised or rural environment is associated with increased body weight (Leal and Chaix, 2011), although there are no major differences between the physical activity levels of children in rural and urban areas, except that rural children played outdoors more than children in urban neighbourhoods (Sandercock et al, 2010). Dunton et al. (2009) found mixed evidence on the relationship between density and adolescent body weight. Adolescents in rural, exurban and mixed urban areas were more likely to be overweight than those from suburban, older suburban and inner city areas (where inner city and mixed urban areas have the highest levels of density). Access to facilities and services Bramley et al.(2009) (see below) found that higher density neighbourhoods did allow better access to and increased use of local facilities, although access to services for people living in areas which were further from urban centres was also related to the availability of transport services. Food environments Better access to goods and services is widely perceived to be a positive aspect of denser urban environments. Given global concerns over increasing rates of obesity, there is a considerable body of literature that addresses the food environment, or the availability of places where food can be obtained, such as supermarkets, grocery stores, convenience stores, restaurants, fast food outlets, restaurants and farmers’ markets. Evidence from two reviews suggests a higher density of fast food outlets is associated with higher levels of obesity and overweight. Giskes et al. (2010) found that weight status is associated with the food environment, as greater access to supermarkets and less access to takeaway outlets are associated with lower BMI. Area level deprivation was also associated with obesogenic13 food consumption but it is unclear whether the studies reviewed by Giskes et al. considered low income as 12 Body mass index is a simple index of weight for height that is commonly used to classify overweight and obesity in adults. It is defined as a person’s weight in kilograms divided by the square of his/her height in metres. The WHO definition is that a BMI greater than or equal to 25 is overweight, a BMI greater than or equal to 30 is obese. BMI provides the most useful population measure of overweight and obesity as it is the same for both sexes and all age adults. See: http://www.who.int/mediacentre/factsheets/fs311/en/
9
13 Obesogenic is defined by the Oxford English Dictionary, as “tending to cause obesity”.
a confounding factor. Proximity to supermarkets also increases the consumption of fruit and vegetables, and can lower obesity and levels of overweight (Sallis and Glanz, 2009). Furthermore, Sallis and Glanz (2009) found evidence that although high incidence of fast food outlets explains six per cent of the variance in rates of obesity, the relationship was weak and not supported by larger scale studies in the review. Giskes et al. (2010) found that living in a rural area, an advantaged area, or not being a shift worker was associated with more fruit and vegetable consumption, and living in an urban area was associated with greater takeaway consumption. The dietary behaviour mechanisms through which the food environment influences food consumption are unclear (Giskes et al., 2010). Unsurprisingly, Fraser et al. (2010) also found the relationship between the density and proximity of fast food outlets and obesity was weaker than the relationship between fast food consumption and obesity. Increased density and proximity were considered insufficient to influence behaviour directly. However, the relationship between individual characteristics and the likelihood of being obese in areas with a high density of fast food outlets is significant and individual characteristics may influence residents’ propensity to use the fast food outlets in their area may be more powerful than exposure to the outlets alone (Li et al., 2009). However, it is unclear whether selection effects are at play as fast food companies target their stores in areas of concentrated deprivation. Fraser et al. (2010) found that the highest density of McDonalds in England and Scotland were in areas with concentrated disadvantage, although the highest density was found in the second quintile of deprivation rather than in the most deprived areas. However, in the case of Glasgow half of the fast food outlets were concentrated in the most affluent areas. Furthermore, Kirk et al. (2010) found that lower income neighbourhoods also have higher concentrations of supermarkets, allowing better access to a greater range of foods, than more affluent areas. A study in Sweden (Kawakami et al., 2011) found that low and moderate income neighbourhoods had access to a wider range of resources including both “health promoting” (food shops and supermarkets, exercise facilities and cultural amenities, financial services, general shops, health care facilities), and “health damaging” (fast food outlets, bars, and liquor stores) in comparison with high income neighbourhoods. However, Fraser et al. (2010) did support the banning of fast food outlets around schools as there was evidence of clustering and increased body weight. Alcohol outlets Unsurprisingly a study in the USA showed that the density of alcohol outlets and Narcotics/Alcoholics Anonymous were adversely associated with poor outcomes (non-attendance at first out-patient appointment, and readmission to inpatient facility within one year of discharge) for patients with dual diagnosis of mental health and substance misuse who were discharged to community rather than institutional settings (Stalher et al., 2007). However, other neighbourhood characteristics,
10
including the proportion of vacant or empty properties, also influenced outcomes. The authors conclude more research is needed to understand the neighbourhood effects on clinical outcomes for patients with dual diagnosis. Urban green spaces The term ‘green space’ includes parks and other areas of vegetation that can also offer recreational opportunities. There is a concern that high density developments lead to a reduction in urban green space. There is a significant body of evidence to support the physical and mental health benefits of urban green spaces, such as municipal parks and gardens, and private urban gardens (Croucher and Myers, 2008). Lachowycz and Jones (2011) in a systematic review of green space and obesity found evidence that residents in the top quintile of areas for green spaces undertook three times more physical activity than those who lived in the bottom quintile for green spaces. Furthermore, in areas with the most green spaces boys walked 2.3 times more and girls 1.7 times more than those in areas with the least green space. Similarly, Lindberg et al. (2010) found the amount of vegetation around public housing increased children’s play and residents’ perceptions of safety. Proximity to open play spaces was positively associated with physical activity for boys but girls’ use of green space was more likely to be negatively influenced by the amount of violent crime in their neighbourhood regardless of proximity (Kirk et al., 2010). Density and social interaction High density is considered to increase the possibility of social interaction as people are in closer proximity to each other. The evidence regarding density and social interaction is inconsistent. With regard to the development of social capital some of the retrieved studies did highlight possibly negative associations with low density, car dependent suburban neighbourhoods, but also suggested that the relationship was complex and non-linear. Brueckner and Largey (2008), mapping data from a survey of social capital to neighbourhood density in the USA, found that despite a common belief that suburbs were not congenial to social interactions and the development of social capital, high density had a negative association with social interactions and social capital. This may be a consequence of the presence of social disorder or incivilities in urban neighbourhoods, but crime data was not included in this particular analysis. However, McDonald et al. (2008) in their “review of reviews” found evidence that the dislocation between work, home and amenities produced negative effects on health and wellbeing, and that social capital diminishes with increasing time spent in cars. Bramley et al. (2009) report findings from the City Form Investigation which is a major UK study of the extent and ways in which urban form contributes to social
11
sustainability, involving 15 case studies in five UK cities. 14 In considering the socially sustainable city, the study provides a critical UK evidence base for the social benefits and dis-benefits of the compact city. Bramley et al. (2009) examine the different elements of urban design that contribute to social sustainability. They propose that social sustainability should be seen as comprising two dimensions: social equity with particular reference to access to services and opportunities; and sustainability of community, comprising a number of sub-dimensions including attachment to neighbourhood, social interaction at neighbourhood level, safety, perceived quality of the local environment, participation in groups, satisfaction with home, and stability. Crucially they identify a trade off between the increased sustainability of compact neighbourhoods, where higher densities allow the greatest access to and use of services and amenities, but reduce resident satisfaction, compared to medium density areas which have the greatest social interactions, and the lowest density areas that have lower interactions but the greatest stability and greatest resident satisfaction with neighbourhood environment. Outcomes most negatively associated with high density were home satisfaction and safety. With regard to social interaction, having a garden, neighbourhood green space, and areas with terraced housing produced better outcomes. Living above the ground floor (i.e. in apartment style developments) showed negative social interaction outcomes. The authors suggest that higher storey flats and low density “detached suburbia” provide fewer opportunities for comfortable meeting on the street or near the entrance to home, whereas terraced housing does offer more opportunities for people to talk across the wall or fence or meet on the street. The authors recommend caution in planning new urban developments that place an emphasis exclusively on high density (particularly apartment accommodation without gardens) as it would appear such developments will be unlikely to produce happy, well-functioning communities. However, as other studies have noted, Bramley et al. (2009) suggest that the socioeconomic and demographic mix of communities is very significant for social outcomes, and likely to account for area variation in social sustainability as much as - if not more than - the urban form. 2.2 Land use mix Land use mix describes the heterogeneity of land uses in geographically defined areas. Measures of land use mix typically include residential, commercial, institutional, industrial, recreational, and agricultural uses. Authors highlight concerns regarding how the concept of land use mix is operationalised and determined, as descriptions often lack specificity, and geographical scale often varies across studies (see Duncan et al, 2010). With regard to the impact on health, a more heterogeneous mix of land uses is thought to enable easier access to services and
12
14 See: http://www.city-form.org/uk/index.html
facilities, and employment, and to facilitate greater opportunities for active travel, thereby increasing physical activity. Land use mix and physical activity As noted in the introduction, the majority of studies that consider the impact of land use mix on health are concerned with improving levels of physical activity with consequent health gains including reduced levels of obesity, and identifying types of neighbourhoods, or aspects of neighbourhoods that will facilitate a more active life style (see for example, Papas et al., 2007; Feng et al., 2010; Rodriguez et al., 2006). Given the proven health benefits of even moderate exercise, and the burden of disease created by lack of physical activity, this focus would appear entirely legitimate. Indicators associated with urban containment such as shorter distances to central services and facilities (and the consequent reduction in travel times), and mixed land use, are all associated with less transit use, more walking and active transport options (Frank et al., 2006; Lathey et al., 2009; Aytur et al., 2007; Aytur et al., 2008; Pont et al., 2009). Evidence suggests that one of the key element of land use mix that promote physical activity is urban green space. The importance of urban green space for mental well-being - as a place to escape from urban grime and noise, de-stress and enjoy contact with nature – has been covered in an earlier review undertaken for Glasgow Centre for Population Health (Croucher and Myers, 2008). This review also addressed the impact of urban green spaces on levels of physical activity. More recent studies on the health promoting effects of urban green spaces reinforce the findings of the earlier review, notably the need for urban green spaces to provide facilities for a range of active sports as well as unstructured activity (for example, trees for children to climb), as well as offering space for more passive, de-stressing activities (contact with nature, enjoyment of views and vistas). This is particularly important in areas with high residential density. In line with the findings of the earlier review, more recent studies emphasise how perceptions of safety influence use and enjoyment of green spaces (McCormack et al, 2010: Wendel-Vos et al, 2009; Limstrand, 2008; Sallis and Glanz, 2009). Limstrand (2008) notes evidence of the correlation between the presence of sports and recreational facilities and physical activity. However, there are disparate findings on the association between parks and recreational facilities and physical activity (Kaczynski and Henderson, 2007; Ferreira et al., 2007). Distance to trails is associated with physical activity and with people engaging in the recommended amounts of physical activity per week, and parks increased strolling and destination trips (Kaczynski and Henderson, 2007). However, Ferreira et al. (2007) found that individual attributes like the father’s level of physical activity, the mother’s education and family income were also strong indicators of physical activity in children and adolescents.
13
Other factors also impact on the use made of the park, regardless of proximity and availability. There is evidence that the perceptions of safety in the park influences use (McCormack et al., 2010). People perceived as undesirable such as homeless people and drug users, a lack of law enforcement, secluded paths, lack of surveillance and security, and poor lighting militate against the use of the park. The cost of facilities, having to cross traffic and poor weather are negatively associated with use of the park or recreational facility and physical activity (Limstrand, 2008). In addition, social companionship increases engagement in sports and activities (Wendel Vos et al., 2009). 2.3 Urban design Urban design is concerned with the layout and design and construction of buildings and the spaces between them, and there is growing interest in how urban design can influence both physical and mental health (see Delivering Healthier Communities in London commissioned by the NHS London Healthy Development Unit15). Urban design is thought to have the potential to influence health primarily through providing environments that enable physical activity. The provision of cycle ways and walking routes may encourage active travel (and therefore increase levels of physical activity), however spaces shared by pedestrians and cyclists may discourage walking in people with a sensory impairment or mobility problems. Similarly urban design that allows better and easier connectivity (for example, traditional grid street layout as opposed to cul-de-sacs) may also encourage walking and consequently provide increased opportunities for social interaction. Other urban design features that might encourage physical activity (and social interaction) include improved aesthetics and provision of attractive features and destinations, as well as measures to increase perceived and actual safety, such as street lighting, traffic calming measures, opportunities for informal surveillance and provision of defensible spaces. Neighbourhood design and promoting physical activity There is a small body of work that assesses the impact of changes to the physical environment to support walking and cycling for transport. Brownson et al. (2006) found insufficient evidence that interventions to improve transportation, through changing roadway designs, expanding transport services or subsidising public transport increased physical activity. Giles-Corti et al. (2008) found no differences in walking in liveable neighbourhoods with more support for active transport, and hybrid
15 See: http://www.healthyurbandevelopment.nhs.uk/documents/integrating_health/HUDU_Delivering_Healthier_Communities.pdf
14
neighbourhood or conventional neighbourhoods16. Coulson (2011) examined a Home Zone scheme which gives priority to pedestrians over cars in local neighbourhoods. Improvements were made to the spatial aesthetics and extensive replanting and streetscape improvements were made to enhance the walkability of the area. However, the car orientated culture of residents remained and there were complaints about parking, safety and poor public transport. A series of studies reported interventions in US cities to promote active living: Go Orlando (McCreedy and Leslie, 2009), Project U-Turn in Jackson, Michigan (Hendrick et al., 2009; Tenbrink et al., 2009), and Active Louisville (Walfoort et al, 2009). These were all comprehensive interventions founded on the so-called ‘5Ps’: preparation, promotion, programmes, policy and physical projects, designed to combine redesigns of the physical environment, infrastructure changes and promotion and awareness raising among residents of these changes (and the increased opportunities for physical activity and health benefits they could generate) to increase levels of physical activity and active transportation among local residents. In Orlando there was no evidence that the levels of cycling and walking had increased (McReedy and Leslie, 2009). In Jackson, a 65% increase in the numbers of people seen walking and cycling was reported, using a community observation study (Hendrick et al., 2009). In Louisville, again it was reported that wider sidewalks and pocket gardens had increased walking, specifically for children who attended activities at the local community garden, however it was not reported how these increases in activity had been measured. Perhaps this group of studies illustrate the potential difficulties of measuring the outcomes of programmes of interventions and prompts. Design and well-being Several studies have examined the specific attributes of a neighbourhood that may impact upon mental health and wellbeing. The environmental factors that show a negative impact on mental health and well-being are neighbourhood manifestations of social and physical disorder and neglect, such as graffiti and litter. The evidence, such as it is, does however suggest at least some role for urban design and planning in producing and maintaining environments that could sustain mental health and well-being, notably with environmental improvements, and initiatives to tackle manifestations of urban neglect. For example, a relatively modest before and after study of a community urban renewal project in in the USA found improvements to the urban environment - that included street murals, public benches, planters, information kiosk, trellis and hanging baskets in public areas - improved the mental
16 Giles-Corti et al. proposed that this Australian study may have been biased by the ‘ocean effect’ as the hybrid and conventional neighbourhood comparison sites were near the ocean. Areas near the beach typically attract residents who are seeking an environment where they can be more active.
15
health, social capital and sense of community of residents in close proximity of the intervention (Semenza and Krishnasamy, 2007). A study in Greenwich (London, UK) found that, after controlling for confounders, poor mental health was associated with a range of negative housing and neighbourhood attributes such as noisy neighbours, overcrowding, dissatisfaction with greenspaces, feeling unsafe in the day, and a lack of access to community facilities (Guite et al., 2006). McDonald et al. (2008) in a “review of reviews” highlight a number of physical characteristics of neighbourhoods that have a positive impact on health and well-being. These include: attractive and well-kept environments; well lit and constructed footpaths that are pedestrian friendly; street patterns that provide opportunities for informal contact among residents (see also Heath et al, 2006). These authors also highlight how safe and convenient neighbourhoods are associated with higher rates of walking and physical activity, and stress the value of urban green spaces not just as places for physical exercise, but also as social spaces for people to meet, de-stressing places for people to relax, and also barriers to reduce environmental noise. Residents’ perceptions of urban design Residents’ perceptions of their neighbourhoods appear to be an important mediator of physical activity and health. Kamphuis et al. (2008) examined the mismatch between objective and subjective measures of neighbourhood and found that residents with lower socio-economic status, older people and women were more likely to report their neighbourhood as unsafe and unattractive, both elements associated with lower physical activity, but residents’ perceptions were partly informed by their lower assessment of neighbourhood social cohesion and the consequent adverse psychosocial effects. Children’s impression of their neighbourhood – whether it seems friendly and busy – appear as important to increasing levels of physical activity, as other measures of neighbourhood, including density, the proportion of greenspace, and measures of the number of street connections (see for example (Kirk et al., 2010). Residents’ perceptions of safety A particular challenge for urban planning is to create environments which foster supportive communities. Social disorder, social fragmentation or a lack of social cohesion in urban areas is identified as a critical influence on anxiety, psychosis and depression (Zammit et al. 2010; Echeverria et al., 2008; Ross and Mirowsky, 2009), as well as impacting negatively on physical health (Schuurman et al, 2009; Sundquist et al, 2006; Poortinga et al, 2007). Neighbourhood trust, alongside food insecurity, was also found to affect stress levels in Philadelphia (Yang and Mathews, 2010). Moreover, research identifies that antisocial behaviour in Glasgow increased resident’s social isolation, increased their fears about safety and made them unhappy (Quinn and Biggs, 2010).
16
Trayers et al. (2006) reports the outcome of four focus groups with children, adults, and college student all resident in a deprived area. The groups were convened to discuss the potential health benefits of two regeneration measures: a cycle track offering more opportunities for exercise and better links to other facilities, and a Home Zone scheme offering safer play areas. The study found found that residents were not particularly interested in the increased health promoting opportunities, but extremely concerned about the impact of the proposed improvement on neighbourhood safety and security. The authors concluded that changes to physical environment to provide cycle ways and walking facilities need also to address neighbourhood safety, and reflect on the differing perceptions of local residents and planners. Similarly, a large population survey in the North West of England found that feeling unsafe had the largest effect on population levels of physical activity (Harrison et al., 2007). Feeling unsafe is a barrier to regular physical activity, especially for women in low -income neighbourhoods, for whom it may undermine their confidence (Bennett et al., 2007). Perceptions that a neighbourhood is unsafe are also associated with risk of being over-weight at aged seven (Lumeng et al., 2006). However, in a study of physical activity (as opposed to BMI) of school children in Alberta, Canada, Carson et al. (2010) found no association with parents’ perceptions of safety and children’s levels of physical activity. Similarly Rossen et al. (2011) found no evidence that poor neighbourhood safety in low-income neighbourhoods in Baltimore deterred children from walking to school, indeed children living in neighbourhoods with higher than the median levels of neighbourhood incivilities were more likely to walk to school, despite lower levels of perceived safety in these neighbourhoods. Design of urban green space Mc Cormack et al. (2010) in a review of qualitative studies exploring different characteristics of urban parks associated with park use and greater activity, make a series of recommendations regarding the design and attributes of green spaces. Facilities for children should include provision for structured physical activity, through sport, and unstructured activity through play, such as trees for climbing and playgrounds. Nature trails were identified as important for adults and girls. Also the aesthetics of the park was important for adults, with trees, attractive buildings and water views increasing the amenity and use made of the facility (see also Sallis and Glanz, 2009). Aesthetics may also be related to the safety and maintenance of the facility, which if neglected is a disincentive for use of the park or recreational facility (McCormack et al., 2010). Poorly specified or poorly designed play equipment are also a barrier for children’s activities. Regeneration Three systematic reviews have explored the evidence regarding the impact on health of regeneration programmes and programmes of housing improvement, and
17
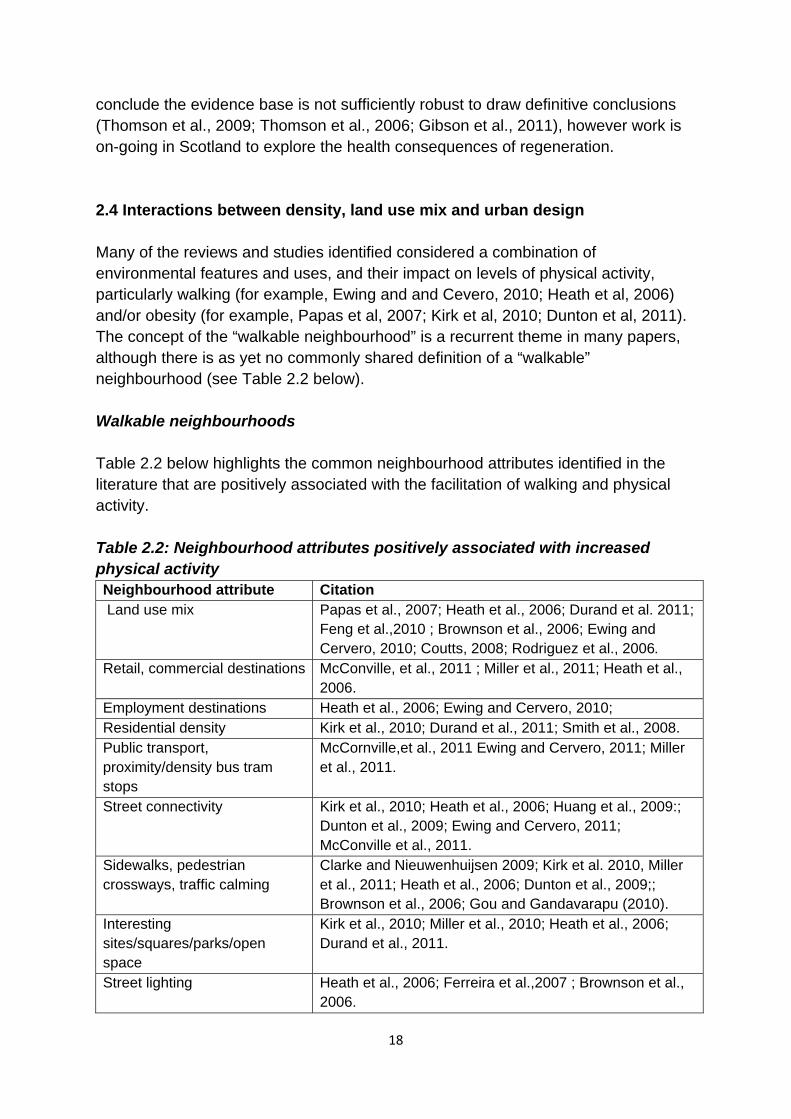
conclude the evidence base is not sufficiently robust to draw definitive conclusions (Thomson et al., 2009; Thomson et al., 2006; Gibson et al., 2011), however work is on-going in Scotland to explore the health consequences of regeneration. 2.4 Interactions between density, land use mix and urban design Many of the reviews and studies identified considered a combination of environmental features and uses, and their impact on levels of physical activity, particularly walking (for example, Ewing and and Cevero, 2010; Heath et al, 2006) and/or obesity (for example, Papas et al, 2007; Kirk et al, 2010; Dunton et al, 2011). The concept of the “walkable neighbourhood” is a recurrent theme in many papers, although there is as yet no commonly shared definition of a “walkable” neighbourhood (see Table 2.2 below). Walkable neighbourhoods Table 2.2 below highlights the common neighbourhood attributes identified in the literature that are positively associated with the facilitation of walking and physical activity. Table 2.2: Neighbourhood attributes positively associated with increased physical activity Neighbourhood attribute Citation Land use mix Papas et al., 2007; Heath et al., 2006; Durand et al. 2011;
Feng et al.,2010 ; Brownson et al., 2006; Ewing and Cervero, 2010; Coutts, 2008; Rodriguez et al., 2006.
Retail, commercial destinations McConville, et al., 2011 ; Miller et al., 2011; Heath et al., 2006.
Employment destinations Heath et al., 2006; Ewing and Cervero, 2010; Residential density Kirk et al., 2010; Durand et al., 2011; Smith et al., 2008. Public transport, proximity/density bus tram stops
McCornville,et al., 2011 Ewing and Cervero, 2011; Miller et al., 2011.
Street connectivity Kirk et al., 2010; Heath et al., 2006; Huang et al., 2009:; Dunton et al., 2009; Ewing and Cervero, 2011; McConville et al., 2011.
Sidewalks, pedestrian crossways, traffic calming
Clarke and Nieuwenhuijsen 2009; Kirk et al. 2010, Miller et al., 2011; Heath et al., 2006; Dunton et al., 2009;; Brownson et al., 2006; Gou and Gandavarapu (2010).
Interesting sites/squares/parks/open space
Kirk et al., 2010; Miller et al., 2010; Heath et al., 2006; Durand et al., 2011.
Street lighting Heath et al., 2006; Ferreira et al.,2007 ; Brownson et al., 2006.
18
The evidence suggests that those attributes of neighbourhood design that facilitate walking at the community level are essentially those that allow a mixed range of destinations serving a range of purposes – residential, leisure, work, retail services and facilities – and where there are safe and attractive pathways with street lighting, raised crossways, connected sidewalks, improved landscaping and public spaces such as squares for people to gather (Heath et al., 2006). Other characterisations of walkable neighbourhoods that are positively associated with health and higher levels of physical activity are sidewalks, bike paths, playing fields, parks, shopping accessible on foot, and neighbourhoods supported by public transport (Miller et al., 2011). Kirk et al. (2010) found that neighbourhoods with no nearby non-residential destinations, no sidewalks, an unpleasant community, lacking interesting sites, and displayed signs of physical disorder, such as garbage and graffiti et cetera, were correlated with higher BMI scores. Neighbourhood attributes associated with greater physical activity were high housing density, greater connectivity and land use mix. ‘Smart Growth’ is a North American term for intensive development based on principles that produce walkable neighbourhoods, with high density, mixed land use and accessible by public transport17. Lindberg et al. (2010) suggested more research was required to identify the exact components of this planning approach that are most effective for walking and physical activity. However, in an evidence review Durand et al. (2011) found that five Smart Growth attributes – diverse house types, mixed land use, housing density, compact development patterns and levels of open space – are positively associated with walking, but are less influential on other forms of physical activity. Although there is evidence that people are more physically active in walkable neighbourhoods, the evidence is mixed as to whether there is also a positive association with other health indicators such as BMI, or rates of depression. Renalds (2010) concluded that more walkable neighbourhoods encourage higher levels of physical activity, lower levels of obesity, and lower rates of depression. Using an Index of Walkability that combined land use mix, street connectivity, net residential density, and retail space ratios, Frank et al. (2006) found that a five per cent increase in walkability as measured by the Index led to a 32 per cent increase in time spent on active travel, 0.23 per cent reduction in BMI score and 6.5 per cent fewer vehicle miles traveled (and, therefore, less pollution). But other studies were unable to demonstrate an association with walkable neighbourhoods and BMI. For example, Smith et al.(2008) found pedestrian street networks were unrelated to BMI. Durand et al.(2011) found Smart Growth features had no effect on BMI levels and Dunton et al. (2011) found that providing street level improvements to crossing lights, walks and public transport were not associated with BMI. However, more recent reviews,
19
17 There is a huge overlap between Smart Growth and New Urbanism, however Smart Growth focuses on land use and density, while New Urbanism focuses more on urban design.
where evidence from a number of studies have been combined, have seen a positive association between walkability and reduced BMI (Papas et al., 2007; Kirk et al., 2010). The review by Feng et al. (2010) concludes that the evidence supports the case for containing urban sprawl and increasing land use mix as there is a consistent relationship between land use mix and increased walking, and also with lower BMI. There is some recent evidence of effective measures to increase active travel, which involve packages of environmental changes. Guo and Gandavarapu (2010) found the most effective measures to exert a positive influence on people’s travel behaviour were regional retail accessibility and increased prevalence of sidewalks. Pucher et al. (2010) found evidence that combining land use planning, with compact high density designs, infrastructure improvements to provide cycle racks and cycle paths, with pro-bicycle promotions can increase the number of cycle trips and the proportion of people cycling. Heath et al.(2010) similarly found evidence to support community scale urban design and land use interventions to support increases in walking and cycling. Aytur et al. (2007) found residents with lower social economic status were three times more likely to participate in active transportation than similar residents living in areas with low active community environmental scores. Perceptions of walkability Objectively measured neighbourhood characteristics that support walking or cycling appear to have a positive association with physical activity, but subjective perceptions of neighbourhood attributes are also influential and contribute further to the complexity of the field. Resident’s subjective perceptions of the walkability of their neighbourhood are positively associated with higher levels of physical activity (Panter and Jones, 2008), reflecting the relationship between objective measures of walkability and physical activity. For many residents objective measures of neighbourhood walkability concur with their subjective assessments of the neighbourhood, however, there are critical differences for some groups. In a prospective study carried out in Australia reported by Gebel et al.(2009) roughly one third of residents living in neighbourhoods that had been objectively assessed as “high walkable” perceived their neighbourhood to be “low walkable”. Conversely a third considered their neighbourhood to be “high walkable” although it was assessed as “low walkable”. The authors concluded that adults with lower educational attainment, lower incomes, who are overweight, or less physically active for transport purposes were more likely to perceive their high walkable neighbourhood as low walkable. A follow up study, carried out four years later, found those adults who did not perceive their walkable neighbourhood as walkable had decreased their walking for transport purposes, gained weight, and their BMI had increased in comparison to those residents whose perceptions of high walkability were concordant with objective measures (Gabel et al, 2011).
20
Social capital Wood et al. (2008) examined the relationship between the development of social capital and observed indicators of walkable neighbourhoods (see above). They found that the built environment has small but positive effects on the development of social capital, but that the quality and type of destinations was as important as the quantity of walkable destinations. Mason (2010) also investigated the hypothesis that urban sprawl increases social stratification of communities and can negatively affect levels of trust, undermining social capital. She found that residents living in traditional compact neighbourhoods did display higher levels of trust but the environment was insufficient to overcome the negative effects on trust produced by income inequalities. Socio-economic indicators and demographics are, therefore, important influences on social capital, and health, but as Wood et al. (2008) note that these factors are less amenable to transformation than the potentially modifiable built environment. Promoting mixed tenure or mixed income communities may go some way to mitigating to negative neighbourhood effects. Unfortunately there were no studies identified in the review that considered the impact of mixed communities on health outcomes. Mental health and well-being Social fragmentation or a lack of social cohesion in urban areas is identified as a critical influence on psychosis and depression (Kim, 2008; Zammit et al., 2010; Echeverria et al., 2008), as well as impacting negatively on physical health (Schurman et al., 2009; Sundquist et al., 2006; Poortinga et al., 2007). Neighbourhood trust, alongside food insecurity, was also found to affect stress levels in Philadelphia (Yang and Mathews, 2010). Moreover, research identified that antisocial behaviour in Glasgow increased resident’s social isolation, increased their fears about safety and made them unhappy (Quinn and Biggs, 2010). A particular challenge for urban planning is then to create environments which foster supportive communities. However in a systematic review of neighbourhood characteristics and depression, Kim (2008) notes that the evidence regarding the relationships between physical neighbourhood environment and social disorder and social capital is sparse, and inconsistent.
21
Section 3: Overview and reflection on key findings 3.1 Robustness of the of evidence base In reflecting on the findings of the review, there are a number of caveats regarding the general quality of the evidence base. Although continually growing, the evidence base relating to health and place remains reliant on cross sectional research, and there is inconsistent measurement of the environment, physical activity, diet and health indicators. This limits the comparability of studies, and frequently produces conflicting findings. There is also considerable inconsistency or absence of definitions of key terms, for example Dempsey’s review of approaches towards city planning found that key definitions of terms such as ‘compact city’, ‘high density’, or definitions of the exact sizes of residential developments or the exact composition of “mixed land use” are frequently absent from the literature (Dempsey, 2008). In addition, as noted in the introduction, it is questionable whether the findings of studies undertaken in a specific locations and social contexts can be generalised to a range of locations and different social contexts. The research base in the UK remains under-developed. A full discussion of the quality of the evidence base is presented in Appendix A. 3.2 Other influences on health There is also a parallel debate in the literature relating to the relative impact of individual and neighbourhood characteristics on health, well-being and social cohesion (see for example, HUDU, 2007; Lindstrom et al., 2006; Thomas et al., 2007; Kaymaz et al., 2006; Truong et al., 2006). There is strong evidence that associates concentrations of disadvantage or neighbourhoods with lower socio-economic status, characterised by residents experiencing social isolation, social disorder and crime within neighbourhoods, with poor health generally, and in particular with negative outcomes in relation to poor mental health, for example, people witnessing violence are more likely to report depression or psychological distress (Kim, 2008; Curry, et al., 2008). Again this parallel evidence base is not heterogeneous and this inhibits generalisation from findings. The neighbourhood characteristics most frequently examined are socio-demographic and socio-economic rather than attributes of urban design. Furthermore, it is clear that there is an interplay between the effects of the built environment on health and other factors such as selection effects, personal beliefs, behaviours, and cultural influences (see for example, Health et al,. 2010; Maley et al, 2010; MacIntyre et al., 2006). The clear message is, therefore, that the built environment cannot be considered in isolation. Nevertheless other factors that have a strong influence on health outcomes may be less tractable to change. Modifications to the physical environment may
22
produce small effect sizes, but do have, however, the potential to produce improved outcomes across whole populations. 3.3 Key findings As noted in the Introduction, there is growing emphasis on understanding how spatial planning can serve the preventive health agenda, notably in promoting and assisting more active lifestyles in consequence of the recognition that in the developing world lack of physical activity is considered to be the greatest risk factor after smoking for chronic disease. The health benefits of even moderate exercise are well documented, thus any measures or interventions that can promote increased and sustained levels of physical activity are to be welcomed. Unsurprisingly, therefore, the predominant focus of much of the literature is on how the built environment can assist with promoting and facilitating increased levels of physical activity. Overall, the research examining the relationship between the land use and health provides plausible associations between aspects of the built environment, and levels of physical activity. There needs to be an increased awareness among those undertaking planning and urban design of the need to create spaces that present opportunities for physical activity. Indicators associated with urban containment, such as shorter distances to central services and facilities, and mixed land use are all associated with increased levels of walking and active transport options. Urban containment policies accompanied by a mix of land uses that provide walkable neighbourhoods with good connectivity offering safe, attractive places with a mixed range of desirable destinations, free from expressions of social disorder and are associated with higher levels of walking and cycling. Whilst there is no agreed definition or consensus about the set of features that define a “walkable neighbourhood”, characteristics of a walkable neighbourhood suggested by the evidence to be positively associated with health and high levels of physical activity include: safe and attractive pathways with street lighting, easy crossings, connected pavements (sidewalks); improved landscaping; bike paths; shopping facilities accessible on foot; and neighbourhoods supported by public transport. With regard to destinations, quality appears to be more important than quantity, and there should be a range of opportunities to access leisure, work, retail and other services. The availability and accessibility of parks and recreational and sports facilities are also positively associated with physical activity. Moreover the literature points to the important role of parks and green spaces for “de-stressing”, as well as their role as providing neutral spaces for social interaction. The quality of green space has an important impact on the amenity and use made of such facilities. Green spaces and parks should offer opportunities for structured sports, and unstructured activities and play, as well as being attractive spaces with views, trees and planting, water
23
features, nature trails (see McCormack et al., 2010). The use of such facilities is mediated by the attributes within the park and perceptions of accessibility, safety, aesthetics, and maintenance. Residential density has been linked to increases in physical activity but is insufficient alone to influence rates of activity. Rather it appears that residential density is important only in relation to the other elements of neighbourhood design that it facilitates, such as mixed land use, walkable neighbourhoods with street connections, and leisure, retail or employment destinations of interest. Undoubtedly residential density offers greater efficiencies in the use of infrastructure and facilitates vibrant street life, but is not the ‘silver bullet’ with regard to developing health promoting environments (Forsyth et al., 2007). The evidence supports a link between the density of fast food outlets and obesity, but it remains unclear whether exposure to fast food is sufficient to account for the increased likelihood of being obese that has been observed in areas with higher densities of fast food outlets. Individual characteristics of residents and selection effects also appear to influence patterns of fast food consumption. While some authors (for example, Li et al, 2009) conclude that individual characteristics are the more powerful influence, the findings of other studies challenge such conclusions suggesting a more complex inter-play between individual characteristics, socio-economic variables, density of fast food outlets (and associated marketing and targeting) and availability of health promoting resources. While individual ultimately make their own choices, choices are made in particular contexts. The evidence base regarding walkable neighbourhoods, residential density, and social capital is smaller and more muted. There is some evidence that the built environment has small but positive effects on the development of social capital, but this evidence is inconsistent. The socio-economic mix of communities is very significant for social outcomes, and likely to account for area variation in social sustainability and cohesion as much if not more than urban form. The impact of concentrated disadvantage and resulting social and physical disorder in neighbourhoods is strongly associated with increased mental health problems. Social disadvantage may exert a more powerful influence over the incidence of mental health problems but is less amenable to modification than the built environment. There is a lack of evidence that identifies the role that urban design and planning may play in mitigating these adverse impacts or in supporting the development of protective qualities, such as social interactions and the accumulation of social capital. Nevertheless, neighbourhood changes that can foster social interactions and support the development of social capital, and improve the aesthetics of the environment thus reducing psychosocial stressors can produce small but significant population effects.
24
The Scottish Executive’s planning policy documents Designing Places (Scottish Executive, 2008) and Designing Streets (Scottish Executive, 2010) accord with the findings of the evidence reviewed. Creating places with identity, that are safe and pleasant, that facilitate the ease of movement, are welcoming, adaptable and sustainable are all evidenced as health promoting. The legacy of previous waves of development with different priorities weighs heavy on policies to create health promoting urban environments. The rate of urban change can be slow and incremental. Incorporating desirable attributes of walkability, land use mix, connectivity and desirable spaces into new developments is easier and less expensive than retro-fitting existing neighbourhoods, although the greatest gains may be made by doing so. While the international literature provides substantial food for thought, and underlines the need for urban planning and design to consider the health consequences it does not provide a sufficiently robust evidence base to make definitive recommendations for policy and practice.
25
References included in evidence review by strength of evidence Robust reviews These studies are based on reviews of reviews, systematic reviews or other critically robust reviews with transparent methodological reporting. Brownson, R. C., Haire-Joshu, D., & Luke, D. A. (2006). Shaping the context of health: a review of environmental and policy approaches in the prevention of chronic diseases. Annual Review of Public Health, 27, 341-370. Carter, M. A., & Dubois, L. (2010). Neighbourhoods and child adiposity: a critical appraisal of the literature. Health & Place, 16(3), 616-628. Clarke, P., &, E. R. Nieuwenhuijsen (2009). Environments for healthy ageing: a critical review. Maturitas, 64(1), 14-19. Deguen, S., & Zmirou-Navier, D. (2010). Social inequalities resulting from health risks related to ambient air quality- a European review. European Journal of Public Health, 20(1), 27-35. Dunton, G. F., Kaplan, J., Wolch, J., Jerrett, M., & Reynolds, K. D. (2009). Physical environmental correlates of childhood obesity: a systematic review. Obesity Reviews, 10 (4), 393-402. Durand, C. P., Andalib, M., Dunton, G. F., Wolch, J., & Pentz, M. A. (2011). A systematic review of built environment factors related to physical activity and obesity risk: implications for smart growth urban planning. Obesity Reviews, 12(5), e173-182. Ewing, R., & Cervero, R. (2010). Travel and the built environment. Journal of the American Planning Association, 76(3), 265-294. Feng, J., Glass, T. A., Curriero, F. C., Stewart, W. F., & Schwartz, B. S. (2010). The built environment and obesity: a systematic review of the epidemiologic evidence. Health & Place, 16(2), 175-190. Ferreira, I., van der Horst, K., Wendel-Vos, W., Kremers, S., van Lenthe, F. J., & Brug, J. (2007). Environmental correlates of physical activity in youth - a review and update. Obesity Reviews, 8(2), 129-154. Fraser, L. K., Edwards, K. L., Cade, J., & Clarke, G. P. (2010). The geography of Fast Food outlets: a review. International Journal of Environmental Research & Public Health [Electronic Resource], 7(5), 2290-2308.
26
Gibson, M., Petticrew, M., Bambra, C., Sowden, A., Wright, K. and Whitehead, M. (2011) Housing and health inequalities: a synthesis of systematic reviews of interventions aimed at different pathways linking housing and health Health and Place 17 (1), 175-184. Giskes, K., van Lenthe, F., Avendano-Pabon, M., & Brug, J. (2011). A systematic review of environmental factors and obesogenic dietary intakes among adults: are we getting closer to understanding obesogenic environments? Obesity Reviews, 12(5), e95-e106. Heath, G. W., Brownson, R. C., Kruger, J., Miles, R., Powell, K. E., & Ramsey, L. T. (2006). The effectiveness of urban design and land use and transport policies and practices to increase physical activity: a systematic review. Journal of Physical Activity & Health, 3(Suppl1), S55-S76. Kaczynski, A. T., & Henderson, K. A. (2007). Environmental correlates of physical activity: a review of evidence about parks and recreation. Leisure Sciences, 29(4), 315-354. Kim, D. (2008). Blues from the neighborhood? Neighborhood characteristics and depression. Epidemiologic Reviews, 30, 101-117. Kirk, S. F. L., Penney, T. L., & McHugh, T. L. F. (2010). Characterizing the obesogenic environment: the state of the evidence with directions for future research. Obesity Reviews, 11(2), 109-117. Lachowycz, K., & Jones, A. P. (2011). Greenspace and obesity: a systematic review of the evidence. Obesity Reviews, 12(5), e183-189. Leal, C., & Chaix, B. (2011). The influence of geographic life environments on cardiometabolic risk factors: a systematic review, a methodological assessment and a research agenda. Obesity Reviews, 12(3), 217-230. Limstrand, T. (2008). Environmental characteristics relevant to young people's use of sports facilities: a review. Scandinavian Journal of Medicine & Science in Sports, 18(3), 275-287. Lindberg, R. A., Shenassa, E. D., Acevedo-Garcia, D., Popkin, S. J., Villaveces, A., & Morley, R. L. (2010). Housing interventions at the neighborhood level and health: a review of the evidence. Journal of Public Health Management & Practice, 16(5 Suppl), S44-52.
27
McCormack, G. R., Rock, M., Toohey, A. M., & Hignell, D. (2010). Characteristics of urban parks associated with park use and physical activity: a review of qualitative research. Health & Place, 16(4), 712-726. McDonald, J., Wise, M and Harris, P. (2008) The health impacts of the urban form: a review of the reviews. Sydney, Centre for Health Equity Training, Research and Evaluation. Miller, W. D., Pollack, C. E., & Williams, D. R. (2011). Healthy homes and communities: putting the pieces together. American Journal of Preventive Medicine, 40(1 Suppl 1), S48-57. Papas, M. A., Alberg, A. J., Ewing, R., Helzlsouer, K. J., Gary, T. L., & Klassen, A. C. (2007). The built environment and obesity. Epidemiologic Reviews, 29, 129-143. Pont, K., Ziviani, J., Wadley, D., Bennett, S., & Abbott, R. (2009). Environmental correlates of children's active transportation: a systematic literature review. Health & Place, 15(3), 849-862. Pucher, J., Dill, J., & Handy, S. (2010). Infrastructure, programs, and policies to increase bicycling: an international review. Preventive Medicine, 50, S106-S125. Renalds, A., Smith, T. H., & Hale, P. J. (2010). A systematic review of built environment and health. Family & Community Health, 33(1), 68-78. Sallis, J. F., & Glanz, K. (2009). Physical activity and food environments: solutions to the obesity epidemic. Milbank Quarterly, 87(1), 123-154. Sandercock, G., Angus, C., & Barton, J. (2010). Physical activity levels of children living in different built environments. Preventive Medicine, 50(4), 193-198. Thomson, H., Atkinson, R., Petticrew, M., & Kearns, A. (2006). Do urban regeneration programmes improve public health and reduce health inequalities? A synthesis of the evidence from UK policy and practice (1980-2004). Journal of Epidemiology & Community Health, 60(2), 108-115. Thomson, H., Thomas, S., Sellstrom, E., & Petticrew, M. (2009). The health impacts of housing improvement: a systematic review of intervention studies from 1887 to 2007. American Journal of Public Health, 99 Suppl 3, S681-692. Truong, K. D., & Ma, S. (2006). A systematic review of relations between neighborhoods and mental health. The Journal of Mental Health Policy & Economics, 9(3), 137-154.
28
Wendel-Vos, W., Droomers, M., Kremers, S., Brug, J., & van Lenthe, F. (2007). Potential environmental determinants of physical activity in adults: a systematic review. Obesity Reviews, 8(5), 425-440. Cohort or longitudinal analysis These studies include cohort analysis or an element of longitudinal follow up data collection. Aytur, S., Rodrigeuez, D., Evenson, K. and Catellier, D. (2008). Urban containment policies and physical activity. A time-series analysis of metropolitan areas, 1990-2002. American Journal of Preventative Medicine. 34 (4), 320-332. Echeverria, S., Diez-Roux, A. V., Shea, S., Borrell, L. N., & Jackson, S. (2008). Associations of neighborhood problems and neighborhood social cohesion with mental health and health behaviors: the Multi-Ethnic Study of Atherosclerosis. Health & Place, 14(4), 853-865. Giles-Corti, B., Knuiman, M., Timperio, A., Van Niel, K., Pikora, T. J., Bull, F. C. L., et al. (2008). Evaluation of the implementation of a state government community design policy aimed at increasing local walking: design issues and baseline results from RESIDE, Perth Western Australia. Preventive Medicine, 46(1), 46-54. Hou, N., Popkin, B. M., Jacobs, D. R., Jr., Song, Y., Guilkey, D., Lewis, C. E., et al. (2010). Longitudinal associations between neighborhood-level street network with walking, bicycling, and jogging: the CARDIA study. Health & Place, 16(6), 1206-1215. Huang, L., Stinchcomb, D., Pickle, L., Dill, J. and Berrigan, D. (2009). Identifying clusters of active transportation using spatial scan statistics. American Journal of Preventative Medicine. 37 (2), 157-166. Kaymaz, N., Krabbendam, L., de Graaf, R., Nolen, W., ten Have, M., & van Os, J. (2006). Evidence that the urban environment specifically impacts on the psychotic but not the affective dimension of bipolar disorder. Social Psychiatry and Psychiatric Epidemiology, 41(9), 679-685. Plantinga, A. J., & Bernell, S. (2007). The association between urban sprawl and obesity: is it a two-way street? Journal of Regional Science, 47(5), 857-879. Ross, C. E., & Mirowsky, J. (2009). Neighborhood Disorder, Subjective Alienation, and Distress. Journal of Health and Social Behavior, 50(1), 49-64.
29
Stahler, G. J., Mazzella, S., Mennis, J., Chakravorty, S., Rengert, G., & Spiga, R. (2007). The effect of individual, program, and neighborhood variables on continuity of treatment among dually diagnosed individuals. Drug & Alcohol Dependence, 87(1), 54-62. Zammit, S., Lewis, G., Rasbash, J., Dalman., C., Gustafsson, E., Allebeck., P. (2010). Individuals, schools and neighbourhood: a multi-level longitudinal study of variation in incidence of psychotic disorders. Archives of General Psychiatry 67 (9), 914-922. Cross sectional study designs These studies may include quantitative analysis of new or existing statistical or administrative datasets or, less often, qualitative interview or focus group data Aytur, S., Rodriguez, D., Evenson, K., Catellier, R.and Rosamund, W. (2007) Promoting active community environments through land use and transportation planning American Journal of Health Promotion 21 (4), 397-407. Bennett, G. G., McNeill, L. H., Wolin, K. Y., Duncan, D. T., Puleo, E., & Emmons, K. M. (2007). Safe to walk? Neighborhood safety and physical activity among public housing residents. PLoS Medicine / Public Library of Science, 4(10), 1599-1606; discussion 1607. Boarnet, M. G., Greenwald, M., & McMillan, T. E. (2008). Walking, urban design, and health - Toward a cost-benefit analysis framework. Journal of Planning Education and Research, 27(3), 341-358. Brink, M. (2011) Parameters of well-being and subjective health and their relationship with residential traffic noise exposure - a representative evaluation in Switzerland Environment International 37 (4), 723-733. Brueckner, J. K., & Largey, A. G. (2008). Social interaction and urban sprawl. Journal of Urban Economics, 64(1), 18-34. Carson, V., Kuhle, S., Spence, J. C., & Veugelers, P. J. (2010). Parents' perception of neighbourhood environment as a determinant of screen time, physical activity and active transport. Canadian Journal of Public Health. Revue Canadienne de Sante Publique, 101(2), 124-127. Chakraborty, J. (2009). Automobiles, air toxics, and adverse health risks: Environmental Inequities in Tampa Bay, Florida. Annals of the Association of American Geographers, 99(4), 674-697.
30
Coulson, J. C., Fox, K. R., Lawlor, D. A., & Trayers, T. (2011). Residents' diverse perspectives of the impact of neighbourhood renewal on quality of life and physical activity engagement: improvements but unresolved issues. Health and Place, 17 (1), 300-310. Coutts, C. (2008). Greenway accessibilityand physical activity behaviour. Environment and Planning B 35 (3) pp. 552-563. Curry, A., Latkin, C., & Davey-Rothwell, M. (2008). Pathways to depression: the impact of neighborhood violent crime on inner-city residents in Baltimore, Maryland, USA. Social Science & Medicine, 67(1), 23-30. Duncan., M., Winkler, E., Sugiyama, T., Cerin, E., du Toit, L., Leslie, E., and Owen, N. (2010). Relationships of land use mix with walking for transport: do land uses and geographical scale matter? Journal of Urban Health, 87 (5), 782-95. Forsyth, A., Oakes, J. M., Schmitz, K. H., & Hearst, M. (2007). Does residential density increase walking and other physical activity? Urban Studies, 44(4), 679-697. Frank, L. D., Sallis, J. F., Conway, T. L., Chapman, J. E., Saelens, B. E., & Bachman, W. (2006). Many pathways from land use to health - associations between neighborhood walkability and active transportation, body mass index, and air quality. Journal of the American Planning Association, 72(1), 75-87. Fyhri, A., & Klaeboe, R. (2009). Road traffic noise, sensitivity, annoyance and self-reported health--a structural equation model exercise. Environment International, 35(1), 91-97. Gebel, K., Bauman, A., & Owen, N. (2009). Correlates of non-concordance between perceived and objective measures of walkability. Annals of Behavioral Medicine, 37(2), 228-238. Gebel, K., Bauman, A. E., Sugiyama, T., & Owen, N. (2011). Mismatch between perceived and objectively assessed neighborhood walkability attributes: prospective relationships with walking and weight gain. Health & Place, 17(2), 519-524. Giles-Corti, B., Kelty, S. F., Zubrick, S. R., & Villanueva, K. P. (2009). Encouraging walking for transport and physical activity in children and adolescents: how important is the built environment? Sports Medicine, 39(12), 995-1009. Gordon-Larsen, P., Nelson, M. C., Page, P., & Popkin, B. M. (2006). Inequality in the built environment underlies key health disparities in physical activity and obesity. Pediatrics, 117(2), 417-424.
31
Guite, H. F., Clark, C., & Ackrill, G. (2006). The impact of the physical and urban environment on mental well-being. Public Health, 120(12), 1117-1126. Guo, J. and Gandavarapu, S. (2010) An economic evaluation of health-promotive built environment changes Preventative Medicine 50 (1), 44-49. Harrison, R., Gemmell, I. and Heller, R. (2007) The population effect of crime and neighbourhood on physical activity: an analysis of 15,461 adults. Journal of Epidemiology and Community Health. 61 (1), 34-39. Kamphuis, C. B. M., Giskes, K., Kavanagh, A. M., Thornton, L. E., Thomas, L. R., van Lenthe, F. J., et al. (2008). Area variation in recreational cycling in Melbourne: a compositional or contextual effect? Journal of Epidemiology and Community Health, 62(10), 890-898. Kawakami, N., Winkleby, M., Skog, L., Szulkin, R.and Sundquist, K. (2011) Differences in neighborhood accessibility to health-related resources: A nationwide comparison between deprived and affluent neighborhoods in Sweden Health and Place 17 (1), 132-139. Kloos, B., & Townley, G. (2011). Investigating the relationship between neighborhood experiences and psychiatric distress for individuals with serious mental illness. Administration & Policy in Mental Health, 38(2), 105-116. Lathey, V., Guhathakurta, S., & Aggarwal, R. M. (2009). The impact of sub-regional variations in urban sprawl on the prevalence of obesity and related morbidity. Journal of Planning Education and Research, 29(2), 127-141. Li, F., Harmer, P., Cardinal, B. J., Bosworth, M., & Johnson-Shelton, D. (2009). Obesity and the built environment: does the density of neighborhood fast-food outlets matter? American Journal of Health Promotion, 23(3), 203-209. Librett, J. J., Yore, M. M., Schmid, T. L., & Kohl, H. W., 3rd. (2007). Are self-reported physical activity levels associated with perceived desirability of activity-friendly communities? Health & Place, 13(3), 767-773. Lindstrom, M., Moghaddassi, M., & Merlo, J. (2006). Individual and contextual determinants of self-reported poor psychological health: A population-based multilevel analysis in southern Sweden. Scandinavian Journal of Public Health, 34(4), 397-405. Lumeng, J. C., Appugliese, D., Cabral, H. J., Bradley, R. H., & Zuckerman, B. (2006). Neighborhood safety and overweight status in children. Archives of Pediatrics & Adolescent Medicine, 160(1), 25-31.
32
Maley, M., Warren, B. S., & Devine, C. M. (2010). Perceptions of the environment for eating and exercise in a rural community. Journal of Nutrition Education & Behavior, 42(3), 185-191. Marshall, J. D., Brauer, M., & Frank, L. D. (2009). Healthy neighborhoods: walkability and air pollution. Environmental Health Perspectives, 117(11), 1752-1759. Mason, S. (2010). Can community design buld trust? A comparative study of design factors in Boise, Idaho neighbourhoods. Cities 27, 456-465. Macintyre, S., Mckay, L. & Ellaway, A. (2006) Lay concepts of the relative importance of different influences on health; are there major socio-demographic variations? Health Education Research, 21, 731-739. McConville, M., Rodriguez, D., Clifton, K., Cho, G., and Fleischhacker, S. (2011). Disaggregate land uses and walking. American Journal of Preventative Medicine 40 (1), 25-32. Monnat, S. M., & Pickett, C. B. (2011). Rural/urban differences in self-rated health: examining the roles of county size and metropolitan adjacency. Health & Place, 17(1), 311-319. Niemann, H., Bonnefoy, X., Braubach, M., Hecht, K., Maschke, C., Rodrigues, C., et al. (2006). Noise-induced annoyance and morbidity results from the pan-European LARES study. Noise & Health, 8(31), 63-79. Oakes, J. M., Forsyth, A., & Schmitz, K. H. (2007). The effects of neighborhood density and street connectivity on walking behavior: the Twin Cities walking study. Epidemiologic Perspectives & Innovations, 4, 16. Panter, J. and Jones, A. (2008). Associations between physical activity, perceptions of the neighbourhood environment and access to facilities in an English city. Social Science and Medicine 67 (11) pp. 1917-1923. Poortinga, W., Dunstan, F. D., & Fone, D. L. (2007). Perceptions of the neighbourhood environment and self rated health: a multilevel analysis of the Caerphilly Health and Social Needs Study. BMC Public Health, 7, 285. Rossen, L., Pollack, K., Curreiro, F., shields, T., Smart, M., Furr-Holden, D. and Cooley Strickland, M. (2011). Neighborhood incivilities, perceived neighborhood safety, and walking to school among urban-dwelling children. Journal of Physical Activity and Health 8 (2), 262-271.
33
Rodriguez, D. A., Khattak, A. J., & Evenson, K. R. (2006). Can new urbanism encourage physical activity? Comparing a new urbanist neighborhood with conventional suburbs. Journal of the American Planning Association, 72(1), 43-54. Ryan, P. H., LeMasters, G. K., Biswas, P., & et al. (2007). A comparison of proximity and land use regression traffic exposure models and wheezing in infants. Environmental Health Perspectives. Schuurman, N., Peters, P. A., & Oliver, L. N. (2009). Are obesity and physical activity clustered? A spatial analysis linked to residential density. Obesity, 17(12), 2202-2209. Semenza, J. and Krishnasamy, P. (2007). Design of a health-promoting neighborhood intervention. Health Promotion Practice 8 (3), 243-256. Slama, R., Morgenstern, V., Cyrys, J., & et al. (2007). Traffic-related atmospheric pollutants levels during pregnancy and offspring's term birth weight: a study relying on a land-use regression exposure model. Environmental Health Perspectives. Smith, K. R., Brown, B. B., Yamada, I., Kowaleski-Jones, L., Zick, C. D., & Fan, J. X. (2008). Walkability and body mass index - density, design, and new diversity measures. American Journal of Preventive Medicine, 35(3), 237-244. Subramanian, S. V., & Kennedy, M. H. (2009). Perception of neighborhood safety and reported childhood lifetime asthma in the United States (U.S.): a study based on a national survey. PLoS ONE [Electronic Resource], 4(6), e6091. Sundquist, K., Theobald, H., Yang, M., Li, X. J., Johansson, S. E., & Sundquist, J. (2006). Neighborhood violent crime and unemployment increase the risk of coronary heart disease: a multilevel study in an urban setting. Social Science & Medicine, 62 (8), 2061-2071. Thomas, H., Weaver, N., Patterson, J., Jones, P., Bell, T., Playle, R., et al. (2007). Mental health and quality of residential environment. British Journal of Psychiatry, 191, 500-505. Trayers, T., Deem, R., Fox, K. R., Riddoch, C. J., Ness, A. R., & Lawlor, D. A. (2006). Improving health through neighbourhood environmental change: are we speaking the same language? A qualitative study of views of different stakeholders. Journal of Public Health, 28(1), 49-55. Wood, L., Shannon, T., Bulsara, M. Pikora, T., McCormack, G. and Giles-Corti, B. (2008). The anatomy of the safe and social suburb: an exploratory study of the built
34
environment, social capital and residents’ perceptions of safety. Health and Place 14 (1), 14-31. Yang, T.-C., & Matthews, S. A. (2010). The role of social and built environments in predicting self-rated stress: a multilevel analysis in Philadelphia. Health & Place, 16(5), 803-810. Case studies These studies include action research or community participation type evaluations of local initiatives or those with weaker methods and/or reporting of those methods. Hendrick, K., Wilkerson, R., Vogt, C., TenBrink, S. (2009). Transforming a small Midwestern city for physical activity from the sidewalk up. Journal of Physical Activity and Health 6 (6), 690-8. McCreedy, M., & Leslie, J. G. (2009). Get Active Orlando: changing the built environment to increase physical activity. American Journal of Preventive Medicine, 37(6 Suppl 2), S395-402. Quinn, N., & Biggs, H. (2010). Creating partnerships to improve community mental health and well-being in an area of high deprivation: lessons from a study with high-rise flat residents in east Glasgow. Journal of Public Mental Health, 9(4), 16-21. TenBrink, D. S., McMunn, R., & Panken, S. (2009). Project U-Turn: increasing active transportation in Jackson, Michigan. American Journal of Preventive Medicine, 37(6 Suppl 2), S329-335. Walfoort, N. L., Clark, J. J., Bostock, M. J., & O'Neil, K. (2009). ACTIVE Louisville: incorporating active living principles into planning and design. American Journal of Preventive Medicine, 37(6 Suppl 2), S368-376. Wiggs, I., Brownson, R. C., & Baker, E. A. (2008). If you build it, they will come: lessons from developing walking trails in rural Missouri. Health Promotion Practice, 9(4), 387-394. Background references Barton, H. (2009) Land use planning and health and well-being. Land Use Policy, 26, 115-123.
35
Bramley. G., Dempsey, N., Power, S., Brown, C. and Watkins, D. (2009). Social sustainability and urban form: evidence from five British cities. Environment and Planning A 41 pp.2125-2142. Croucher, K., and Myers, L. 2008. The Health Impacts of Urban Green Spaces: A Literature Review. Centre for Housing Policy, University of York. Dempsey, N. (2008). Quality of the built environment in urban neighbourhoods. Planning Practice and Research. 23 (2) pp.249-264. Department of Health. (2010) Healthier Lives, Healthier People: Our Strategy for Public Health in England. London: Department of Health. Frank, L., Sallis, J., Saelens, B., Leary,L., Cain,K., Conway,T., Hess,P.(2009) The development of a Walkability Index: application to the Neighborhood Quality of Life Study. British Journal of Sports Medicine, 44 (13), 924-33. Jarvis, H. (2003) Dispelling the Myth that preference makes practice in residential location and transport behaviour. Housing Studies, 18 (4) pp. 587-606. Marmot, M. (2010) Fairer Societies, Healthy Lives: The Marmot Review. A Strategic Review of Health Inequalities post 2010. London: Department of Health. National Institute for Clinical Excellence. 2008. Promoting or Creating Built Environments that Encourage and Support Physical Activity. NICE Public Health Guidance 8. National Institute for Clinical Excellence. Panter, J. and Jones, A. (2008). Associations between physical activity, perceptions of the neighbourhood environment and access to facilities in an English city.Social Science and Medicine, 67 (11), 1917-1923. Sallis, J. F., & Glanz, K. (2006). The role of built environments in physical activity, eating, and obesity in childhood. Future of Children, 16(1), 89-108. Scottish Executive. (2003). Physical Activity Task Force: Let's Make Scotland More Active - A Strategy for Physical Activity. Edinburgh, Scottish Executive. Scottish Executive. (2008). Designing Places. Edinburgh, Scottish Executive. Scottish Executive. (2010a). Designing Streets. Edinburgh, Scottish Executive. Scottish Government. 2008. Good Places, Better Health: A New Approach to the Environment and Health in Scotland, Implementation Plan. Edinburgh: Scottish Government.
36

http://www.scotland.gov.uk/Publications/2008/12/11090318/0 Scottish Government. (2010b).The Scottish Health Survey: Volume 1, Main Report. Edinburgh, Scottish Government.
37
APPENDIX A: REVIEW METHODS Methods of the review The search strategies adopted in the earlier review of the physical characteristics of urban neighbourhoods and health successfully identified studies that addressed the influence of the built environment on health and wellbeing, and also studies about land use mix and land density. This search strategy was adapted by an information scientist (Steven Duffy) to include additional search terms for ‘spatial layout’, including ‘land use mix’ and ‘land use density, and ‘neighbourhood design’. The searches were then updated from 2006 (when the searches for the previous review were completed), and limited to English language studies. Searches were carried out in May 2011. These strategies are presented in Appendix B. The following databases were searched:
• MEDLINE and Pre-MEDLINE • Embase • PsycINFO • Social Policy and Practice • Social Sciences Citation Index (SSCI) • Cochrane Database of Systematic Reviews (CDSR) • Database of Abstracts of Reviews of Effects (DARE) • Cochrane Central Register of Controlled Trials (CENTRAL) • Health Technology Assessment (HTA) • NHS Economic Evaluation Database (NHS EED) • OAIster
Internet searches were carried out in the following websites:
• National Institute for Health and Clinical Excellence (NICE) public health guidance
• ESRC Centre for Evidence-Based Public Health Policy • Scottish Public Health Network • Public Health Wales • Association of Public Health Observatories • National Planning Forum • Royal Institute of British Architects • Town and Country Planning Association • Royal Town Planning Institute • National Platform for the Built Environment • Centre for Education in the Built Environment
38
• Commission for Architecture and the Built Environment (decommissioned in 2011, but research still accessible)
• Living Streets References were initially checked for duplication, and then entered into an Endnote Library. The library contained 4,613 references. An initial sift of references was undertaken to exclude papers that reported methodological debate, design guides, and discursive papers or “think pieces” that did not report primary studies. This is not to say such papers are not of value, however their relevance to this review was limited. Several of these papers have informed the context to the review. In addition review papers were identified (n=125), and then assessed for their robustness. Forty review papers gave a sufficiently detailed account of their methods to be considered for the review, 33 of which were available to the review team. These provided the strongest evidence. A total of 65 individual research papers were also included in this review to inform topic areas omitted from the robust reviews identified by the search. Only nine of these included any longitudinal or cohort analysis The majority of these papers (51) represented cross sectional studies, predominantly quantitative, Lastly, five studies based on case studies or evaluations of specific initiatives were also included in the review and these studies provided the weakest evidence. A total of 98 papers entered the review and a breakdown of the references by study type is included at the end of the report. Overview of the literature Researchers in the field are acutely aware of the heterogeneity of the literature on the relationship between the built environment and health, which inhibits the comparability between studies and the ability to learn from the body of evidence (Carter and Dubois, 2010; Feng et al., 2010). Indeed, Ferreira et al. (2006) suggest that many questions remain unanswered because of the data and analytic methods used. However, Sallis and Glanz (2009) note the emergence of stronger evidence in recent years. This section highlights some of the important caveats to consider when interpreting the evidence, outlining some of the theoretical and methodological weaknesses and inconsistencies within the evidence base. Theorising the link between the built environment and health Lachowycz and Jones (2011) note that there is a lack of theory regarding the mechanisms through which the environment can improve health, in this case the issue of green space. Moreover, this absence of theory to inform the expected transmission mechanisms is reflected in methodological problems (Clark and Nieuwenhuisjen, 2009). For example, associations between the environment and physical activity may be demonstrated but the health outcomes of this activity are often assumed, and health indicators not included as outcome variables.
39
Research Methods The evidence base is almost exclusively quantitative analysis of existing or new survey data. Isolating the influence of one or a limited number of elements of the physical environment on residents’ health is methodologically challenging, given the myriad of factors that may mediate the outcomes or exert a significantly more powerful influence on health. It is not surprising therefore that a number of methodological weaknesses have been identified relating to the research designs, data collection and analysis. Over reliance on cross sectional data The principle issue with the evidence base is its overreliance on cross sectional data (Papas et al., 2007; Wendel-Vos et al., 2007; Ferreira et al., 2006). This means that the studies identify differences instead of change and are unable to infer the direction of causation in relationships (Leal and Chaix, 2011). Several authors call for more longitudinal prospective studies in the field to capture the effects of cumulative exposure, and record change over time in individuals and the environment (Pont et al., 2009; Pucher et al., 2010; Sallis and Glanz, 2009; Ferreira et al., 2007; Deguen and Zmirou-Navier, 2010). Wendel-Vos et al. (2007) also note this weakness in the evidence base but report that the three longitudinal studies included in their review had superior methods but produced the same findings as the cross-sectional studies. Nonetheless, greater use of longitudinal studies and prospective evaluations to examine the outcomes of environmental changes would be beneficial (Kacynski and Henderson, 2007). Inconsistent measurement The second most frequent complaint about the methodological foundation of the evidence is that the comparability between studies is poor because of the inconsistent measurement of the attributes of the built environment and the health related outcomes (Clark and Nieuwenhuijsen, 2009; Duegen and Zmirou-Navier, 2010; Kaczynski and Henderson, 2007; Wendel-Vos et al., 2007; Pucher et al., 2010; Pont et al., 2009; Papas et al., 2007). Some authors also complained about the over-reliance on subjective or self-reported data (Sandercock et al., 2010 ) and some found that only 21 per cent of studies in their review were based on objective measures (Wendel-Vos et al., 2007). However, perceptions of the environment are found to be as important as objective measures. Almost all key aspects of the studies reflect inconsistencies in measures deployed. For example, the relationship between parks and physical activity may be based on the proximity between a person’s home and the park and measured ‘as the crow flies’, by the time taken to walk to the park, or the actual distance of the walking route; or is based upon local density of parks or recreational facilities in the
40
neighbourhood, by counts of parks per geographical unit, or the proportion of land in the neighbourhood given over to parkland. The neighbourhood may be operationalised using census tracts, may be undefined or may relate to a small geography that relates to people’s regular activities. Physical activity may be measured by whether people meet the recommended daily or weekly time spent in exercise, the number of minutes per week or day they engage in any activities, or just walking or just cycling. In addition, physical activity may be low, moderate or vigorous but it is not always defined. Moreover, self-reported measures (by the individual or by parents of children) are frequently adopted but objective measures of activity that include accelerometers, heart monitors or direct observation are also used, but less frequently. In studies of the influence of the food environment on health, measures again relate to proximity or density of fast food outlets, but there is also a lack of definition of ‘fast food’ or the choices of food available in that neighbourhood. Also the actual consumption of fast food is rarely considered and studies of the ‘obesogenic environment’ rarely measure the energy consumed (what people have actually eaten) as well as energy spent (engaging in physical activity). A minority of studies examining the built environment and physical activity included additional health indicators as outcome variables, but positive associations with these other indicators (such as BMI) were harder to demonstrate (Kirk et al., 2010; Thomson et al.2006 and 2009). Controlling for cofounders Many studies provide evidence that supports a relationship between the built environment and physical activity, in particular, but a perennial concern is determining to what extent this relationship is explained by selection effects. Do people who enjoy walking, cycling or sports move more frequently to areas that support these activities? Leal and Chaix (2011) note that few studies control for residential preferences and call for future studies to ask why people moved to their area of residence, as longitudinal studies will not eliminate this potential source of bias. Many studies control for various individual characteristics in their analysis but Kim (2008) observe that studies do not control for other sources of neighbourhood exposure, or the influence of the workplace, which they suggest exerts powerful effects , particularly on mental health. Even if longitudinal research designs were employed it would be challenging to disentangle multiple effects of overlapping interventions, so examining local neighbourhood effects of environmental changes may miss population wide health promotion campaigns, for example. Furthermore, the issue of the workplace raises a concern that the residential neighbourhood is not the only built environment that people are exposed to, or indeed need to access, as people may live, work, and study in different places.
41
Qualitative research Few studies adopt qualitative methods of enquiry and mixed methods studies in the field are rare. Qualitative research is valuable in gaining nuanced insights of attitudinal data, exploring perceptions of the environment that existing datasets cannot, and in improving our understanding of causal pathways. For example, McCormack et al. (2010) suggest that qualitative methods would be useful in exploring how the attributes of the park, such as its quality, may influence their use of the park and their physical activity, for example. However, the quality of some qualitative research was questioned as it lacked specificity, calling for more ‘facilities’ without identifying which specific facilities were required (Kaczynski and Henderson, 2007). However, this trait was also evident in many quantitative studies, where ‘parks and recreational facilities’ were found to be associated with activity, for example, but with infrequent explanations of what form these amenities took. Moreover, studies have shown that perceptions of safety and of the aesthetics of neighbourhoods or parks are powerful influences on the use made of green space or walkable environments and are readily captured by qualitative forms of enquiry. Cost benefit analysis Only one study (Brueckner and Largey, 2008) undertook a cost benefit analysis of the impact of neighbourhood improvements on health. Such studies are reliant on the assumptions made in the modelling, but are useful to support decision-making when resources are constrained. Applicability of the research evidence to Scotland Some states in the USA have sought to control urban sprawl but others allow less controlled development of large suburban and exurban settlements where residents are, by necessity, totally dependent on the car for almost every activity outside the home. In the UK, many settlements are based on old street patterns developed prior to the motor car and one might reasonably expect that residents in such areas would have greater opportunities to walk. Development patterns in Australia, Canada and mainland Europe are different again. For example, walking and cycling are more regular means of transport (and recreation) in mainland Europe, where residential density is higher (as a consequence of greater numbers of apartments as opposed to houses) than in the UK. Thus the findings of studies exploring street design and its impact on the frequency of walking or cycling may only be applicable or relevant in certain contexts. A good example is the consistent and strong finding across studies that the provision of sidewalks is associated with more people walking. Although this finding may have salience in some rural areas, it is of little use for most of the UK where the provision of pavements is routine. In contrast, the identification of raised crossways on sidewalks or pavements to support walkability is explicitly
42
transferable to a number of different contexts, as these are commonly absent from road junctions. Spatial social segregation and spatial patterns of racial segregation in the USA may also differ to those in the UK. Studies identifying differing effects between Latinos, African American and Asian groups in the USA were not reported as the applicability and interpretation of such evidence for a UK and/or Scottish context is challenging. Variations in impacts for low income or neighbourhoods of high social disadvantage were reported as these findings were considered to be more directly transferable, although it is to be noted that there are minimal social safety nets in the USA in comparison to the UK, which may impact upon studies examining the neighbourhood environment, social disadvantage and health. Another contextual issue apparent in the literature was that of the weather that was found to be positively associated with levels of physical activity or use of parks or recreational facilities. It is possible that studies undertaken in Australia or certain states in the USA are less generalisable to the UK and/or Scotland or parts of Scotland where the prevailing weather will be very different. For example, the provision of indoor sport and exercise facilities may be of greater benefit than outdoor facilities and greenspaces in some contexts.
43

44
APPENDIX B: Land use/density search strategy The search strategy used for the earlier 2007 review successfully identified studies that addressed the influence of the built environment on health and wellbeing, and also studies about land use mix and land density. This search strategy was adapted to include additional search terms for ‘spatial layout’, including ‘land use mix’ and ‘land use density, and ‘neighbourhood design’. The searches were then updated from 2006 (when the searches for the previous review were completed), and limited to English language studies only. The following databases were searched:
• MEDLINE and Pre-MEDLINE • Embase • PsycINFO • Social Policy and Practice • Social Sciences Citation Index (SSCI) • Cochrane Database of Systematic Reviews (CDSR) • Database of Abstracts of Reviews of Effects (DARE) • Cochrane Central Register of Controlled Trials (CENTRAL) • Health Technology Assessment (HTA) • NHS Economic Evaluation Database (NHS EED) • OAIster
Internet searches were carried out in the following websites:
• National Institute for Health and Clinical Excellence (NICE) public health guidance • ESRC Centre for Evidence-Based Public Health Policy • Scottish Public Health Network • Public Health Wales • Association of Public Health Observatories • National Planning Forum • Royal Institute of British Architects • Town and Country Planning Association • Royal Town Planning Institute • National Platform for the Built Environment • Centre for Education in the Built Environment • Commission for Architecture and the Built Environment (decommissioned in 2011,
but research still accessible) • Living Streets
The search strategies and results are listed below. As a number of databases and internet websites were searched, some degree of duplication resulted. In order to manage this issue, the titles and abstracts of bibliographic records were downloaded and imported into EndNote software and duplicate records removed.
45
Search Strategies and results 1) Database searches MEDLINE and Pre-MEDLINE (OvidSP). 1996-2011/Apr week 4. 10th May 2011. 1971 records were retrieved in MEDLINE, and 243 records in Pre-MEDLINE 1 *Residence Characteristics/ (3519) 2 neighbo?rhood$.ti,ab. (8323) 3 *poverty areas/ (1009) 4 ((deprived or deprivation or disadvantage$) adj2 area$).ti,ab. (1187) 5 (residential environment$ or local environment$ or built environment$ or physical environment$ or local area$).ti,ab. (5184) 6 place effect$.ti,ab. (36) 7 (place of residence or area of residence).ti,ab. (2413) 8 (access$ adj2 (transport$ or shop$ or bank$ or parks or garden$ or nature or greenspace$ or public)).ti,ab. (1183) 9 (local adj2 (facility or facilities or amenity or amenities or resource$)).ti,ab. (819) 10 (community adj2 (facility or facilities or amenity or amenities or resource$)).ti,ab. (1518) 11 ((recreation or leisure) adj2 (facility or facilities or amenity or amenities or resource$)).ti,ab. (101) 12 ((local or area) adj3 (crime or nuisance)).ti,ab. (38) 13 urban sprawl.ti,ab. (68) 14 *environment design/ or *urban renewal/ (1526) 15 urban regeneration.ti,ab. (23) 16 or/1-15 (23829) 17 *Health Status/ (17864) 18 (health status or health state$).ti,ab. (22360) 19 level$ of health.ti,ab. (1923) 20 *Mental Health/ (5145) 21 mental health.ti,ab. (38135) 22 health impact$.ti,ab. (3126) 23 health risk$.ti,ab. (10895) 24 health benefit$.ti,ab. (6078) 25 health improv$.ti,ab. (1197) 26 (influenc$ health or influence$ on health or influence$ upon health).ti,ab. (1386) 27 promot$ health.ti,ab. (1491) 28 inhibit$ health.ti,ab. (7) 29 enhanc$ health.ti,ab. (389) 30 affect$ health.ti,ab. (1250) 31 (effect$ on health or effect$ upon health).ti,ab. (1617) 32 (self-rated health or self-assess$ health or self-report$ health or self-perceived health or self-perception$ of health).ti,ab. (4580) 33 social capital.ti,ab. (921) 34 physical activity.ti,ab. (29093) 35 or/17-34 (125443) 36 16 and 35 (3294) 37 limit 36 to (english language and yr="2006 -Current") (1933) 38 exp Spatial Behavior/ (5187) 39 (spatial behavio?r$ or spatial layout or spatial analys$ or proxemic$).ti,ab. (1456) 40 (land mix or land mixes).ti,ab. (1)
46
41 ("land use" or "land uses" or "land usage").ti,ab. (3249) 42 (land adj3 densit$).ti,ab. (94) 43 housing densit$.ti,ab. (65) 44 or/38-43 (9796) 45 35 and 44 (272) 46 limit 45 to (english language and yr="2006 -Current") (187) 47 37 or 46 (2012) 48 animals/ not (animals/ and humans/) (1431078) 49 (comment or editorial or letter or news or newspaper article).pt. (762128) 50 47 not (48 or 49) (1971) Embase (OvidSP). 1996-2011/week 18. 10th May 2011. 2115 records were retrieved 1 (residen$ adj2 characteristic$).ti,ab. (516) 2 neighbo?rhood$.ti,ab. (9952) 3 (poverty adj2 area$).ti,ab. (131) 4 ((deprived or deprivation or disadvantage$) adj2 area$).ti,ab. (1394) 5 (residential environment$ or local environment$ or built environment$ or physical environment$ or local area$).ti,ab. (6462) 6 place effect$.ti,ab. (42) 7 (place of residence or area of residence).ti,ab. (2920) 8 (access$ adj2 (transport$ or shop$ or bank$ or parks or garden$ or nature or greenspace$ or public)).ti,ab. (1520) 9 (local adj2 (facility or facilities or amenity or amenities or resource$)).ti,ab. (1052) 10 (community adj2 (facility or facilities or amenity or amenities or resource$)).ti,ab. (1914) 11 ((recreation or leisure) adj2 (facility or facilities or amenity or amenities or resource$)).ti,ab. (131) 12 ((local or area) adj3 (crime or nuisance)).ti,ab. (54) 13 urban sprawl.ti,ab. (83) 14 *environmental planning/ (1000) 15 urban regeneration.ti,ab. (26) 16 or/1-15 (25897) 17 *health status/ (13396) 18 (health status or health state$).ti,ab. (27652) 19 level$ of health.ti,ab. (2453) 20 *mental health/ (9037) 21 mental health.ti,ab. (52119) 22 health impact$.ti,ab. (3935) 23 health risk$.ti,ab. (13679) 24 health benefit$.ti,ab. (7858) 25 health improv$.ti,ab. (1585) 26 (influenc$ health or influence$ on health or influence$ upon health).ti,ab. (1679) 27 promot$ health.ti,ab. (1811) 28 inhibit$ health.ti,ab. (9) 29 enhanc$ health.ti,ab. (488) 30 affect$ health.ti,ab. (1522) 31 (effect$ on health or effect$ upon health).ti,ab. (2077) 32 (self-rated health or self-assess$ health or self-report$ health or self-perceived health or self-perception$ of health).ti,ab. (5381) 33 social capital.ti,ab. (1067) 34 physical activity.ti,ab. (38247)
47
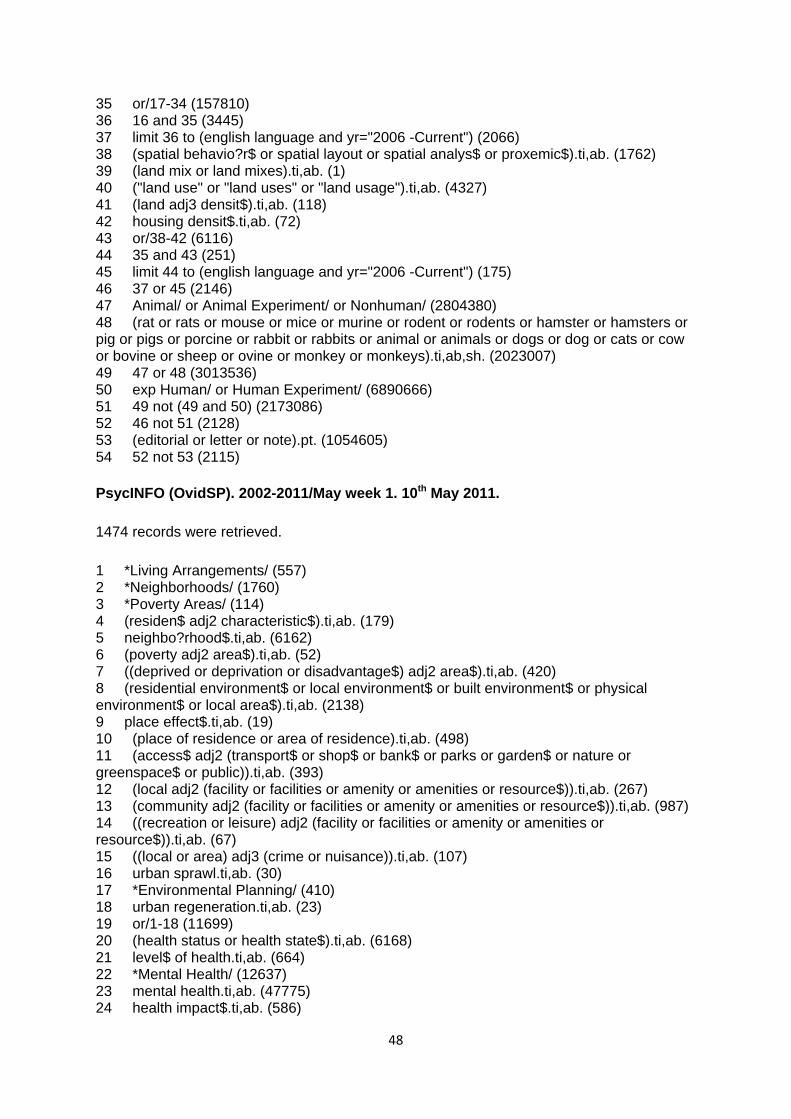
35 or/17-34 (157810) 36 16 and 35 (3445) 37 limit 36 to (english language and yr="2006 -Current") (2066) 38 (spatial behavio?r$ or spatial layout or spatial analys$ or proxemic$).ti,ab. (1762) 39 (land mix or land mixes).ti,ab. (1) 40 ("land use" or "land uses" or "land usage").ti,ab. (4327) 41 (land adj3 densit$).ti,ab. (118) 42 housing densit$.ti,ab. (72) 43 or/38-42 (6116) 44 35 and 43 (251) 45 limit 44 to (english language and yr="2006 -Current") (175) 46 37 or 45 (2146) 47 Animal/ or Animal Experiment/ or Nonhuman/ (2804380) 48 (rat or rats or mouse or mice or murine or rodent or rodents or hamster or hamsters or pig or pigs or porcine or rabbit or rabbits or animal or animals or dogs or dog or cats or cow or bovine or sheep or ovine or monkey or monkeys).ti,ab,sh. (2023007) 49 47 or 48 (3013536) 50 exp Human/ or Human Experiment/ (6890666) 51 49 not (49 and 50) (2173086) 52 46 not 51 (2128) 53 (editorial or letter or note).pt. (1054605) 54 52 not 53 (2115) PsycINFO (OvidSP). 2002-2011/May week 1. 10th May 2011. 1474 records were retrieved. 1 *Living Arrangements/ (557) 2 *Neighborhoods/ (1760) 3 *Poverty Areas/ (114) 4 (residen$ adj2 characteristic$).ti,ab. (179) 5 neighbo?rhood$.ti,ab. (6162) 6 (poverty adj2 area$).ti,ab. (52) 7 ((deprived or deprivation or disadvantage$) adj2 area$).ti,ab. (420) 8 (residential environment$ or local environment$ or built environment$ or physical environment$ or local area$).ti,ab. (2138) 9 place effect$.ti,ab. (19) 10 (place of residence or area of residence).ti,ab. (498) 11 (access$ adj2 (transport$ or shop$ or bank$ or parks or garden$ or nature or greenspace$ or public)).ti,ab. (393) 12 (local adj2 (facility or facilities or amenity or amenities or resource$)).ti,ab. (267) 13 (community adj2 (facility or facilities or amenity or amenities or resource$)).ti,ab. (987) 14 ((recreation or leisure) adj2 (facility or facilities or amenity or amenities or resource$)).ti,ab. (67) 15 ((local or area) adj3 (crime or nuisance)).ti,ab. (107) 16 urban sprawl.ti,ab. (30) 17 *Environmental Planning/ (410) 18 urban regeneration.ti,ab. (23) 19 or/1-18 (11699) 20 (health status or health state$).ti,ab. (6168) 21 level$ of health.ti,ab. (664) 22 *Mental Health/ (12637) 23 mental health.ti,ab. (47775) 24 health impact$.ti,ab. (586)
48
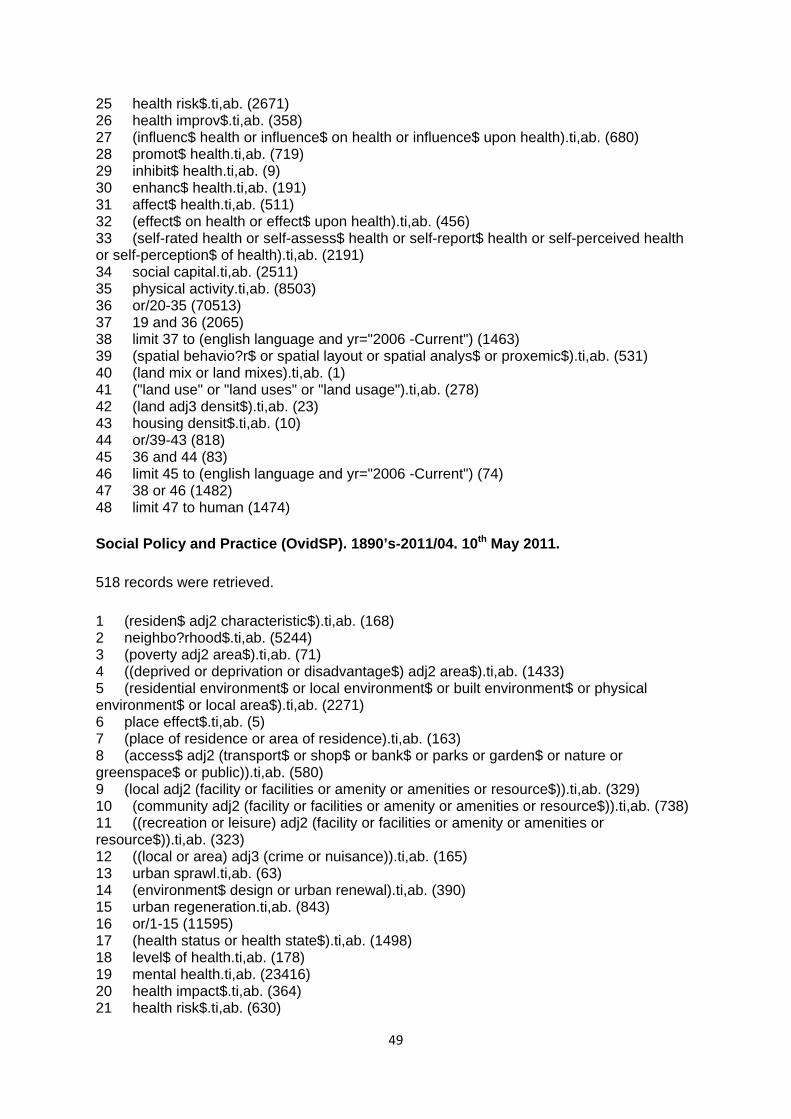
25 health risk$.ti,ab. (2671) 26 health improv$.ti,ab. (358) 27 (influenc$ health or influence$ on health or influence$ upon health).ti,ab. (680) 28 promot$ health.ti,ab. (719) 29 inhibit$ health.ti,ab. (9) 30 enhanc$ health.ti,ab. (191) 31 affect$ health.ti,ab. (511) 32 (effect$ on health or effect$ upon health).ti,ab. (456) 33 (self-rated health or self-assess$ health or self-report$ health or self-perceived health or self-perception$ of health).ti,ab. (2191) 34 social capital.ti,ab. (2511) 35 physical activity.ti,ab. (8503) 36 or/20-35 (70513) 37 19 and 36 (2065) 38 limit 37 to (english language and yr="2006 -Current") (1463) 39 (spatial behavio?r$ or spatial layout or spatial analys$ or proxemic$).ti,ab. (531) 40 (land mix or land mixes).ti,ab. (1) 41 ("land use" or "land uses" or "land usage").ti,ab. (278) 42 (land adj3 densit$).ti,ab. (23) 43 housing densit$.ti,ab. (10) 44 or/39-43 (818) 45 36 and 44 (83) 46 limit 45 to (english language and yr="2006 -Current") (74) 47 38 or 46 (1482) 48 limit 47 to human (1474) Social Policy and Practice (OvidSP). 1890’s-2011/04. 10th May 2011. 518 records were retrieved. 1 (residen$ adj2 characteristic$).ti,ab. (168) 2 neighbo?rhood$.ti,ab. (5244) 3 (poverty adj2 area$).ti,ab. (71) 4 ((deprived or deprivation or disadvantage$) adj2 area$).ti,ab. (1433) 5 (residential environment$ or local environment$ or built environment$ or physical environment$ or local area$).ti,ab. (2271) 6 place effect$.ti,ab. (5) 7 (place of residence or area of residence).ti,ab. (163) 8 (access$ adj2 (transport$ or shop$ or bank$ or parks or garden$ or nature or greenspace$ or public)).ti,ab. (580) 9 (local adj2 (facility or facilities or amenity or amenities or resource$)).ti,ab. (329) 10 (community adj2 (facility or facilities or amenity or amenities or resource$)).ti,ab. (738) 11 ((recreation or leisure) adj2 (facility or facilities or amenity or amenities or resource$)).ti,ab. (323) 12 ((local or area) adj3 (crime or nuisance)).ti,ab. (165) 13 urban sprawl.ti,ab. (63) 14 (environment$ design or urban renewal).ti,ab. (390) 15 urban regeneration.ti,ab. (843) 16 or/1-15 (11595) 17 (health status or health state$).ti,ab. (1498) 18 level$ of health.ti,ab. (178) 19 mental health.ti,ab. (23416) 20 health impact$.ti,ab. (364) 21 health risk$.ti,ab. (630)
49
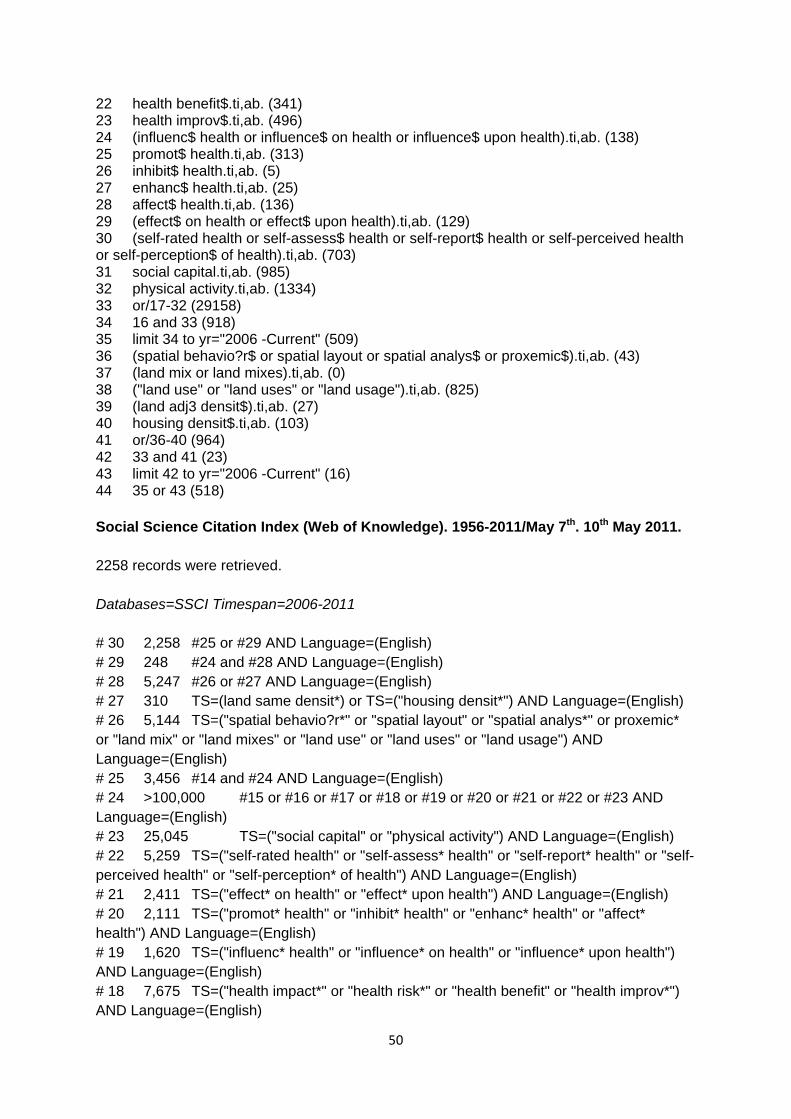
22 health benefit$.ti,ab. (341) 23 health improv$.ti,ab. (496) 24 (influenc$ health or influence$ on health or influence$ upon health).ti,ab. (138) 25 promot$ health.ti,ab. (313) 26 inhibit$ health.ti,ab. (5) 27 enhanc$ health.ti,ab. (25) 28 affect$ health.ti,ab. (136) 29 (effect$ on health or effect$ upon health).ti,ab. (129) 30 (self-rated health or self-assess$ health or self-report$ health or self-perceived health or self-perception$ of health).ti,ab. (703) 31 social capital.ti,ab. (985) 32 physical activity.ti,ab. (1334) 33 or/17-32 (29158) 34 16 and 33 (918) 35 limit 34 to yr="2006 -Current" (509) 36 (spatial behavio?r$ or spatial layout or spatial analys$ or proxemic$).ti,ab. (43) 37 (land mix or land mixes).ti,ab. (0) 38 ("land use" or "land uses" or "land usage").ti,ab. (825) 39 (land adj3 densit$).ti,ab. (27) 40 housing densit$.ti,ab. (103) 41 or/36-40 (964) 42 33 and 41 (23) 43 limit 42 to yr="2006 -Current" (16) 44 35 or 43 (518) Social Science Citation Index (Web of Knowledge). 1956-2011/May 7th. 10th May 2011. 2258 records were retrieved. Databases=SSCI Timespan=2006-2011 # 30 2,258 #25 or #29 AND Language=(English) # 29 248 #24 and #28 AND Language=(English) # 28 5,247 #26 or #27 AND Language=(English) # 27 310 TS=(land same densit*) or TS=("housing densit*") AND Language=(English) # 26 5,144 TS=("spatial behavio?r*" or "spatial layout" or "spatial analys*" or proxemic* or "land mix" or "land mixes" or "land use" or "land uses" or "land usage") AND Language=(English) # 25 3,456 #14 and #24 AND Language=(English) # 24 >100,000 #15 or #16 or #17 or #18 or #19 or #20 or #21 or #22 or #23 AND Language=(English) # 23 25,045 TS=("social capital" or "physical activity") AND Language=(English) # 22 5,259 TS=("self-rated health" or "self-assess* health" or "self-report* health" or "self-perceived health" or "self-perception* of health") AND Language=(English) # 21 2,411 TS=("effect* on health" or "effect* upon health") AND Language=(English) # 20 2,111 TS=("promot* health" or "inhibit* health" or "enhanc* health" or "affect* health") AND Language=(English) # 19 1,620 TS=("influenc* health" or "influence* on health" or "influence* upon health") AND Language=(English) # 18 7,675 TS=("health impact*" or "health risk*" or "health benefit" or "health improv*") AND Language=(English)
50
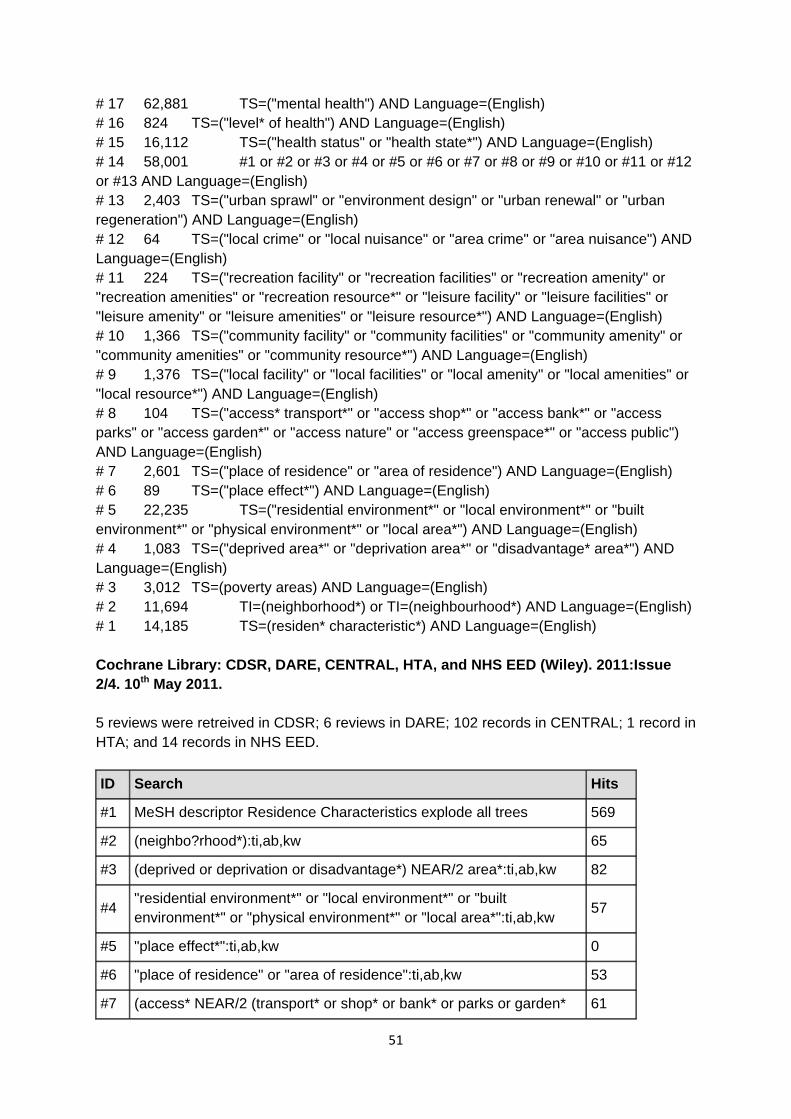
# 17 62,881 TS=("mental health") AND Language=(English) # 16 824 TS=("level* of health") AND Language=(English) # 15 16,112 TS=("health status" or "health state*") AND Language=(English) # 14 58,001 #1 or #2 or #3 or #4 or #5 or #6 or #7 or #8 or #9 or #10 or #11 or #12 or #13 AND Language=(English) # 13 2,403 TS=("urban sprawl" or "environment design" or "urban renewal" or "urban regeneration") AND Language=(English) # 12 64 TS=("local crime" or "local nuisance" or "area crime" or "area nuisance") AND Language=(English) # 11 224 TS=("recreation facility" or "recreation facilities" or "recreation amenity" or "recreation amenities" or "recreation resource*" or "leisure facility" or "leisure facilities" or "leisure amenity" or "leisure amenities" or "leisure resource*") AND Language=(English) # 10 1,366 TS=("community facility" or "community facilities" or "community amenity" or "community amenities" or "community resource*") AND Language=(English) # 9 1,376 TS=("local facility" or "local facilities" or "local amenity" or "local amenities" or "local resource*") AND Language=(English) # 8 104 TS=("access* transport*" or "access shop*" or "access bank*" or "access parks" or "access garden*" or "access nature" or "access greenspace*" or "access public") AND Language=(English) # 7 2,601 TS=("place of residence" or "area of residence") AND Language=(English) # 6 89 TS=("place effect*") AND Language=(English) # 5 22,235 TS=("residential environment*" or "local environment*" or "built environment*" or "physical environment*" or "local area*") AND Language=(English) # 4 1,083 TS=("deprived area*" or "deprivation area*" or "disadvantage* area*") AND Language=(English) # 3 3,012 TS=(poverty areas) AND Language=(English) # 2 11,694 TI=(neighborhood*) or TI=(neighbourhood*) AND Language=(English) # 1 14,185 TS=(residen* characteristic*) AND Language=(English) Cochrane Library: CDSR, DARE, CENTRAL, HTA, and NHS EED (Wiley). 2011:Issue 2/4. 10th May 2011. 5 reviews were retreived in CDSR; 6 reviews in DARE; 102 records in CENTRAL; 1 record in HTA; and 14 records in NHS EED. ID Search Hits
#1 MeSH descriptor Residence Characteristics explode all trees 569
#2 (neighbo?rhood*):ti,ab,kw 65
#3 (deprived or deprivation or disadvantage*) NEAR/2 area*:ti,ab,kw 82
#4 "residential environment*" or "local environment*" or "built environment*" or "physical environment*" or "local area*":ti,ab,kw 57
#5 "place effect*":ti,ab,kw 0
#6 "place of residence" or "area of residence":ti,ab,kw 53
#7 (access* NEAR/2 (transport* or shop* or bank* or parks or garden* 61
51
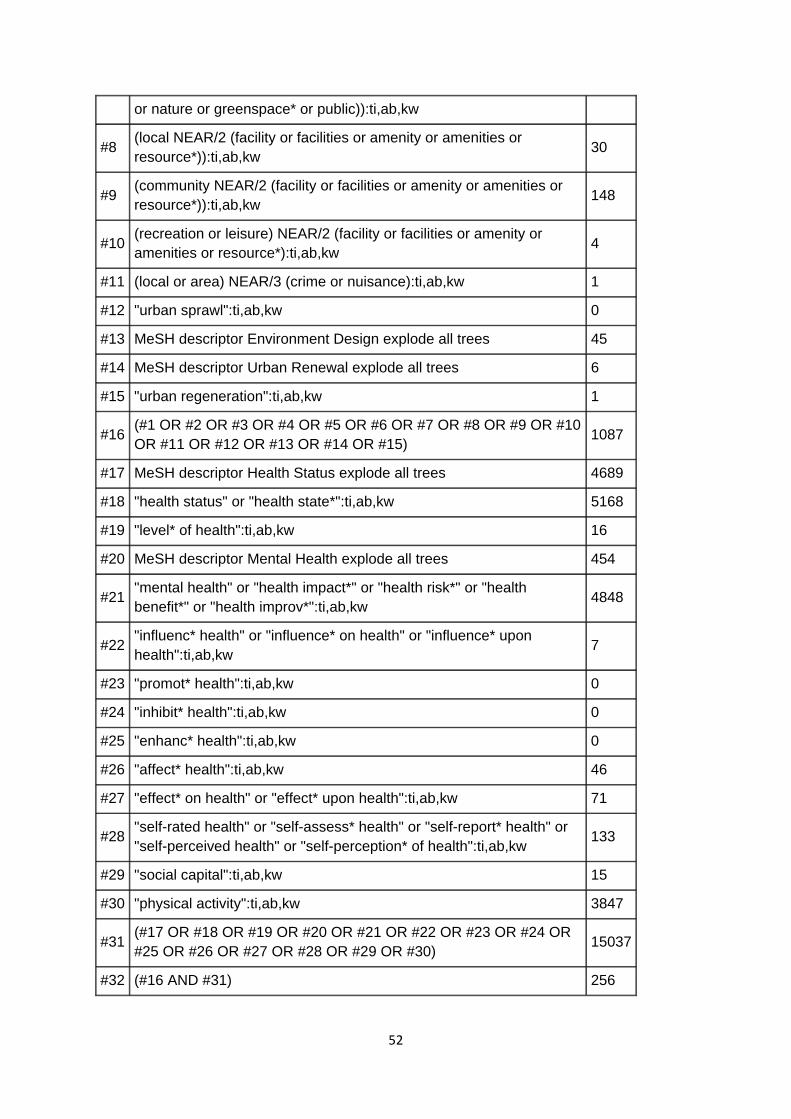
or nature or greenspace* or public)):ti,ab,kw
#8 (local NEAR/2 (facility or facilities or amenity or amenities or resource*)):ti,ab,kw
30
#9 (community NEAR/2 (facility or facilities or amenity or amenities or resource*)):ti,ab,kw 148
#10 (recreation or leisure) NEAR/2 (facility or facilities or amenity or amenities or resource*):ti,ab,kw 4
#11 (local or area) NEAR/3 (crime or nuisance):ti,ab,kw 1
#12 "urban sprawl":ti,ab,kw 0
#13 MeSH descriptor Environment Design explode all trees 45
#14 MeSH descriptor Urban Renewal explode all trees 6
#15 "urban regeneration":ti,ab,kw 1
#16 (#1 OR #2 OR #3 OR #4 OR #5 OR #6 OR #7 OR #8 OR #9 OR #10 OR #11 OR #12 OR #13 OR #14 OR #15) 1087
#17 MeSH descriptor Health Status explode all trees 4689
#18 "health status" or "health state*":ti,ab,kw 5168
#19 "level* of health":ti,ab,kw 16
#20 MeSH descriptor Mental Health explode all trees 454
#21 "mental health" or "health impact*" or "health risk*" or "health benefit*" or "health improv*":ti,ab,kw 4848
#22 "influenc* health" or "influence* on health" or "influence* upon health":ti,ab,kw
7
#23 "promot* health":ti,ab,kw 0
#24 "inhibit* health":ti,ab,kw 0
#25 "enhanc* health":ti,ab,kw 0
#26 "affect* health":ti,ab,kw 46
#27 "effect* on health" or "effect* upon health":ti,ab,kw 71
#28 "self-rated health" or "self-assess* health" or "self-report* health" or "self-perceived health" or "self-perception* of health":ti,ab,kw
133
#29 "social capital":ti,ab,kw 15
#30 "physical activity":ti,ab,kw 3847
#31 (#17 OR #18 OR #19 OR #20 OR #21 OR #22 OR #23 OR #24 OR #25 OR #26 OR #27 OR #28 OR #29 OR #30) 15037
#32 (#16 AND #31) 256
52
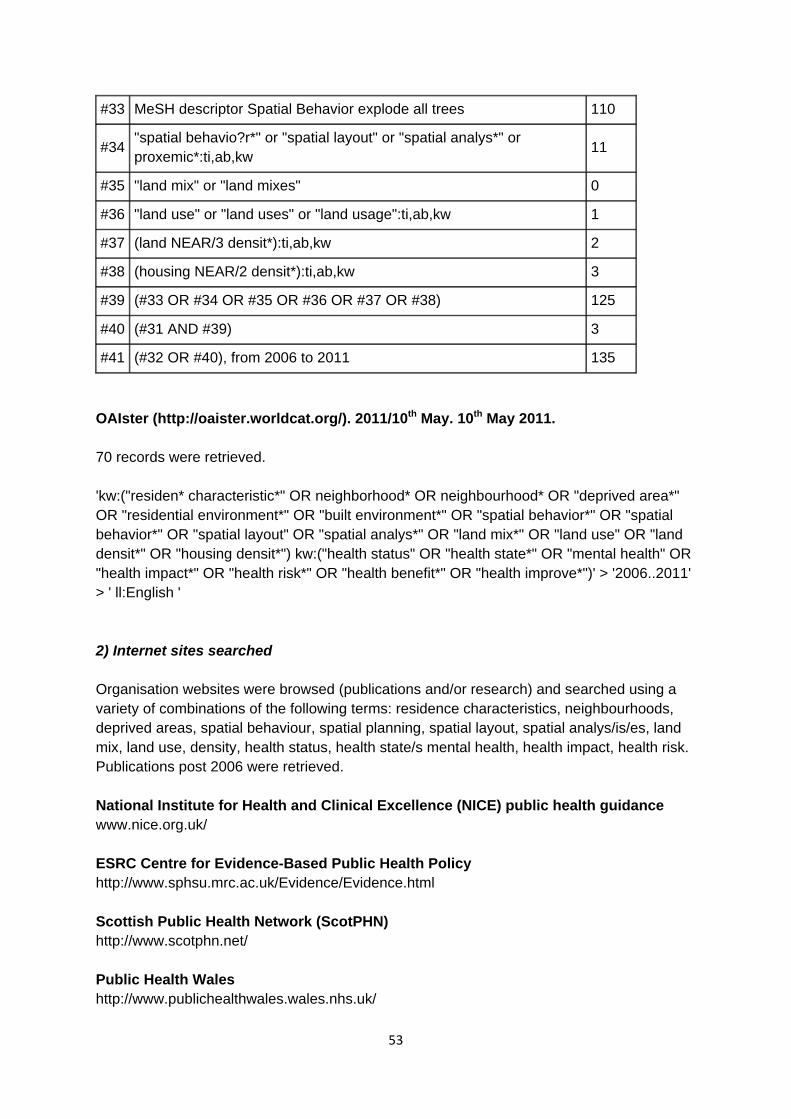
#33 MeSH descriptor Spatial Behavior explode all trees 110
#34 "spatial behavio?r*" or "spatial layout" or "spatial analys*" or proxemic*:ti,ab,kw
11
#35 "land mix" or "land mixes" 0
#36 "land use" or "land uses" or "land usage":ti,ab,kw 1
#37 (land NEAR/3 densit*):ti,ab,kw 2
#38 (housing NEAR/2 densit*):ti,ab,kw 3
#39 (#33 OR #34 OR #35 OR #36 OR #37 OR #38) 125
#40 (#31 AND #39) 3
#41 (#32 OR #40), from 2006 to 2011 135
OAIster (http://oaister.worldcat.org/). 2011/10th May. 10th May 2011. 70 records were retrieved. 'kw:("residen* characteristic*" OR neighborhood* OR neighbourhood* OR "deprived area*" OR "residential environment*" OR "built environment*" OR "spatial behavior*" OR "spatial behavior*" OR "spatial layout" OR "spatial analys*" OR "land mix*" OR "land use" OR "land densit*" OR "housing densit*") kw:("health status" OR "health state*" OR "mental health" OR "health impact*" OR "health risk*" OR "health benefit*" OR "health improve*")' > '2006..2011' > ' ll:English ' 2) Internet sites searched Organisation websites were browsed (publications and/or research) and searched using a variety of combinations of the following terms: residence characteristics, neighbourhoods, deprived areas, spatial behaviour, spatial planning, spatial layout, spatial analys/is/es, land mix, land use, density, health status, health state/s mental health, health impact, health risk. Publications post 2006 were retrieved. National Institute for Health and Clinical Excellence (NICE) public health guidance www.nice.org.uk/ ESRC Centre for Evidence-Based Public Health Policy http://www.sphsu.mrc.ac.uk/Evidence/Evidence.html Scottish Public Health Network (ScotPHN) http://www.scotphn.net/ Public Health Wales http://www.publichealthwales.wales.nhs.uk/
53
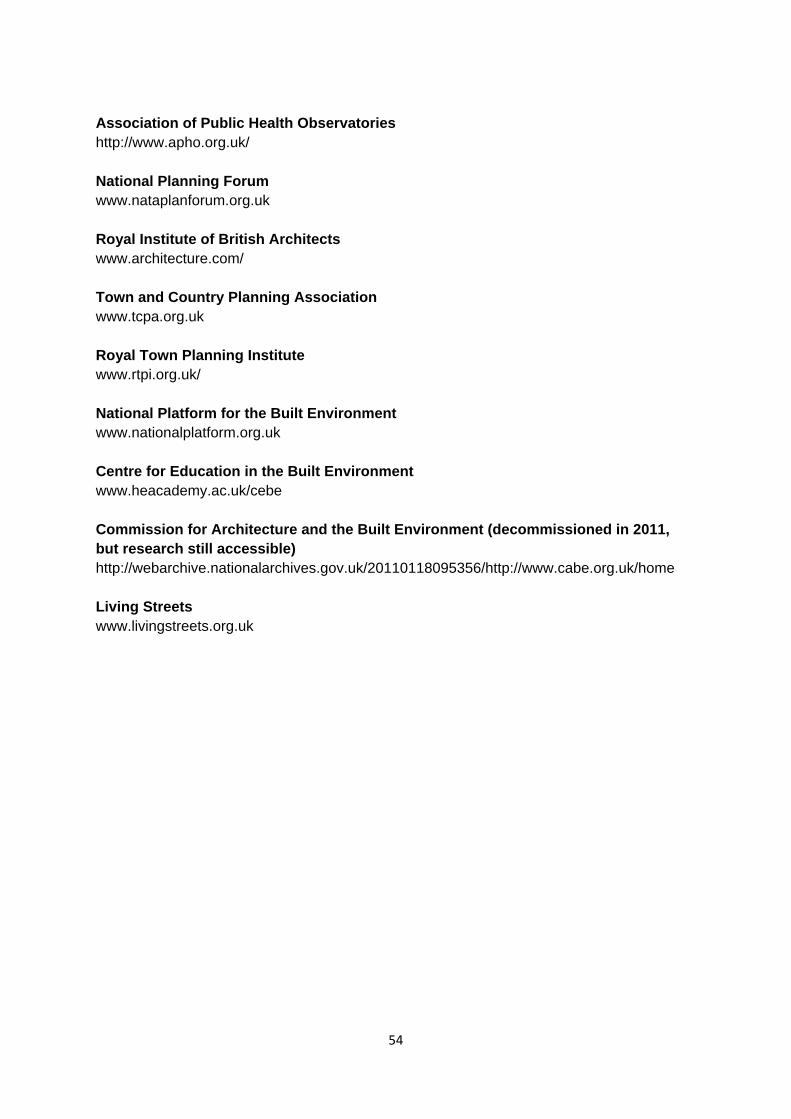
Association of Public Health Observatories http://www.apho.org.uk/ National Planning Forum www.nataplanforum.org.uk Royal Institute of British Architects www.architecture.com/ Town and Country Planning Association www.tcpa.org.uk Royal Town Planning Institute www.rtpi.org.uk/ National Platform for the Built Environment www.nationalplatform.org.uk Centre for Education in the Built Environment www.heacademy.ac.uk/cebe Commission for Architecture and the Built Environment (decommissioned in 2011, but research still accessible) http://webarchive.nationalarchives.gov.uk/20110118095356/http://www.cabe.org.uk/home Living Streets www.livingstreets.org.uk
54